Article

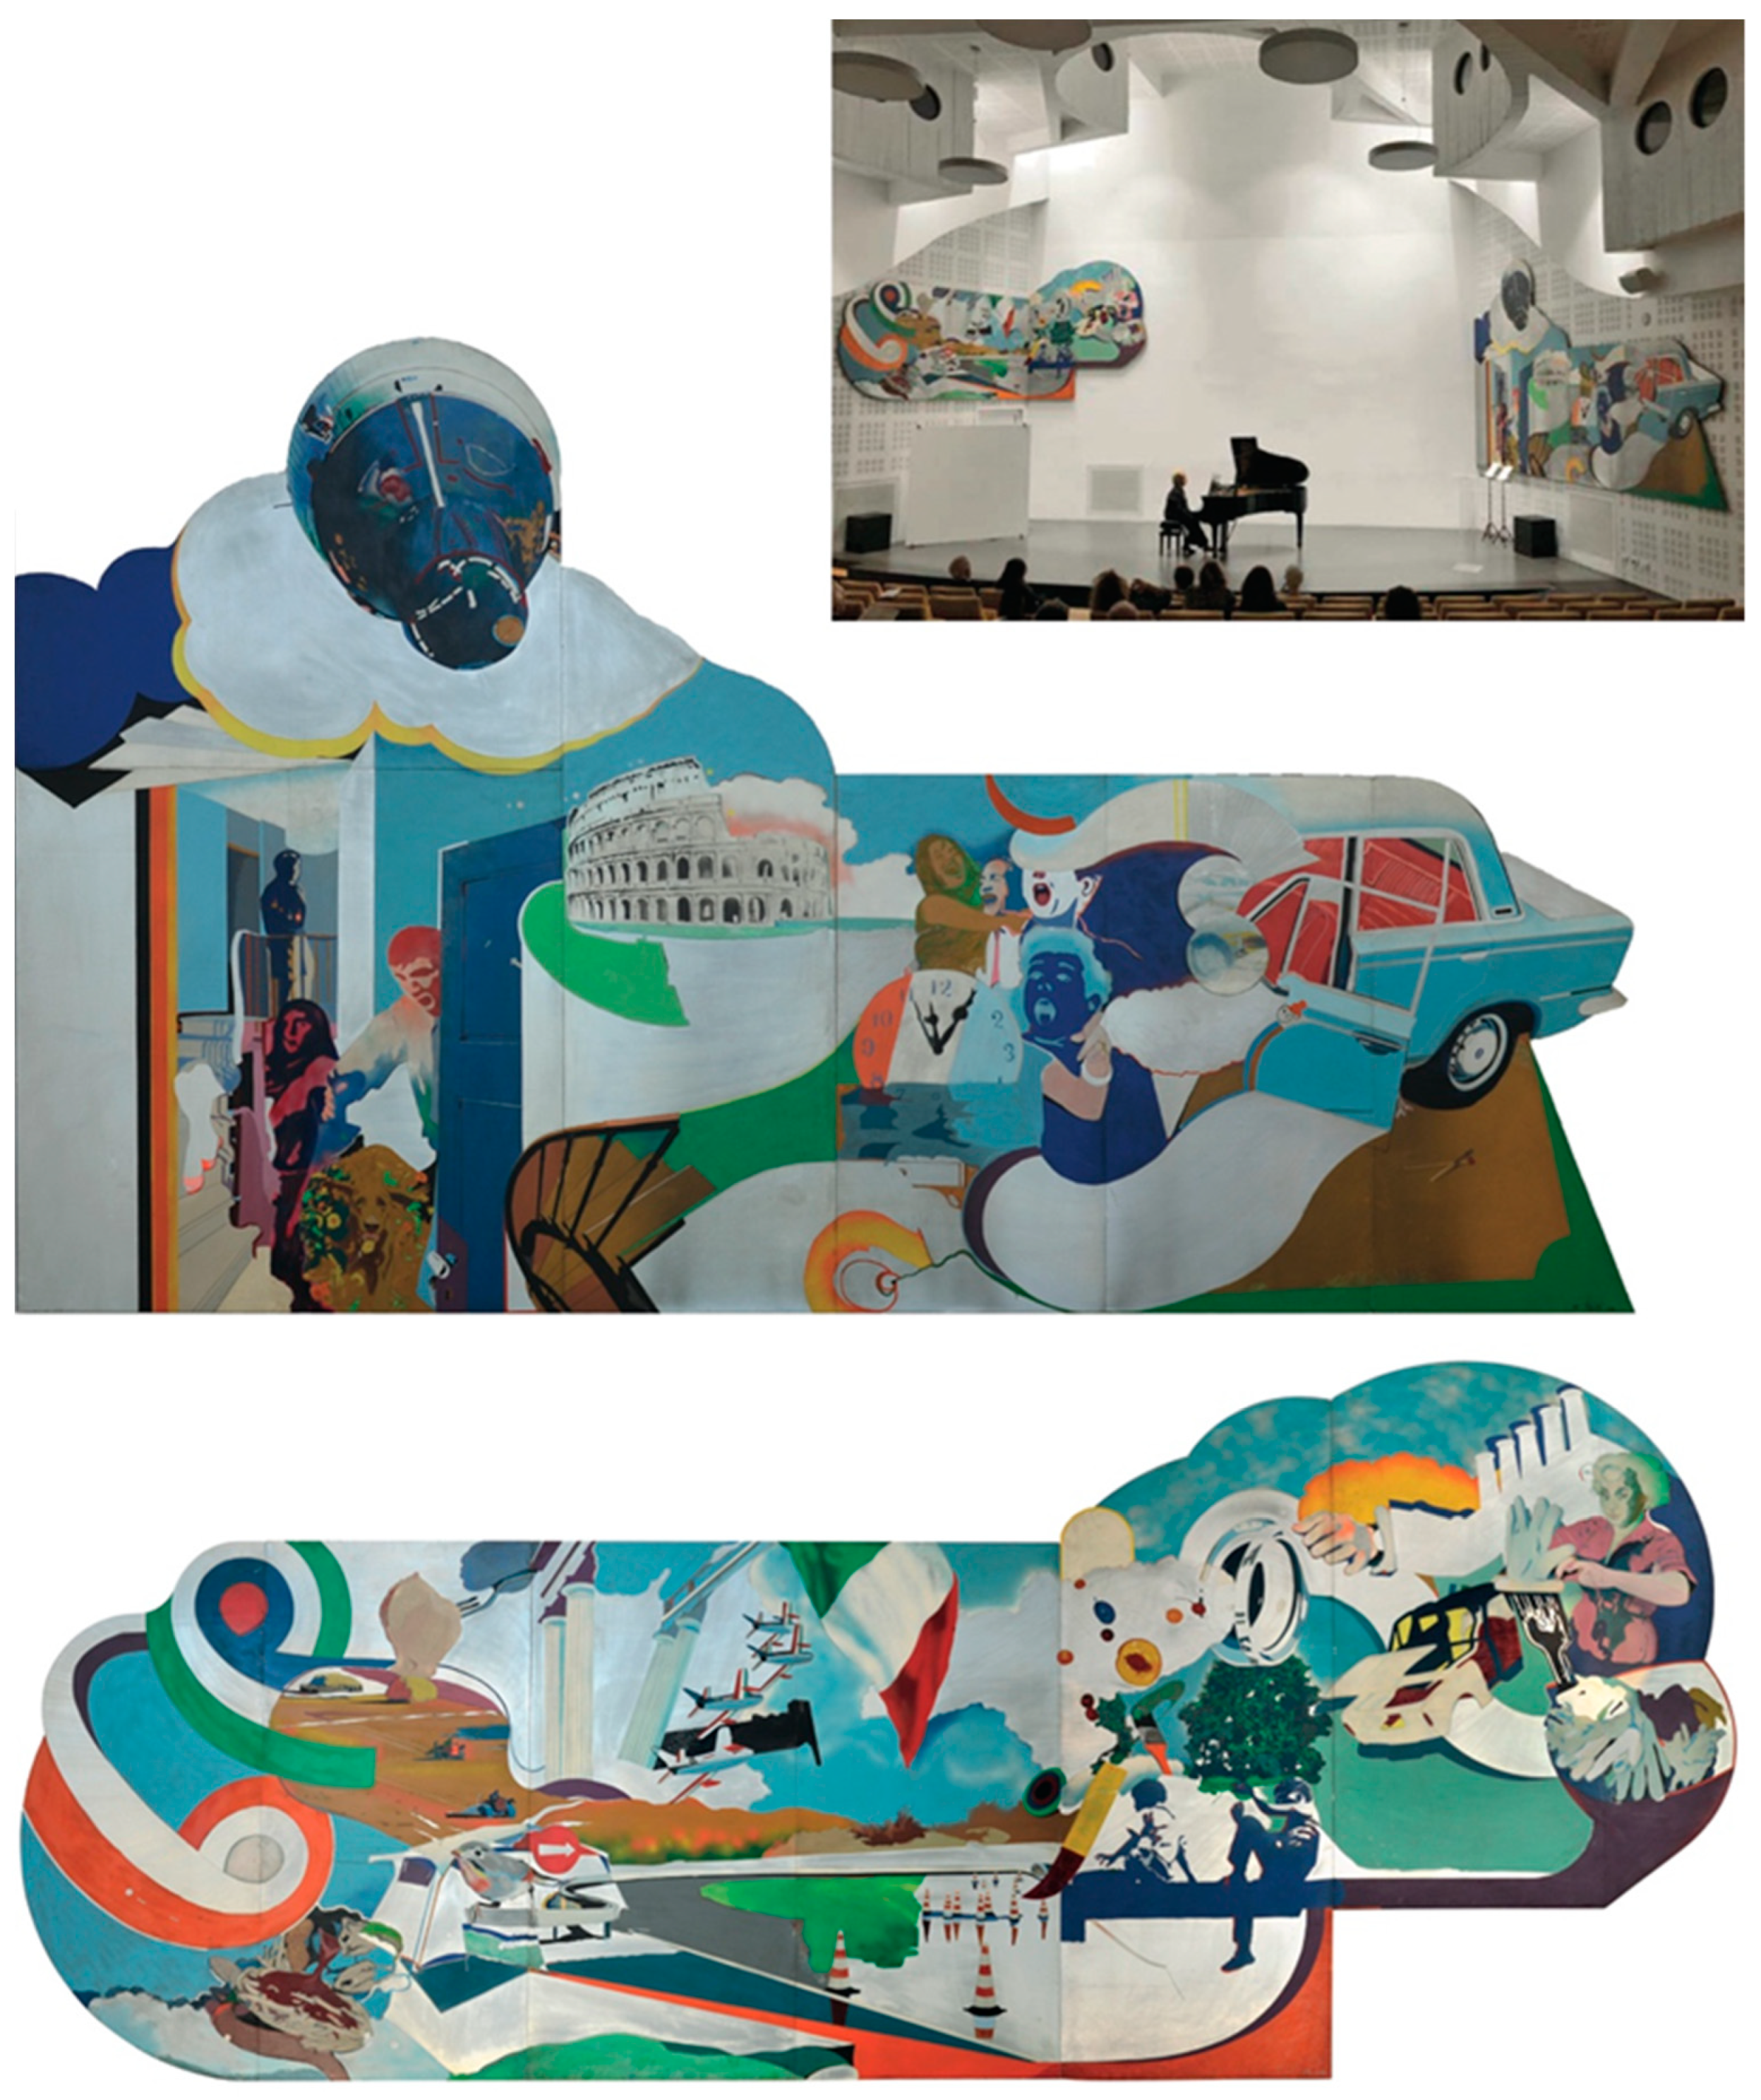
The Art of Everyday Objects: A Non-Invasive In Situ Investigation of Materials and Techniques of Italian Pop Art Paintings on Aluminium

1
Dipartimento di Chimica, Università degli Studi di Milano, Via C. Golgi, 19, 20133 Milan, Italy
2
Dipartimento di Lettere, Filosofia e Comunicazione, Università degli Studi di Bergamo, Via Pignolo, 76, 24121 Bergamo, Italy
*
Authors to whom correspondence should be addressed.
Submission received: 2 November 2021 / Revised: 3 December 2021 / Accepted: 15 December 2021 / Published: 23 December 2021

Abstract

:
Two paintings, made on aluminium support by Silvio Pasotti (among the major exponents of 1960s Italian pop art) were investigated in a totally non-invasive manner to identify the materials used by the artist. Raman spectroscopy, Fourier-transform infrared spectroscopy (FTIR), visible reflectance spectroscopy, and spectrofluorimetry with visible excitation were exploited as molecular analysis techniques, which are particularly suitable to recognise also synthetic organic materials, such as pigments and binders. The effectiveness of this multi-analytical approach was demonstrated, leading to the identification of several synthetic organic pigments, both conventional and “special effect” ones, introduced during the first half of the 20th century, as well as some well-established inorganic ones. Combining FTIR results both in the medium and near IR ranges, considerations regarding the binders employed by the artist could also be made, suggesting the use of both nitrocellulose and acrylic paints. Imaging techniques, such as IR reflectography, false colour IR, UV induced fluorescence, and portable microscopy, were also used to achieve a better knowledge of the painting practice.

1. Introduction

The need for a scientific non-invasive approach to the identification of materials and techniques is of course well established for paintings of any period in the history of art. Nevertheless, when artworks dating to the 1950s and 1960s are considered, this task is even more challenging due to the fast evolution of synthetic materials in that period and in the immediately previous decades of the 20th century.
As regards synthetic binders, acrylic resins had been finally developed, while nitrocellulose paints were still used by important artists such as Jackson Pollock in the early 1950s and Richard Hamilton in the second half of the same decade and in the 1960s [1]. On the other hand, as for synthetic organic pigments, it was in that period that new molecular classes such as benzimidazolones, isoindolinone, and others were introduced to obtain vivid colours [2].
In the artistic panorama of those years, the Pop Art movement was particularly innovative for the choice of themes, the use of objects (or their parts) taken from everyday life, the mixing of expressive techniques and, of course, the exploitation of newly available or unconventional painting materials. As an example, the well-known use of fluorescent pigments by the leader of the Pop Art Andy Warhol could be cited among others.
For choosing the most suitable investigation techniques, the large prevalence of organic materials in contemporary paintings needs to be considered. In fact, it limits the effectiveness of non-invasive methods of elemental analysis routinely used for more ancient artworks, such as X-ray fluorescence, in favour of molecular-specific analytical techniques. The use of Fourier-transform infrared (FTIR) spectroscopy is well established for the identification of binders [1], but its application in reflection mode to in situ analyses without sampling has somewhat more limited examples in the literature [3]. The spectral response in the near-IR (NIR) range is also of particular interest being related to a greater depth in the painting stratigraphy in comparison with the mid-IR region [3]. Inorganic pigments that are still in use can also be recognized employing FTIR or Raman spectroscopy. At the same time, the Raman technique is particularly suitable for the identification of synthetic organic pigments [4], even if its use can be partially hindered by the fluorescence emission due to aged binders or to pigments themselves [5]. For this reason, in a recent paper, the possibility of identifying synthetic organic pigments through their emission spectra was also considered [6].
Some of the advantages and limitations of reflectance spectrometry (vis-RS) applied to 20th-century paintings have been established, as well as the need to integrate this methodology with others [7]; it was used due to its ability to recognize certain classes of modern pigments, especially green, blue, and violet.
Imaging techniques including IR reflectography, false colour IR, and UV induced fluorescence [8] were also used to verify the presence of underdrawings and changes, retouches or repainting, fluorescent pigments, and to choose the measurement areas. Portable optical microscopy helped to better focus some technical issues, such as the use of spray paint or brush, the mixing of different pigments, and the presence of overlapping layers of different colours (including any ground layer).
In the present work, molecular spectroscopic methods were tested for a complete characterization of materials in two paintings on aluminium of the Italian Pop artist Silvio Pasotti, namely the right panel of the frieze “The Daily Neo-Mythology” (1966−1967, ab. 15 m2 each, Property of Comune di Segrate; Figure 1) and “The Monster” (1966, 150 × 100 cm2, oval, Collection of the painter; Figure 2a) [9,10]. The latter painting was examined during the exhibition dedicated to the artist, that took place in 2018 in Segrate (Milano, Italy). The first painting, also investigated by means of elemental analysis ED-XRF, is permanently on show in the Auditorium of the “Giuseppe Verdi” Cultural Centre in Segrate (Figure 1, top).
The paintings were chosen for their wide chromatic range, for their palette, and their relative simplicity of technique: Pasotti generally avoids impasto and overlapping of pictorial layers, except for a few areas, and the priming is uniform, always the same, allowing one to reduce the complexity of integrated analyses. So, they were preferred to other works due to the possibility of enriching the personal database, verifying the limits of detection of the techniques used, interviewing the author, and as well for their unusual metal support.
Silvio Pasotti (Bergamo, 1933), who attended the Carrara Academy of Bergamo, established his studio in Milan in 1958, the city where he still resides today, except for a long period in Paris between 1969 and 1976. He participated in numerous exhibitions in Italy and abroad and is considered one of the most representative Italian pop artists. In fact, in the 1960s, after having met American pop art, he was the author of works that often combined metal and painting, sometimes even of monumental proportions, in which images of everyday objects (such as cars or washing machines) were used to develop reflections on social issues. He also worked with mixed media and different techniques, including ceramic sculpture.

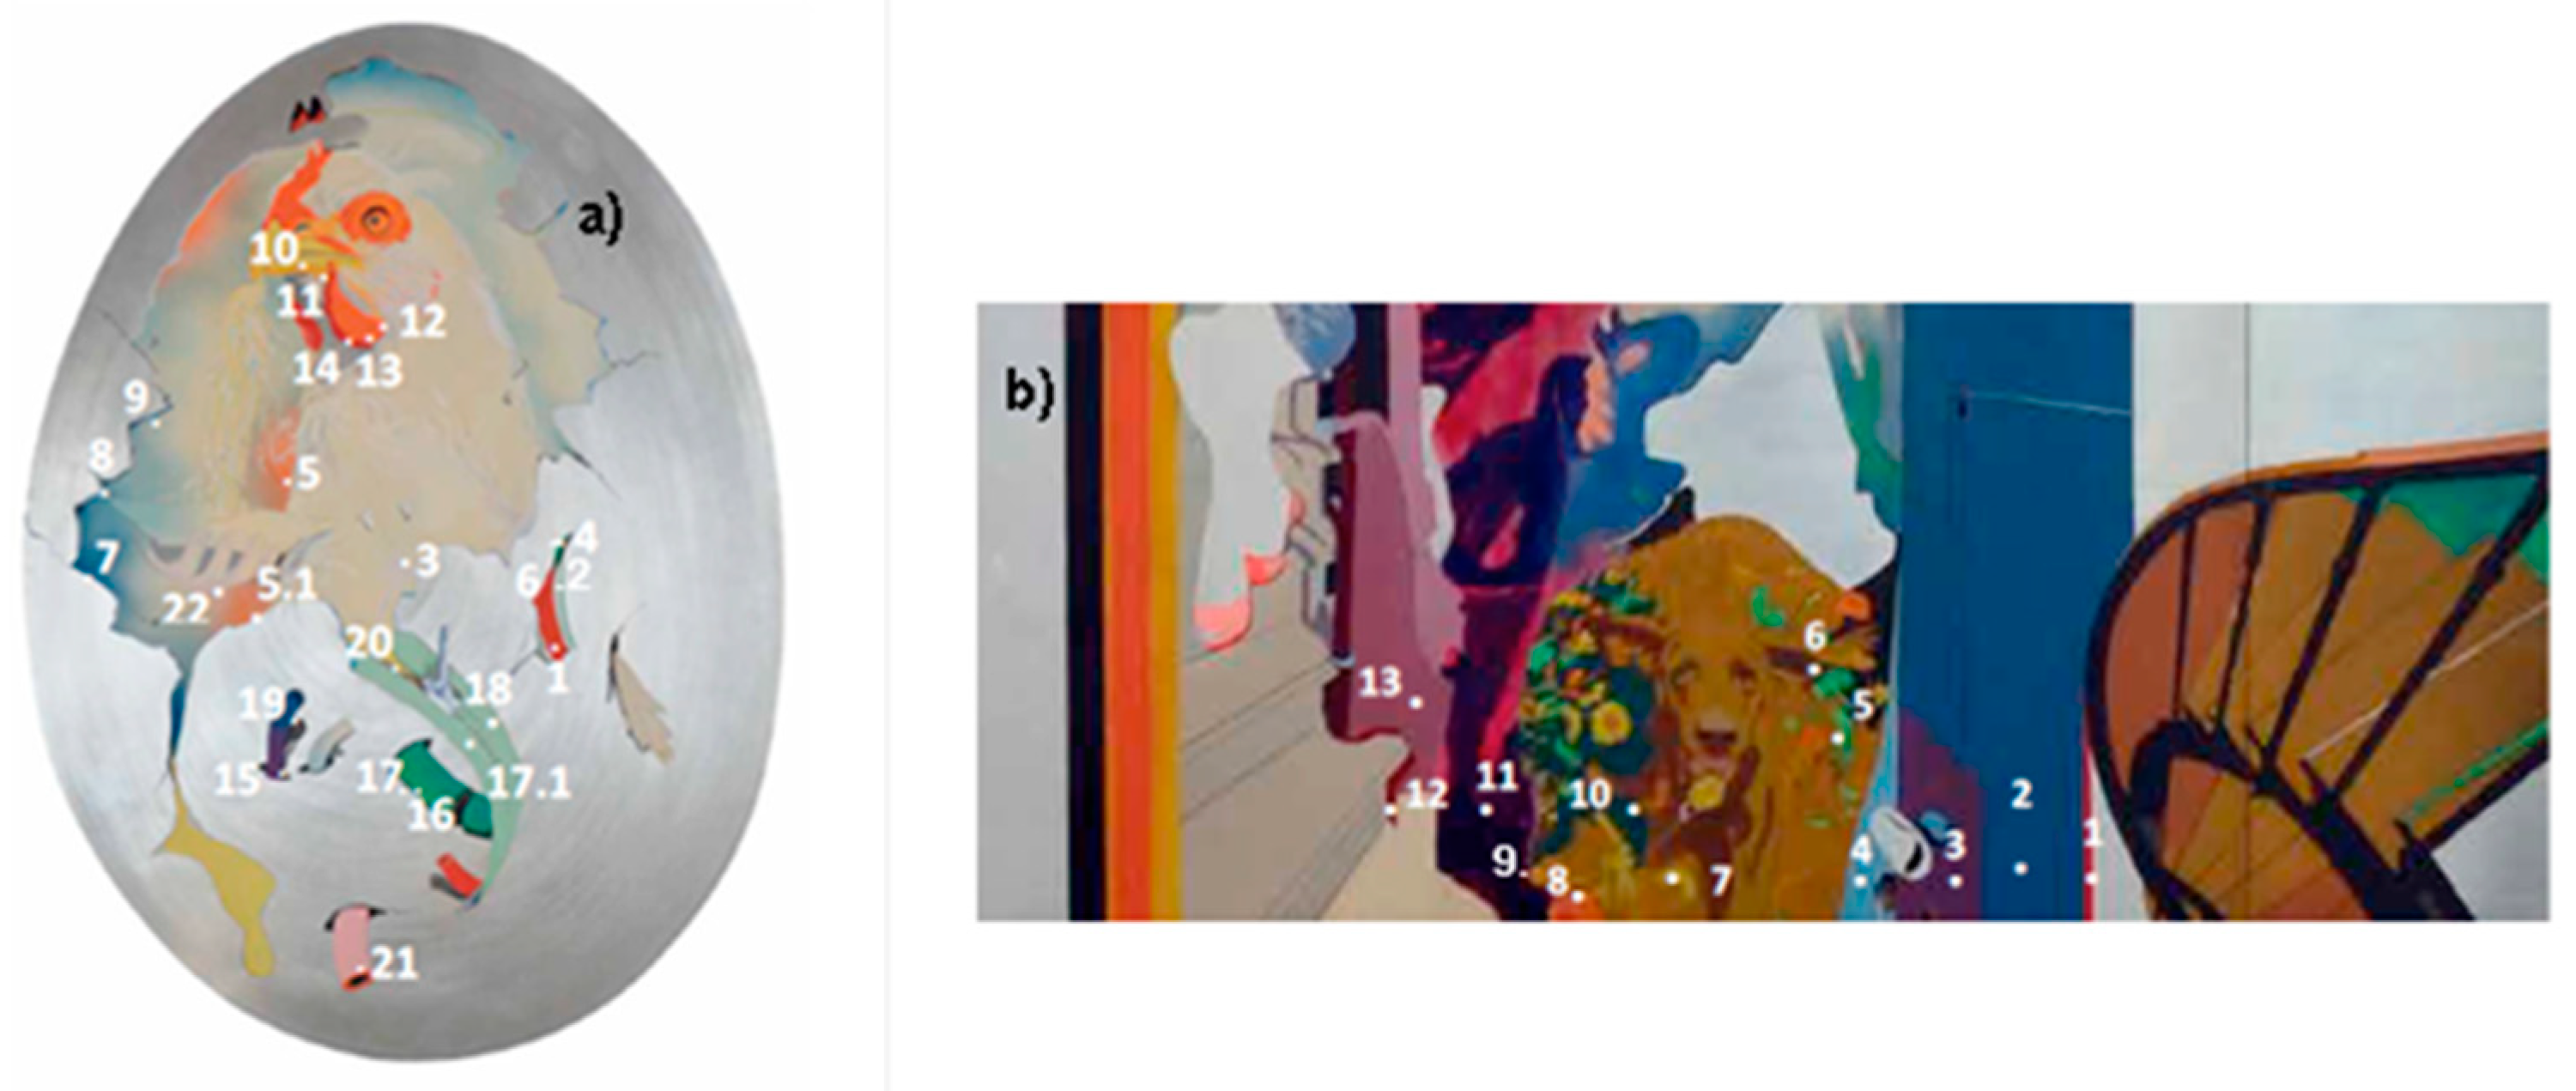
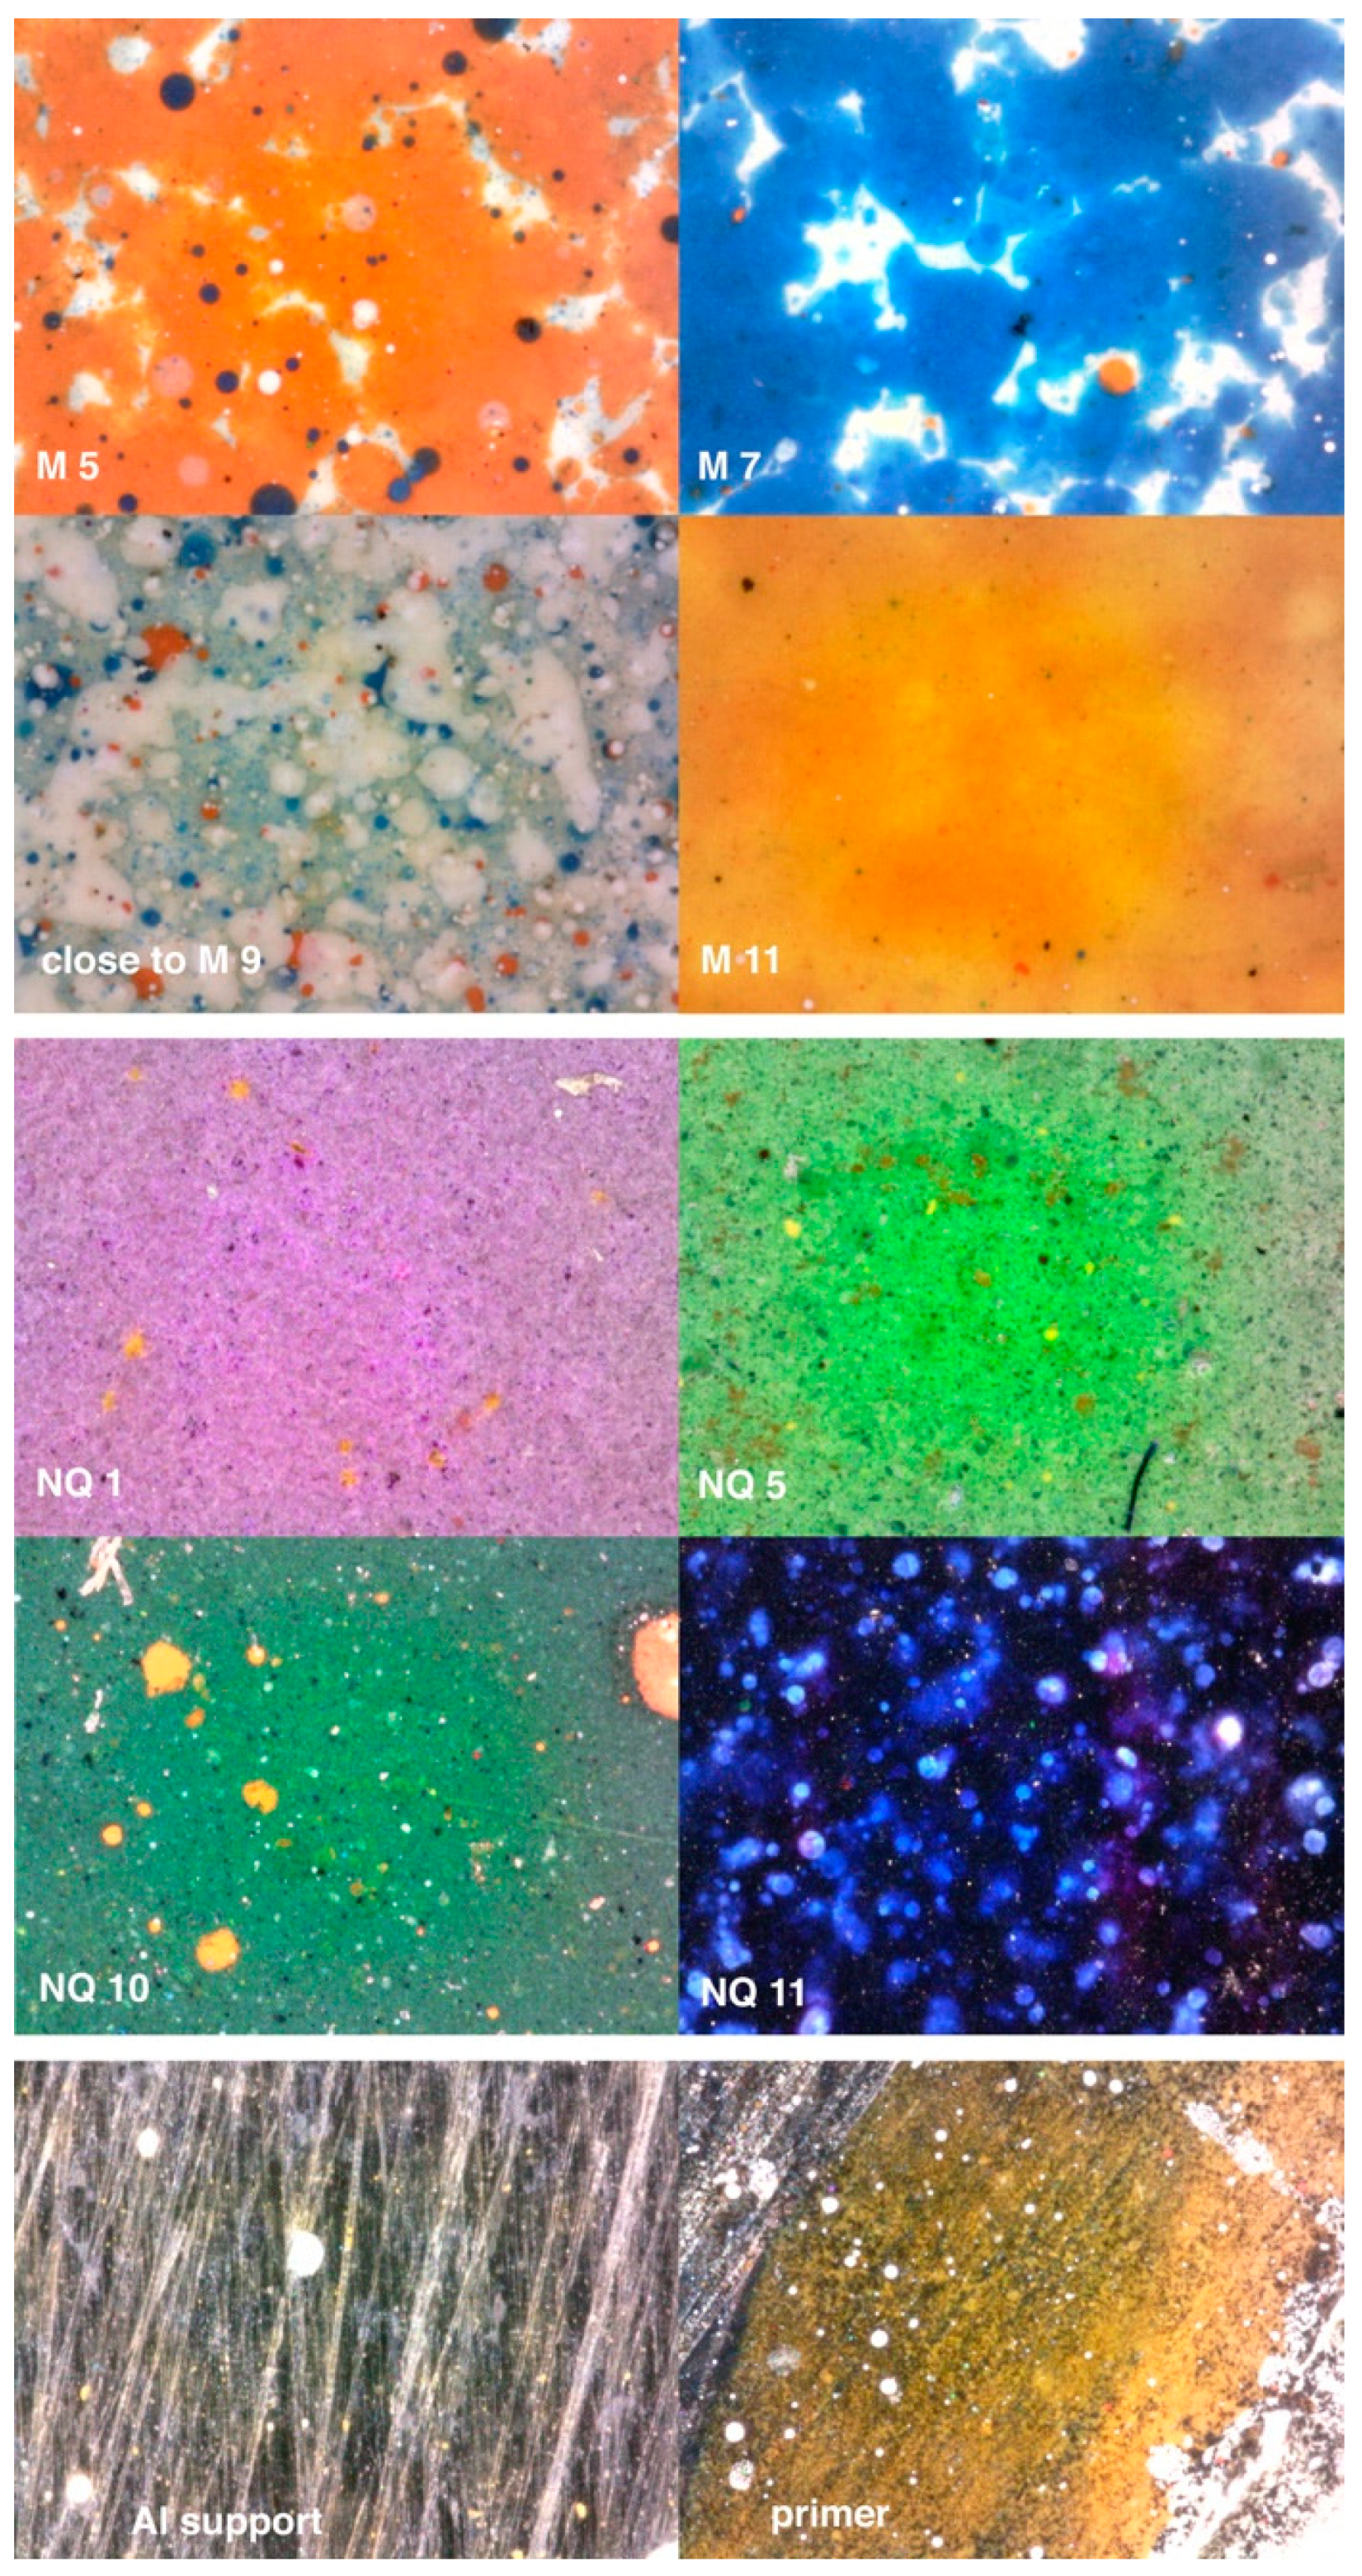
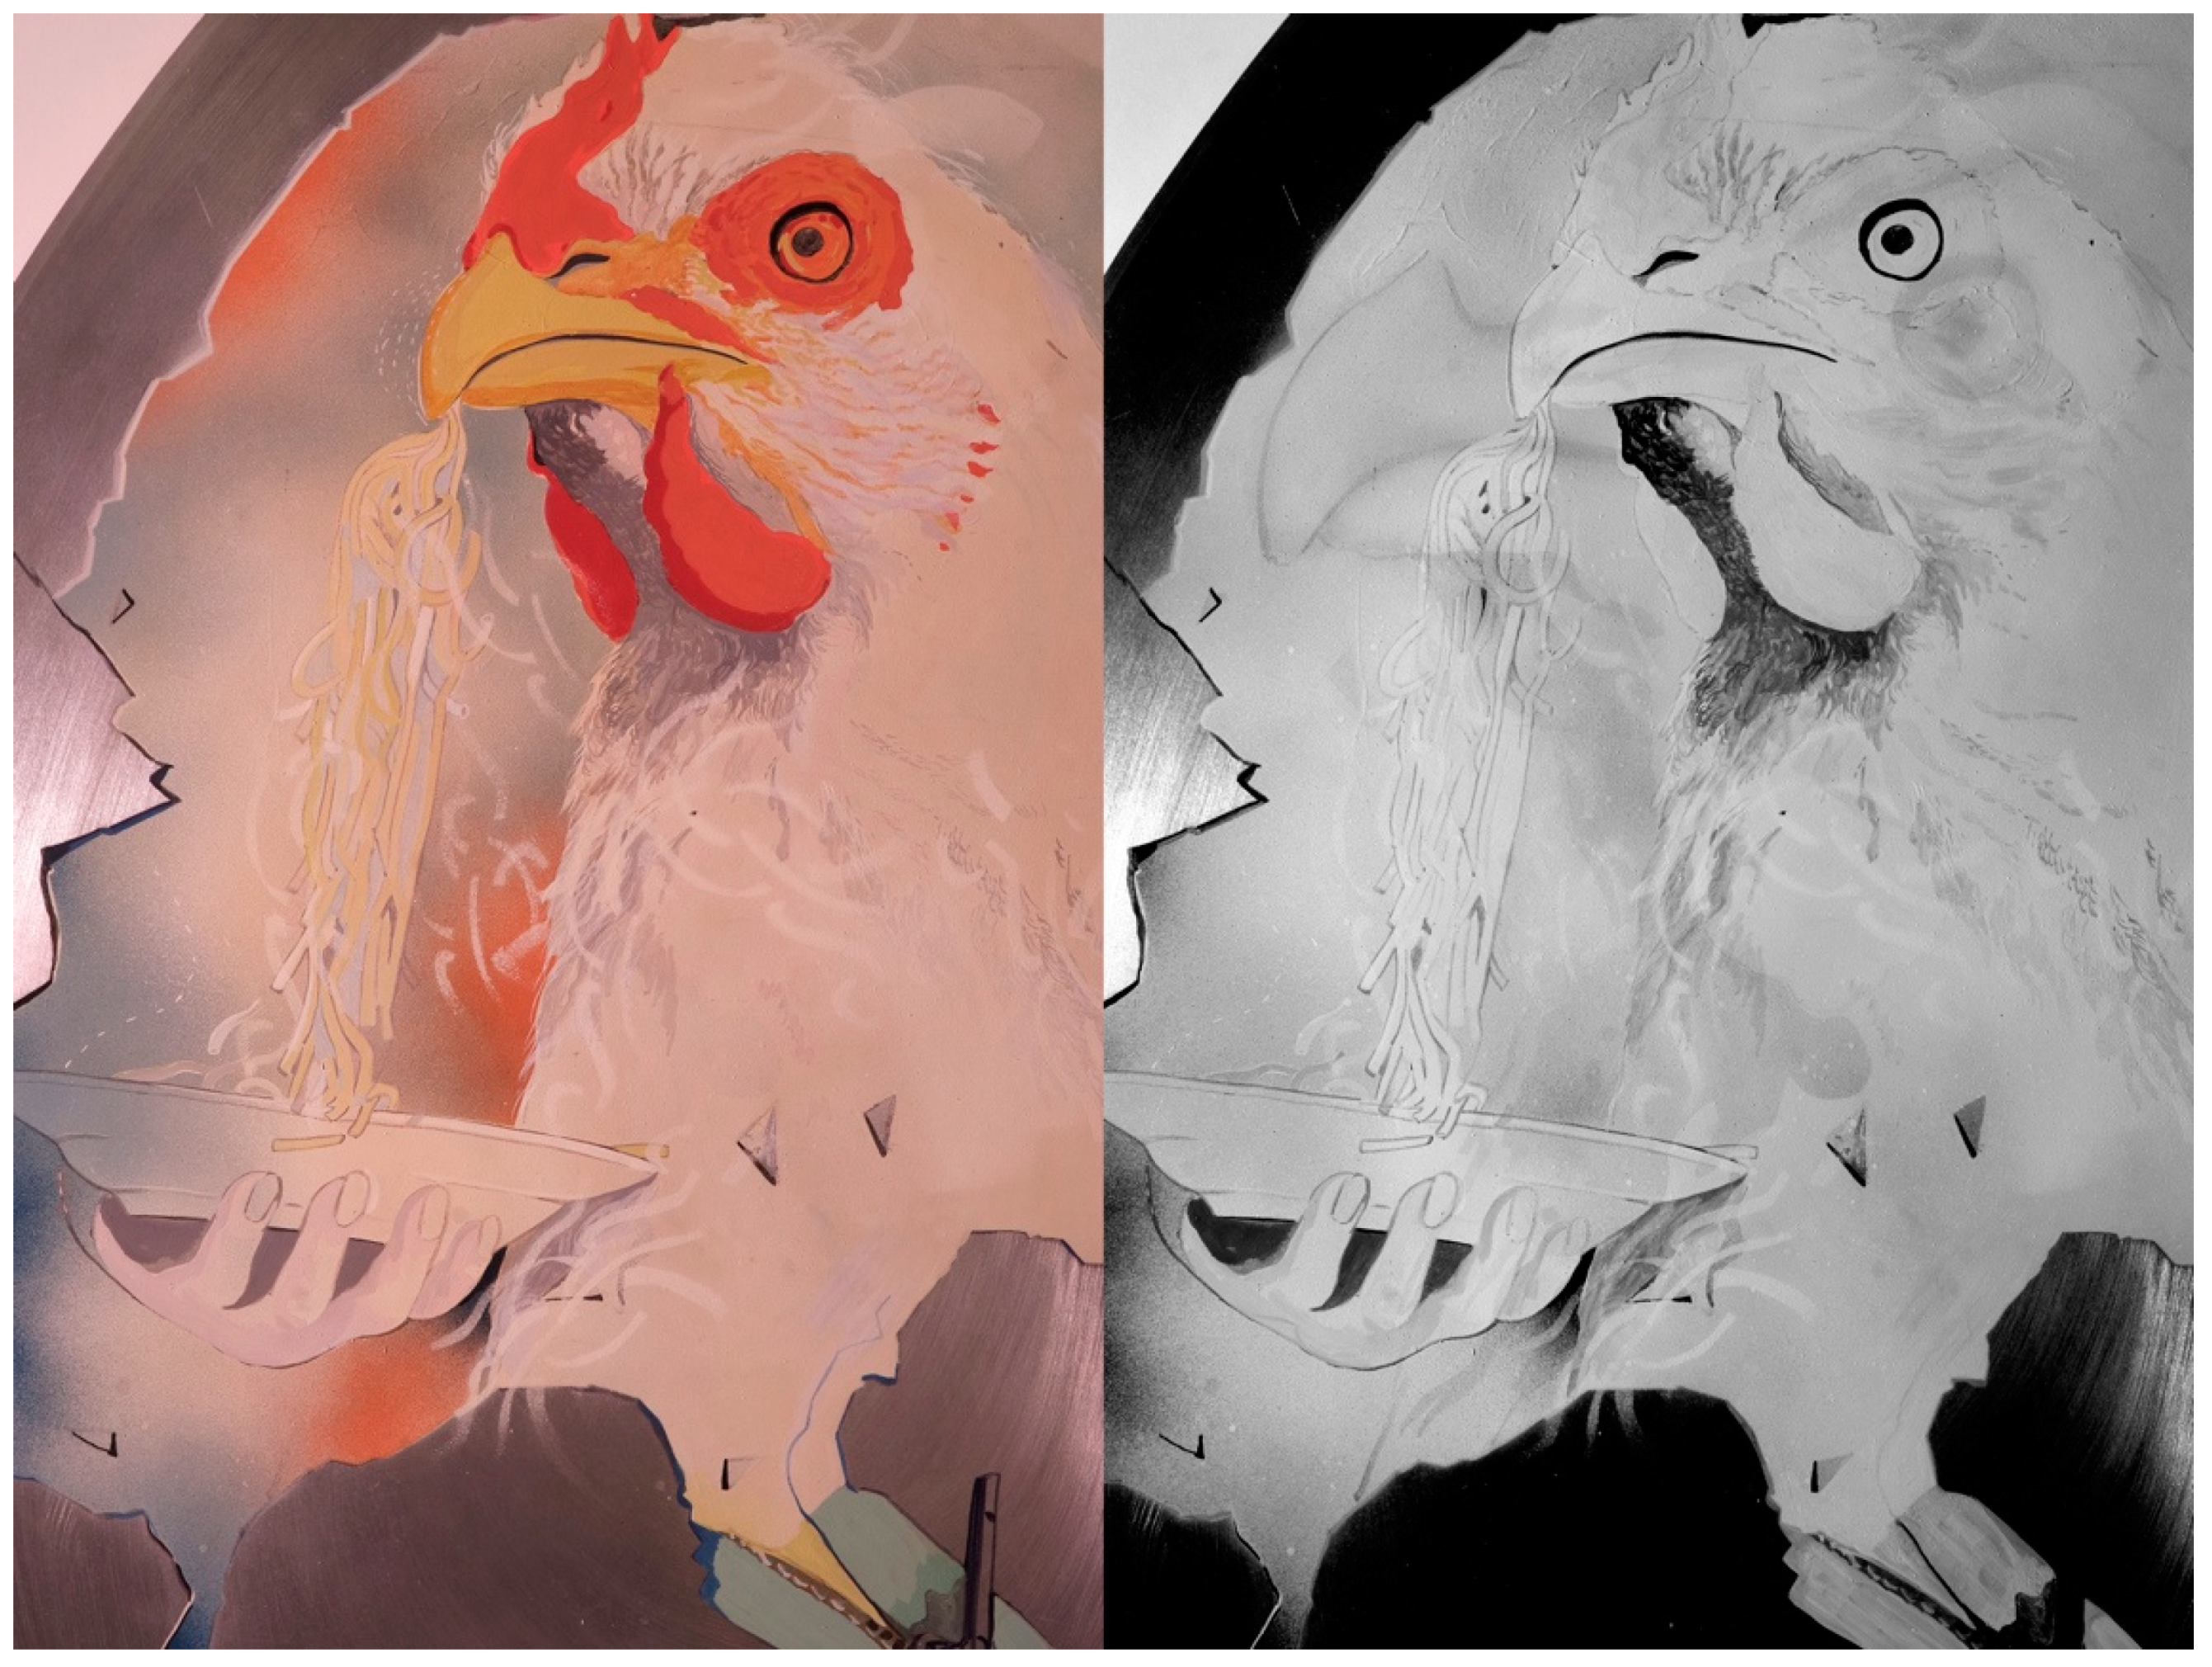
2. Materials and Methods

The measurement areas in the two paintings are shown in Figure 2 and will be indicated with the prefix M when belonging to “The Monster” and the prefix NQ when referring to “The Daily Neo-Mythology”.
The in situ Raman analyses were performed in the range of 200–1900 cm−1 using a Jasco RPM-100 microprobe, equipped with a notch filter and an Olympus 50× objective and interfaced via optical fibres to the laser source and to a Lot-Oriel MS125 spectrometer (1200 lines/mm grid). The latter was equipped with an Andor CCD detector (1024 × 128 pixels), cooled by a Peltier device. A diode laser emitting at 785 nm was used as the excitation source, maintaining an incident laser power of a few milliwatts. Raman spectra were obtained by collecting 30 scans, with an exposure time of 2 s. For the acquisition of the spectra on the paintings in their exhibition venue, the microprobe was mounted on a tripod equipped with a xyz stage.
Reflection FTIR measurements were performed directly on Pasotti’s paintings using an Alpha Bruker FTIR spectrometer. This instrument is equipped with a deuterated triglycine sulfate (DTGS) detector operating at room temperature, and a specular reflection module allowed for non-contact measurements. The FTIR spectra were collected in the spectral range of 7500–400 cm−1 as a sum of 200 scans with a resolution of 4 cm−1. An integrated video camera allows one to select exactly the area of the samples to be analysed, having a diameter of 0.6 cm. In the mid-IR range the reflectance spectra were processed by the Kramers-Kronig transform, while in the near-IR (NIR) range the same spectra were converted into pseudo-absorbance log(1/R).
A portable microprobe was used for the fluorescence analyses. The microprobe is equipped with an Olympus 20× objective and is connected via optical fibres to a halogen source (maximum power 150 W) and to the same Lot Oriel MS125 spectrometer already described above, here equipped with a 400 lines/mm grating. The wavelength scale was calibrated using the emission spectrum of a neon lamp. In the microprobe, the radiation from the source is sent along a direction perpendicular to the objective of the microscope. The microprobe is equipped with an interference filter to select the excitation wavelength and a dichroic filter to eliminate the component due to the exciting radiation from the spectrum. In particular, the interference filter was centred at 435 nm, while the dichroic one had a transmission range between 458 and 680 nm. The fluorescence spectra were collected as a sum of 30 scans with an exposure time of 2 s and the analyses were preceded by the acquisition of a background spectrum in the absence of incident radiation. The emission spectra collected on the paintings were compared with the laboratory database of fluorescence spectra of synthetic organic pigments in mock-up paint samples [6], also performing principal component analysis (PCA) using the Minitab software version 14.
Diffuse reflectance spectrometry in the spectral range of 360–740 nm (vis-RS) was performed with a handheld spectrophotometer Minolta CM-2600d equipped with an inner integrating sphere (10 nm acquisition step, d/8 geometry, UV included, 3 mm diameter spot, measurement time 1 s, specular component included and excluded). Colorimetric data in the CIELAB colour space were also acquired. A personal database, together with literature data, was used to compare spectra.
X-ray fluorescence (ED-XRF) was carried out on some chosen areas of “The Daily Neo-Mythology” to verify some results obtained by molecular spectroscopy and to acquire information on the support and primer, the same used in “The Monster”. An Oxford Instrument X-Met 8000 energy dispersive handheld spectrometer (X-Flash SDD detector, 6 mm diameter spot, Rh target X-ray tube operating both at 8 kV, 50 µA and 40 kV, 8 µA). Spectra were collected with a measurement time of 100 s: 74 s at 8 kV, to detect light elements, and 26 s at 40 kV, for heavier ones. Data were processed using Artax proper software (version 4.9).
Spectroscopic analyses were generally carried out on the same chosen points, but, due to the shorter measurement time vis-RS was applied to a greater number of areas.
Regarding imaging methods, IR reflectography (IRR) and false colour IR (IRFC) were performed with a 20 Mpx Samsung digital camera (filtered to operate in the IR range 0.85–1 µm) and a 1000 W halogen source. For UV induced fluorescence (UVF) the same camera, operating in the visible range, and a Labino bulb UV beam lamp were employed (MPX technology, emission peak at 365 nm).
In situ optical digital microscopy (DM) was carried out with a Dino-Lite USB digital microscope (CMOS 5 Megapixel sensor, equipped with polarizer, anti-reflection, and IR cut-filter >650 nm, interface USB 2.0), directly connected to PC. Images were acquired at 50× and 230× magnifications.

3. Results and Discussion

As for the pictorial technique, both works examined are painted on aluminium panels. The Segrate frieze, in particular, consists of separate panels placed side by side and hooked on the back, each made as a sandwich structure, where two aluminium sheets about 1 mm thick are separated by an internal wooden frame. As observed and also confirmed by Pasotti himself during a series of meetings that preceded a recent exhibition dedicated to him [9], the aluminium surface of the support was brushed in most of the areas to be painted so as to become rough and ensure better adhesion of the paint. On the contrary, it remains smooth in unpainted areas. Then, a light brown paint base was applied as a primer. The subsequent painting was applied by spray, generally without overlapping between the different colours. Despite the probable use of cardboard masks, useful to avoid dirtying the adjacent backgrounds, at high magnifications (50–230×) small scattered drops of colour can be observed that encroach on the neighbouring areas, without significantly changing the final tone (Figure 3, M5 and M7). In some cases, on the contrary, the spraying of one colour on the other is desired by the painter to obtain a blurred effect in terms of colour (Figure 3, image “close to M9”).
For this series of works, the painter remembers the use of nitrocellulose paints, but also acrylics. Interventions with brushes or felt-tip pens are found in some zones to, respectively, define small coloured areas and some details (such as the edges of some backgrounds, for example).
Multispectral images—IRR, IRFC and UVF—allowed us to check the preservation state and to choose the measurement points, avoiding retouching due to restorations. The only small damages (small losses), mainly integrated during the last restoration a few years ago, were found in the frieze, while “The Monster” appears to be very well preserved.
IR reflectograms (IRR) showed only a few lines of underdrawing; probably a fairly transparent drawing medium or thin drawing lines largely covered by paint were used. The outline drawing is precise, very accurate, with small corrections made with the paint. The most interesting IRR result regards “The Monster”, where a previous version can be seen (Figure 4). The figure was originally bigger and its profile less rotated, its larger eye placed below the visible one and its beak extending to the left.
IRFC and IRR were also useful to discriminate layers made with different pigments but with the same colour, as in the very dark area in the centre of Figure 5. The different IR transparency allows to distinguish the distribution of black and dark blue pigment, i.e., ultramarine blue (as explained later, see NQ11 in Table 1), showing its characteristic red tint in IRFC image (Figure 5c).
UV fluorescence showed the existence of highly fluorescent pigments, in some pink areas, which were then subjected to the spectroscopic investigation, while the UV fluorescence of the other pigments was generally low and the unpainted aluminium support returned a bluish colour due to the reflected UV component (see below).
The aluminium alloy was characterized by XRF, constituted by Al (99.4 ± 0.1%) with very small amounts of Mn, Fe, Cu, Zn, Ga, and Pb (see the black spectrum in Figure 6). Its quantitative composition, close to “1060 Al-alloy”, was derived by calibration standards and proper software.
The light brown primer that can be sometimes seen at the edges of some coloured areas and under the paint where small lacunas can be found by magnification (Figure 3, bottom right), contains ochre/iron-oxides according to vis-RS and XRF. In particular, X-ray fluorescence (Figure 6, yellow spectrum vs. black one) evidenced the presence of Fe (abundant), Ca, Sr, Ti, Ba, Zn, S, Pb (traces), where Ca, Sr, and S (better read with the lower elements excitation 8 kV) can be due to calcium sulphate with celestite impurities, while Ti and Zn are linked to white pigments, titanium and zinc oxides mixed in the primer.
The materials identified in the two paintings will be discussed in detail below and are summarised in Table 1. In parallel, the performances of the different techniques adopted in the present study will be examined for each class of materials.

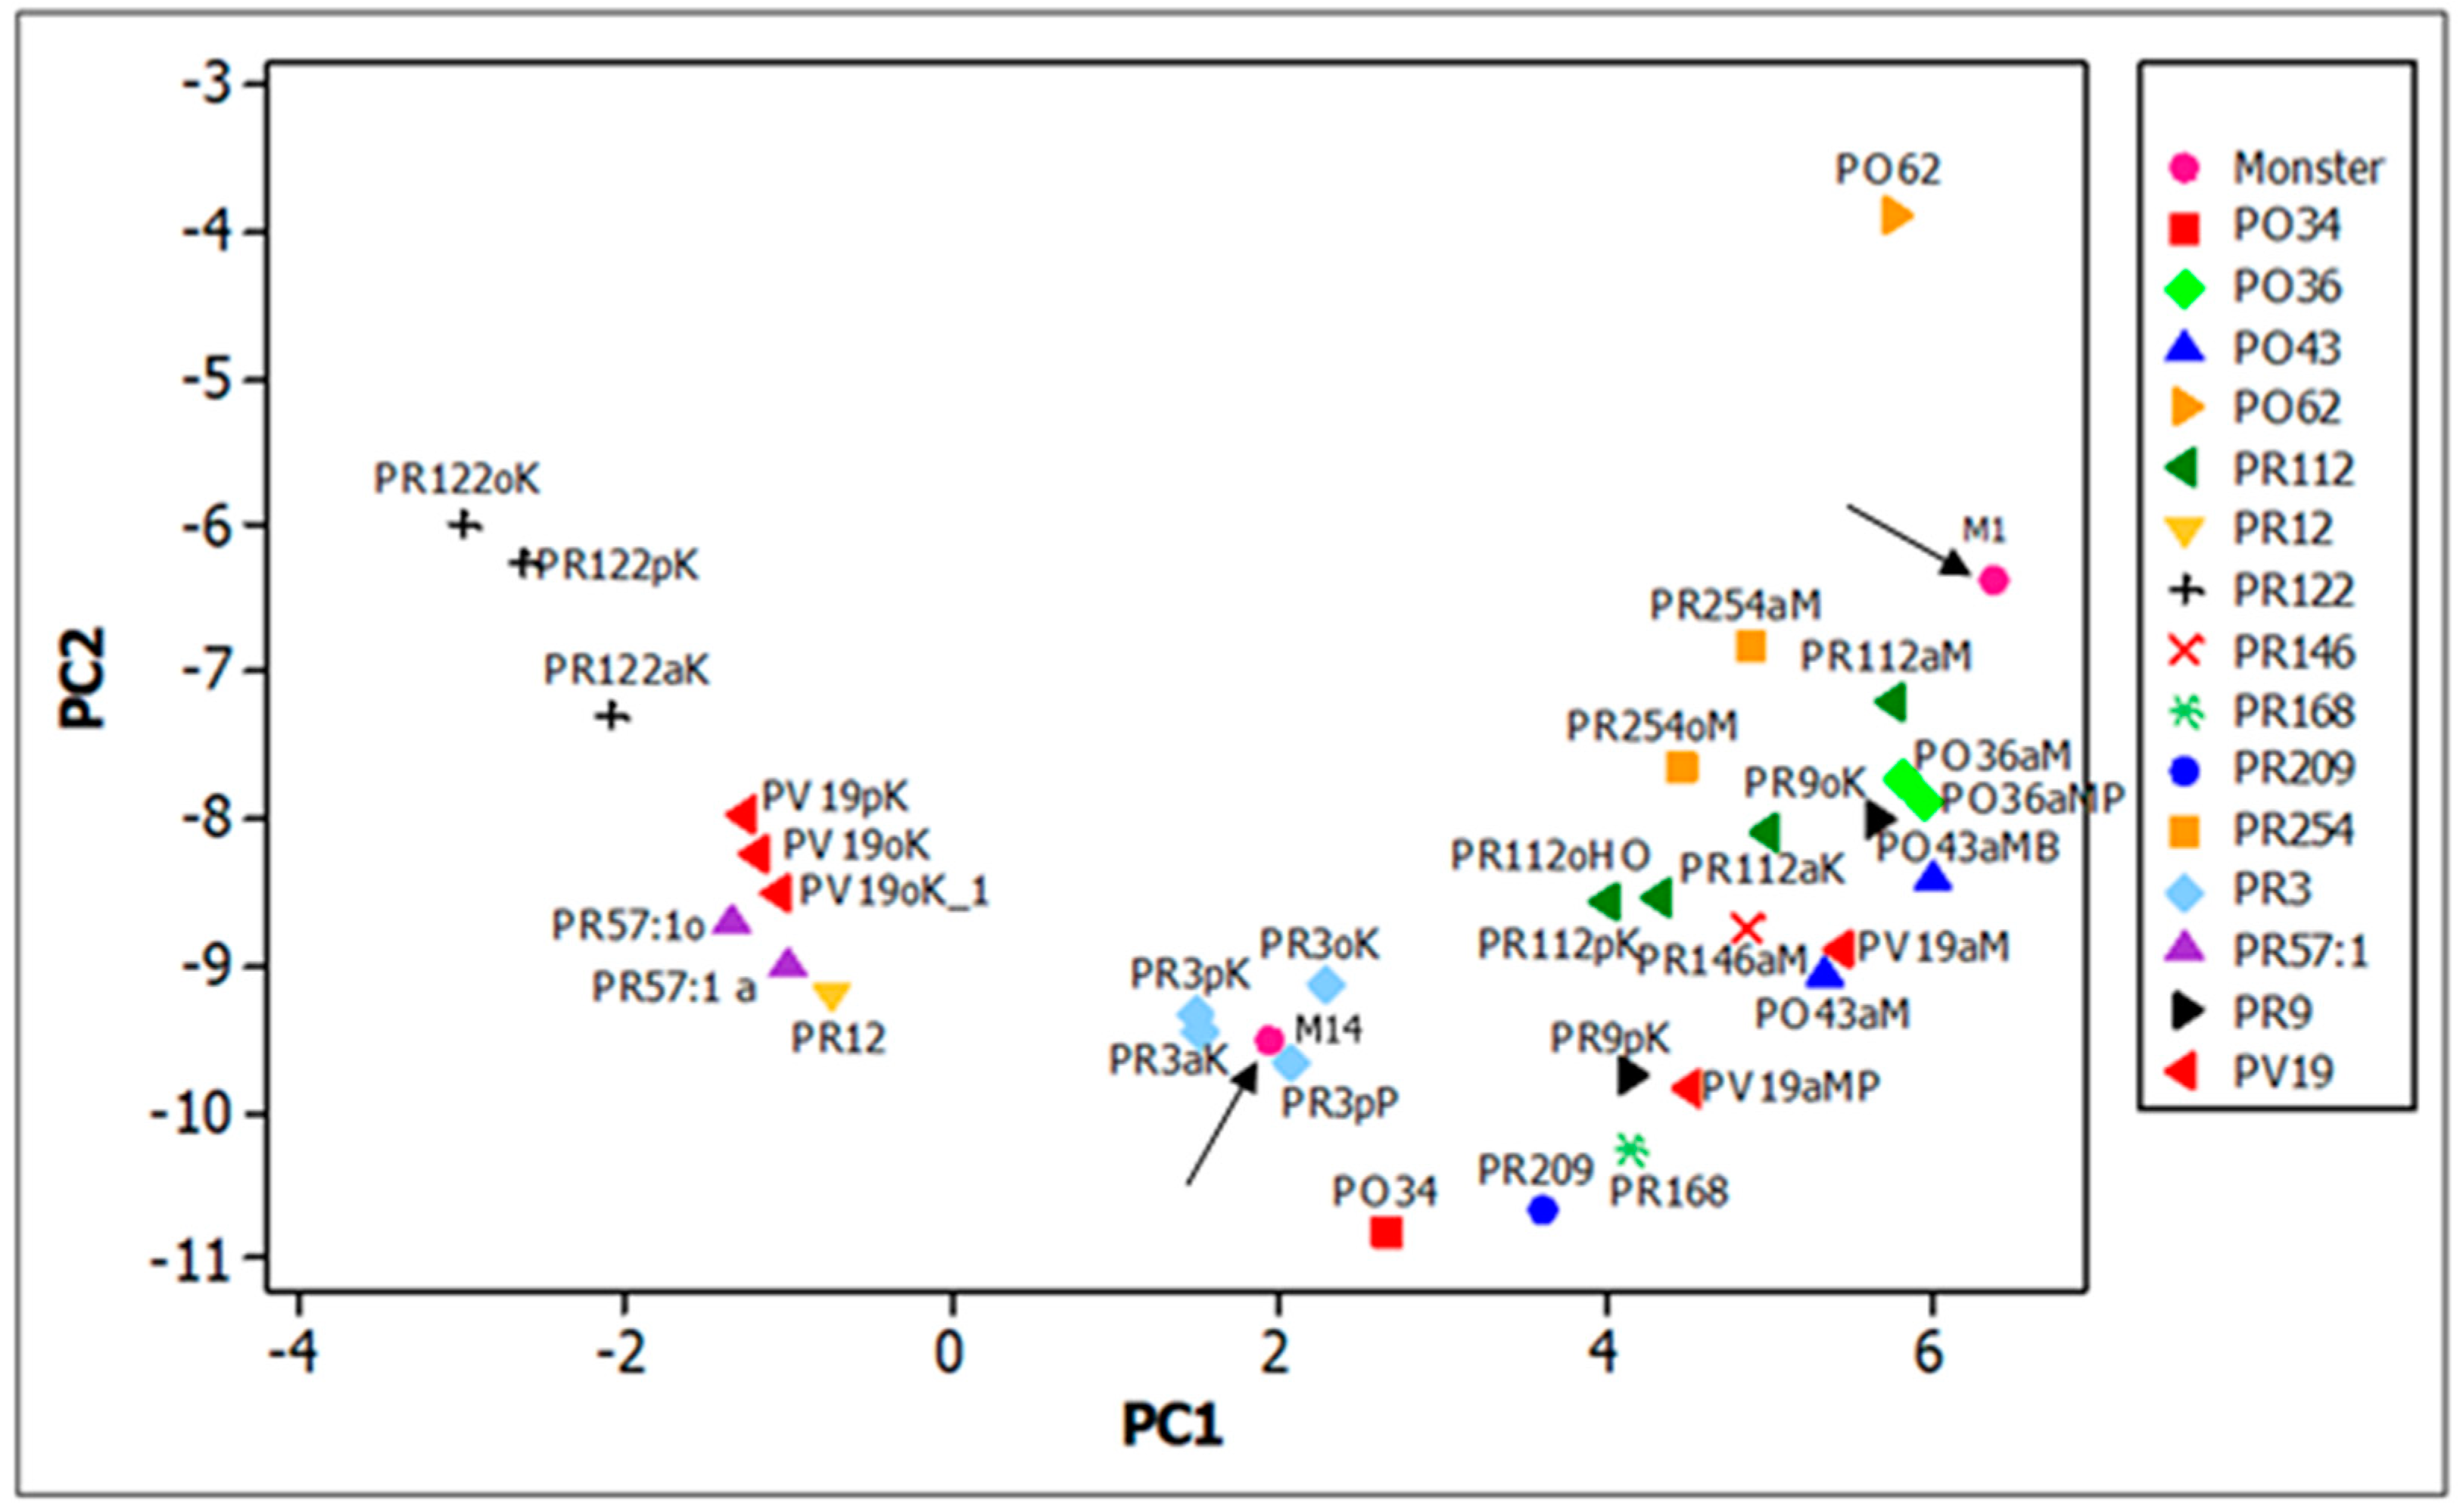
3.1. Synthetic Organic Pigments

In the paintings analysed, a rather wide choice of synthetic organic pigments was detected. Throughout the paper, the pigments are named according to the conventional Colour Index (CI) nomenclature system, which requires each colourant to be designed by a CI name, referring to its colour, and a CI number, giving some information about the chemical constitution of the pigment (e.g., Pigment Red 1, or PR1). Specifically, for names, the matches are R for red, Y for yellow, O for orange, B for blue, G for green, V for violet and W for white. The chemical class to which each pigment belongs is reported in Table 1.

3.1.1. Blue and Green
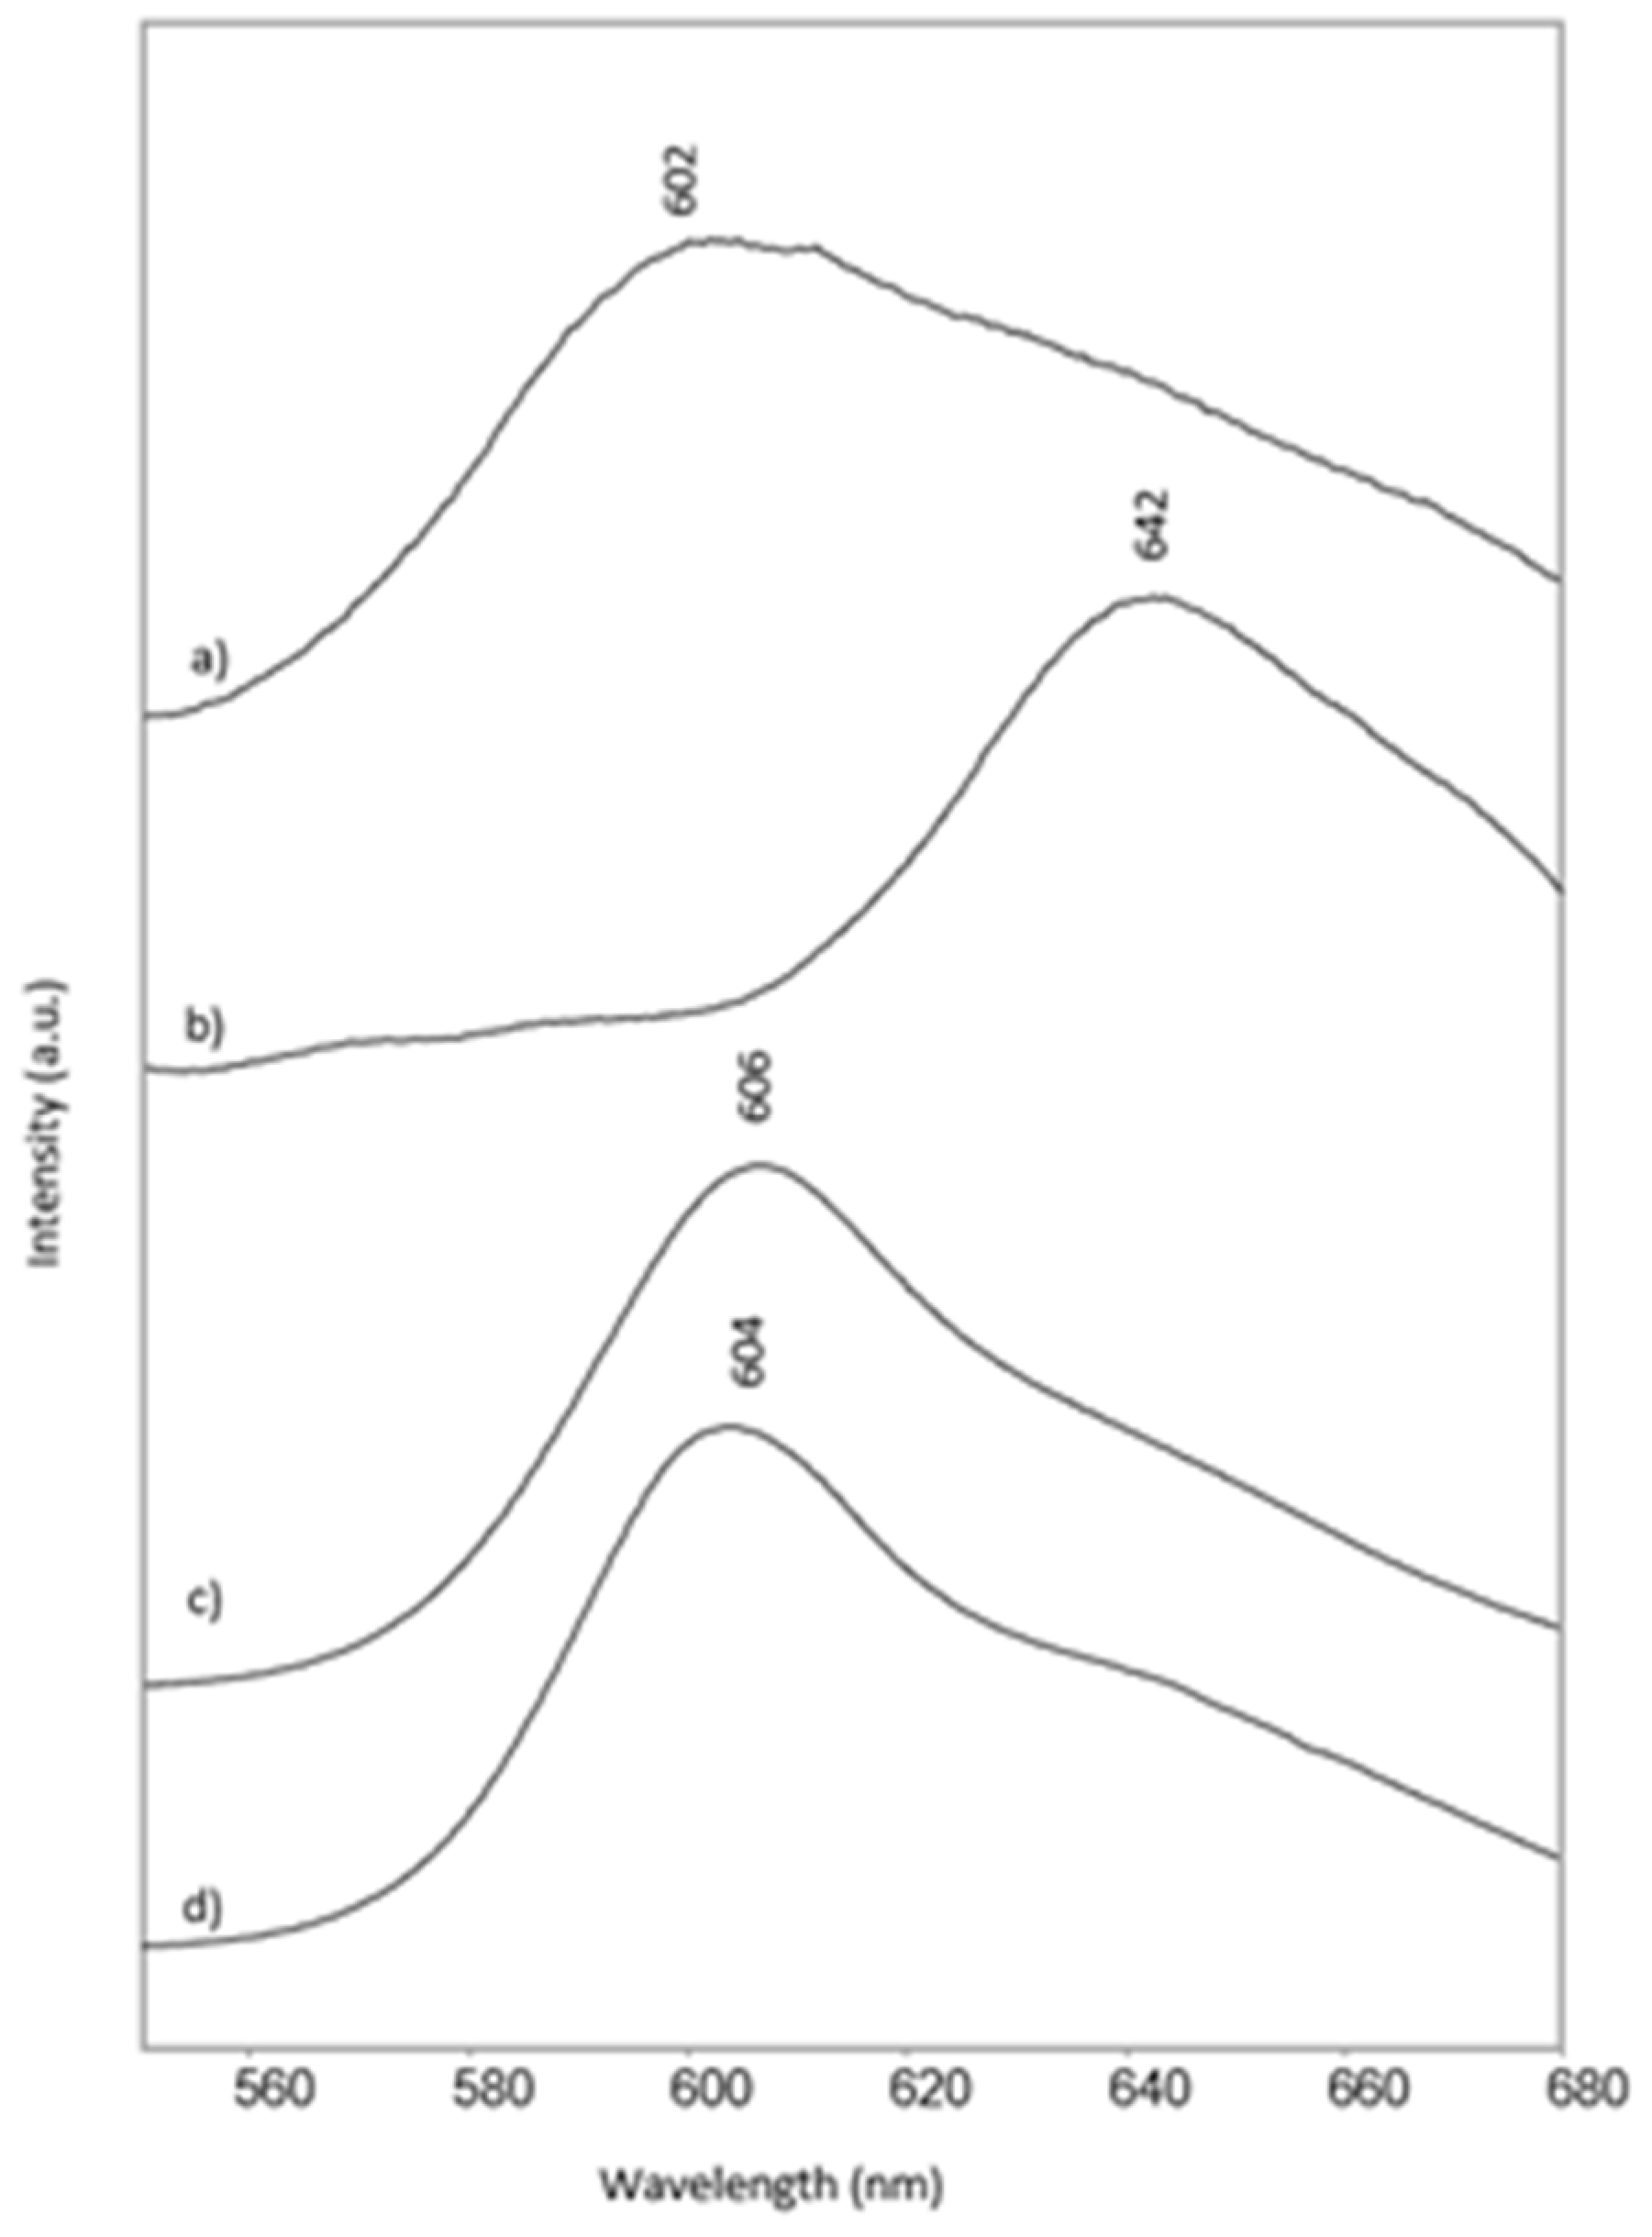
For the blue and green hues, phthalocyanine pigments were abundantly used, even mixed with other organic or inorganic pigments, and could be identified through their Raman spectra.
For blue, phthalocyanine blue PB15 was recognised in areas M9, M7 and NQ4 (Figure 7e, Figures S1c and S2c, Supplementary Materials) and supposed to be in the form PB15:1 due to the presence of a very weak band at around 1182 cm−1 [11]. As will be shown below, further spectroscopic data demonstrated that it was mixed with Prussian blue in the M7 area.
PB15 was also detected by means of vis-RS, thanks to its characteristic bands (i.e., the broad 580–610 nm absorption band and the narrow 690–700 nm one) the relative maximum between these at 660–670 nm, and the reflectance peak at 460–480 nm [12]. However, on the basis of vis-RS it appears to be difficult to distinguish between PB15 and PB15:1.
For green, both fully chlorinated PG7 and partially brominated PG36 phthalocyanine could be detected.
In particular, PG7 was recognised in both paintings, in areas M16 and NQ6, again thanks to the Raman spectra (Figure 7f) [13,14,15]. In the dark green area NQ10, the same pigment was used in mixture with PB15, as indicated by the coexistence of Raman bands at 680, 740, 774, 816, and 1290 cm−1, due to PG7, and at 956, 1145, 1342, 1451 cm−1, due to PB15. Furthermore, the signal at 1530–1540 cm−1 contains both one component at about 1530 cm−1 for PB15 and another at approximately 1539 cm−1 for PG7 (Figure S2e, Supplementary Materials). For this area, vis-RS measurements could only distinguish the presence of PB15, although some traces of phthalocyanine were found in the yellow paint of NQ7, showing the sensitivity of this technique to this class of pigments. For the bright green NQ5 area of the same painting, the Raman spectrum suggests that PG7 was likely mixed with PY3 (Figure S2c, Supplementary Materials), as detailed below. The presence of a yellow pigment in some green mixtures such as NQ5 can be observed by microscopy (Figure 3, NQ5).
Also, vis-RS allows the detection of PG7 due to the absorption band at 620–650 nm and the narrow one at 730 nm, with a relative maximum at 710 nm, in accordance with the literature [12]. When PY3 is mixed, as in the NQ5 area, it produces the shift of the maximum from about 500–510 nm to 530 nm, and of the first edge from ab. 450 nm to 470–480 nm.
PG36 was identified on the basis of the Raman spectra in M4 and M6 areas of “The monster” (Figure 7g and Figure S1b, Supplementary Materials) [13]. It is interesting to note that this pigment was produced starting from 1959 [16], therefore only a few years before the painting under investigation. Phthalocyanine PG36 was not identified by vis-RS: probably its bands are too close to PG7 ones.
Of course, none of the above pigments gave rise to fluorescence emission upon visible excitation, most likely due to the quenching effect of the paramagnetic Cu2+ ion [17].
ED-XRF could detect very small amounts of Cu, which also belong to the Al alloy, but at least in one point, NQ10, where the green is darker (i.e., more concentrated) a higher intensity of Cu was measured (Figure 6, green spectrum).

3.1.2. Red

For red colours, two different synthetic organic pigments could be identified. The first one is the β-naphthol PR3, positively indicated by its characteristic Raman bands [4] in the red area M14 of “The Monster” (Figure 7b), but also in the red-purple area NQ12 of “The Daily Neo-Mythology” (Figure S2f, Supplementary Materials). An interesting fluorescence response was obtained on the same areas upon excitation at 435 nm. As can be seen in Figure S3a (Supplementary Materials), an emission maximum around 630 nm is observed, in accordance with what previously reported for this pigment [6]. Furthermore, an excellent correspondence was obtained in the PCA for the emission spectrum of the M14 area in comparison with those of mock-up samples painted on canvas with several red organic pigments [6] (Figure 8).
The emission maximum of NQ12 is also found around 630 nm (Figure S3c, Supplementary Materials), in agreement with the same pigment PR3 detected by Raman spectroscopy, but a broadening of the band towards 610 nm is also evident. Indeed, the red-purple hue of that measurement area suggests a second component, possibly a violet one such as the β-form of PV19 (Figure S3a, Supplementary Materials). In fact, this pigment shows a fluorescence maximum around 605 nm [6]. Furthermore, it has a weaker Raman response in comparison with PR3, and this may explain why its bands are not observed in the Raman spectrum of NQ12. It is interesting to note that a fuchsia detail of the same painting, NQ9, shows an emission maximum always around 610 nm (Figure S3b, Supplementary Materials), with an excellent correspondence with the fluorescence spectrum of PV 19 β (Figure S3a, Supplementary Materials) also with regard to the band shape.
The second red organic pigment is a naphthol AS (or naphthol red) one and was identified in the NQ1 area on the basis of its Raman bands (Figure S2a, Supplementary Materials), corresponding to those of PR10 [4], but also of the orange pigment PO38 [15] which belongs to the same structural class. The emission maximum observed for the same area upon visible excitation is around 600 nm (Figure 9a). Correctly, it does not match any spectrum of our database, which actually does not contain those pigments.
The same Raman bands were recorded for the orange area M10 of “The Monster” (Figure 7a), where also a yellow pigment, not detectable by the Raman spectrum, was identified by spectrofluorimetry as will be detailed below.
As hypothesized and already verified [7], vis-RS is not effective in distinguishing among modern red pigments, as well as yellow ones, if not in special cases.

3.1.3. Yellow

No Raman bands were observed for the yellow pigment in the M11 and M20 areas of “The monster”, but a characteristic emission spectrum was recorded for both areas, with a maximum at 525 nm and shoulders at about 537, 560, and 582 nm (Figure S4a, Supplementary Materials). This pattern has a good correspondence with the fluorescence spectrum previously reported for the isoindole yellow PY109 [6] and was also observed for the orange area M10 (Figure S4b, Supplementary Materials), where the red pigment PR10 (or PO38) was identified by Raman spectroscopy. The PCA of the emission spectra obtained on “The Monster” compared with those of yellow synthetic organic pigments in painting mock-up samples [6] shows nevertheless a certain distance in the space of the first two principal components between the spectra from the painting and those of the reference PY109 paints (Figure 10), which however do not in themselves form a very close group. Furthermore, a minor contribution to the emission spectra due to the additional red pigment recognised for M10 cannot be excluded.
The possible identification of the pigment PY109 is of interest, as it was introduced in the same years when Pasotti painted “The Monster”. Indeed, this type of pigment was first described in 1964 [18]. The vis-RS characteristics of this material are listed in Table 1 (M10, M11, M20).
For the yellow area NQ7 and the green one NQ5 in “The Daily Neo-Mythology” two different yellow pigments were identified.
In the first area the arylide yellow (or Hansa yellow) PY1 could be recognised on the basis of its Raman spectrum (Figure 7d) [4]. To further verify the performance of spectrofluorimetry in the identification of such pigments, the emission spectrum of the NQ7 area was also recorded (Figure S4d, Supplementary Materials) and a remarkable correspondence was obtained with the spectra of arylide yellows. In fact, as expected [6] the emission maximum was located around 540 nm and the attribution was confirmed by PCA (Figure 10). PY1 was also detected by Raman (Figure S2d, Supplementary Materials) and by FTIR spectroscopy (Figure 11b) [19] in the orange area NQ8 of “The Daily Neo-Mythology”. The obvious presence of a second red or orange component in such area is confirmed by the fluorescence band with a maximum at 590 nm, that prevails on the emission of the yellow dye but unfortunately does not correspond to the spectrum of any pigment present in our database [6].
In the green area NQ5, where the Raman spectrum of phthalocyanine green PG7 was obtained (see above), the visible-excited emission spectrum (Figure S4c, Supplementary Materials), with a maximum at 524 nm, should be attributed to a yellow component. A reasonable assignment, also on the basis of PCA (Figure 10), could be the arylide yellow PY3 [6]. A very weak Raman band observed at approximately 1140 cm−1 (Figure S2c, Supplementary Materials) could further support this hypothesis [4].

3.1.4. Violet

The violet tint is present in both paintings, respectively, in the M15 and NQ3 areas. The same Raman spectral pattern was obtained for the two areas (Figure 7c and Figure S2b, Supplementary Materials), showing a good correspondence with the spectrum reported in the literature for the anthraquinone pigment PV5 [4]. To complement the available database, which does not include the aforementioned pigment, it should be noted that a characteristic emission at 640 nm (Figure 9b) was observed upon excitation at 435 nm.
Vis-RS can detect two bands around 550 and 590 nm, and a small increase in the reflectance factor at 560 nm, while above 590–600 nm the curve begins to rise.

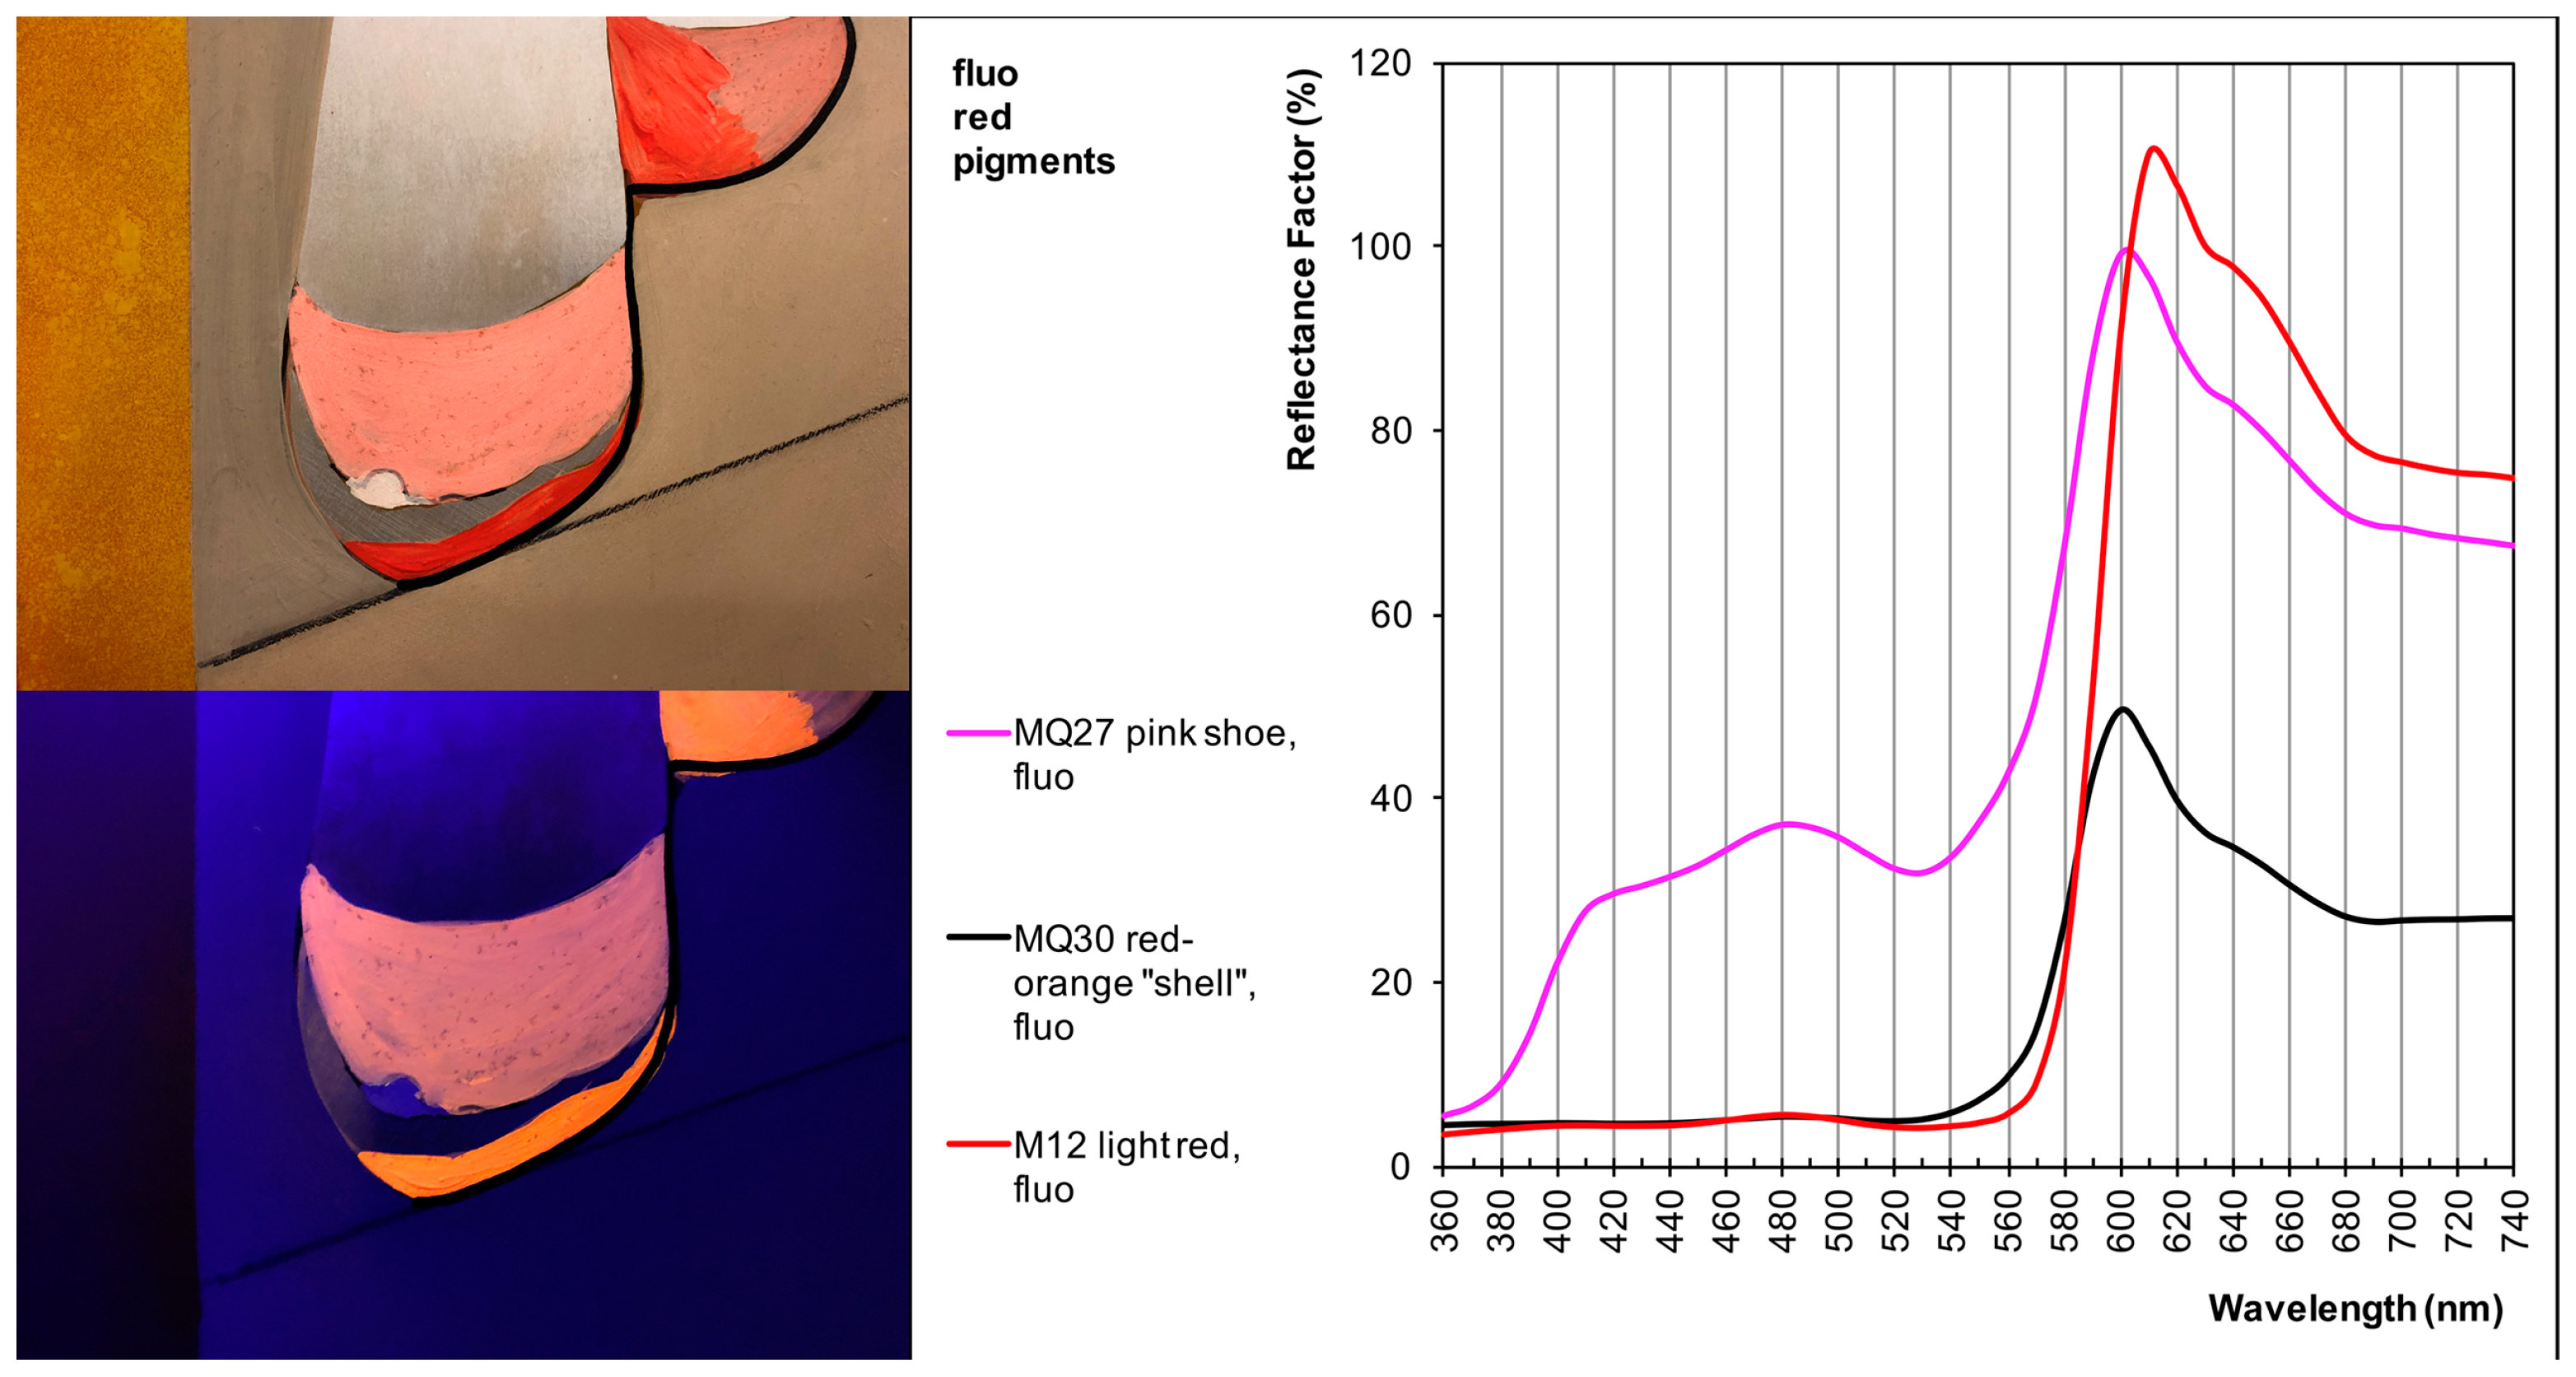
3.2. “Special Effect” Pigments

The so-called “special effect” pigments include among others UV- and daylight-fluorescent pigments [20], that were adopted by pop artists, first Andy Warhol in the 1960s, for their exceptional brightness. Fluorescent pigments are typically composed of a 5% fluorescent dye diluted by a transparent resin. Usually, several dyes are combined to obtain a wider range of different hues. Among them, xanthene dyes such as rhodamine B or 6G are often employed [21].
Emission spectra were acquired for areas M12 and M13 of “The Monster”, showing a peculiarly high intensity. Their shape and wavelength of the fluorescence maximum (604 nm) resulted to be characteristic of rhodamine 6G. This is evidenced in Figure 9d by comparison with the fluorescence spectrum of a commercial fluorescent paint whose formulation was already demonstrated to contain such dye [22].
The higher fluorescence was detected by UVF images and vis-RS spectra in some pink and red-pink areas, as the shoes of the pair of female legs painted on the left side of “The Daily Neo-Mythology” right frieze, and a peculiar red hue of “The Monster”. The same vis-RS spectrum was obtained in all cases, with a relative maximum at 480 nm, a very intense fluorescence peak at 600 nm, and absorption bands at 530 nm (stronger), 630, and 690 nm (Figure 12).

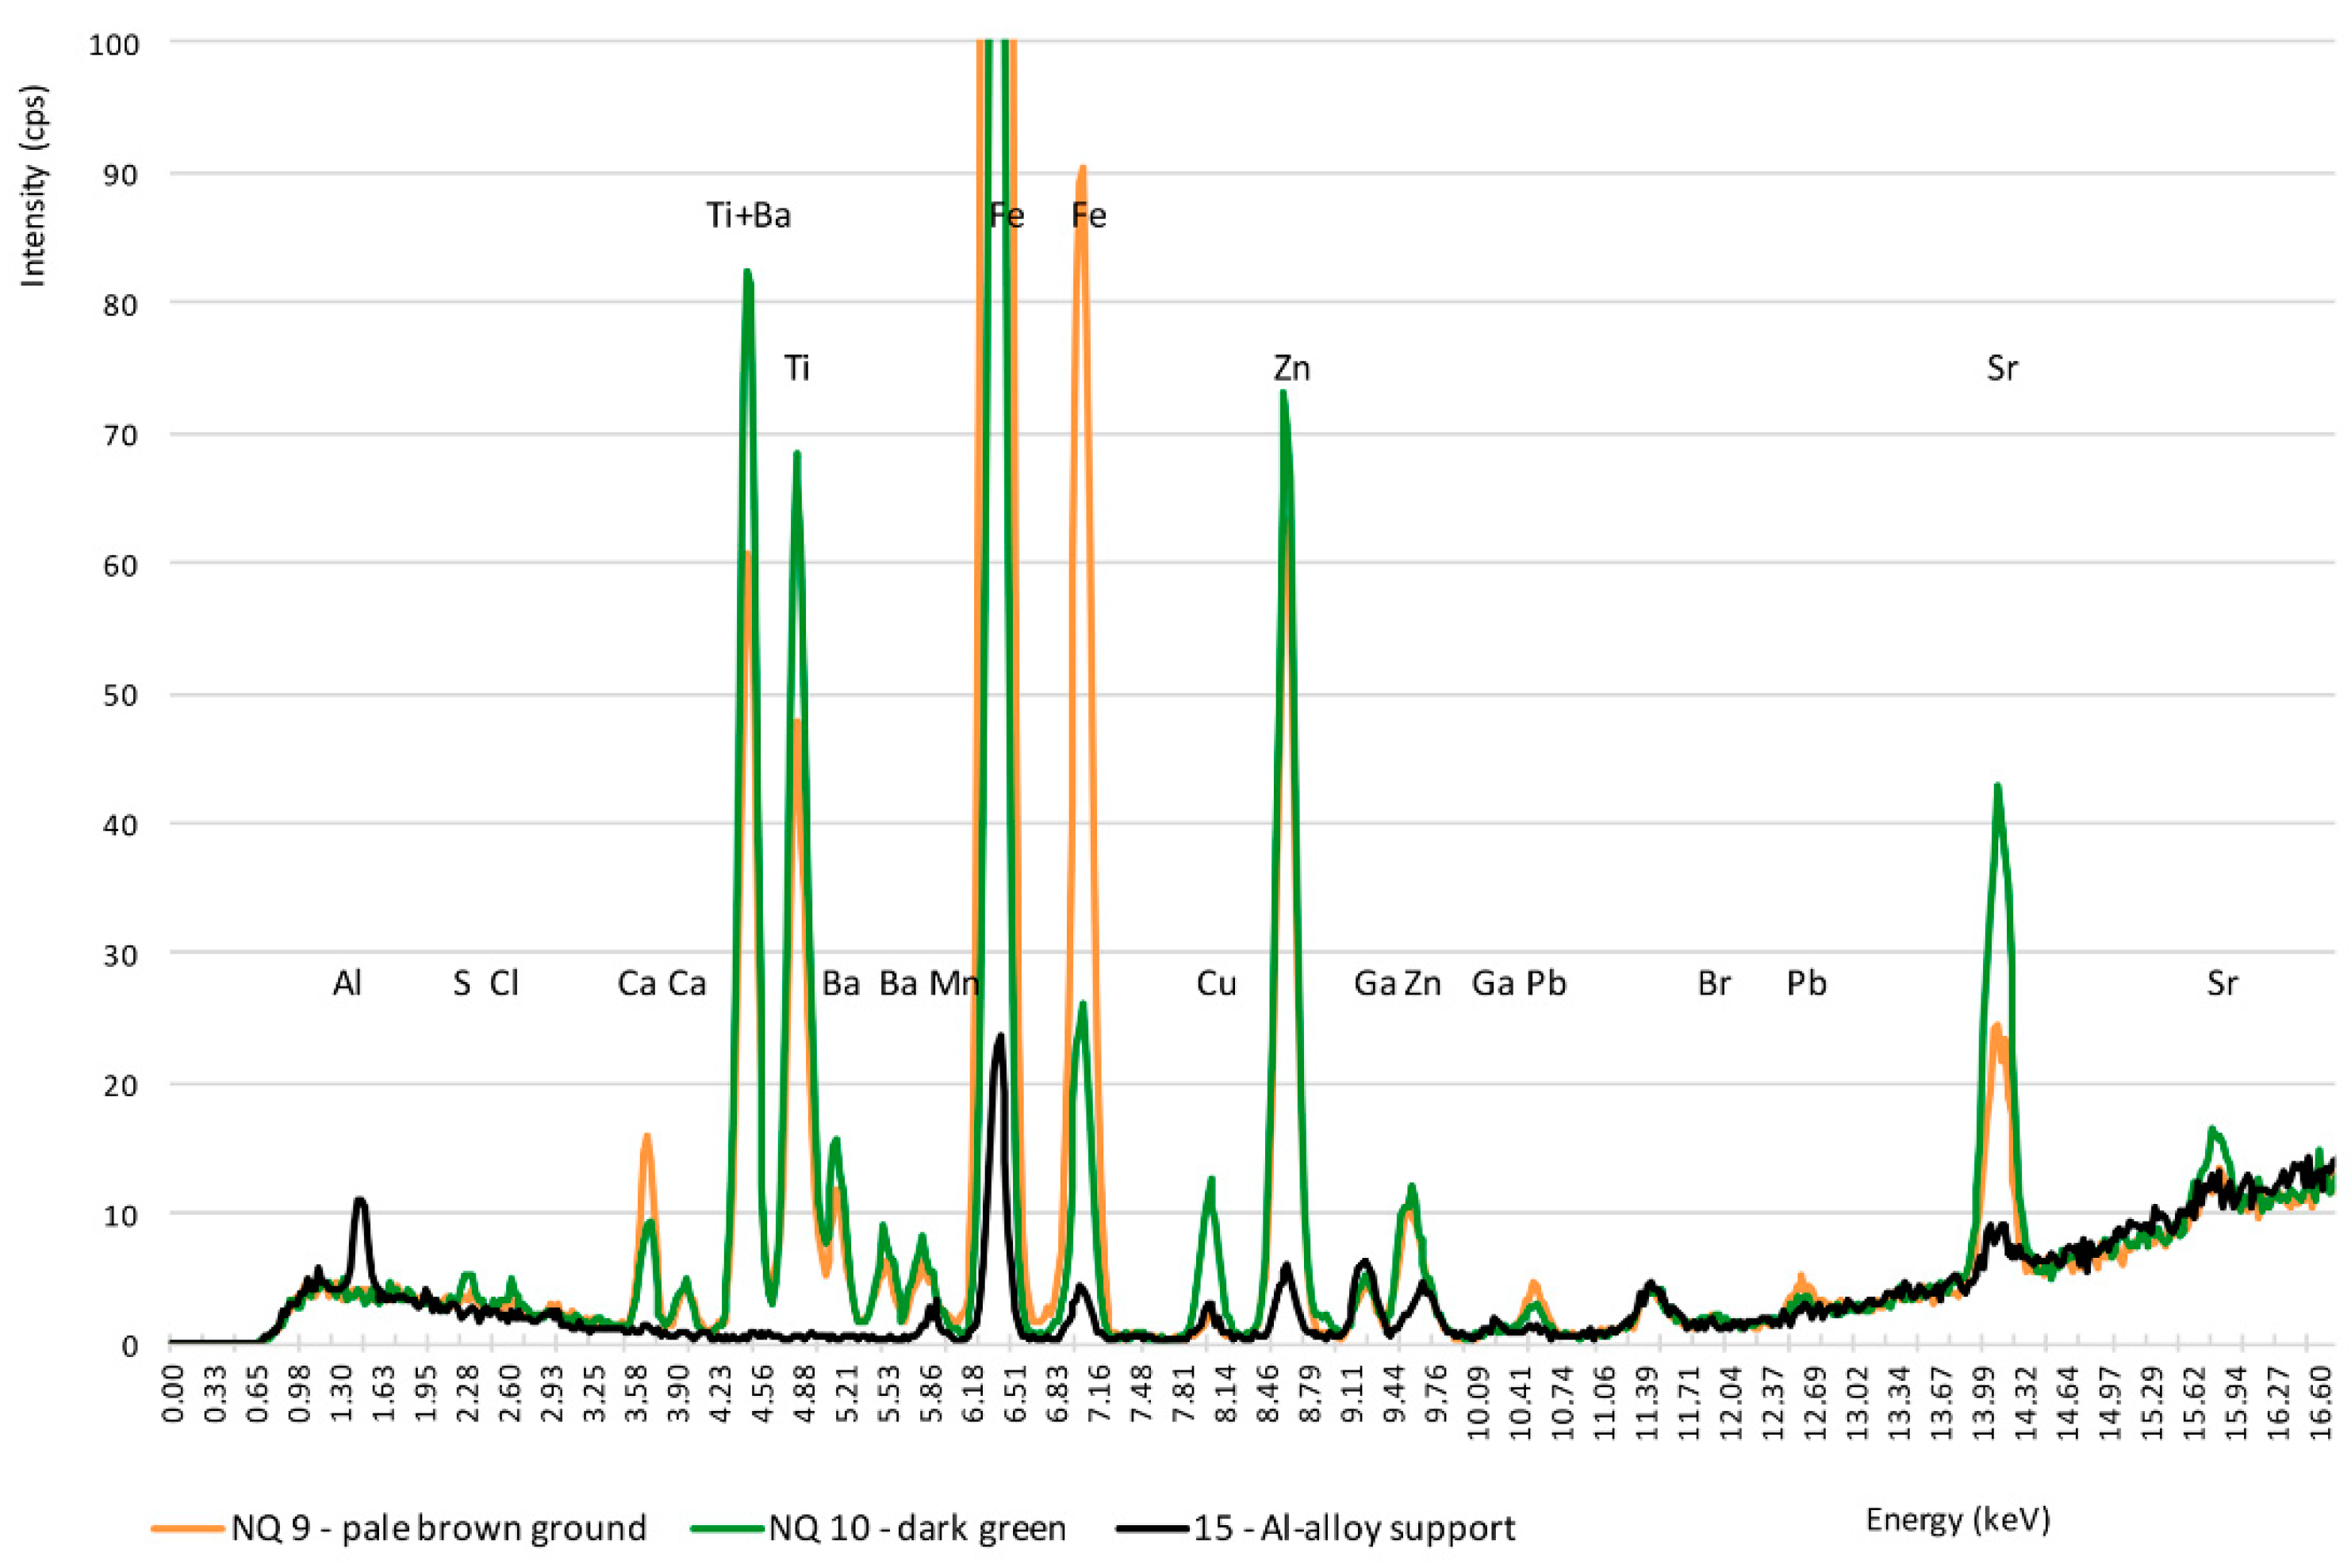
3.3. Inorganic Pigments

Traditional inorganic pigments are also represented in the paintings under investigation.
Titanium white TiO2 as rutile is ubiquitous and its typical Raman bands around 445 and 605 cm−1 [23] are observed in the spectra of white details such as M2 (data not shown) and also of several examined areas having different colours (see for example Figure 7a,b,e). The Ti signal was measured by ED-XRF in all the examined points, partly due to the primer, partly to the outer coloured layer (cf. spectra NQ9 and NQ10 in Figure 6), and the rutile 410 nm shoulder (sometimes shifted to 420 nm) was clearly detected by vis-RS in many spectra (see Figure 12, MQ27 line).
Two inorganic blue pigments were also recognised (i.e., ultramarine blue PB29 and Prussian blue PB27) thanks to the vibrational spectra and, very easily, through the reflectance spectra in the visible range.
Ultramarine blue could be detected in a dark blue detail (NQ11) of the “The Daily Neo-Mythology”. It was identified thanks to vis-RS typical spectrum with 590 nm absorption band, as well as to the characteristic Raman signal at 548 cm−1 [23] (Figure S2f, Supplementary Materials) and, in the IR spectrum, to the strong and wide band around 1015 cm−1 and the medium one at 450 cm−1 [24] (Figure 11c).
As anticipated above, Prussian blue was recognized in the area NQ2 of “The Daily Neo-Mythology” and in the area M7 of “The Monster”, where it is admixed with phthalocyanine blue PB15. In both cases, it could not be identified on the basis of the Raman spectrum, simply since its strongest Raman band was located outside the spectral range accessible with a single acquisition by our equipment. On the contrary, it was clearly individuated by the intense IR signal around 2090 cm−1 (Figure 11a).
Finally, an interesting case is represented by the red pigment employed in the area M1 of “The Monster”. The most significant Raman band are located at 985 cm−1 and 1085 cm−1 and can be assigned respectively to BaSO4 and CaCO3 as calcite [23], which were most probably extenders of the paint used by the artist. It is interesting to note that in the Raman spectrum of cadmium red reported in ref. [16] the band at 985 cm−1 due to the filler barium sulphate is indeed the strongest one. In parallel, in another work [25] the Raman spectrum of the same red pigment could not be obtained upon excitation at 785 nm, the wavelength used in the present study for the in situ measurements. These two facts, and the lack of other significant signals, led us to hypothesize that our Raman data suggested indirectly the use of cadmium red as pigment in the examined area. As reported in ref. [6], such pigment can be identified by its characteristic NIR emission upon visible excitation. However, in the present work, just the fluorescence response in the visible range was investigated and a weak emission around 610 nm was observed (Figure S3c, Supplementary Materials). The position of the band is coincident with that of the absorption edge of the same area (data not shown), and this fact seems to corroborate the above hypothesis. Indeed, as reported in the literature [26], semiconductor cadmium pigments can also exhibit a weak band edge luminescence at a wavelength close to the transition edge of the reflectance spectrum, besides the stronger one due to the deep trap emission.
XRF was not carried out on “The Monster”, but Cd and Se signals were found in a red of “The Daily Neo-Mythology” not listed in Table 1.

3.4. Binders

The investigation of binders was entirely based on the use of reflection FTIR spectroscopy, both in the MIR and in the NIR region.
The experimental results pointed to the prevailing use of nitrocellulose paint for “The Monster” and of acrylic paint, at least for the most part, in the case of “The Daily Neo-Mythology”.
Nitrocellulose could be identified as a binder in “The Monster” thanks to bands at 1650, 1282, 1074, and 845 cm−1, observed in the transformed reflection spectrum in the MIR range [27,28,29] (Figure 11d).
In “The Daily Neo-Mythology”, the acrylic binder could be recognised in the MIR spectrum based on signals at 1736, 1446, 1382, and 1160 cm−1 [3,27] (Figure 11b,c). Among the examined areas, just in the blue detail NQ2 nitrocellulose could instead be detected (Figure 11a).
Unlike what was observed in the MIR region, the NIR spectra obtained for the two paintings are quite similar and show bands at 4680, 4430, and 4350 cm−1, that can be assigned to an acrylic binder (Figure 11e,f). In particular, in the NIR spectra of details of “The Monster” it is not possible to observe the bands characteristic of the NO2 group of nitrocellulose at 4835 and 5262 cm−1 [28]. Considering the greater penetration depth of NIR compared to MIR radiation [3], it can be supposed that an acrylic primer was used by the artist on the aluminium surface before applying the nitrocellulose paint.

4. Conclusions

During the 1960s, Silvio Pasotti began to temporarily abandon the canvas support experimenting with Al-alloy panels (Al above 99%), chosen for the possibility to work on a flat and durable surface, as well as for its aesthetic appearance, with differently reflective zones left unpainted. He used both brush and spray, usually avoiding mixing pigments, except for a few cases, to achieve peculiar effects.
The non-invasive analytical approach adopted in this investigation allowed an in-depth study of the painting technique, including the changes that occurred during painting, and a comprehensive identification of the pigments and binders employed by the Italian pop artist, highlighting a wide choice of materials and some specific limitations of the analytical techniques used. The materials also included recently introduced pigments at the time of making the paintings and special effect coloring substances, such as rhodamine-based fluorescent pigments. Both acrylic and nitrocellulose binders were also recognised.
Finally, from the methodological point of view, the synergic and complementary use of large area multispectral imaging techniques and molecular spectroscopic techniques, including the optical fluorescence, although so far little exploited, has proved to be an effective approach to the complex identification of materials in contemporary art, especially as regards the vast range of synthetic organic pigments.

Supplementary Materials

The following are available online at https://0-www-mdpi-com.brum.beds.ac.uk/article/10.3390/heritage5010003/s1. Figure S1: Supplementary Raman spectra from areas of “The Monster”; Figure S2: Supplementary Raman spectra from areas of “The Daily Neo-Mythology”; Figure S3: Emission spectra from red areas of “The Monster” and “The Daily Neo-Mythology”; Figure S4: Emission spectra from yellow and green areas of “The Monster” and “The Daily Neo-Mythology”.

Author Contributions

Conceptualization, G.P. and S.B.; methodology, S.B. and G.P.; formal analysis, S.B. and M.L.; investigation, S.B., N.C., V.G. and G.P.; resources, S.B. and G.P.; data curation, S.B., M.L., N.C. and G.P.; writing—original draft preparation, S.B., M.L. and G.P.; writing—review and editing, S.B.; visualization, M.L. and G.P.; supervision, S.B. All authors have read and agreed to the published version of the manuscript.

Funding

This research received no external funding.

Institutional Review Board Statement

Not applicable.

Informed Consent Statement

Not applicable.

Data Availability Statement

Not applicable.

Acknowledgments

The Municipality of Segrate (Milano, Italy) and the artist Silvio Pasotti are acknowledged for granting permission to analyse the paintings. Maria Letizia Amadori is thanked for the use of XRF equipment.

Conflicts of Interest

The authors declare no conflict of interest.

References

  1. Learner, T. Modern paints: Uncovering the choices. In Modern Paints Uncovered; Learner, T.J.S., Smithen, P., Krueger, J.W., Schilling, M.R., Eds.; The Getty Conservation Institute: Los Angeles, CA, USA, 2007; pp. 3–16. [Google Scholar]
  2. Lomax, S.; Learner, T. A review of the classes, structures, and methods of analysis of synthetic organic pigments. J. Am. Inst. Conserv. 2007, 45, 107–125. [Google Scholar] [CrossRef]
  3. Rosi, F.; Daveri, A.; Moretti, P.; Brunetti, B.G.; Miliani, C. Interpretation of mid and near-infrared reflection properties of synthetic polymer paints for the non-invasive assessment of binding media in twentieth-century pictorial artworks. Microchem. J. 2016, 124, 898–908. [Google Scholar] [CrossRef]
  4. Scherrer, N.C.; Zumbuehl, S.; Delavy, F.; Fritsch, A.; Kuehnen, R. Synthetic organic pigments of the 20th and 21st century relevant to artist’s paints: Raman spectra reference collection. Spectrochim. Acta A 2009, 73, 505–524. [Google Scholar] [CrossRef] [PubMed]
  5. Bruni, S.; Guglielmi, V. Raman spectroscopy for the identification of materials in contemporary painting. In Raman Spectroscopy in Archaeology and Art History; Vandenabeele, P., Edwards, H., Eds.; Royal Society of Chemistry: London, UK, 2019; Volume 2, pp. 157–173. [Google Scholar] [CrossRef]
  6. Longoni, M.; Freschi, A.; Cicala, N.; Bruni, S. Non-invasive identification of synthetic organic pigments in contemporary art paints by visible–excited spectrofluorimetry and visible reflectance spectroscopy. Spectrochim. Acta A 2020, 229, 117907. [Google Scholar] [CrossRef] [PubMed]
  7. Poldi, G.; Anselmi, C.; Daveri, A.; Vagnini, M. Josef Albers’ Use of 20th Century Pigments: A Non-Invasive Analytical Approach. In Science and Art: The Contemporary Painted Surface; Sgamellotti, A., Brunetti, B.G., Miliani, C., Eds.; The Royal Society of Chemistry: London, UK, 2020; pp. 67–94. [Google Scholar]
  8. Pinna, D.; Galeotti, M.; Mazzeo, R. (Eds.) Scientific Examination for the Investigation of Paintings: A Handbook for Conservators-Restorers; Centro Di: Firenze, Italy, 2009. [Google Scholar]
  9. Poldi, G.; Fiorucci, L.; Nicoletti, L.P. (Eds.) Pop ’60 Silvio Pasotti. Intorno al Fregio del Municipio di Segrate; Editoriale Umbra: Foligno, Italy, 2018. (In Italian) [Google Scholar]
  10. Cavallo, L. Silvio Pasotti. Catalogo Ragionato Della Pittura; Skira: Milano, Italy, 2008. (In Italian) [Google Scholar]
  11. Defeyt, C.; Vandenabeele, P.; Gilbert, B.; Van Pevenage, J.; Clootse, R.; Strivaya, D. Contribution to the identification of α-, β- and ε-copper phthalocyanine blue pigments in modern artists’ paints by X-ray powder diffraction, attenuated total reflectance micro-Fourier transform infrared spectroscopy and micro-Raman spectroscopy. J. Raman Spectrosc. 2012, 43, 1772–1780. [Google Scholar] [CrossRef]
  12. Poldi, G.; Caglio, S. Phthalocyanine identification in paintings by reflectance spectroscopy. A laboratory and in situ study. Opt. Spectrosc. 2013, 114, 1018–1025. [Google Scholar] [CrossRef]
  13. Coccato, A.; Bersani, D.; Coudray, A.; Sanyova, J.; Moens, L.; Vandenabeele, P. Raman spectroscopy of green minerals and reaction products with an application in Cultural Heritage research. J. Raman Spectrosc. 2016, 47, 1429–1443. [Google Scholar] [CrossRef]
  14. Zieba-Palus, J.; Was-Gubała, J. An investigation into the use of micro-Raman spectroscopy for the analysis of car paints and single textile fibres. J. Mol. Struct. 2011, 993, 127–133. [Google Scholar] [CrossRef]
  15. Fremout, W.; Saverwyns, S. Identification of synthetic organic pigments: The role of a comprehensive digital Raman spectral library. J. Raman Spectrosc. 2012, 43, 1536–1544. [Google Scholar] [CrossRef]
  16. Lenoir, J. Organic Pigments. In The Chemistry of Synthetic Dyes; Venkataraman, K., Ed.; Academic Press: New York, NY, USA, 1971; Volume 5, p. 390. [Google Scholar]
  17. Skoog, D.A.; Holler, F.J.; Crouch, S.R. Principles of Instrumental Analysis, 7th ed.; Cengage: Boston, MA, USA, 2018; p. 379. [Google Scholar]
  18. Hunger, K.; Herbst, W. Pigments, organic. In Ullmann’s Encyclopedia of Industrial Chemistry; Wiley-VCH: Weinheim, Germany, 2012; Volume 27, pp. 404–405. [Google Scholar]
  19. Tate Gallery, London. IOD00298, Pigment Yellow 1. In Infrared and Raman Users Group Spectral Database; Price, B.A.; Pretzel, B.; Lomax, S.Q. (Eds.) Infrared and Raman Users Group: Philadelphia, PA, USA; Available online: www.irug.org (accessed on 31 October 2021).
  20. Nurhan Becidyan, A. The Chemistry & Physics of Special Effect Pigment & Colorants “What They Are & How They Are Used”; AESA NY-NJ Section Lecture Series; United Mineral & Chemical Corporation: New York, NY, USA, 2014. [Google Scholar]
  21. Streitel, S.G. Fluorescent pigments (daylight). In Kirk-Othmer Encyclopedia of Chemical Technology; John Wiley and Sons: New York, NY, USA, 2009; Volume 15, p. 584. [Google Scholar]
  22. Boscacci, M.; Francone, S.; Galli, K.; Bruni, S. The brightest colors: A Fourier-transform Raman, surface-enhanced Raman, and thin-layer chromatography-surface-enhanced Raman spectroscopy study of fluorescent artists’ paints. J. Raman Spectrosc. 2020, 51, 1108–1117. [Google Scholar] [CrossRef]
  23. Burgio, L.; Clark, R.J.H. Library of FT-Raman spectra of pigments, minerals, pigment media and varnishes, and supplement to existing library of Raman spectra of pigments with visible excitation. Spectrochim. Acta A 2001, 57, 1491–1521. [Google Scholar] [CrossRef]
  24. Silva, C.E.; Silva, L.P.; Edwards, H.G.M.; de Oliveira, L.F.C. Diffuse reflection FTIR spectral database of dyes and pigments. Anal. Bioanal. Chem. 2006, 386, 2183–2191. [Google Scholar] [CrossRef] [PubMed]
  25. Caggiani, M.C.; Cosentino, A.; Mangone, A. Pigments Checker version 3.0, a handy set for conservation scientists: A free online Raman spectra database. Microchem. J. 2016, 129, 23–132. [Google Scholar] [CrossRef]
  26. Thoury, M.; Delaney, J.K. Near-Infrared Luminescence of Cadmium Pigments: In Situ Identification and Mapping in Paintings. Appl. Spectrosc. 2011, 65, 939–951. [Google Scholar] [CrossRef]
  27. Doménech-Carbó, M.T.; Doménech-Carbó, A.; Gimeno-Adelantado, J.V.; Bosch-Reig, F. Identification of synthetic resins used in works of art by Fourier transform infrared spectroscopy. Appl. Spectrosc. 2001, 55, 1590–1602. [Google Scholar] [CrossRef]
  28. Rodrigues, V.C.; de Cássia Lazzarini Dutra, R.; Faria Diniz, M.; da Costa Mattos, E. Quantificação por NIR/MIR de Resina Poliuretânica em Misturas Binárias com Nitrocelulose Utilizadas em Tintas. Polímeros 2014, 24, 367–372. [Google Scholar] [CrossRef] [Green Version]
  29. Dredge, P. Sidney Nolan’s adventures in paint—An analytical study of the artist’s use of commercial paints in the 1940s and ’50s. AICCM Bull. 2014, 34, 15–23. [Google Scholar] [CrossRef]
Figure 1. Silvio Pasotti, “The Daily Neo-Mythology”: (top) the frieze in its context in the Auditorium of the “Giuseppe Verdi” Cultural Centre in Segrate and (centre and bottom) the right and left panels.
Heritage 05 00003 g001
Figure 2. Measurement areas in the two paintings by S. Pasotti: (a) “The monster” (M); (b) “The Daily Neo-Mythology”, right panel, detail (NQ).
Heritage 05 00003 g002
Figure 3. Digital microscopy details (230×) of the measurement areas indicated (see Table 1 for descriptions). The lower images refer to the brushed aluminium-alloy support and to the light brown primer painted on it.
Heritage 05 00003 g003
Figure 4. “The Monster”: the same detail under (left) visible diffused light ad (right) IRR. The first version of the chicken, a larger one, can be seen in the IRR.
Heritage 05 00003 g004
Figure 5. “The Daily Neo-Mythology”, right panel: the same detail seen in (a) visible diffused light, (b) IRR, and (c) IRFC.
Heritage 05 00003 g005
Figure 6. XRF spectra (acquired at 40 kV) of the “The Daily Neo-Mythology”, a comparison among the metal support, the primer (close to NQ9) and a green area (NQ10).
Heritage 05 00003 g006
Figure 7. Raman spectra (λexc = 785 nm) of areas: (a) orange M10; (b) red M14; (c) violet M15; (d) yellow NQ7; (e) blue M9; (f) green NQ6; (g) green M4. The inserted box shows an enlargement of spectra (a,c) to highlight some weaker bands.
Heritage 05 00003 g007
Figure 8. Score plot of the first two principal components of the emission spectra (λexc = 435 nm) of the red areas M14 and M1 (pink circles with arrows) in comparison with those of red and orange pigments in painting mock-up samples with oil or acrylic binder on canvas [6].
Heritage 05 00003 g008
Figure 9. Emission spectra (λexc = 435 nm) of areas: (a) red NQ1; (b) violet M15; (d) red M12. For comparison, the emission spectrum (c) of a red fluorescent paint containing rhodamine 6G (Flashe Fluo colour by Lefranc and Bourgeois) is also reported. Note: the vertical scale is not the same for the four spectra; bands in spectra (c,d), due to “special effect” fluorescent pigments, are about one order of magnitude more intense than those in spectra (a,b).
Heritage 05 00003 g009
Figure 10. Score plot of the first two principal components of the emission spectra (λexc = 435 nm) of the yellow areas M10 and M20 in “The Monster” (red squares with arrows) and NQ5 and NQ7 in “The Daily Neo-Mythology” (green diamonds with arrows) in comparison with those of red and orange pigments in painting mock-up samples with oil or acrylic binder on canvas [6].
Heritage 05 00003 g010
Figure 11. (right) MIR reflection spectra (after Kramers-Kronig transform) of: (a) blue area NQ2 (● band due to Prussian blue PB27); (b) orange area NQ8 (◆ bands due to PY1); (c) blue area NQ11 (■ bands due to ultramarine blue PB29); (d) green area M6; (left) NIR reflection spectra of: (e) blue area NQ11; (f) yellow area M11.
Heritage 05 00003 g011
Figure 12. (top left) visible light detail and (bottom left) UVF detail of “The Daily Neo-Mythology”; (right) comparison of vis-RS spectra of fluorescent pigments (rhodamine 6G) in different red or pink areas of the two examined paintings. 420 nm intense shoulder in the fuchsia line (MQ27, regarding the shoe illustrated) due to titanium white in the mixture.
Heritage 05 00003 g012
Table 1. Pigments identified in the paintings “The Monster” and “The Daily Neo-Mythology” by Silvio Pasotti, with Raman, FTIR and fluorescence data supporting the identification. In case of mixtures, the band assignments are reported in parentheses. In vis-RS column, − indicates the minimum, + the maximum, “s” the shoulder, “e” the edge (increasing slope) and “de” the decreasing edge (slope) of the spectrum.
ColourAreaRaman Bands (cm−1) 1IR Bands (cm−1) 1,2vis-RS Bands (nm)Emission Maximum (nm) 1 Pigment
The Monster (M)
RedM1985 (BaSO4)-510e, 560–570e, 630s 610cadmium red PR108?
M12, M13--410s (TiO2), ab. 490e, 550−, 630s604rhodamine 6G
M14793, 982, 1120, 1183, 1214, 1252, 1317, 1332, 1395, 1445, 1496, 1555, 1622-570e, 640s630 β-naphthol PR3
OrangeM10445, 604 (TiO2), 963, 1044, 1365, 1426, 1493, 1555, 1582 (PR10)-410s (TiO2), 460e, 480+ (weak), 490e, 540−560s525 (530, 560 and 582 shoulders) (PY109)naphthol AS PR10 (or PO38) + isoindole PY109
YellowM11, M20445, 604 (TiO2)-460e, 480+ (weak), 490e, 530s525 (530, 560 and 582 shoulders) (PY109)isoindole PY109
GreenM4, M6667, 747, 770, 1212, 1278, 1336, 1539-410s (TiO2), ab. 460s, 510–520+, 620de, 650−, 710+, 720−-phthalocyanine PG36
M16684, 742, 775, 819. 960, 977, 1002, 1083, 1214, 1289, 1343, 1541-410s (TiO2), ab. 460s, 510–520+, 620de, 650−, 710+, 730−-phthalocyanine PG7
BlueM7440, 605 (TiO2), 677, 745, 950, 1140, 1182, 1338, 1450, 1528 (PB15)2093 (PB27)410s (TiO2), 460+, ab. 710−-phthalocyanine PB15(:1) + Prussian blue PB27
M9443, 602 (TiO2), 677, 745, 951, 1140, 1338, 1450, 1528 (PB15)-420s (TiO2), 480+, 580de, 610−, 660−670+, 690−700−-phthalocyanine PB15(:1)
VioletM15440, 602 (TiO2), 1262, 1400 (PV5)-420+, 540de, 560+ (weak), 590−640anthraquinone PV5
WhiteM2440, 602-380e, 420s (TiO2)-titanium white PW6
The Daily Neo-Mythology (NQ)
RedNQ1963, 1044, 1365, 1426, 1493, 1555, 1582-ab. 560e, 620s600naphthol AS PR10 (or PO38)
NQ12 (red-purple)795, 1125, 1179, 1323, 1393, 1444 (PR3)-580e, 640s, 690− (weak)630 (610 shoulder, PV19?)β-naphthol PR3 + violet pigment (PV19?)
NQ9
(fuchsia)
--not examined612PV19?
OrangeNQ8789, 945, 997,1135, 1252, 1311, 1484, 1623 (PY1)1669, 1602, 1559, 1509, 1450, 1386, 1293, 1271, 1175, 1137, 1120, 1084, 950, 912, 802, 770 (PY1)ab. 480e, 530e, 600s 590 (unidentified orange pigment)arylide PY1 + unidentified orange pigment
YellowNQ7950, 1000, 1137, 1214, 1254, 1312, 1389, 1488, 1536, 1565, 1626not available480-490e, ab. 550s; 620− (weak), 700+ (weak)540arylide PY1
GreenNQ5 (light green)682, 741, 1285, 1340, 1542 (PG7), 1145 (PY3?)-410s/(+) (TiO2), ab. 470s, 530+, 620de, 650−, 710+, 730−524phthalocyanine PG7 + arylide PY3
NQ6684, 742, 775, 819, 977, 1002, 1083, 1214, 1289, 1343, 1541-not examined-phthalocyanine PG7
NQ10 (dark green)680, 740, 774, 816, 1290, 1539 (PG7), 956, 1145, 1342, 1451, 1530 (PB15)-410s/(+) (TiO2), ab. 460s, 500+, 580de, 610−, 660+, 690−-phthalocyanine PG7 + PB15
BlueNQ2see text2100410s (TiO2), 460+, 670−710−-Prussian blue PB27
NQ4677, 746, 1001, 1143, 1343, 1534670 (TiO2)420s (TiO2), 490+, 580de, 610−, 670+, 700−-phthalocyanine PB15(:1)
NQ115481015, 450450+, 590−, ab. 650e-ultramarine blue PB29
VioletNQ31262-410s (TiO2), 430+, 550−, 560+ (weak), 580−640anthraquinone PV5
1 A dash indicates that no bands attributable to the pigment were detected in the spectrum. 2 FTIR spectra allowed also the identification of the binders used in the different areas, that are nitrocellulose for the examined details of “The Monster” and acrylic for most examined areas of “The Daily Neo-Mythology” with the exception of area NQ2 where again nitrocellulose was instead detected, as detailed in Section 3.4.
Publisher’s Note: MDPI stays neutral with regard to jurisdictional claims in published maps and institutional affiliations.

