
Electrochemical Detection of Dinitrobenzene on Silicon Electrodes: Toward Explosives Sensors


School of Molecular and Life Sciences, Curtin Institute of Functional molecules and Interfaces, Curtin University, Bentley, WA 6102, Australia
*
Author to whom correspondence should be addressed.
Surfaces 2022, 5(1), 218-227; https://0-doi-org.brum.beds.ac.uk/10.3390/surfaces5010015
Submission received: 7 December 2021
/
Revised: 4 February 2022
/
Accepted: 3 March 2022
/
Published: 4 March 2022
(This article belongs to the Special Issue Surfaces on Emerging Chemical Sensing Applications)
Abstract
:Detection of explosives is vital for protection and criminal investigations, and developing novel explosives’ sensors stands at the forefront of the analytical and forensic chemistry endeavors. Due to the presence of terminal nitro groups that can be electrochemically reduced, nitroaromatic compounds (NACs) have been an analytical target for explosives’ electrochemical sensors. Various electrode materials have been used to detect NACs in solution, including glassy carbon electrodes (GCE), platinum (Pt), and gold (Au) electrodes, by tracking the reversible oxidation/reduction properties of the NACs on these electrodes. Here, we show that the reduction of dinitrobenzene (DNB) on oxide-free silicon (Si–H) electrodes is irreversible with two reduction peaks that disappear within the successive voltammetric scanning. AFM imaging showed the formation of a polymeric film whose thickness scales up with the DNB concentration. This suggest that Si–H surfaces can serve as DNB sensors and possibly other explosive substances. Cyclic voltammetry (CV) measurements showed that the limit of detection (LoD) on Si–H is one order of magnitude lower than that obtained on GCE. In addition, EIS measurements showed that the LoD of DNB on Si–H is two orders of magnitude lower than the CV method. The fact that a Si–H surface can be used to track the presence of DNB makes it a suitable surface to be implemented as a sensing platform. To translate this concept into a sensor, however, it would require engineering and fabrication prospect to be compatible with the current semiconductor technologies.
1. Introduction
Detection of explosive substances and their resources using simple and versatile methods stands at the forefront for protection and criminal investigations. Currently, analytical techniques, such as mass spectroscopy (MS), high performance liquid chromatography (HPLC), gas chromatography (GC), and UV-Vis absorption spectroscopy, have been used to detect nitroaromatic compounds (NACs) that are extensively used to detect NACs with ppm limits of detection [1,2,3,4].
Although these techniques are dominating the current technologies, they are all laboratory-based and, thus, limited in their applicability for onsite detection of explosives. Other methods using fluorescent probes [5,6], conductive polymers [7,8], and various electrochemical approaches for signal transduction have shown to be alternative detection tools for NACs and their explosives’ products [9,10]. Currently, MS and electrochemical methods are dominating the quantitative methods for detecting NACs. Recently, thermally unstable NACs including ethylene glycol dinitrate, nitroglycerin, and pentaerythritol tetranitrate were detected using MS with limits of detection (LoD) down to 0.1 μg mL−1 [11]. Other approaches such as surface-enhanced Raman scattering (SERS) have been used to detect 2,4,6-trinitrotoluene (TNT), 2,4,6-trinitrophenylmethylnitramine (tetryl), and hexanitrostilbene (HNS) with LoD in the range of 6.81 ng mL−1 for TNT, 17.2 ng mL−1 for tetryl, and 135.1 ng mL−1 for HNS [12]. In the same context, Guo and et al. built a flexible and portable sensor for the detection of NACs vapors based on fluorescence quenching of an aggregation-induced emission enhancement (AIEE)-active fluorophore that is connected to a self-assembled monolayer. Although the sensor system was flexible and portable, the LoD was found to be ∼1.4, ∼8.4, and ∼249.5 μg mL−1 for TNT, DNB, and NB, respectively [13].
Electrochemical sensors have been demonstrated to be cost-effective, portable devices with high sensitivity and selectivity for onsite detection of explosives [14]. The fact that NACs have redox properties make them ideal candidates for electrochemical signal transduction, by tracking the evolution of the reduction and oxidation peaks for the nitro groups. The interaction of NACs with the electrode surface/material varies depending on the surface activity toward the NO2 groups that is reduced through an irreversible four- or six-electron reduction process [15,16]. For example, 1,4 dinitrobenzene (DNB) was found to undergo irreversible reduction on metal organic framework structures deposited on ITO electrodes. The evolution of the reduction peak current was linearly proportional to the concentration of DNB in solution [17]. Other irreversible redox reactions have been utilized to electrochemically grow polymer films at the electrode/electrolyte interface; however, the kinetics and the control of these interfacial polymeric films depend on many parameters including the diffusion of the monomer, its solubility, and the solvent potential window. For example, Schoenfisch et al. utilized electropolymerization of phenols at the electrode/electrolyte interface to fabricate thin, porous polymeric films with controlled thickness (10–100 nm), and these porous membranes were used as selective sensing interfaces [18].
Glassy carbon electrode (GCE) has been widely used as a working electrode for detecting NACs due to the reversible reduction–oxidation reaction of the nitro groups [19,20,21]. Modification of the GCE with other electroactive materials, such as graphene [22], carbon nanotubes [23], and polymers [8], has been demonstrated to enhance the sensitivity, selectivity, and LoD of NACs. Although GCE is inert and can serve as a stable platform for sensing devices, high-sensitivity and lower LoD are only achieved by modifying the electrode with an electroactive transducing material; in addition, building a portable sensing device based on GCE could be challenging from a fabrication perspective [24,25].
Silicon (Si) is an intriguing semiconductor that represents the cornerstone of the electronic devices’ industry and could be an ideal surface for creating portable sensors. The Si surface is covered with a native oxide layer that is usually removed by etching, leaving a chemically reactive Si–H layer. Detection methods for NACs based on Si have been explored using different signal transduction approaches. For example, quenching the luminescence of docecyl-functionalized photoluminescent Si nanocrystal upon interaction with NACs in solution was used to develop a paper-based explosive sensor. The LoD was found to be 1.54, 0.995, and 0.341 mM for nitrobenzene, mononitrotoluene, and dinitrotoluene, respectively [26]. Moreover, porous Si functionalized with a quinoxaline-bridged (EtQxBox) cavitand was found to be selectively interacting with volatile organic compounds including nitrobenzene, providing a more qualitative than quantitative approach for NACs traces, even in presence of other organic contaminants [27]. In this context, Si–H surfaces have been demonstrated to form covalent bonds with molecules containing disulfide bonds [28,29,30], diazo [31], and OH moieties [32,33,34]. Here, we explore the reactivity of Si–H with DNB for electrochemical detection of DNB and, potentially, other NACs. However, for the system to be a portable and viable sensor, it will require more simplification from an engineering aspect. Cyclic voltammetry (CV) and electrochemical impedance spectroscopy (EIS) were used to investigate the versatility of the Si–H as a sensing platform for DNB. AFM imaging was utilized to characterize the surface topography of the molecular film that forms upon the reaction of DNB with Si–H.
2. Materials and Methods
2.1. Chemicals and Reagents
Sulfuric acid (Puranal TM, 95−97%), hydrogen peroxide (30 wt.% in water), ammonium fluoride (Puranal TM, 40 wt.% in water), and 1,4-dinitrobenzene (DNB) were purchased from Sigma Aldrich (Sydney, NSW, Australia). Dimethylformamide (DMF) was used without any purification, while dichloromethane (DCM) and isopropyl alcohol (IP) were purified via distillation before use. The p-type silicon wafers were purchased from Siltronix, S.A.S. (Archamps, France). They were highly doped (boron) and had a resistivity between 0.007 and 0.013 Ω cm. The wafers had a thickness of 500 ± 25 µm and were oriented ±0.5° away from the (111) plane. Milli-Q water (>18 MΩ cm) was used for all cleaning procedures.
2.2. Preparation of 1,4-Dinitrobenzene Solution
The DNB was dissolved in DMF to form a 20 mM stock solution. Tetrabutylammonium hexafluorophosphate (NBu₄PF₆) used as the electrolytic salt and was dissolved in the DNB stock solution. A 0.5 M NBu₄PF₆ electrolyte in DMF was used to dilute the DNB stock solution.
2.3. Electrode Preparation
P-type Si wafers were cut into approximately 1 × 1 cm and were washed thoroughly with DCM, isopropanol, and Milli-Q water. The Si was then cleaned with piranha solution (3:1, v:v, concentrated sulfuric acid and 30% hydrogen peroxide) for 30 min at 130 °C. The wafers were rinsed with water before being etched for 13 min in a deoxygenated solution of ammonium fluoride (40%). The Si–H surfaces were then rinsed quickly with Milli-Q water once, followed by DCM after etching. Glassy Carbon Electrode (GCE) surface was thoroughly polished with alumina slurry successively and sonicated with water and acetone, respectively, for 5 min each.
2.4. Electrochemical Measurements
All electrochemical measurements were performed using a CHI650 electrochemical workstation (CH Instruments, Austin, TX, USA) with a 3-electrode system in a single-compartment cell. The etched Si–H and GCE served as the working electrode, Ag/AgCl electrode was used as the reference and a Pt wire as the counter electrode. The CV measurements were performed within different concentrations of DNB solution in presence of 0.5 M NBu₄PF₆. The EIS measurements were performed on the DNB functionalized Si surfaces in a 10 mM solution of hexamine ruthenium (III) chloride (in 100 mM KCl).
2.5. Atomic Force Microscopy Imaging
AFM images were acquired using a Bruker dimension microscope. A FastScan head with a resolution of 512 points/line and scan rate of 0.5 Hz was used. The images were acquired in tapping mode using a silicon nitride cantilever (TESPA from Bruker (Singapore), which had a spring constant of 20 N m−1, at room temperature, in air.
3. Results and Discussion
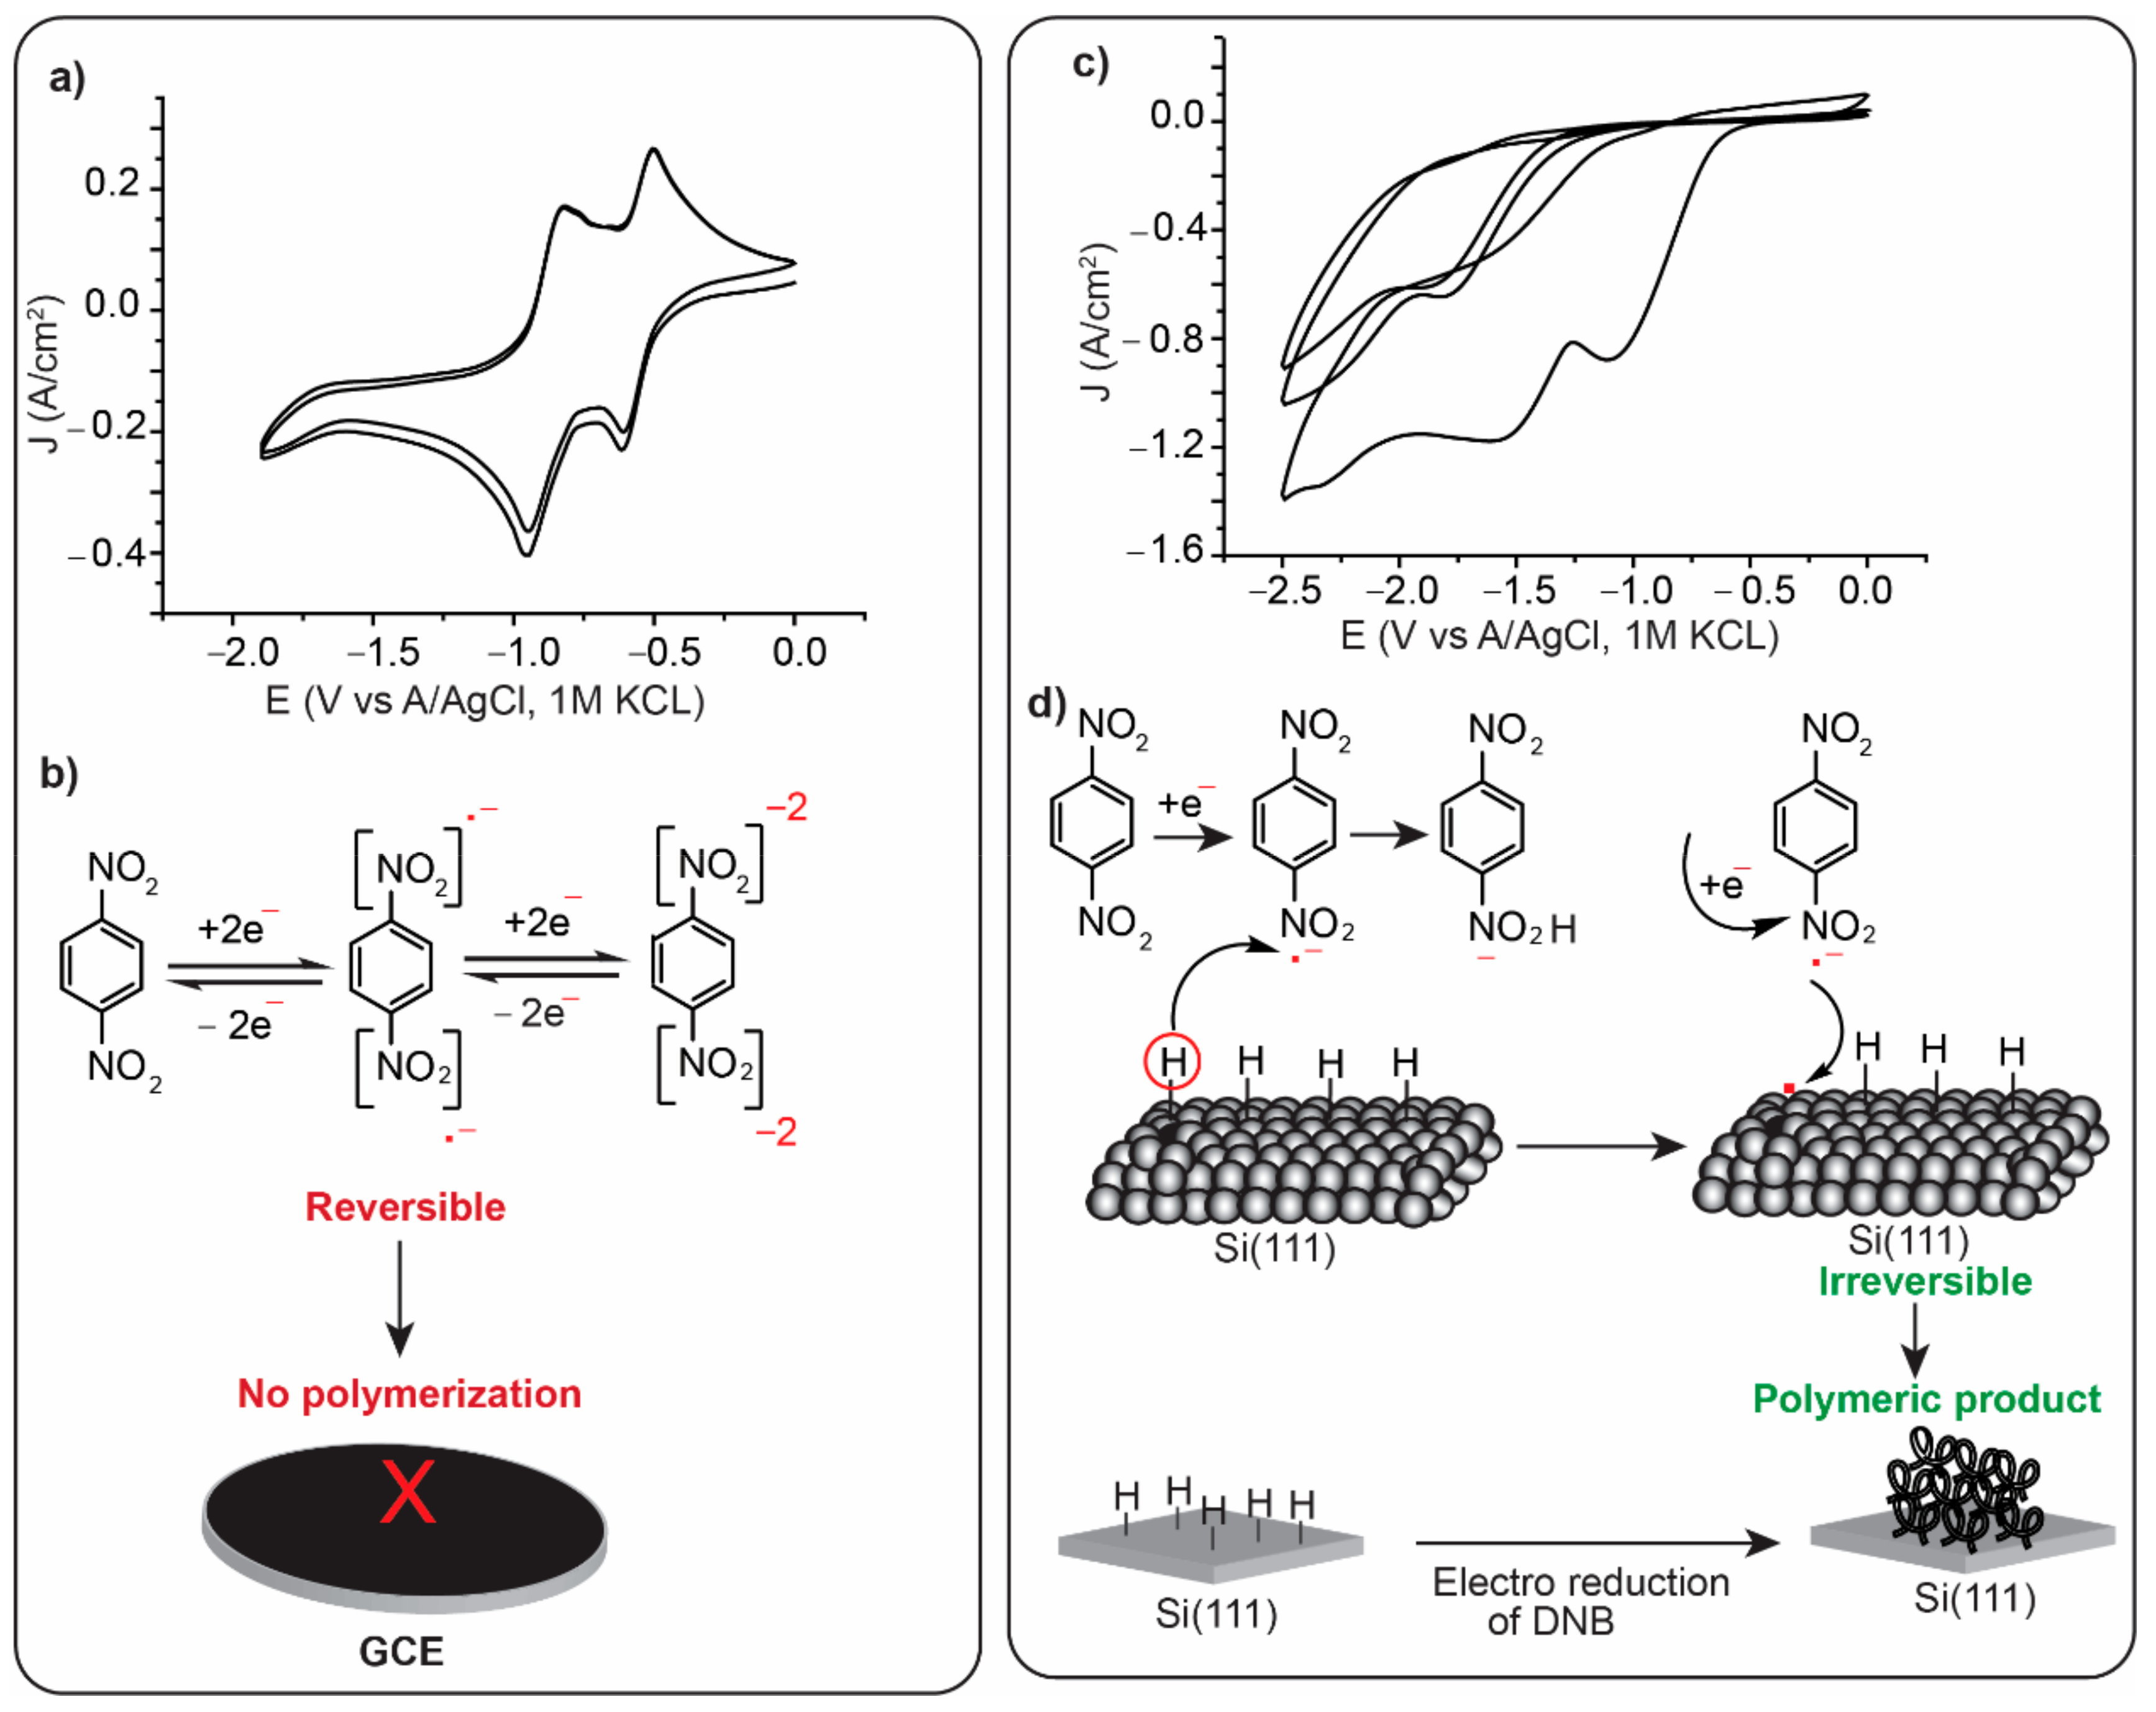
The CV from the reduction of DNB on GCE showed two reduction and two oxidation peaks, indicating that the reaction of the nitro groups of DNB with the GCE surface is reversible (Figure 1a) [35,36,37]. The reduction of the two nitro groups leads to the formation of dinitro radical anions (RA), then dinitro diradical anions (DA) that reversibly convert back to DNB in aprotic solvent (Figure 1b), and the current increases linearly with the concentration of the analyte [38].
On Si–H however, and during the second CV scan, the reduction waves are slightly negatively shifted and in the third CV cycle the waves disappear suggesting that DNB is undergoing an irreversible reduction reaction and reacting with the Si–H surface. This agrees with what has been previously observed for the interaction of DNB with flavonoids in DMF [39]. Irreversible redox chemical characteristics of DNB were previously observed when DNB derivatives are exposed to diphenyl urea, and this was attributed to a proton transfer process from the urea to the DA species of the DNB [40]. In the same context, a proton transfer from flavonoids led to an irreversible reduction process of DNB, which is ascribed to a hydrogen abstraction from the flavonoid to the RA species [39]. Similarly, Si–H has been demonstrated to undergo oxidation at ambient conditions with proton donation from the surface to radical species in solution, leaving a radical on the Si surface [28,30,34]. Therefore, in the presence of the RA chemical state, it is likely that a proton is abstracted from the Si–H surface, leading to irreversible reaction. In addition, this process appears to lead to a polymeric product on the surface (Figure 1d), similar to the reduction of diazonium salts on Si–H surfaces [31].
3.1. Surface Characterization
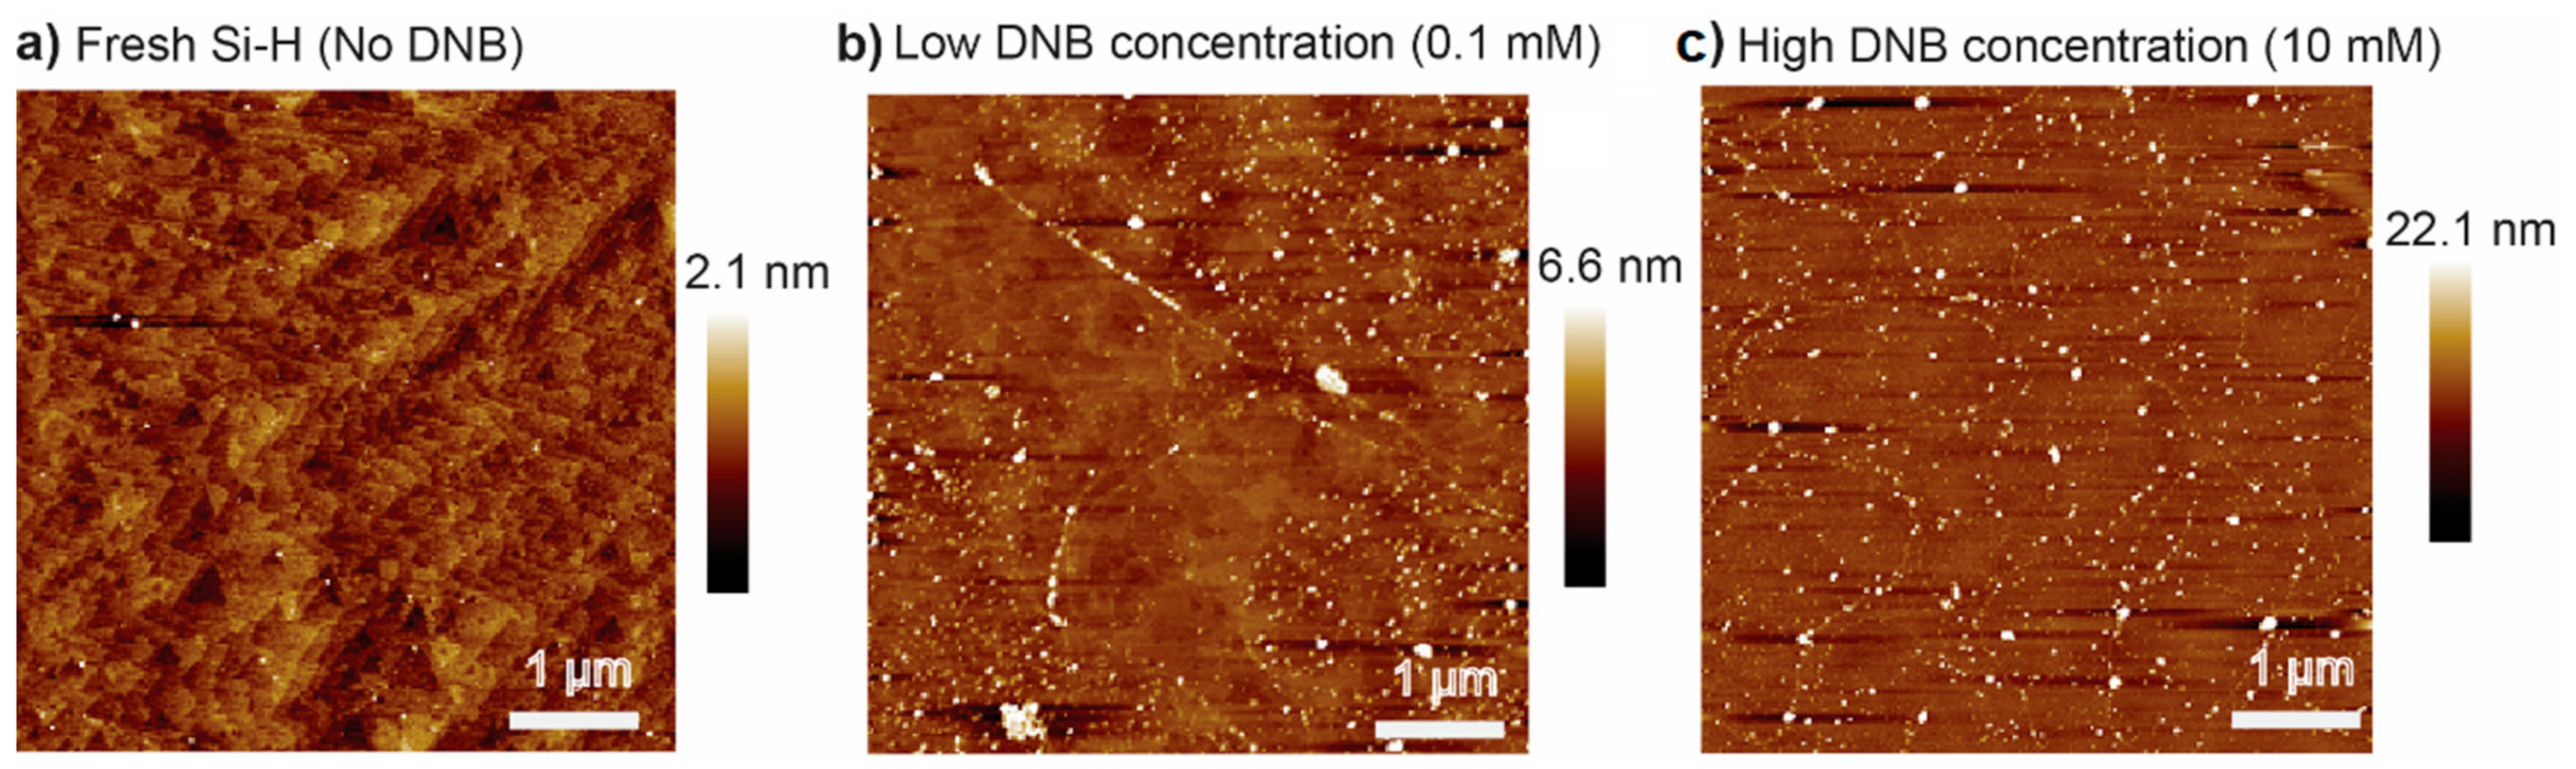
Figure 2 shows AFM topography images for Si–H surfaces before and after DNB reduction. A freshly prepared Si–H surface shows smooth Si terraces with individual terrace roughness of ~0.18 nm (Figure 2a). AFM images for the for Si–H surface after reduction of 1 mM DNB solution shows the growth of a molecular film with some areas of the Si surface showing flat terraces (Figure 2b). Higher concentration of DNB (10 mM) showed a thicker molecular film with the Si terraces almost disappearing (Figure 2c). This suggests that the reduction of DNB on Si–H is an irreversible reaction whose products react with the Si–H surface. The density of the products on the Si surface is dependent on the concentration of the DNB in solution.
3.2. Electrochemical Detection of DNB on GCE
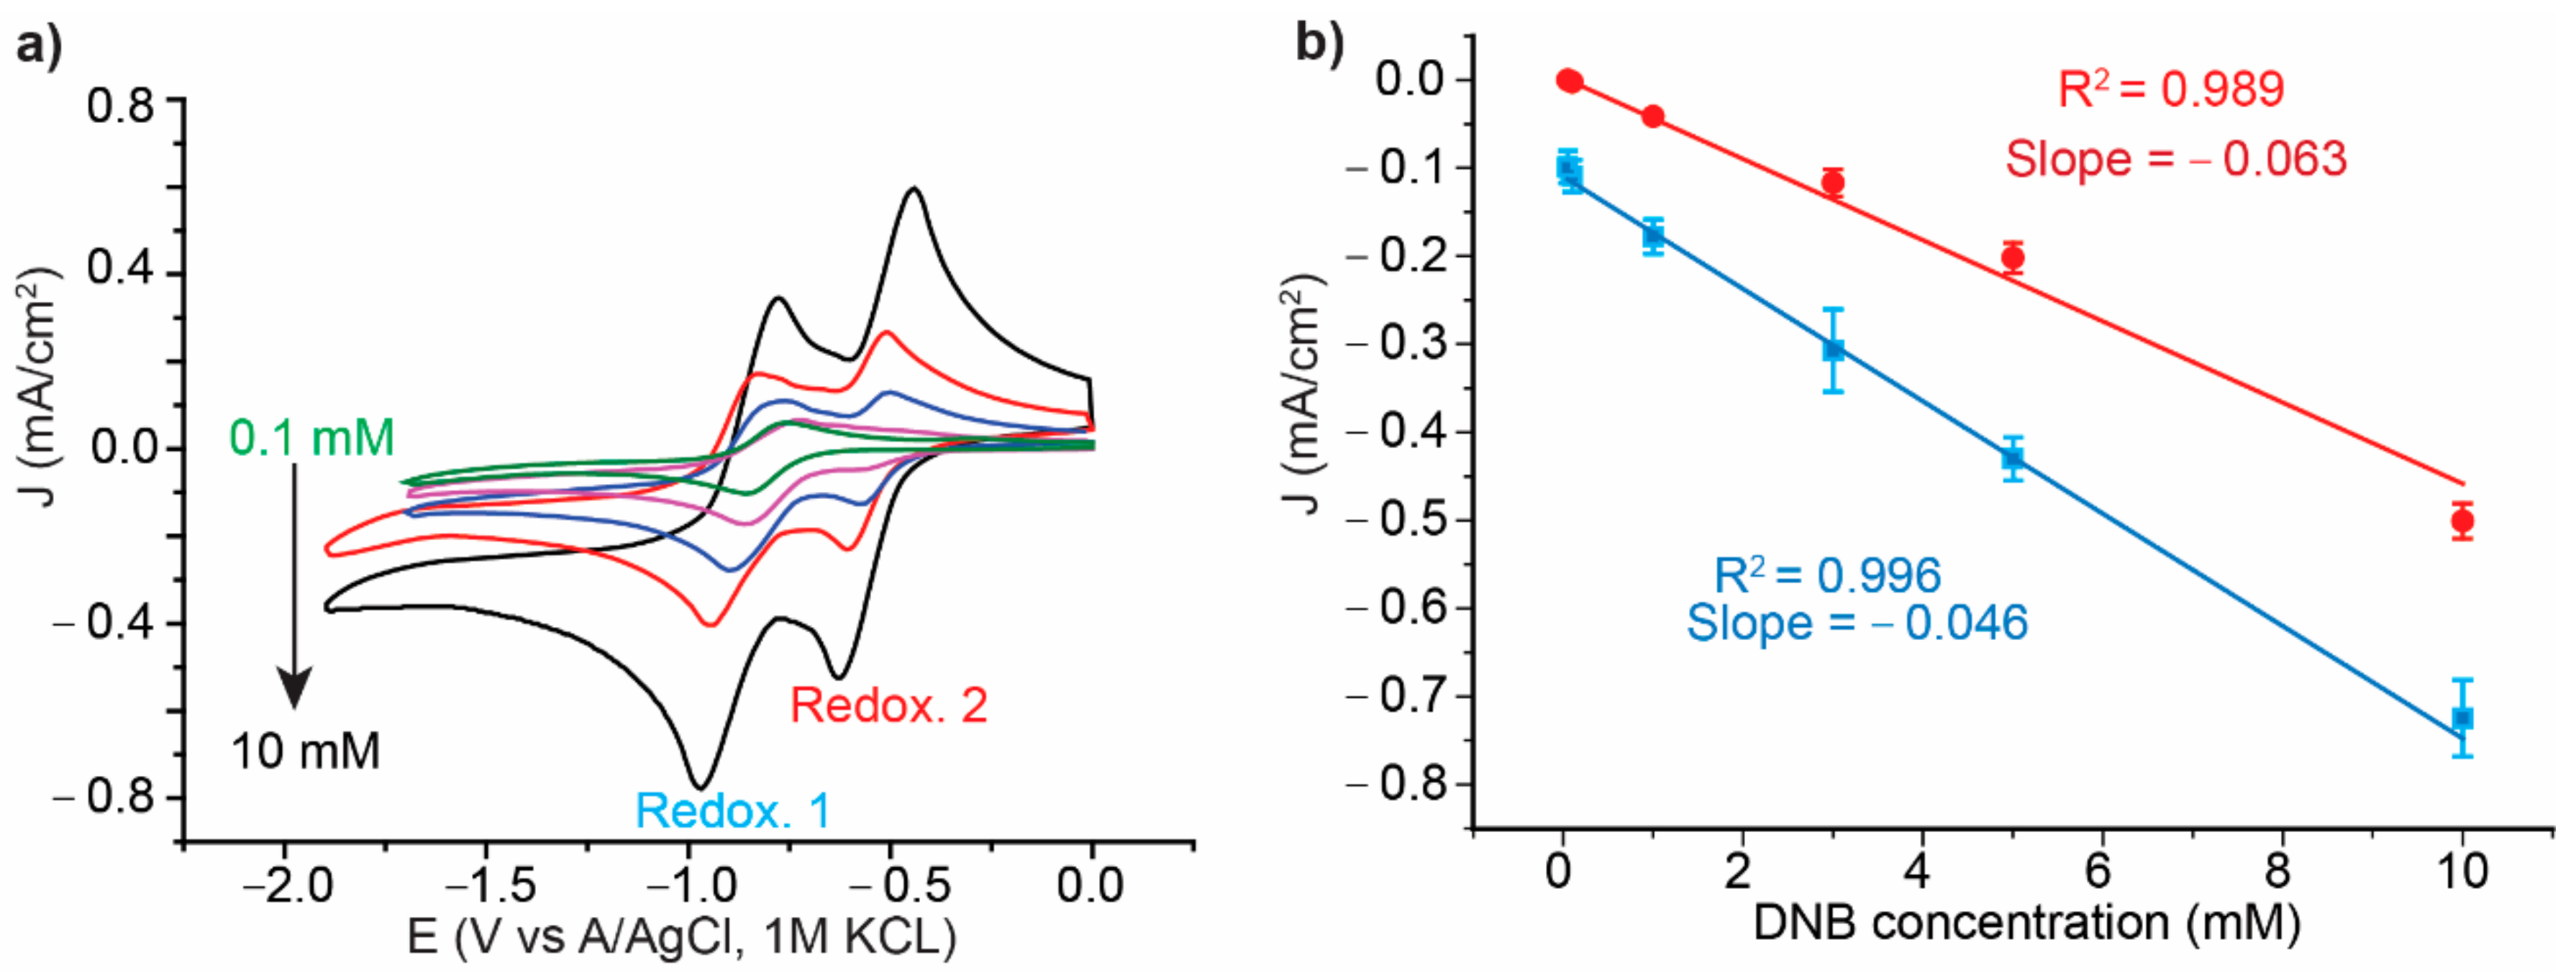
Electrochemical characterization of the reduction of DNB was performed on GCE which is an inert electrode that does not allow chemical bonding between the electrode and the DNB. Figure 3a shows CV for DNB at different concentrations on GCE with two reversible reduction/oxidation peaks, indicating that the DNB reaction with GCE in DMF is a reversible redox process. The evolution of the CV peak currents with the scan rates at any DNB concentration shows a linear relationship between the peak currents with the square root of the scan rate (Figure S1). This suggests that reaction of DNB with GCE is a diffusion-based electrochemical process where the molecules are reversibly oxidised and reduced on the electrode surface without chemically binding to the electrodes, consistent with what have been previously reported for NACs on GCE [36]. Figure 3b shows that the evolution of current of the two reduction peaks, at the same scan rate (100 mVs−1), increases linearly with increasing the concentration of DNB in a range between 0.1 mM and 10 mM. The linear regression equation for fitting of the peak current vs the different concentrations of DNB was used to calculate the LoD according to equation 1.
The current of the blank sample was measured at the same peak positions (−1.0 V for the redox peak 1 and −0.6 V for the redox peak 2) for the DNB. The STD of the three different blank measurements (Figure S2) and the slope value shown in Equation (1) were used to calculate the LoD that was found to be of an average of 44 ± 6.8 μM using both redox peak 1 and the redox peak 2, respectively.
3.3. Electrochemical Detection of DNB on Si–H
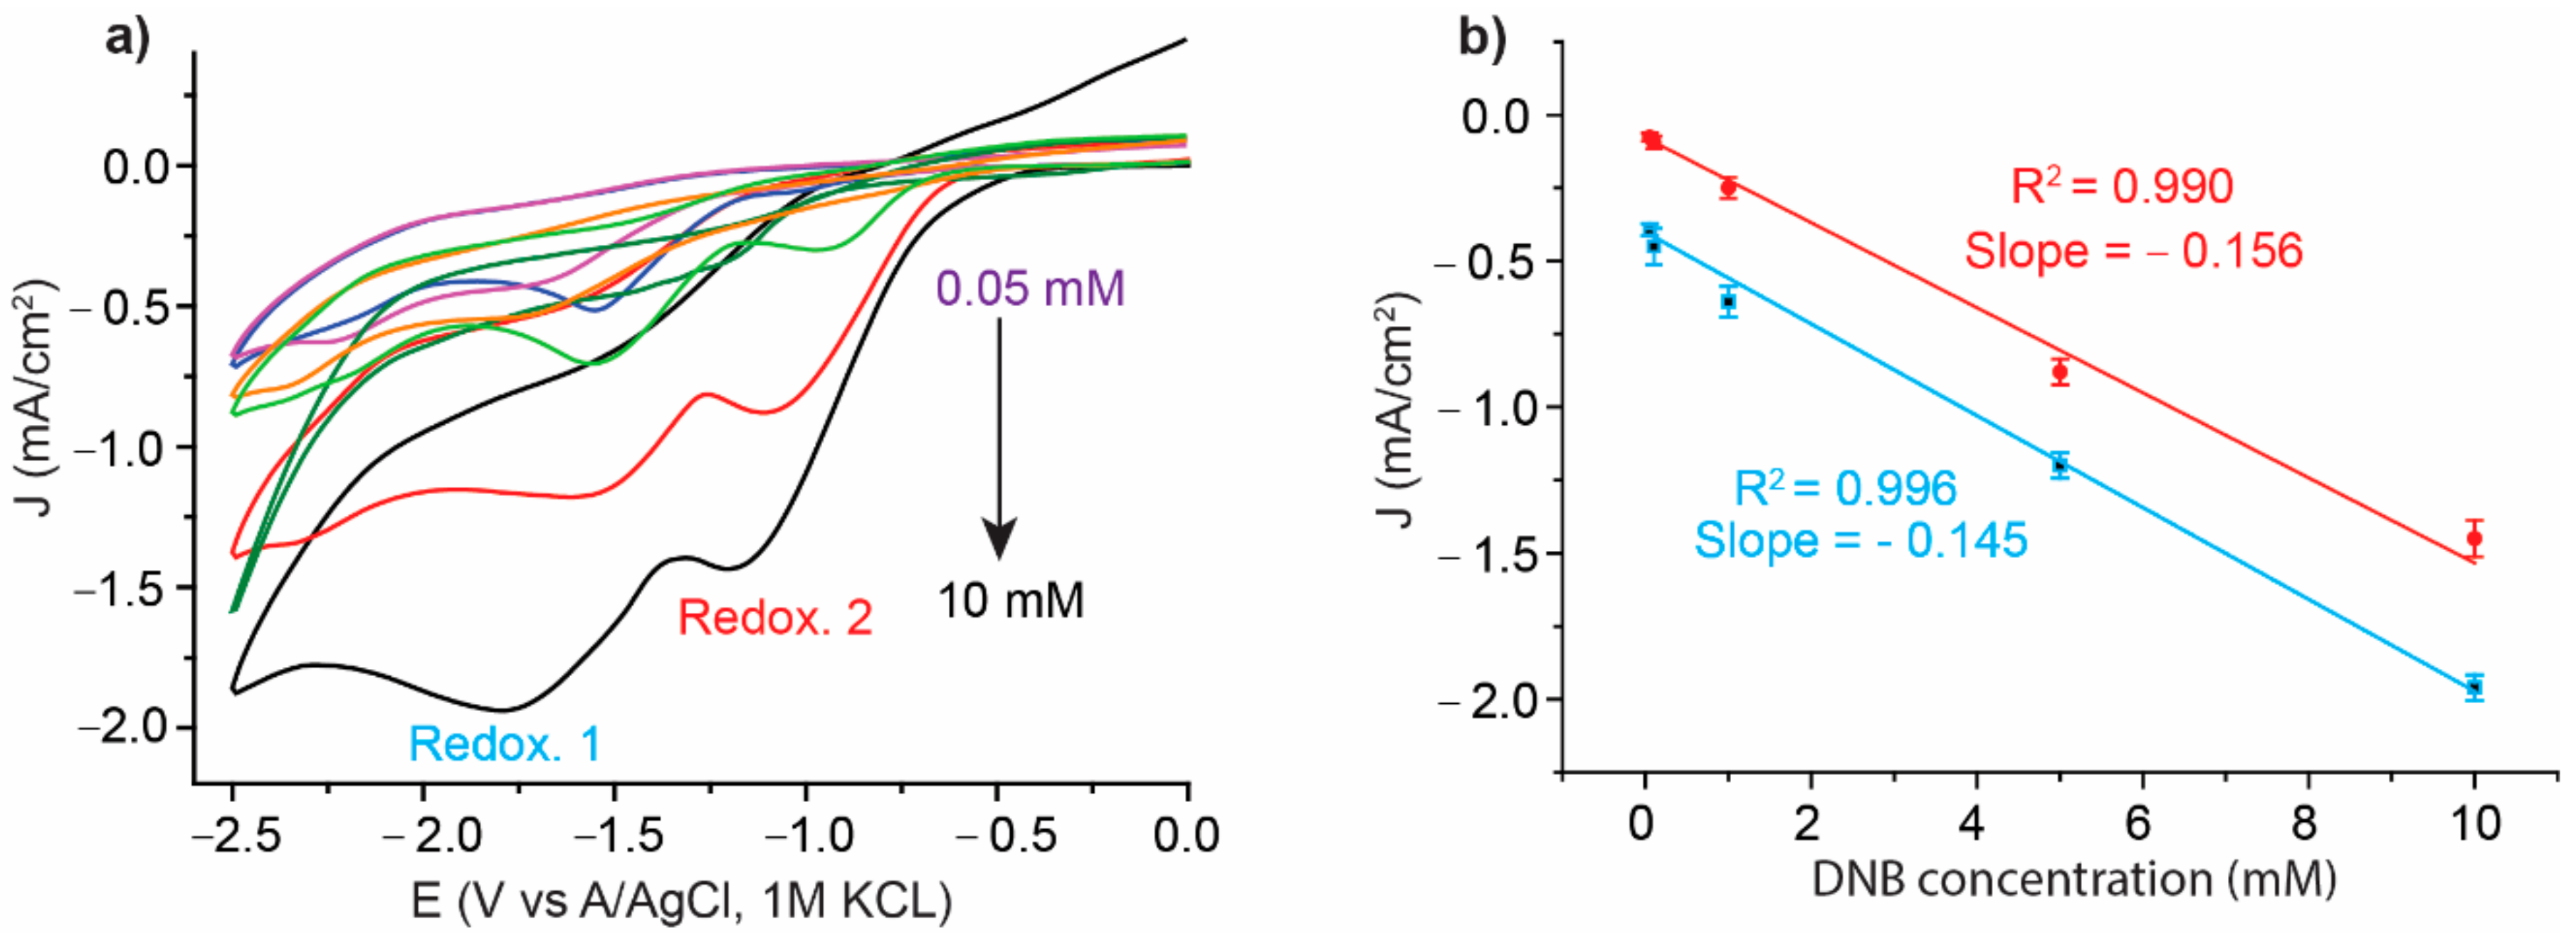
In contrast to GCE, the reduction of DNB on Si–H shows only two reduction waves, and the absence of oxidation waves, indicating an irreversible redox process that led to the formation of a molecular film on the Si–H surface. Consistent with the AFM imaging, the thickness of the film increases with the concentration of the DNB. The CV for the reduction of different concentrations of DNB on Si–H surface showed an increase in the current of the two reduction peaks with increasing concentration (Figure 4a). The evolution of the reduction peaks with the concentration shows a linear relationship in the range between 0.05 mM and 10 mM (Figure 4b). Furthermore, CV for the Si–H electrode in the electrolyte solution showed redox peaks in the same potential range (Figure S3). The slope of the linear regression in Figure 4b and the cathodic peak current of the blank sample were used to calculate the LoD according to equation 1 which was found to be of an average of 6.8 ± 0.54 μM. This suggests that the irreversible reduction of DNB on Si–H provides a new method for explosive detection with one order of magnitude lower LoD than that can be achieved on conventional GCE.
3.4. Electrochemical Impedance Spectroscopy (EIS)
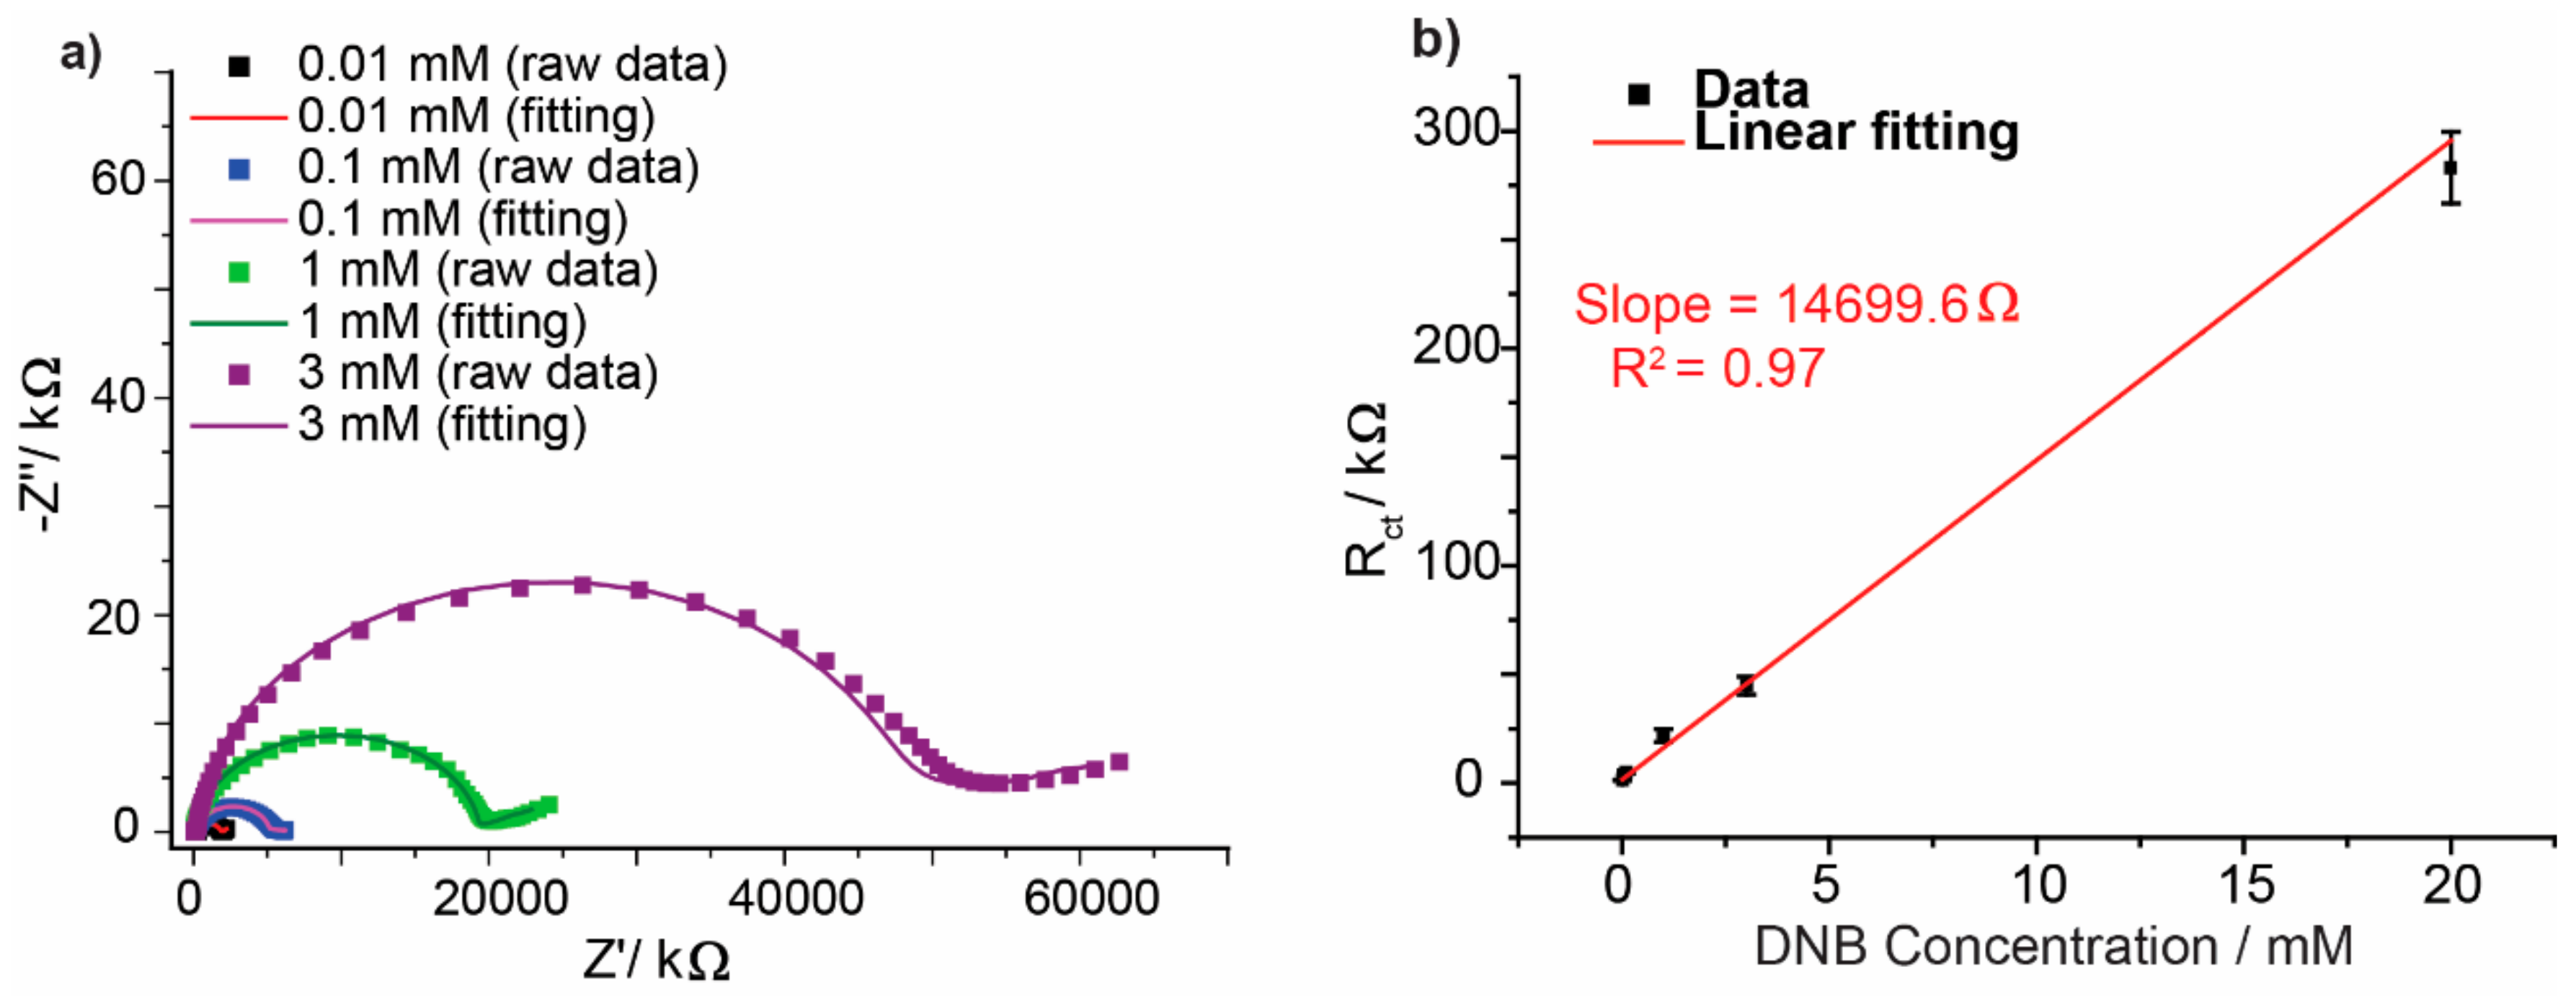
Consistent with the finding that the reduction of DNB on Si–H is irreversible and forms a polymeric product, impedimetric detection can be carried out using a redox probe in solution. The charge transfer resistance will depend on the interfacial blocking capability of the polymeric product [41]. A different concentration of DNB was used to deposit the polymeric film on Si–H surface by running a CV on the Si–H electrode in an organic electrolyte (0.5 M NBu₄PF₆ DMF), for three voltammetric cycles. Figure 5a shows the Nyquist plot obtained from the EIS measurements for the polymer film that was reduced from different concentrations of DNB. The unreacted DNB was washed away and the EIS was measured in 10 mM hexamine ruthenium (III) chloride (in 50 mM KCl). Each DNB concentration led to a specific blocking capability on the surface that, in turn, affected the Ru (NH3)63+/2+ ions’ charge transfer resistance (Rct). Consistent with the increase in the Rct value in the Nyquist plots at different concentrations, the bode plots showed a shift in the phase angle valley with different concentrations (Figure S4).
The increase in the Rct value which can be visually observed from the diameter of each semicircle in Figure 5a was found to be linearly proportional to the DNB concentrations. The impedance spectra obtained at different concentrations of DNB was modeled by a Randles circuit (Figure S5) [41,42]. Figure 5b shows a linear fitting for the calibration curve build from different concentrations of DNB and the fitting parameters are shown in Table S1. The LoD was 0.36 ± 0.09 μM calculated with the aid of the blank sample (Figure S6) and applying equation 1, demonstrating that the EIS measurement is more sensitive technique of an LoD that is one order of magnitude lower than the conventional CV method on Si–H. This is consistent with findings from the electrochemical diffusion blocking effect of the polymer film formed using different concentrations of DNB. Figure S7 shows CV obtained for the polymeric film formed from higher concentrations of DNB where the redox peaks of the Ru (NH3)63+/2+ ions are more separated, and the peak current is lower than that obtained with the polymer film formed from reducing lower concentration of DNB on Si.
4. Conclusions
We report the electro polymerization of DNB on a Si–H electrode, and we test the possibility of using a Si–H surface as a sensor for detecting DNB and, potentially, other NACs explosives. Our experiments show: (1) in contrast to the reversible reduction of DNB on GCE, DNB undergoes an irreversible reduction reaction on Si–H electrodes, which leads to the formation of a polymer film on the surface; (2) CV measurements showed a linear increase in the reduction peak current, and in the thickness of the polymer film, with increasing the DNB concentration in the solution; (3) the LoD calculated using CV on GCE and Si–H were 44 ± 6.8 μM and 6.8 ± 0.54 μM, respectively; and (4) the EIS measurements for the resistance of the polymer film resulting from different DNB concentrations enabled an order of magnitude lower LoD (0.36 ± 0.09 μM).
Supplementary Materials
The following are available online at https://0-www-mdpi-com.brum.beds.ac.uk/article/10.3390/surfaces5010015/s1, Figure S1: CV for 5 mM DNB on GCE. (a) CV showing different scan rates for the GCE in 5 mM DNB solution. (b) The correlation between the evolution of the peak current versus the scan rate showing a linear relationship between the square root (Sqrt) of the scan rate and the peak current, indicating that the redox process is diffusion-based electrochemical process, Figure S2: CV for GCE electrode in 0.5 M NBu₄PF₆ electrolyte in DMF, without DNB, at a scan rate of 0.1 V·s−1, Figure S3: CV for Si–H surface in 0.5 M NBu₄PF₆ electrolyte in DMF, without DNB, at a scan rate of 0.1 V·s−1, Figure S4: Bode plot for two different DNB concentrations, 0.1 mM (black dots represent raw data and red line represents the best fit of the Randles circuit) and 5 mM (blue dots represent raw data and green line represents the best fit of the Randles circuit), showing that the the phase angle valley shifts towards lower frequency with increasing concentration, Figure S5: The equivalent Randles circuit used to fit the experimental EIS data. R1 represents the solution resistance, R2 represents the resistance of the free Si–H areas that are not covered by the polymer film, assuming that the polymer deposition occurs locally with a diffusion-controlled process, and CPE2 is a constant phase element that represents the capacitance over the area that is not covered by the polymer. R3 is the resistance of the polymer film or the area of the Si–H surface that is covered by the polymer, and CPE3 represents the capacitance of the polymeric film. Wo1 and CPE4 represent the Warburg diffusion element and the charging of the redox species in the electrolyte solution, Table S1: Fitting parameters for the equivalent Randles circuit that was used to fit the Nyquist plots of the electrochemical impedance spectroscopy measured for the diffusion of the Ru (NH3)63+/2+ ions through the DNB polymer films that were formed from using different concentrations of DNB. Each value is an average of three different measurements and the error represents the standard deviation from the averages, Figure S6: Nyquist plot fitted to a Randles circuit for Si–H electrode in 5 mM solution of hexamine ruthenium (III) chloride (in 50 mM KCl), without DNB reduction, Figure S7: CV demonstrating the capability of the film in blocking the diffusion of Ru (NH3)63+/2+ redox ions. The redox peaks are more separated, and the peak current intensity is inversely proportional to the concentration with 10 mM (red line) and 0.1 mM.
Author Contributions
N.D. conceived the project. E.M.D. performed AFM imaging, electrochemical impedance spectroscopy, and performed the fittings. N.H. performed cyclic voltammetry experiments. E.M.D. analyzed the data. E.M.D. and N.D. wrote the manuscript. All authors discussed and interpreted the results. All authors have read and agreed to the published version of the manuscript.
Funding
This research was funded by Australian Research Council, grant number DE160101101.
Institutional Review Board Statement
Not applicable.
Informed Consent Statement
Not applicable.
Data Availability Statement
Data is contained within the article or Supplementary Material.
Conflicts of Interest
The authors declare no conflict of interest. The funders had no role in the design of the study; in the collection, analyses, or interpretation of data; in the writing of the manuscript, or in the decision to publish the results.
References
- Giannoukos, S.; Brkić, B.; Taylor, S.; Marshall, A.; Verbeck, G.F. Chemical Sniffing Instrumentation for Security Applications. Chem. Rev. 2016, 116, 8146–8172. [Google Scholar] [CrossRef] [PubMed]
- Takáts, Z.; Cotte-Rodriguez, I.; Talaty, N.; Chen, H.; Cooks, R.G. Direct, trace level detection of explosives on ambient surfaces by desorption electrospray ionization mass spectrometry. Chem. Commun. 2005, 15, 1950–1952. [Google Scholar] [CrossRef]
- Marder, D.; Tzanani, N.; Prihed, H.; Gura, S. Trace detection of explosives with a unique large volume injection gas chromatography-mass spectrometry (LVI-GC-MS) method. Anal. Methods 2018, 10, 2712–2721. [Google Scholar] [CrossRef]
- Marple, R.L.; LaCourse, W.R. A platform for on-site environmental analysis of explosives using high performance liquid chromatography with UV absorbance and photo-assisted electrochemical detection. Talanta 2005, 66, 581–590. [Google Scholar] [CrossRef] [PubMed]
- Mishra, A.; Dheepika, R.; Parvathy, P.A.; Imran, P.M.; Bhuvanesh NS, P.; Nagarajan, S. Fluorescence quenching based detection of nitroaromatics using luminescent triphenylamine carboxylic acids. Sci. Rep. 2021, 11, 19324. [Google Scholar] [CrossRef] [PubMed]
- Shanmugaraju, S.; Joshi, S.A.; Mukherjee, P.S. Fluorescence and visual sensing of nitroaromatic explosives using electron rich discrete fluorophores. J. Mater. Chem. 2011, 21, 9130–9138. [Google Scholar] [CrossRef]
- Dutta, P.; Chakravarty, S.; Sarma, N.S. Detection of nitroaromatic explosives using π-electron rich luminescent polymeric nanocomposites. RSC Adv. 2016, 6, 3680–3689. [Google Scholar] [CrossRef]
- Sohn, H.; Sailor, M.J.; Magde, D.; Trogler, W.C. Detection of Nitroaromatic Explosives Based on Photoluminescent Polymers Containing Metalloles. J. Am. Chem. Soc. 2003, 125, 3821–3830. [Google Scholar] [CrossRef]
- O’Mahony, A.M.; Wang, J. Nanomaterial-based electrochemical detection of explosives: A review of recent developments. Anal. Methods 2013, 5, 4296–4309. [Google Scholar] [CrossRef]
- Yew, Y.T.; Ambrosi, A.; Pumera, M. Nitroaromatic explosives detection using electrochemically exfoliated graphene. Sci. Rep. 2016, 6, 33276. [Google Scholar] [CrossRef]
- Leppert, J.; Härtel, M.A.C.; Klapötke, T.M.; Boeker, P. Hyperfast flow-field thermal gradient GC/MS of explosives with reduced elution temperatures. Anal. Chem. 2018, 90, 8404–8411. [Google Scholar] [CrossRef] [PubMed]
- Milligan, K.; Shand, N.C.; Graham, D.; Faulds, K. Detection of Multiple Nitroaromatic Explosives via Formation of a Janowsky Complex and SERS. Anal. Chem. 2020, 92, 3253–3261. [Google Scholar] [CrossRef] [PubMed] [Green Version]
- Li, M.; Chen, H.; Li, S.; Wang, G.; Wei, F.; Guo, X.; Tu, H. Active Self-Assembled Monolayer Sensors for Trace Explosive Detection. Langmuir 2020, 36, 1462–1466. [Google Scholar] [CrossRef] [PubMed]
- Bakker, E.; Qin, Y. Electrochemical Sensors. Anal. Chem. 2006, 78, 3965–3984. [Google Scholar] [CrossRef] [Green Version]
- Bard, A.J. Encyclopedia of electrochemistry of the elements. J. Electrochem. Soc. 1974, 121, 212C. [Google Scholar] [CrossRef]
- Kokkinidis, G.; Kelaidopoulou, A. Electrochemical behaviour of nitroindoles: Oxidative electropolymerization and reduction of the nitro group of polymerized and non-polymerized 4-nitro and 5-nitroindole. J. Electroanal. Chem. 1996, 414, 197–208. [Google Scholar]
- Zhou, Z.; Mukherjee, S.; Hou, S.; Li, W.; Elsner, M.; Fischer, R.A. Porphyrinic MOF Film for Multifaceted Electrochemical Sensing. Angew. Chem. Int. Ed. 2021, 60, 20551–20557. [Google Scholar] [CrossRef]
- Koh, A.; Lu, Y.; Schoenfisch, M.H. Fabrication of Nitric Oxide-Releasing Porous Polyurethane Membranes-Coated Needle-type Implantable Glucose Biosensors. Anal. Chem. 2013, 85, 10488–10494. [Google Scholar] [CrossRef] [Green Version]
- Chua, C.K.; Pumera, M.; Rulíšek, L. Reduction pathways of 2, 4, 6-trinitrotoluene: An electrochemical and theoretical study. J. Phys. Chem. C 2012, 116, 4243–4251. [Google Scholar] [CrossRef]
- Chua, C.K.; Pumera, M. Influence of Methyl Substituent Position on Redox Properties of Nitroaromatics Related to 2, 4, 6-Trinitrotoluene. Electroanalysis 2011, 23, 2350–2356. [Google Scholar] [CrossRef]
- Holly, A.Y.; DeTata, D.A.; Lewis, S.W.; Silvester, D.S. Recent developments in the electrochemical detection of explosives: Towards field-deployable devices for forensic science. TrAC Trends Anal. Chem. 2017, 97, 374–384. [Google Scholar]
- Ahmad, K.; Mohammad, A.; Ansari, S.N.; Mobin, S.M. Construction of graphene oxide sheets based modified glassy carbon electrode (GO/GCE) for the highly sensitive detection of nitrobenzene. Mater. Res. Express 2018, 5, 075601. [Google Scholar] [CrossRef]
- Wang, J.; Hocevar, S.B.; Ogorevc, B. Carbon nanotube-modified glassy carbon electrode for adsorptive stripping voltammetric detection of ultratrace levels of 2,4,6-trinitrotoluene. Electrochem. Commun. 2004, 6, 176–179. [Google Scholar] [CrossRef]
- Lima, A.P.; Almeida, P.L.; Sousa, R.M.; Richter, E.M.; Nossol, E.; Munoz, R.A. Effect of alumina supported on glassy-carbon electrode on the electrochemical reduction of 2,4,6-trinitrotoluene: A simple strategy for its selective detection. J. Electroanal. Chem. 2019, 851, 113385. [Google Scholar] [CrossRef]
- Arman, A.; Sağlam, Ş.; Üzer, A.; Apak, R. Electrochemical determination of nitroaromatic explosives using glassy carbon/multi walled carbon nanotube/polyethyleneimine electrode coated with gold nanoparticles. Talanta 2022, 238, 122990. [Google Scholar] [CrossRef]
- Gonzalez, C.M.; Iqbal, M.; Dasog, M.; Piercey, D.G.; Lockwood, R.; Klapötke, T.M.; Veinot, J.G.C. Detection of high-energy compounds using photoluminescent silicon nanocrystal paper based sensors. Nanoscale 2014, 6, 2608–2612. [Google Scholar] [CrossRef] [Green Version]
- Tudisco, C.; Motta, A.; Barboza, T.; Massera, C.; Giuffrida, A.E.; Pinalli, R.; Dalcanale, E.; Condorelli, G.G. Cavitand-Decorated Silicon Columnar Nanostructures for the Surface Recognition of Volatile Nitroaromatic Compounds. ACS Omega 2018, 3, 9172–9181. [Google Scholar] [CrossRef]
- Peiris, C.R.; Ciampi, S.; Dief, E.M.; Zhang, J.; Canfield, P.J.; Le Brun, A.P.; Kosov, D.S.; Reimers, J.R.; Darwish, N. Spontaneous S–Si bonding of alkanethiols to Si(111)–H: Towards Si–molecule–Si circuits. Chem. Sci. 2020, 11, 5246–5256. [Google Scholar] [CrossRef]
- Dief, E.M.; Darwish, N. Ultrasonic Generation of Thiyl Radicals: A General Method of Rapidly Connecting Molecules to a Range of Electrodes for Electrochemical and Molecular Electronics Applications. ACS Sens. 2020, 6, 573–580. [Google Scholar] [CrossRef]
- Dief, E.M.; Vogel, Y.B.; Peiris, C.R.; Le Brun, A.P.; Gonçales, V.R.; Ciampi, S.; Reimers, J.R.; Darwish, N. Covalent Linkages of Molecules and Proteins to Si–H Surfaces Formed by Disulfide Reduction. Langmuir 2020, 36, 14999–15009. [Google Scholar] [CrossRef]
- Peiris, C.R.; Vogel, Y.B.; Le Brun, A.P.; Aragonès, A.C.; Coote, M.L.; Díez-Pérez, I.; Ciampi, S.; Darwish, N. Metal–Single-Molecule–Semiconductor Junctions Formed by a Radical Reaction Bridging Gold and Silicon Electrodes. J. Am. Chem. Soc. 2019, 141, 14788–14797. [Google Scholar] [CrossRef] [PubMed]
- Dief, E.; Brun, A.; Ciampi, S.; Darwish, N. Spontaneous Grafting of OH-Terminated Molecules on Si−H Surfaces via Si–O–C Covalent Bonding. Surfaces 2021, 4, 81–88. [Google Scholar] [CrossRef]
- Rahpeima, S.; Dief, E.M.; Peiris, C.R.; Ferrie, S.; Duan, A.; Ciampi, S.; Raston, C.L.; Darwish, N. Reduced graphene oxide–silicon interface involving direct Si–O bonding as a conductive and mechanical stable ohmic contact. Chem. Commun. 2020, 56, 6209–6212. [Google Scholar] [CrossRef] [PubMed]
- Rahpeima, S.; Dief, E.M.; Ciampi, S.; Raston, C.L.; Darwish, N. Impermeable Graphene Oxide Protects Silicon from Oxidation. ACS Appl. Mater. Interfaces 2021, 13, 38799–38807. [Google Scholar] [CrossRef]
- Silvester, D.S.; Wain, A.J.; Aldous, L.; Hardacre, C.; Compton, R.G. Electrochemical reduction of nitrobenzene and 4-nitrophenol in the room temperature ionic liquid [C4dmim][N(Tf)2]. J. Electroanal. Chem. 2006, 596, 131–140. [Google Scholar] [CrossRef]
- Huang, Y.; Lessard, J. Electrochemical Behaviour of Nitrobenzene, Nitrosobenzene, Azobenzene, and Azoxybenzene on Hg, Pt, Cu, and Ni Electrodes in Aprotic Medium. Electroanalysis 2016, 28, 2716–2727. [Google Scholar] [CrossRef]
- Li, H.; Huang, C.; Li, Y.; Yang, W.; Liu, F. Electrocatalytic reduction of trace nitrobenzene using a graphene-oxide@polymerized-manganese-porphyrin composite. RSC Adv. 2019, 9, 22523–22530. [Google Scholar] [CrossRef] [Green Version]
- Mendkovich, A.S.; Syroeshkin, M.A.; Mikhalchenko, L.V.; Mikhailov, M.N.; Rusakov, A.I.; Gul’tyai, V.P. Integrated Study of the Dinitrobenzene Electroreduction Mechanism by Electroanalytical and Computational Methods. Int. J. Electrochem. 2011, 2011, 346043. [Google Scholar] [CrossRef] [Green Version]
- Arshad, N.; Janjua, N.K.; Khan, A.Y.; Yaqub, A.; Burkholz, T.; Jacob, C. Natural flavonoids interact with dinitrobenzene system in aprotic media: An electrochemical probing. Nat. Prod. Commun. 2012, 7, 311–315. [Google Scholar] [CrossRef]
- Chan-Leonor, C.; Martin, S.L.; Smith, D.K. Electrochemically Controlled Hydrogen Bonding. Redox-Dependent Formation of a 2:1 Diarylurea/Dinitrobenzene2-Complex. J. Org. Chem. 2005, 70, 10817–10822. [Google Scholar] [CrossRef]
- Brosel-Oliu, S.; Uria, N.; Abramova, N.; Bratov, A. Impedimetric sensors for bacteria detection. Biosens. Micro Nanoscale Appl. 2015, 9, 257–288. [Google Scholar]
- Shuang, S.; Girardi, L.; Rizzi, G.A.; Sartorel, A.; Marega, C.; Zhang, Z.; Granozzi, G. Visible Light Driven Photoanodes for Water Oxidation Based on Novel r-GO/β-Cu₂V₂O₇/TiO₂ Nanorods Composites. Nanomaterials 2018, 8, 544. [Google Scholar] [CrossRef] [PubMed]
Figure 1.
Redox properties of DNB in aprotic solvents on GCE and Si–H electrodes. (a) CV for 5 mM of DNB on GCE at a scan rate of 100 mV s−1 with two reversible redox waves. (b) Schematic describing the oxidation/reduction reaction of DNB in aprotic solvents. (c) CV for 5 mM of DNB on Si–H electrode at a scan rate of 100 mV s−1, showing only two reduction waves at a relatively more negative potential and the waves disappear within the third cycle. (d) Schematic describing the formation of a molecular film on the Si–H surface upon reducing DNB in aprotic solvent.

Figure 2.
AFM topography images for the Si–H surface before and after DNB reduction. (a) AFM image for a freshly etched Si–H surface, showing flat Si terraces. (b) AFM image for a Si–H surface in DNB solution of 0.1 mM, showing that the surface is partially covered with a molecular film where in some areas the Si terraces are visible and in other areas the surface is covered with a molecular film. (c) AFM image for a Si–H surface in 10 mM DNB solution, showing the formation of a thicker molecular film that completely shadows the Si terraces.

Figure 3.
(a) CV for the evolution of the peak current vs the concentration of DNB on GCE between 0.1 mM and 10 mM. (b) Calibration curves created by plotting the peak current of the redox peak 1 (blue) and the redox peak 2 (red) against its corresponding concentration.
Figure 3.
(a) CV for the evolution of the peak current vs the concentration of DNB on GCE between 0.1 mM and 10 mM. (b) Calibration curves created by plotting the peak current of the redox peak 1 (blue) and the redox peak 2 (red) against its corresponding concentration.

Figure 4.
(a) CV showing the increase in the reduction peak current of DNB on Si–H between 0.05 mM and 10 mM. (b) Calibration curves of DNB on Si–H electrode obtained by plotting the peak current of redox peak 1 (blue) and redox peak 2 (red) against its corresponding concentration.
Figure 4.
(a) CV showing the increase in the reduction peak current of DNB on Si–H between 0.05 mM and 10 mM. (b) Calibration curves of DNB on Si–H electrode obtained by plotting the peak current of redox peak 1 (blue) and redox peak 2 (red) against its corresponding concentration.

Figure 5.
(a) Nyquist plot of the EIS for the polymeric film formed by reducing different concentrations of DNB in organic electrolyte, followed by EIS measurement in Ru (NH3)63+/2+ solution. Dots represent raw data and lines represent the equivalent Randles circuit fitting. (b) Calibration curve built from measuring the charge transfer resistance (Rct) obtained from different DNB concentrations in the range of 0.01 mM to 20 mM and fitted with a linear regression of R2 = 0.97.

Publisher’s Note: MDPI stays neutral with regard to jurisdictional claims in published maps and institutional affiliations. |
© 2022 by the authors. Licensee MDPI, Basel, Switzerland. This article is an open access article distributed under the terms and conditions of the Creative Commons Attribution (CC BY) license (https://creativecommons.org/licenses/by/4.0/).
Share and Cite
MDPI and ACS Style
Dief, E.M.; Hoffmann, N.; Darwish, N. Electrochemical Detection of Dinitrobenzene on Silicon Electrodes: Toward Explosives Sensors. Surfaces 2022, 5, 218-227. https://0-doi-org.brum.beds.ac.uk/10.3390/surfaces5010015
AMA Style
Dief EM, Hoffmann N, Darwish N. Electrochemical Detection of Dinitrobenzene on Silicon Electrodes: Toward Explosives Sensors. Surfaces. 2022; 5(1):218-227. https://0-doi-org.brum.beds.ac.uk/10.3390/surfaces5010015
Chicago/Turabian StyleDief, Essam M., Natasha Hoffmann, and Nadim Darwish. 2022. "Electrochemical Detection of Dinitrobenzene on Silicon Electrodes: Toward Explosives Sensors" Surfaces 5, no. 1: 218-227. https://0-doi-org.brum.beds.ac.uk/10.3390/surfaces5010015