
Tunning the Gas Sensing Properties of rGO with In2O3 Nanoparticles

 , and
, and
Abstract
:
1. Introduction
2. Materials and Methods
3. Results
3.1. Structural Characterization
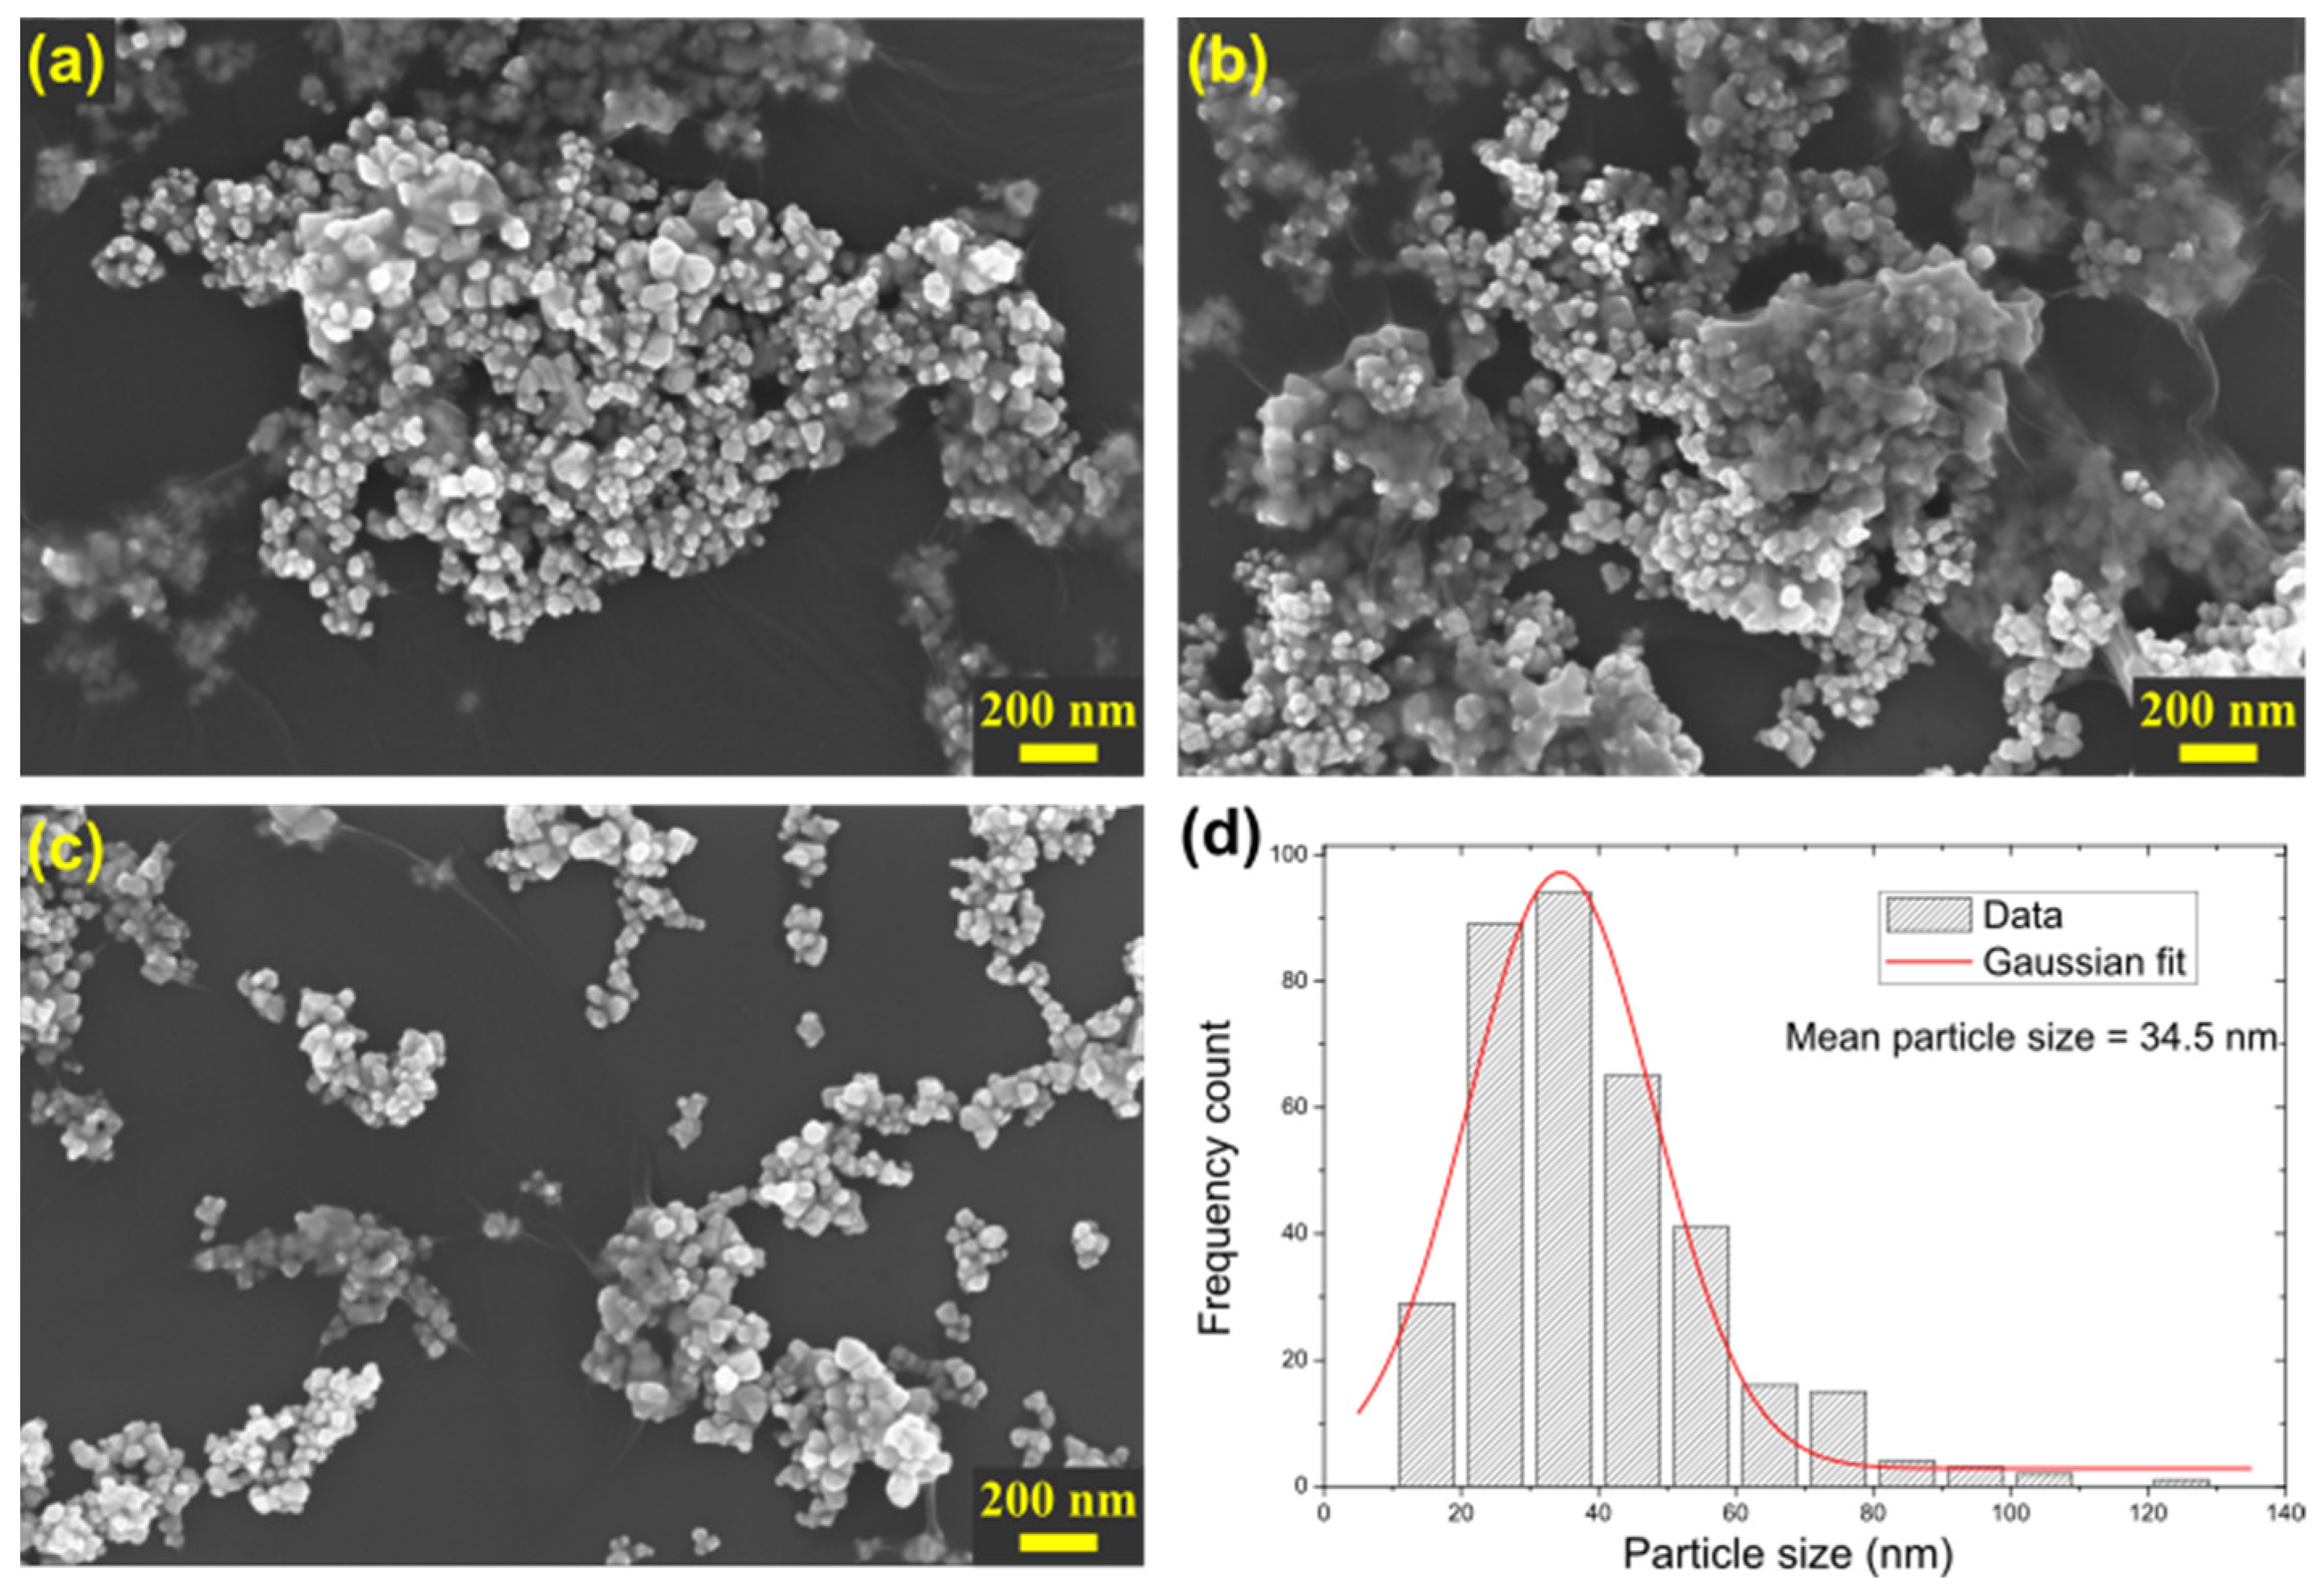
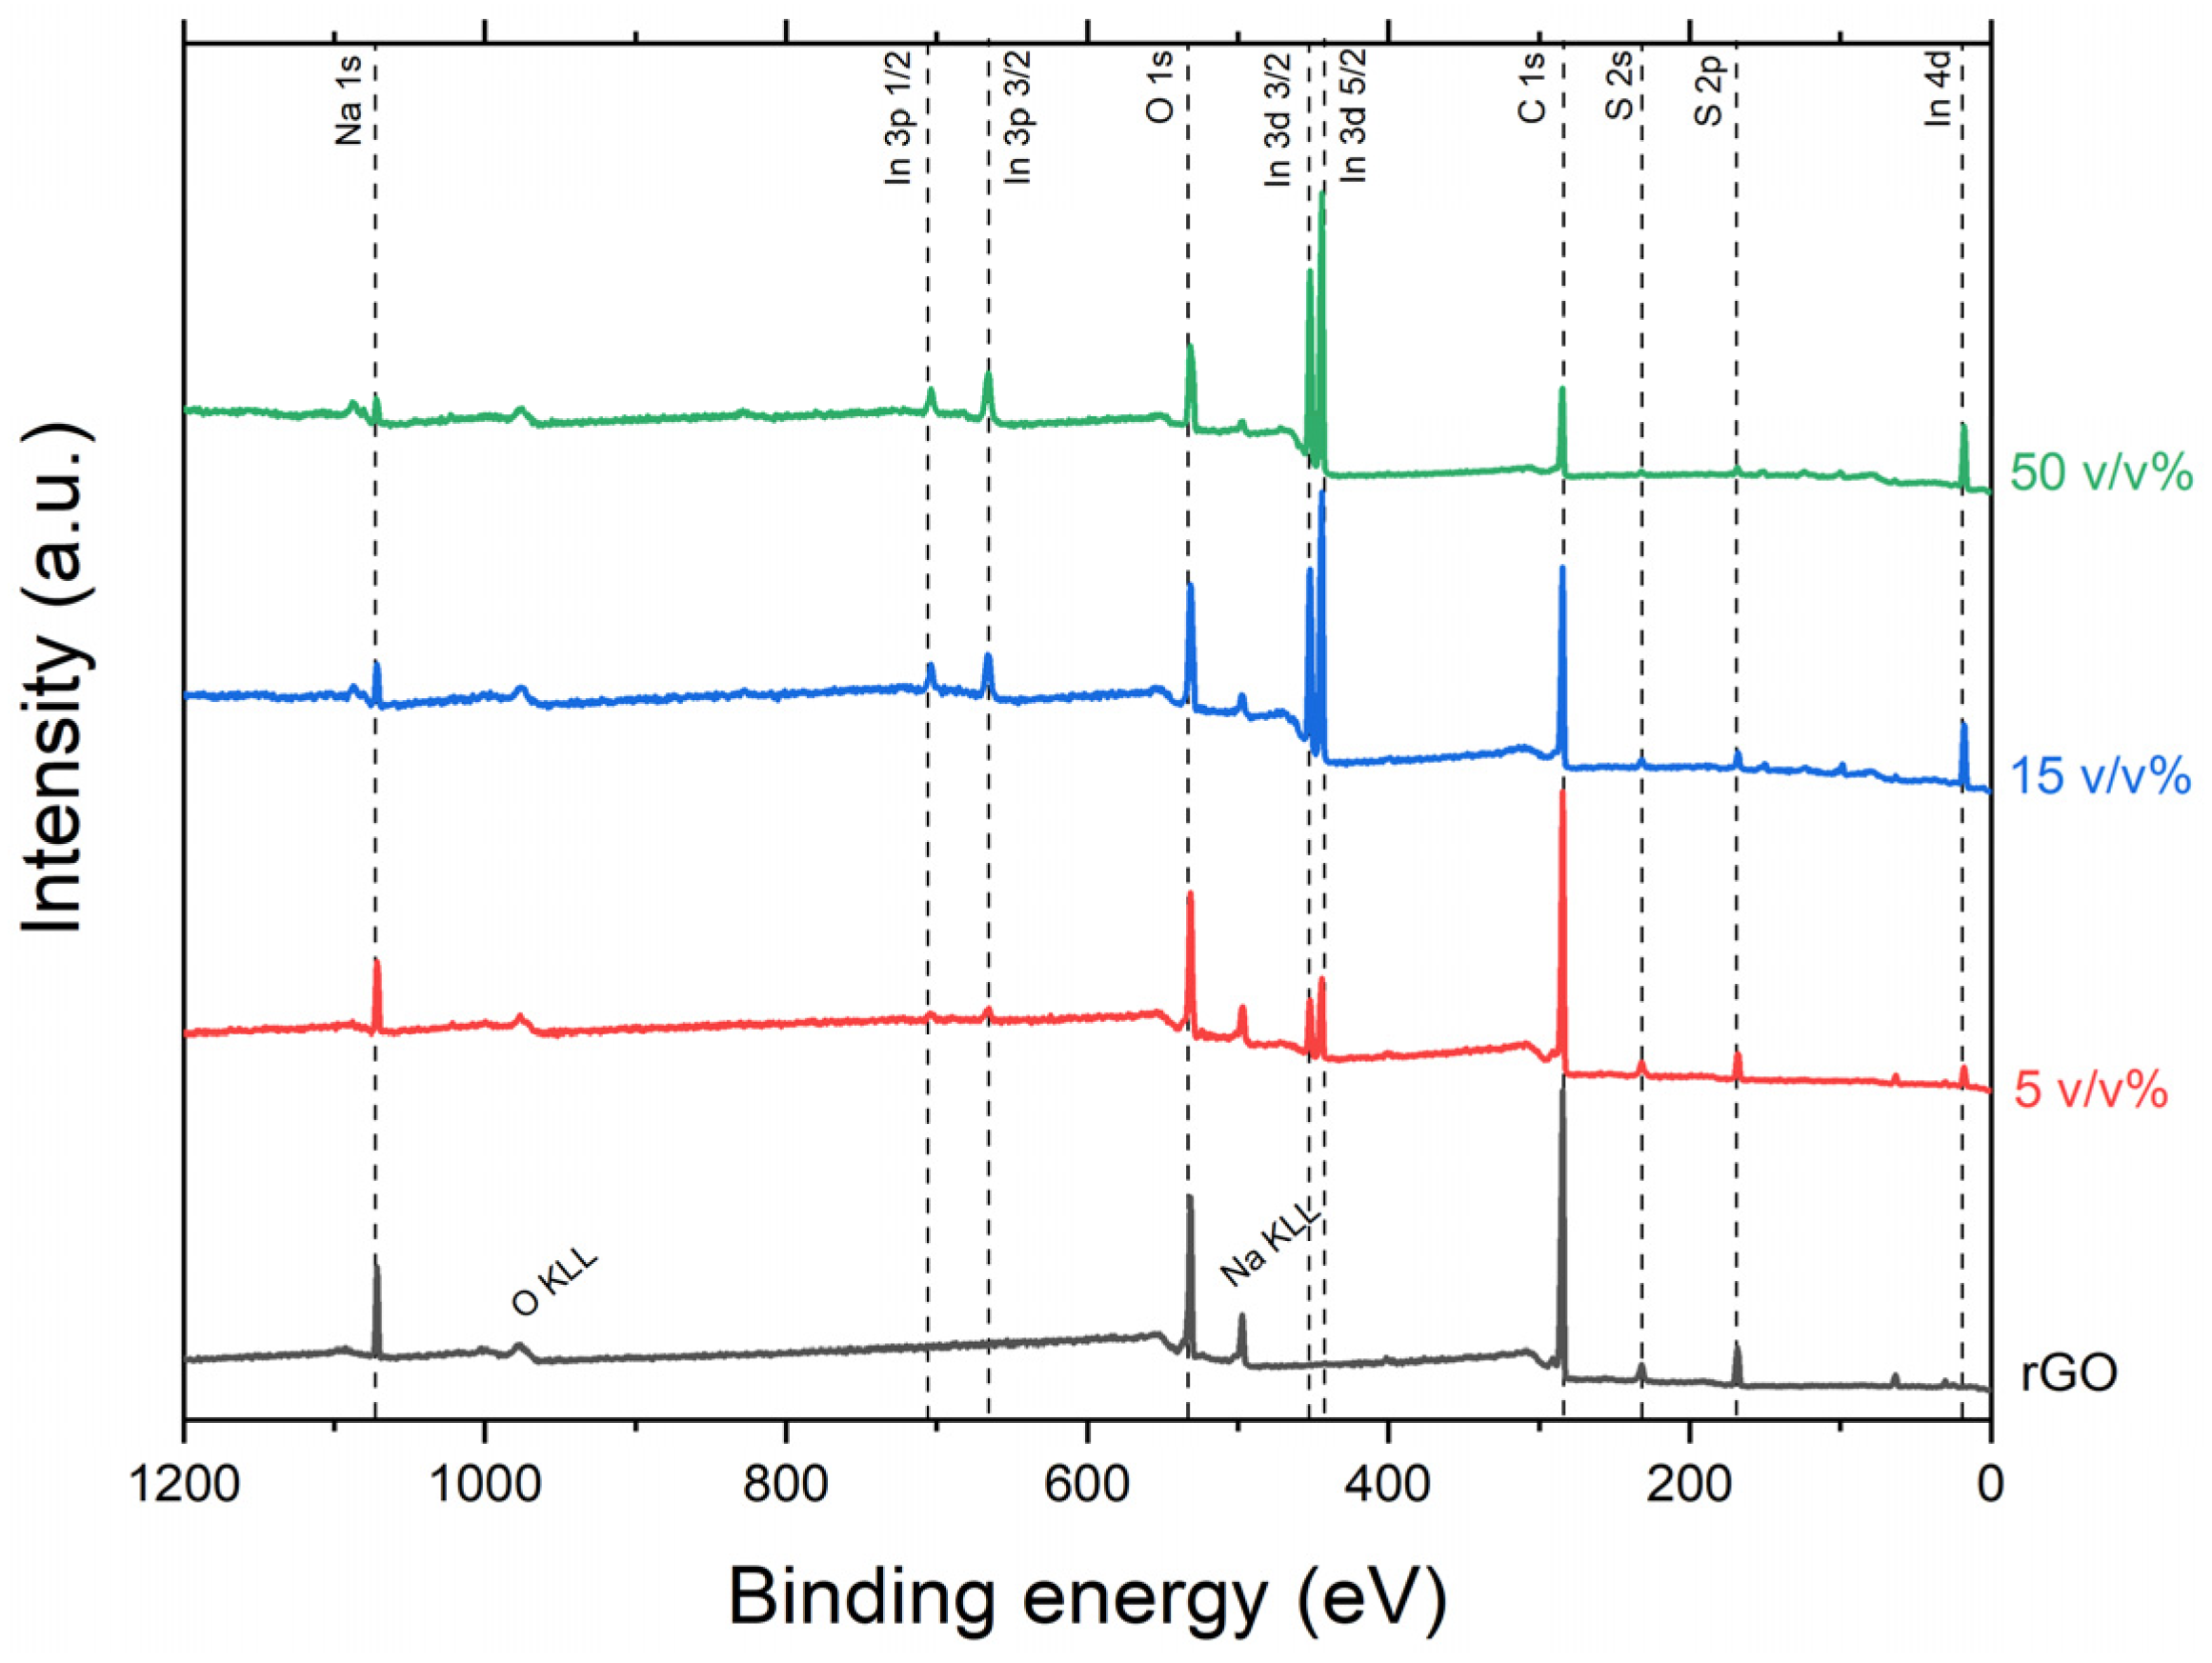
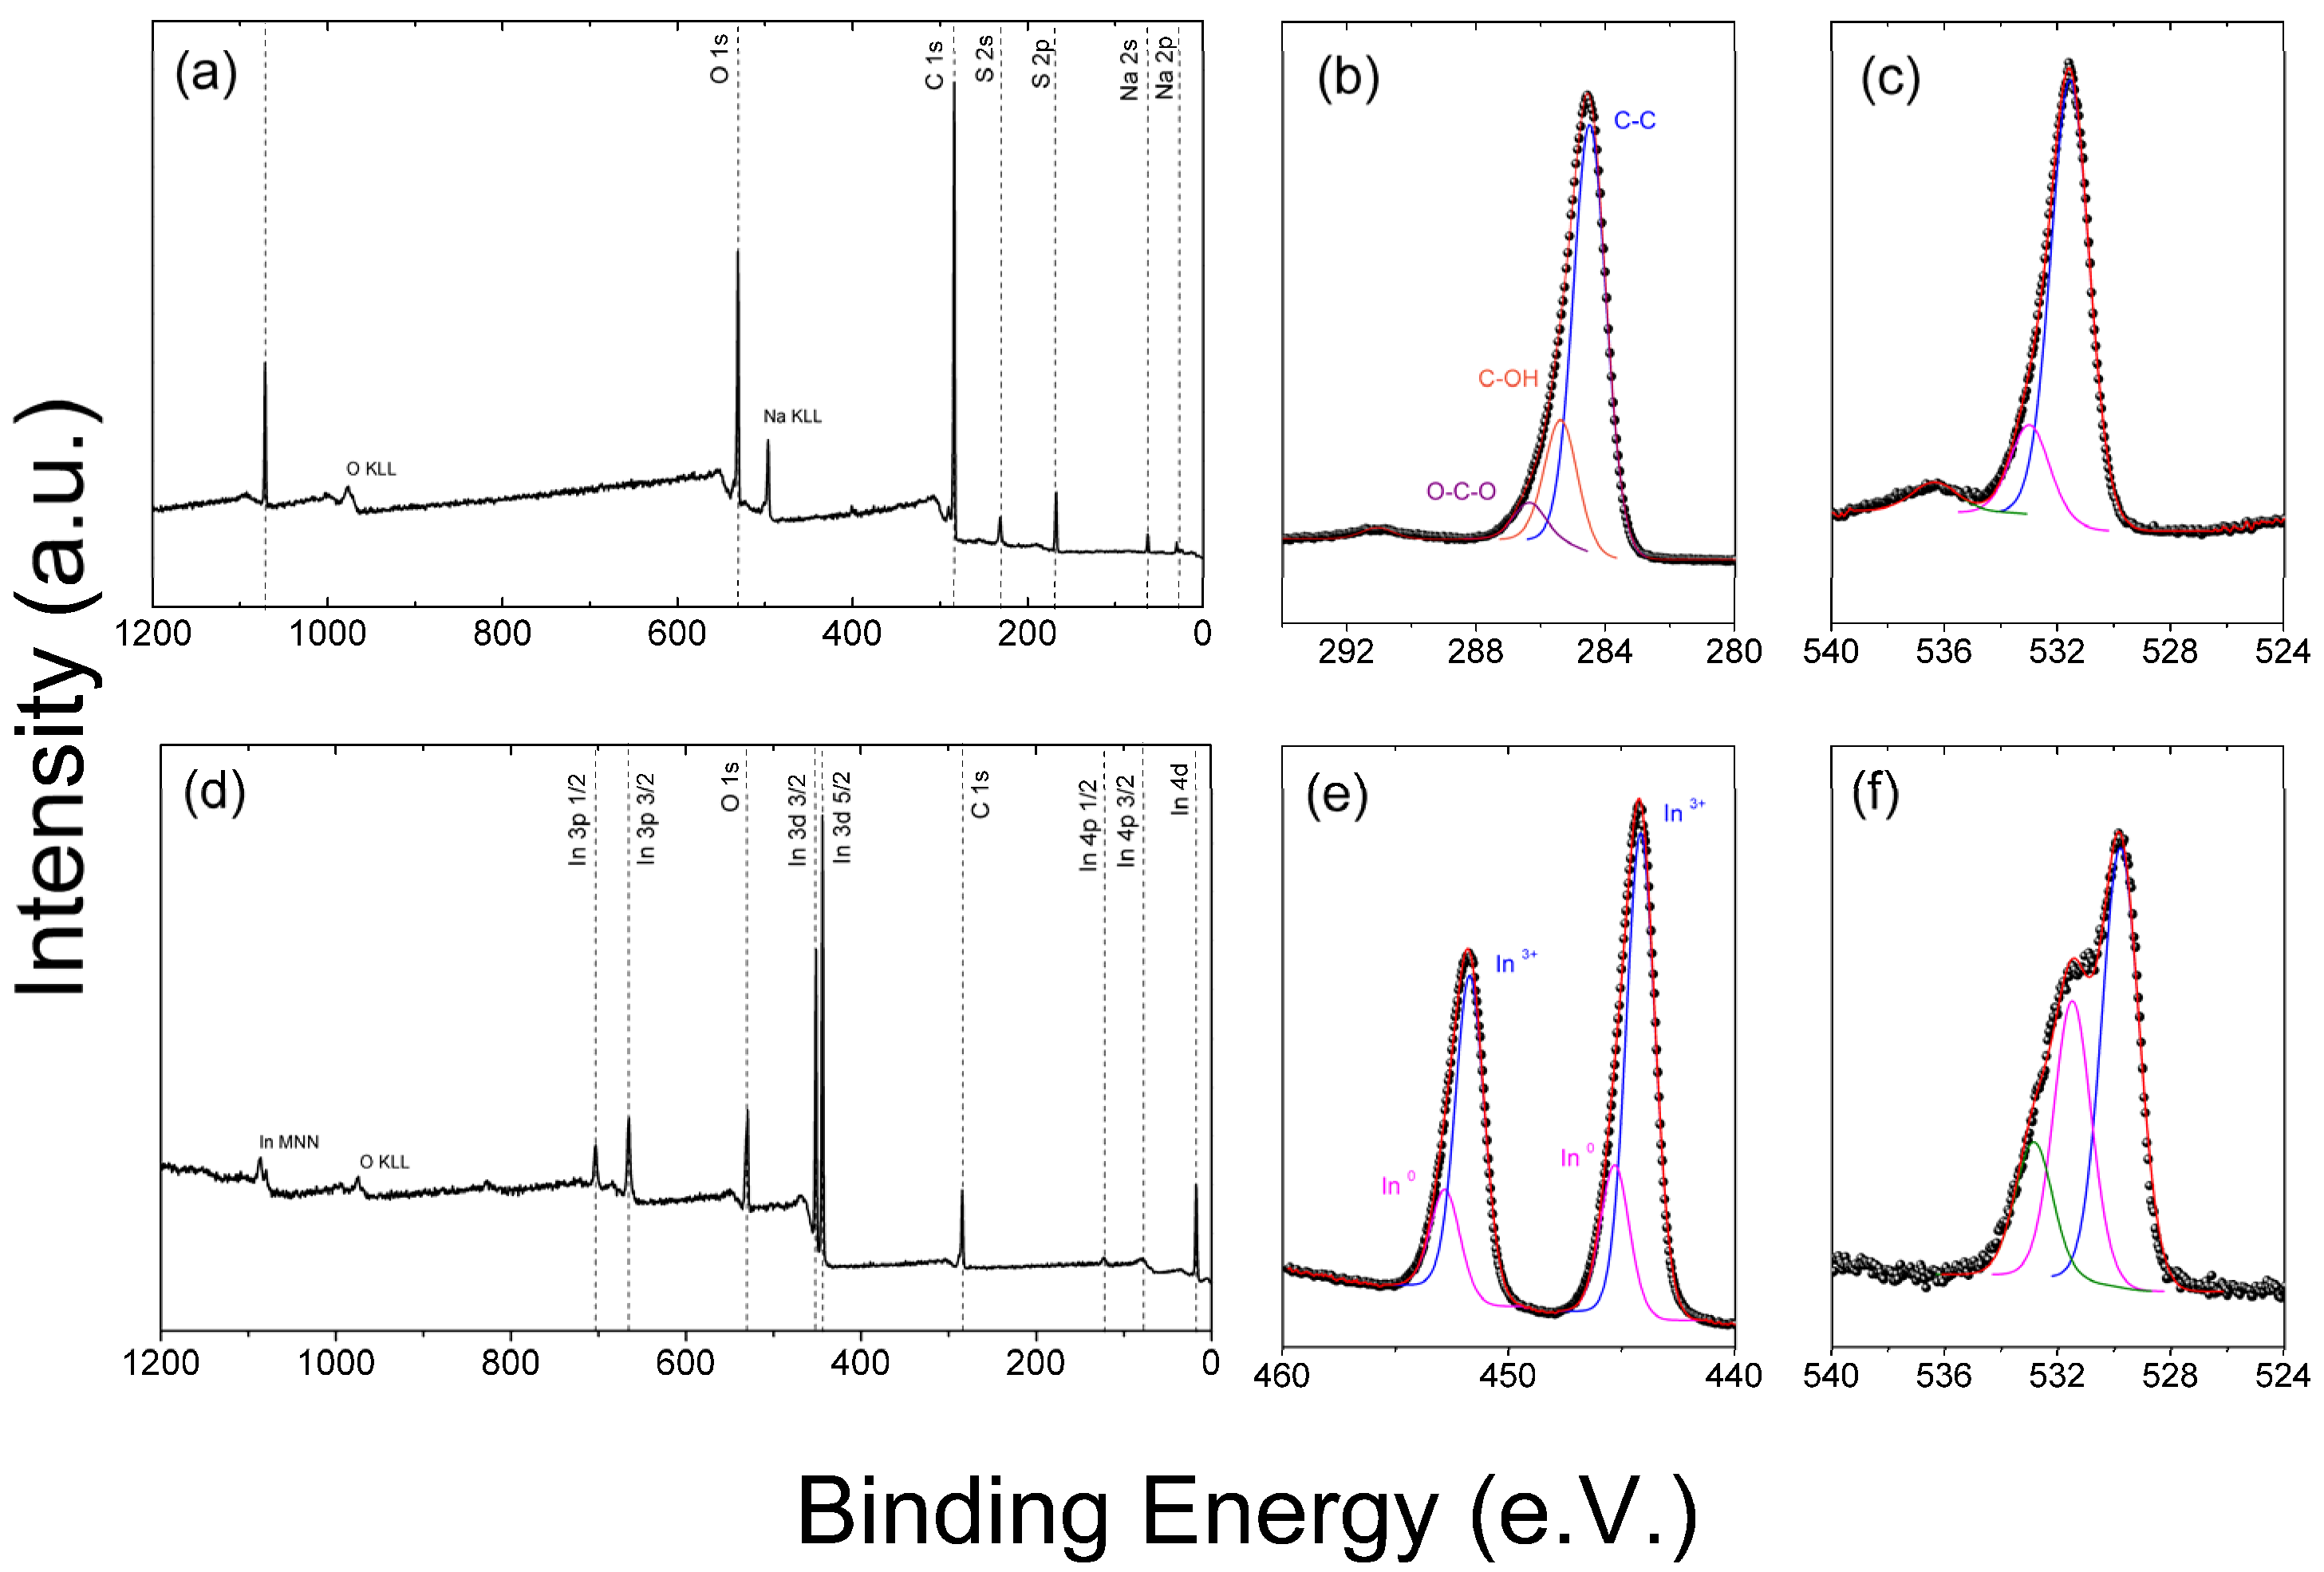
3.2. Surface Characterization and Morphology
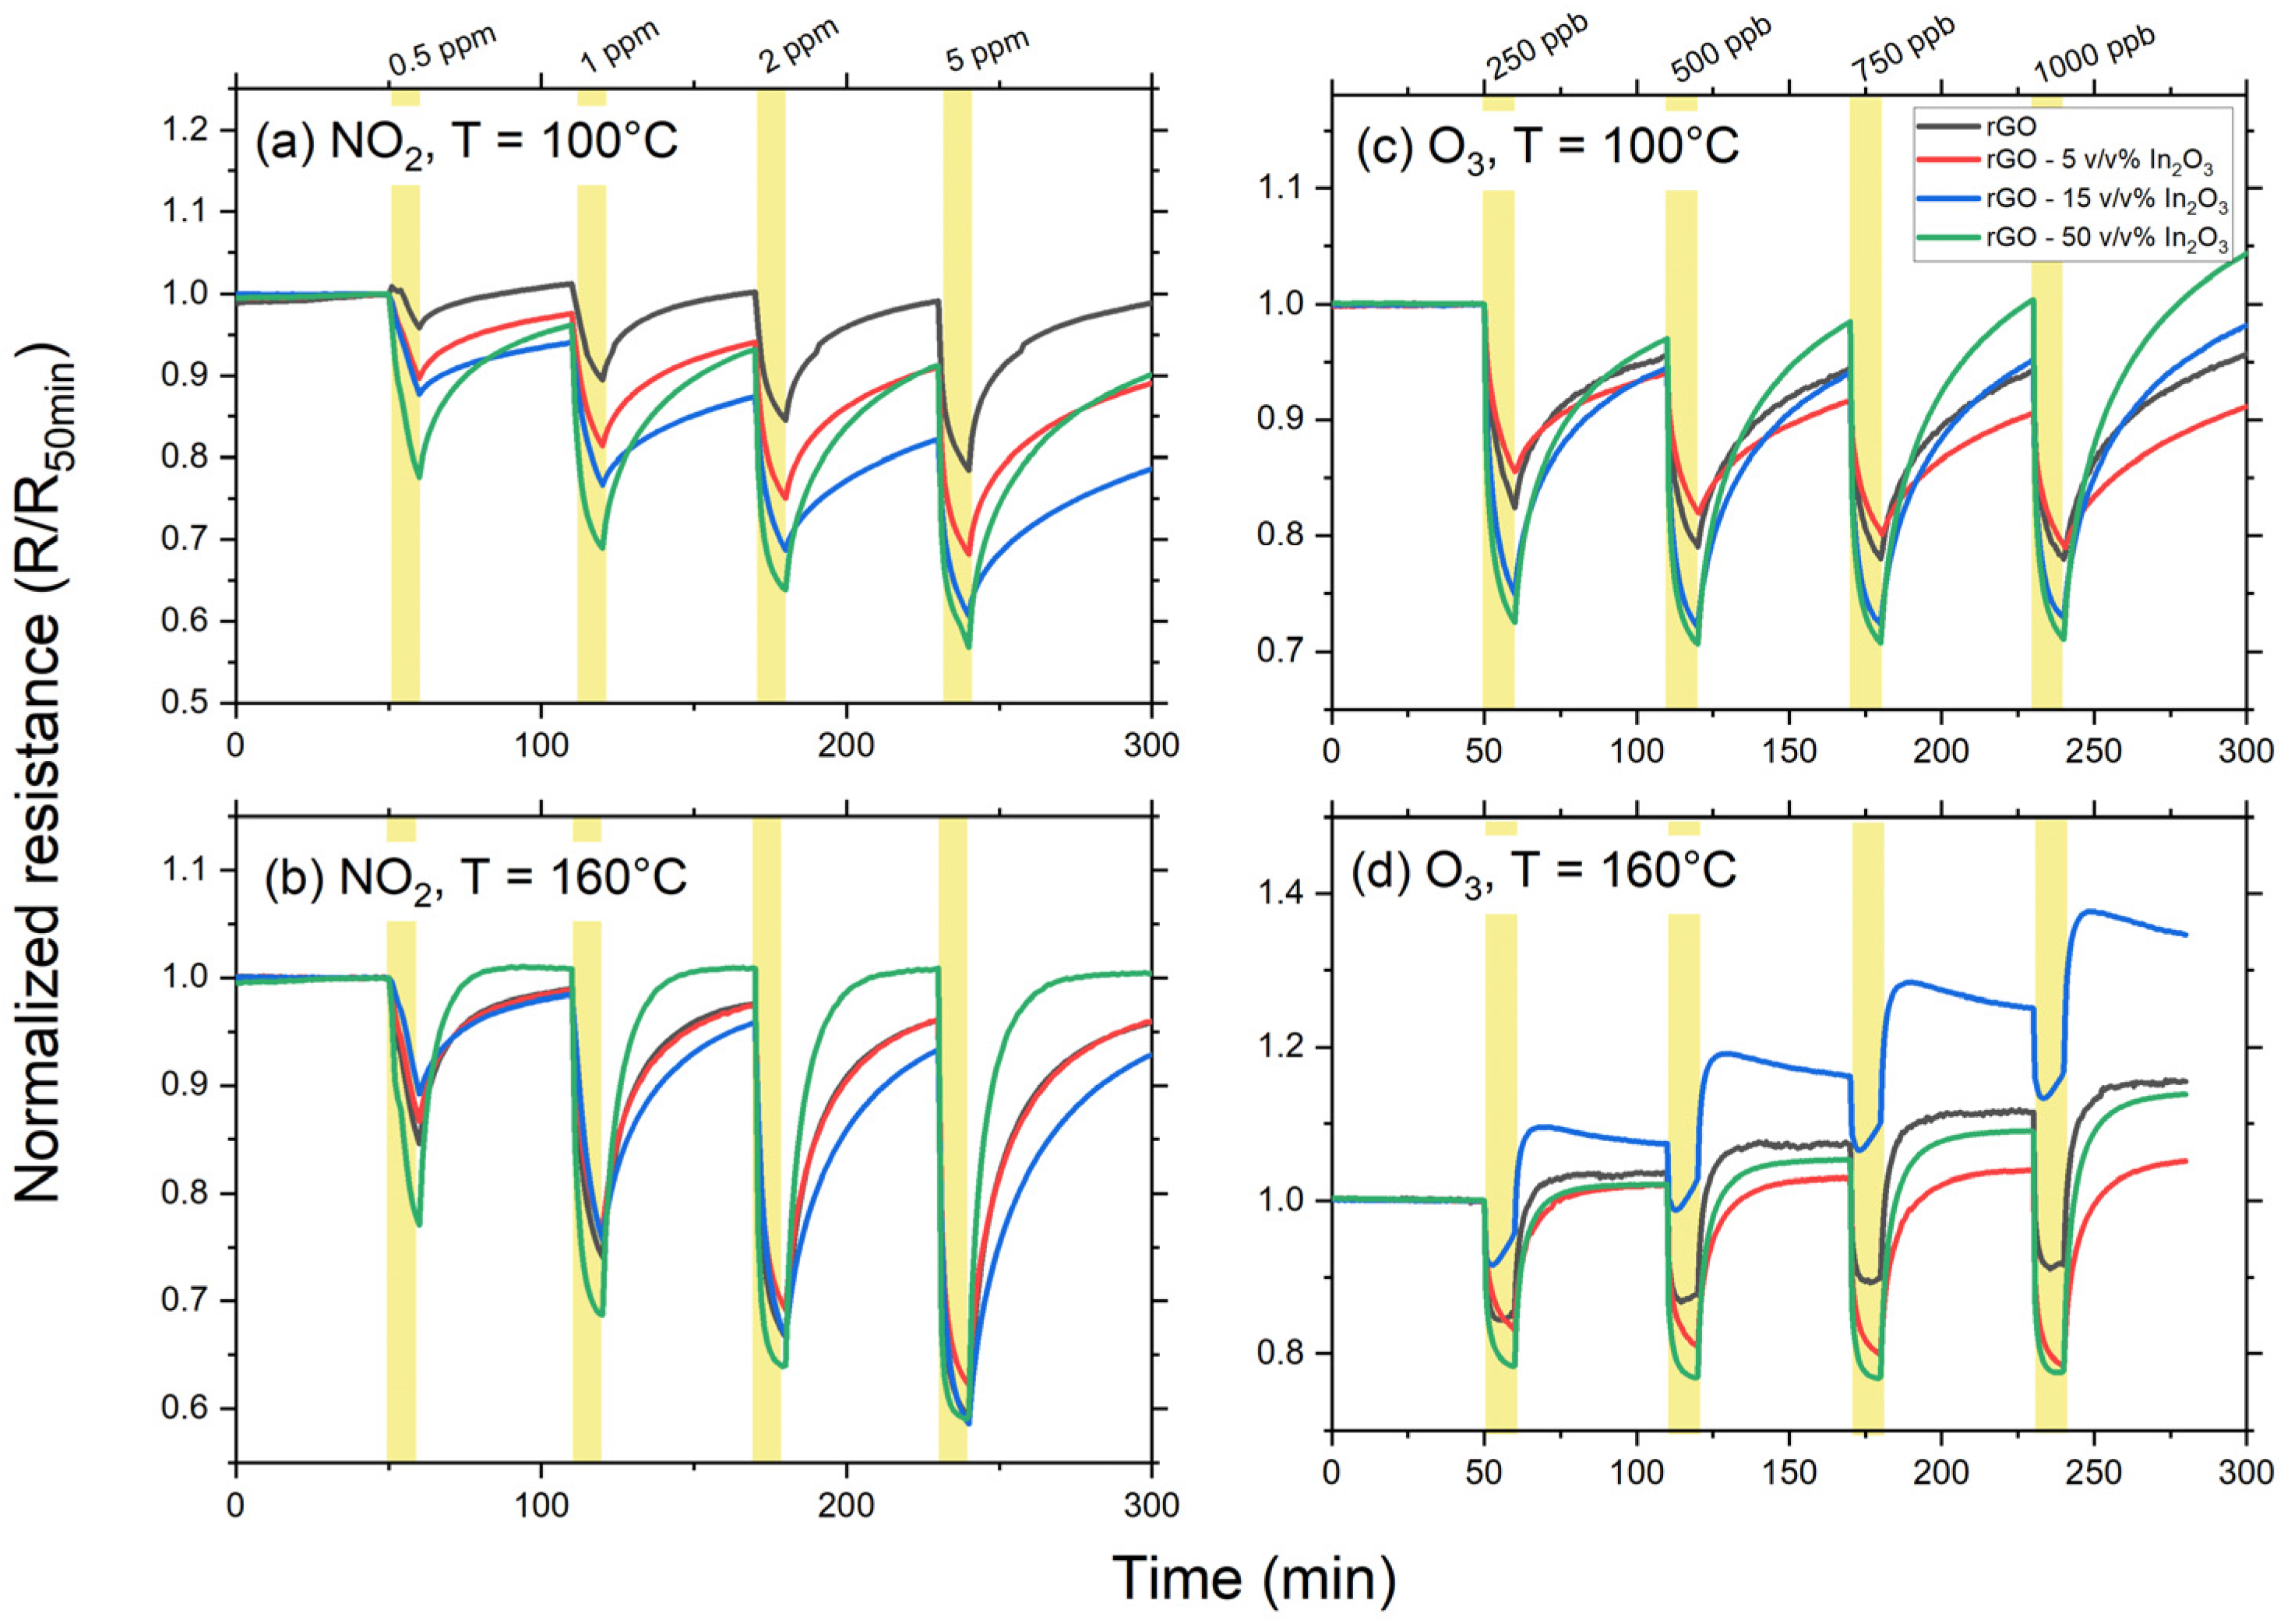
3.3. Gas Sensing Properties
4. Discussion
5. Conclusions
Author Contributions
Funding
Institutional Review Board Statement
Informed Consent Statement
Data Availability Statement
Acknowledgments
Conflicts of Interest
References
- Savage, N. Materials Science: Super Carbon. Nature 2012, 483, S30–S31. [Google Scholar] [CrossRef] [Green Version]
- Huang, H.; Su, S.; Wu, N.; Wan, H.; Wan, S.; Bi, H.; Sun, L. Graphene-Based Sensors for Human Health Monitoring. Front. Chem. 2019, 7, 399. [Google Scholar] [CrossRef] [Green Version]
- Justino, C.I.L.; Comes, A.R.; Freitas, A.C.; Duarte, A.C.; Rocha-Santos, T.A.P. Graphene Based Sensors and Biosensors. Trac-Trends Anal. Chem. 2017, 91, 53–66. [Google Scholar] [CrossRef]
- Ehtesabi, H. Carbon Nanomaterials for Salivary-Based Bioensors: A Review. Mater. Today Chem. 2020, 17, 100342. [Google Scholar] [CrossRef]
- Novodchuk, I.; Bajcsy, M.; Yavuz, M. Graphene-Based Field Effect Transistor Biosensors for Breast Cancer Detection: A Review on Biosensing Strategies. Carbon 2021, 172, 431–453. [Google Scholar] [CrossRef]
- Han, T.-H.; Kim, H.; Kwon, S.-J.; Lee, T.-W. Graphene-Based Flexible Electronic Devices. Mater. Sci. Eng. R-Rep. 2017, 118, 1–43. [Google Scholar] [CrossRef]
- You, R.; Liu, Y.-Q.; Hao, Y.-L.; Han, D.-D.; Zhang, Y.-L.; You, Z. Laser Fabrication of Graphene-Based Flexible Electronics. Adv. Mater. 2020, 32, 1901981. [Google Scholar] [CrossRef]
- Mehmood, A.; Mubarak, N.M.; Khalid, M.; Walvekar, R.; Abdullah, E.C.; Siddiqui, M.T.H.; Baloch, H.A.; Nizamuddin, S.; Mazari, S. Graphene Based Nanomaterials for Strain Sensor Application-A Review. J. Environ. Chem. Eng. 2020, 8, 103743. [Google Scholar] [CrossRef]
- Luo, Z.; Hu, X.; Tian, X.; Luo, C.; Xu, H.; Li, Q.; Li, Q.; Zhang, J.; Qiao, F.; Wu, X.; et al. Structure-Property Relationships In Graphene-Based Strain and Pressure Sensors for Potential Artificial Intelligence Applications. Sensors 2019, 19, 1250. [Google Scholar] [CrossRef] [Green Version]
- Wan, S.; Zhu, Z.; Yin, K.; Su, S.; Bi, H.; Xu, T.; Zhang, H.; Shi, Z.; He, L.; Sun, L. A Highly Skin-Conformal and Biodegradable Graphene-Based Strain Sensor. Small Methods 2018, 2, 1700374. [Google Scholar] [CrossRef]
- Jin, X.; Feng, C.; Ponnamma, D.; Yi, Z.; Parameswaranpillai, J.; Thomas, S.; Nisa, V.S. Review on Exploration of Graphene In The Design and Engineering of Smart Sensors, Actuators and Soft Robotics. Chem. Eng. J. Adv. 2020, 4, 100034. [Google Scholar] [CrossRef]
- Wang, X.; Zhang, J.; Mei, X.; Xu, B.; Miao, J. Laser Fabrication of Fully Printed Graphene Oxide Microsensor. Opt. Lasers Eng. 2021, 140, 106520. [Google Scholar] [CrossRef]
- Desai, J.A.; Chugh, S.; Michel, M.; Kaul, A.B. Inkjet Printed Graphene As an Interconnect for Optoelectronic Devices. J. Mater. Sci.-Mater. Electron. 2019, 30, 12500–12509. [Google Scholar] [CrossRef]
- Tian, W.C.; Liu, X.H.; Yu, W.B. Research Progress of Gas Sensor Based on Graphene and Its Derivatives: A Review. Appl. Sci. 2018, 8, 1118. [Google Scholar] [CrossRef] [Green Version]
- Schedin, F.; Geim, A.K.; Morozov, S.V.; Hill, E.W.; Blake, P.; Katsnelson, M.I.; Novoselov, K.S. Detection of Individual Gas Molecules Adsorbed on Graphene. Nat. Mater. 2007, 6, 652–655. [Google Scholar] [CrossRef] [PubMed]
- Yavari, F.; Castillo, E.; Gullapalli, H.; Ajayan, P.M.; Koratkar, N. High Sensitivity Detection of NO2 and NH3 in Air Using Chemical Vapor Deposition Grown Graphene. Appl. Phys. Lett. 2012, 100, 203120. [Google Scholar] [CrossRef]
- Chung, M.G.; Kim, D.H.; Lee, H.M.; Kim, T.; Choi, J.H.; Seo, D.K.; Yoo, J.-B.; Hong, S.-H.; Kang, T.J.; Kim, Y.H. Highly Sensitive NO2 Gas Sensor Based on Ozone Treated Graphene. Sens. Actuators B-Chem. 2012, 166, 172–176. [Google Scholar] [CrossRef]
- Yuan, W.; Liu, A.; Huang, L.; Li, C.; Shi, G. High-Performance NO2 Sensors Based on Chemically Modified Graphene. Adv. Mater. 2013, 25, 766–771. [Google Scholar] [CrossRef] [PubMed]
- Hu, N.; Yang, Z.; Wang, Y.; Zhang, L.; Wang, Y.; Huang, X.; Wei, H.; Wei, L.; Zhang, Y. Ultrafast and Sensitive Room Temperature NH3 Gas Sensors Based on Chemically Reduced Graphene Oxide. Nanotechnology 2014, 25, 025502. [Google Scholar] [CrossRef] [PubMed]
- Novikov, S.; Lebedeva, N.; Satrapinski, A.; Walden, J.; Davydov, V.; Lebedev, A. Graphene Based Sensor for Environmental Monitoring of NO2. Sens. Actuators B-Chem. 2016, 236, 1054–1060. [Google Scholar] [CrossRef]
- Wu, D.; Peng, Q.; Wu, S.; Wang, G.; Deng, L.; Tai, H.; Wang, L.; Yang, Y.; Dong, L.; Zhao, Y.; et al. A Simple Graphene NH3 Gas Sensor Via Laser Direct Writing. Sensors 2018, 18, 4405. [Google Scholar] [CrossRef] [Green Version]
- Huang, L.; Wang, Z.; Zhang, J.; Pu, J.; Lin, Y.; Xu, S.; Shen, L.; Chen, Q.; Shi, W. Fully Printed, Rapid-Response Sensors Based on Chemically Modified Graphene for Detecting NO2 at Room Temperature. Acs Appl. Mater. Interfaces 2014, 6, 7426–7433. [Google Scholar] [CrossRef]
- Mtz-Enriquez, A.I.; Padmasree, K.P.; Oliva, A.I.; Gomez-Solis, C.; Coutino-Gonzalez, E.; Garcia, C.R.; Esparza, D.; Oliva, J. Tailoring The Detection Sensitivity of Graphene Based Flexible Smoke Sensors By Decorating With Ceramic Microparticles. Sens. Actuators B-Chem. 2020, 305, 127466. [Google Scholar] [CrossRef]
- Pandhi, T.; Chandnani, A.; Subbaraman, H.; Estrada, D. A Review of Inkjet Printed Graphene and Carbon Nanotubes Based Gas Sensors. Sensors 2020, 20, 5642. [Google Scholar] [CrossRef] [PubMed]
- Luo, G.F.; Xie, L.L.; He, M.; Jaisutti, R.; Zhu, Z.G. Flexible Fabric Gas Sensors Based on Reduced Graphene-Polyaniline Nanocomposite for Highly Sensitive NH3 Detection at Room Temperature. Nanotechnology 2021, 32, 305501. [Google Scholar] [CrossRef]
- Wei, Z.; Wang, D.; Kim, S.; Kim, S.-Y.; Hu, Y.; Yakes, M.K.; Laracuente, A.R.; Dai, Z.; Marder, S.R.; Berger, C.; et al. Nanoscale Tunable Reduction of Graphene Oxide for Graphene Electronics. Science 2010, 328, 1373–1376. [Google Scholar] [CrossRef] [Green Version]
- Pei, S.F.; Cheng, H.M. The Reduction of Graphene Oxide. Carbon 2012, 50, 3210–3228. [Google Scholar] [CrossRef]
- Donarelli, M.; Ottaviano, L. 2D Materials for Gas Sensing Applications: A Review on Graphene Oxide, MoS2, WS2 and Phosphorene. Sensors 2018, 18, 3638. [Google Scholar] [CrossRef] [Green Version]
- Tjoa, V.; Jun, W.; Dravid, V.; Mhaisalkar, S.; Mathews, N. Hybrid Graphene-Metal Nanoparticle Systems: Electronic Properties and Gas Interaction. J. Mater. Chem. 2011, 21, 15593–15599. [Google Scholar] [CrossRef]
- Hoa, H.T.M.; Lee, K.J.; Pham, H.P.; Doan, T.A.; Nguyen, H.H.; Nguyen, T.Q.; Tran, Q.T.; Cuong, T.V. Ammonia Gas Sensing Behavior of Hybridization Between Reduced Graphene Oxide and Gold Nanoparticles. J. Nanomater. 2020, 2020, 7680508. [Google Scholar] [CrossRef]
- Dong, X.; Wu, K.; Zhu, W.; Wu, P.; Hou, J.; Wang, Z.; Li, R.; Wu, J.; Liu, Z.; Guo, X. TiO2 Nanotubes/G-C3N4 Quantum Dots/rGO Schottky Heterojunction Nanocomposites As Sensors for Ppb-Level Detection of NO2. J. Mater. Sci. 2019, 54, 7834–7849. [Google Scholar] [CrossRef]
- Zhou, Y.; Liu, G.; Zhu, X.; Guo, Y. Cu2O Quantum Dots Modified By rGO Nanosheets for Ultrasensitive and Selective NO2 Gas Detection. Ceram. Int. 2017, 43, 8372–8377. [Google Scholar] [CrossRef]
- Jung, M.W.; Kang, S.M.; Nam, K.-H.; An, K.-S.; Ku, B.-C. Highly Transparent and Flexible NO2 Gas Sensor Film Based on MoS2/rGO Composites Using Soft Lithographic Patterning. Appl. Surf. Sci. 2018, 456, 7–12. [Google Scholar] [CrossRef]
- Paolucci, V.; Emamjomeh, S.M.; Ottaviano, L.; Cantalini, C. Near Room Temperature Light-Activated WS2-Decorated rGO As NO2 Gas Sensor. Sensors 2019, 19, 2617. [Google Scholar] [CrossRef] [PubMed] [Green Version]
- Wang, J.; Deng, H.; Li, X.; Yang, C.; Xia, Y. Visible-Light Photocatalysis Enhanced Room-Temperature formaldehyde Gas Sensing By MoS2/rGO Hybrids. Sens. Actuators B-Chem. 2020, 304, 127317. [Google Scholar] [CrossRef]
- Jha, R.; Nanda, A.; Bhat, N. Ammonia Sensing Performance of rGO-Based Chemiresistive Gas Sensor Decorated With Exfoliated MoSe2 Nanosheets. IEEE Sens. J. 2021, 21, 10211–10218. [Google Scholar] [CrossRef]
- Majhi, S.M.; Mirzaei, A.; Kim, H.W.; Kim, S.S. Reduced Graphene Oxide (rGO)-Loaded Metal-Oxide Nanofiber Gas Sensors: An Overview. Sensors 2021, 21, 1352. [Google Scholar] [CrossRef]
- Chu Manh, H.; Do Quang, D.; Nguyen Van, D.; Vu Van, Q.; Nguyen Van, T.; Nguyen Van, H.; Nguyen Duc, H. Facile Synthesis of Ultrafine rGO/WO3 Nanowire Nanocomposites for Highly Sensitive Toxic NH3 Gas Sensors. Mater. Res. Bull. 2020, 125, 110810. [Google Scholar] [CrossRef]
- Su, P.-G.; Peng, S.-L. Fabrication and NO2 Gas-Sensing Properties of Reduced Graphene Oxide/WO3 Nanocomposite Films. Talanta 2015, 132, 398–405. [Google Scholar] [CrossRef]
- Liu, Y.; Huang, J.; Gong, Y.; Xu, X.; Li, H. Liquid Flame Spray Fabrication of WO3-Reduced Graphene Oxide Nanocomposites for Enhanced O-3-Sensing Performances. Ceram. Int. 2017, 43, 13185–13192. [Google Scholar] [CrossRef]
- Su, P.-G.; Zheng, Y.-L. Room-Temperature Ppb-Level SO2 Gas Sensors Based on rGO/WO3 and Mwcnts/WO3 Nanocomposites. Anal. Methods 2021, 13, 782–788. [Google Scholar] [CrossRef]
- Amarnath, M.; Gurunathan, K. Highly Selective CO2 Gas Sensor Using Stabilized NiO-In2O3 Nanospheres Coated Reduced Graphene Oxide Sensing Electrodes at Room Temperature. J. Alloy Compd. 2021, 857, 157584. [Google Scholar] [CrossRef]
- Jeevitha, G.; Abhinayaa, R.; Mangalaraj, D.; Ponpandian, N.; Meena, P.; Mounasamy, V.; Madanagurusamy, S. Porous Reduced Graphene Oxide (rGO)/WO3 Nanocomposites for the Enhanced Detection of NH3 at Room Temperature. Nanoscale Adv. 2019, 1, 1799–1811. [Google Scholar] [CrossRef] [Green Version]
- Punetha, D.; Pandey, S.K. Sensitivity Enhancement of Ammonia Gas Sensor Based on Hydrothermally Synthesized rGO/WO3 Nanocomposites. IEEE Sens. J. 2020, 20, 1738–1745. [Google Scholar] [CrossRef]
- Wang, T.; Hao, J.; Zheng, S.; Sun, Q.; Zhang, D.; Wang, Y. Highly Sensitive and Rapidly Responding Room-Temperature NO2 Gas Sensors Based on WO3 Nanorods/Sulfonated Graphene Nanocomposites. Nano Res. 2018, 11, 791–803. [Google Scholar] [CrossRef]
- Hassan, M.; Wang, Z.-H.; Huang, W.-R.; Li, M.-Q.; Liu, J.-W.; Chen, J.-F. Ultrathin Tungsten Oxide Nanowires/Reduced Graphene Oxide Composites for Toluene Sensing. Sensors 2017, 17, 2245. [Google Scholar] [CrossRef] [PubMed]
- Anasthasiya, A.N.A.; Kishore, K.R.; Rai, P.K.; Jeyaprakash, B.G. Highly Sensitive Graphene Oxide Functionalized Zno Nanowires for Ammonia Vapour Detection at Ambient Temperature. Sens. Actuators B-Chem. 2018, 255, 1064–1071. [Google Scholar] [CrossRef]
- Cao, P.; Cai, Y.; Pawar, D.; Navale, S.T.; Rao, C.N.; Han, S.; Xu, W.; Fang, M.; Liu, X.; Zeng, Y.; et al. Down to Ppb Level NO2 Detection By ZnO/rGO Heterojunction Based Chemiresistive Sensors. Chem. Eng. J. 2020, 401, 125491. [Google Scholar] [CrossRef]
- Shewale, P.S.; Yun, K.S. Synthesis and Characterization of Cu-Doped ZnO/rGO Nanocomposites for Room-Temperature H2s Gas Sensor. J. Alloys Compd. 2020, 837, 155527. [Google Scholar] [CrossRef]
- Drmosh, Q.A.; Hendi, A.H.; Hossain, M.K.; Yamani, Z.H.; Moqbel, R.A.; Hezam, A.; Gondal, M. Uv-Activated Gold Decorated rGO/ZnO Heterostructured Nanocomposite Sensor for Efficient Room Temperature H-2 Detection. Sens. Actuators B-Chem. 2019, 290, 666–675. [Google Scholar] [CrossRef]
- Peng, R.; Li, Y.; Chen, J.; Si, P.; Feng, J.; Zhang, L.; Ci, L. Reduced Graphene Oxide Wrapped Au@ZnO Core-Shell Structure for Highly Selective Triethylamine Gas Sensing Application at A Low Temperature. Sens. Actuators A-Phys. 2018, 283, 128–133. [Google Scholar] [CrossRef]
- Drmosh, Q.A.; Yamani, Z.H.; Hendi, A.H.; Gondal, M.A.; Moqbel, R.A.; Saleh, T.A.; Khan, M.Y. A Novel Approach to Fabricating A Ternary rGO/ZnO/Pt System for High-Performance Hydrogen Sensor at Low Operating Temperatures. Appl. Surf. Sci. 2019, 464, 616–626. [Google Scholar] [CrossRef]
- Moon, D.-B.; Bag, A.; Lee, H.-B.; Meeseepong, M.; Lee, D.-H.; Lee, N.-E. A Stretchable, Room-Temperature Operable, Chemiresistive Gas Sensor Using Nanohybrids of Reduced Graphene Oxide and Zinc Oxide Nanorods. Sens. Actuators B-Chem. 2021, 345, 130373. [Google Scholar] [CrossRef]
- Lee, J.-H.; Katoch, A.; Choi, S.-W.; Kim, J.-H.; Kim, H.W.; Kim, S.S. Extraordinary Improvement of Gas-Sensing Performances In SnO2 Nanofibers Due to Creation of Local P-N Heterojunctions By Loading Reduced Graphene Oxide Nanosheets. ACS Appl. Mater. Interfaces 2015, 7, 3101–3109. [Google Scholar] [CrossRef] [PubMed]
- Song, Z.; Wei, Z.; Wang, B.; Luo, Z.; Xu, S.; Zhang, W.; Yu, H.; Li, M.; Huang, Z.; Zang, J.; et al. Sensitive Room-Temperature H2s Gas Sensors Employing SnO2 Quantum Wire/Reduced Graphene Oxide Nanocomposites. Chem. Mater. 2016, 28, 1205–1212. [Google Scholar] [CrossRef]
- Sivakumar, R.; Krishnamoorthi, K.; Vadivel, S.; Govindasamy, S. Progress Towards A Novel NO2 Gas Sensor Based on SnO2/rGO Hybrid Sensors By A Facial Hydrothermal Approach. Diam. Relat. Mater. 2021, 116, 108418. [Google Scholar] [CrossRef]
- Huang, M.; Wang, Y.; Ying, S.; Wu, Z.; Liu, W.; Chen, D.; Peng, C. Synthesis of Cu2O-Modified Reduced Graphene Oxide for NO2 Sensors. Sensors 2021, 21, 1958. [Google Scholar] [CrossRef]
- Srirattanapibul, S.; Nakarungsee, P.; Issro, C.; Tang, I.M.; Thongmee, S. Enhanced Room Temperature NH3 Sensing of rGO/CO3O4 Nanocomposites. Mater. Chem. Phys. 2021, 272, 125033. [Google Scholar] [CrossRef]
- Sen, S.; Kundu, S. Reduced Graphene Oxide (rGO) Decorated ZnO-SnO2: A Ternary Nanocomposite Towards Improved Low Concentration Voc Sensing Performance. J. Alloys Compd. 2021, 881, 160406. [Google Scholar] [CrossRef]
- Gao, Y.W.; Chen, D.L.; Hou, X.H.; Zhang, Y.; Yi, S.S.; Ji, H.P.; Wang, Y.; Yin, L.; Sun, J. Microwave-Assisted Synthesis of Hierarchically Porous CO3O4/rGO Nanocomposite for Low-Temperature Acetone Detection. J. Colloid Interface Sci. 2021, 594, 690–701. [Google Scholar] [CrossRef] [PubMed]
- Liu, J.; Luo, T.; Meng, F.; Qian, K.; Wan, Y.; Liu, J. Porous Hierarchical In2O3 Micro-/Nanostructures: Preparation, formation Mechanism, and Their Application in Gas Sensors for Noxious Volatile Organic Compound Detection. J. Phys. Chem. C 2010, 114, 4887–4894. [Google Scholar] [CrossRef]
- Soulantica, K.; Erades, L.; Sauvan, M.; Senocq, F.; Maisonnat, A.; Chaudret, B. Synthesis of Indium and Indium Oxide Nanoparticles from Indium Cyclopentadienyl Precursor and Their Application for Gas Sensing. Adv. Funct. Mater. 2003, 13, 553–557. [Google Scholar] [CrossRef]
- Shu, S.; Yu, D.; Wang, Y.; Wang, F.; Wang, Z.; Zhong, W. Thermal-Induced Phase Transition and Assembly of Hexagonal Metastable In2O3 Nanocrystals: A New Approach to In2O3 Functional Materials. J. Cryst. Growth 2010, 312, 3111–3116. [Google Scholar] [CrossRef]
- Shen, Y.; Zhong, X.; Zhang, J.; Li, T.; Zhao, S.; Cui, B.; Wei, D.; Zhang, Y.; Wei, K. In-Situ Growth of Mesoporous In2O3 Nanorod Arrays on A Porous Ceramic Substrate for Ppb-Level NO2 Detection at Room Temperature. Appl. Surf. Sci. 2019, 498, 143873. [Google Scholar] [CrossRef]
- De Boer, T.; Bekheet, M.F.; Gurlo, A.; Riedel, R.; Moewes, A. Band Gap and Electronic Structure of Cubic, Rhombohedral, and Orthorhombic In2O3 Polymorphs: Experiment and Theory. Phys. Rev. B 2016, 93, 155205. [Google Scholar] [CrossRef] [Green Version]
- andre, R.S.; Mercante, L.A.; Facure, M.H.M.; Mattoso, L.H.C.; Correa, D.S. Enhanced and Selective Ammonia Detection Using In2O3/Reduced Graphene Oxide Hybrid Nanofibers. Appl. Surf. Sci. 2019, 473, 133–140. [Google Scholar] [CrossRef]
- Gu, F.; Nie, R.; Han, D.; Wang, Z. In2O3-Graphene Nanocomposite Based Gas Sensor for Selective Detection of NO2 at Room Temperature. Sens. Actuators B-Chem. 2015, 219, 94–99. [Google Scholar] [CrossRef]
- Liu, J.; Li, S.; Zhang, B.; Wang, Y.; Gao, Y.; Liang, X.; Wang, Y.; Lu, G. Flower-Like In2O3 Modified By Reduced Graphene Oxide Sheets Serving As A Highly Sensitive Gas Sensor for Trace NO2 Detection. J. Colloid Interface Sci. 2017, 504, 206–213. [Google Scholar] [CrossRef] [PubMed]
- Na, C.W.; Kim, J.-H.; Kim, H.-J.; Woo, H.-S.; Gupta, A.; Kim, H.-K.; Lee, J.-H. Highly Selective and Sensitive Detection of NO2 Using rGO-In2O3 Structure on Flexible Substrate at Low Temperature. Sens. Actuators B-Chem. 2018, 255, 1671–1679. [Google Scholar] [CrossRef]
- Toby, B.H.; Von Dreele, R.B. Gsas-Ii: The Genesis of A Modern Open-Source All Purpose Crystallography Software Package. J. Appl. Crystallogr. 2013, 46, 544–549. [Google Scholar] [CrossRef]
- Momma, K.; Izumi, F. Vesta 3 for Three-Dimensional Visualization of Crystal, Volumetric and Morphology Data. J. Appl. Crystallogr. 2011, 44, 1272–1276. [Google Scholar] [CrossRef]
- Schneider, C.A.; Rasband, W.S.; Eliceiri, K.W. Nih Image to Imagej: 25 Years of Image Analysis. Nat. Methods 2012, 9, 671–675. [Google Scholar] [CrossRef]
- Ferrari, A.C.; Meyer, J.C.; Scardaci, V.; Casiraghi, C.; Lazzeri, M.; Mauri, F.; Piscanec, S.; Jiang, D.; Novoselov, K.S.; Roth, S.; et al. Raman Spectrum of Graphene and Graphene Layers. Phys. Rev. Lett. 2006, 97, 187401. [Google Scholar] [CrossRef] [Green Version]
- Kaniyoor, A.; Ramaprabhu, S. A Raman Spectroscopic Investigation of Graphite Oxide Derived Graphene. Aip Adv. 2012, 2, 032183. [Google Scholar] [CrossRef] [Green Version]
- Dupin, J.C.; Gonbeau, D.; Vinatier, P.; Levasseur, A. Systematic Xps Studies of Metal Oxides, Hydroxides and Peroxides. Phys. Chem. Chem. Phys. 2000, 2, 1319–1324. [Google Scholar] [CrossRef]
- Reddy, I.N.; Reddy, C.H.V.; Cho, M.; Shim, J.; Kim, D. Structural, Optical and Xps Study of Thermal Evaporated In2O3 Thin Films. Mater. Res. Express 2017, 4, 086406. [Google Scholar] [CrossRef]
- Yang, F.; Zhao, M.L.; Wang, Z.; Ji, H.Y.; Zheng, B.Z.; Xiao, D.; Wu, L.; Guo, Y. The Role of Ozone In The Ozonation Process of Graphene Oxide: Oxidation Or Decomposition? Rsc Adv. 2014, 4, 58325–58328. [Google Scholar] [CrossRef]
- Choi, Y.R.; Yoon, Y.G.; Choi, K.S.; Kang, J.H.; Shim, Y.S.; Kim, Y.H.; Chang, H.J.; Lee, J.H.; Park, C.R.; Kim, S.Y.; et al. Role of Oxygen Functional Groups In Graphene Oxide for Reversible Room-Temperature NO2 Sensing. Carbon 2015, 91, 178–187. [Google Scholar] [CrossRef]
- Li, C.; Zhang, D.H.; Lei, B.; Han, S.; Liu, X.L.; Zhou, C.W. Surface Treatment and Doping Dependence of In2O3 Nanowires As Ammonia Sensors. J. Phys. Chem. B 2003, 107, 12451–12455. [Google Scholar] [CrossRef]
- Guo, P.F.; Pan, H.B. Selectivity of Ti-Doped In2O3 Ceramics As an Ammonia Sensor. Sens. Actuators B-Chem. 2006, 114, 762–767. [Google Scholar] [CrossRef]
- Xu, J.Q.; Wang, X.H.; Shen, J.N. Hydrothermal Synthesis of In2O3 for Detecting H2S In Air. Sens. Actuators B-Chem. 2006, 115, 642–646. [Google Scholar] [CrossRef]
- Liu, J.; Guo, W.; Qu, F.; Feng, C.; Li, C.; Zhu, L.; Zhou, J.; Ruan, S.; Chen, W. V-Doped In2O3 Nanofibers for H2S Detection at Low Temperature. Ceram. Int. 2014, 40, 6685–6689. [Google Scholar] [CrossRef]
- Reshak, A.H.; Auluck, S. Adsorbing H2S onto A Single Graphene Sheet: A Possible Gas Sensor. J. Appl. Phys. 2014, 116, 103702. [Google Scholar] [CrossRef] [Green Version]
- Jeong, S.Y.; Kim, J.S.; Lee, J.H. Rational Design of Semiconductor-Based Chemiresistors and Their Libraries for Next-Generation Artificial Olfaction. Adv. Mater. 2020, 32, 2002075. [Google Scholar] [CrossRef] [PubMed]
- Yuan, Z.; Bariya, M.; Fahad, H.M.; Wu, J.B.; Han, R.; Gupta, N.; Javey, A. Trace-Level, Multi-Gas Detection for Food Quality Assessment Based on Decorated Silicon Transistor Arrays. Adv. Mater. 2020, 32, 1908385. [Google Scholar] [CrossRef]


| Nominal Composition | Atomic % | ||||
|---|---|---|---|---|---|
| C 1s | O 1s | In 3d | Na 1s | S 2p | |
| rGO | 73.5 | 16.9 | - | 2.4 | 7.2 |
| 5 v/v% In2O3 | 75.6 | 15.8 | 1.5 | 1.8 | 5.3 |
| 15 v/v% In2O3 | 69.3 | 20.1 | 6.4 | 1.5 | 2.7 |
| 50 v/v% In2O3 | 58.1 | 26.1 | 11.3 | 1.4 | 3.1 |
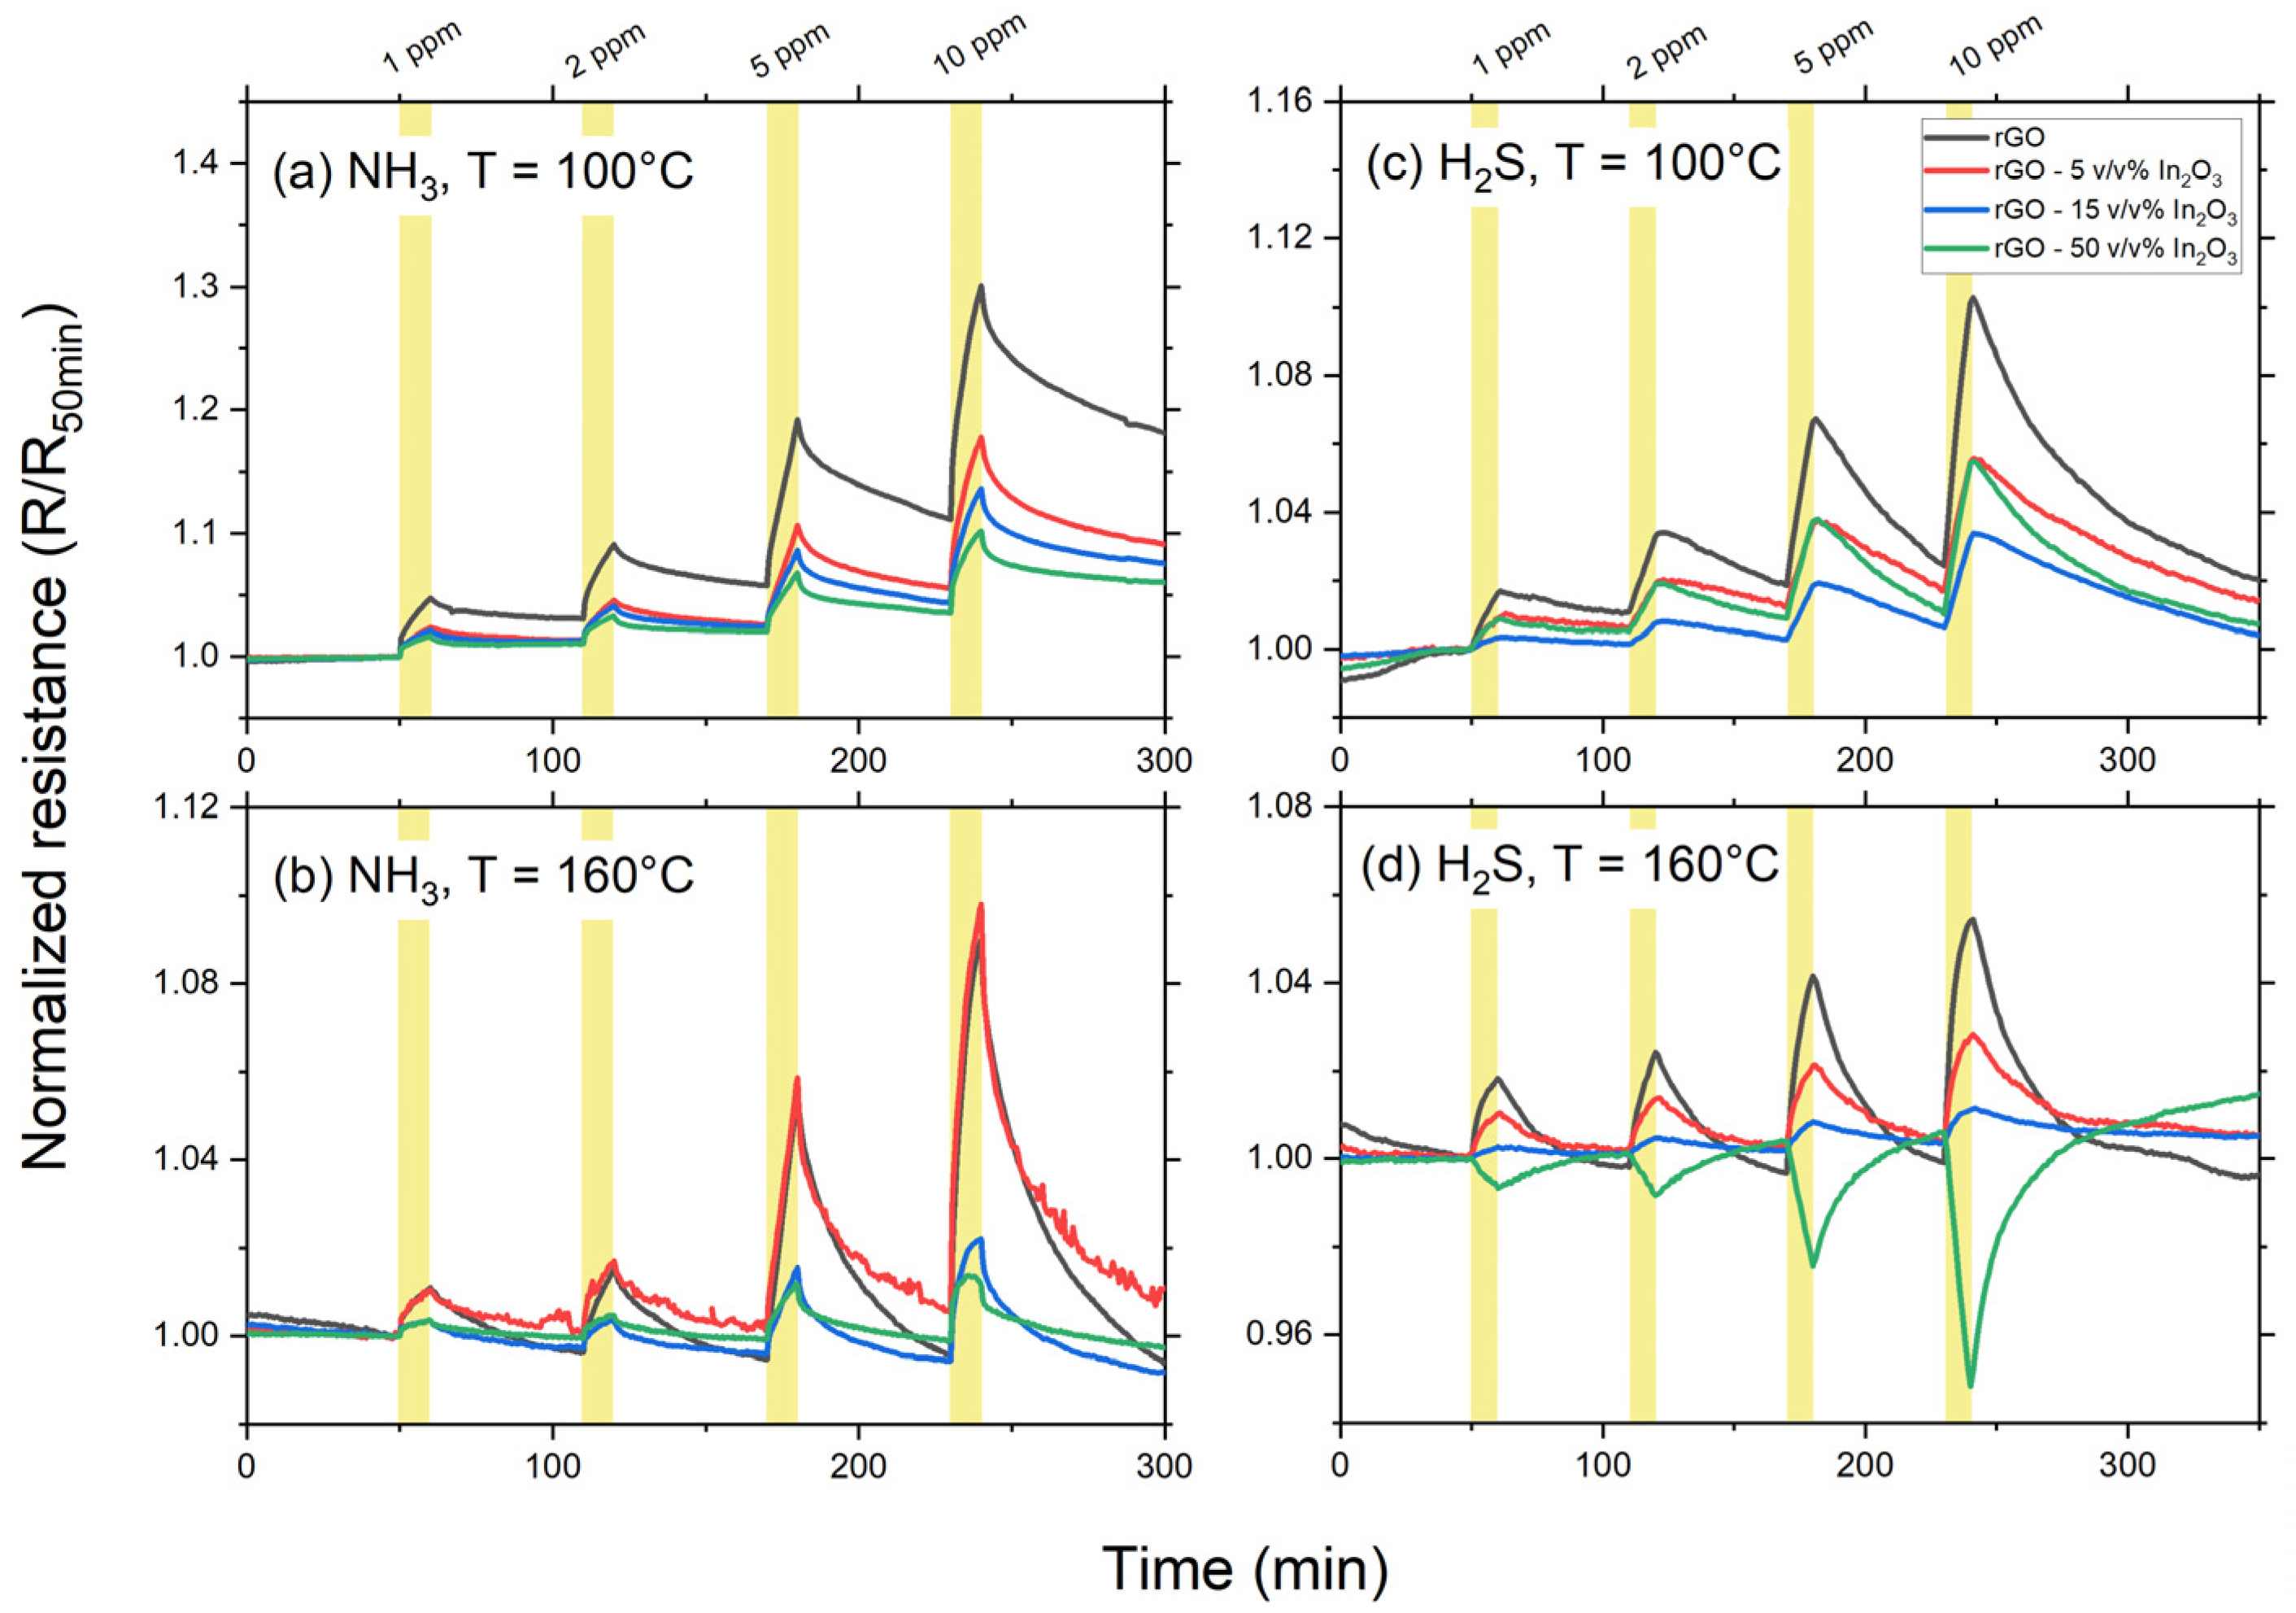
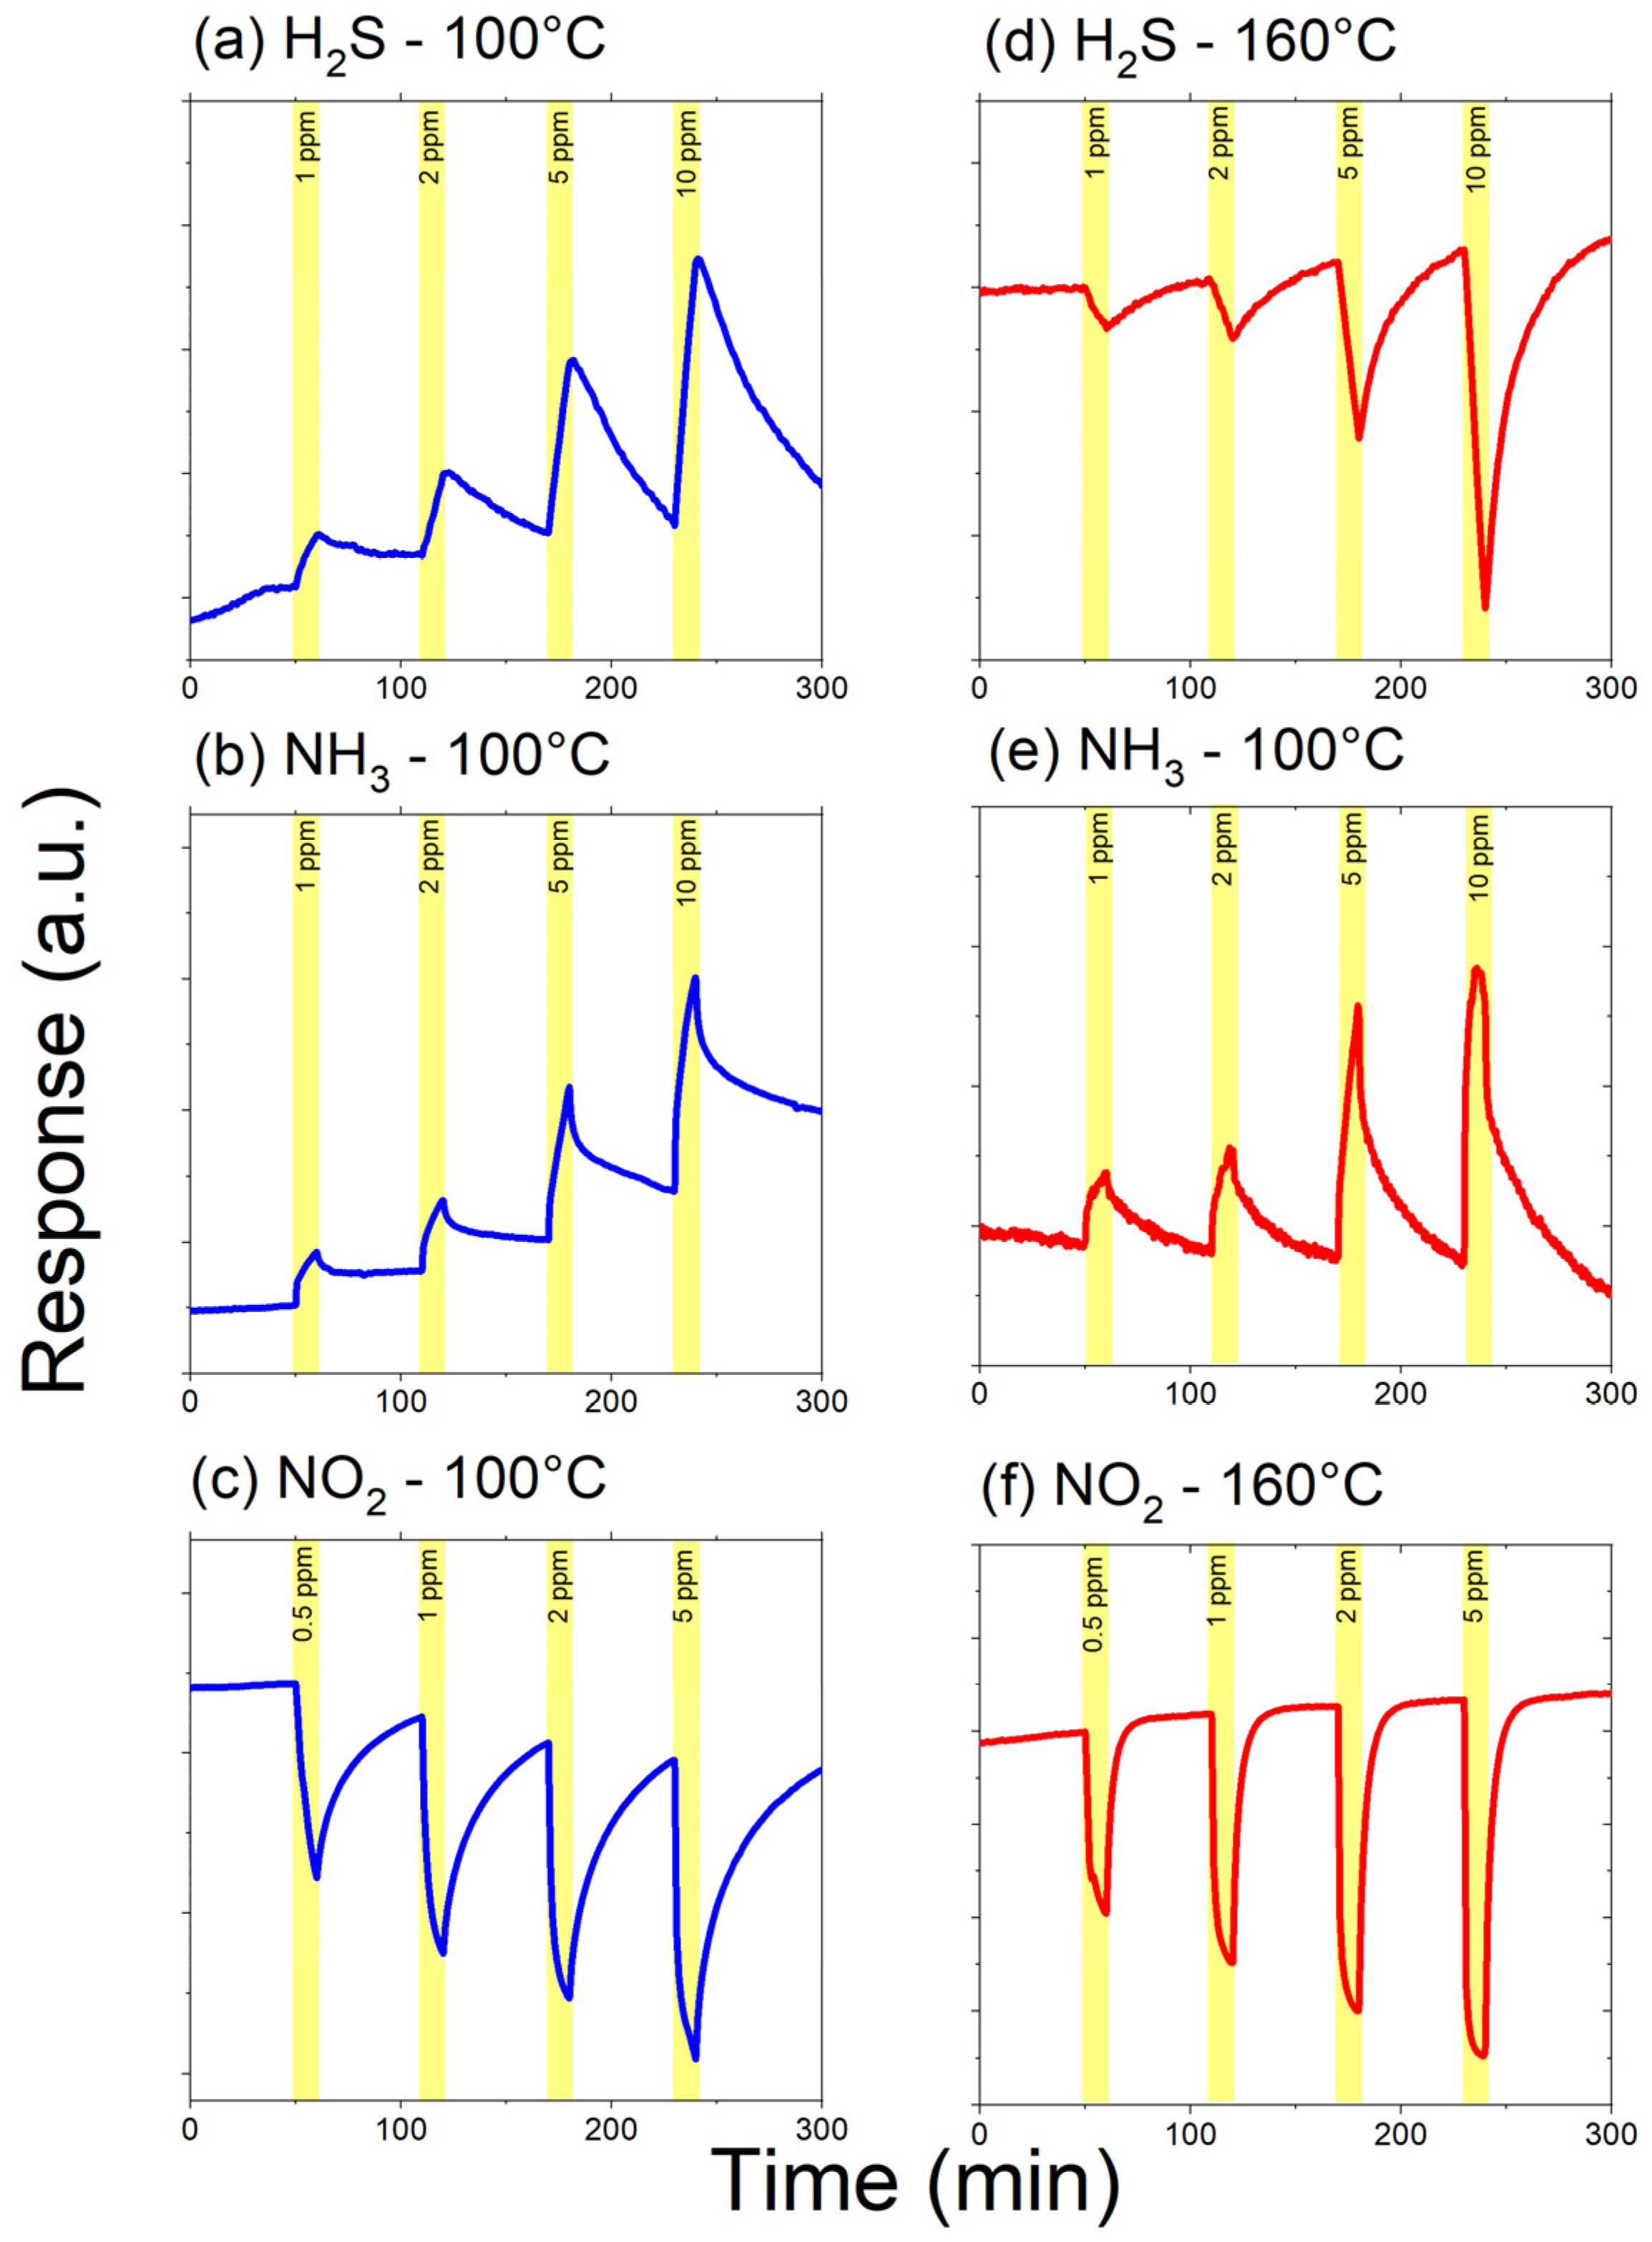
| R(rGO/In2O3) during Gas Exposure | Gas Identified | |
|---|---|---|
| @ 100 °C | @ 160 °C | |
| ↗ | ↘ | H2S |
| ↗ | ↗ | NH3 |
| ↘ | ↘ | NO2 |
Publisher’s Note: MDPI stays neutral with regard to jurisdictional claims in published maps and institutional affiliations. |
© 2022 by the authors. Licensee MDPI, Basel, Switzerland. This article is an open access article distributed under the terms and conditions of the Creative Commons Attribution (CC BY) license (https://creativecommons.org/licenses/by/4.0/).
Share and Cite
de Lima, B.S.; Komorizono, A.A.; Ndiaye, A.L.; Bernardi, M.I.B.; Brunet, J.; Mastelaro, V.R. Tunning the Gas Sensing Properties of rGO with In2O3 Nanoparticles. Surfaces 2022, 5, 127-142. https://0-doi-org.brum.beds.ac.uk/10.3390/surfaces5010006
de Lima BS, Komorizono AA, Ndiaye AL, Bernardi MIB, Brunet J, Mastelaro VR. Tunning the Gas Sensing Properties of rGO with In2O3 Nanoparticles. Surfaces. 2022; 5(1):127-142. https://0-doi-org.brum.beds.ac.uk/10.3390/surfaces5010006
Chicago/Turabian Stylede Lima, Bruno S., Amanda A. Komorizono, Amadou L. Ndiaye, Maria Inês B. Bernardi, Jérôme Brunet, and Valmor R. Mastelaro. 2022. "Tunning the Gas Sensing Properties of rGO with In2O3 Nanoparticles" Surfaces 5, no. 1: 127-142. https://0-doi-org.brum.beds.ac.uk/10.3390/surfaces5010006