Validation Framework for Sleep Stage Scoring in Wearable Sleep Trackers and Monitors with Polysomnography Ground Truth

 ,
,
Abstract
:1. Introduction
2. Methodology
2.1. Data Preparation
2.2. General Features and Sleep Stage Distribution Evaluation
2.3. Localized Quantifier Index
2.4. Statistical Test
3. Results
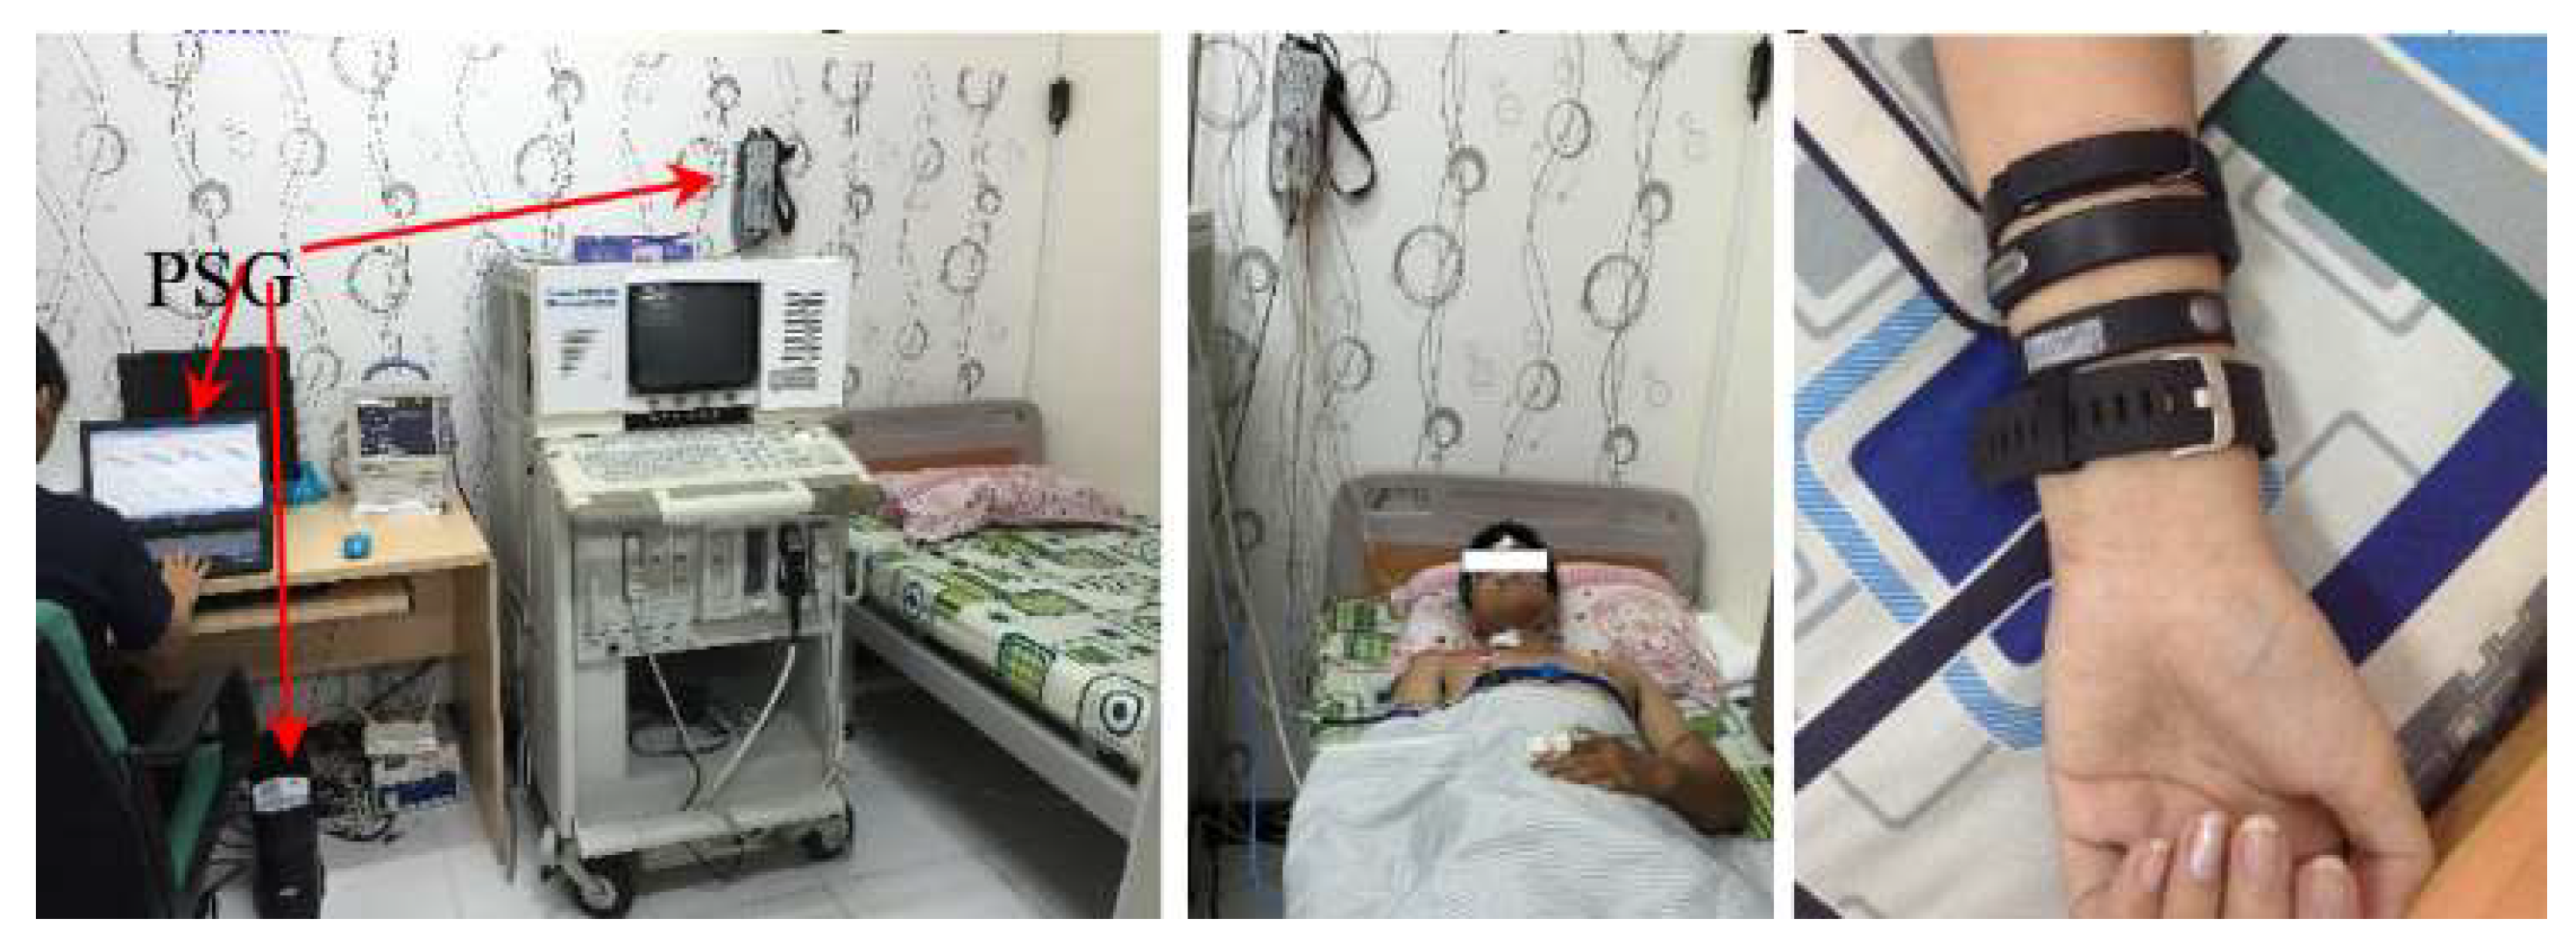
3.1. Experimental Setup and Data Collection
3.2. Wake-Sleep Analysis
3.3. Sleep Stage Distribution Evaluation
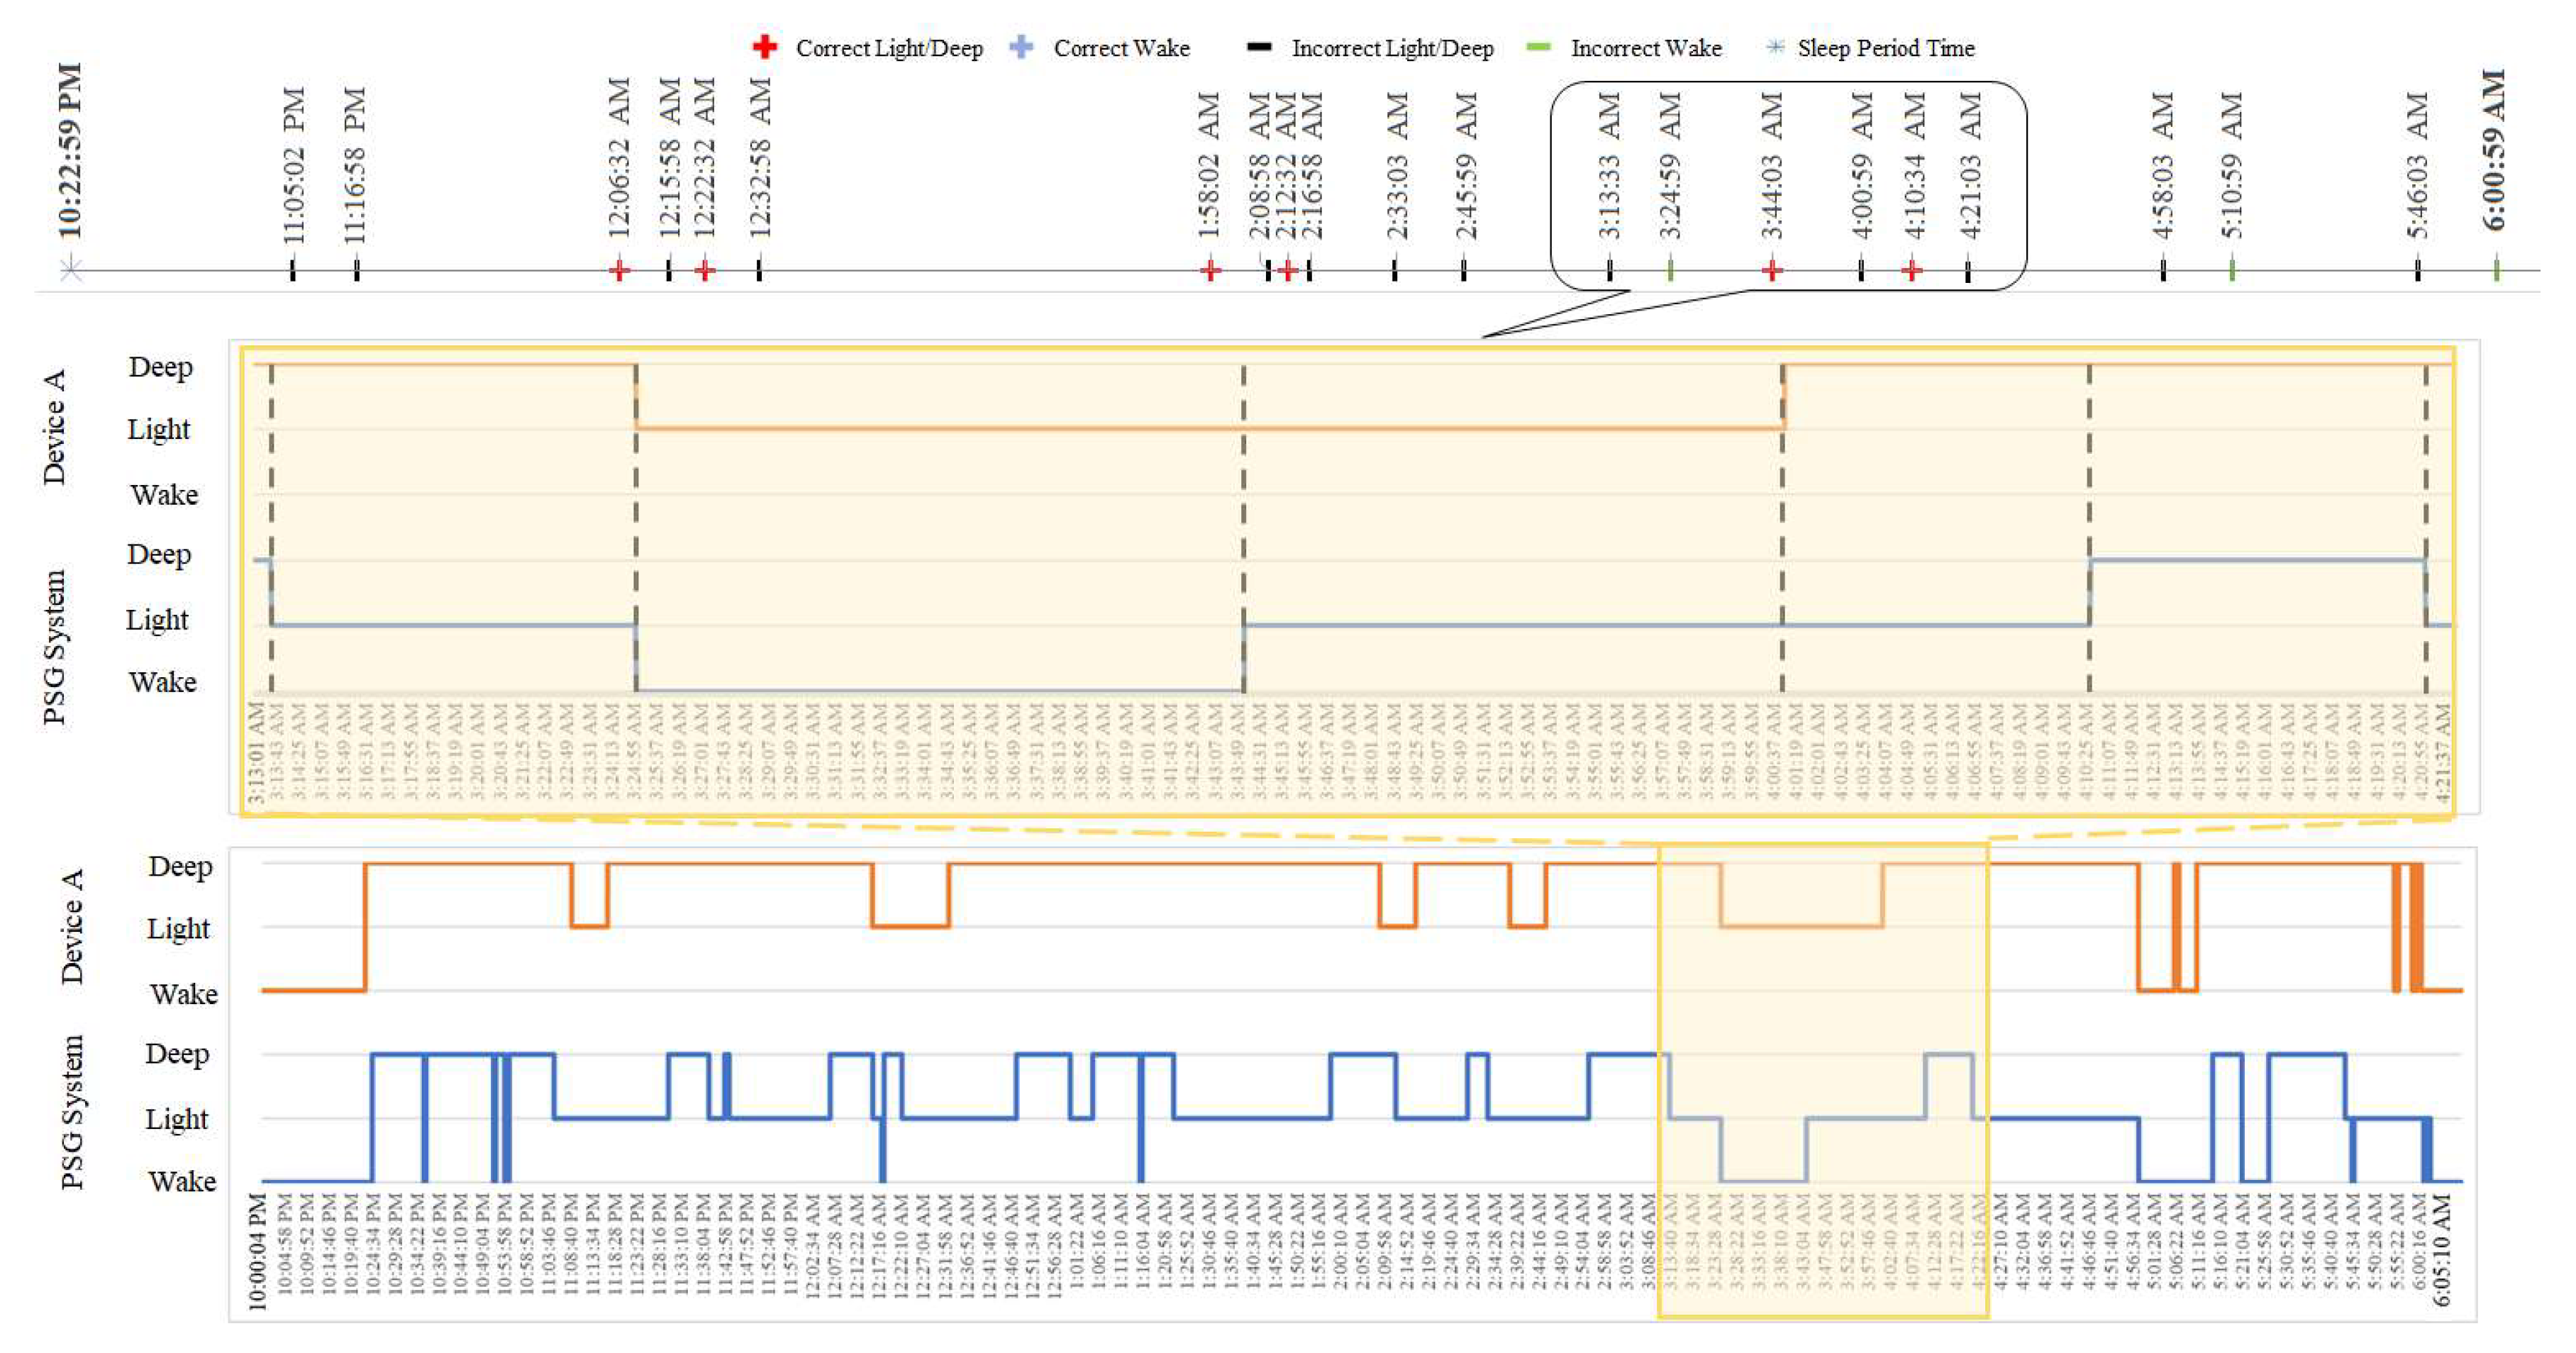
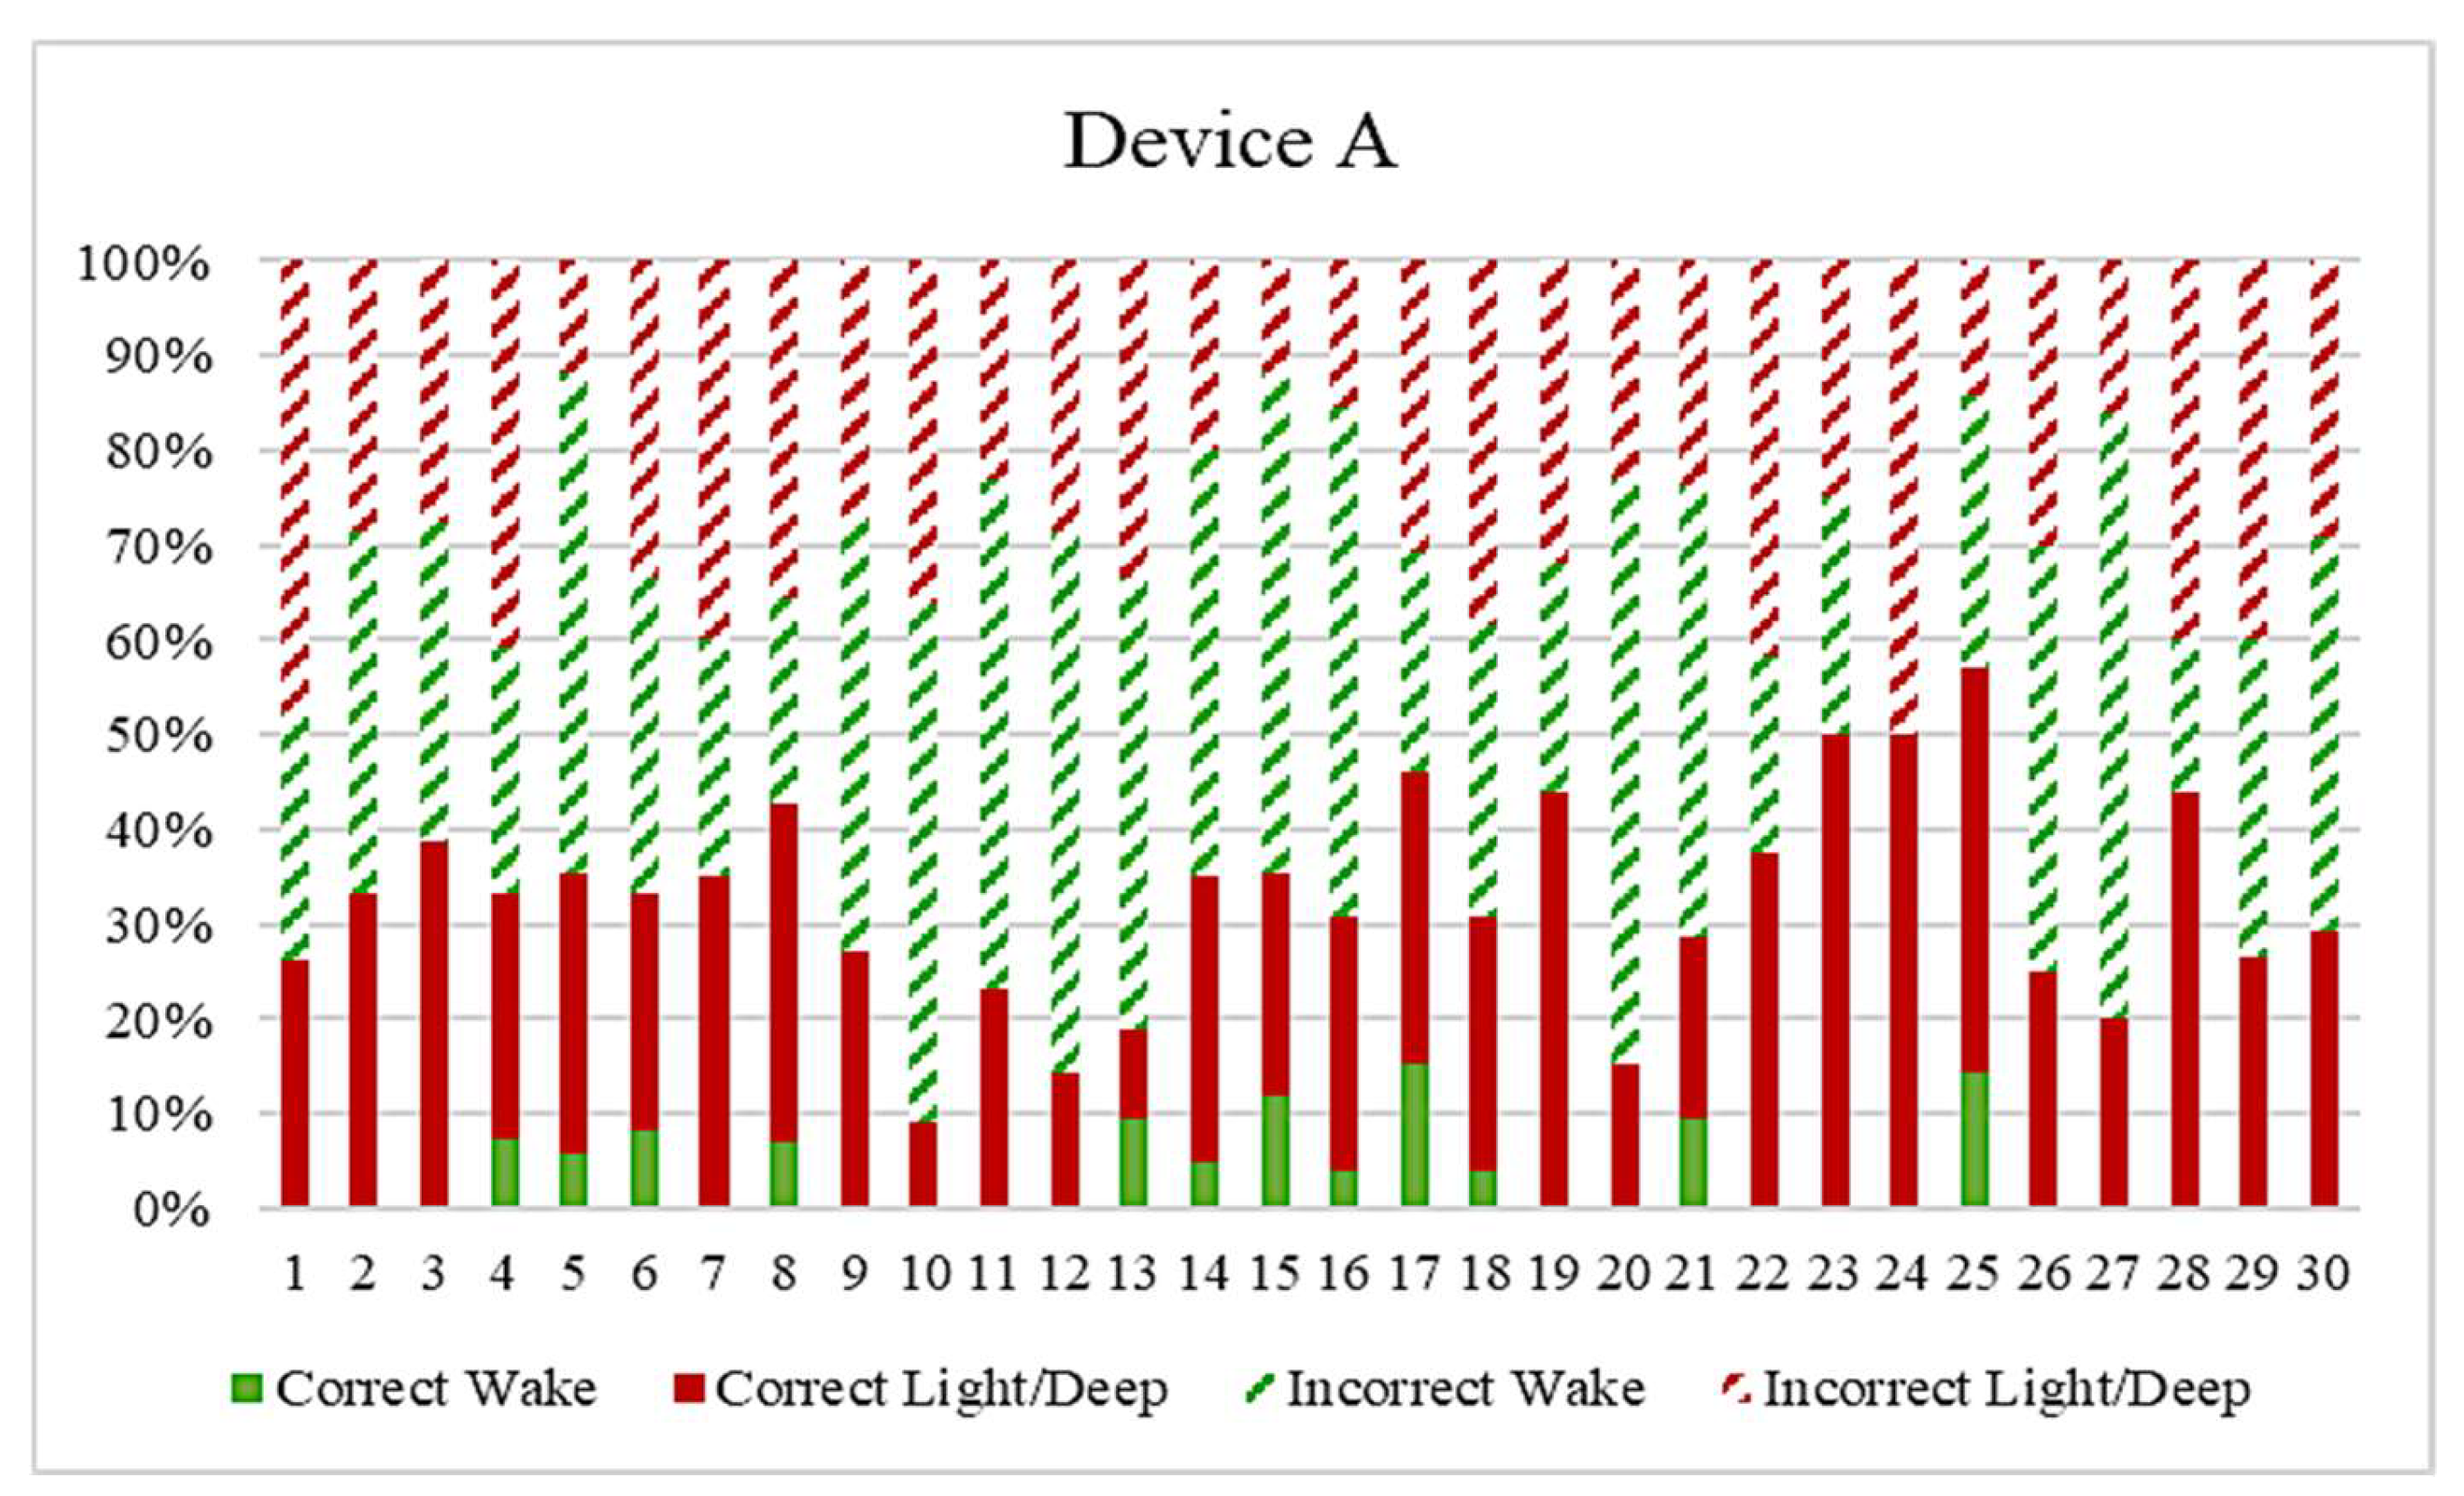
3.4. Localized Mismatch Analysis
3.5. Comparison with Other Methods
4. Discussion and Conclusions
Author Contributions
Funding
Institutional Review Board Statement
Informed Consent Statement
Acknowledgments
Conflicts of Interest
Appendix A

| LMI Value | Device Type I | W–R | W–L | W–D | R–L | R–D | L–D | R–W | L–W | D–W | L–R | D–R | D–L | |
|---|---|---|---|---|---|---|---|---|---|---|---|---|---|---|
| PSG | ∆YW | 1 | 3 | 8 | 2 | 7 | 5 | −1 | −3 | −8 | −2 | −7 | −5 | |
| ∆YP | ||||||||||||||
| W-R | 1 | 1 | 3 | 8 | 2 | 7 | 5 | −1 | −3 | −8 | −2 | −7 | −5 | |
| W-L | 3 | 3 | 9 | 24 | 6 | 21 | 15 | −3 | −9 | −24 | −6 | −21 | −15 | |
| W-D | 8 | 8 | 24 | 64 | 16 | 56 | 40 | −8 | −24 | −64 | −16 | −56 | −40 | |
| R-L | 2 | 2 | 6 | 16 | 4 | 14 | 10 | −2 | −6 | −16 | −4 | −14 | −10 | |
| R-D | 7 | 7 | 21 | 56 | 14 | 49 | 35 | −7 | −21 | −56 | −14 | −49 | −35 | |
| L-D | 5 | 5 | 15 | 40 | 10 | 35 | 25 | −5 | −15 | −40 | −10 | −35 | −25 | |
| R-W | −1 | −1 | −3 | −8 | −2 | −7 | −5 | 1 | 3 | 8 | 2 | 7 | 5 | |
| L-W | −3 | −3 | −9 | −24 | −6 | −21 | −15 | 3 | 9 | 24 | 6 | 21 | 15 | |
| D-W | −8 | −8 | −24 | −64 | −16 | −56 | −40 | 8 | 24 | 64 | 16 | 56 | 40 | |
| L-R | −2 | −2 | −6 | −16 | −4 | −14 | −10 | 2 | 6 | 16 | 4 | 14 | 10 | |
| D-R | −7 | −7 | −21 | −56 | −14 | −49 | −35 | 7 | 21 | 56 | 14 | 49 | 35 | |
| D-L | −5 | −5 | −15 | −40 | −10 | −35 | −25 | 5 | 15 | 40 | 10 | 35 | 25 | |
References
- Poyares, D.; Hirotsu, C.; Tufik, S. Fitness tracker to assess sleep: Beyond the market. Sleep 2015, 38, 1351. [Google Scholar] [CrossRef]
- Kolla, B.P.; Mansukhani, S.; Mansukhani, M.P. Consumer sleep tracking devices: A review of mechanisms, validity and utility. Expert Rev. Med. Devices 2016, 13, 497–506. [Google Scholar] [CrossRef]
- Kripke, D.F.; Mullaney, D.; Messin, S.; Wyborney, V.G. Wrist actigraphic measures of sleep and rhythms. Electroencephalogr. Clin. Neurophysiol. 1978, 44, 674–676. [Google Scholar] [CrossRef]
- Webster, J.B.; Kripke, D.F.; Messin, S.; Mullaney, D.J.; Wyborney, G. An activity-based sleep monitor system for ambulatory use. Sleep 1982, 5, 389–399. [Google Scholar] [CrossRef] [PubMed] [Green Version]
- Cole, R.J.; Kripke, D.F.; Gruen, W.; Mullaney, D.J.; Gillin, J.C. Automatic sleep/wake identification from wrist activity. Sleep 1992, 15, 461–469. [Google Scholar] [CrossRef] [PubMed]
- Jean-Louis, G.; Kripke, D.F.; Cole, R.J.; Assmus, J.D.; Langer, R.D. Sleep detection with an accelerometer actigraph: Comparisons with polysomnography. Physiol. Behav. 2001, 72, 21–28. [Google Scholar] [CrossRef]
- Sadeh, A. The role and validity of actigraphy in sleep medicine: An update. Sleep Med. Rev. 2011, 15, 259–267. [Google Scholar] [CrossRef] [PubMed]
- Sadeh, A.; Hauri, P.J.; Kripke, D.F.; Lavie, P. The role of actigraphy in the evaluation of sleep disorders. Sleep 1995, 18, 288–302. [Google Scholar] [CrossRef]
- Quante, M.; Kaplan, E.R.; Cailler, M.; Rueschman, M.; Wang, R.; Weng, J.; Taveras, E.M.; Redline, S. Actigraphy-based sleep estimation in adolescents and adults: A comparison with polysomnography using two scoring algorithms. Nat. Sci. Sleep 2018, 10, 13. [Google Scholar] [CrossRef] [Green Version]
- Seneviratne, S.; Hu, Y.; Nguyen, T.; Lan, G.; Khalifa, S.; Thilakarathna, K.; Hassan, M.; Seneviratne, A. A survey of wearable devices and challenges. IEEE Commun. Surv. Tutor. 2017, 19, 2573–2620. [Google Scholar] [CrossRef]
- Le, T.Q.; Cheng, C.; Sangasoongsong, A.; Wongdhamma, W.; Bukkapatnam, S.T. Wireless wearable multisensory suite and real-time prediction of obstructive sleep apnea episodes. IEEE J. Transl. Eng. Health Med. 2013, 1, 2700109. [Google Scholar] [CrossRef]
- Penzel, T. Technology to Assess Sleep, An Issue of Sleep Medicine Clinics; Elsevier Health Sciences: Amsterdam, The Netherlands, 2016; Volume 11. [Google Scholar]
- So, K.; Buckley, P.; Adamson, T.M.; Horne, R.S. Actigraphy correctly predicts sleep behavior in infants who are younger than six months, when compared with polysomnography. Pediatric Res. 2005, 58, 761–765. [Google Scholar] [CrossRef] [Green Version]
- Suzuki, T.; Ouchi, K.; Kameyama, K.-i.; Takahashi, M. Development of a Sleep Monitoring System with Wearable Vital Sensor for Home Use. In BioDevices; pp. 326–331. Available online: citeseerx.ist.psu.edu/viewdoc/download?doi=10.1.1.462.5715&rep=rep1&type=pdf (accessed on 1 May 2021).
- Cartwright, R.; Baehr, E.; Kirkby, J.; Pandi-Perumal, S.; Kabat, J. REM sleep reduction, mood regulation and remission in untreated depression. Psychiatry Res. 2003, 121, 159–167. [Google Scholar] [CrossRef]
- Hoffmann, G.; Conrad, M.O.; Qiu, D.; Kamper, D.G. Contributions of voluntary activation deficits to hand weakness after stroke. Top. Stroke Rehabil. 2016, 23, 384–392. [Google Scholar] [CrossRef] [PubMed]
- Karandikar, K.; Le, T.Q.; Sa-ngasoongsong, A.; Wongdhamma, W.; Bukkapatnam, S.T. Detection of sleep apnea events via tracking nonlinear dynamic cardio-respiratory coupling from electrocardiogram signals. In Proceedings of the 2013 6th International IEEE/EMBS Conference on Neural Engineering (NER), San Diego, CA, USA, 6–8 November 2013; pp. 1358–1361. [Google Scholar]
- Sivertsen, B.; Omvik, S.; Havik, O.; Pallesen, S.; Bjorvatn, B.; Nielsen, G.; Straume, S.; Nordhus, I. A comparison of actigraphy and polysomnography in older adults treated for chronic primary insomnia. Sleep 2006, 29, 1353–1358. [Google Scholar] [CrossRef] [Green Version]
- Kaplan, K.A.; Talbot, L.S.; Gruber, J.; Harvey, A.G. Evaluating sleep in bipolar disorder: Comparison between actigraphy, polysomnography, and sleep diary. Bipolar Disord. 2012, 14, 870–879. [Google Scholar] [CrossRef] [PubMed] [Green Version]
- de Souza, L.; Benedito-Silva, A.A.; Pires, M.L.N.; Poyares, D.; Tufik, S.; Calil, H.M. Further validation of actigraphy for sleep studies. Sleep 2003, 26, 81–85. [Google Scholar] [CrossRef] [Green Version]
- Marino, M.; Li, Y.; Rueschman, M.N.; Winkelman, J.W.; Ellenbogen, J.; Solet, J.M.; Dulin, H.; Berkman, L.F.; Buxton, O.M. Measuring sleep: Accuracy, sensitivity, and specificity of wrist actigraphy compared to polysomnography. Sleep 2013, 36, 1747–1755. [Google Scholar] [CrossRef] [PubMed]
- Meltzer, L.J.; Walsh, C.M.; Traylor, J.; Westin, A. Direct comparison of two new actigraphs and polysomnography in children and adolescents. Sleep 2012, 35, 159–166. [Google Scholar] [CrossRef] [Green Version]
- Danker-Hopfe, H.; Anderer, P.; Zeitlhofer, J.; Boeck, M.; Dorn, H.; Gruber, G.; Heller, E.; Loretz, E.; Moser, D.; Parapatics, S. Interrater reliability for sleep scoring according to the Rechtschaffen & Kales and the new AASM standard. J. Sleep Res. 2009, 18, 74–84. [Google Scholar]
- Berry, R.B.; Brooks, R.; Gamaldo, C.E.; Harding, S.M.; Marcus, C.; Vaughn, B. The AASM Manual for the Scoring of Sleep and Associated Events: Rules, Terminology and Technical Specifications; American Academy of Sleep Medicine: Darien, IL, USA, 2012. [Google Scholar]
- Nguyen, Q.N.T.; Bui, P.N.; Le, T.Q.; Nguyen, H.H.; Nguyen, C.T.; Bui, L.X. In Vivo Comparison of Sleep Stage Scoring between Commercialized Wearable Devices and Polysomnography System. In 6th International Conference on the Development of Biomedical Engineering in Vietnam; Springer: Singapore, 2017. [Google Scholar]
- Cu, H.; Nguyen, T.; Nguyen, T.; Le, T.; Van, T.V. Validation of Wireless Wearable Electrocardiogram System for Real-Time Ambulatory Cardiac Monitoring. In International Conference on the Development of Biomedical Engineering in Vietnam; Springer: Singapore, 2017; pp. 771–777. [Google Scholar]
- Landis, J.R.; Koch, G.G. The measurement of observer agreement for categorical data. Biometrics 1977, 33, 159–174. [Google Scholar] [CrossRef] [PubMed] [Green Version]
- Hirshkowitz, M.; Whiton, K.; Albert, S.M.; Alessi, C.; Bruni, O.; DonCarlos, L.; Hazen, N.; Herman, J.; Katz, E.S.; Kheirandish-Gozal, L. National Sleep Foundation’s sleep time duration recommendations: Methodology and results summary. Sleep Health 2015, 1, 40–43. [Google Scholar] [CrossRef] [PubMed]
- Benca, R.M.; Obermeyer, W.H.; Thisted, R.A.; Gillin, J.C. Sleep and psychiatric disorders: A meta-analysis. Arch. Gen. Psychiatry 1992, 49, 651–668. [Google Scholar] [CrossRef] [PubMed]
- Azagra Calero, E.; Espinar-Escalona, E.; Barrera Mora, J.M.; Llamas, J.; Solano Reina, E. Obstructive sleep apnea syndrome (OSAS). Review of the literature. Med. Oral Patol. Oral Cir. Bucal. 2012, 17, 925–929. [Google Scholar] [CrossRef] [PubMed]
- Lee, J.-M.; Byun, W.; Keill, A.; Dinkel, D.; Seo, Y. Comparison of Wearable Trackers’ Ability to Estimate Sleep. Int. J. Environ. Res. Public Health 2018, 15, 1265. [Google Scholar] [CrossRef] [Green Version]
- Herscovici, S.; Pe’er, A.; Papyan, S.; Lavie, P. Detecting REM sleep from the finger: An automatic REM sleep algorithm based on peripheral arterial tone (PAT) and actigraphy. Physiol. Meas. 2006, 28, 129. [Google Scholar] [CrossRef] [Green Version]
- Bresler, M.a.; Sheffy, K.; Pillar, G.; Preiszler, M.; Herscovici, S. Differentiating between light and deep sleep stages using an ambulatory device based on peripheral arterial tonometry. Physiol. Meas. 2008, 29, 571. [Google Scholar] [CrossRef] [PubMed]


| Sleep Stages | ||||||
|---|---|---|---|---|---|---|
| PSG | Wake | N1 | N2 | N3 | REM | |
| Wearable Devices | ||||||
| Type I | Wake | Light | Deep | REM | ||
| Type II | Wake | Light | Deep | |||
| Category | Features | Description | Formula | Unit | |
|---|---|---|---|---|---|
| Total sleep time (TST) | Time spent on sleeping during sleep period time (SPT) | TST = TLST + TDST + TRST | min | ||
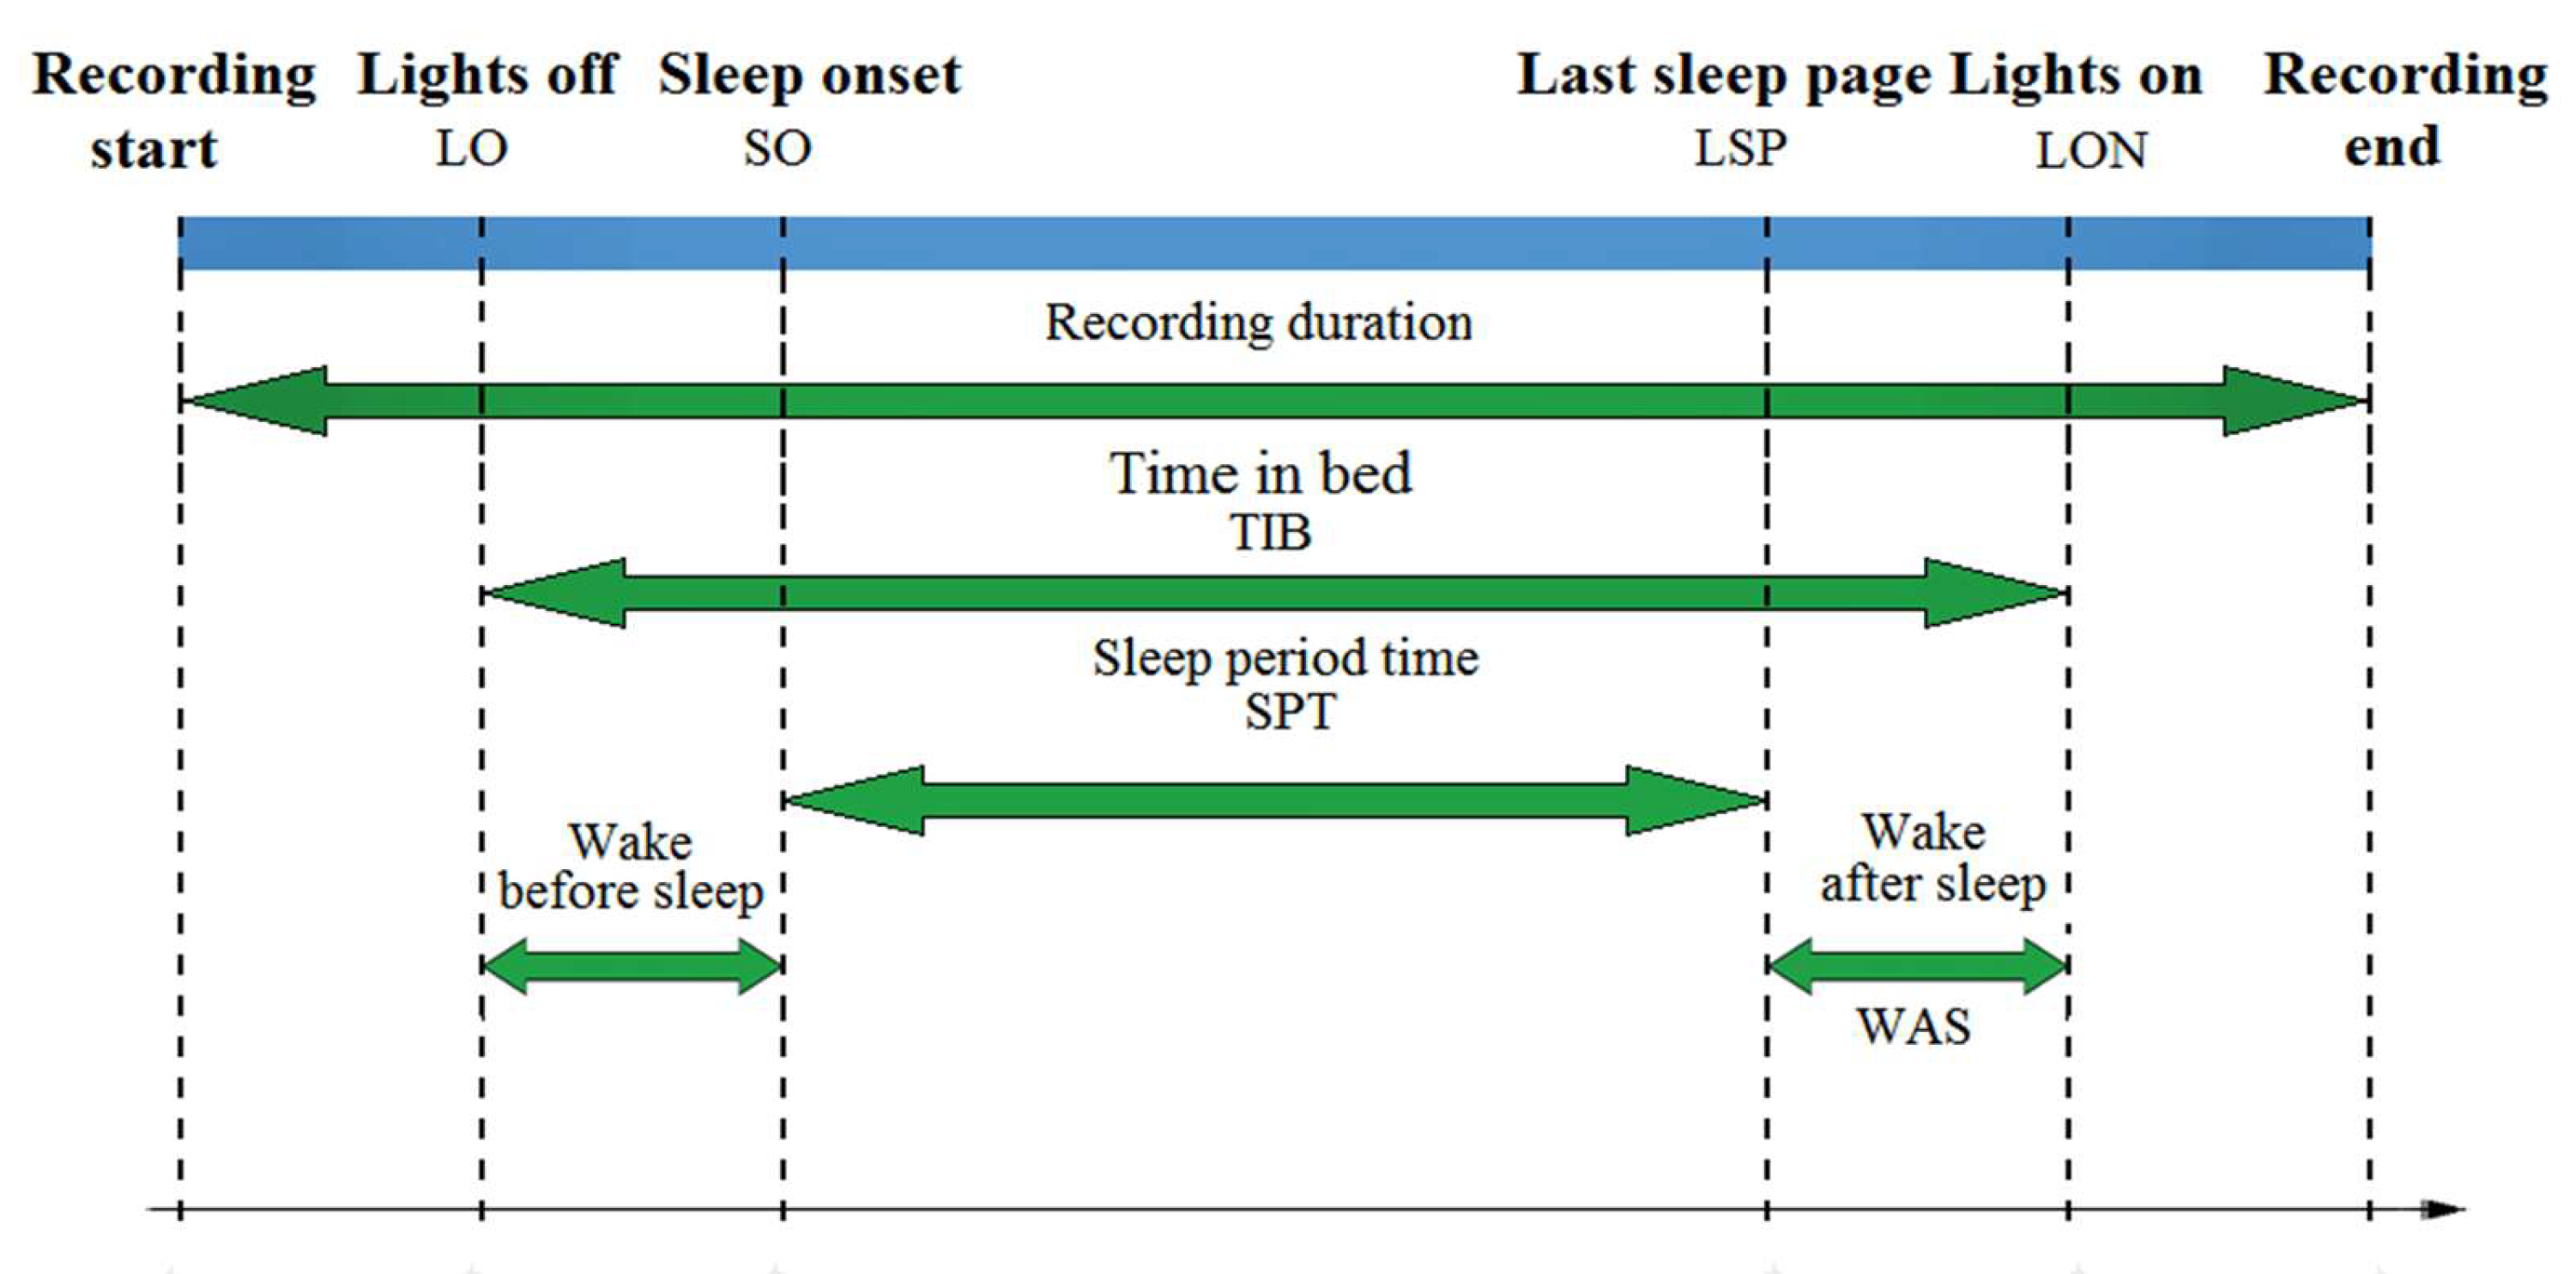
| Wake-sleep features | Sleep quality | Sleep period time (SPT) | Elapsed time from sleep onset (SO) to last epoch of sleep (LSP) | SPT = LSP-SO | min |
| Sleep efficiency (SE) | Ratio of total sleep time (TST) to sleep period time (SPT) | SE = TST/SPT | % | ||
| Sleep disturbance | Wakefulness after sleep onset (WASO) | Awake time (AWT) during sleep onset (SO) to lights on (LO) [30] | WASO = SPT-TST+WAS | min | |
| Wake-sleep transition | Sleep onset (SO) | The point of time when the subject undergoes a transition from wakefulness into sleep. | 1st N1/N2/N3/REM | hh:mm:ss | |
| Sleep stage distribution | Percentage of light sleep (PLS) | Ratio of total light sleep time (TLST) over total sleep time (TST) | PLS = TLST/TST | % | |
| Percentage of deep sleep (PDS) | Ratio of total deep sleep time (TDST) over total sleep time (TST) | PDS = TDST/TST | % | ||
| Percentage of REM sleep (PRS) | Ratio of total REM sleep time (TRST) over total sleep time (TST) | PRS = TRST/TST | % | ||
| LMI Value | Device Type II | W–L | W–D | L–D | L–W | D–L | D–W | |
|---|---|---|---|---|---|---|---|---|
| PSG | ∆YW | 1 | 3 | 2 | −1 | −2 | −3 | |
| ∆YP | ||||||||
| W-L | 1 | 1 | 3 | 2 | −1 | −2 | −3 | |
| W-D | 3 | 3 | 9 | 6 | −3 | −6 | −9 | |
| L-D | 2 | 2 | 6 | 4 | −2 | −4 | −6 | |
| L-W | −1 | −1 | −3 | −2 | 1 | 2 | 3 | |
| D-L | −2 | −2 | −6 | −4 | 2 | 4 | 6 | |
| D-W | −3 | −3 | −9 | −6 | 3 | 6 | 9 | |
| -Data preparation +Synchronize and align the data using clock time of the host computer +Specify the AASM sleep scoring category of the wearable device +Establish agreement among sleep raters on the PSG hypgram -General features and sleep stage distribution evaluation +Extract general sleep features +Extract sleep state distribution features -Localized quantifier estimation +Construct the hypnographic states of wearable device +Construct the hypnographic states of PSG +Compute sleep state difference and +Detect epochs with sleep stage transition as +Estimate sleep stage correlation indexes +Determine the correct and incorrect sleep transition epoch based on the -Overall evaluation +Estimate ρ and η2 for wake-sleep features and sleep stage distribution comparison +Estimate the percentage of the correct sleep stage transition +Estimate sensitivity, specificity, and accuracy from percentage of correct transition of each sleep stage. |
| Features | PSG and Device A | PSG and Device B | PSG and Device C | PSG and Device D |
|---|---|---|---|---|
| SPT | (*)ρ = 0.005 η2 = 0.572 | (*)ρ = 0.001 η2 = 0.717 | (*)ρ = 0.027 η2 = 0.297 | (*)ρ < 0.001 η2 = 0.782 |
| SE | (*)ρ = <0.001 η2 = 4.613 | (*)ρ <0.001 η2 = 5.566 | (*)ρ = 0.039 η2 = 2.301 | (*)ρ = 0.001 η2 = 3.365 |
| WASO | (*)ρ <0.001 η2 = −19.508 | (*)ρ <0.001 η2 = −24.017 | (*)ρ = 0.032 η2 = −9.492 | (*)ρ = 0.002 η2 = −14.500 |
| SO | (*)ρ <0.001 η2 = 0.083 | (*)ρ <0.001 η2 = 0.083 | (*)ρ = 0.042 η2 = 0.034 | (*)ρ = 0.001 η2 = 0.079 |
| Device A (Accelerometer Sensor) and PSG | Device B (Accelerometer Sensor, Optical Sensor) and PSG | Device C (Accelerometer sensor, Bio-Impedance Sensor) and PSG | Device D (Accelerometer Sensor) and PSG | |
|---|---|---|---|---|
| PLS | (**) ρ = 0.254 η2 = 0.250 | (*) ρ < 0.001 η2 = 6.638 | (*) ρ = 0.001 η2 = 0.898 | (*) ρ = 0.002η2 = 0.853 |
| PDS | (*) ρ < 0.001 η2 = 1.373 | |||
| PRS | (**) ρ = 0.820; η2 = 0.057 |
| Correct Transition Rate | Incorrect Transition Rate | |
|---|---|---|
| Device A | 31.83% | 68.17% |
| Device B | 24.35% | 75.65% |
| Device C | 24.66% | 75.34% |
| Device D | 28.86% | 71.14% |
| Wearable Devices | Wake | Light | Deep | REM | Acc. | ||||
|---|---|---|---|---|---|---|---|---|---|
| Sen. | Spec. | Sen. | Spec. | Sen. | Spec. | Sen. | Spec | ||
| Device A | 9.24 | 99.17 | 55.94 | 43.75 | 50.91 | 64.36 | 65.10 | ||
| Device B | 3.39 | 99.92 | 2.87 | 92.97 | 98.70 | 8.71 | 61.75 | ||
| Device D | 27.88 | 98.57 | 41.40 | 62.10 | 65.76 | 51.63 | 66.38 | ||
| Device C | 40.17 | 95.54 | 73.30 | 47.81 | 28.07 | 92.93 | 25.01 | 84.51 | 40.17 |
| General Sleep Feature Evaluation | Proposed Method (ρ Statistic) | Pearson Correlation (r Statistic) [19,22] | Pairwise Comparison (Two-Way ANOVA) [19,22] |
|---|---|---|---|
| SPT | Device C, A, B and D | Device C, D, A and B | Device C, A, D and B |
| SE | Device C, D, A and B | Device C, D, A and B | Device C, D, A and B |
| WASO | Device C, D, A and B | Device C, D, A and B | Device C, D, A and B |
| SO | Device C, D, A and B | Device C, D, A and B | Device C, D, B and A |
| Sleep Distribution Evaluation | Proposed Methods | Tryon’s Approach [18,22] |
|---|---|---|
| Light | Device A, D, C and B | Device C, D, A and B |
| Deep | Device A, D, C and B | |
| REM | Not significantly different |
Publisher’s Note: MDPI stays neutral with regard to jurisdictional claims in published maps and institutional affiliations. |
© 2021 by the authors. Licensee MDPI, Basel, Switzerland. This article is an open access article distributed under the terms and conditions of the Creative Commons Attribution (CC BY) license (https://creativecommons.org/licenses/by/4.0/).
Share and Cite
Nguyen, Q.N.T.; Le, T.; Huynh, Q.B.T.; Setty, A.; Vo, T.V.; Le, T.Q. Validation Framework for Sleep Stage Scoring in Wearable Sleep Trackers and Monitors with Polysomnography Ground Truth. Clocks & Sleep 2021, 3, 274-288. https://0-doi-org.brum.beds.ac.uk/10.3390/clockssleep3020017
Nguyen QNT, Le T, Huynh QBT, Setty A, Vo TV, Le TQ. Validation Framework for Sleep Stage Scoring in Wearable Sleep Trackers and Monitors with Polysomnography Ground Truth. Clocks & Sleep. 2021; 3(2):274-288. https://0-doi-org.brum.beds.ac.uk/10.3390/clockssleep3020017
Chicago/Turabian StyleNguyen, Quyen N. T., Toan Le, Quyen B. T. Huynh, Arveity Setty, Toi V. Vo, and Trung Q. Le. 2021. "Validation Framework for Sleep Stage Scoring in Wearable Sleep Trackers and Monitors with Polysomnography Ground Truth" Clocks & Sleep 3, no. 2: 274-288. https://0-doi-org.brum.beds.ac.uk/10.3390/clockssleep3020017