
Baseline Examinations and Autoclave Tests of 65 and 100 dpa Flux Thimble Tube O-Ring Specimens


1
VTT Technical Research Centre of Finland, 02044 Espoo, Finland
2
Ringhals AB, 432 85 Väröbacka, Sweden
3
Department of Solid Mechanics, Royal Institute of Technology (KTH), 10044 Stockholm, Sweden
*
Author to whom correspondence should be addressed.
Corros. Mater. Degrad. 2021, 2(2), 248-273; https://0-doi-org.brum.beds.ac.uk/10.3390/cmd2020014
Submission received: 19 March 2021
/
Revised: 17 April 2021
/
Accepted: 18 May 2021
/
Published: 25 May 2021
(This article belongs to the Special Issue Corrosion and Materials Degradation under Irradiation: From Understanding to Mitigation…)
Abstract
:This paper describes the methods and results of analytical TEM examinations and autoclave testing of two highly-irradiated flux thimble tube materials harvested from a commercial pressurized water reactor. The materials are cold-worked 316L, and accumulated 65 dpa and 100 dpa of radiation dose. To set the baseline for a broader study, the materials were examined in the as-irradiated condition and tested as O-ring specimens at relatively high constant loads in simulated PWR water conditions. Tests were also conducted with elevated hydrogen. For a given load, more rapid cracking was associated with higher radiation dose, and with the elevated hydrogen.
1. Introduction
Neutron irradiation causes nano-scale damage and hardening in austenitic stainless steels, resulting in a significant effect on the mechanical properties of the materials. The change in properties can impact the behavior of core components in service. Irradiation-assisted stress corrosion cracking (IASCC) is an issue affecting safe long-term operation of pressurized water reactors (PWRs), most recently in terms of baffle former bolt failures. The combined action of stress, the primary water environment, and the neutron irradiation-induced microstructure lead to a complex scenario in which the austenitic stainless steels (generally 316L or 347) fail in a primarily intergranular mode.
Reactor internal component cracking by the IASCC mechanism was first observed in boiling water reactors (BWRs), but a few failures in the mid to late 1980s were observed also in PWR components. These included cracking in Type 304 stainless steel control rod cladding reported by Westinghouse in 1987. Because of these early indications, PWR IASCC feasibility studies were carried out at Westinghouse with support of the Westinghouse Owners Group. The studies of Westinghouse were probably the first to verify that IASCC was a phenomenon of concern in PWRs [1]. As a consequence of the observed risk for IASCC in the operating LWRs, the Electric Power Research Institute (EPRI) initiated a Co-operative IASCC Research Program (CIR) in 1995. The international program had participants from utilities, regulators, research organizations and vendors. The aim was to develop a mechanistic understanding of IASCC, derive a predictive model for IASCC, and identify possible countermeasures against IASCC.
Perhaps the most easily recoverable stainless steel irradiated to high neutron dose in a PWR is the steel from flux thimble tubes (FTTs). In the Westinghouse tests initiated in 1988, stressed cold worked Type 316 stainless steel C-rings prepared from FTTs were exposed to a simulated PWR environment in a static autoclave. Rapidly occurring intergranular cracking was observed. Reference tests were performed in air, which did not result in intergranular cracking. Based on these results, a second study with better controlled water chemistry was started after the first study, and was completed in 1990. The tests were performed in an autoclave with flowing water (autoclave volume 2 liters and flow rate 100 mL/h) in PWR water at 330 °C with 1200 ppm B (added as H3BO3), 2.2 ppm Li (added as LiOH), <5 ppb dissolved oxygen, and 30 cc/kg H2O dissolved hydrogen [1].
The tests were performed following the instructions in ASTM Standard Practice G382. In this practice, C-rings are either squeezed together or spread apart to load either the inside or outside surface. In the Westinghouse tests, load was applied by bolt loading the specimens within stiff stainless steel clamps. After that, the specimens were exposed to the test environment and periodically examined visually for cracking. Shogan and Mager selected this procedure because it is relatively easy and inexpensive to perform in a hot cell environment. By this method, it is also possible to tests a large number of specimens loaded to individual load levels simultaneously [1].
The primary conclusion of the two initial Westinghouse studies was that IASCC of austenitic stainless steel reactor internal materials is possible in PWR coolant at low corrosion potentials. It was also noted that crack initiation may be quick and the crack growth rate fast at high neutron doses and stresses. The results also suggested that there is a large heat-to-heat variability in the IASCC susceptibility of the PWR internal materials [1].
Since the IASCC initiation studies at Westinghouse on the C-rings, tests on irradiated C-rings have been done in many laboratories in order to determine the effects of, e.g., water chemistry, temperature, neutron dose and heat-to-heat variation on the IASCC stress threshold, micro-mechanisms, and prediction models. Moreover, in-pile testing has been used in test reactors. Most often the specimens have been bolt loaded as was the case in the Westinghouse tests [2,3,4,5].
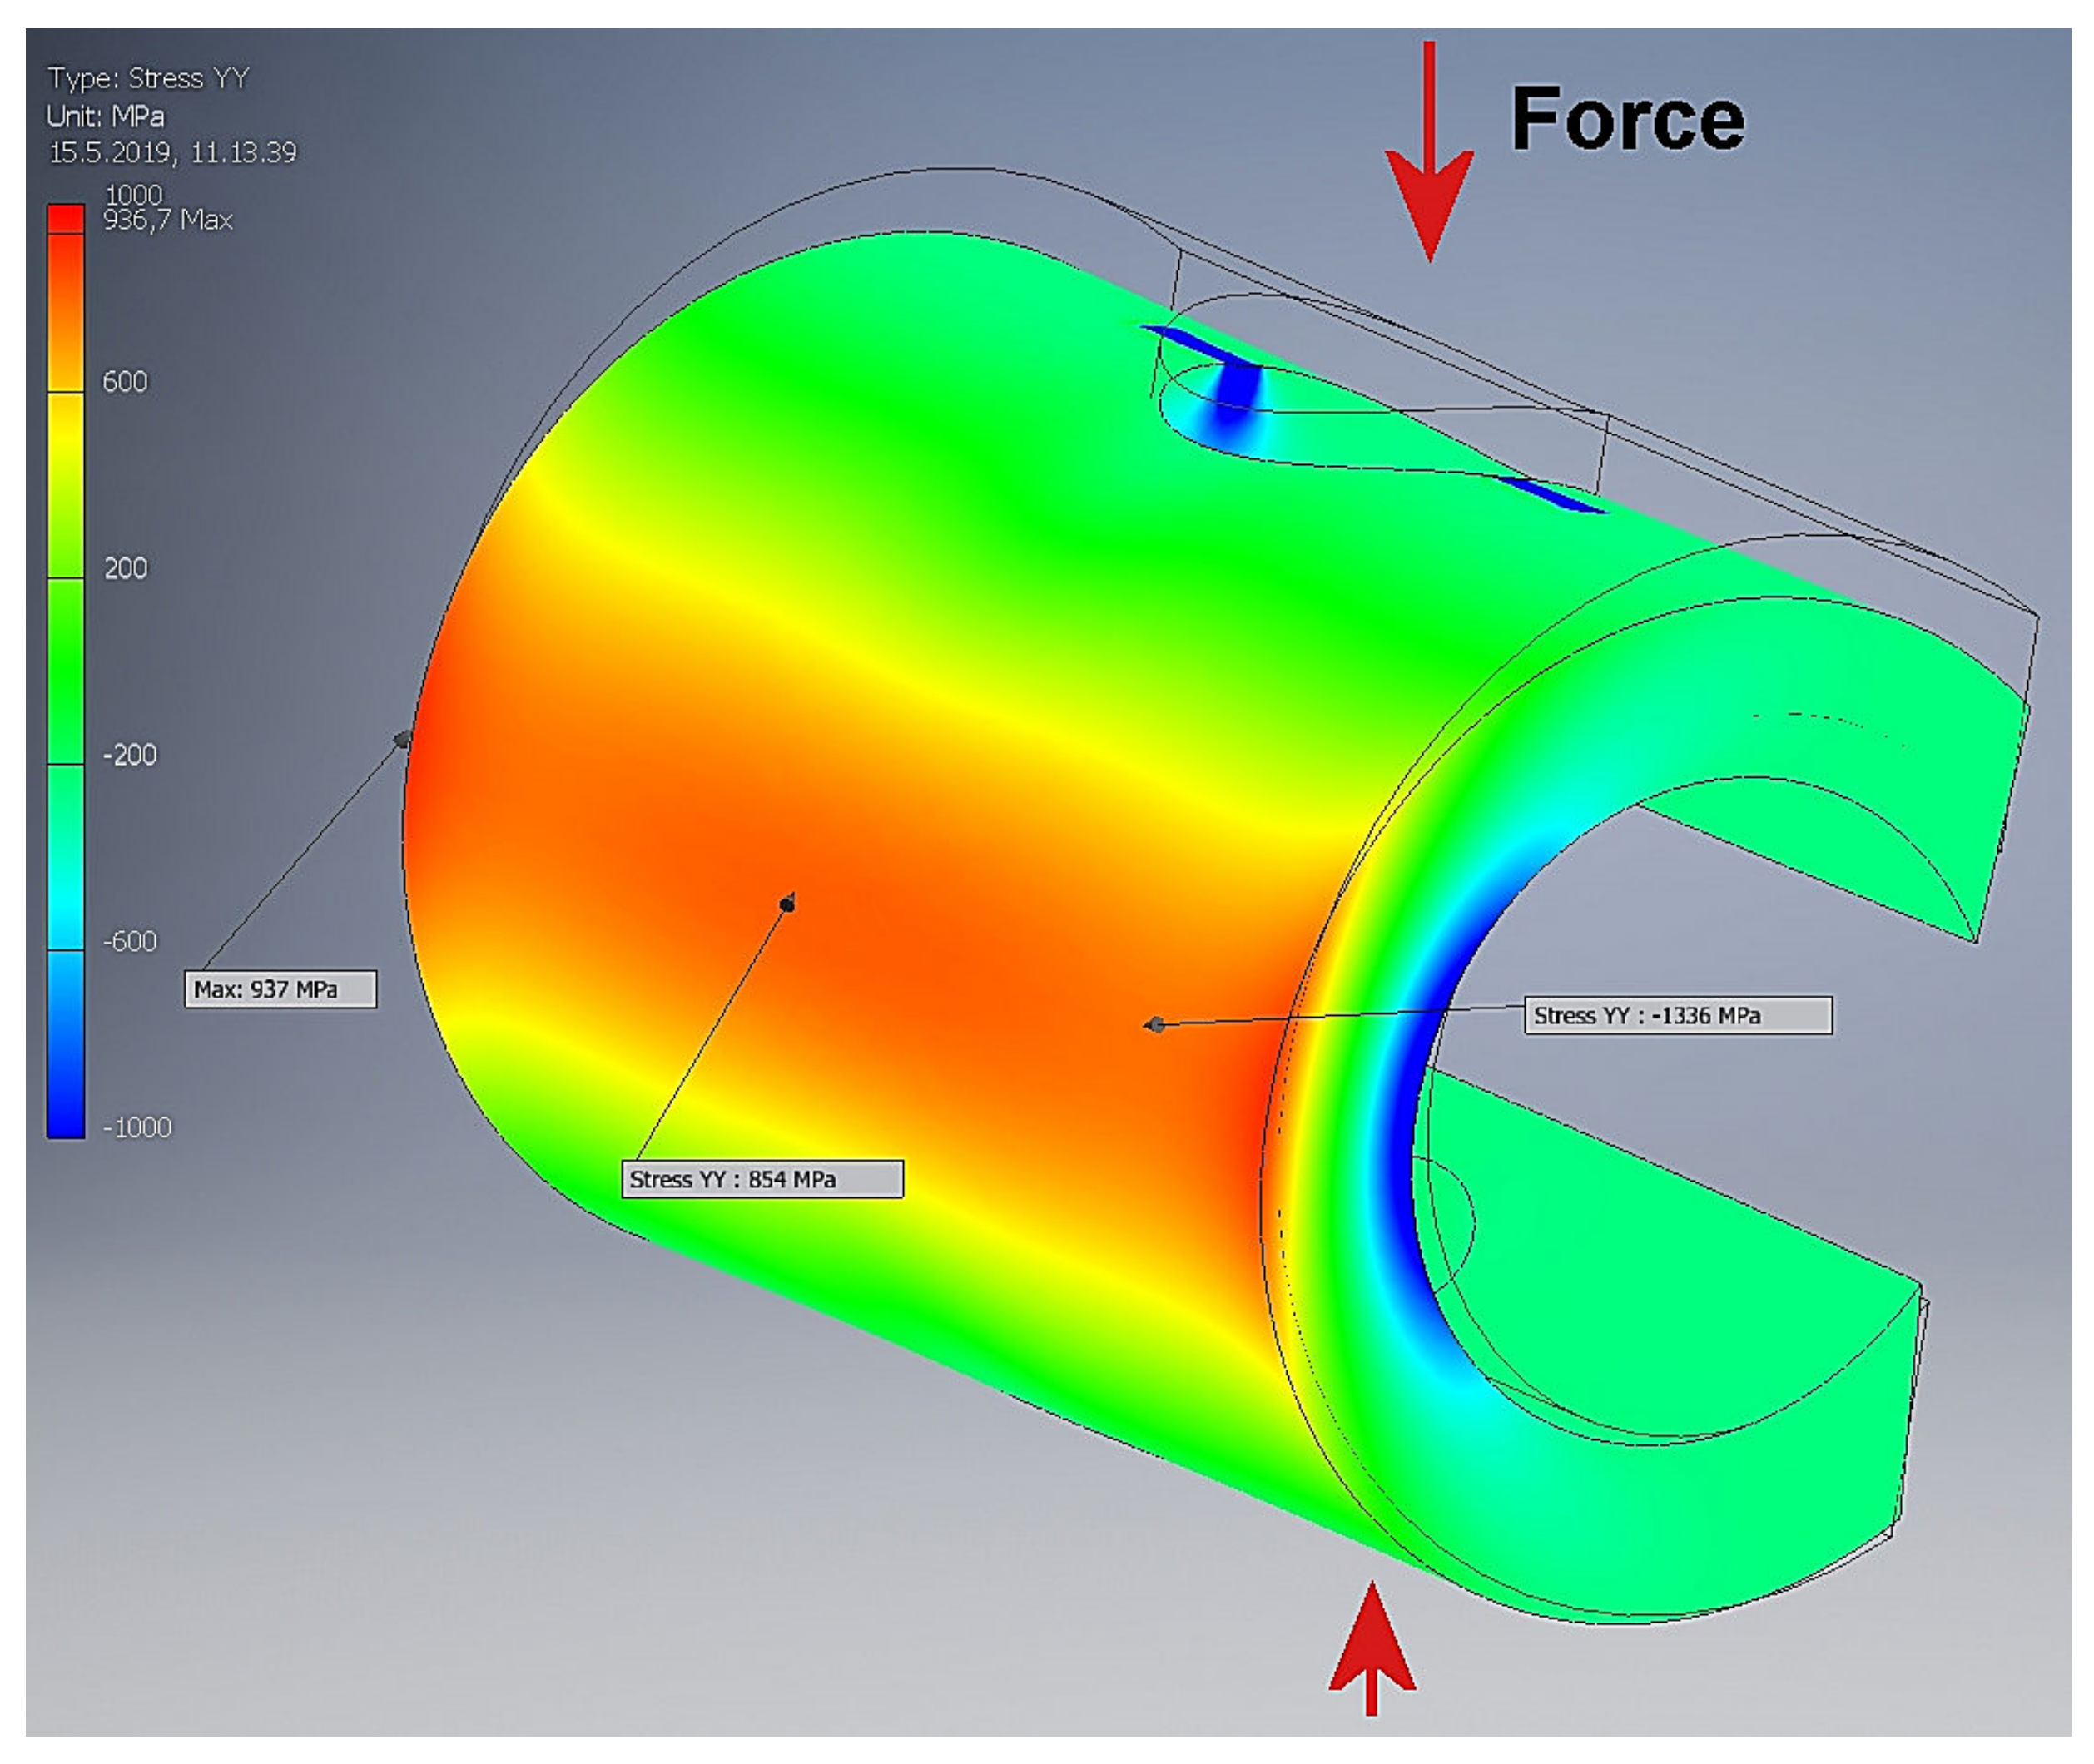
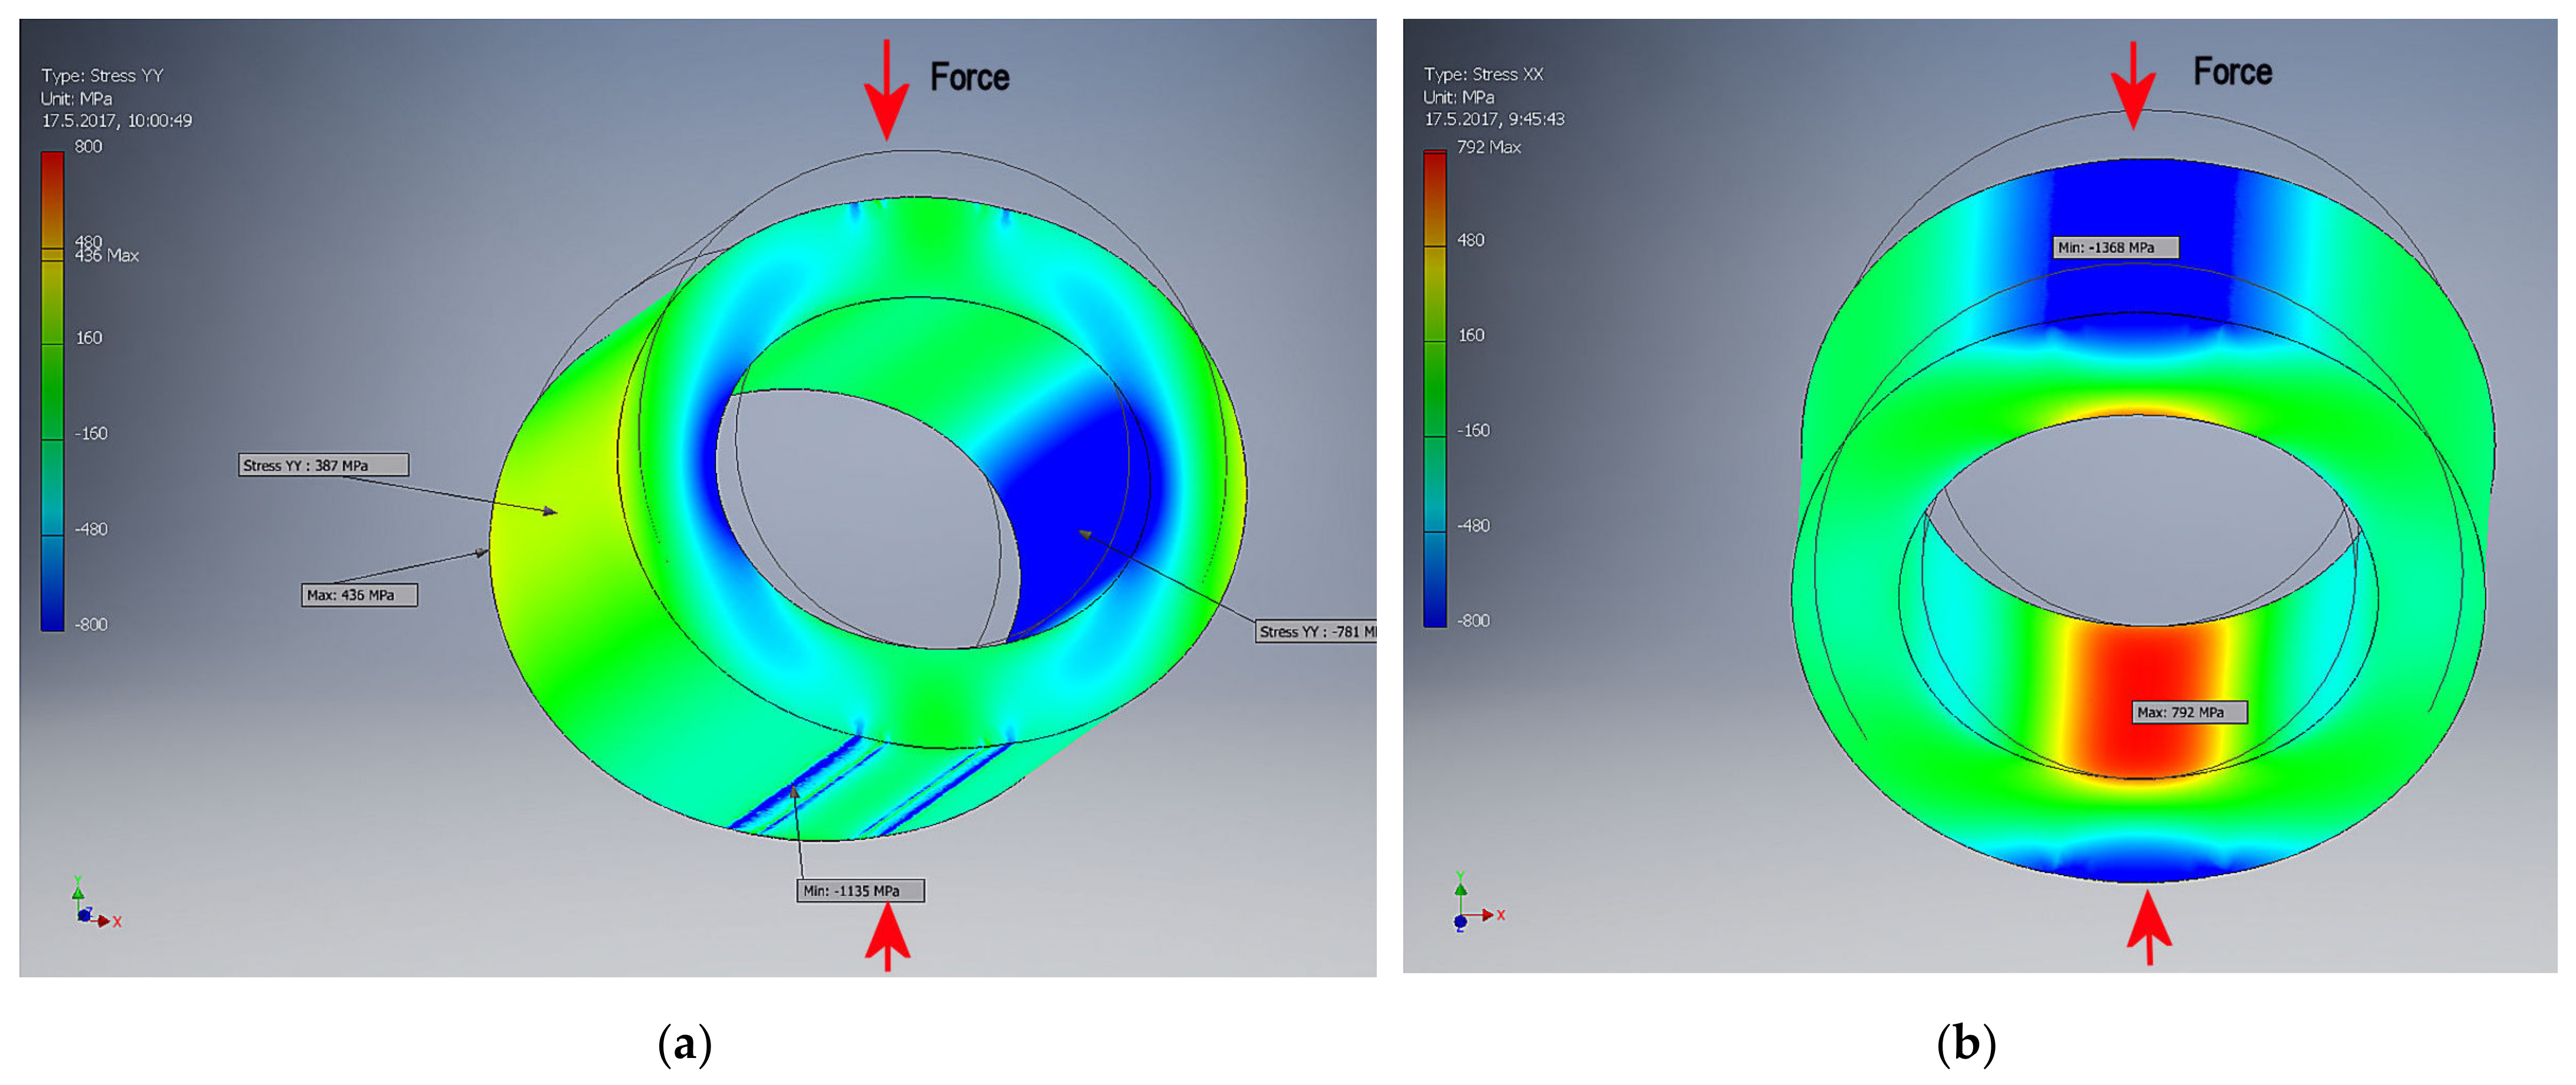
In many cases, active loading control has been used in order to get a more precisely-controlled stress applied to the specimen. Nowadays O-rings are preferred over the C-ring configuration. For C-rings the loads required to produce relevant stresses in the specimen are smaller than for O-rings. The stresses are schematically shown in Figure 1 for a C-ring specimen and in Figure 2 for an O-ring specimen. In a C-ring the maximum tensile stress is on the outer surface in one location of the loaded specimen. In an O-ring there are stress maximums on the inner surfaces in the load line and on the outer side surfaces.
In active load control a pull rod penetrates the top of the autoclave. The pull-rod transfers the load controlled by, e.g., a stepper motor, which gets feedback from an autoclave external load cell, to the loading rig. Due to the friction in the penetration, and pressure fluctuation in the autoclave in the case of a recirculated water chemistry control, control of the applied load may not be accurate. In addition to the higher loads in O-ring testing, another benefit in using O-rings is that less machining is needed and, thus, less active waste in fine/powdery form is produced when specimens are prepared from readily tubular shape FTT.
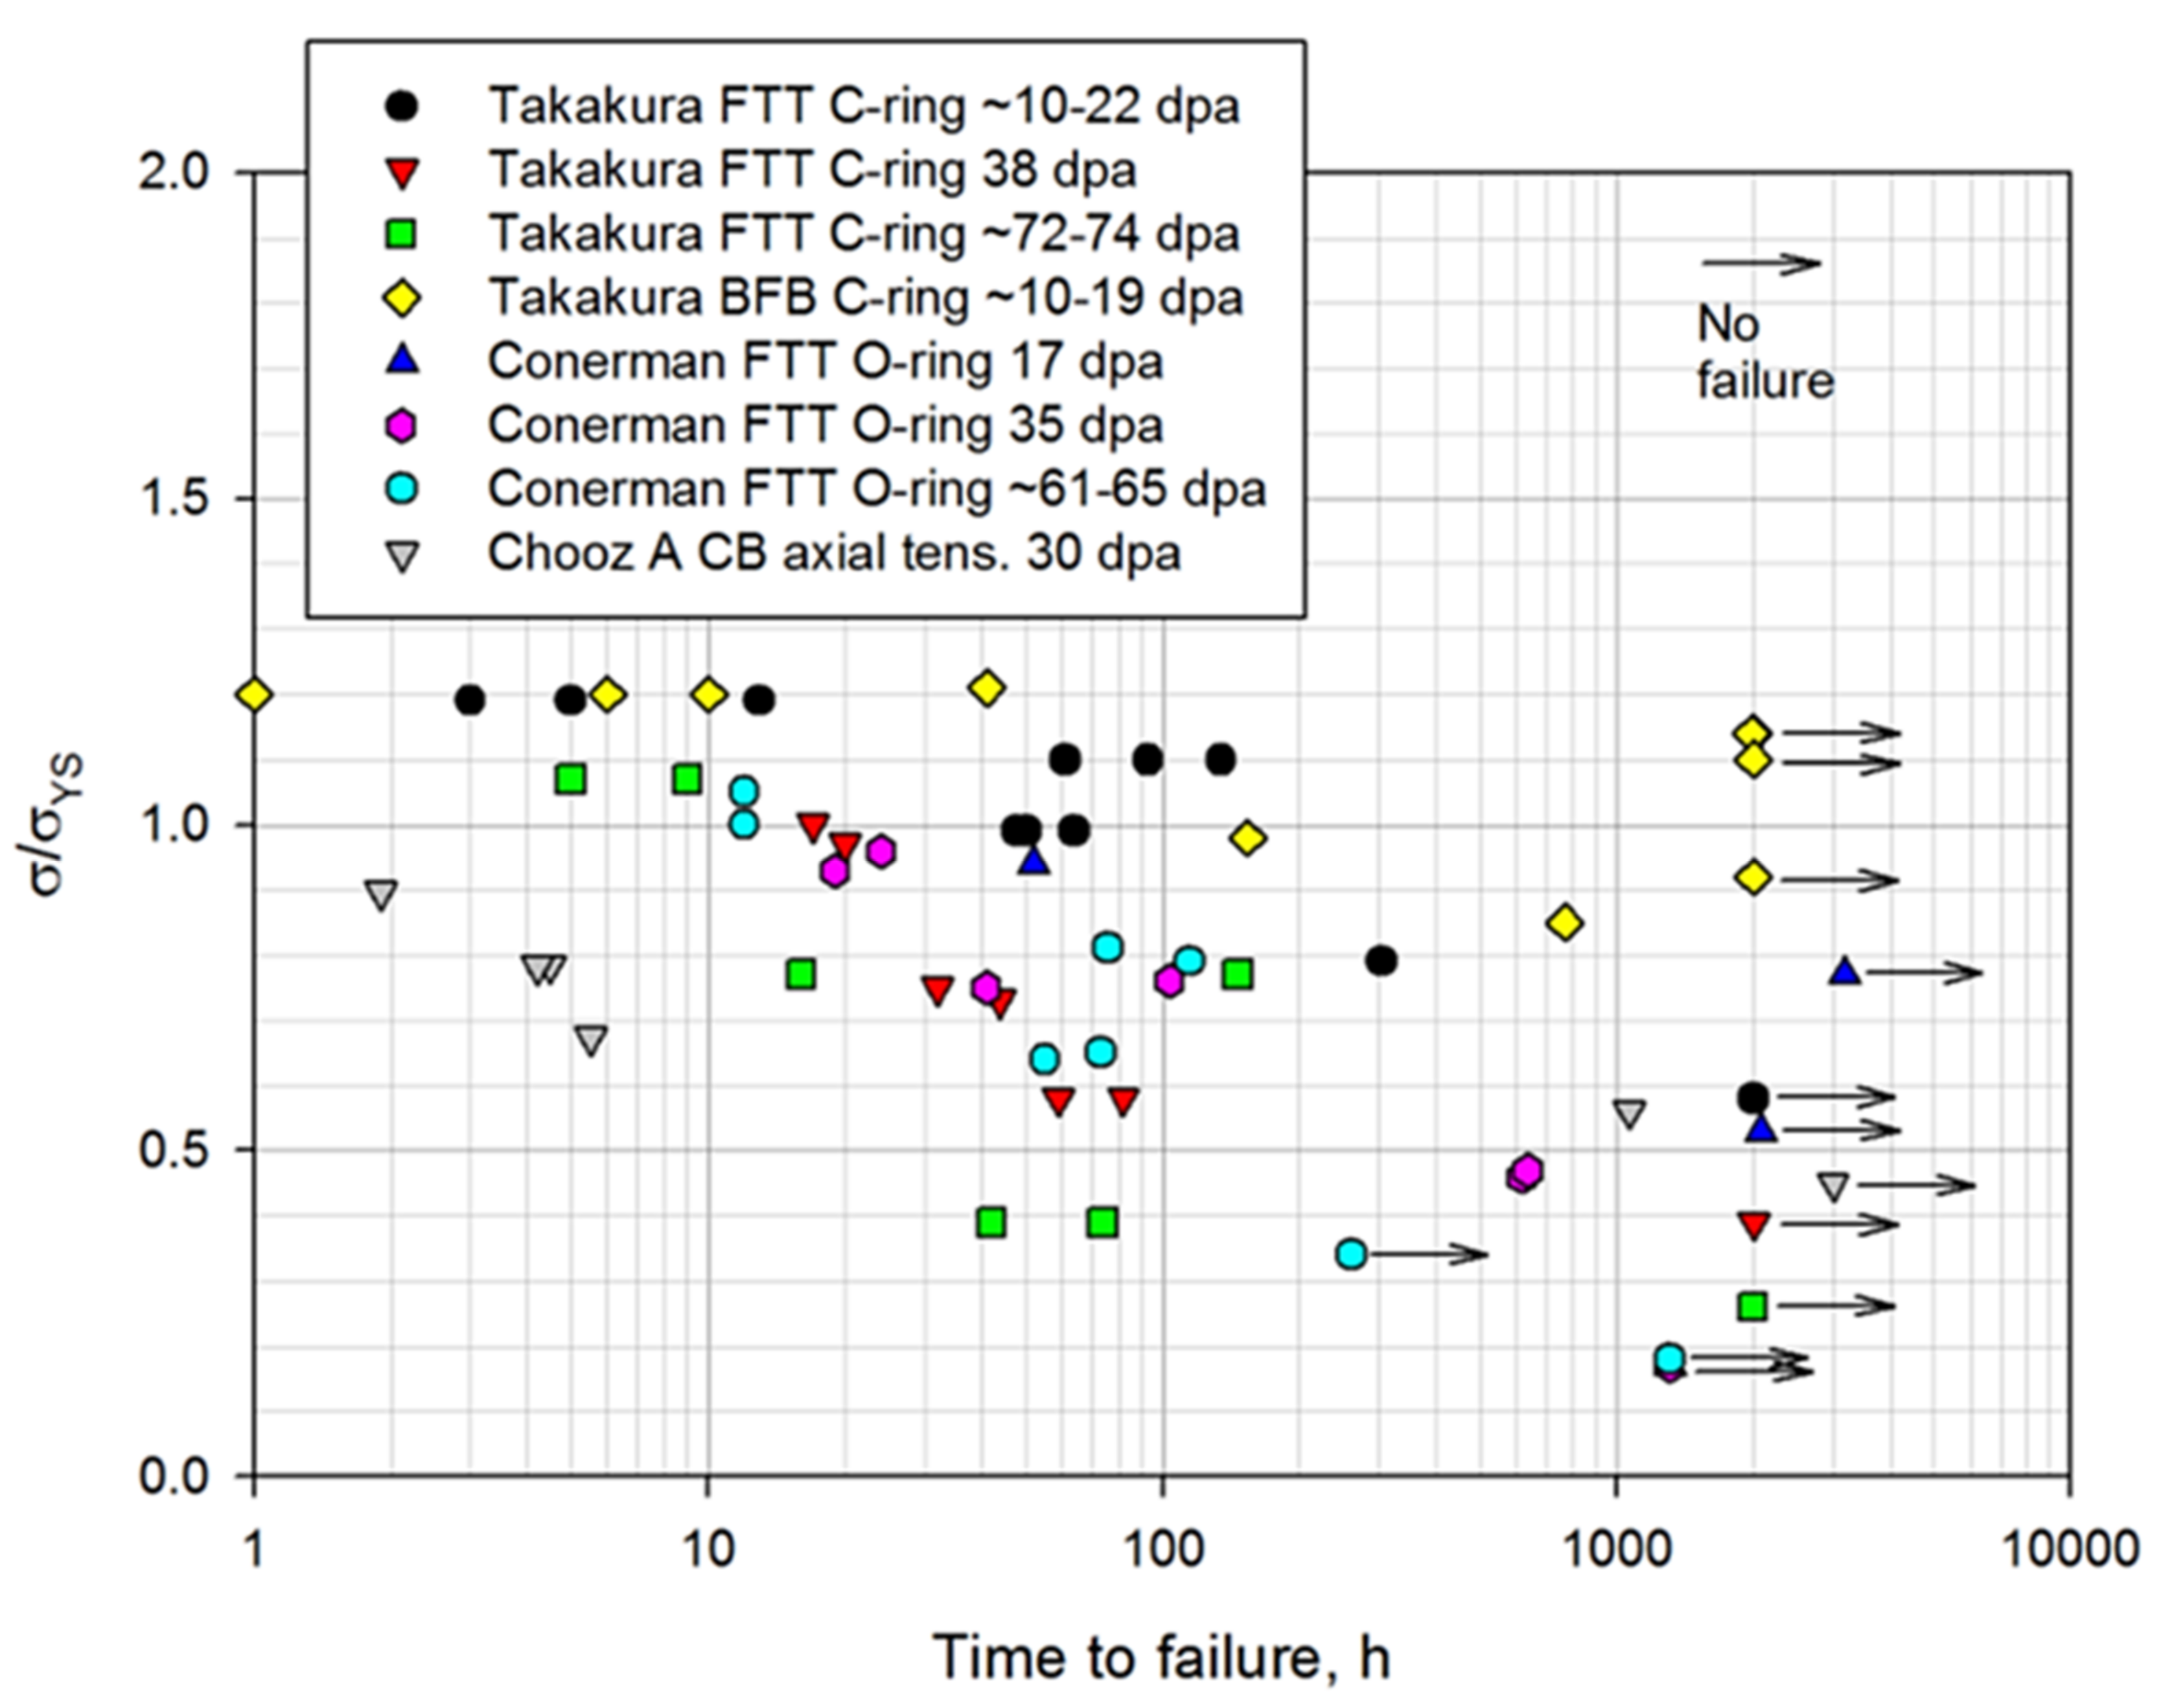
In recent years results on O-ring IASCC tests have been reported by several authors [6,7,8,9,10,11,12]. Selected C-ring and O-ring test data on type 316 steel is collected in Figure 3. All tests in Figure 3 are done at 340 °C in PWR water with 1000–1200 ppm B (as H3BO3), 2–2.2 ppm Li (as LiOH) and ~30 cc/kg dissolved H2.
When the results on similar neutron doses are compared, the tests on C-rings and O-rings produce relatively similar σ/σYS vs. time-to-failure dependencies. As a comparison, also time-to-failure data on axially loaded tensile specimens on type 304 steel are included. As a whole, it is evident that significant scatter exists in the data. This can be due to a myriad of variables in such sophisticated tests, such as the particular loading type, steel composition, surface condition of base metal and the oxide formed, and even accuracy of dpa assessments. Therefore, any additional data produced can be viewed as enrichening the overall dataset to facilitate more robust conclusions to be drawn.
The aims of the initial series of IASCC tests performed by VTT, and reported here, were initialization of VTT’s new autoclave laboratory for testing irradiated materials, and to study the influence of PWR water dissolved hydrogen level on crack initiation in highly irradiated O-ring specimens.
2. Materials and Methods
The Type 316 stainless steel used in this study was provided by Ringhals AB. The material had the composition shown in Table 1. It originates from two Flux Thimble Tubes (FTTs) originating from Ringhals Unit 2: FTT-99 with a peak dose of 65 dpa, and FTT-10 with a peak dose of 100 dpa. FTT-99 was in service from the first start-up of the reactor until 1998, while FTT-10 was in service until 2009, i.e., for 23 and 34 years, respectively. The FTTs were subjected to about 15% cold-working during manufacture. While the material for this study only involved the irradiated conditions, as described in [15], prior to irradiation the cold-worked material had a population of network dislocations and some deformation bands. These deformation bands are typically a combination of hexagonally close-packed epsilon martensite and twinned austenitic microstructure [16].
The FTT were subjected to gamma scanning by Studsvik AB [17]. Gamma scanning was performed with a Ge detector provided with a 0.5 mm collimator. Gamma spectra were obtained and analyzed at equidistant positions along the FTT segments. These measurements yielded the relative axial activity distributions of Co-58, Co-60, and Mn-54 in the FTT. Based on the gamma scan, the highest Mn-54 activity level for each FTT was assigned a dose of 65 dpa for FTT-99, and 100 dpa for FTT-10. The materials used in this work came from a fairly constant dose region of the maximum dose area of the FTT, and therefore the FTT materials of this study are considered to be 65 dpa and 100 dpa.
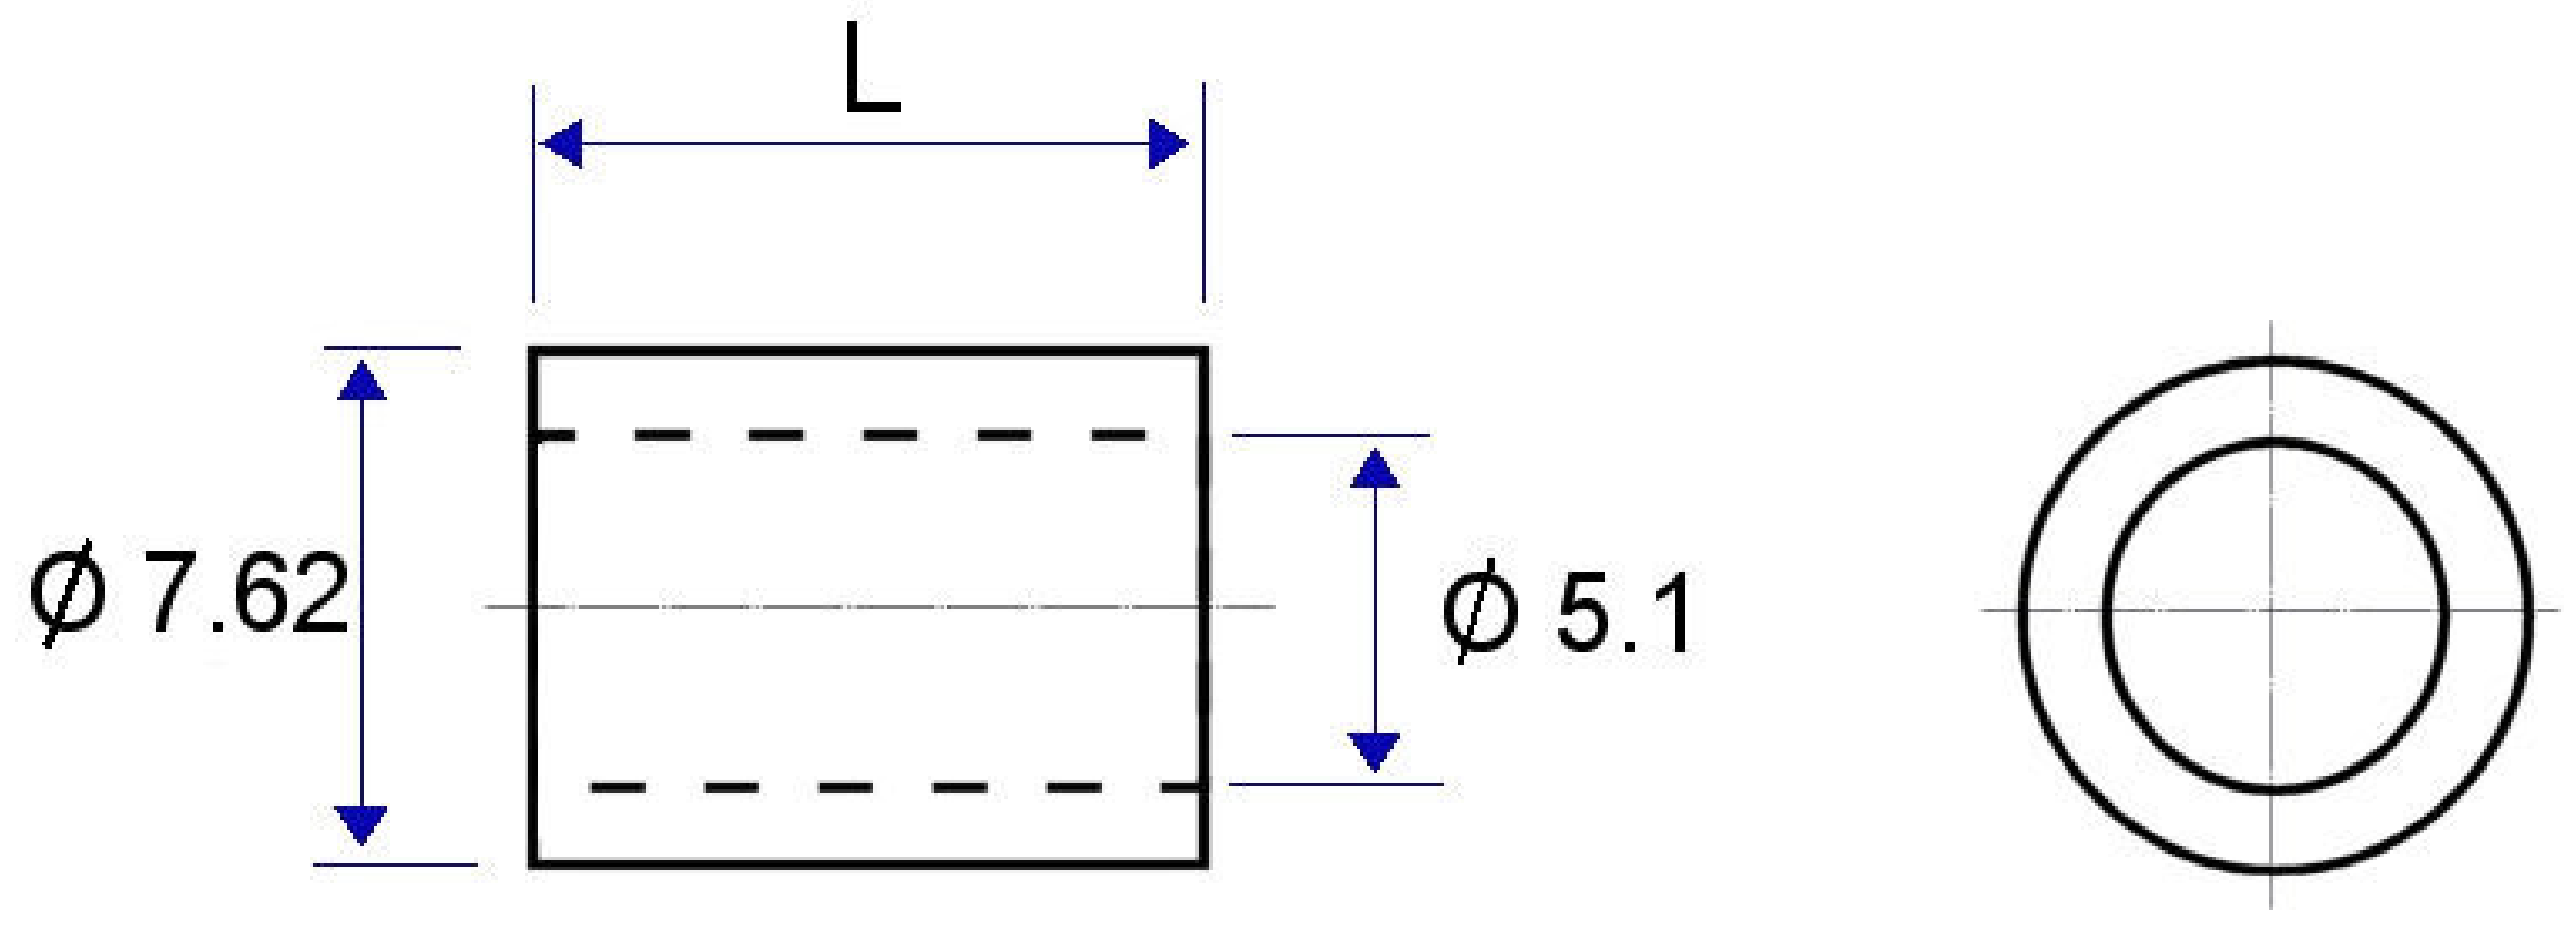
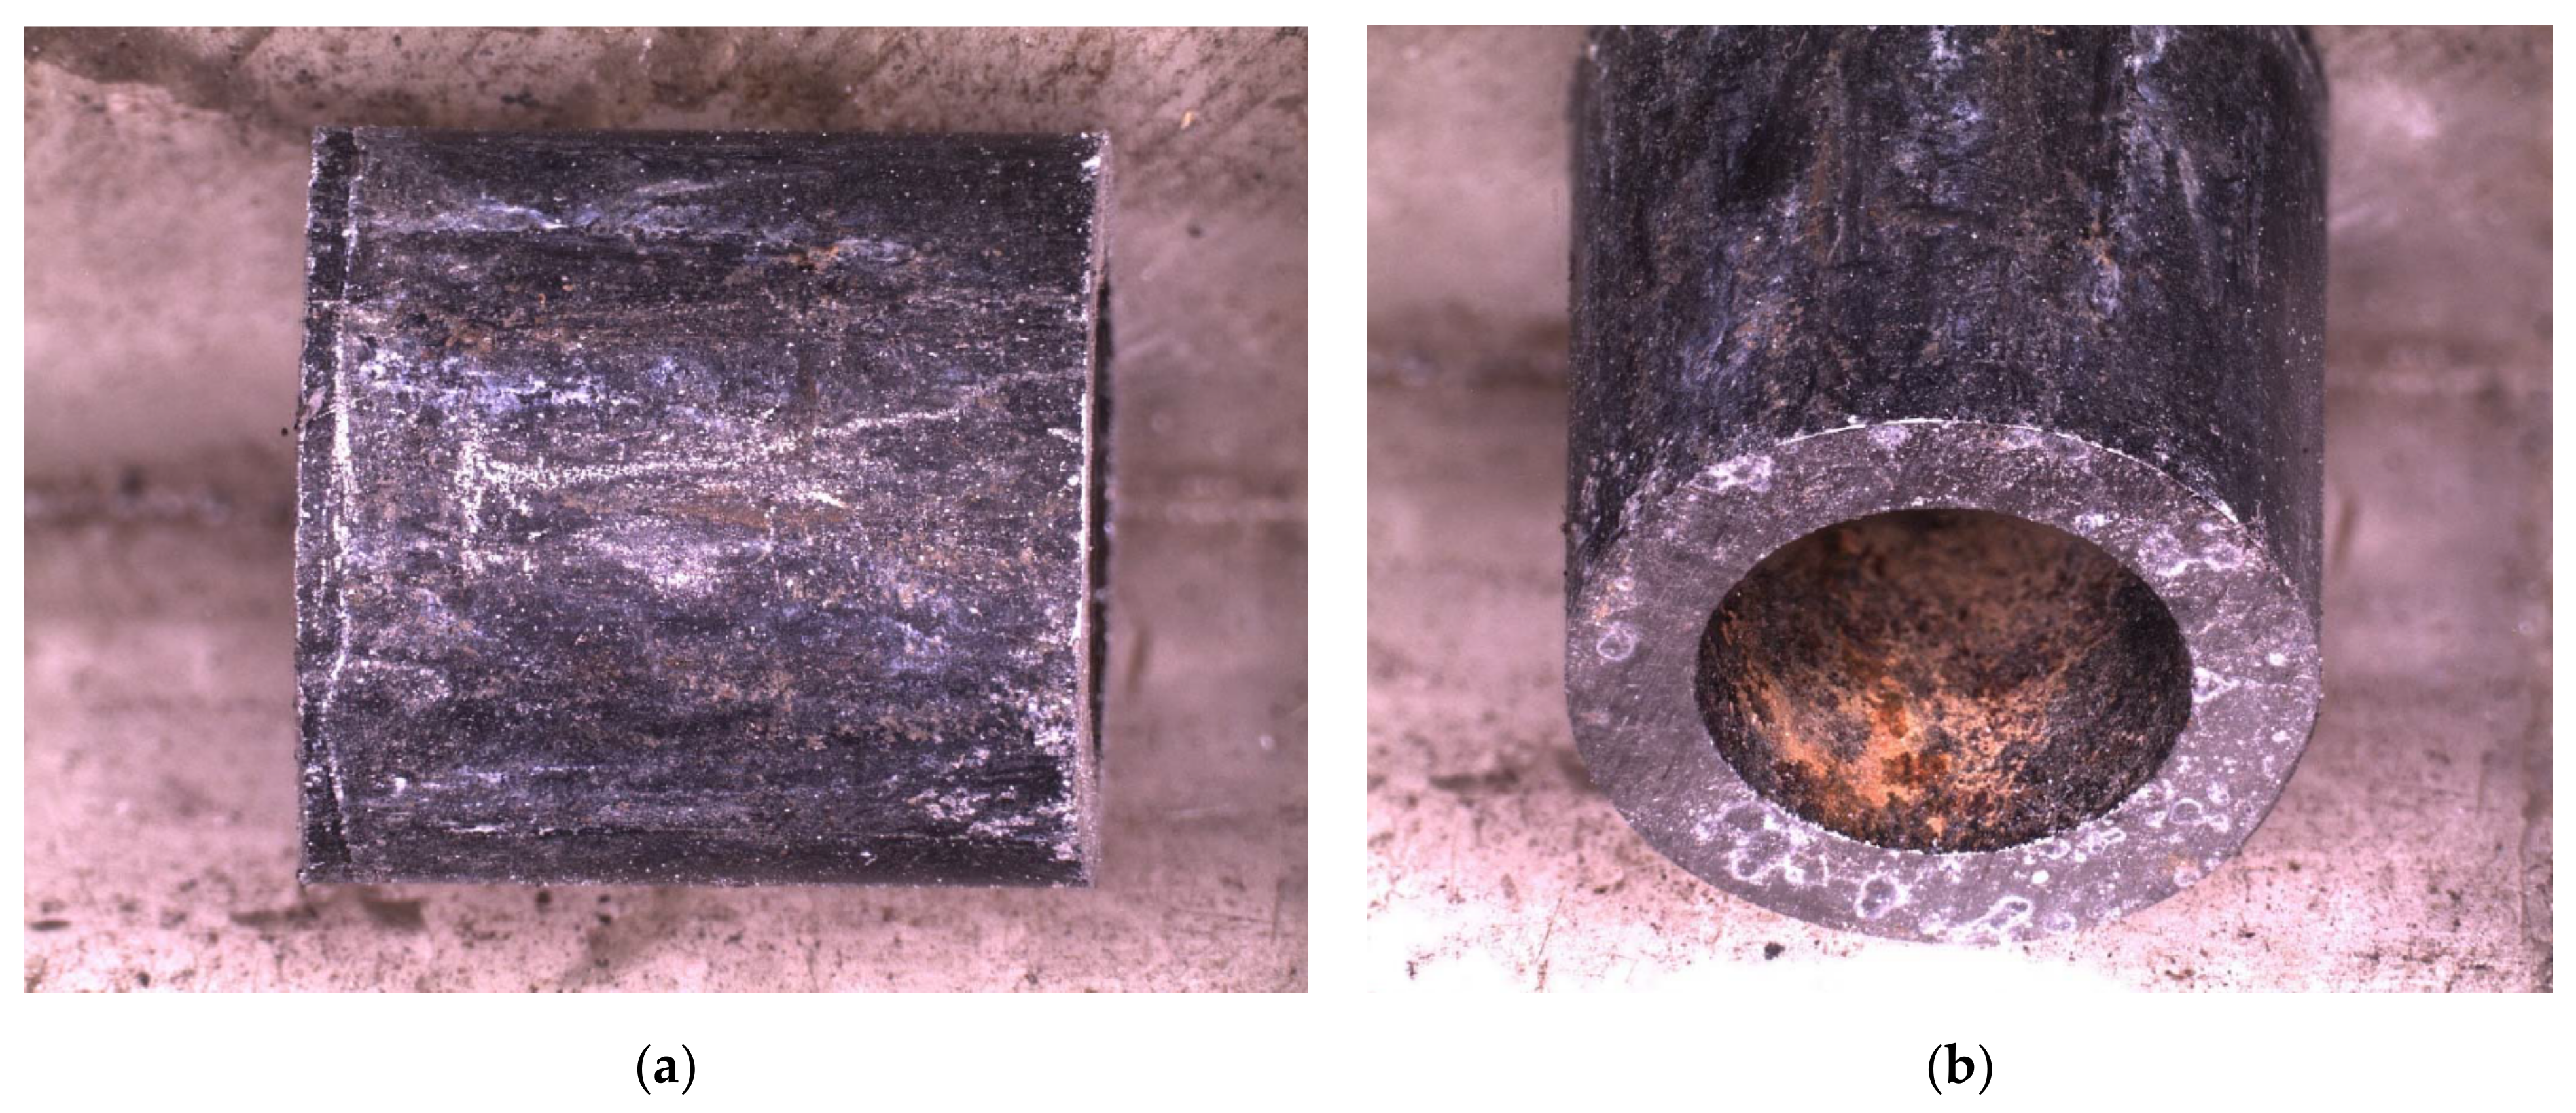
The O-ring specimens for this study were fabricated for VTT by Studsvik AB [17]. Specimens from each FTT source were made with a length of 10 mm and 8 mm. The O-ring specimens were prepared by first cutting to the oversized lengths (+1 mm) using a diamond cutting wheel with water as cooling agent, then milling from both ends with a numerically controlled milling machine to almost final length, again using water as cooling agent. On each specimen, a fresh milling tool was used for the final pass. The milled surfaces were polished with a 180-grit aluminum oxide/ceramic polishing pin to final length using tap water as cooling agent. Both ends of the specimen were then manually deburred using a ceramic deburring tool (no cooling agent was applied). Dimensions were confirmed according to the drawing shown in Figure 4. As shown in Figure 5, remains of what is most likely hematite is visible on the inner surface of the O-ring specimens. The inside of flux thimble tubes is exposed to the air outside the reactor, while it is the outer surface of the tube that is exposed to the reactor water environment.
2.1. TEM Specimen Preparation
The neutron-irradiated microstructure of the FTT material was characterized in the as-received condition by transmission electron microscopy (TEM). To provide material for investigation, two slices were cut off of one end of one of the 10 mm long O-ring specimens for each of the two material dose levels, using an in-cell slow-speed diamond saw cooled with water. Each slice was 0.6-mm thick, and the diamond saw blade kerf was 0.4 mm, resulting in removal of a total of 2 mm from the specimen, making two more O-ring specimens of 8 mm length. Since the irradiated materials of this study were radiation hardened to a high level, and any residual stresses had been sufficiently relaxed, diamond sawing produced slices which remained perfectly straight, with no evidence of distortion.
In the hot cell one 0.6 mm thick slice from each of the two dpa levels was then glued in turn to a grinding slug using hot-wax. The exposed side of the mounted slice was ground using an in-cell Mini-Met semi-automatic grinder with 600 grit (P1200) papers wetted with ethanol. After removing about 0.2 mm of material, the slice was flipped over and then ground to the final thickness of about 0.25 mm, producing thin, flat rings of material from which specimens could be punched for TEM. The relatively thin wall-thickness of the FTT required punching of 1-mm diameter blanks from the ground rings. This also significantly reduced the amount of radioactivity needing to be handled in subsequent steps. The 1-mm diameter blanks of radioactive specimen material were then pressed into the 1 mm diameter holes in the middle of 3-mm diameter blanks of non-active Type 316 stainless steel, to make composite blanks for TEM foil production. Gatan thermal-set epoxy was utilized to assure secure affixing of the insert in the ring. Each composite blank was then hand-ground on both sides on 600-grit (P1200) paper wetted with tap water until a final thickness of less than 0.1 mm was achieved.
The ground composite TEM foil blanks were electropolished to electron-transparency using a Struers Tenupol 5 twin-jet electropolisher equipped with a Laude closed-cycle chiller. The specimens were thinned using a solution of 5% perchloric acid in methanol at about −45 °C and +40 V. In these conditions typical currents were on the order of 50 mA, with polishing times of at least 2 min. They were then rinsed in a series of baths of high-purity ethanol. Three foils were prepared from each of the two dpa levels for examination in TEM.
2.2. TEM Investigations
The prepared foils were examined with a Talos F200 field emission gun (FEI, Copenhagen, Denmark) analytical electron microscope. The microscope is equipped with the Super X configuration of 4 Silicon Drift Detectors for improved Energy Dispersive X-ray (EDX) spectroscopy and EDX spectrum imaging analyses. EDX spectrum imaging is a technique in which a full EDX spectrum is acquired at each pixel during STEM imaging. This generates a “data cube“ or dataset that includes the STEM image in the X-Y plane and an EDX spectrum at each pixel. After processing, an elemental image or map can be extracted. In addition, regions in the image field can be isolated and an EDX spectrum from that specific region (or feature) can be extracted during post-acquisition analysis. In this work, EDX spectrum imaging analyses were performed in scanning transmission electron microscopy mode with a 256 × 256 pixel image field with 400 microsecond dwell time per pixel. The EDX spectrum image datasets were acquired for a live-time of 30 to 60 min. All post-acquisition image processing was performed using ThermoScientific’s Velox software version 2.13.0.1138.
2.3. Autoclave Testing Procedure
The autoclave used for this study was a brand-new autoclave connected to a totally refurbished circulating water circuit. For the purpose of this study a custom-built, remotely-operated, three-position rig was fabricated for simultaneously testing three O-rings. As such, the study began with a series of systems tests to confirm that the new equipment functioned according to expectations. This initiation series began with a water recirculation loop functionality test, proceeded to the specimen rig functionality test, and finally, a test of the remote, shielded specimen loading procedure for remotely loading the O-ring specimens in a hot cell, and then connecting the loading rig to the autoclave load-line. The same procedures were then employed for the testing of the materials of interest in this study.
2.3.1. Water Recirculation Loop Functionality Tests
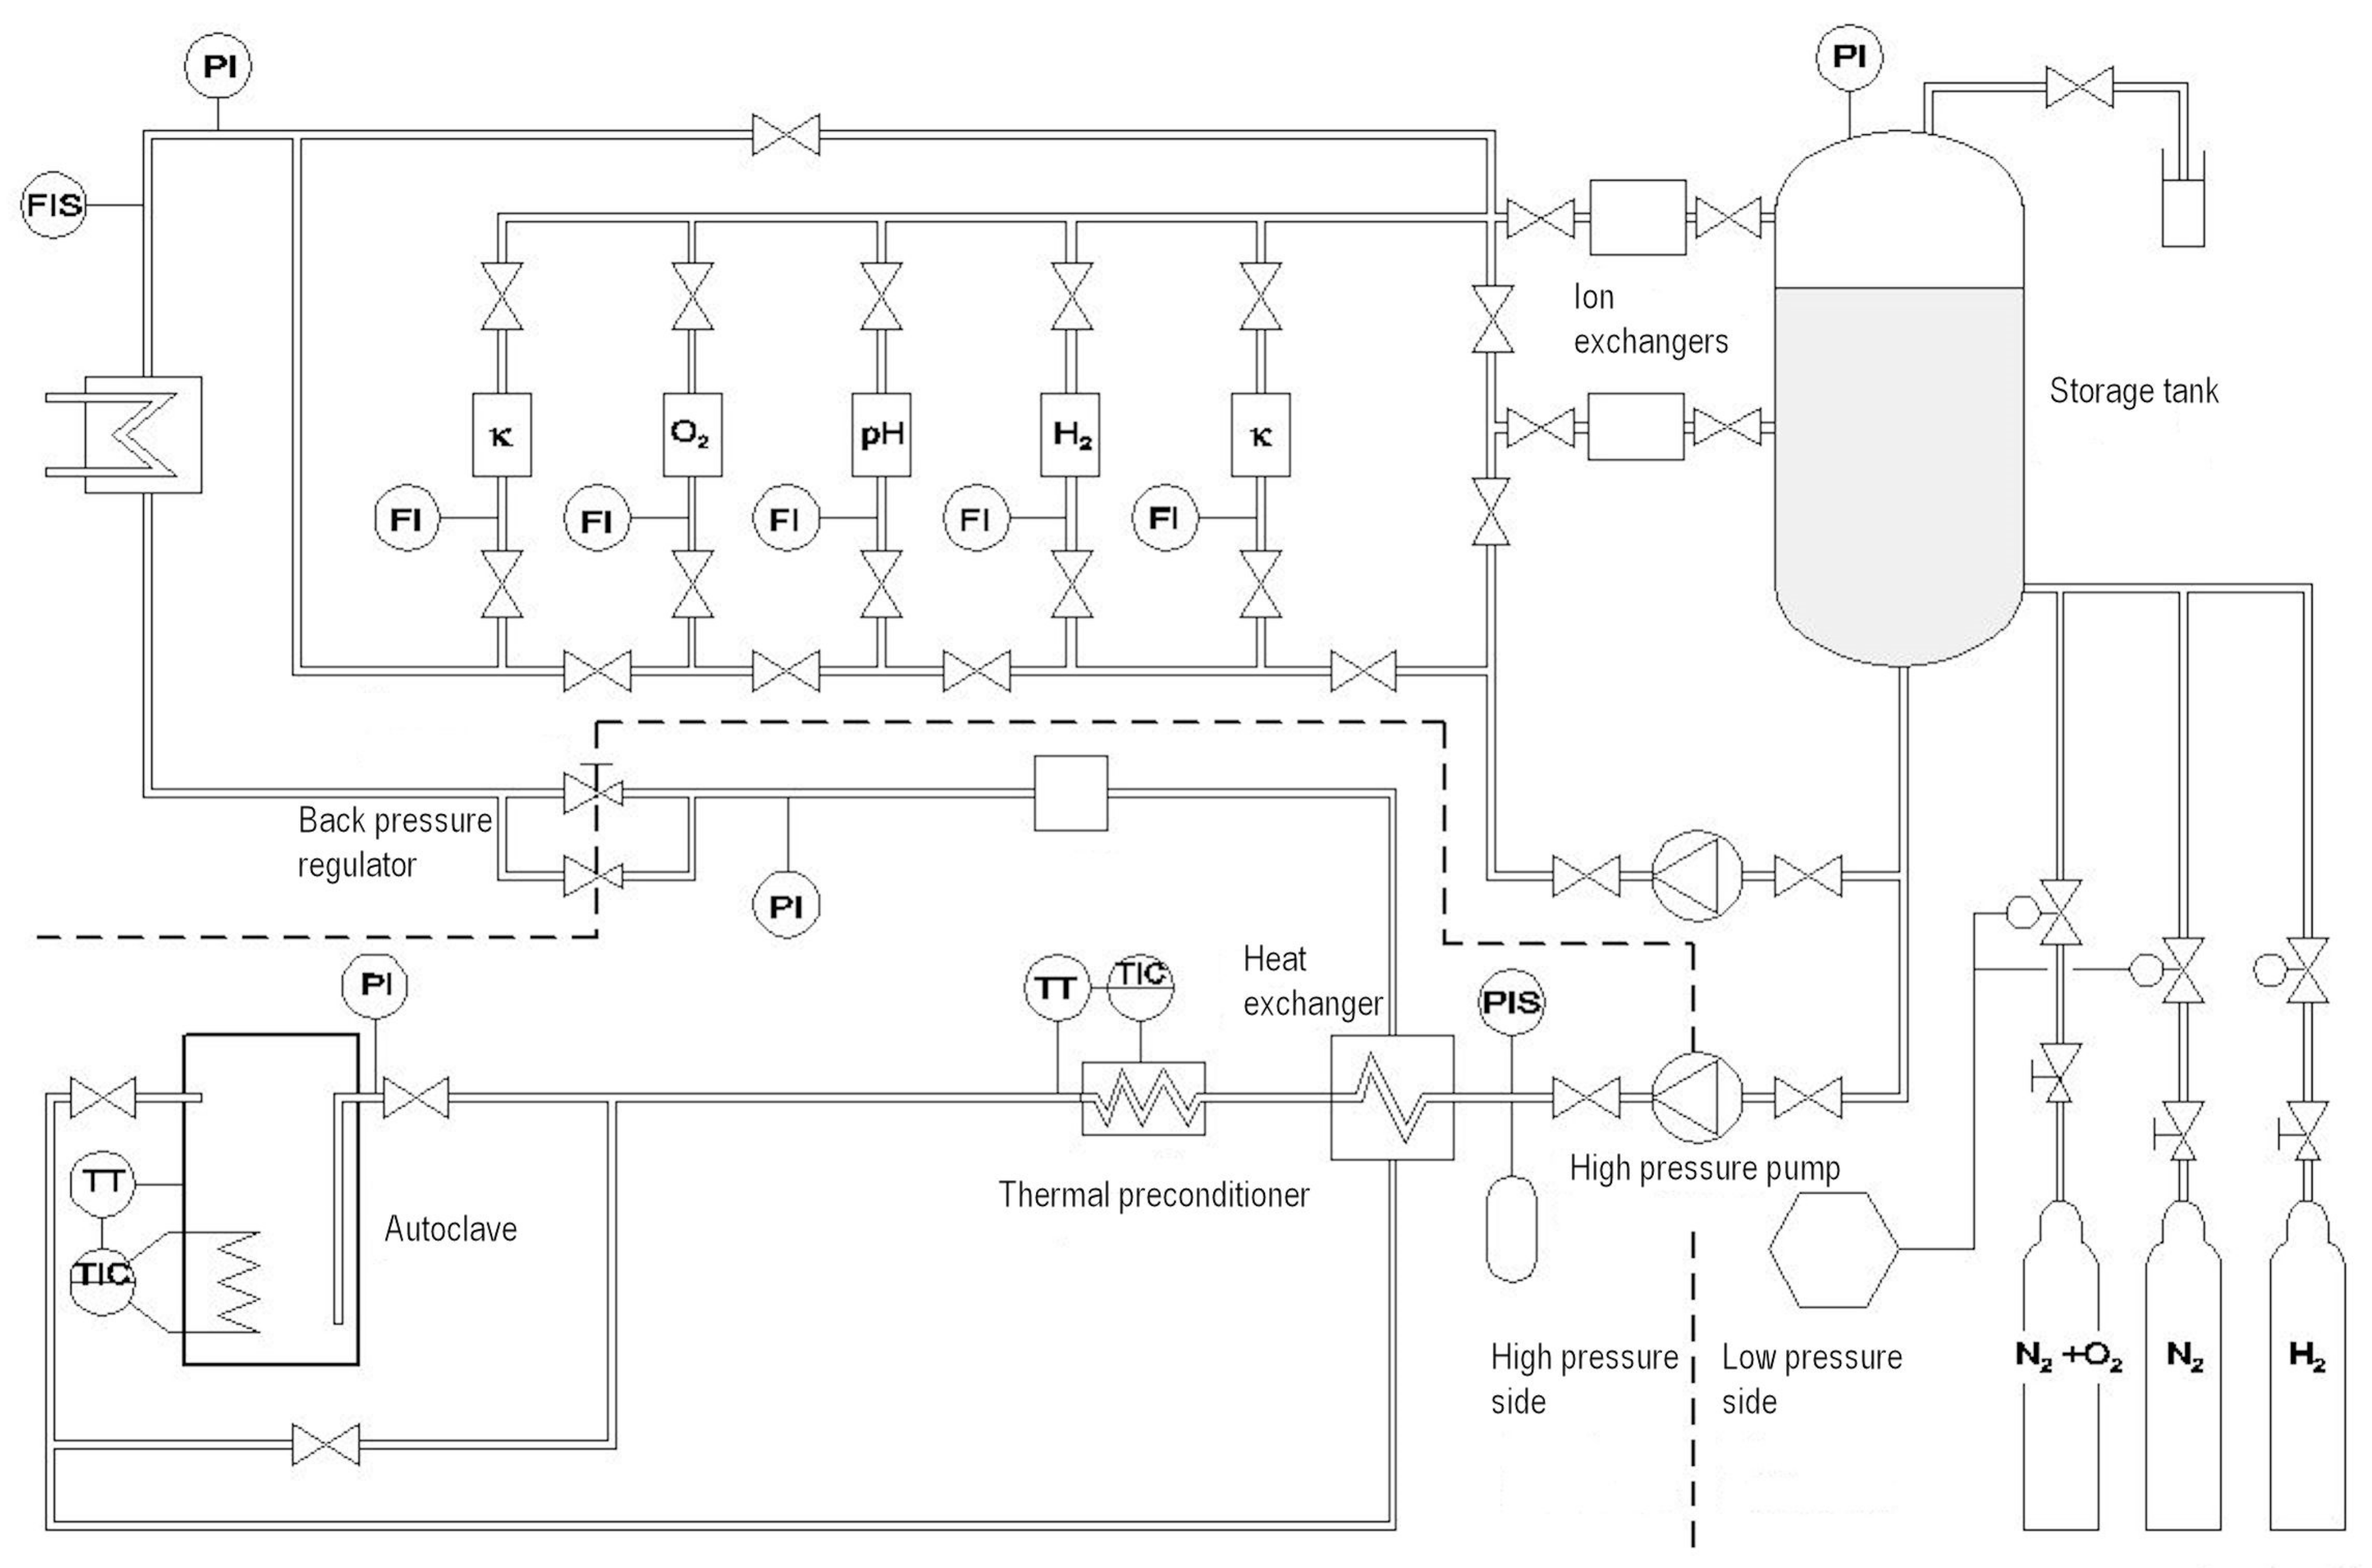
The structure of the loop is schematically presented in Figure 6. The loop consists of low- and high-pressure sections.
The low-pressure section consists of a make-up water tank equipped with nitrogen, hydrogen and mixed gas gasification systems, a low-pressure recirculation pump, a mixed bed ion exchanger, and water chemistry measurement instrumentation for on-line monitoring of conductivity, pH, dissolved oxygen, and dissolved hydrogen. Water chemistry monitoring instruments can be switched to measure either autoclave inlet or outlet water.
The high-pressure section consists of a high pressure diaphragm pump, a pressure accumulator to reduce pressure fluctuations, a heat exchanger, a pre-heater, an autoclave with step motor driven loading device, a helical pre-cooler of the return water (a later addition because no tap water is available for return water cooling), and a pressure release valve which separates the high- and low pressure sections of the loop.
The loop pipelines and valves are made of austenitic stainless steel of type AISI 316L. Sensor connectors at the low-pressure side are made either of AISI 316L stainless steel or thick-walled Teflon© blocks.
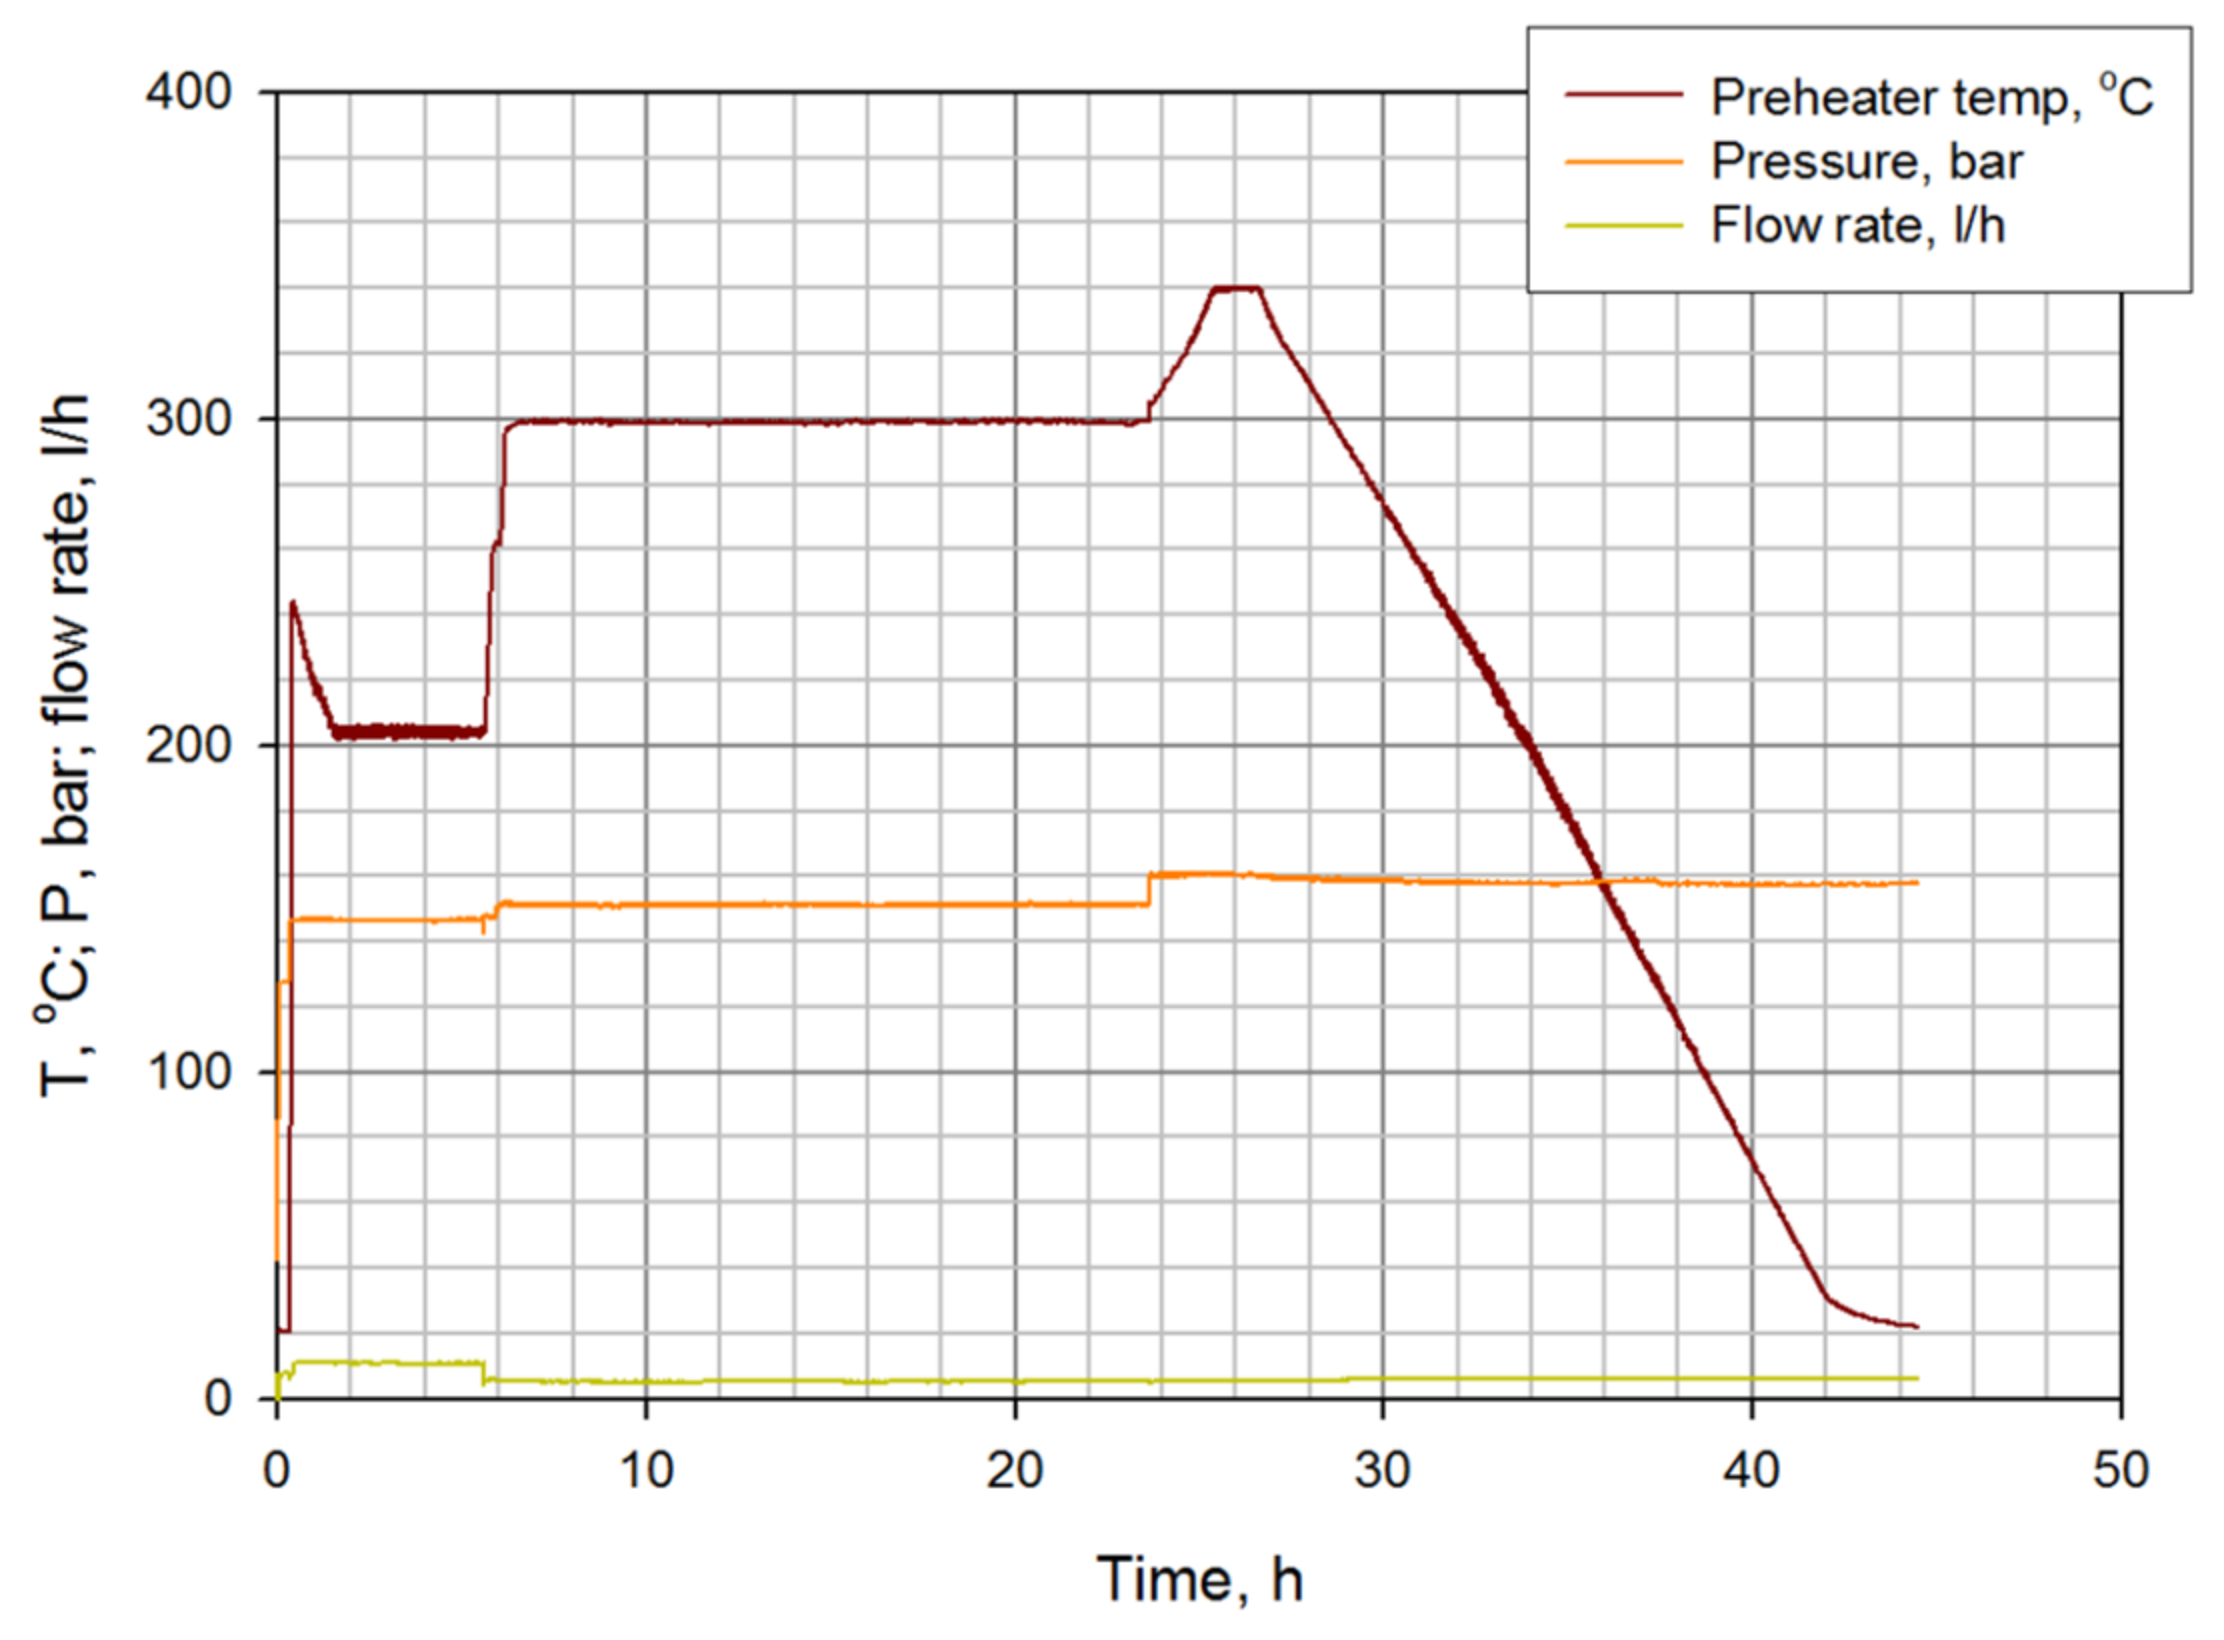
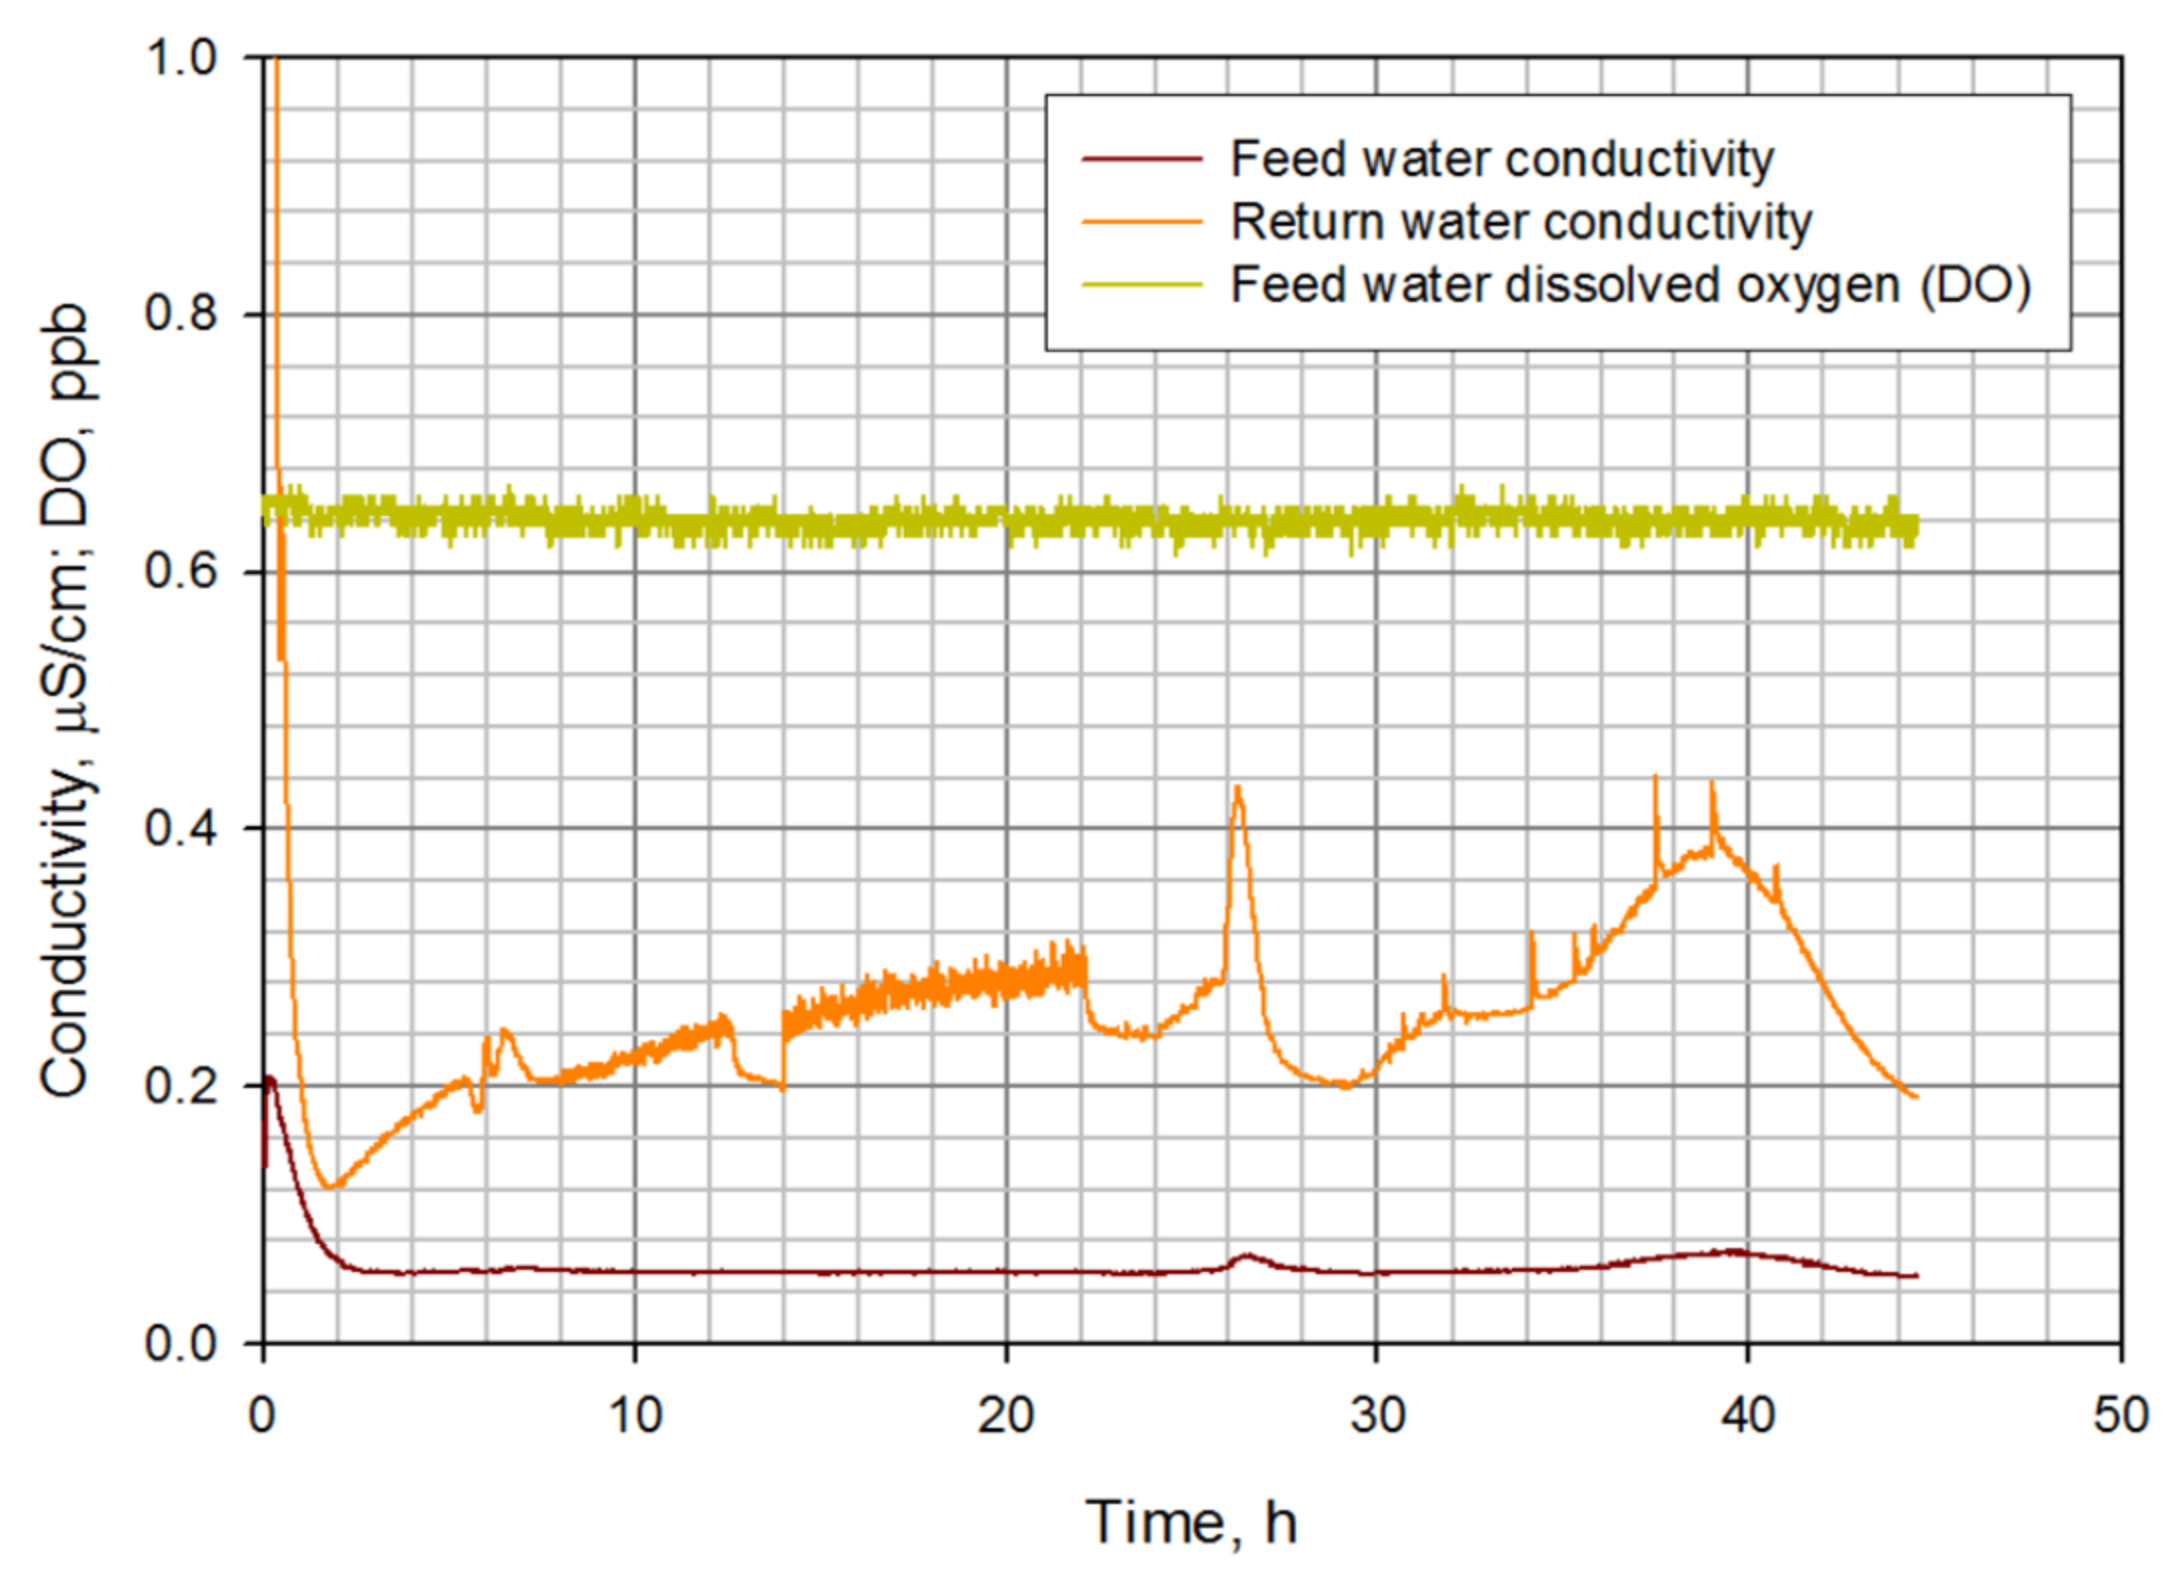
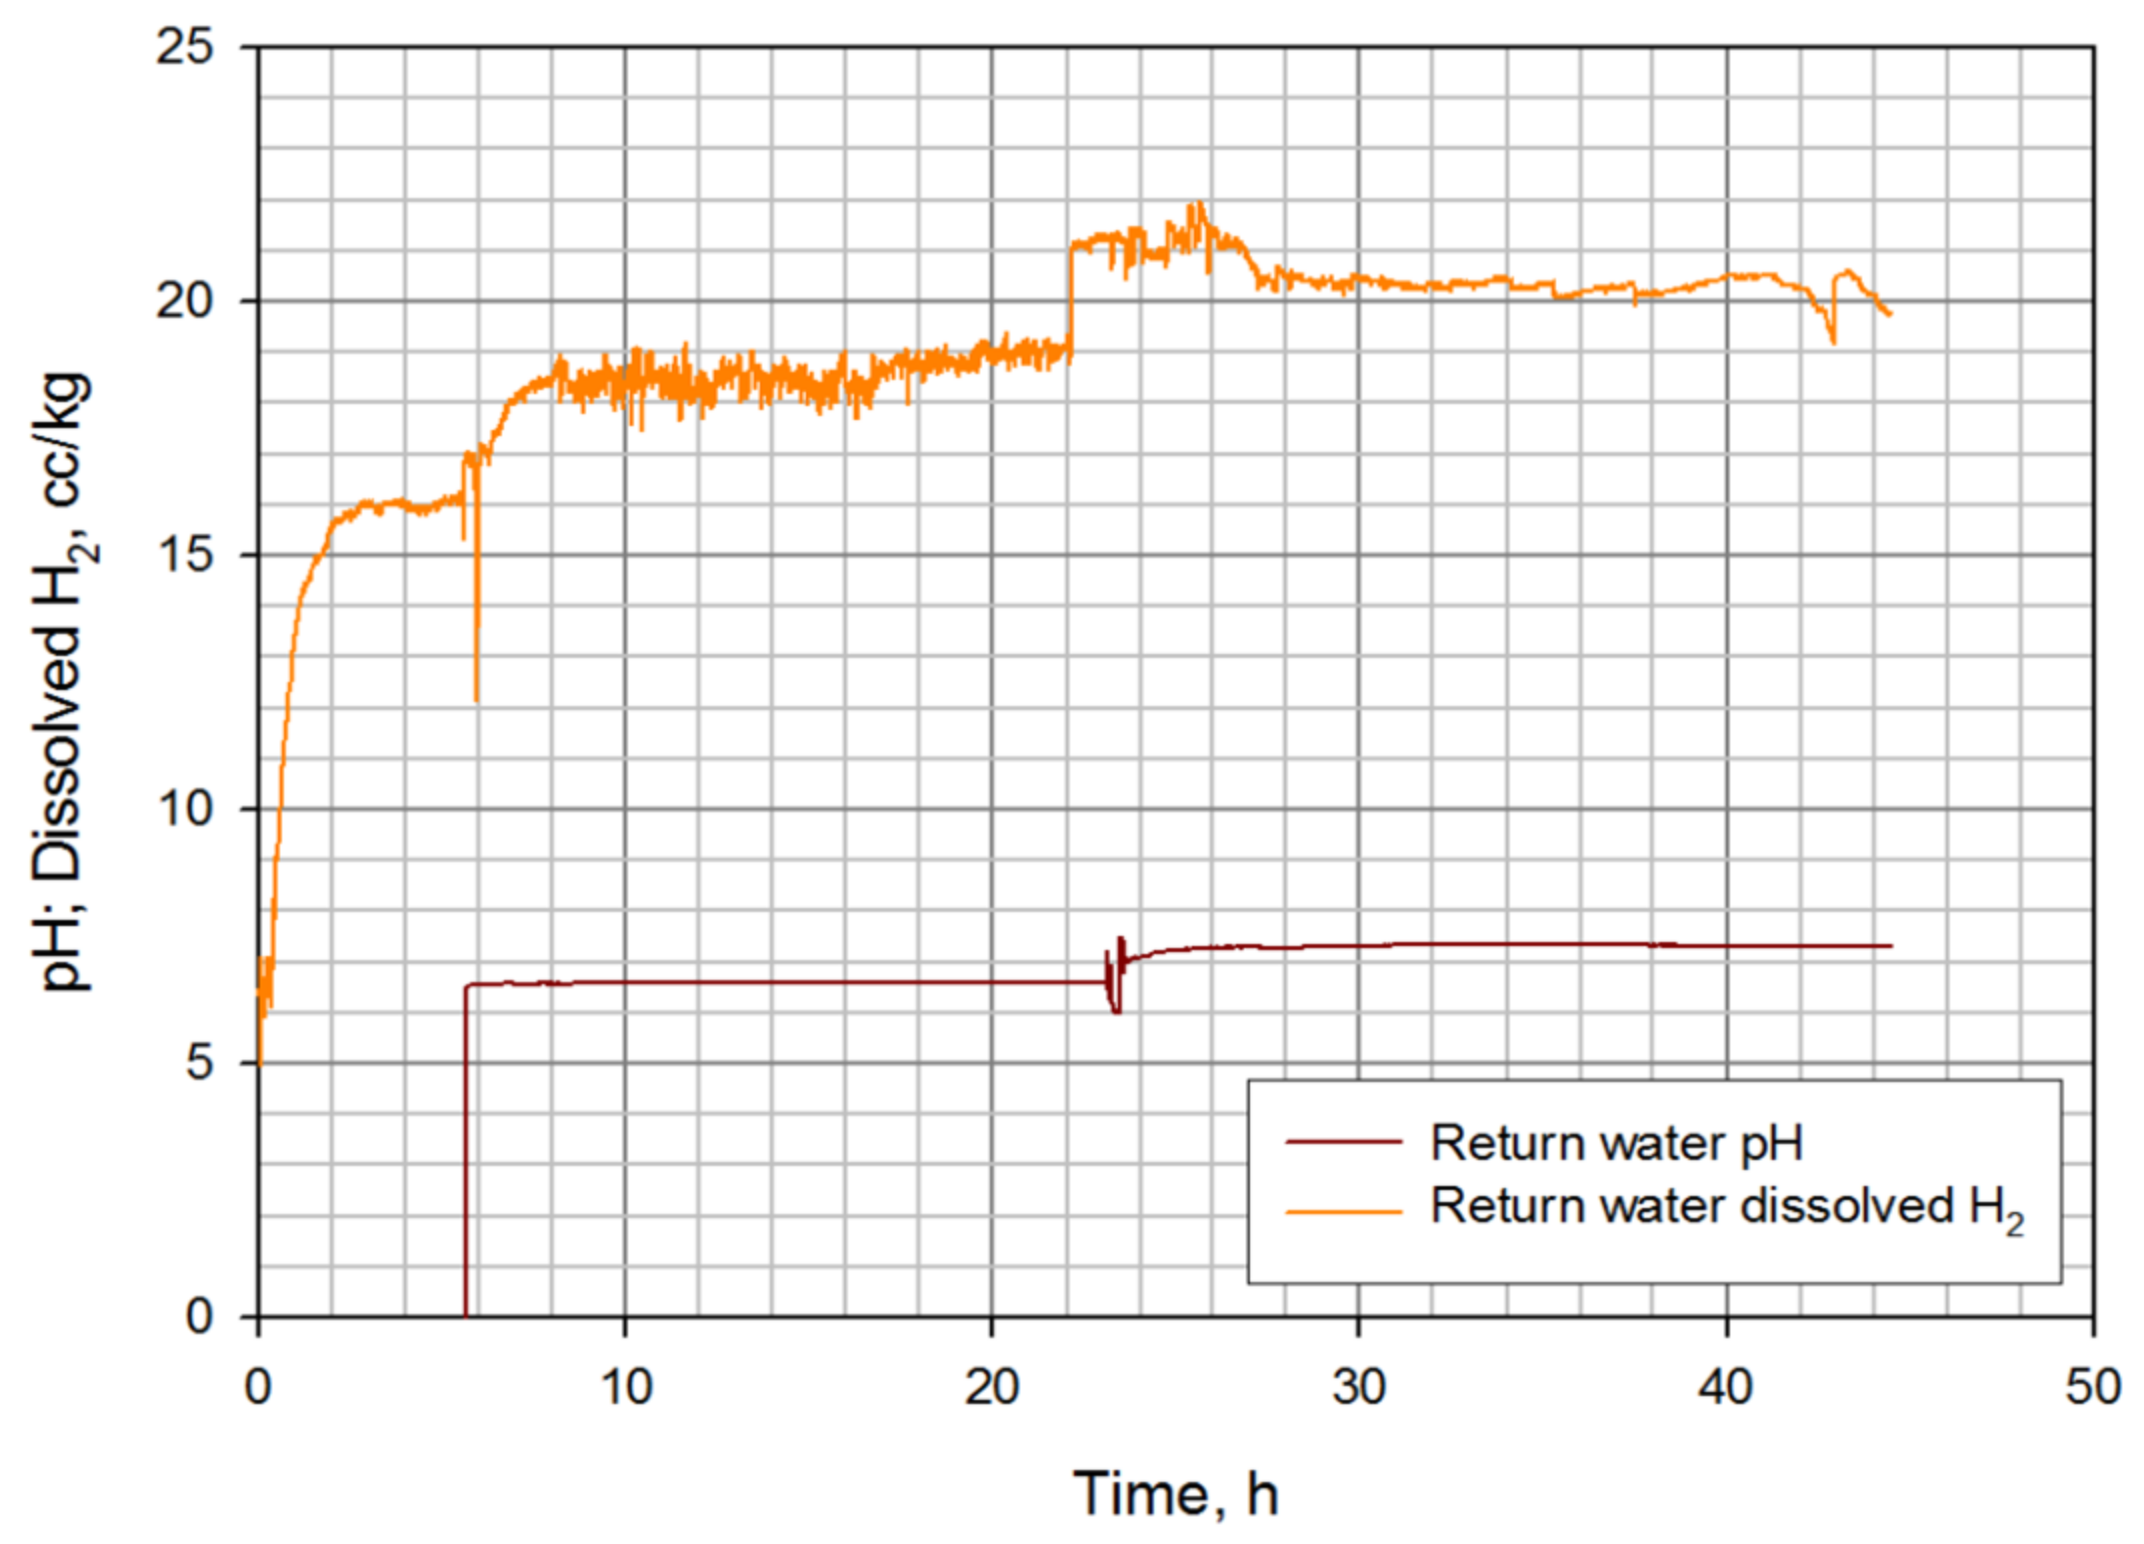
The functionality test aimed at: (1) measuring the stability of test parameters at a typical test temperature of ~300 °C and (2) reaching a higher typical test temperature (340 °C) without leaks or cooling problems. The minimum, maximum, and average levels during the stability test are shown in Table 2, while the test parameters as a function of time over the whole cycle are shown in Figure 7, Figure 8 and Figure 9. The testing was performed using pure de-ionized water. The stability test portion of the cycle took place between ~7.5 and 22 h in Figure 7, Figure 8 and Figure 9, and the higher temperature test took place immediately after that. As there are no standardized value ranges for the environmental parameters (they are case specific and usually agreed to be limited to the capabilities of the equipment employed), the stability results can be considered good. Stability of the return water conductivity was not considered important at this point, as it is expected to be high and unstable until the loop and autoclave surfaces have developed a stable surface oxide layer. The higher temperature was also reached without leaks or cooling problems.
2.3.2. Specimen Rig Functionality Test
To prepare for the first tests series to be done on the irradiated materials of this study, a functionality test of the loading rig was first carried out utilized unirradiated O-ring specimens 7–10 mm long with OD 8 mm, but made from unirradiated AISI 316L. These were selected due to good material availability.
To facilitate safely loading the radioactive O-ring specimens into the loading rig, the rig was designed to be able to be opened with one master-slave manipulator, while the other manipulator, equipped with tweezers and a camera, is used to accurately and gently pick and place each O-ring specimen into position in the rig. A backing plate is used to lock the rig in the open position. The set-up is shown in the hot cell in the photo in Figure 10, with the camera view shown on the computer screen in the right-hand photo. Thus, for loading specimens, the rig is placed on the backing plate, a manipulator is used to open the rig and lock it open on pegs on the backing plate, camera-equipped tweezers are used to accurately pick and place the O-ring specimens into the rig, and then the rig is released from the backing plate. A spring holds the loading cross-bars with enough tension to hold the O-ring specimens in place during subsequent handling.
2.3.3. Autoclave Functionality Test
The autoclave is made of austenitic stainless steel AISI 316L. Its design temperature is 360 °C and pressure 200 bar. The autoclave volume is 1.6 liters. Load measurement and control is performed using an INTERFACE load cell and Cormet SSRT control electronics (step motor control and data acquisition system). For the measurement of load, pressure, and autoclave temperature, a computer and Cormet SSRT software are used. The test temperature is measured and controlled by an internal Pt-100 sensor and West 6100+ PID controller.
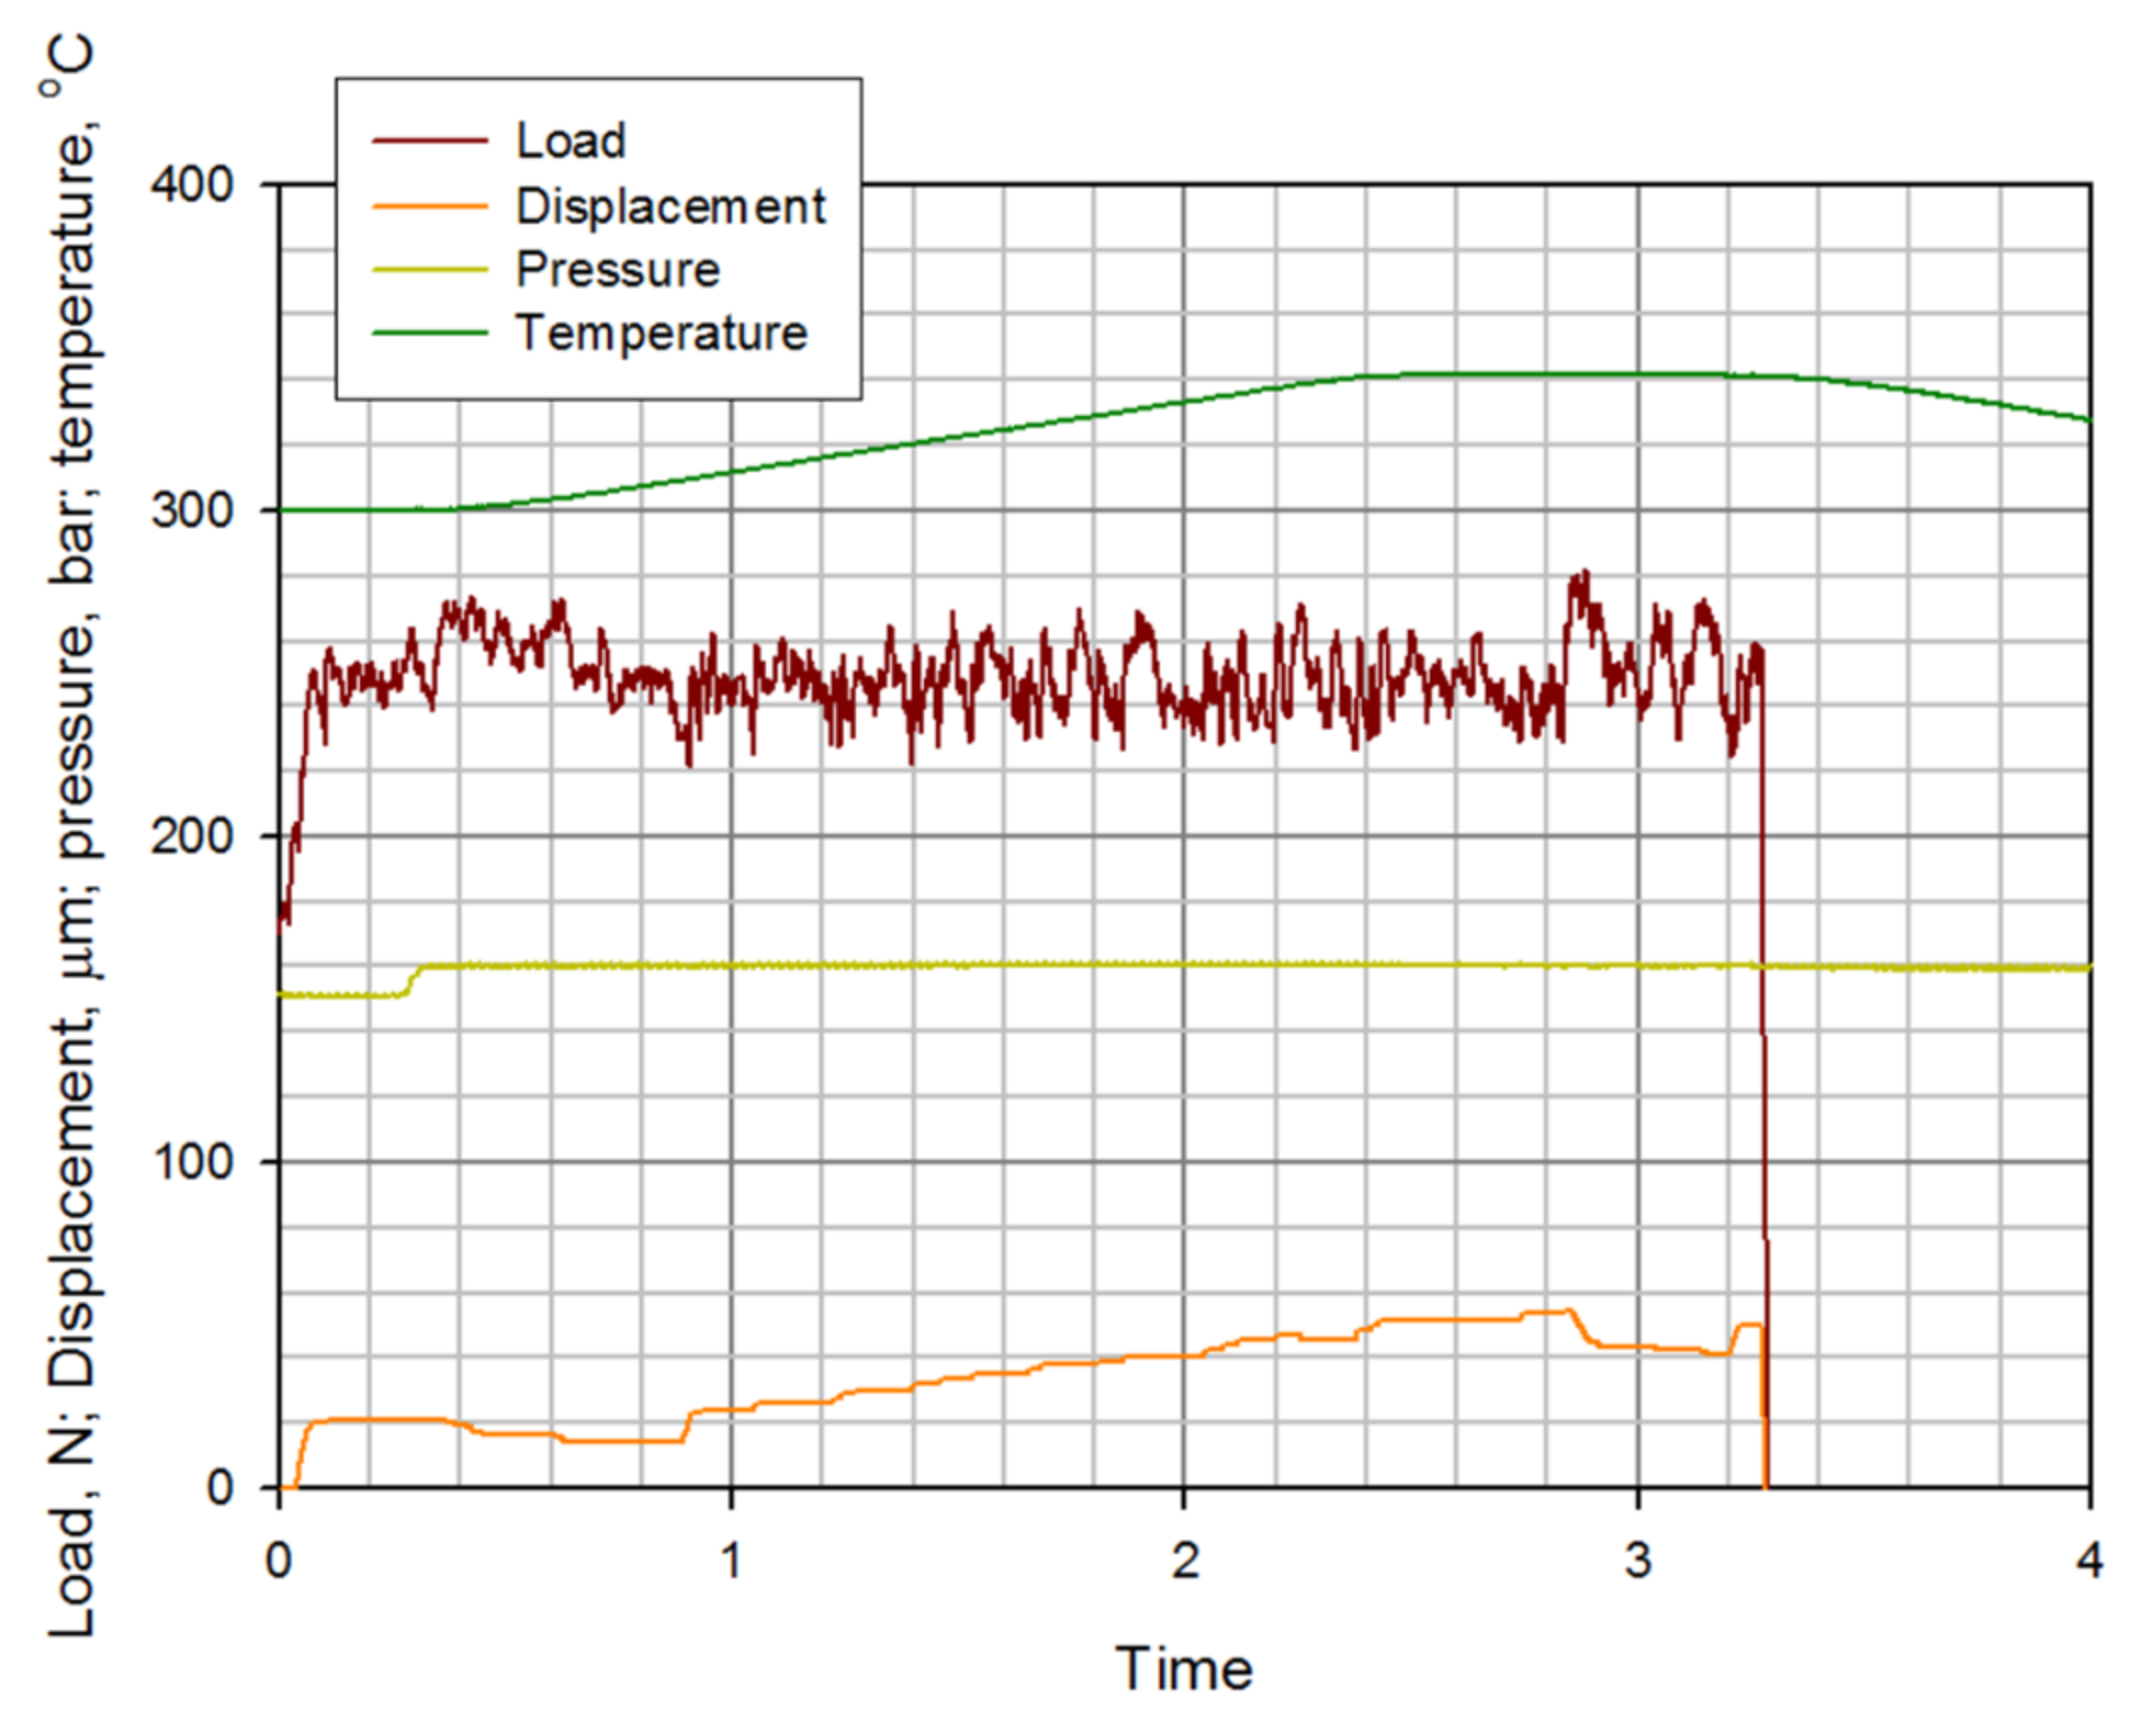
After the specimens were installed in the loading frame, the loading frame was installed into the pull rod of the autoclave, the autoclave was closed, pressurized, and heated up. After the autoclave was heated to 300 °C, the specimens were loaded to a target load of 250 N. After a while the temperature was increased to 340 °C, in order to observe the compensation of the loading control upon dimensional changes of the system from thermal expansion, and at the same time, how stable the loading is and how stable the autoclave temperature is at the planned test temperature of 340 °C. The measured values and stabilities are shown in Table 3 and measurement data in Figure 11. Displacement and pressure stabilities were not measured, as displacement control is used in order to control the loading, and pressure is determined by the water recirculation loop.
The measured stability of the load is relatively good and is expected to be, by experience, the same over the available loading range (0–5000 N). The stability is dependent on the friction force caused by the pull rod sealing, and that, on the other hand, is dependent on the pressure. The temperature stability and difference between the set-point and measured temperature are not the best possible. However, they can be improved by changing PID (proportional–integral–derivative) parameters of the temperature controller and using lower feed water temperature (feed water temperature is controlled by the recirculation loop).
2.3.4. Functionality of Local Radiation Shielding and Autoclave Loading/Unloading
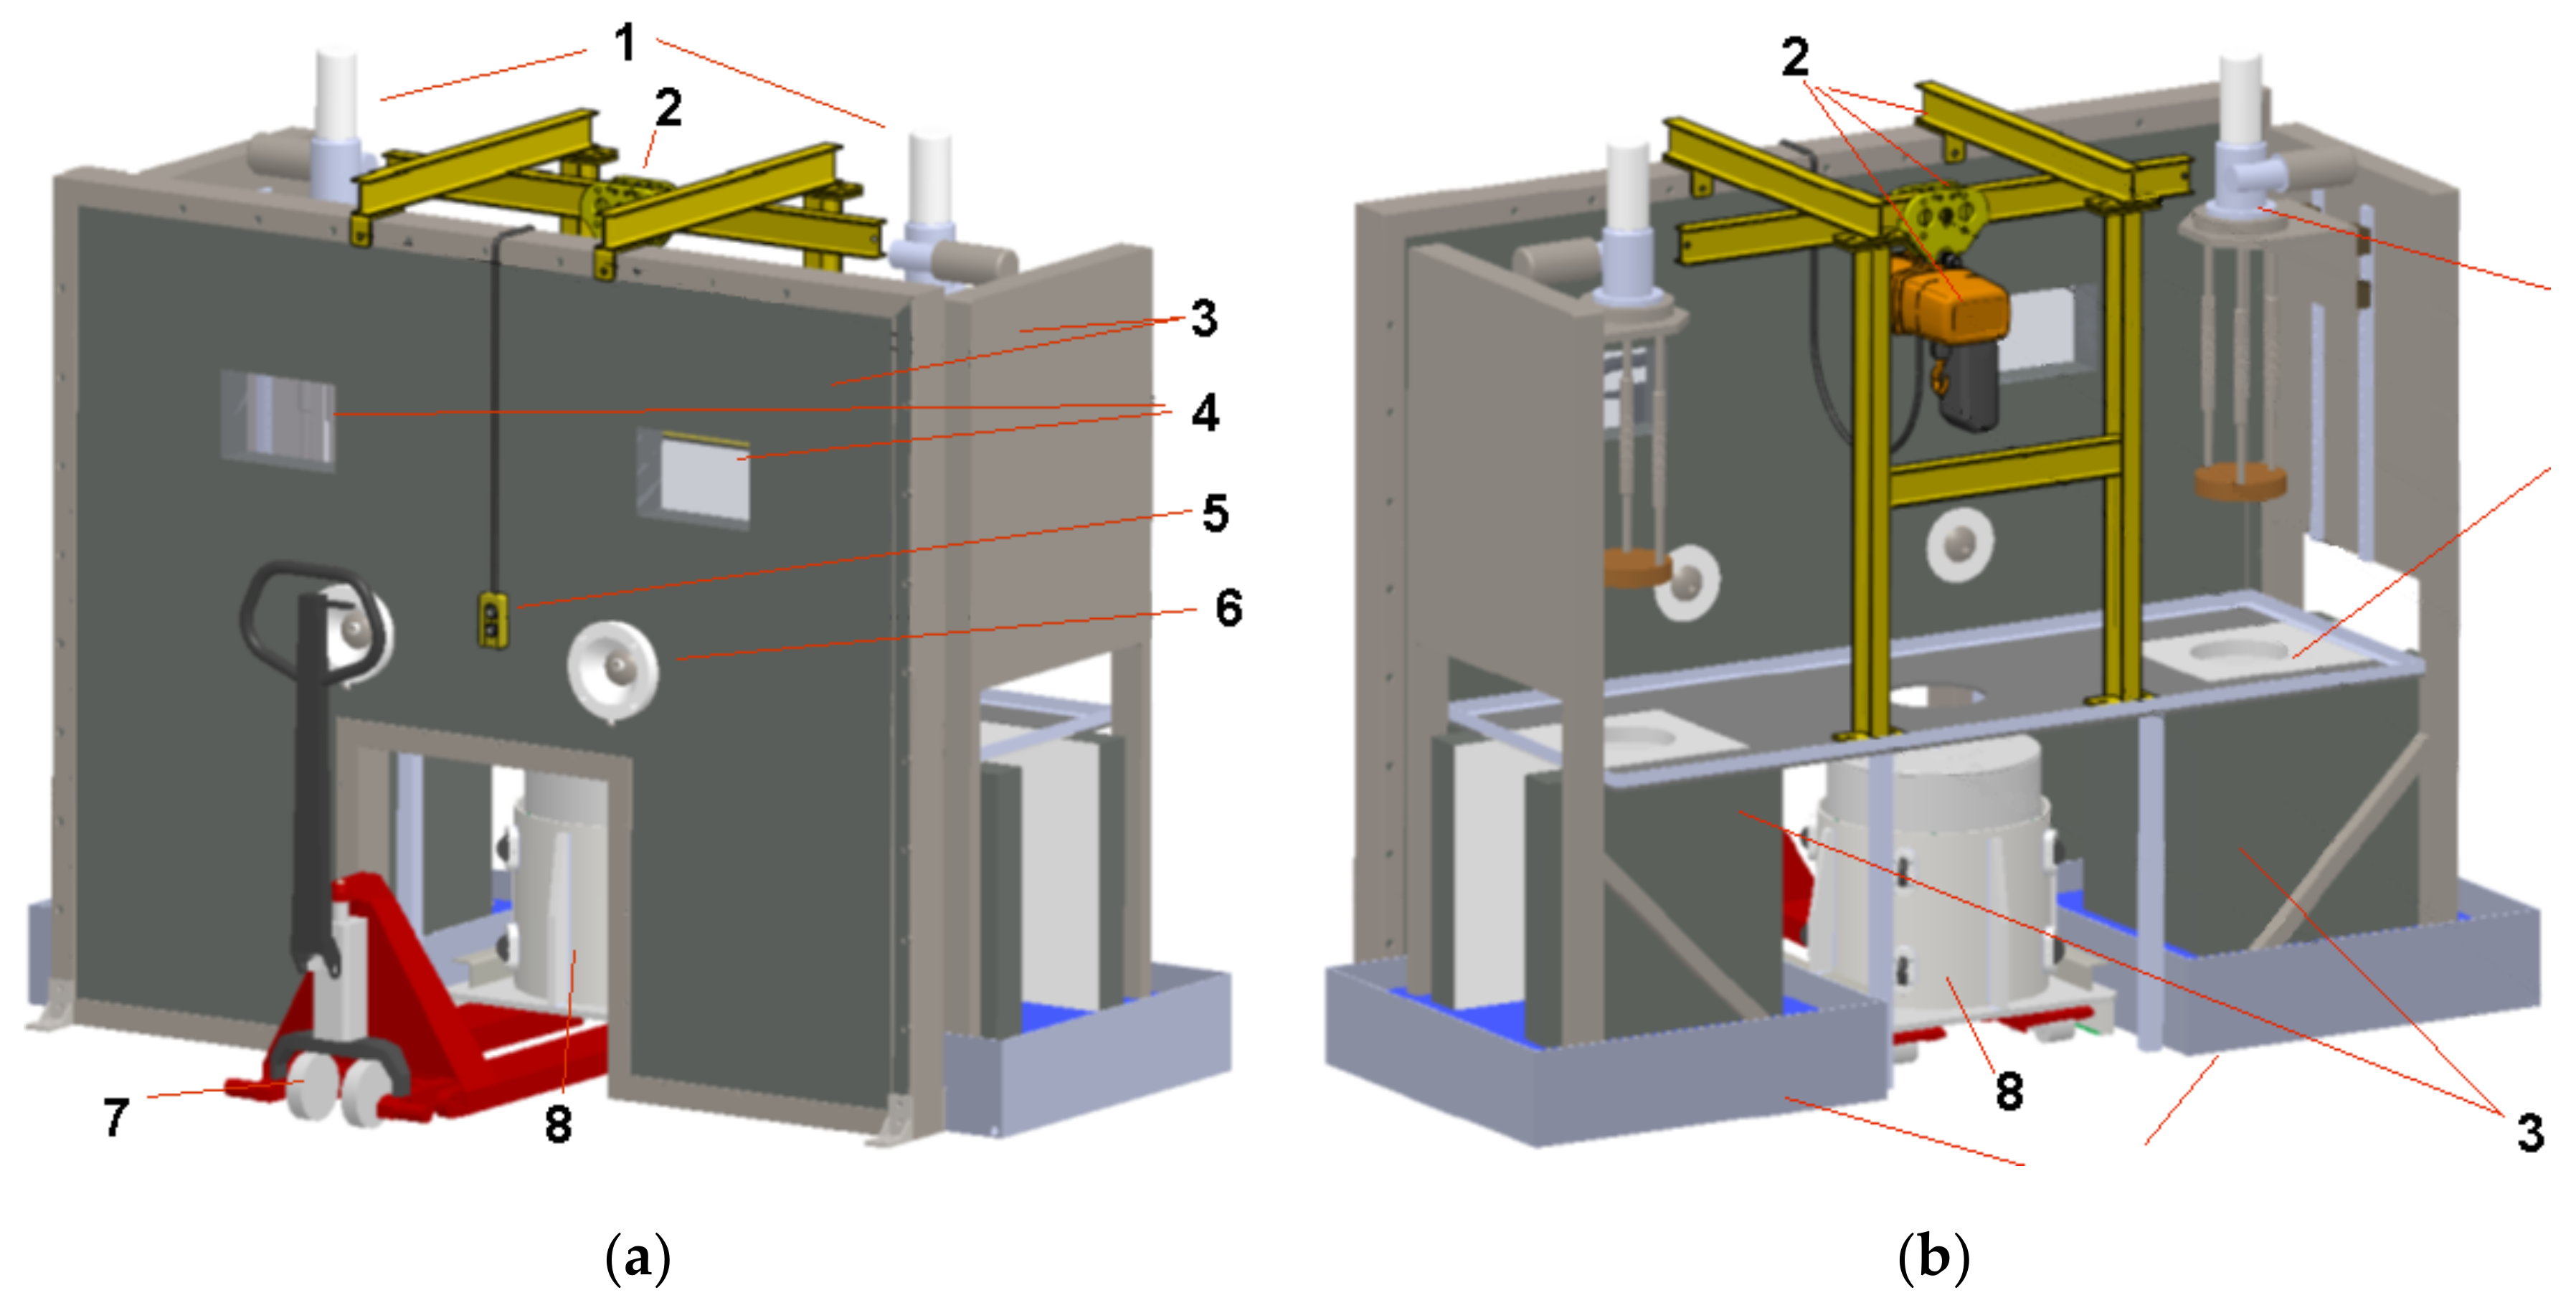
A schematic of the local shielding around two autoclaves and related manipulators and hoist used for autoclave loading and unloading procedure are shown in Figure 12. The process of autoclave loading takes place as follows:
- Specimens are installed into a loading frame in the hot cell. Then, the loading frame is put into a transport cask.
- The cask is transported to the autoclave laboratory with a hand pallet truck.
- The cask is pushed through an opening in the lead wall between the two autoclaves.
- The lid of the transport cask is lifted up, moved sideways away from the autoclave of interest, and laid down onto the working surface.
- The loading frame is lifted with the hoist, moved sideways towards the autoclave of interest, and laid down onto the working surface.
- The loading frame is grabbed with remote handling tongs and mounted into a hook in the pull rod under the open autoclave lid.
- The autoclave lid is lowered using an electro-mechanical lifting mechanism.
- Autoclave lid tightening nuts are installed and tightened using a long extension bar and a torque wrench.
The process of the autoclave unloading is identical to the loading process, but takes place in the reverse order. The above-described process is for O-ring testing when several specimens are installed into a single loading frame. If single specimens are tested (whether O-ring, slow strain rate test, compact tension, or bend specimens), the loading frame in the above-described process is replaced by the specimen to be tested. In that case, the specimen is mounted directly into the loading of the autoclave.
Figure 12.
(a) Front and (b) back views of the autoclaves with local shielding and associated equipment: (1) autoclaves with stepper motor controlled loading, (2) hoist with supporting structure, (3) lead shielding, (4) leaded windows, (5) hoist hand controller, (6) remote handling tong support (tongs not present), (7) hand pallet truck, (8) transport cask.

2.4. IASCC Tests of FTT O-Ring Specimens
The aims of the first IASCC test series using neutron irradiated FTT O-rings were to verify the functionality of VTT’s new autoclave testing facility, to study the influence of PWR water dissolved hydrogen level on crack initiation in highly irradiated O-ring specimens, and to produce IASCC samples for post-test characterization. Two test runs were performed and two specimens were tested in each run. In each run, one 100 dpa and one 65 dpa specimen was tested. All specimens were 8-mm long in order to have equal stress levels. Two of the specimens were originally prepared to that length and two were cut from 10 mm specimens in order to produce slices for TEM specimens and H2 and He measurements. The test parameters are listed below:
- T = 340 °C,
- P = 155 bar,
- B = 1000 ppm (added as H3BO3),
- Li = 2 ppm (added as LiOH),
- DH2 ~20 cc/kg and ~50 cc/kg,
- DO2 < 5 ppb,
- Max. stress 62–65% of YS depending on the neutron dose (extrapolated from calibration curves in presentation of Jenssen & Smith [18]).
The target σ/σYS was estimated from the literature data shown in Figure 3, so that the specimen failure would take place in a reasonable amount of time. The applied load, in order to get the desired stress, was calculated by Autodesk Inventor. The target stress was 75% of the yield strength. The 320 °C yield strengths of the 65 and 100 dpa materials are 937 and 982 MPa, respectively. It was assumed that the difference between 320 °C and 340 °C (used in the autoclave tests) was not significant. Application of load to the specimens was initiated as soon as separate type 316L, Pd, and Pt sample potentials differed less than 10 mV from the body of the autoclave. This can be interpreted as all potentials being close to the hydrogen line.
3. Results
Three foils from each of the two FTT dpa levels were examined by TEM to characterize their as-irradiated microstructure. Two autoclave test runs were done, with two O-ring specimens tested in each run. In each run, one 100 dpa and one 65 dpa specimen was tested.
3.1. As-Irradiated 65 dpa Flux Thimble Tube Microstructure
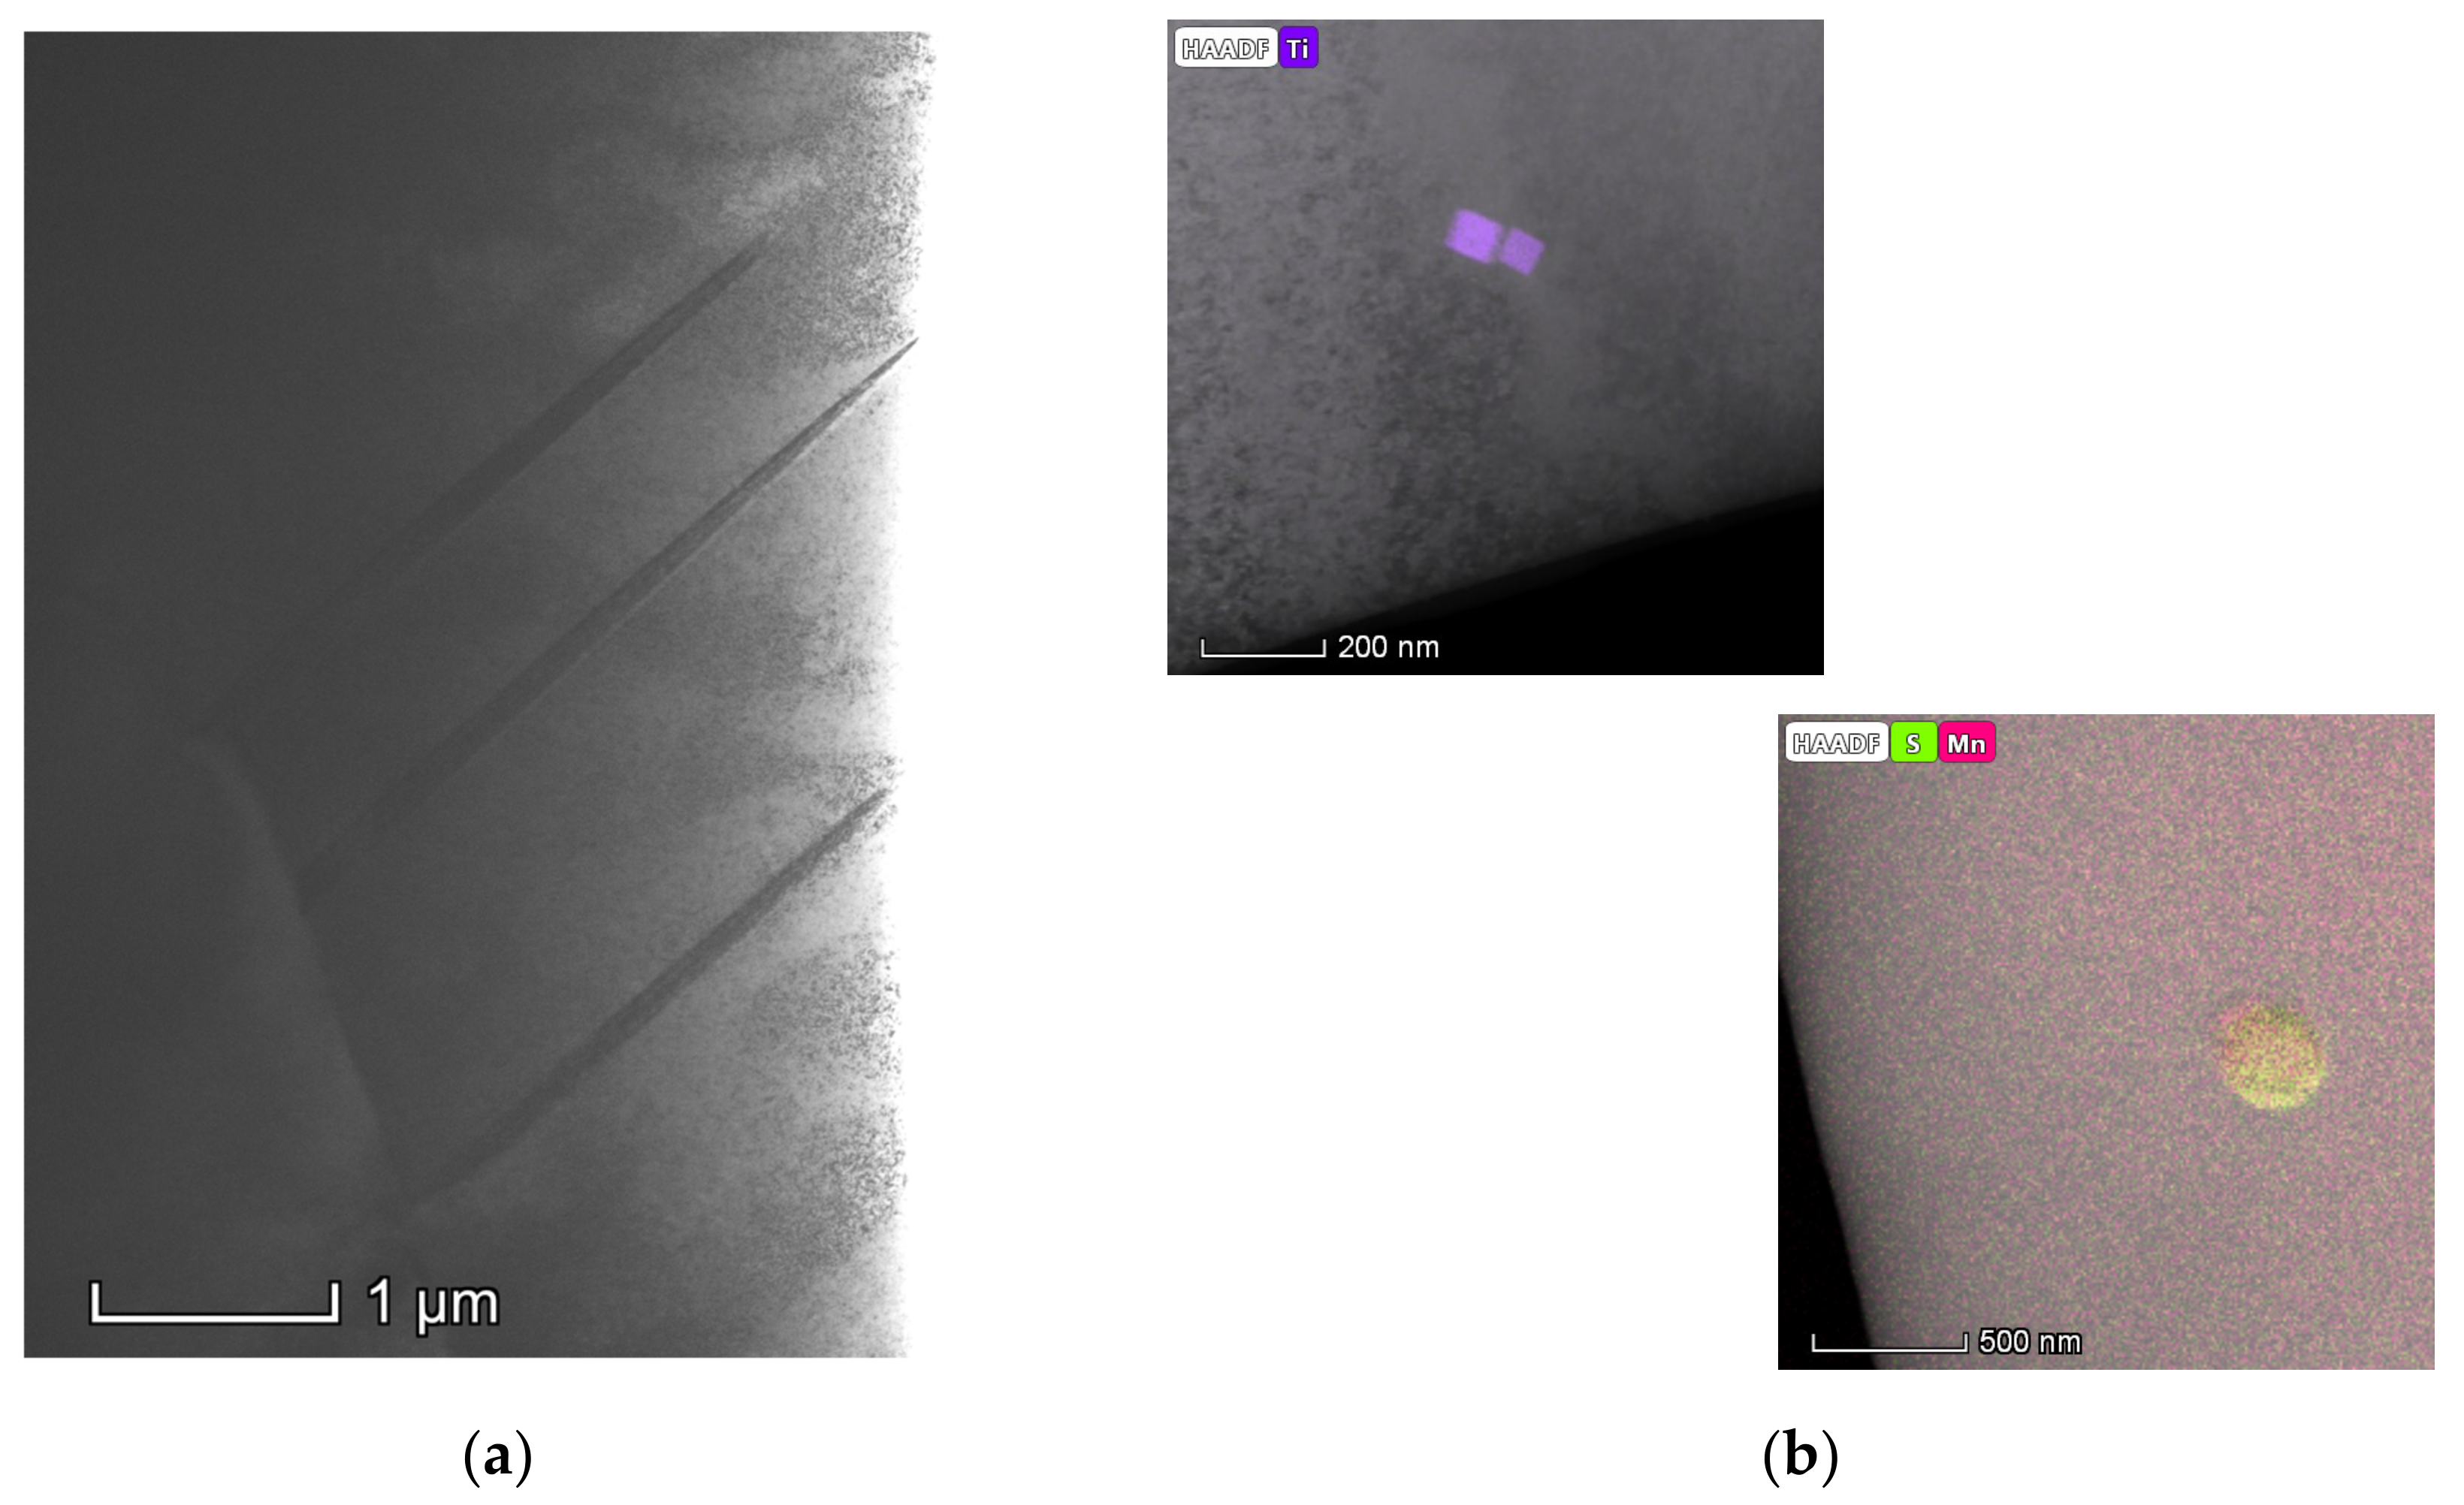
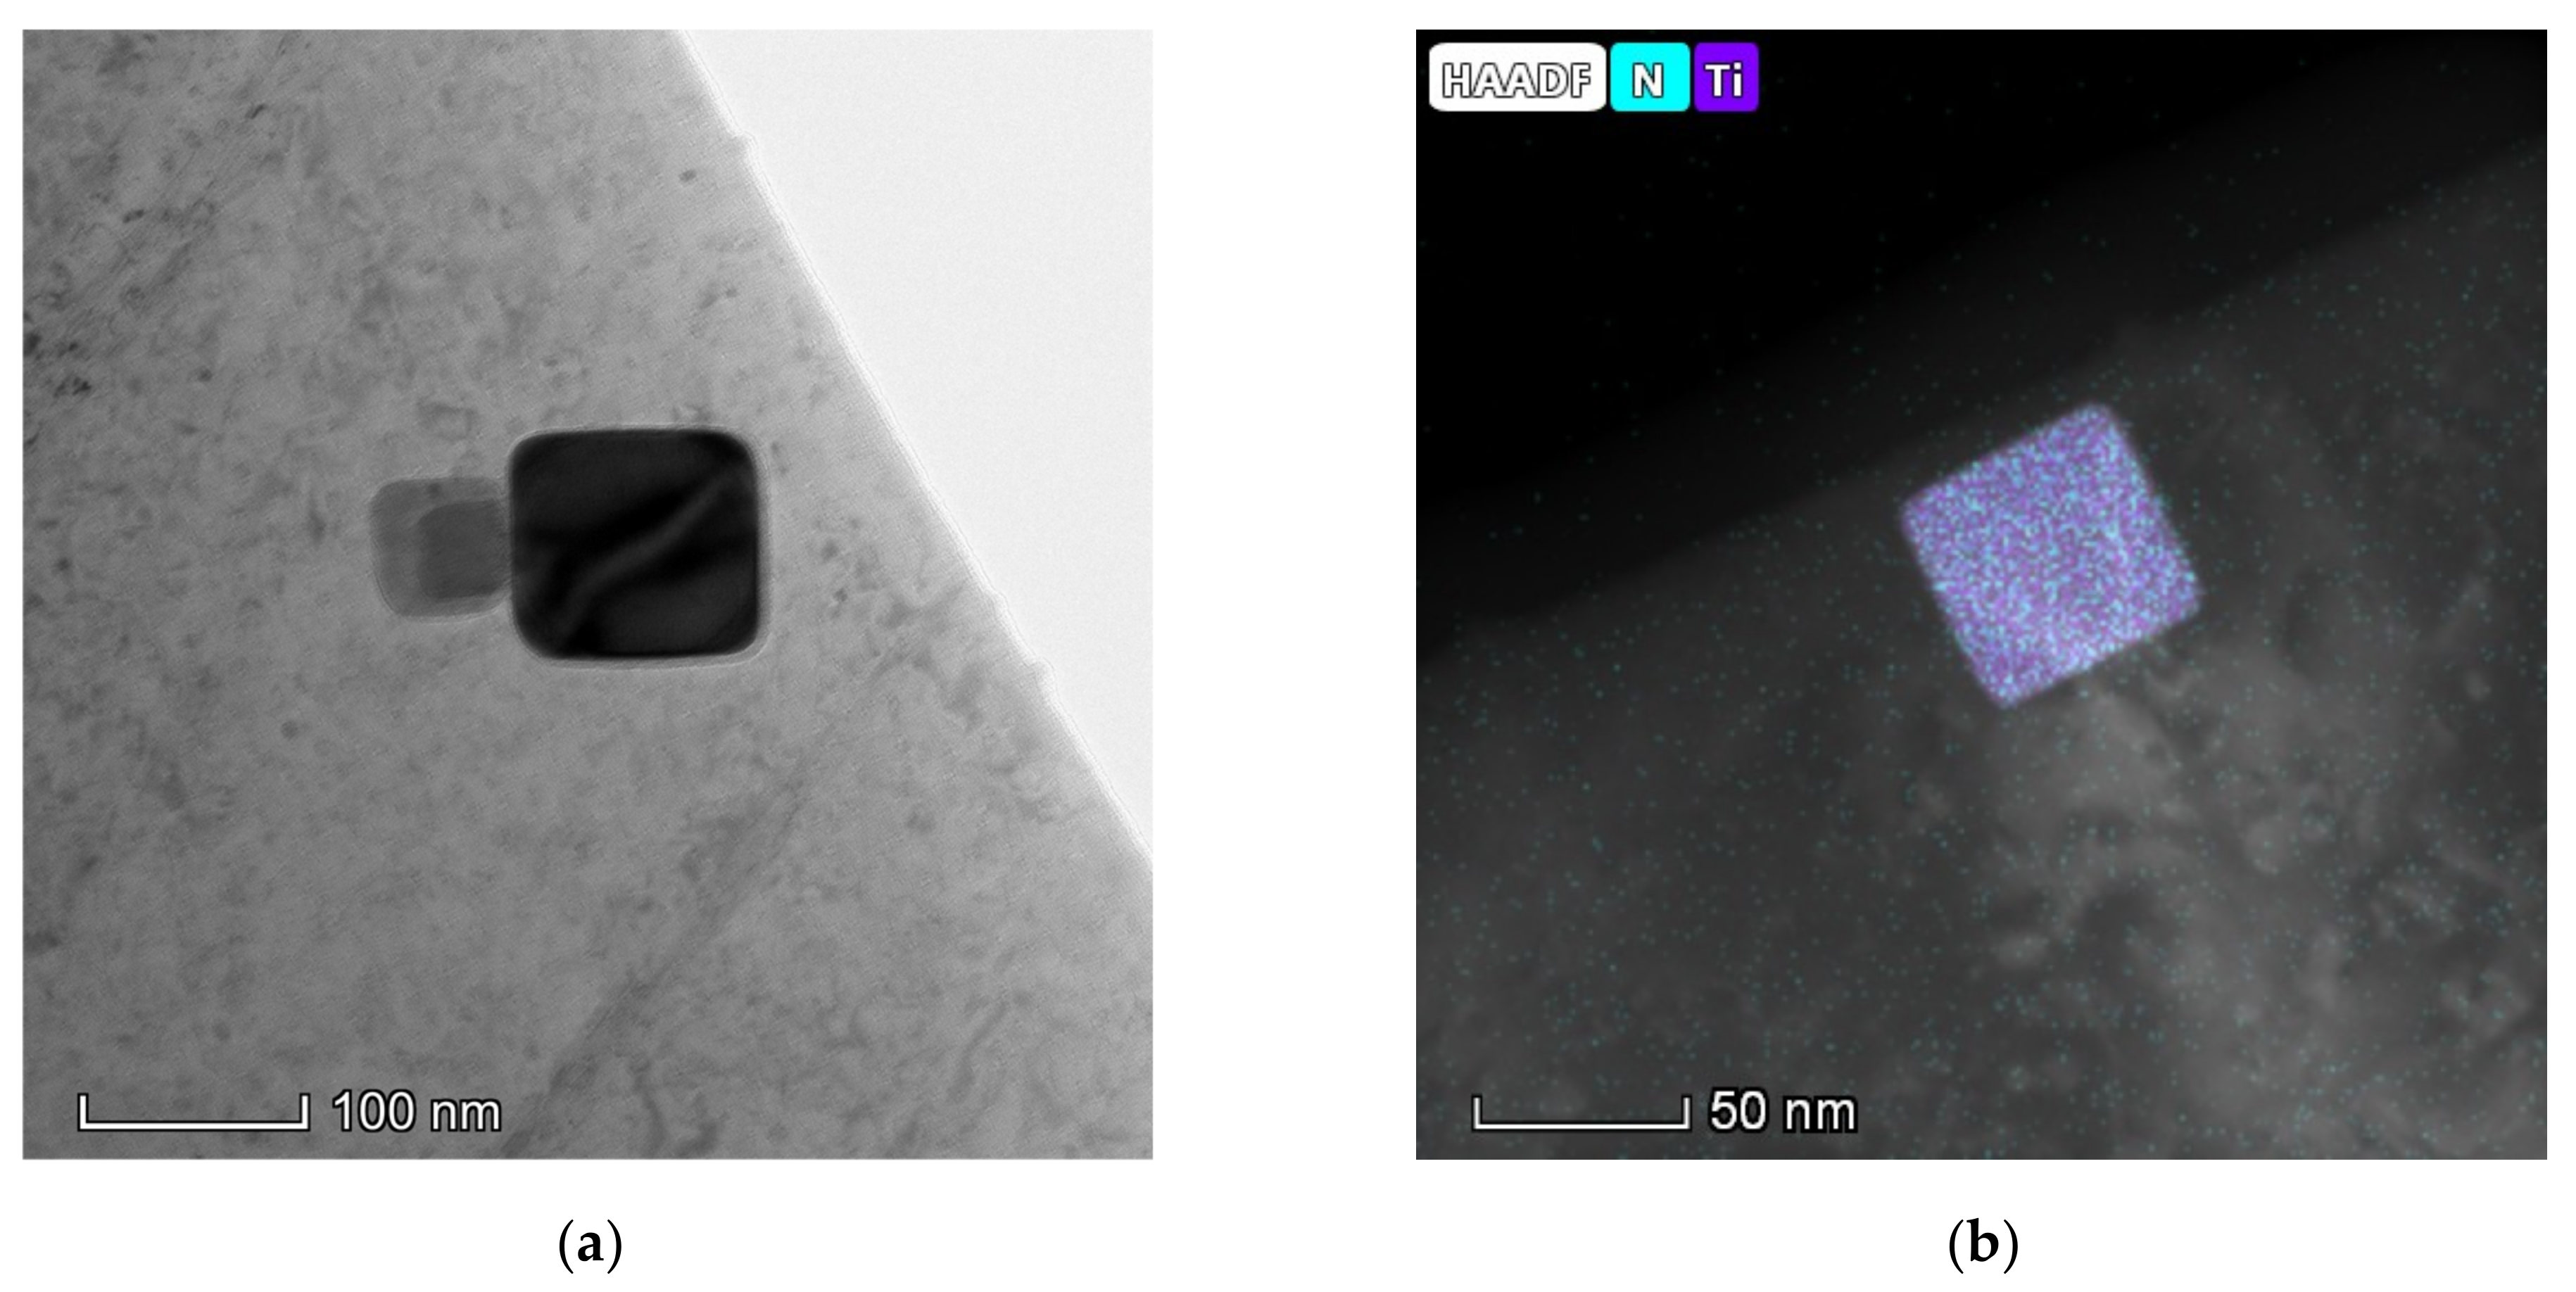
The as-irradiated 65 dpa material showed clear evidence of significant neutron-induced changes in microstructure. As seen in Figure 13, most readily evident already at low magnification was the lack of any network dislocation lines remaining from the dense population typically expected in an as-cold-worked (non-irradiated) Type 316 austenitic stainless steel. However, in some grains tilted in suitable orientation, parallel bands could be observed, which correspond to the bands of epsilon martensite and twins typical of cold-worked austenitic stainless steels. The contrast of these bands is not typically altered by neutron irradiation, as they are a form of long-range ordering in the matrix that cannot be altered by neutron bombardment in the same way as network dislocations can (Figure 14a). Inspection at higher magnification revealed that occasionally some cuboidal precipitates could also be observed (Figure 14b). EDS analysis indicated they were Ti-rich. Likewise, occasionally a MnS inclusion could be found. Based on their relatively large size and sparse distribution, those particles most likely originate from the original steel-making process, and are not a radiation-induced phenomenon.
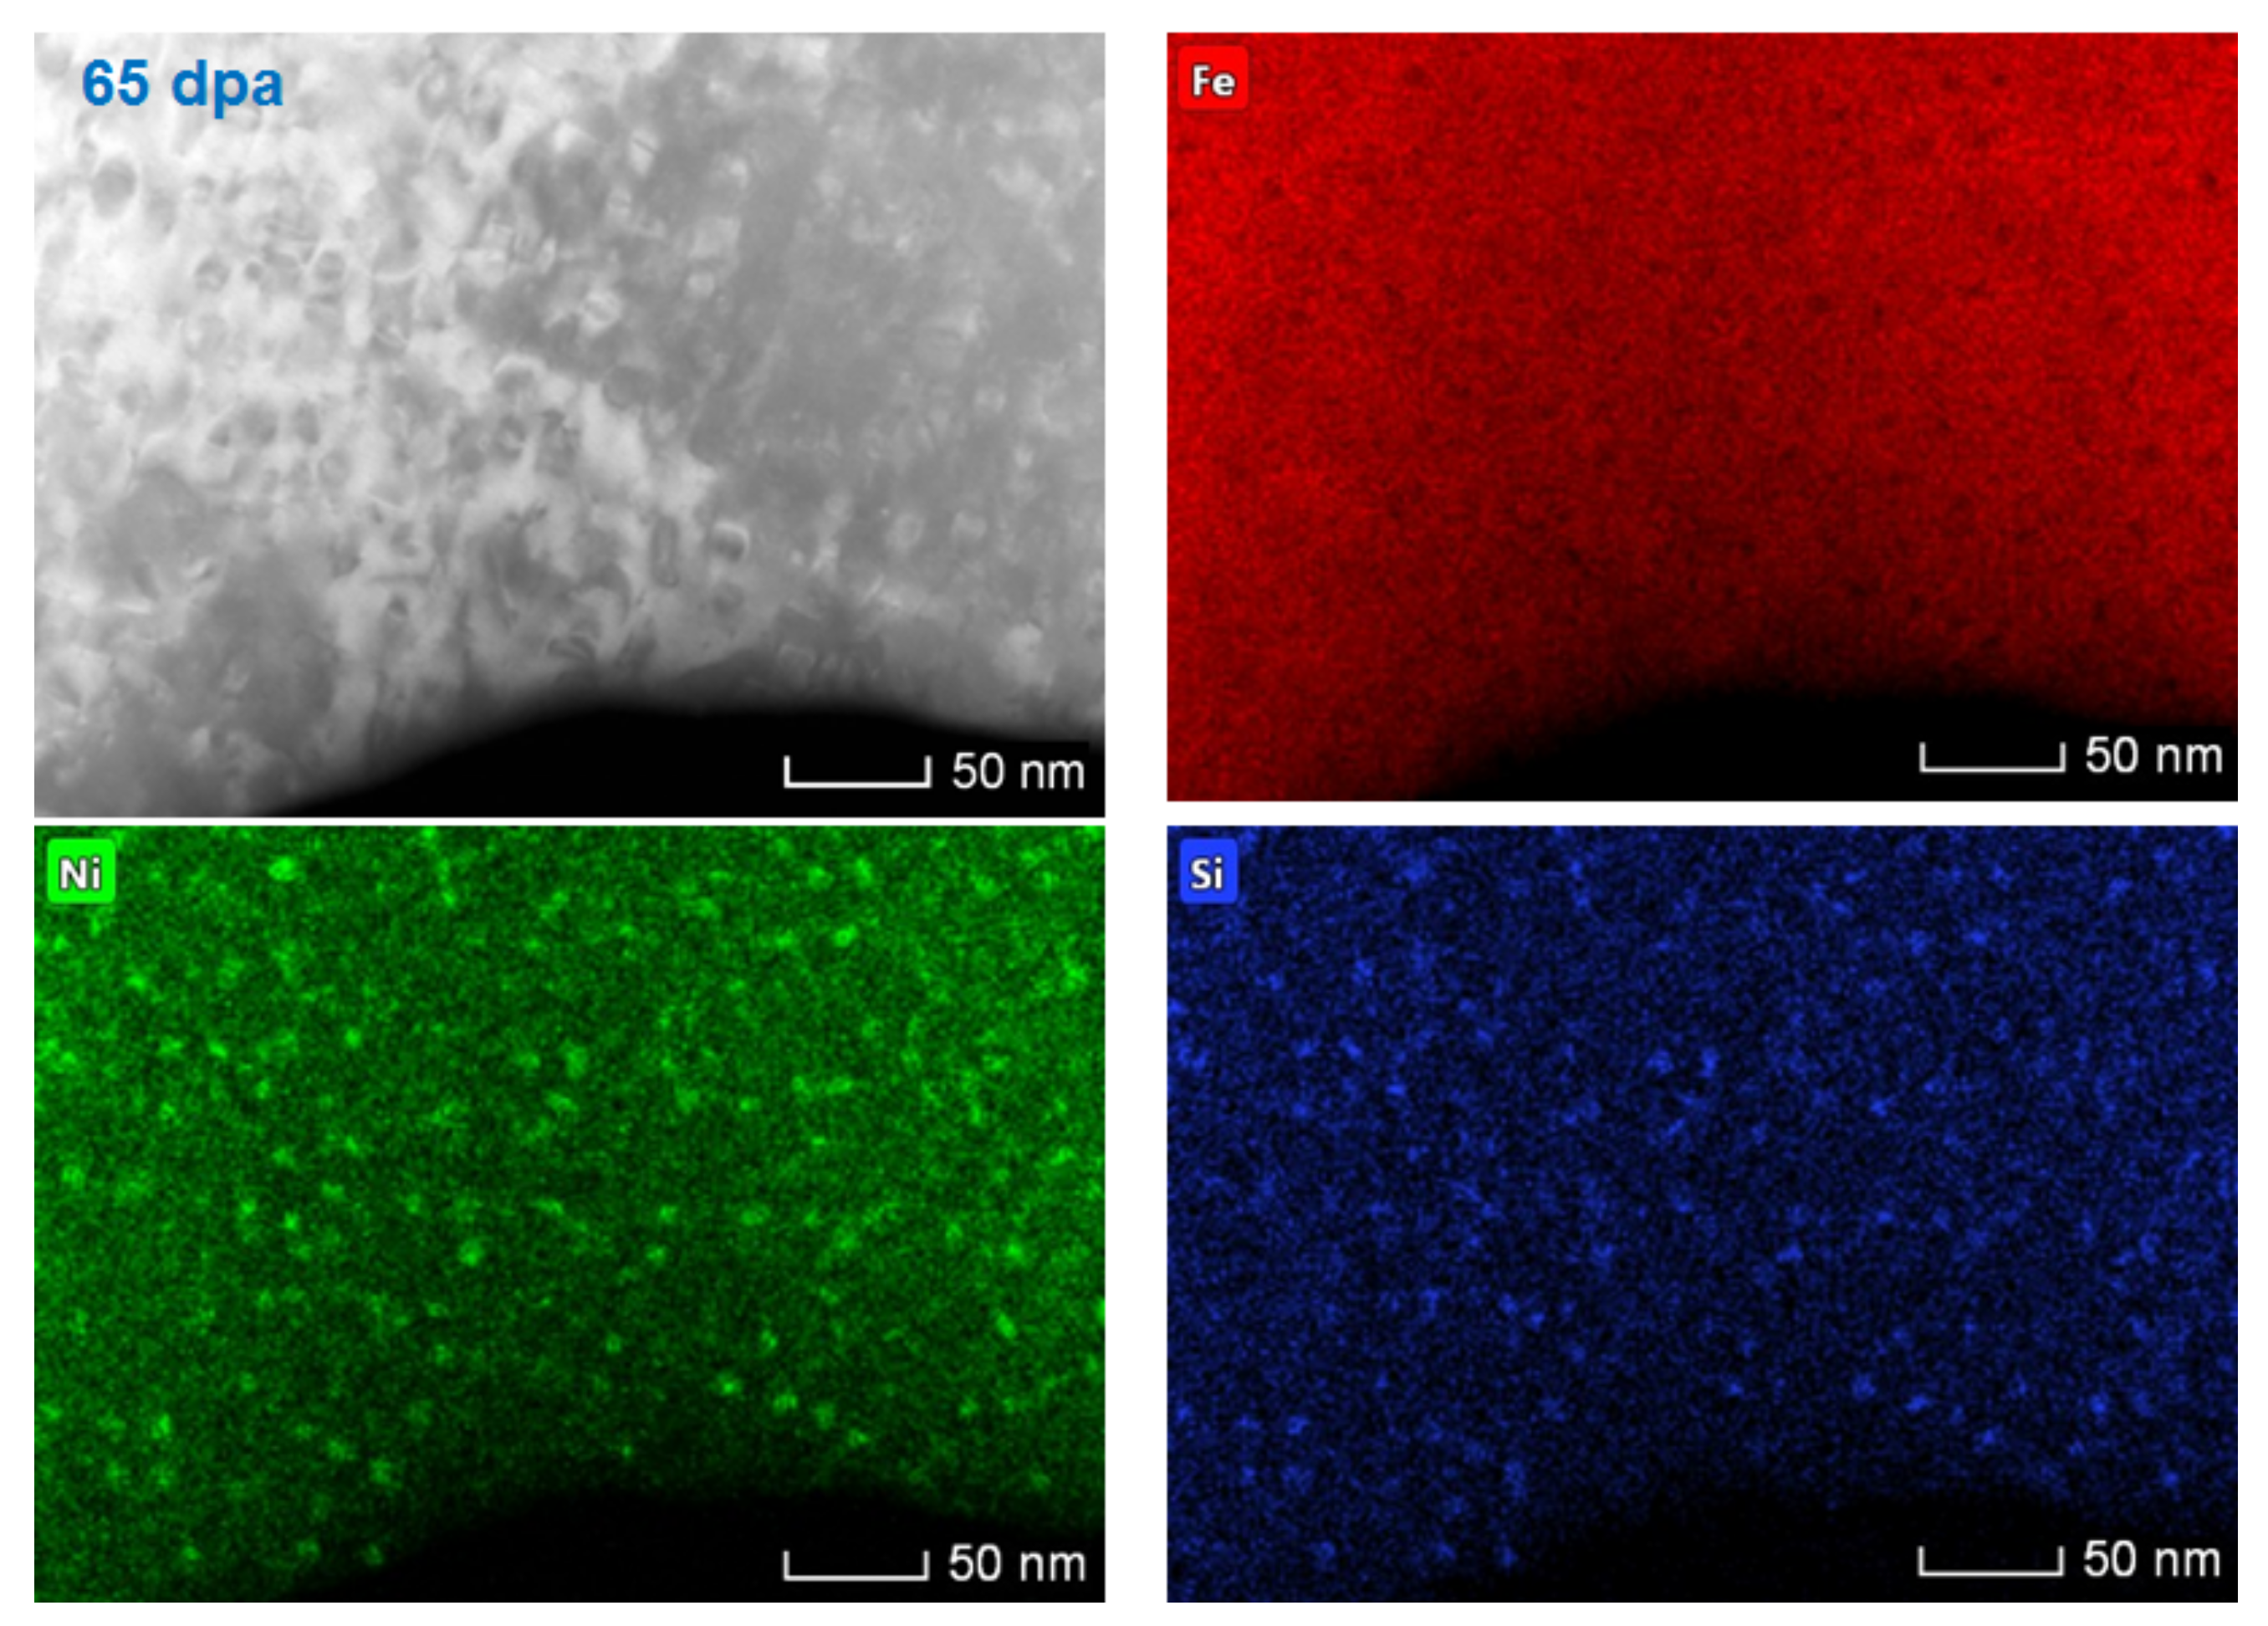
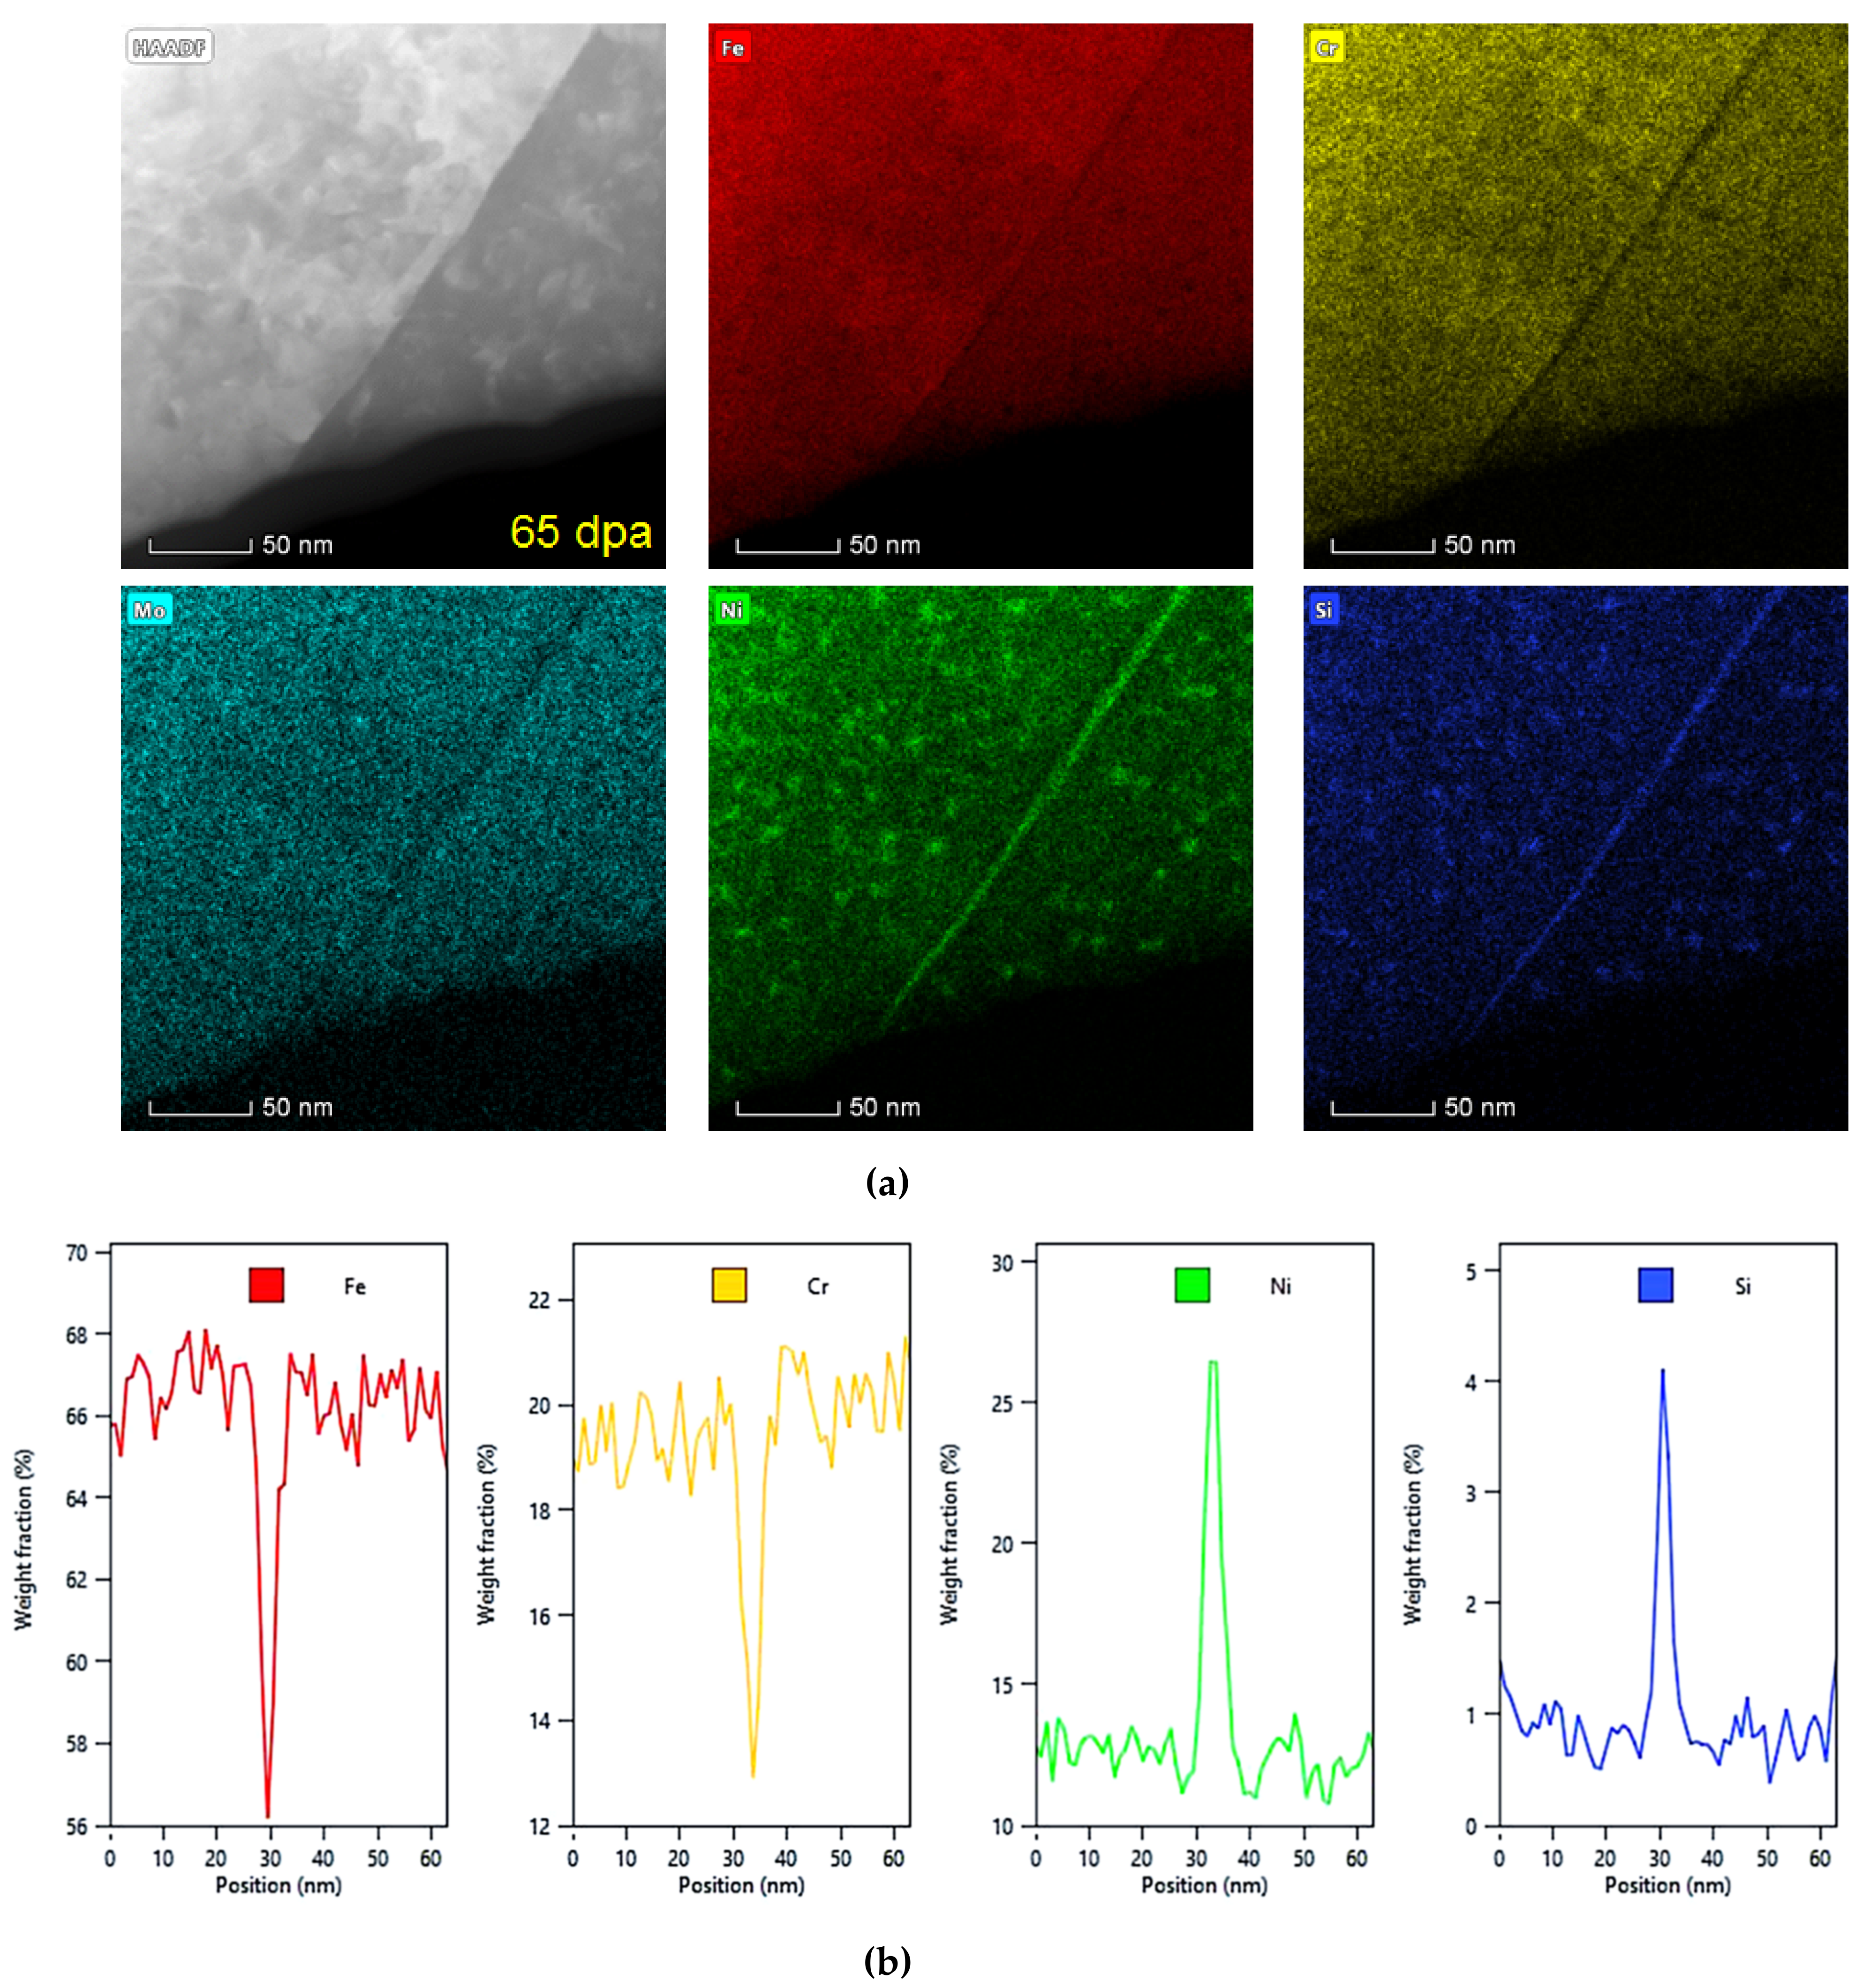
Of greater interest in terms of radiation-induced features are nano-scale phenomena typically only visible at high magnifications. As shown in Figure 15, at high magnification, spectral imaging reveals marked co-segregation of Ni and Si as clusters or precipitates on the order of several nanometers in size as a consequence of the neutron irradiation. Likewise, as shown in the high angle annular dark field (HAADF) and spectral images in Figure 16, Ni and Si also segregated uniformly along the grain boundary, while Cr, Fe and Mo became depleted. The maps in Figure 16 also show that there may be a band along either side of the grain boundary in which the Ni-Si co-segregation within the matrix is not so prevalent, likely due to competition between sinks as a function of diffusion distance.
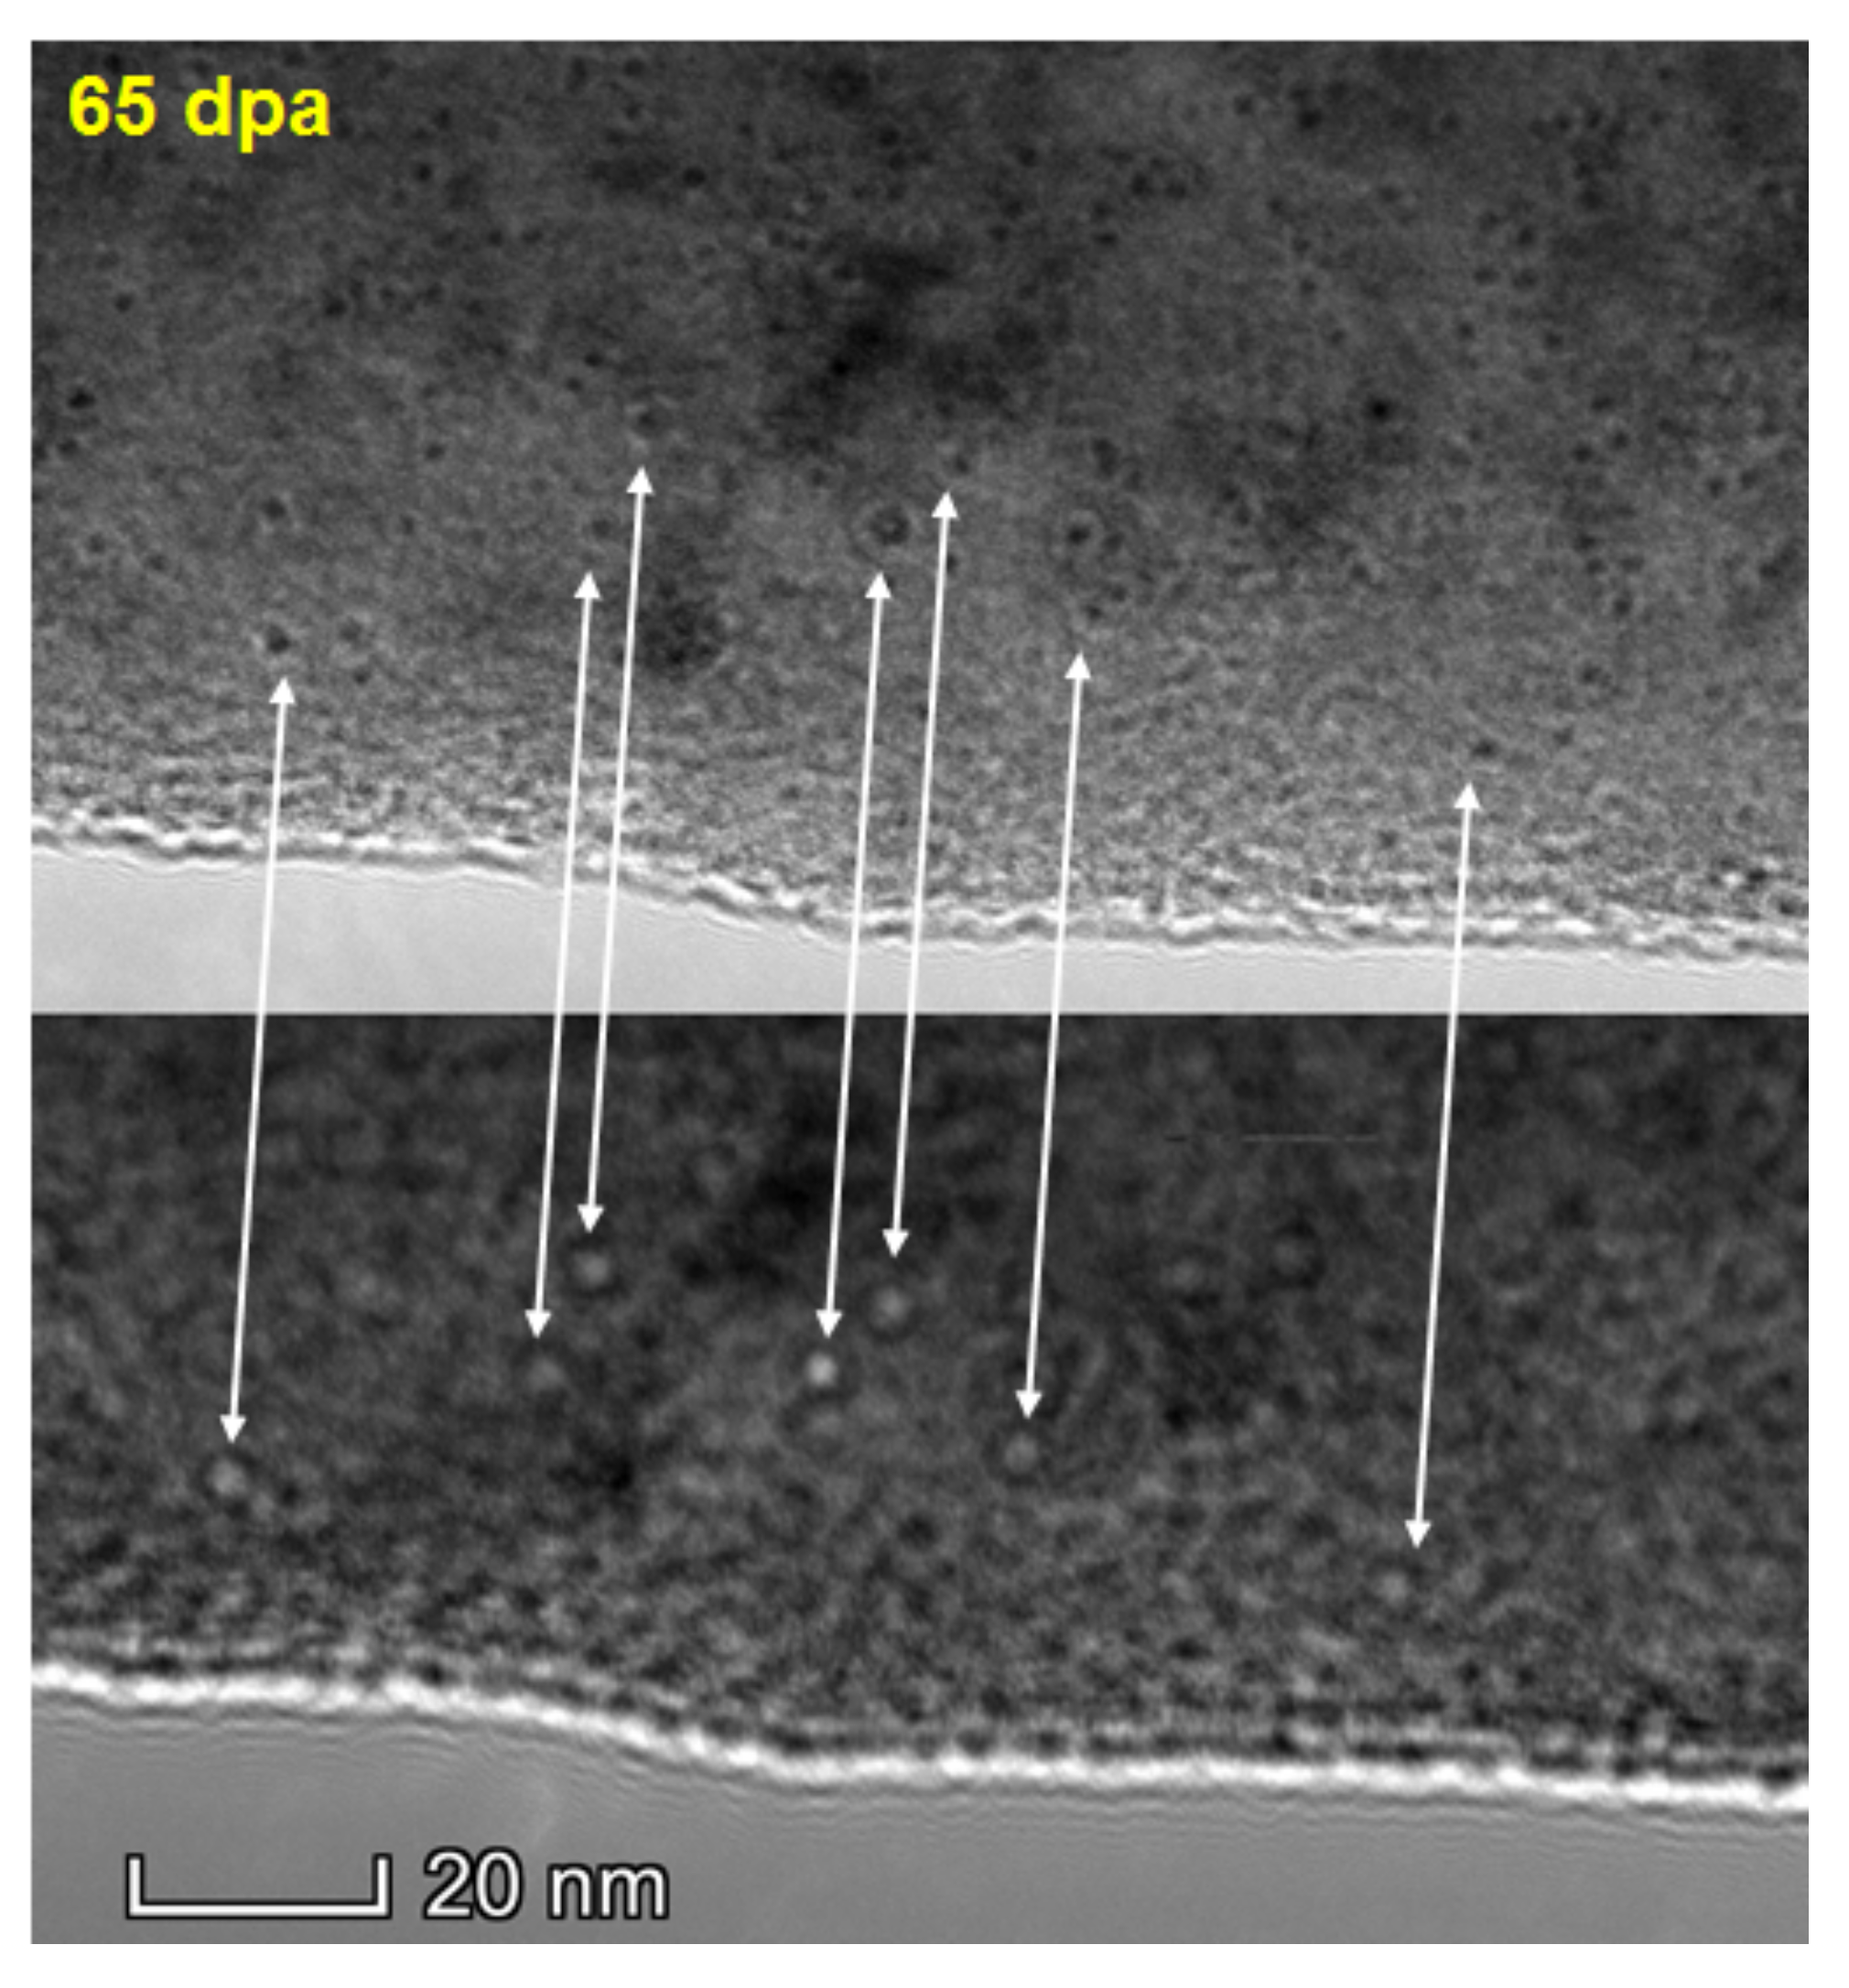
Finally, by utilizing the method of over- and under-focusing, it was possible to reveal a population of very fine cavities in the 65 dpa FTT materials. As shown in Figure 17, although they were not predominant enough to be very easy to image, they could be found. The white arrows indicate the corresponding features in the under- and over-focused images. Their size was on the order of only a few nanometers in diameter.
3.2. As-Irradiated 100 dpa Flux Thimble Tube Material
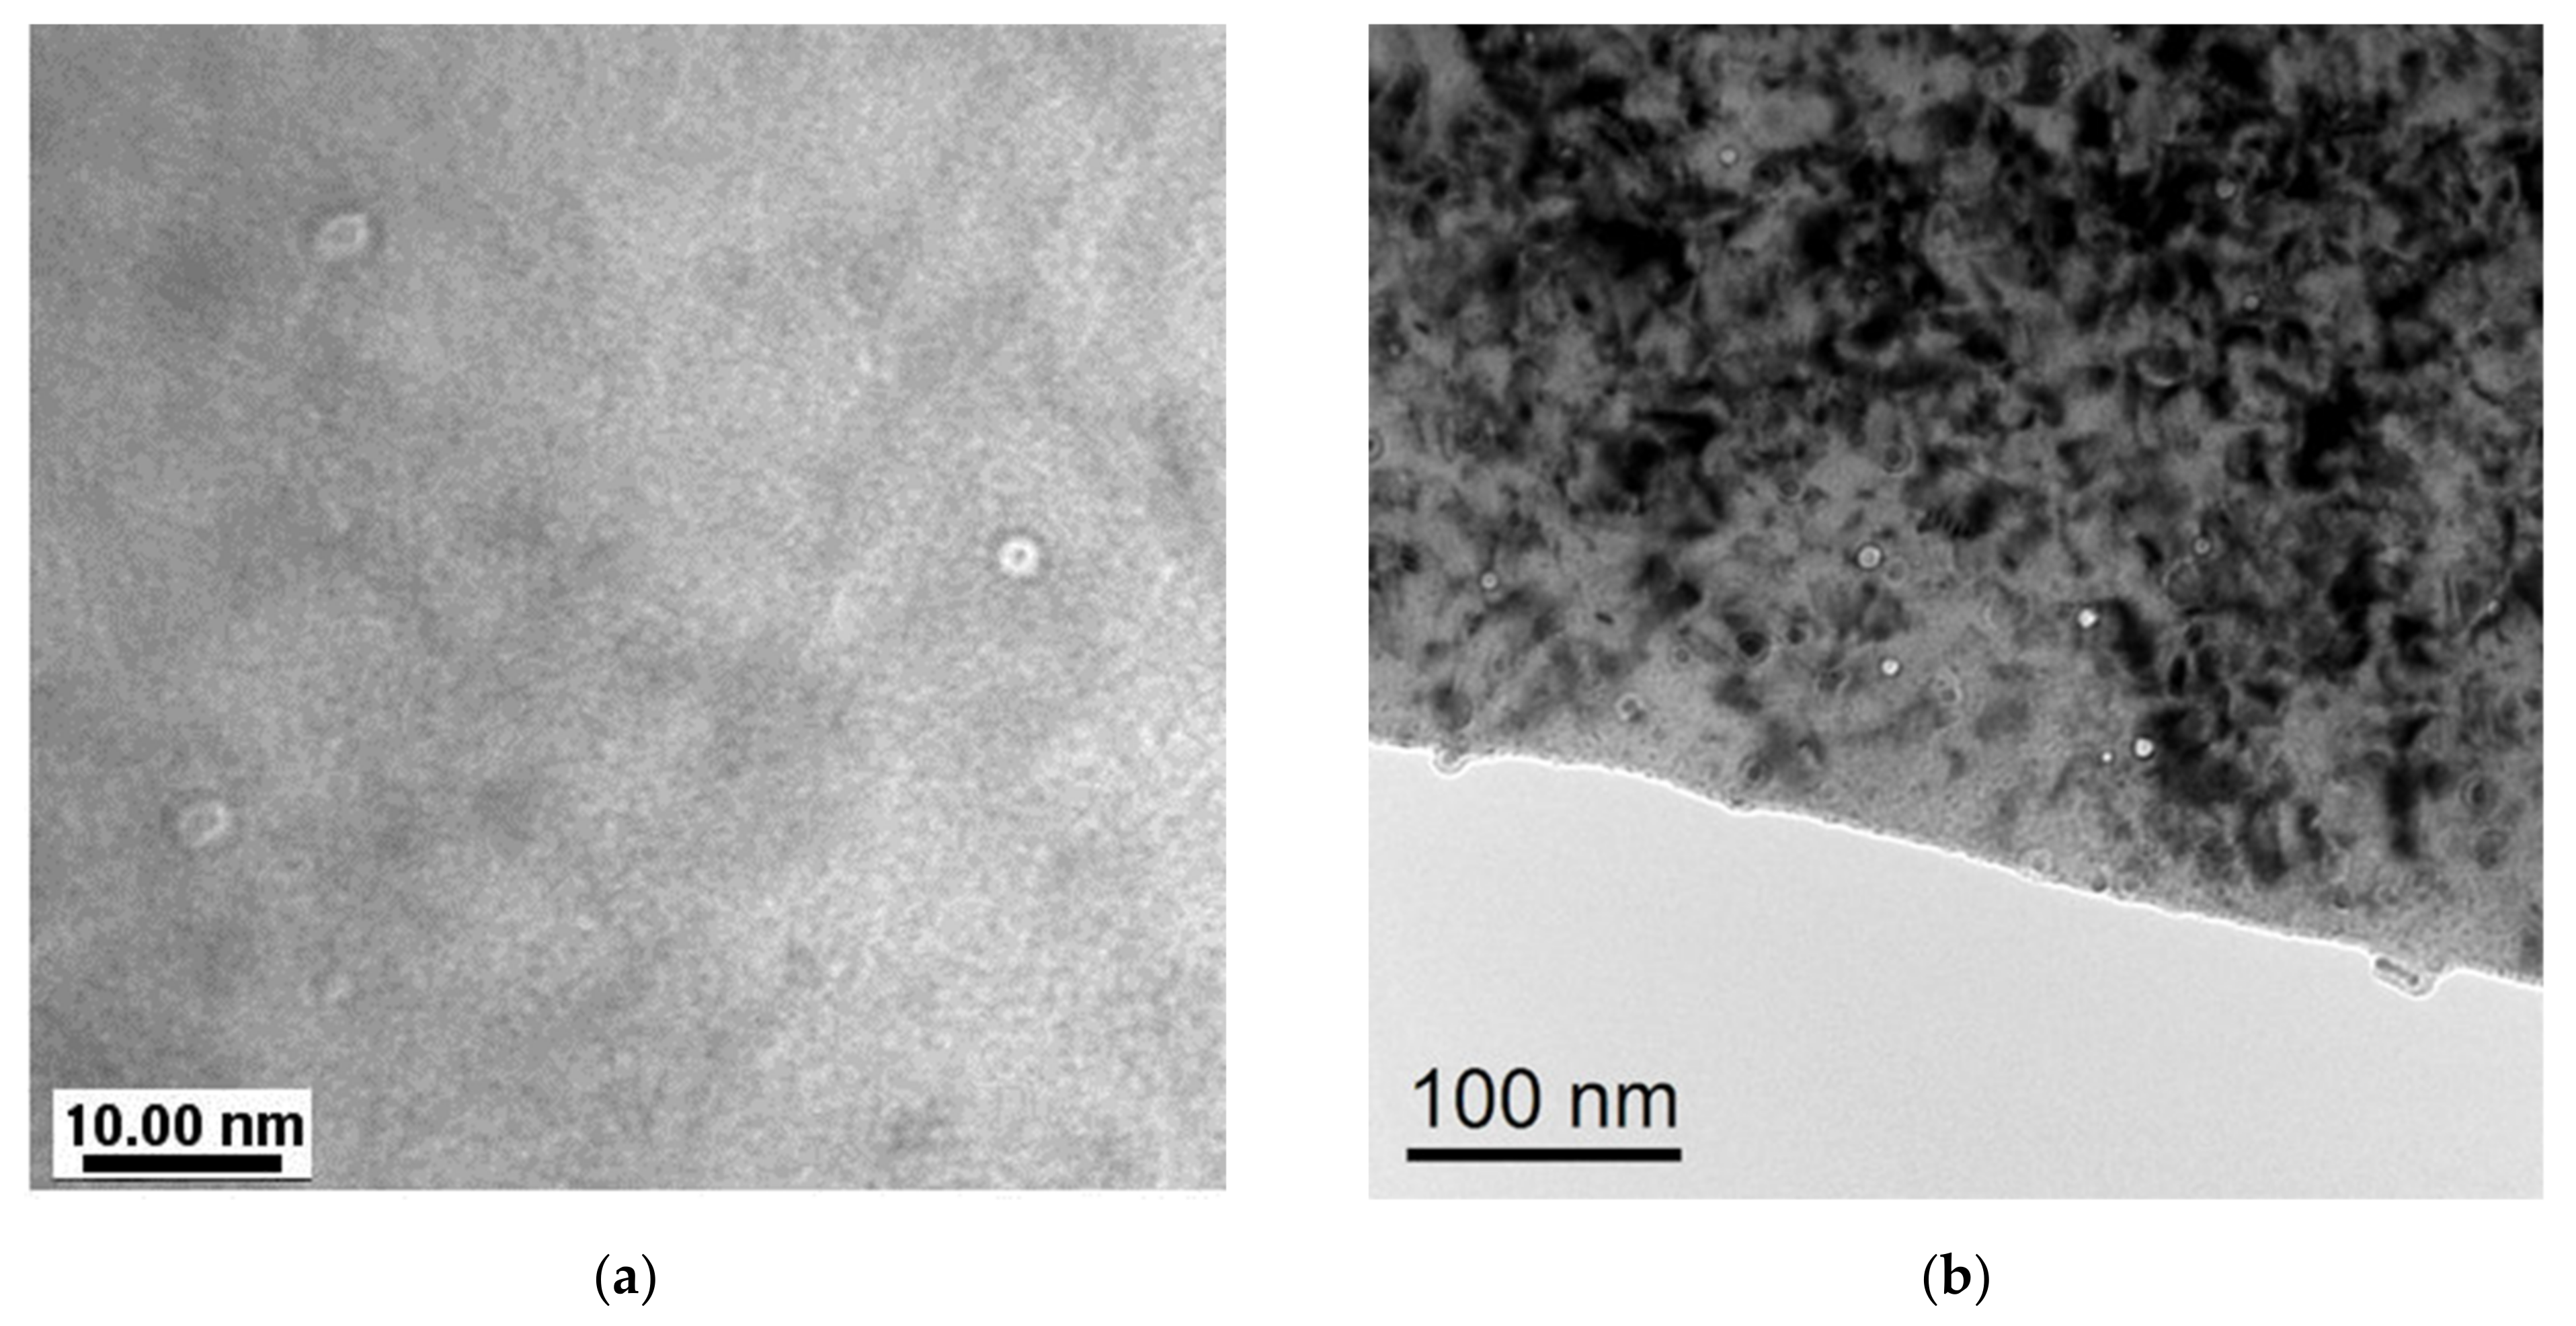
As with the 65 dpa material, the 100 dpa material no longer exhibited any dislocations lines that would be associated with the initial cold-work, but the bands of epsilon/twins remained despite the extensive neutron irradiation. This is shown in the images in Figure 18. Also evident in the images are round holes in the foil corresponding to round non-metallic inclusions that have either experienced preferential electrolytic attack at their interface during foil preparation, and/or fallen completely out of the foil. Inclusions and faceted precipitates were also present in the 100 dpa material, again showing Ti-rich faceted particles and occasional round MnS inclusions. As shown in Figure 19, the cuboidal ones were on the order of 50–100 nm on a side, and in the example composition map, the Ti could also be bonded as a TiN in some cases.
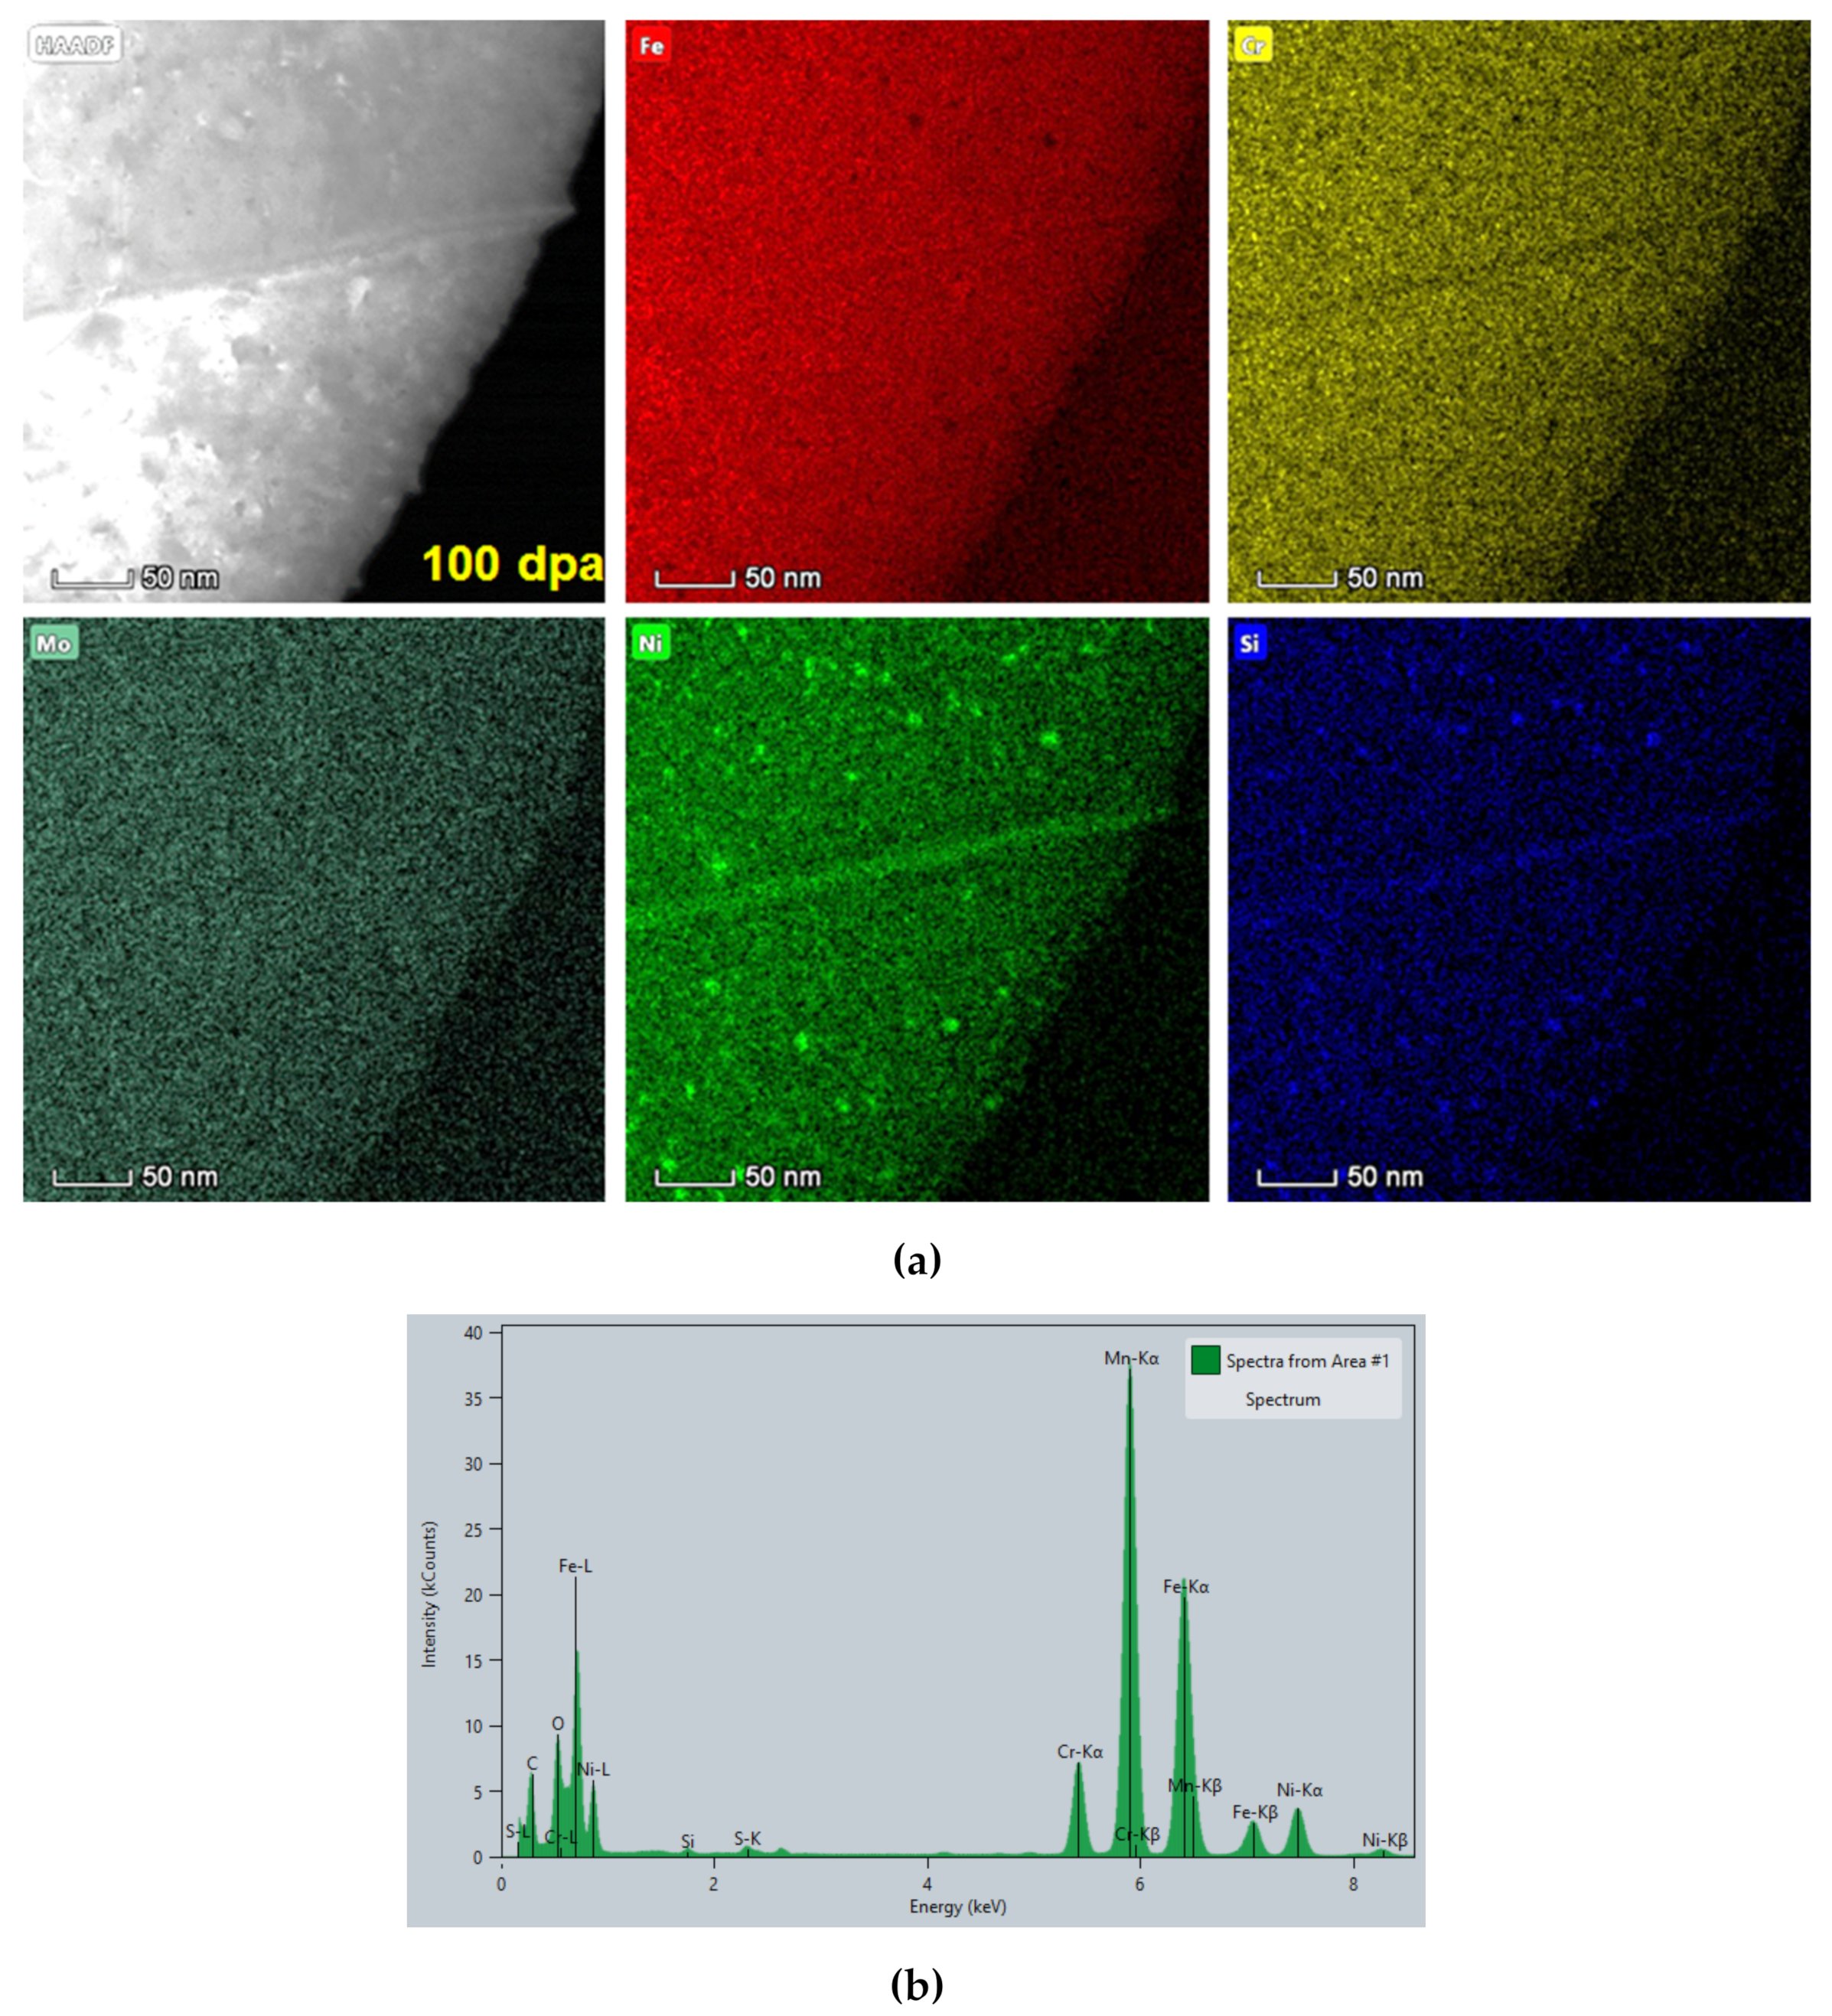
When it comes to effects of irradiation, spectrum imaging at a grain boundary revealed similar segregation behavior in the 100 dpa material as for the 65 dpa material. As shown in Figure 20, Ni and Si co-segregated both uniformly along the grain boundary, and as clusters or precipitates in the matrix. In the immediate vicinity of the grain boundary, the matrix segregation was much sparser. However, as shown in the X-ray energy spectrum accompanying the maps, there are very strong Mn-Kα and Kβ peaks caused by the radioactivity of the specimen. This interfered with the semi-quantitative results for Cr and Fe, preventing accurate composition profiles across the grain boundaries from being extracted from the spectral image.
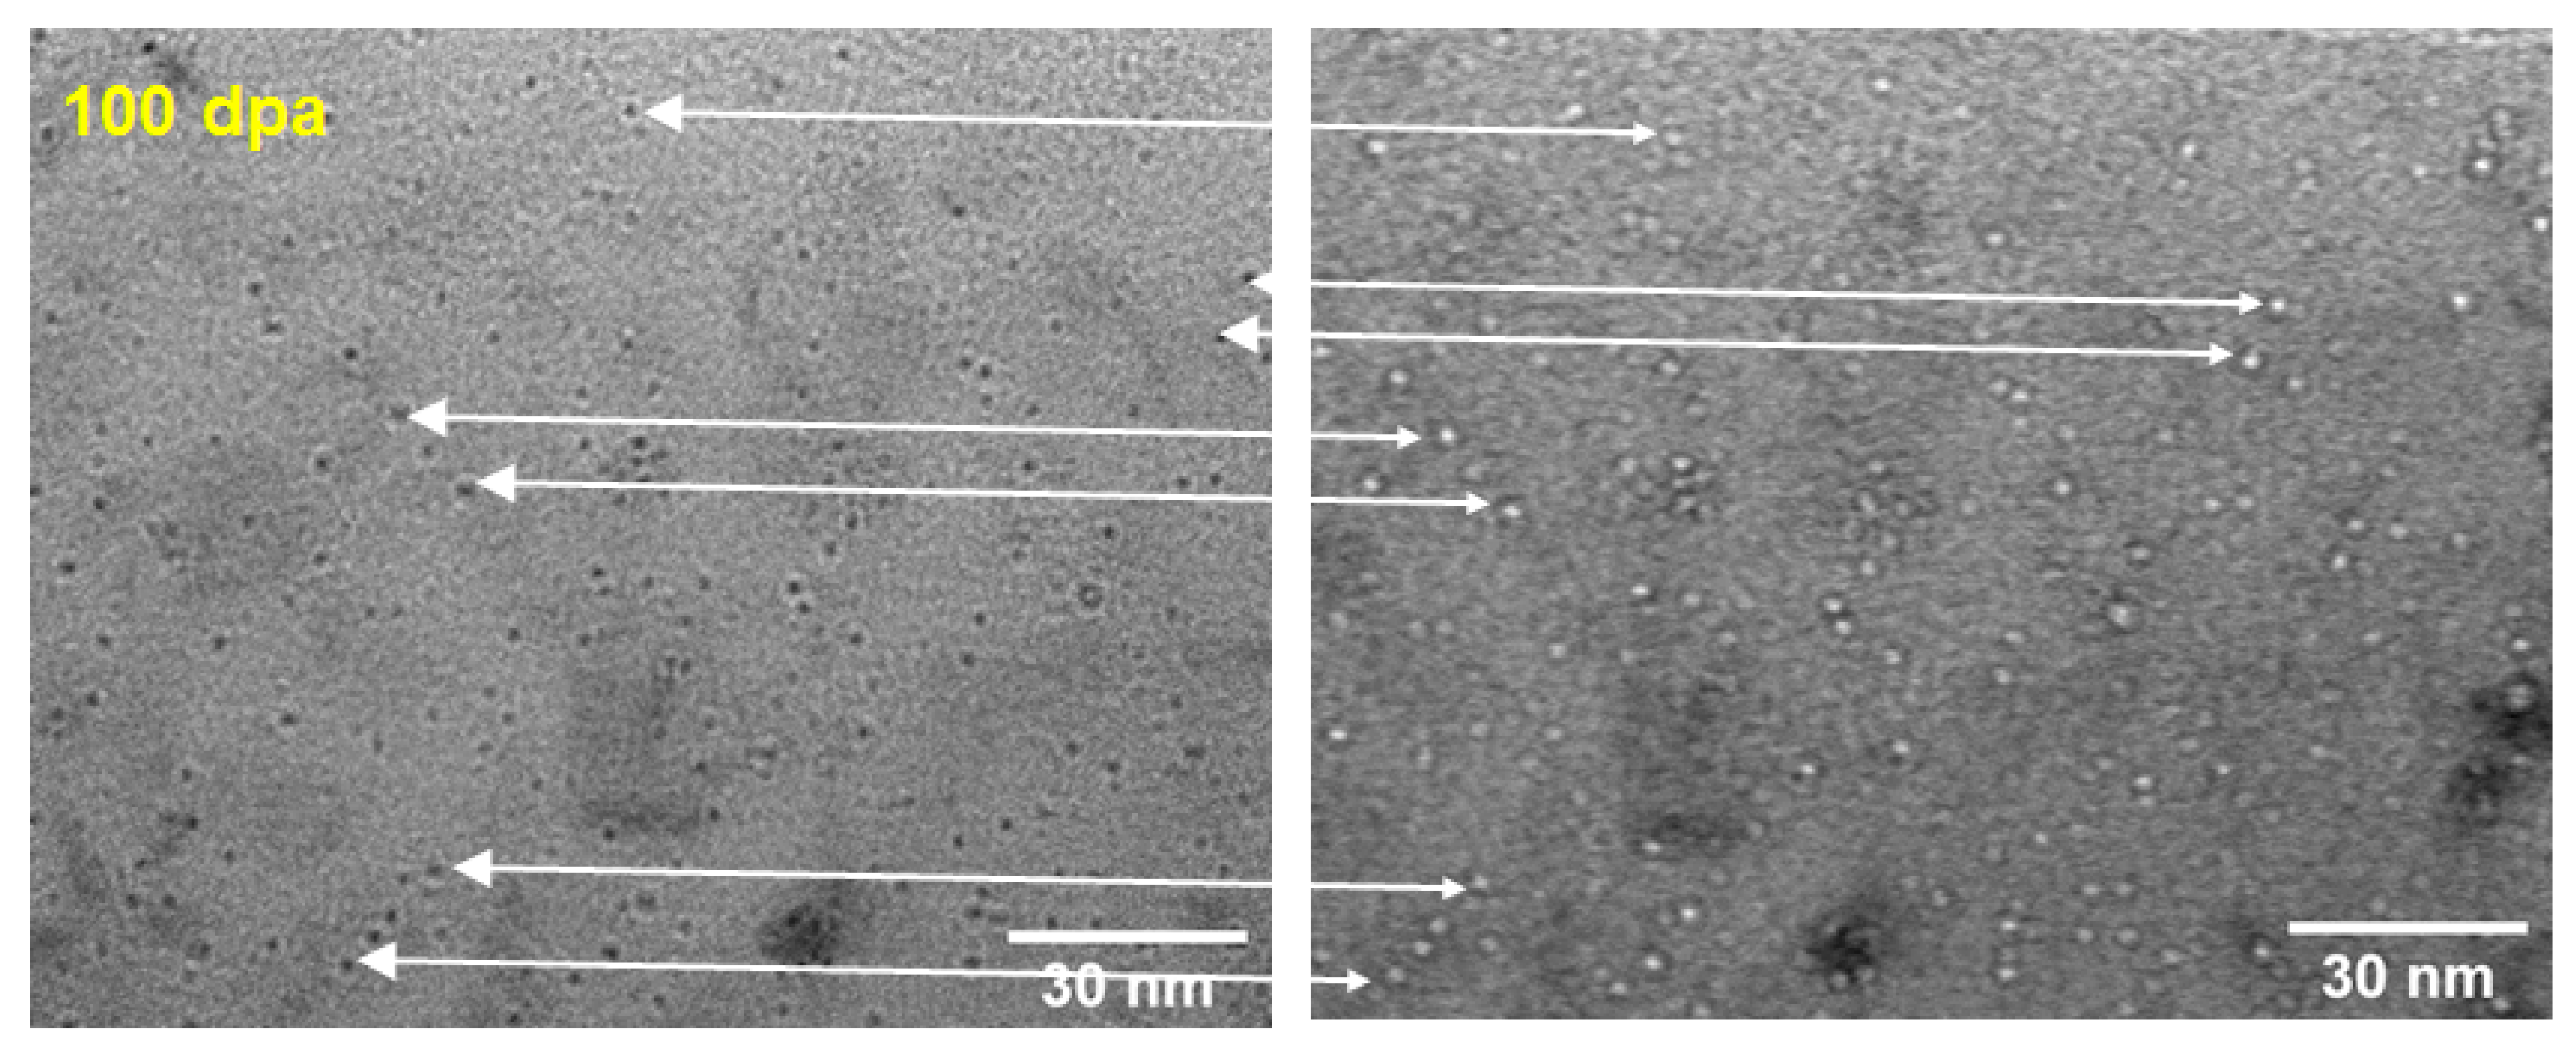
Compared to the 65 dpa material, in the 100 dpa material the population of cavities was much more readily apparent, as shown in Figure 21. While the size was similar to that of the 65 dpa material, on the order of a few nanometers in diameter, in a qualitative sense the number density appeared much greater in the 100 dpa material.
In summary, while some larger second phase particles were present in the FTT materials in the form of MnS inclusions and cuboidal TiC, N precipitates, the principal radiation-induced features were co-segregation of Ni and Si to grain boundaries and as clusters or fine precipitates in the matrix, and the emergence of cavities of a few nanometers in diameter. Moreover, while long bands of epsilon martensite/twinned lattice were observable traversing the grains, they could be attributable to the initial cold-worked microstructure. Most importantly, no evidence was found for any alpha-prime martensite phase in the materials, induced neither by the initial cold-work nor as an artefact by subsequent TEM foil preparation. This sets the stage for post-test investigations in which the presence or absence of alpha-prime martensite will be an important focus of investigations.
3.3. IASCC Tests of FTT O-Ring Specimens
Two autoclave test runs were done, and two specimens were tested in each run. In each run, one 100 dpa and one 65 dpa specimen was tested. Both runs were carried out in borated-lithiated water, but the first run targeted 20 cc/kg hydrogen, while the second run targeted 50 cc/kg hydrogen.
3.3.1. Cracking Behavior in Lower Hydrogen PWR Water
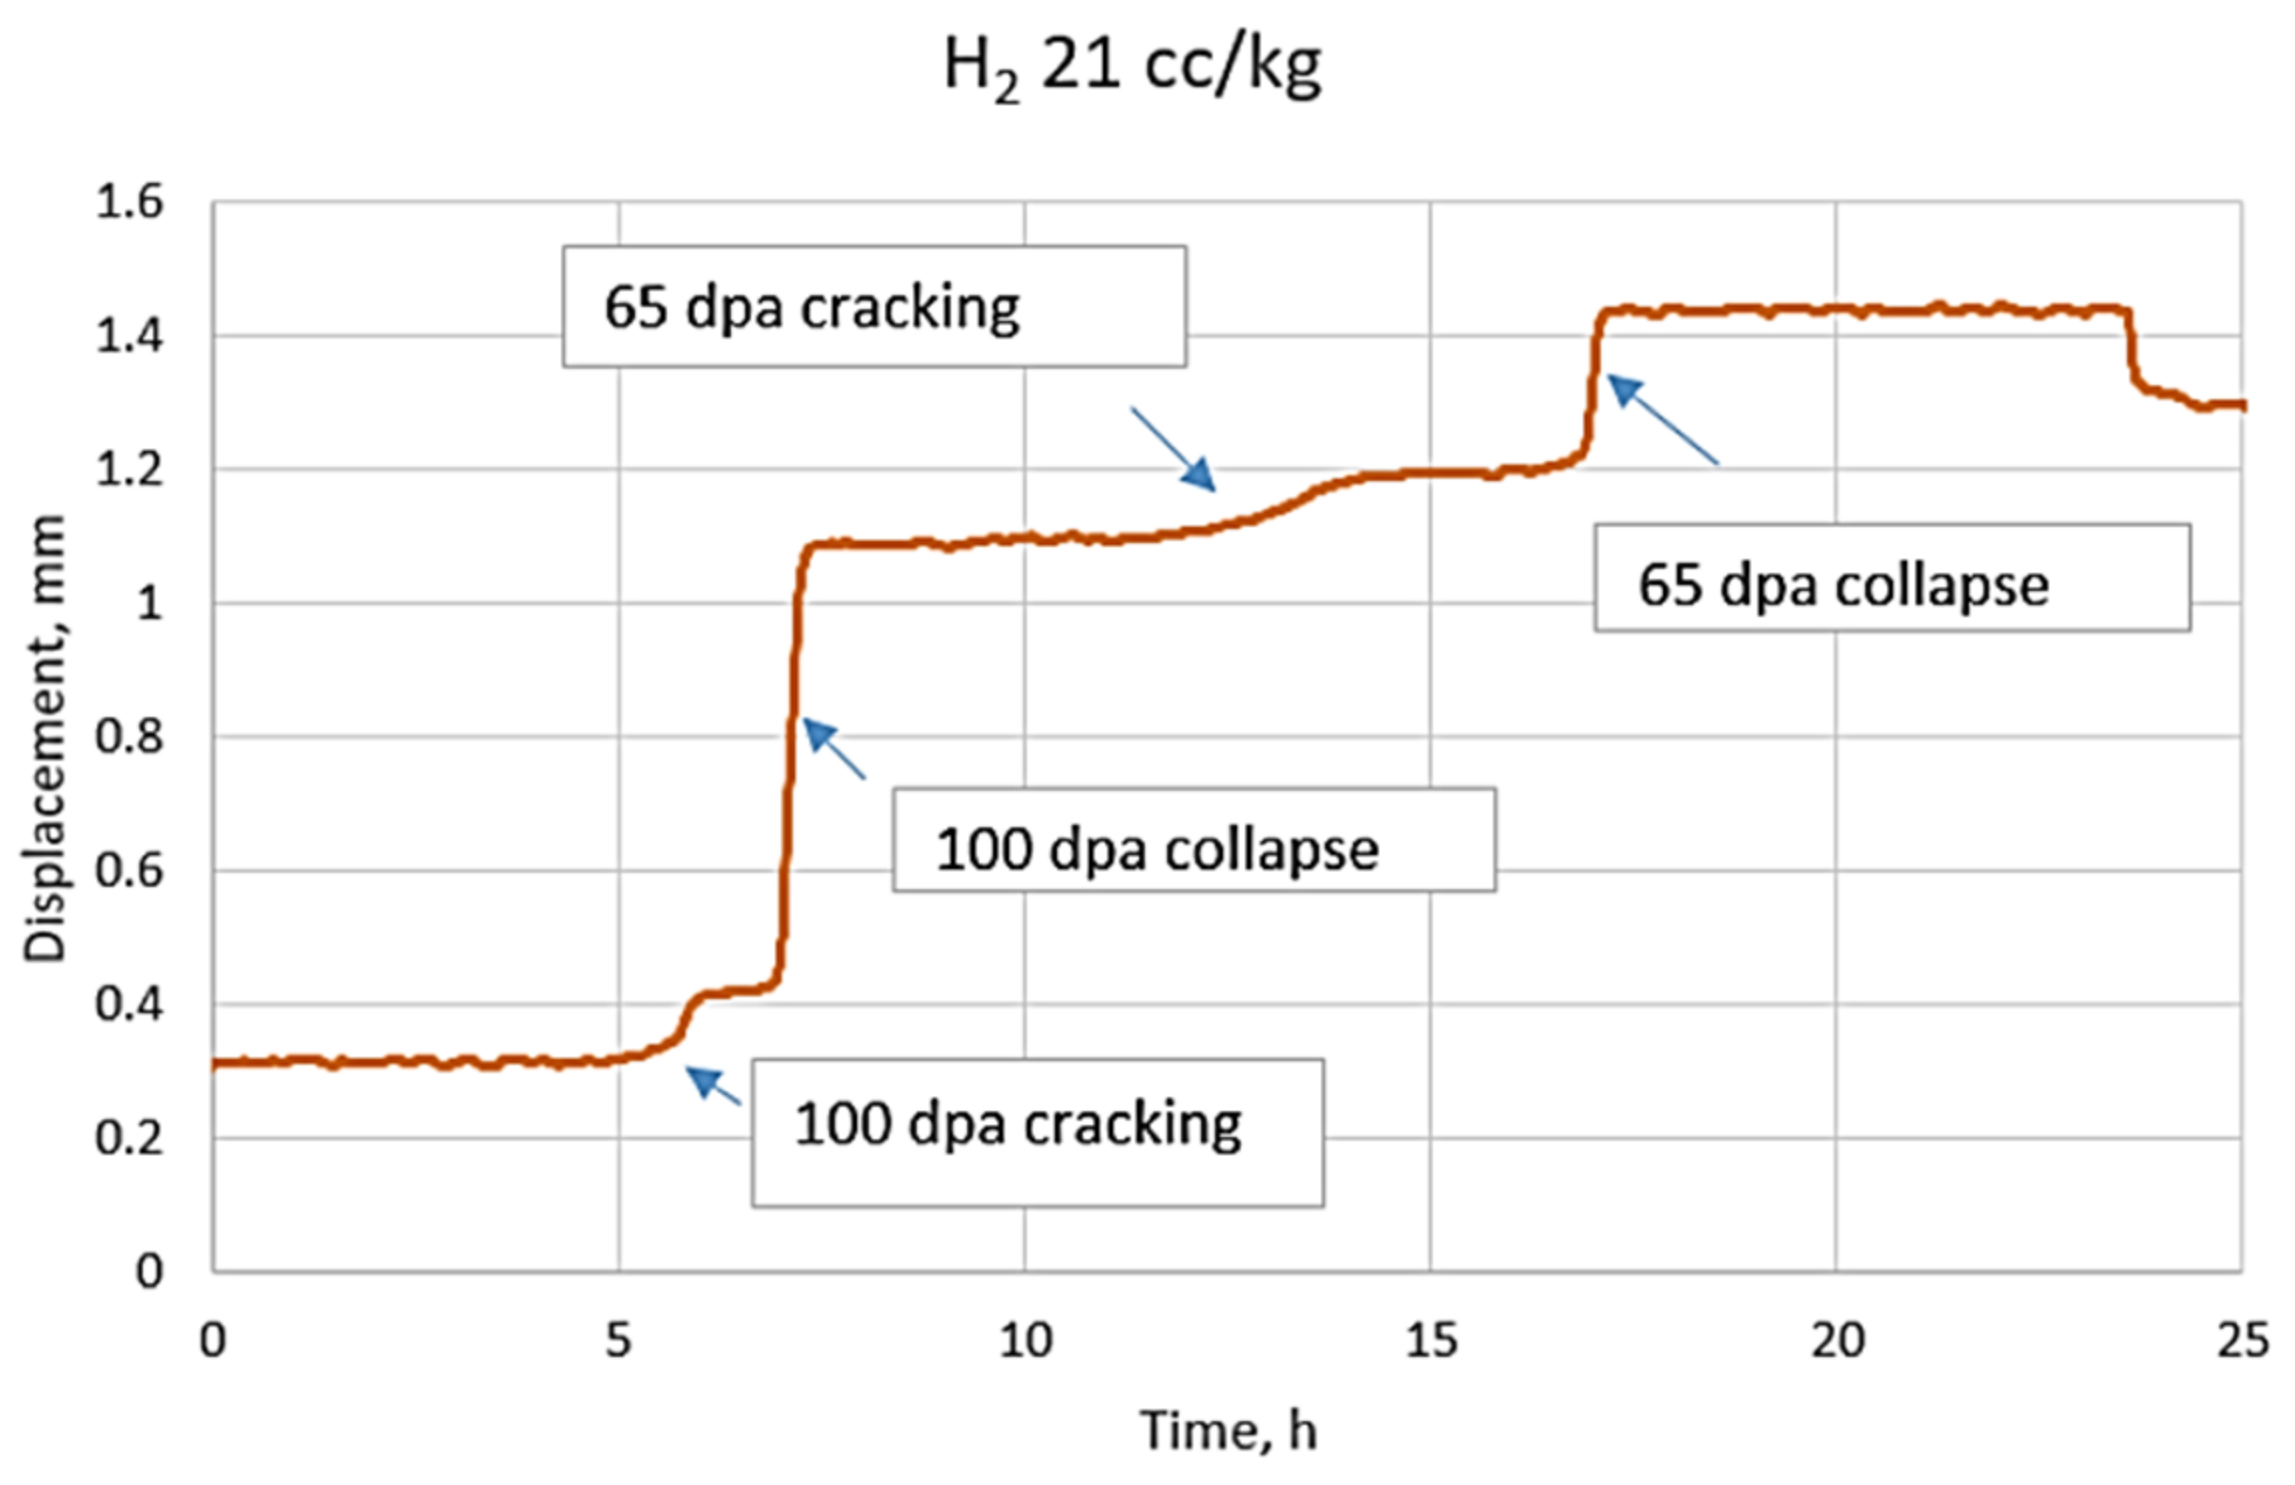
The lower H2 test corresponded to what would be closer to a lower PWR hydrogen content. Figure 22 and Figure 23 show the applied load and resulting displacement response, respectively. The realized H2 level during the test was 21 cc/kg. The horizontal axis starts when the load reached the target value of 1400 N. In this lower hydrogen run, the first crack indication in the 100 dpa specimen can be seen ~6 h after the target load was reached. The specimen collapsed at ~7 h. Similar behavior can be seen in the case of the 65 dpa specimen: first cracking at 12–13 h, and then collapse at ~17 h. The differences in the displacement increments when the specimens collapsed are due to different length stoppers for the specimen loading bars within the loading rig, which enables to obtain which specimen collapsed based only on the displacement curve, without interrupting the test and opening the autoclave.
3.3.2. Cracking Behavior in PWR Water with Elevated Hydrogen Content
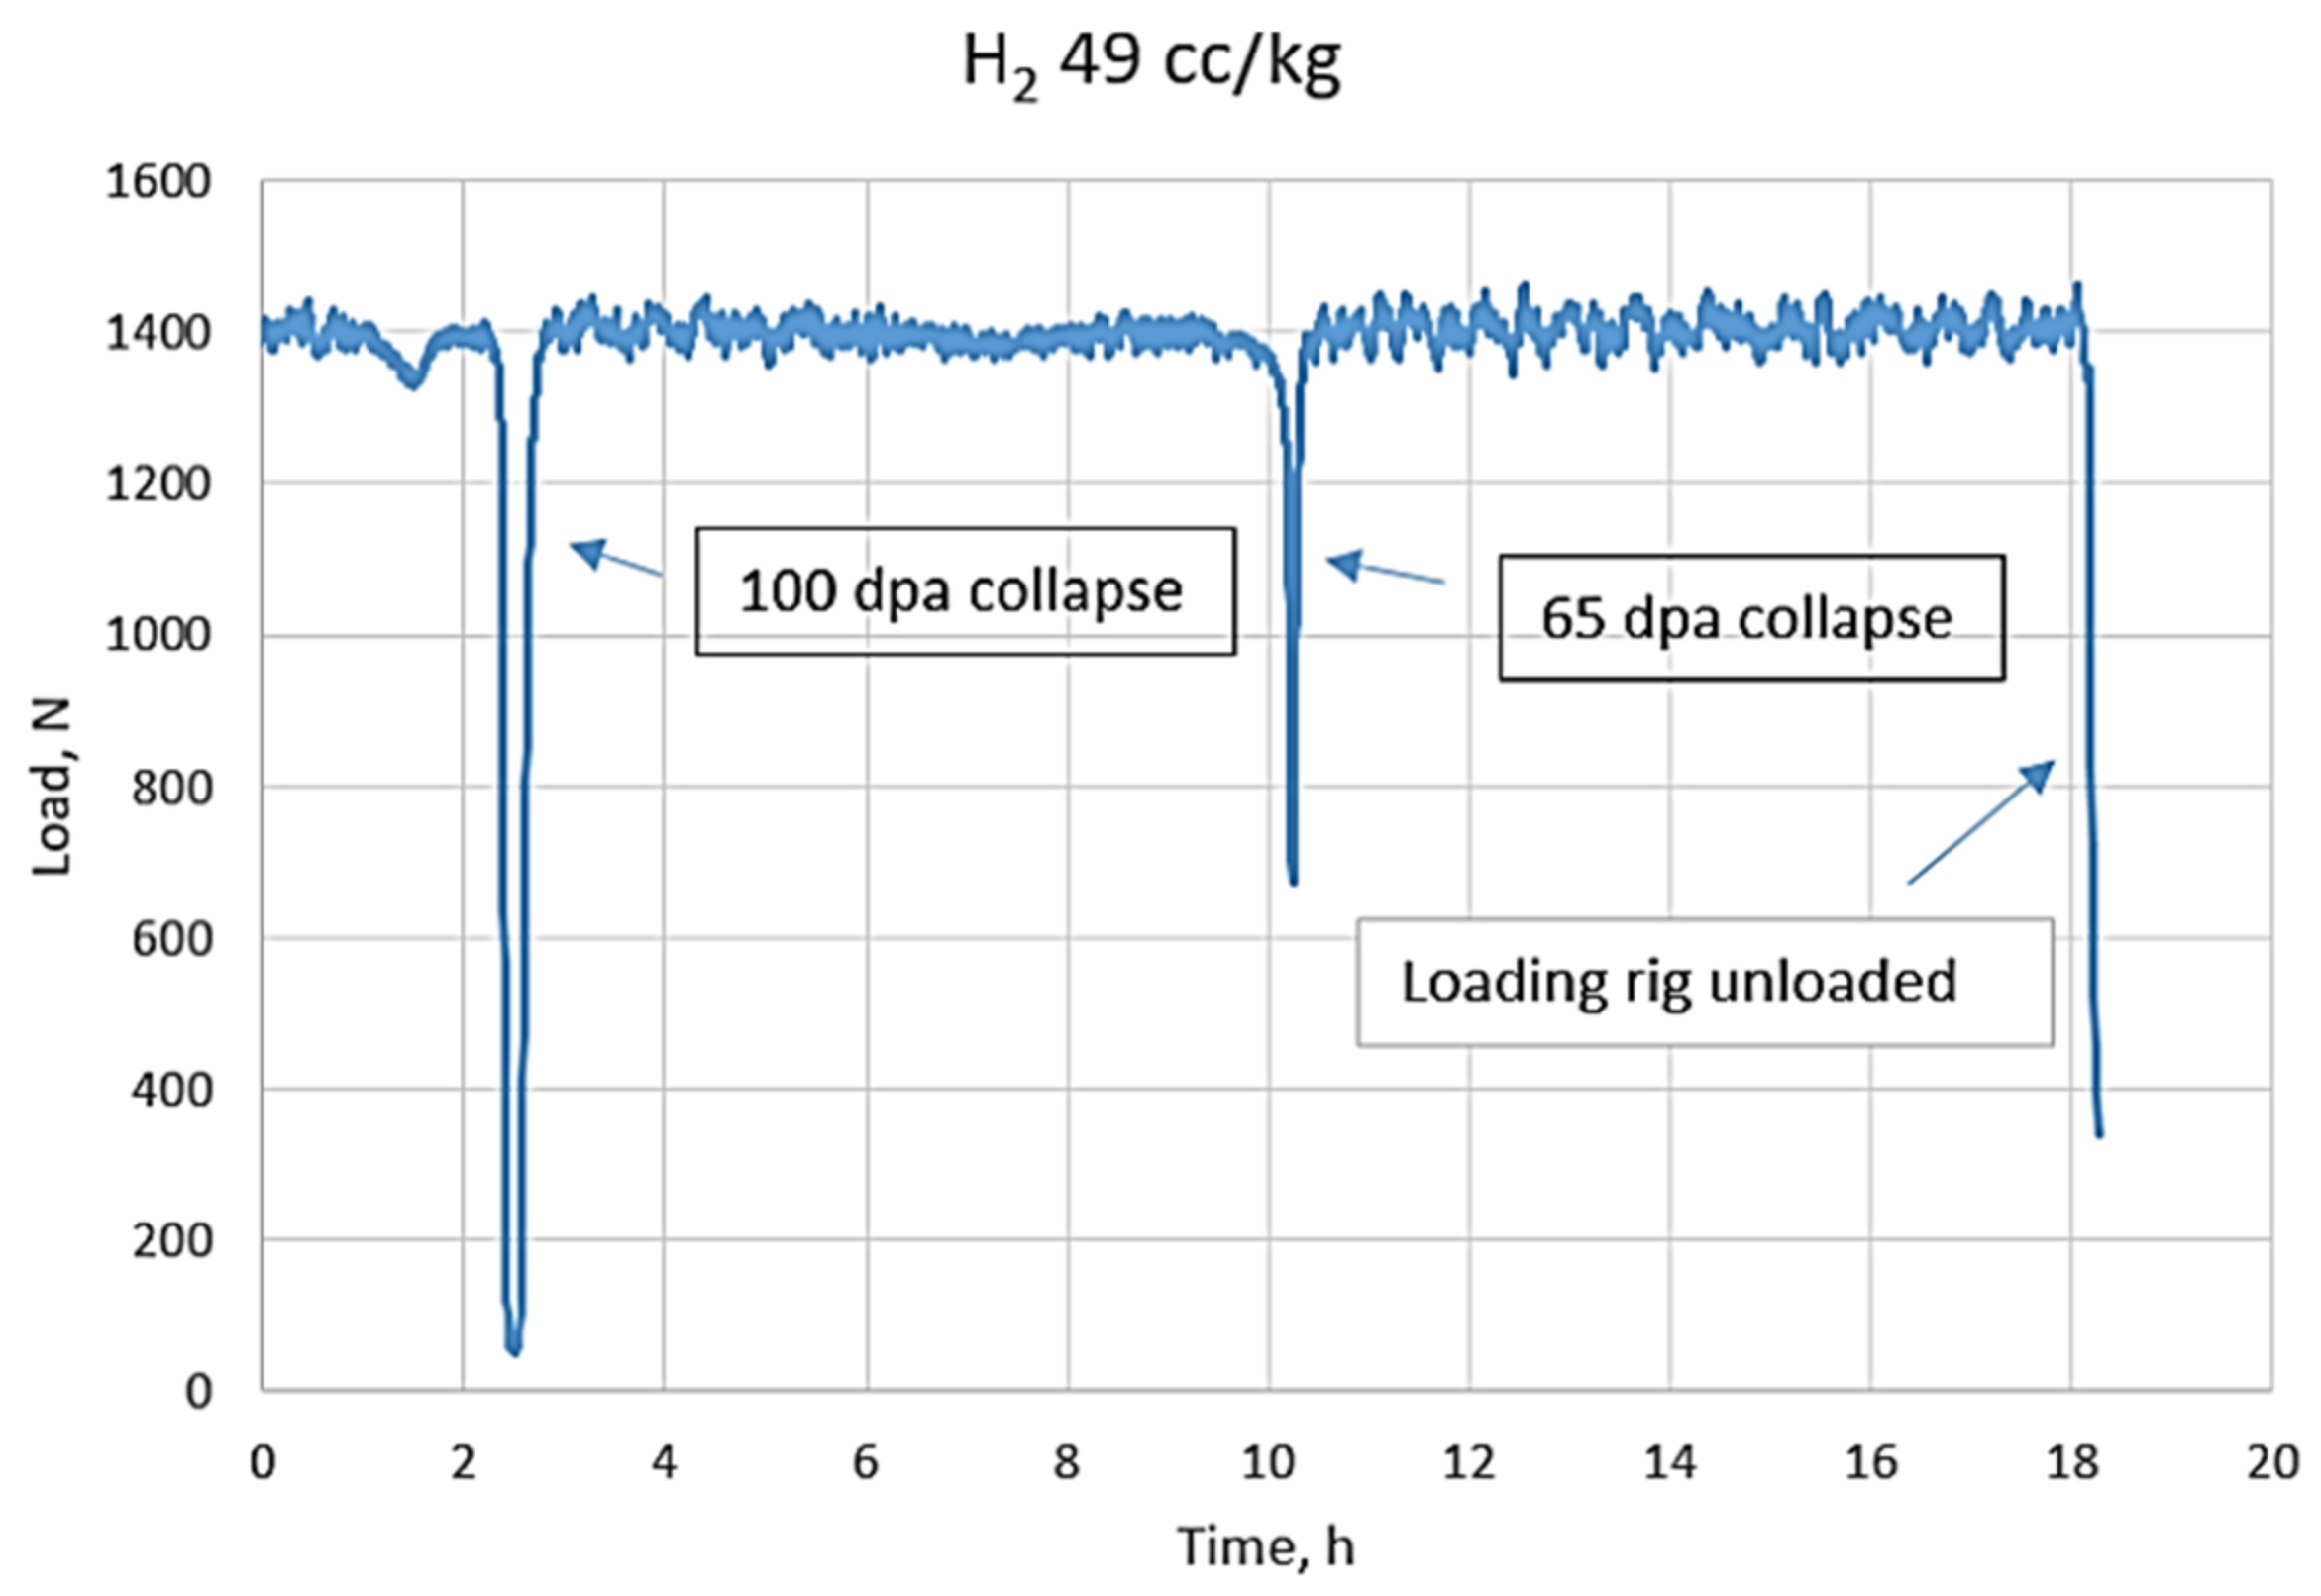
The test in higher H2 concentration was done following the same procedure as for the lower H2 test, but aiming for a hydrogen content beyond the typical specification of 25–30 cc/kg. The realized hydrogen level in that test was 49 cc/kg. The load and displacement plots are shown in Figure 24 and Figure 25, respectively. The load and displacement curves in the higher H2 test are very similar to those of the lower H2 test, except that the first indications of cracking and then final specimen collapse took place earlier in the higher hydrogen conditions for both materials. In the 100 dpa specimen, the first cracking indication is at <1 h loading time, and final collapse at ~2.5 h. In the case of the 65 dpa specimen, the first cracking indication is at 6–7 h, with final collapse at ~10 h.
3.4. Post-Test Examinations of IASCC-Tested FTT O-Ring Specimens
Following each autoclave run, the specimen rig was removed and brought into the hot-cell for visual inspection with a digital camera. It was found that, in every one of the tests, the O-ring specimens cracked in the same manner; cracks initiated from the inside surface at the top and bottom of the O-ring, and from the outside surface at both sides of the O-ring, corresponding to the locations of greatest tensile stresses during loading. The collapsed specimens still in the rig can be seen in Figure 26 (21 cc/kg H2) and Figure 27 (49 cc/kg H2).
Upon removal of the specimens from the rig, it was found that, although collapse of the O-ring had occurred, in every case there was still sufficient ligament remaining to hold the cracked O-ring specimen in one piece. For that reason, in order to examine the fracture surfaces for determining such metrics as the extent of intergranular versus transgranular or ductile fracture, the cracks in the specimens have to be forced apart. On the other hand, by remaining together, the specimens provide an opportunity to make cross-sections of the cracks for characterization of things like oxides in the cracks. These are the next steps in future work.
4. Discussion
Examinations of the same 65 dpa FTT material of this study were made as a part of the CIR program already over a decade ago (estimated to be 70 dpa at that time), and were published in 2009 [19]. In that particular study, analytical results were not presented, but significant attention was paid to the very fine cavities, as an important new development with higher dpa level accumulation. In fact, the authors call them bubbles on the basis that significant levels of hydrogen and helium could also be measured from the materials. In addition, while acknowledging the challenge of imaging such small voids very clearly due to surface conditions of electropolished TEM foils, the study also reported some observations of what appeared to be bubbles decorating the grain boundaries. More recently, a study of the same 100 dpa FTT microstructure was published in 2020, together with results from other dpa level FTT material [15]. That recent study also reported observations of bubbles at the grain boundaries. Such bubbles were not observed in the foils examined in the current study at either dpa level, but nor was that the primary aim of the current study, so their presence cannot be ruled out.
The TEM examinations of the as-irradiated materials of this study showed that, while some larger second phase particles were present in the FTT materials in the form of MnS inclusions and cuboidal TiC,N precipitates, the principal radiation-induced microchemical changes were co-segregation of Ni and Si to grain boundaries and as clusters or fine precipitates in the matrix. The aforementioned study published in 2020 that includes the same 100 dpa FTT material describes similar observations, but in much greater depth [15]. The results of this study are very much in line with the results published by those researchers.
The primary goal of the current study is to set the baseline for subsequent studies seeking to understand the relationship between IASCC and irradiation-induced microstructure and microchemistry. Due to the characteristic intergranular fracture associated with IASCC, radiation-induced segregation has typically focused on the grain boundaries, and on depletion of Cr there. This is based on the experience with SCC associated with depletion of Cr in sensitized austenitic stainless steel [20,21]. However, it is clear from more recent studies, including this one, that the extent of Ni- and Si-co-segregation is significant at both grain boundaries and as small clusters or precipitates in the matrix [22,23]. Additionally, the elemental mapping technique clearly also shows that Fe also depletes at the grain boundaries, a fact not easily picked up in individual spectra that are quantified to merely sum the selected elements to 100%.
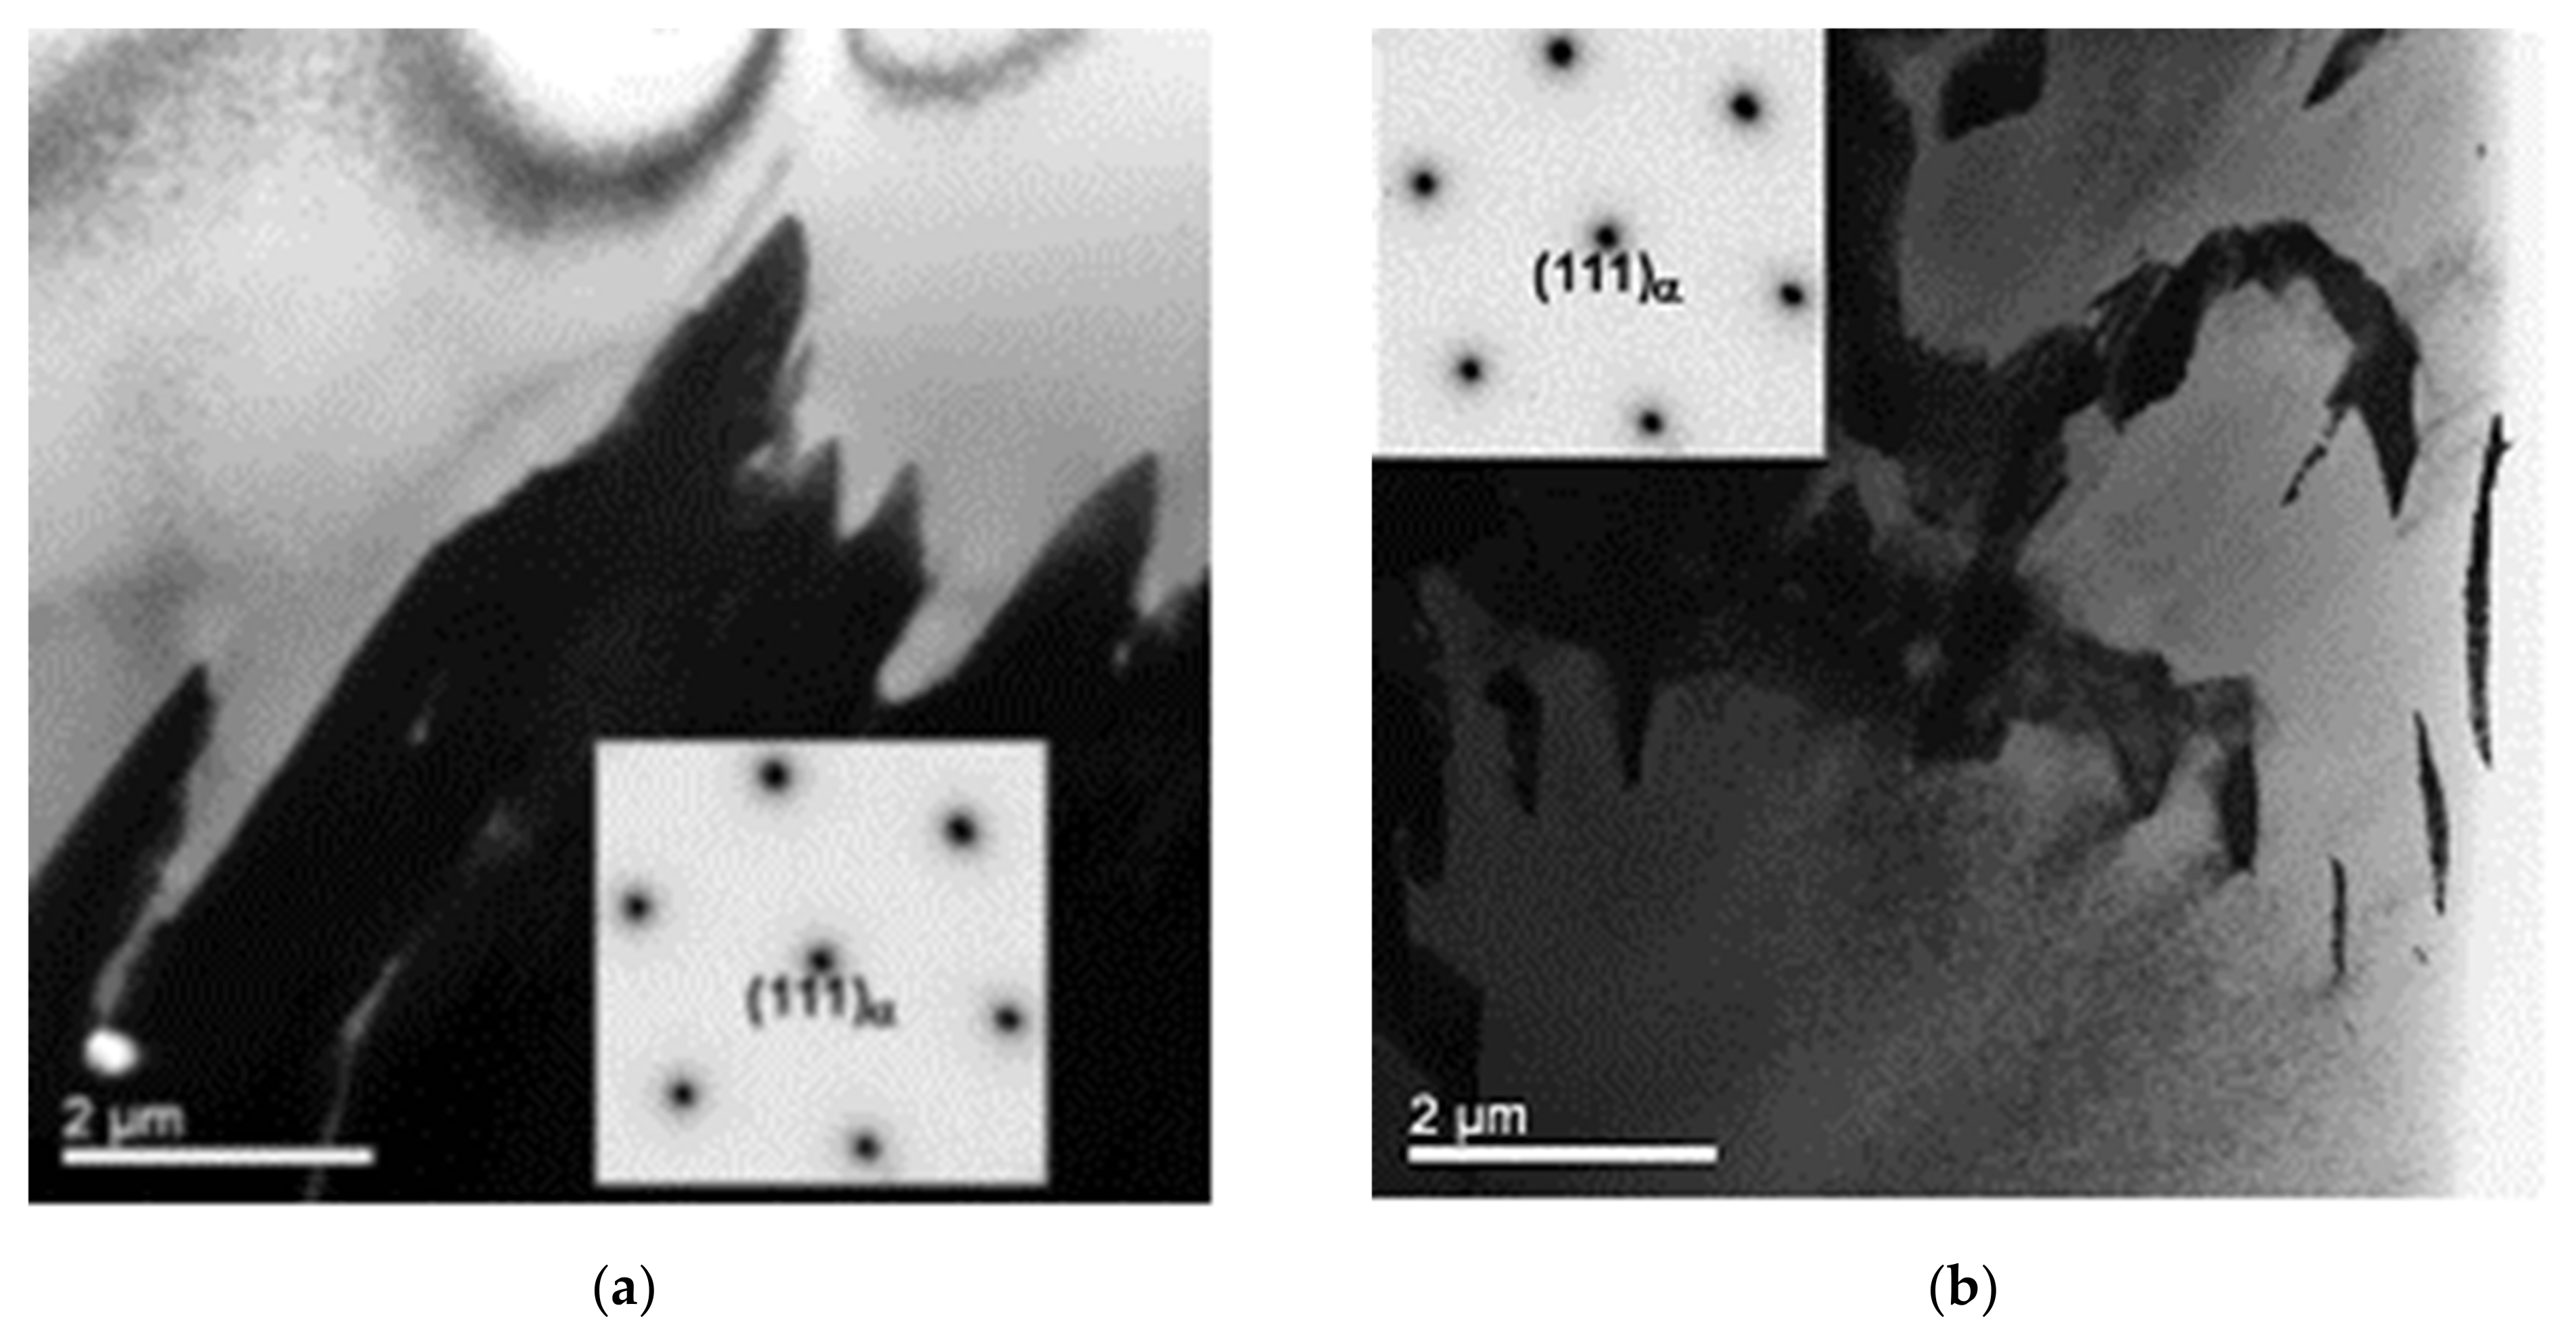
Regarding the emergence of cavities, these are features that have also been reported in highly irradiated materials [24]. However, despite the rather high level of radiation in the FTT materials of this study, the cavities were relatively fine. By comparison, in the materials of other primary circuit reactor components, slightly larger cavities have also been observed. For example, as shown in Figure 28, larger cavities have been observed in a 12 dpa Type 304 austenitic stainless steel from a control rod blade, and also in the inner portion of the shank of a Type 316 baffle bolt, estimated to have accrued 15 dpa of neutron irradiation [25]. It has been determined that the irradiation temperature (e.g., due to gamma heating) may be important in controlling the size and distribution of cavities, with higher irradiation temperatures promoting larger cavities [26]. The thin-walled FTT in contact with the coolant would not be expected to experience much gamma heating.
Finally, earlier studies of the deformed microstructure near the fracture surface of autoclave-tested neutron-irradiated material have revealed the formation of alpha prime martensite there [27]. Examples of alpha-prime formation as imaged in TEM in those studies are shown in Figure 29. As described in more detail in the reference, as neutron irradiation continues to further deplete the matrix of the austenite phase stabilizer Ni, the threshold for producing deformation-induced martensite can be expected to drop to lower stress levels. Although long bands of epsilon martensite/twinned lattice were observable traversing the grains in the as-irradiated (non-deformed) FTT materials of this study attributable to the initial cold-worked microstructure, no evidence was found for any alpha-prime martensite phase pre-existing in the materials prior to irradiation, induced neither by the initial cold-work nor as an artefact by subsequent TEM foil preparation. That sets the stage for post-test investigations in which the presence or absence of alpha-prime martensite will be determined in the deformation region of the cracks. This will be a key focus of investigations in future work.
Turning to the FTT O-ring IASCC results of this study, the literature data that was shown in Figure 3 is repeated in Figure 30, but with the FTT data of this study added. There are four locations in the O-ring specimen with a high tensile stress, as seen in Figure 2: inner surfaces in the loading axis and outer surfaces in the sides. The onset of crack initiation can hardly be seen in the measurement data. The initial phenomenon seen before the collapse of each specimen in the displacement data in Figure 23 and Figure 25 follows from macroscopic cracking in one of the highly stressed regions. This results in reduced load bearing capacity of the O-ring and increasing stresses in the other highly stressed locations, which results in specimen collapse soon after. The data is plotted based on the FEM analysis done using Autodesk Inventor Version 2017, which indicated that the actual applied maximum stresses in the autoclave tests were 75% for the 100 dpa specimens and 78% for the 65 dpa specimens, calculated based on the as-irradiated high temperature σYS. Assuming that the Autodesk Inventor analysis is correct, the lower H2 65 dpa data point (time to collapse, as this seems to be what is often reported) coincides with the 72–74 dpa C-ring data of Takakura. The failure times of the 100-dpa specimens could be expected to be shorter, as in fact they were.
The results also clearly indicate that elevated dissolved H2 had an effect of accelerating the failure times. While more data should be generated before any definite conclusions can be made, the synergism between hydrogen and alpha-prime martensite formation has been discussed in literature. The formation of alpha martensite due to radiation-induced depletion of Ni in the matrix may promote the rapid fracture observed in the tests conducted in elevated hydrogen PWR environment. Hydrogen is frequently cited in association with transformed martensite as a cause for non-ductile fracture, and due to its rapid diffusion along grain boundaries, it is particularly associated with inter-granular fracture, a characteristic also of IASCC. Murakami and Matsuoka have extensively addressed the mechanism whereby hydrogen can accelerate cracking in conjunction with alpha martensite in austenitic stainless steel [28]. Likewise, in a fatigue study comparing Type 316L and 254 SMO in air and in gaseous hydrogen, Tsay et al. found that hydrogen-accelerated crack growth in the 316L was associated with a thin layer of strain-induced martensite that formed on the intergranular fatigue-fractured surface, and that its content increased when raising the stress ratio, while the more stable 254 SMO did not experience any hydrogen-accelerated crack growth. This was attributed to the trapping of hydrogen at the grain boundaries and the transformed martensite [29]. Thus, the accelerated cracking in the elevated hydrogen water in the current study may be associated with formation of alpha-prime martensite in the materials under deformation in the autoclave tests. Indeed, future work will focus on examining the deformed material at the cracks in order to identify whether or not alpha-prime has formed in the same manner observed in other studies of neutron irradiated austenitic stainless steel.
5. Conclusions
This baseline study of the microstructure and IASCC response of two highly irradiated FTT materials enables the following conclusions to be drawn:
- As-irradiated 65 dpa and 100 dpa Type 316 FTT material showed strong segregation of Ni- and Si- along the grain boundaries, and as clusters/precipitates on the order of 5 nm in diameter in the matrix.
- While the as-irradiated FTT material at 65 dpa exhibited nano-scale cavities, such nano-scale cavities appeared to be present in a much higher number density in the 100 dpa material.
- Although transgranular bands of epsilon/twinned microstructure associated with prior cold-work existed in both materials, no evidence was found of alpha-prime martensite in the as-irradiated material.
- Testing of O-ring specimens prepared from the FTT material in normal PWR chemistry at 78% (100 dpa) and 75% (65 dpa) of high temperature yield strength showed that failure (collapse) occurred after 7 and 17 h, respectively.
- Testing of the O-rings specimens at the same load levels in elevated hydrogen (49 cc/kg) resulted in accelerated cracking, occurring after 2.5 h (100 dpa) and 10 h (65 dpa).
Author Contributions
Funding acquisition, transmission electron microscopy and original draft preparation, W.K.; autoclave set-up, experiments and reporting, A.T.; power-plant material recovery and curation, P.E. All authors have read and agreed to the published version of the manuscript.
Funding
This research was funded by the EUROPEAN COMMISSION, Grant agreement number: 661913.
Acknowledgments
The reactor-irradiated flux thimble tube materials of the study were made available by Ringhals AB. The transmission electron microscope was operated by Mykola Ivanchenko.
Conflicts of Interest
The authors declare no conflict of interest. The funders had no role in the design of the study; in the collection, analyses, or interpretation of data; in the writing of the manuscript, or in the decision to publish the results.
References
- Shogan, R.P.; Mager, T.R. Susceptibility of Type 316 Stainless Steel to Irradiation Assisted Stress Corrosion Cracking in a PWR Environment. In Proceedings of the 10th International Conference on Environmental Degradation of Materials in Nuclear Power Systems—Water Reactors, Lake Tahoe, NV, USA, 5–9 August 2001; NACE International: Houston, TX, USA, 2002; p. 9. [Google Scholar]
- Ruscak, M.; Chvatal, P.; Zamboch, M. NRI Experimental Facility for the Testing of Irradiation Assisted Stress Corrosion Cracking. In Proceedings of the IAEA Specialists Meeting, Rez, Chech Republic, 6–8 October 1998. [Google Scholar]
- Takakura, K.; Nakata, K.; Ando, M.; Fujimoto, K.; Wachi, E. Lifetime Evaluation for IASCC Initiation of Cold Worked 316 Stainless Steel’s BFB in PWR Primary Water. In Proceedings of the 13th International Conference on Environmental Degradation of Materials in Nuclear Power Systems—Water Reactors, Whistler, BC, Canada, 19–23 April 2007; Canadian Nuclear Society: Toronto, ON, Canada, 2007. [Google Scholar]
- Takakura, K.; Nakata, K.; Kubo, N.; Fujimoto, K.; Sakima, K. Iascc Evaluation Method of Irradiated Cold Worked 316ss Baffle Former Bolt in Pwr Primary Water. In Proceedings of the ASME 2009 Pressure Vessels and Piping Division Conference PVP2009, Prague, Czech Republic, 26–30 July 2009; ASME: New York, NY, USA, 2009; p. 10. [Google Scholar]
- Fukuya, K.; Fujii, K.; Nishioka, H.; Takakura, K.; Nakata, K. A prediction Model of IASCC Initiation Stress for Bolts in PWR Core Internals. Nucl. Eng. Des. 2010, 240, 473–481. [Google Scholar] [CrossRef]
- Conermann, J.; Shogan, R.; Fujimoto, K.; Yonezawa, T.; Yamaguchi, Y. Irradiation Effects In A Highly Irradiated Cold Worked Stainless Steel Removed From A Commercial Pwr. In Proceedings of the 12th International Conference on Environmental Degradation of Materials in Nuclear Power System—Water Reactors, Salt Lake City, UT, USA, 14–18 August 2005; TMS: Pittsburgh, PA, USA, 2005. [Google Scholar]
- Bosch, R.W.; Vankeerberghen, M.; Gerard, R.; Somville, F. Crack Initiation Testing of Thimble Tube Material Under PWR Conditions to Determine a Stress Threshold for IASCC. J. Nucl. Mater. 2015, 461, 112–121. [Google Scholar] [CrossRef]
- Bosch, R.W.; Vankeerberghen, M.; Ghaouadi, R.; Gerard, R.; Somville, F. Crack Initiation Testing of Highly Irradiated Stainless Steel (Thimble Tube Material with a Dose up to 80 dpa) Under PWR Conditions. In Proceedings of the Fontevraud 7, Avignon, France, 26–30 September 2010; SFEN: Paris, France, 2010. [Google Scholar]
- Bosch, R.W.; Vankeerberghen, M.; Gerard, R.; Somville, F. IASCC crack initiation testing of thimble tube material with a dose up to 80 dpa under PWR conditions. In Proceedings of the Fontevraud 8, Avignon, France, 15–18 September 2014; SFEN: Paris, France, 2014. [Google Scholar]
- Konstantinović, M.J.; Van Eyken, J.; Van Renterghem, W.; Bosch, R.W.; Somville, F.; Gerard, R. Probabilistic Fracture Model of IASCC and the SEM Investigation of Cracking Statistics and Oxidation in O-ring Specimens After Constant Load Testing. In Proceedings of the Fontevraud 9, Avignon, France, 17–20 September 2018; SFEN: Paris, France, 2018. [Google Scholar]
- Freyer, P.D.; Mager, T.R.; Burke, M.A. Hot Cell Crack Initiation Testing of Various Heats of Highly Irradiated 316 Stainless Steel Components Obtained from Three Commercial PWRs. In Proceedings of the 13th International Conference on Environmental Degradation of Materials in Nuclear Power Systems—Water Reactors, Whistler, BC, Canada, 19–23 April 2007; Canadian Nuclear Society: Toronto, ON, Canada, 2007. [Google Scholar]
- Fukumura, T.; Fukuya, K.; Fujii, K.; Miura, T.; Kitsunai, Y. Grain Boundary Oxidation of Neutron Irradiated Stainless Steels in Simulated PWR Water. In Proceedings of the 18th International Conference on Environmental Degradation of Materials in Nuclear Power System—Water Reactors, Portland, OR, USA, 13–17 August 2017. [Google Scholar]
- Toivonen, A.; Aaltonen, P.; Karlsen, W.; Ehrnstén, U.; Massoud, J.-P.; Bouesier, J.-M. Post-Irradiation SCC Investigations on Highly-Irradiated Core Internals Component Materials. In Proceedings of the Fontevraud 6, Fontevraud, France, 18–22 September 2006; Société Française d’Énergie Nucléaire (SFEN): Paris, France, 2006. [Google Scholar]
- Pokor, C.; Massoud, J.-P.; Wintergerst, M.; Toivonen, A.; Ehrnstén, E.; Karlsen, W. Determination of the Time to Failure Curve as a Function of Stress for a Highly Irradiated AISI 304 Stainless Steel After Constant Load Tests in Simulated PWR Water Environment. In Proceedings of the Fontevraud 7, Avignon, France, 26–30 September 2010; SFEN: Paris, France, 2010. [Google Scholar]
- Song, M.; Field, K.G.; Cox, R.M.; Was, G.S. Microstructural characterization of cold-worked 316 stainless steel flux thimble tubes irradiated up to 100 dpa in a commercial Pressurized Water Reactor. J. Nucl. Mater. 2020, 541, 152400. [Google Scholar] [CrossRef]
- Karlsen, W.; Van Dyck, S. The effect of prior cold-work on the deformation behaviour of neutron irradiated AISI 304 austenitic stainless steel. J. Nucl. Mater. 2010, 406, 127–137. [Google Scholar] [CrossRef]
- Becker, R.; Studsvik, A.B., Nyköping, Sweden. “O-Ring Specimens Machined from Irradiated Flux Thimble Tubes—Documentation of Fabrication”. Private Communication, 2018. [Google Scholar]
- Jenssen, A.; Smith, J.M. Effect of Lithium on the Initiation of IASCC in Highly Irradiated Type 316 Stainless Steel. In Proceedings of the Presentation International Light Water Reactor Materials Reliability Conference and Exhibition, Chicago, IL, USA, 1–4 August 2016. [Google Scholar]
- Edwards, D.J.; Garner, F.A.; Bruemmer, S.M.; Efsing, P. Nano-cavities observed in a 316SS PWR flux thimble tube irradiated to 33 and 70 dpa. J. Nucl. Mater. 2009, 384, 249–255. [Google Scholar] [CrossRef]
- Bruemmer, S.M. Grain boundary chemistry and intergranular failure of austenitic stainless steels. Mater. Sci. Forum 1989, 46, 309–334. [Google Scholar] [CrossRef]
- Bruemmer, S.M.; Simonen, E.P.; Scott, P.M.; Andresen, P.L.; Was, G.S.; Nelson, J.L. Radiation-induced material changes and susceptibility to intergranular failure of light-water-reactor core internals. J. Nucl. Mater. 1999, 274, 299–314. [Google Scholar] [CrossRef]
- Chopra, O.K.; Rao, A.S. A review of irradiation effects on LWR core internal materials—Neutron Embrittlement. J. Nucl. Mater. 2011, 412, 195–208. [Google Scholar] [CrossRef]
- Hojna, A. Overview of Intergranular Fracture of Neutron-Irradiated Austenitic Stainless Steels. Metals 2017, 7, 392. [Google Scholar] [CrossRef] [Green Version]
- Foster, J.P.; Porter, D.L.; Harrod, D.L.; Mager, T.R.; Burke, M.G. 316 stainless steel cavity swelling in a PWR. J. Nucl. Mater. 1995, 224, 207–215. [Google Scholar] [CrossRef]
- Karlsen, W.; Pakarinen, J. TEM investigation of plant-irradiated NPP bolt material. In Proceedings of the EHPG Meeting 2013, Enlarged Halden Programme Group Meeting, Storefjell, Norway, 11–14 March 2013; Insitutt for Energiteknikk, OECD Halden Reactor Project: Halden, Norway, 2013. [Google Scholar]
- Garner Frank, A. Radiation-Induced Damage in Austenitic Structural Steels Used in Nuclear Reactors. In Comprehensive Nuclear Materials, 2nd ed.; Konings, J.M., Stoller, E., Eds.; Elsevier: Oxford, UK, 2020; Volume 3, pp. 57–168. [Google Scholar] [CrossRef]
- Karlsen, W.; Pakarinen, J.; Toivonen, A.; Ehrnstén, U. Deformation microstructures of 30 dpa AISI 304 stainless steel after monotonic tensile and constant load autoclave testing. In Proceedings of the 15th International Conference on Environmental Degradation of Materials in Nuclear Power Systems-Water Reactors, Colorado Springs, CO, USA, 7–11 August 2011; The Minerals, Metals & Materials Society: Pittsburgh, PA, USA, 2011; Volume 2, pp. 1352–1366. [Google Scholar]
- Murakami, Y.; Matsuoka, S. Effect of hydrogen on fatigue crack growth of metals. Eng. Fract. Mech. 2010, 77, 1926–1940. [Google Scholar] [CrossRef] [Green Version]
- Tsay, L.W.; Yu, S.C.; Huang, R.-T. Effect of austenite instability on the hydrogen-enhanced crack growth of austenitic stainless steels. Corros. Sci. 2007, 49, 2973–2984. [Google Scholar] [CrossRef]
Figure 1.
Schematically shown stress maximums in C-rings, where blue is compressive and red is tensile stress. (FEM analysis done by Autodesk Inventor Version 2017).
Figure 1.
Schematically shown stress maximums in C-rings, where blue is compressive and red is tensile stress. (FEM analysis done by Autodesk Inventor Version 2017).

Figure 2.
Schematically shown stress maximums in O-rings, where blue is compressive and red is tensile stress; (a) yy stresses and (b) xx stresses (FEM analysis done by Autodesk Inventor Version 2017).
Figure 2.
Schematically shown stress maximums in O-rings, where blue is compressive and red is tensile stress; (a) yy stresses and (b) xx stresses (FEM analysis done by Autodesk Inventor Version 2017).

Figure 3.
Collected data on C-ring and O-ring PWR IASCC tests (1000–1200 ppm B (as H3BO3), 2–2.2 ppm Li (as LiOH) and ~30 cc/kg dissolved H2). Acronyms: FTT = flux thimble tube, BFB = baffle former bolt, CB = core baffle. Chooz A CB material is type 304 steel, other results are on type 316CW steels (data reproduced from Takakura et al. [3], Conermann et al. [6], Toivonen et al. [13], and Pokor et al. [14]).

Figure 4.
Specimens from each of the two dpa levels were made at either L = 8 mm or 10 mm in length, and checked following specimen preparation for length and straightness of ends.
Figure 4.
Specimens from each of the two dpa levels were made at either L = 8 mm or 10 mm in length, and checked following specimen preparation for length and straightness of ends.

Figure 5.
Photographs of a fabricated O-ring specimen viewed from (a) the side and (b) the end. Remains of what is most likely hematite is visible on the inner surface. The inside of flux thimble tubes are exposed to the air outside the reactor, while the outside is exposed to the reactor water environment.

Figure 6.
A schematic presentation of the high-temperature recirculation loop used in the auto-clave experiments.
Figure 6.
A schematic presentation of the high-temperature recirculation loop used in the auto-clave experiments.

Figure 7.
Preheater temperature, pressure, and flow rate during the first operational test of the recirculation loop.
Figure 7.
Preheater temperature, pressure, and flow rate during the first operational test of the recirculation loop.

Figure 8.
Conductivities and dissolved oxygen during the first operational test of the recirculation loop.
Figure 8.
Conductivities and dissolved oxygen during the first operational test of the recirculation loop.

Figure 9.
pH and dissolved hydrogen during the first operational test of the recirculation loop. Hydrogen content was increased when the temperature was increased from ~200 to 300 and again from 300 to 340 °C. pH sensor was initiated ~5.5 h after the cycle began.
Figure 9.
pH and dissolved hydrogen during the first operational test of the recirculation loop. Hydrogen content was increased when the temperature was increased from ~200 to 300 and again from 300 to 340 °C. pH sensor was initiated ~5.5 h after the cycle began.

Figure 10.
(a) The rig for loading radioactive specimens is placed on a backing plate with pegs for locking the loading bars open. Tweezers held in hot cell manipulators with an integrated camera facilitate accurate placement of the O-ring specimens in the rig (b) camera view on PC outside of hot cell.

Figure 11.
Autoclave loading and temperature control functionality data (the time frame of 0–4 h in this figure corresponds with the time frame of 23–27 h in Figure 7).
Figure 11.
Autoclave loading and temperature control functionality data (the time frame of 0–4 h in this figure corresponds with the time frame of 23–27 h in Figure 7).

Figure 13.
Two examples, (a,b), of TEM bright field images of the as-irradiated 65 dpa material in no particular two-beam condition, showing that any high density of dislocation lines expected of a cold-worked austenitic stainless steel, have all been removed by subsequent neutron irradiation. However, banded macrostructure remains from that initial cold-work.

Figure 14.
(a) TEM bright field image of cold-work deformation-induced bands in the 65 dpa material; (b) examples of some relatively large second phase particles, as blocky Ti-rich cuboids and a more globular Mn and S rich inclusion.
Figure 14.
(a) TEM bright field image of cold-work deformation-induced bands in the 65 dpa material; (b) examples of some relatively large second phase particles, as blocky Ti-rich cuboids and a more globular Mn and S rich inclusion.

Figure 15.
At high magnification spectral imaging of the 65 dpa material reveals marked co-segregation of Ni and Si as clusters or precipitates on the order of several nanometers in size (clock-wise from upper left: HAADF, Fe map, Si map, Ni map).
Figure 15.
At high magnification spectral imaging of the 65 dpa material reveals marked co-segregation of Ni and Si as clusters or precipitates on the order of several nanometers in size (clock-wise from upper left: HAADF, Fe map, Si map, Ni map).

Figure 16.
(a) Spectral images of a grain boundary in the as-irradiated 65 dpa FTT material, clockwise from upper left: HAADF image and element maps for Fe, Cr, Si, Ni and Mo. The element maps show Ni and Si co-segregation accompanied by Cr and Fe depletion at the GB. Mo also appears to be depleted at the GB. (b) Profiles across the grain boundary extracted from the spectral images for (from left to right) Fe, Cr, Ni and Si, showing the extent of depletion and enrichment. The apparent quantities in spectral images is dependent upon the total number of elements included in the quantification, so should not be taken as absolute values, but relative changes in each case.

Figure 17.
Pair of over- and under-focused BF TEM images in 65 dpa FTT material, confirming the presence of fine cavities induced by neutron irradiation.
Figure 17.
Pair of over- and under-focused BF TEM images in 65 dpa FTT material, confirming the presence of fine cavities induced by neutron irradiation.

Figure 18.
(a) Low magnification inverse HAADF image; (b) BF TEM image of the as-irradiated 100 dpa material.
Figure 18.
(a) Low magnification inverse HAADF image; (b) BF TEM image of the as-irradiated 100 dpa material.

Figure 19.
(a) TEM BF image of Ti-rich cuboidal precipitates in 100 dpa material; (b) composition map showing that in some cases they could be TiN.
Figure 19.
(a) TEM BF image of Ti-rich cuboidal precipitates in 100 dpa material; (b) composition map showing that in some cases they could be TiN.

Figure 20.
(a) Spectral image of a slightly off-vertical grain boundary and adjacent matrix in the 100 dpa FTT material, clockwise from upper left: HAADF image and element maps for Fe, Cr, Si, Ni and Mo. (b) the X-ray energy spectrum extracted from the spectrum image area, showing the very strong Mn-Kα and Kβ peak caused by the radioactivity of the specimen. The strong Mn peaks made semi-quantitative analysis of Fe and Cr too inaccurate.

Figure 21.
Under- and over-focused TEM image pair revealing readily apparent population of cavities in the 100 dpa FTT material.
Figure 21.
Under- and over-focused TEM image pair revealing readily apparent population of cavities in the 100 dpa FTT material.

Figure 22.
Applied load during the test in PWR water with lower dissolved hydrogen level (21 cc/kg).
Figure 22.
Applied load during the test in PWR water with lower dissolved hydrogen level (21 cc/kg).

Figure 23.
Load line displacement during the test in PWR water with lower dissolved hydrogen level (21 cc/kg).
Figure 23.
Load line displacement during the test in PWR water with lower dissolved hydrogen level (21 cc/kg).

Figure 24.
Applied load during the test in PWR water with higher dissolved hydrogen level (49 cc/kg).
Figure 24.
Applied load during the test in PWR water with higher dissolved hydrogen level (49 cc/kg).

Figure 25.
Load line displacement during the test in PWR water with higher dissolved hydrogen level (49 cc/kg).
Figure 25.
Load line displacement during the test in PWR water with higher dissolved hydrogen level (49 cc/kg).

Figure 26.
(a) 100 dpa specimen and (b) 65 dpa specimen after test in PWR water with 21 cc/kg H2.

Figure 27.
(a) 100 dpa specimen and (b) 65 dpa specimen after test in PWR water with 49 cc/kg H2.

Figure 28.
(a) BF TEM image of a SA 304 stainless steel from a control rod blade irradiated to 12 dpa; (b) BF TEM image of a CW 316 stainless steel from a baffle bolt that was irradiated to 15 dpa. Both examples show sparser, but larger cavities than those observed in the FTT material of this study, despite significantly lower accrued dpa [25].

Figure 29.
(a,b) are two examples of alpha-prime martensite formed at the fracture surface following IASCC testing of a 30 dpa Type 304 austentic stainless steel [27].
Figure 29.
(a,b) are two examples of alpha-prime martensite formed at the fracture surface following IASCC testing of a 30 dpa Type 304 austentic stainless steel [27].

Figure 30.
Literature data shown in Figure 3, but with the FTT results of the current study now included, along with their associated labels.
Figure 30.
Literature data shown in Figure 3, but with the FTT results of the current study now included, along with their associated labels.


Table 1.
Alloying elements (wt.%) of the Type 316L steel used in this study; balance Fe.
| C | S | P | Si | Mn | Ni | Cr | Mo | Co | V | Ti | Al | Sn | N |
|---|---|---|---|---|---|---|---|---|---|---|---|---|---|
| 0.045 | 0.010 | 0.026 | 0.43 | 1.70 | 13.3 | 17.4 | 2.69 | 0.040 | 0.019 | <0.005 | 0.008 | <0.005 | 0.044 |
Table 2.
Stability of water chemistry values (base levels for dissolved H2 and flow rate were arbitrary, target temperature was 300 °C, target pressure was 150 bar, target oxygen content <5 ppb, pH and conductivity values are for high purity water).
Table 2.
Stability of water chemistry values (base levels for dissolved H2 and flow rate were arbitrary, target temperature was 300 °C, target pressure was 150 bar, target oxygen content <5 ppb, pH and conductivity values are for high purity water).
| T, °C | P, bar | Flow Rate, L/h | Conductivitity, µS/cm | O2, ppb | pH | H2, cc/kg | |
|---|---|---|---|---|---|---|---|
| Min. | 297.8 | 150.4 | 5.1 | 0.053 | 0.62 | 6.57 | 17.5 |
| Max. | 300.3 | 152.3 | 5.4 | 0.059 | 0.66 | 6.58 | 19.4 |
| Avg. | 299.2 | 151.3 | 5.2 | 0.056 | 0.64 | 6.58 | 18.6 |
| Max.−Min. | 2.5 | 1.9 | 0.3 | 0.006 | 0.04 | 0.01 | 1.9 |
Table 3.
Measured stability values of load and temperature. Target load was 250 N and target temperature 340 °C.
Table 3.
Measured stability values of load and temperature. Target load was 250 N and target temperature 340 °C.
| Load, N | Temperature, °C | |
|---|---|---|
| Min. | 221 | 339.9 |
| Max. | 281 | 342.0 |
| Avg. | 249 | 341.4 |
| Max.−Min. | 28 | 2.1 |
| Difference between avg. and set-point | −1 | +1.4 |
Publisher’s Note: MDPI stays neutral with regard to jurisdictional claims in published maps and institutional affiliations. |
© 2021 by the authors. Licensee MDPI, Basel, Switzerland. This article is an open access article distributed under the terms and conditions of the Creative Commons Attribution (CC BY) license (https://creativecommons.org/licenses/by/4.0/).
Share and Cite
MDPI and ACS Style
Karlsen, W.; Toivonen, A.; Efsing, P. Baseline Examinations and Autoclave Tests of 65 and 100 dpa Flux Thimble Tube O-Ring Specimens. Corros. Mater. Degrad. 2021, 2, 248-273. https://0-doi-org.brum.beds.ac.uk/10.3390/cmd2020014
AMA Style
Karlsen W, Toivonen A, Efsing P. Baseline Examinations and Autoclave Tests of 65 and 100 dpa Flux Thimble Tube O-Ring Specimens. Corrosion and Materials Degradation. 2021; 2(2):248-273. https://0-doi-org.brum.beds.ac.uk/10.3390/cmd2020014
Chicago/Turabian StyleKarlsen, Wade, Aki Toivonen, and Pål Efsing. 2021. "Baseline Examinations and Autoclave Tests of 65 and 100 dpa Flux Thimble Tube O-Ring Specimens" Corrosion and Materials Degradation 2, no. 2: 248-273. https://0-doi-org.brum.beds.ac.uk/10.3390/cmd2020014