
Sulfide Stress Cracking of C-110 Steel in a Sour Environment


Mewbourne School of Petroleum and Geological Engineering, University of Oklahoma, Norman, OK 73019, USA
*
Author to whom correspondence should be addressed.
Corros. Mater. Degrad. 2021, 2(3), 376-396; https://0-doi-org.brum.beds.ac.uk/10.3390/cmd2030020
Submission received: 1 May 2021
/
Revised: 8 June 2021
/
Accepted: 29 June 2021
/
Published: 5 July 2021
(This article belongs to the Special Issue Corrosion and Protection of Metals and Alloys in the Energy and Carbon Abatement Sectors: Arduous and Extreme Environments)
Abstract
:The scope of this study includes modeling and experimental investigation of sulfide stress cracking (SSC) of high-strength carbon steel. A model has been developed to predict hydrogen permeation in steel for a given pressure and temperature condition. The model is validated with existing and new laboratory measurements. The experiments were performed using C-110 grade steel specimens. The specimens were aged in 2% (wt.) brine saturated with mixed gas containing CH4, CO2, and H2S. The concentration H2S was maintained constant (280 ppm) while varying the partial pressure ratio of CO2 (i.e., the ratio of partial pressure of CO2 to the total pressure) from 0 to 15%. The changes occurring in the mechanical properties of the specimens were evaluated after exposure to assess material embrittlement and SSC corrosion. Besides this, the cracks developed on the surface of the specimens were examined using an optical microscope. Results show that the hydrogen permeation, and subsequently SSC resistance, of C-110 grade steel were strongly influenced by the Partial Pressure Ratio (PPR) of CO2 when the PPR was between 0 and 5%. The PPR of CO2 had a limited impact on the SSC process when it was between 10 and 15 percent.
1. Introduction
1.1. Overview
In a sour environment, Sulfide Stress Cracking (SSC) corrosion often degrades downhole tubulars by embrittlement which leads to premature failure. This study is aimed at understanding the mechanism of hydrogen diffusion in metals in presence of H2S, determining the factors that influence the vulnerability of tubulars to SSC corrosion, and formulating a model to predict SSC corrosion susceptibility of metals. Often SSC corrosion studies [1,2,3,4] are performed at pressures less than 6 bar. The assessment of SSC corrosion is commonly performed applying the standard NACE test Method A with cylindrical specimens. Besides this, other methods have been developed in the industry to assess the SSC corrosion resistance of metals [5]. Cernocky et al. [6] developed an experimental setup for SSC corrosion testing of a minipipe specimen subjected to triaxial stress loading conditions. The test setup simulated the loading conditions that are similar to the actual wellbores. Results were validated with measurements obtained from full-scale experiments.
The life of oil wells critically depends on casings, which protect the integrity of the wellbore. With increasing depth of wells, casing materials with high strength are required. Even though high-strength materials can handle high pressure and stress levels, they could be susceptible to Sulfide Stress Cracking (SSC) corrosion in a sour environment [7]. This type of corrosion rapidly degrades downhole tubulars by embrittlement, and subsequently cracking that causes early failure. SSC is corrosion that is caused often when stressed tubulars are exposed to an H2S environment. Because of SSC, tubulars usually fail at stress levels well below their yield stress [7]. As a result, SSC is affected by different environmental and metallurgical factors, including material type, microstructure, pressure, temperature, and the composition and pH of the surrounding solution [7,8,9,10].
1.2. Factors Affecting SSC Corrosion Resistance
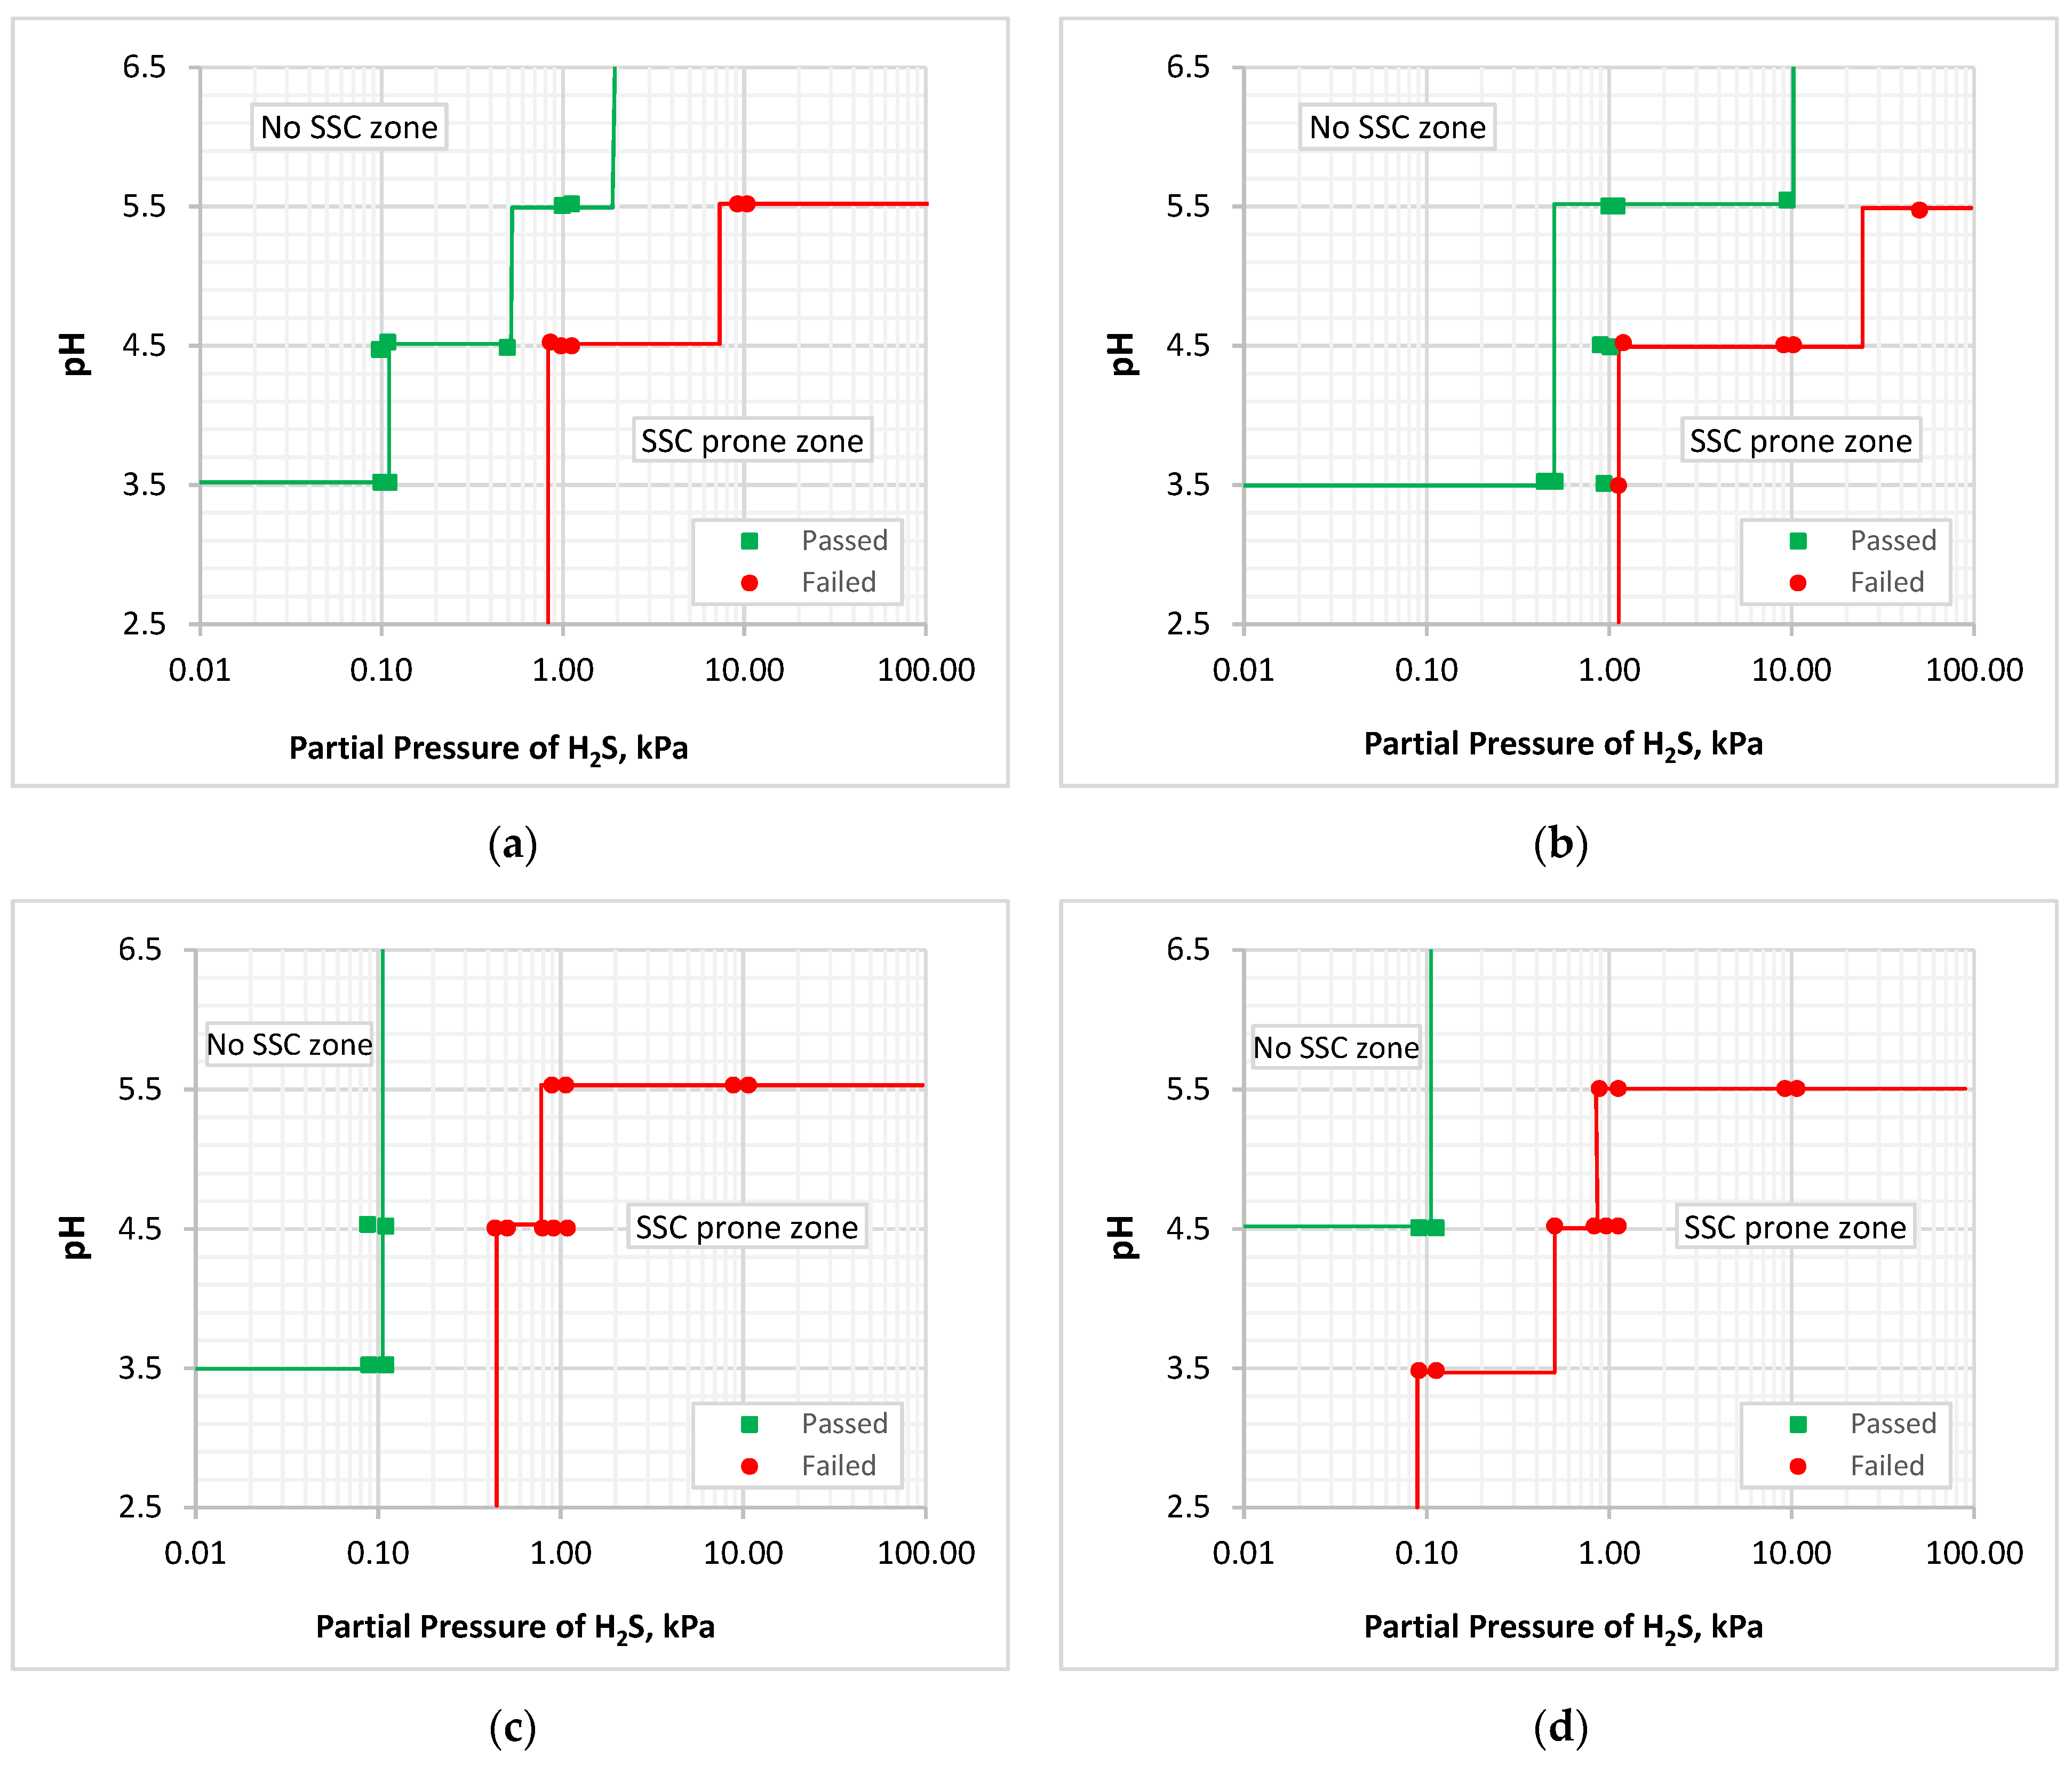
Effect of Partial Pressure of H2S and Solution pH: The partial pressure of H2S and pH of the surrounding solution are the most important factors that affect the SSC corrosion resistance of metals. A recent SSC corrosion study [11] was conducted using the Method A tests. Experiments were performed varying the partial pressure from 0.10 to 50.0 kPa and pH from 3.5 to 5.5. Results demonstrated higher SSC resistance of P-110 carbon steel as compared to high-strength steels (Q-125, Grade 140, and Grade 150 carbon steel). Based on experimental results, a window of applicability plot (Figure 1) was prepared for each steel grade.
Figure 1a displays the operating conditions for Q-125. The area on the left side of the green line represents the safe conditions (i.e., conditions with low partial pressures and high solution pH) in which the vulnerability of the metal to SSC corrosion is minimal while the area on the right side of the red line shows the unsafe conditions in which the material is highly prone to the SSC corrosion. The area in between the two lines represents less certain conditions in which there is a moderate level of vulnerability to the SSC corrosion. Comparing the vulnerability of different steels, P-110 demonstrated the highest window of applicability following Q-125. The SSC corrosion resistance of P-110 was better than Q-125 when they were tested at the same conditions. Thus, as anticipated, the grade with higher yield strength was more susceptible to SSC corrosion.
A study conducted by Vera and Case [12] examined the effects of pH and temperature on SSC corrosion resistance of high strength API carbon steel (P-110) varying pH (2.5 to 3.5) at room temperature and changing temperature (25 to 95 °C) at a pH of 2.5. Increasing pH and temperature improved the SSC corrosion resistance of the metal. Other studies [7,13,14,15,16,17] reported similar observations indicating improvement of the SSC corrosion resistance of steel with an increase in solution pH and temperature.
Effects of Microstructure and Cold Work: A number of investigations [18,19] were performed to study the impact of microstructure on SSC corrosion. A study [19] conducted on materials with varying martensite and bainitic contents indicated that materials with a high martensite content exhibit a higher SSC corrosion resistance. These findings concur with the observations of an earlier study [18]. A more recent SSC corrosion study [20] performed on API-grade pipeline steel demonstrated the impact of microstructure on SSC corrosion. Due to the presence of hard phase cementite at grain boundaries, the ferrite-bainitic microstructure exhibited a lower SSC corrosion resistance as compared to the acicular ferrite microstructure.
Besides microstructure, cold work and the presence of inclusion clusters influence the SSC corrosion resistance. Increasing inclusion clusters in metals exacerbates their susceptibility towards SSC corrosion [21]. Moreover, acicular ferrite exhibits higher SSC resistance than ferrite degenerated pearlite. These findings are in agreement with the observations of a similar study [20]. Furthermore, cold work considerably influences the SSC corrosion resistance of metals. Cold work is regularly conducted on metals to improve their mechanical characteristics such as yield strength, Young modulus, and hardness. When cold work is performed, the grain structure of the material could get distorted, increasing the number of structural dislocations. This causes the loss of ductility and reduction in SSC corrosion resistance [13]. Often heat treatment such as tempering is applied after cold work to recover the SSC corrosion resistance of metals.
Effects of Alloying Element, Hardness, and Fluid Chemistry: In addition to heat treatment, different alloying elements are introduced into the formulation of metals and alloys to improve their metallurgical characteristics including SSC corrosion resistance. Chromium (Cr), Molybdenum, and Nickel are important alloying elements used for improving SSC corrosion resistance. Chromium lessens the rate of hydrogen diffusion into metals [22]. When Nickel content is less than 1%, it does not affect the SSC corrosion resistance of metals [23,24]. However, when it is more than 2%, the yield strength of metals increases, reducing their SSC corrosion resistance [25]. The addition of Molybdenum significantly enhances the SSC corrosion resistance of steels by decreasing the depassivation pH [26]. Metals with a reduced depassivation pH perform better in severe sour environments.
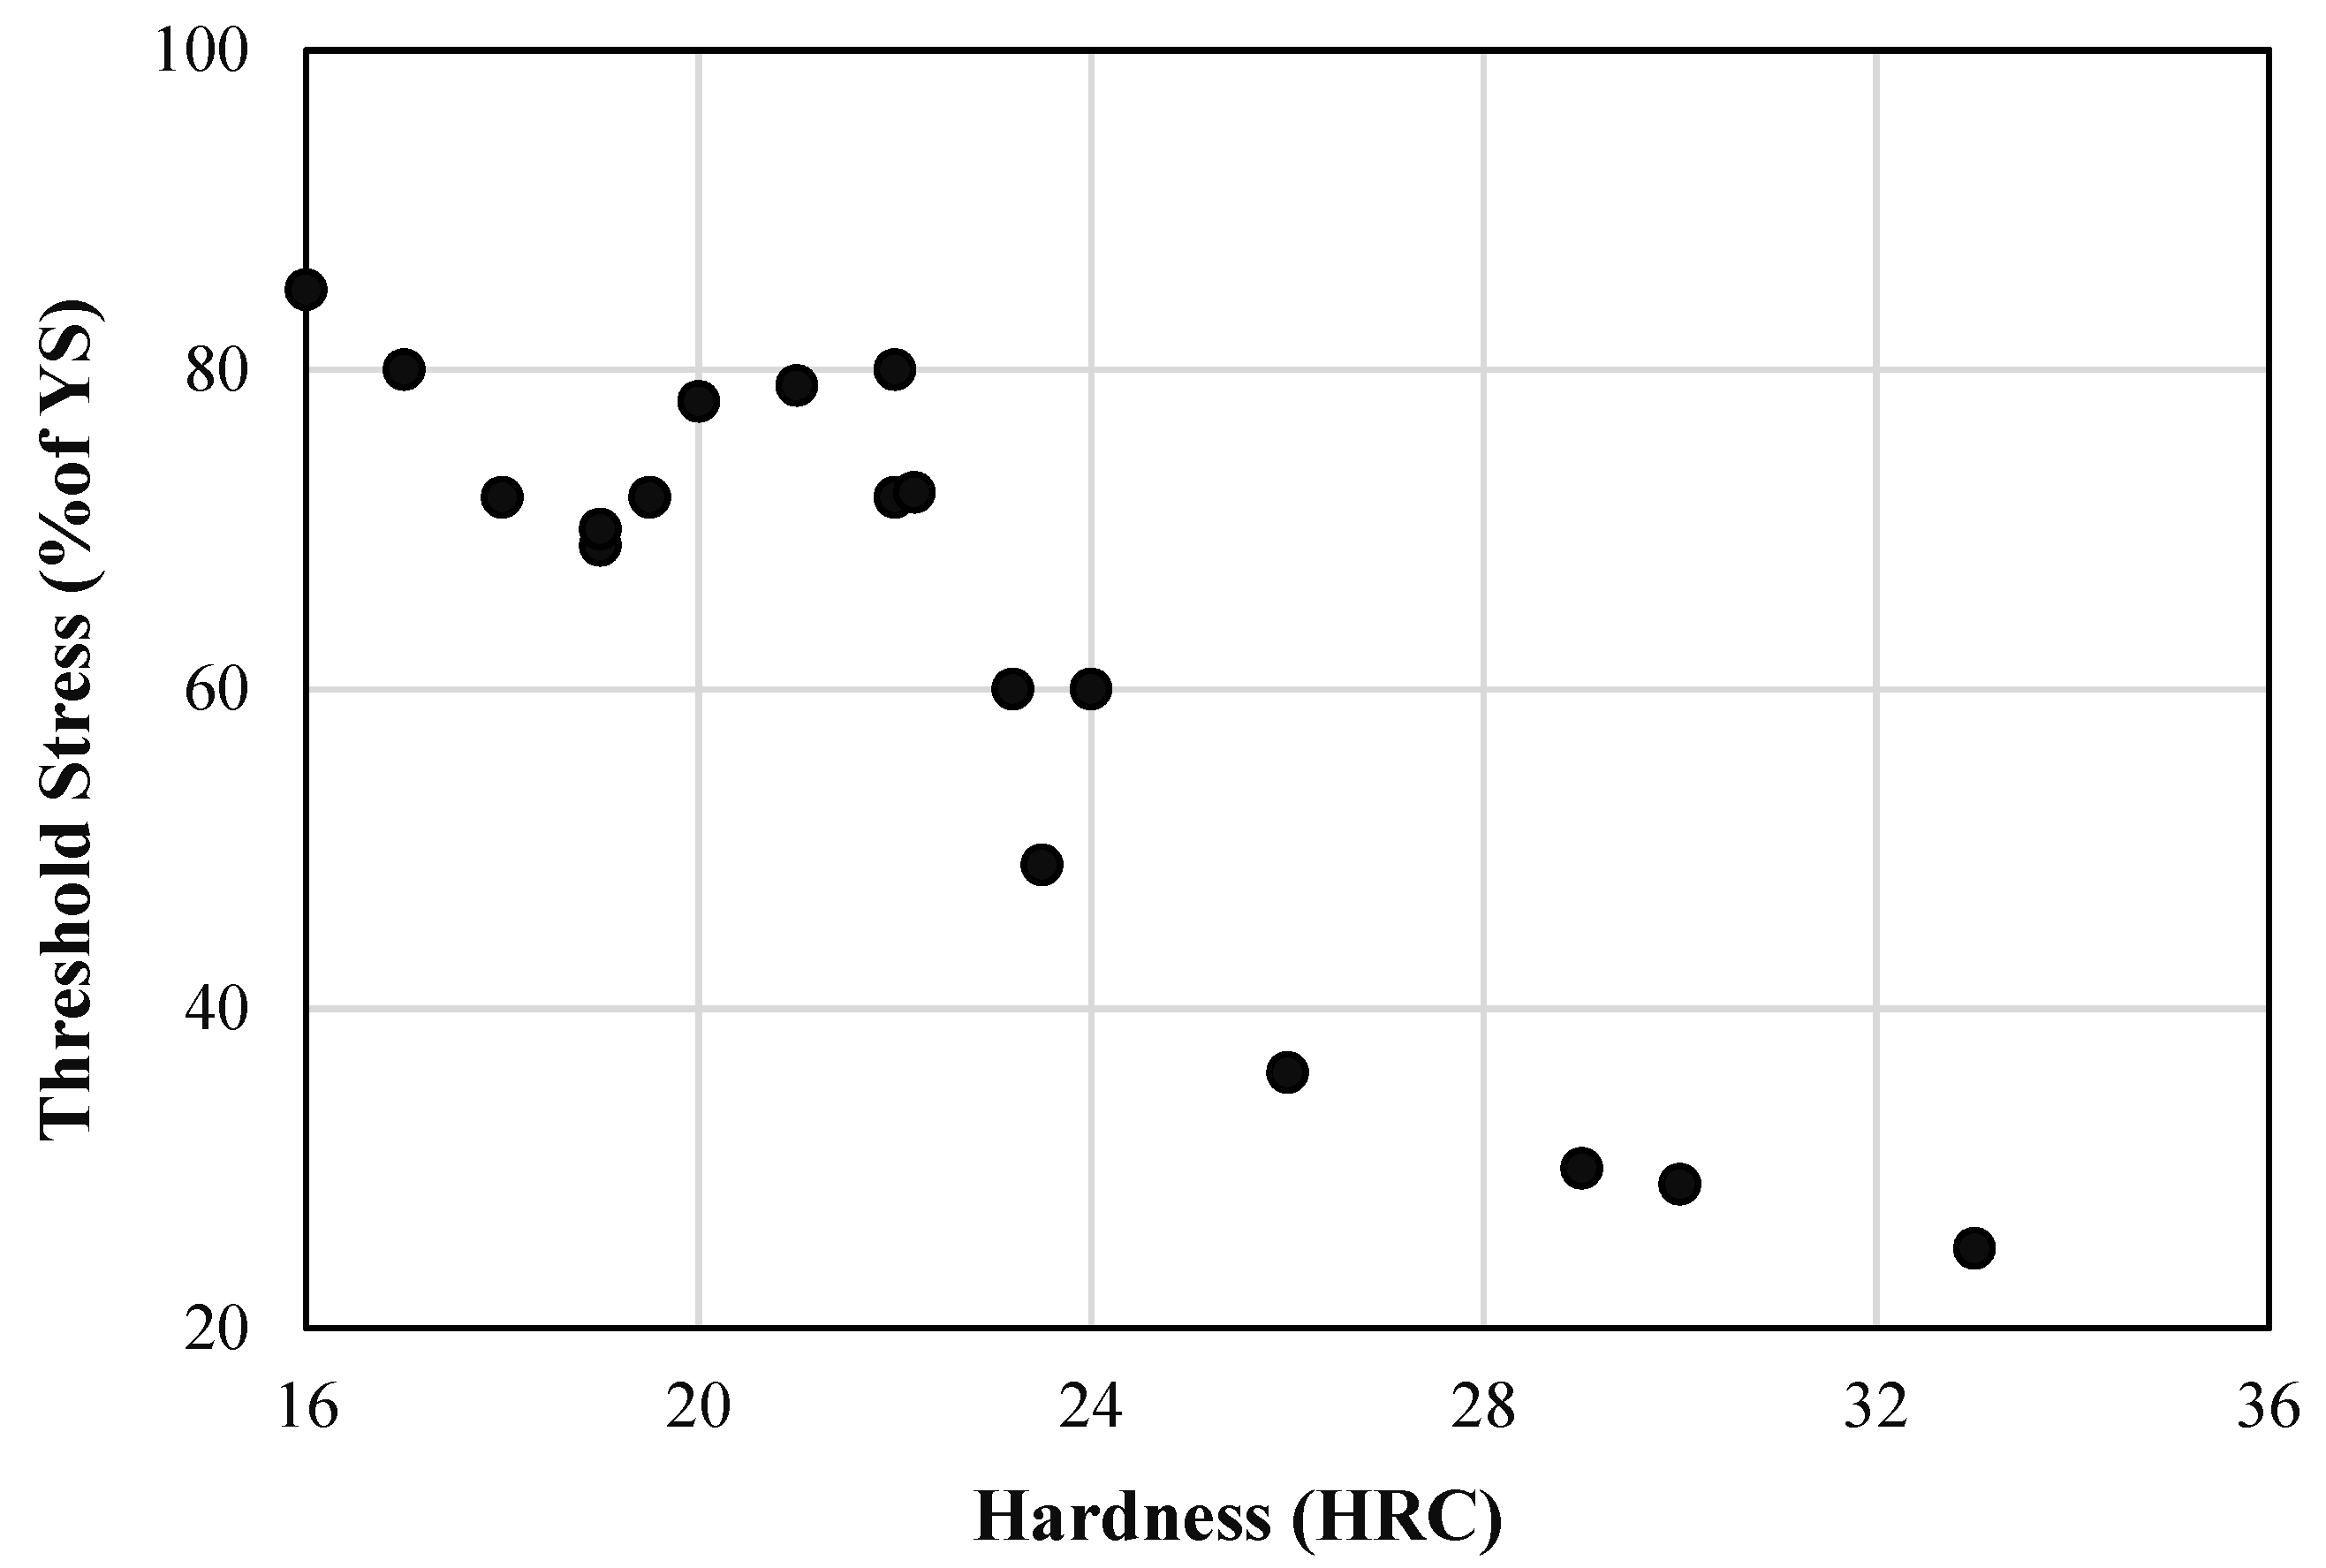
Hardness is one of the commonly applied criteria for selecting steels used in sour environments. Increasing hardness exacerbates the vulnerability of metals towards SSC corrosion. Even if the Rockwell hardness (HRC) limit of 22 is one of the criteria recommended by NACE, it is not a sufficient precondition to prevent SSC corrosion in sour environments. Predominantly, the SSC threshold stress reduces with hardness (Figure 2), even though there is an abnormal threshold stress trend in the hardness range of 22–24 [27]. The SSC threshold stress is a stress level below which metal vulnerability to failure due to SSC corrosion is minimal in standard corrosive solution. Some case studies [28,29] presented in the literature showed the SSC corrosion failures of soft metals that had a hardness level of less than the specified limit (22 HRC).
In addition to the characteristics of metals, the surrounding fluid chemistry is a key factor that affects their SSC corrosion resistance. The presence of a corrosion inhibitor significantly increases the critical stress intensity factor, which represents the minimum stress value required to propagate a crack on SSC corroded metal [30]. The effect of salt content on SSC corrosion resistance of steel is often limited [31].
1.3. Mechanism of SSC Corrosion
SSC corrosion is a hydrogen embrittlement phenomenon resulting from the combined effects of stress and the diffusion of atomic hydrogen into the lattice structure of metals following corrosion by wet H2S. The requirements for SSC corrosion include (i) tensile stress (imposed by either applied loads or residual stresses); (ii) susceptible material with a structural defect, and (iii) entry of atomic hydrogen through exposure to a corrosive environment containing hydrogen sulfide [32].
SSC corrosion occurs due to the combined effect of a corrosive environment containing hydrogen sulfide and tensile stress, which leads to the formation of cracks when its level exceeds the threshold value. The presence of H2S promotes the penetration of hydrogen atoms into the lattice structure of the metal. Because of the stretching of the metal, the corrosion protective layer regularly breaks and detaches from the metal surface. As the stretching continues, a small molecular opening develops on the surface of the metal through which hydrogen atoms can diffuse into it. In presence of a corrosive solution, the atoms of the metal get oxidized leaving electrons on the surface of the metal. These electrons that are absorbed by hydrogen ions form free H atoms, which could convert to H2 molecules. The following chemical reactions describe the process:
Hydrogen sulfide plays a major role in SSC corrosion by impeding the reaction represented by Equation (3). This increases the concentration of hydrogen atoms near the metal surface [33]. Subsequently, the hydrogen atoms enter the metal lattice through openings developed on the surface of the metal due to the stretching of the metal. Consequently, the presence of H2S and tensile stress promotes the entry or permeation of hydrogen atoms into the metal lattice. The permeated atoms occupy void spaces present in the lattice structure resulting in the embrittlement and failure of the metal. Moreover, the presence of H2S facilitates the localized crevice corrosion caused by chloride ions [34].
2. Modeling SSC Corrosion
A new mathematical model has been developed based on an existing model [35] to predict the susceptibility of materials towards SSC corrosion under different environmental conditions. The model predicts hydrogen atom concentration in the steel matrix. The existing model has been improved to extend its range of applicability. The new model predicts H2S concentration using modified Raoult’s law which is applicable for a wide range of pressures (0 to 6.2 MPa) while the existing model predicts the solubility based on Henry’s law which is valid for low pressures (less than 0.21 MPa). The new model also accounts for the impacts of salt content and solution pH on SSC corrosion.
2.1. Model Formulation
The SSC corrosion susceptibility model includes three major calculation steps: (i) determination of H2S and CO2 concentrations in the surrounding solution using solubility model (Appendix A), (ii) predicting of the surrounding solution pH (Appendix B), and (iii) computation of the hydrogen concentration in steel using hydrogen permeation model (Appendix C). The critical hydrogen concentration in steel is utilized as a threshold condition required for the determination of SSC susceptibility of the metal. Along with the solubility of H2S, the solubility model predicts CO2 solubility at a specific pressure and gas-phase composition. The model is appropriate up to 80 °C. The commonly-used API grade steels (Q-125, T-95, and C-110) are not susceptible to SSC corrosion above this temperature [11]. The model is applicable for H2S and CO2 partial pressures of up to 6 and 15 MPa, respectively. The details of the model are presented in Appendix A.
2.2. Numerical Procedures
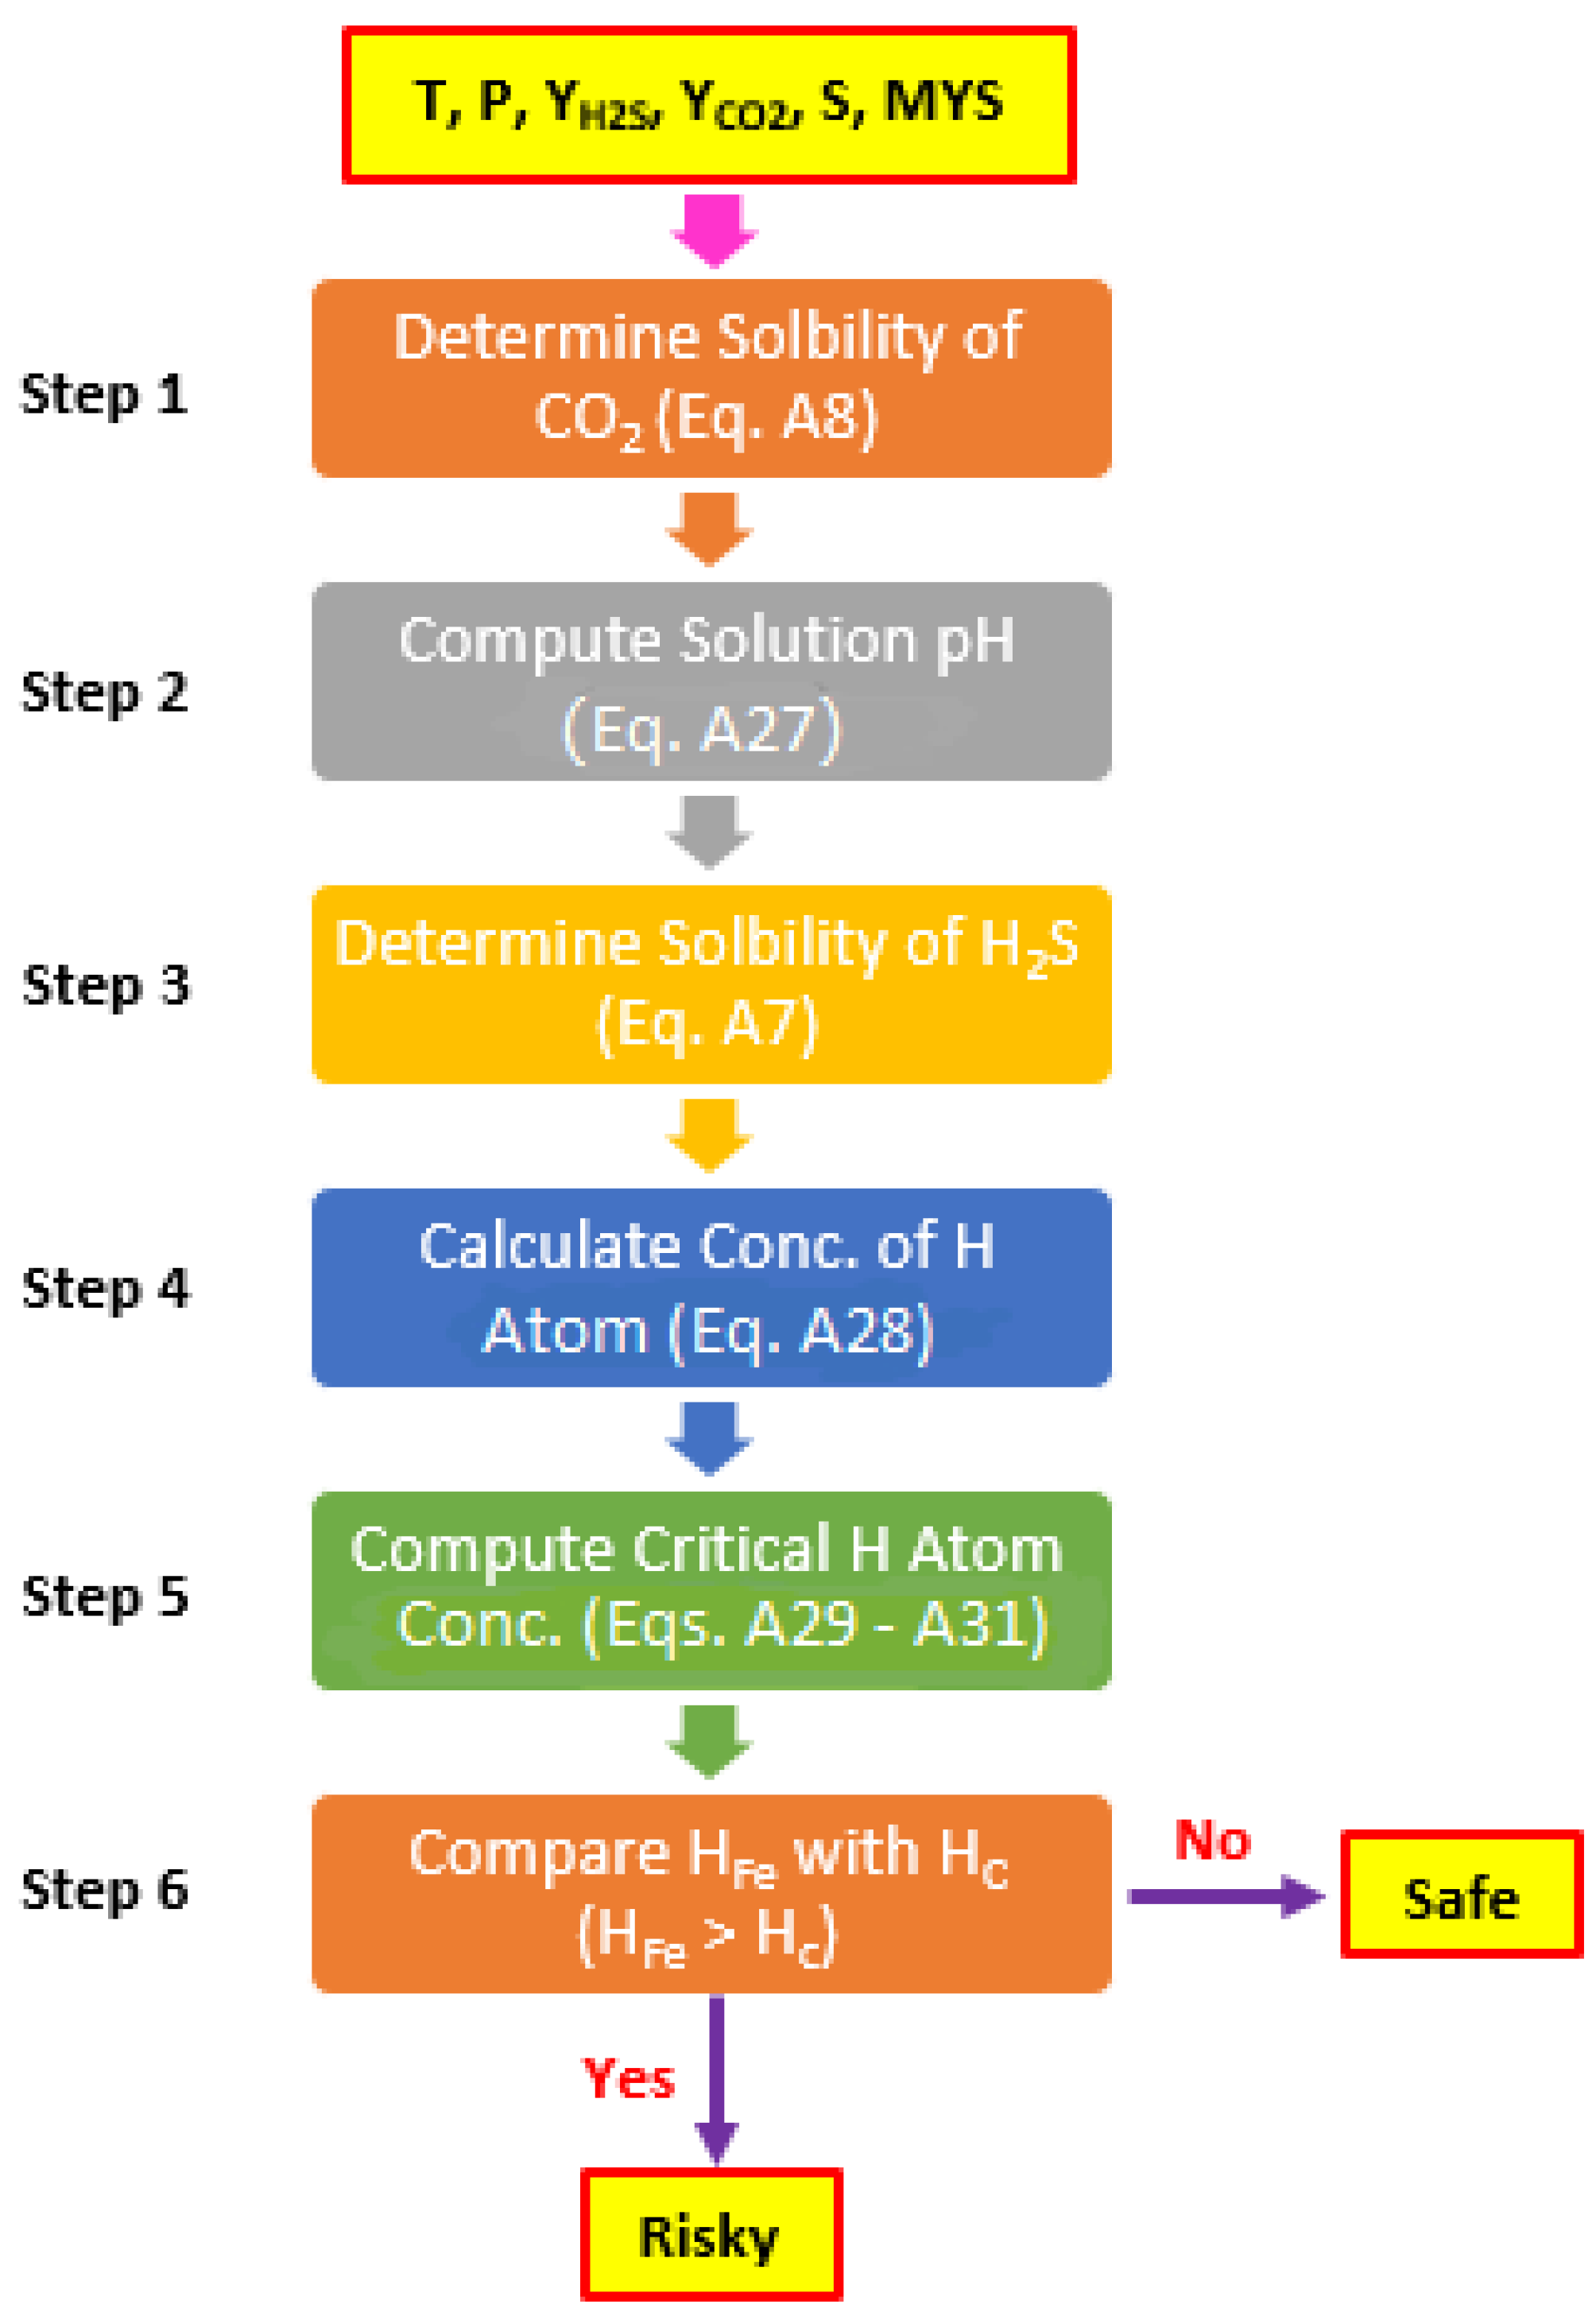
The flowchart presented in Figure 3 displays the calculation steps that are performed to obtain a reliable and unique numerical solution to the SSC corrosion model. The model first (Step 1) determines the solubility of CO2 in brine solutions at a given CO2 partial pressure, temperature, and salt concentration applying Appendix A (Equation (A7)). Then, using the concentration of CO2 obtained from the solubility model, the solution pH is computed as presented in Appendix B (Equation (A25)). Subsequently, the model computes the solubility of H2S in brine at a given H2S partial pressure, temperature, and salt concentration as presented in Appendix A (Equation (A6)). Using H2S concentration calculated in Step 3 and pH calculated from Step 2, the model predicts the concentration of hydrogen atom inside the steel matrix using Appendix C (Equation (A28)). Using yield strength of the metal, the critical hydrogen atom concentration is determined using Equation (A28). Then, comparing the hydrogen atom content of the steel with the critical hydrogen content, the susceptibility of the material towards SSC corrosion is determined.
2.3. Validation of SSC model
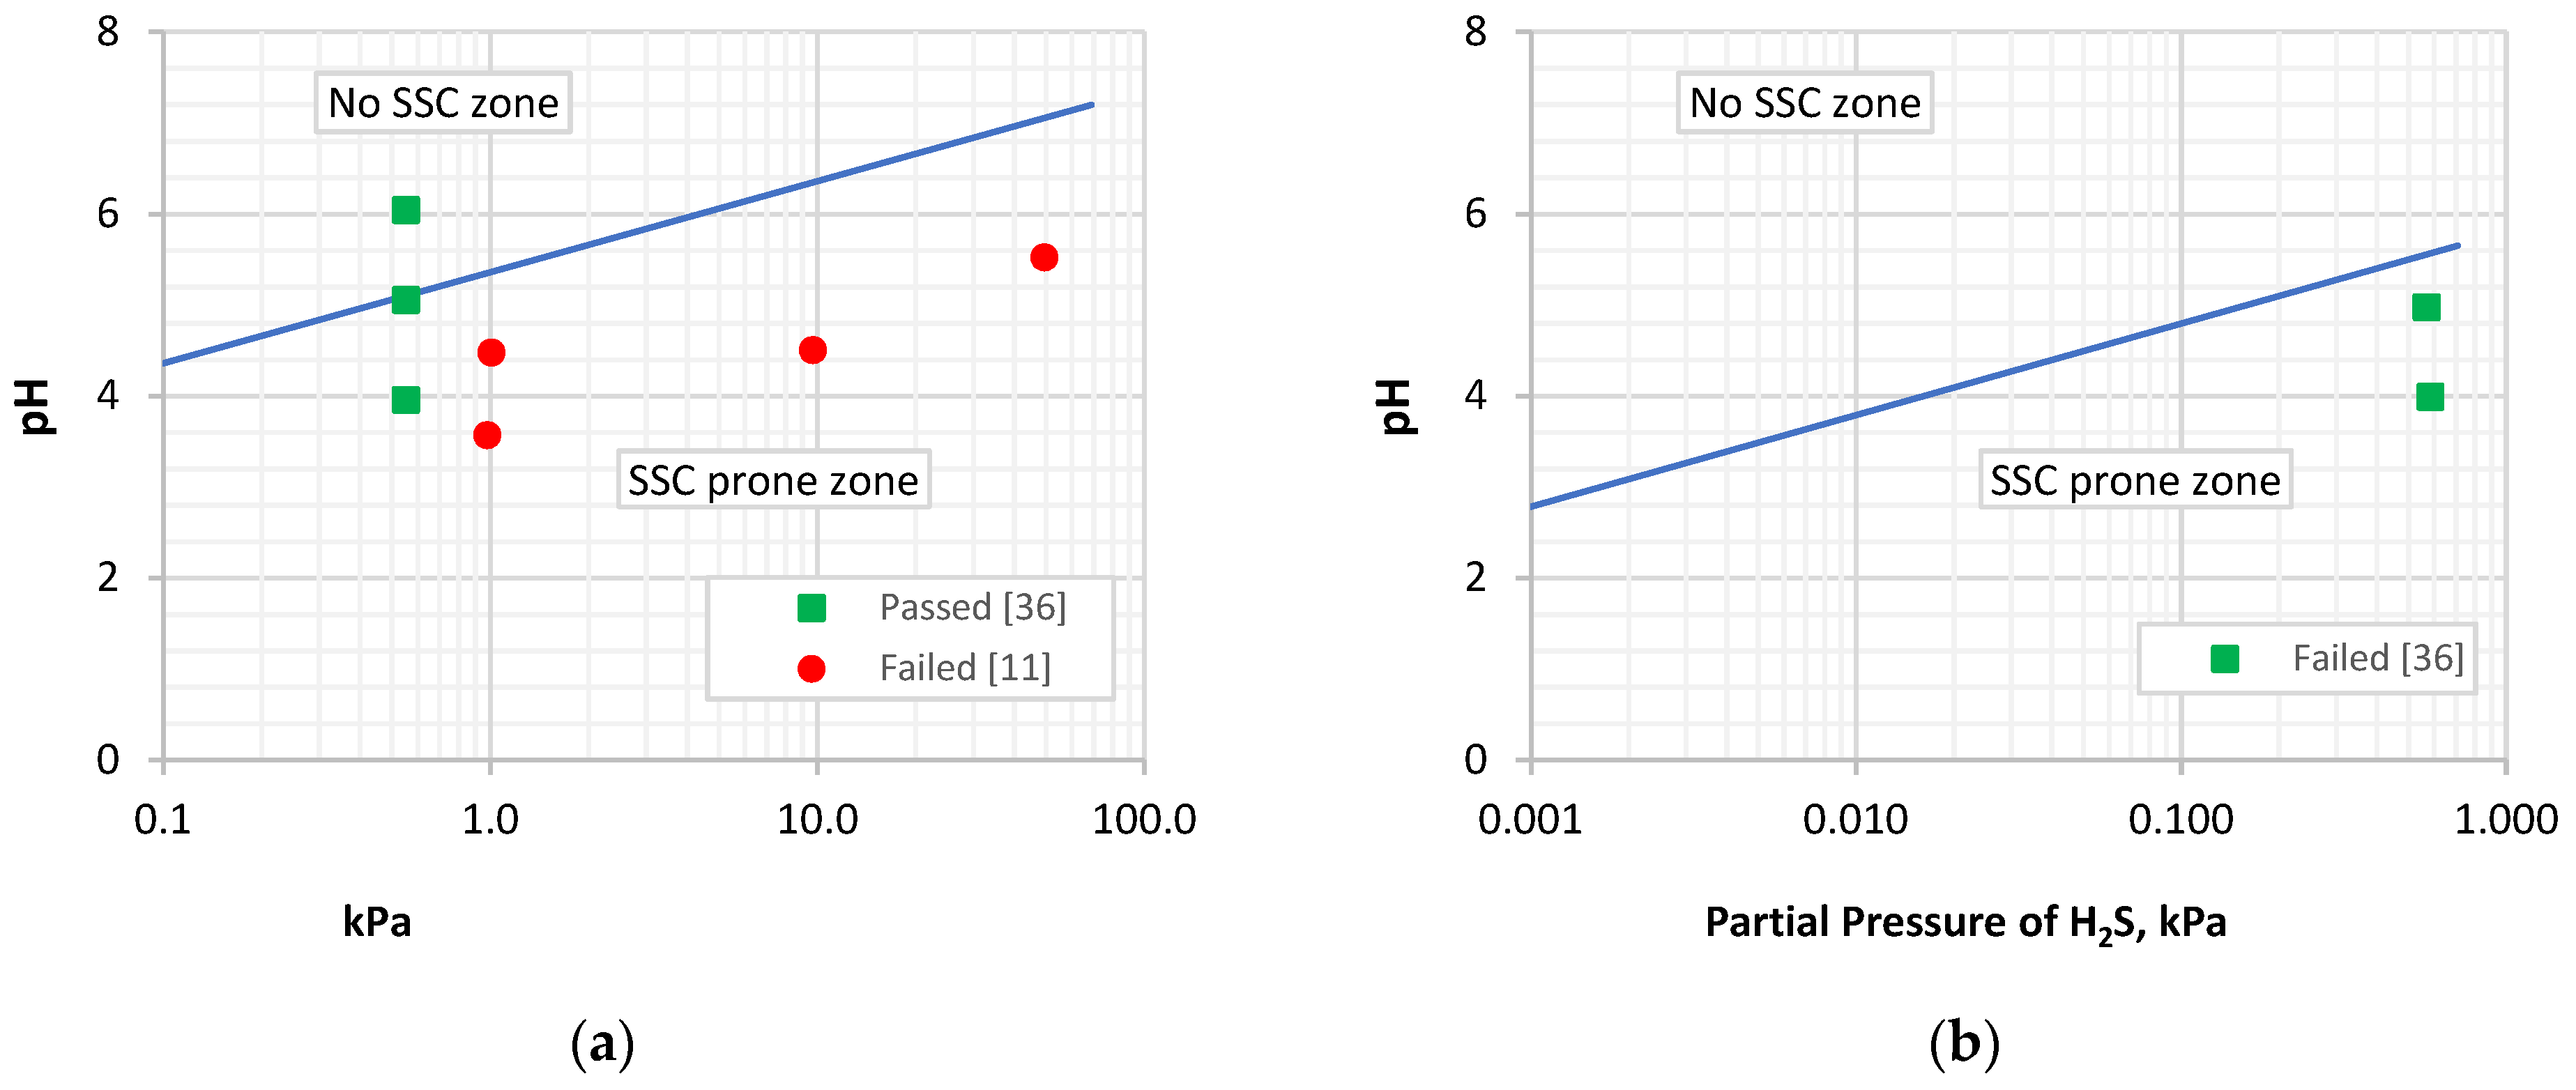
The new model has been validated extensively by comparing its predictions with published measurements [11,36,37]. The measurements of Morana and Nice [11] and Skogsberg et al. [38] were obtained by performing the NACE Method A tests on API grade carbon steels (P-110 and Q-125) while varying the pH of the corrosive environment (aqueous solution) and the partial pressure of H2S in a mixed gas, which was in equilibrium with the solution. The SSC model has been applied to forecast the vulnerability of the materials in these environments. The model predictions are in agreement with published measurements (Figure 4). Some of the specimens which passed the NACE Method A are predicted to be prone to SSC in the given environments. This is because the model provides a conservative estimate since it considers the maximum hydrogen permeation rate as a criterion for SSC failure.
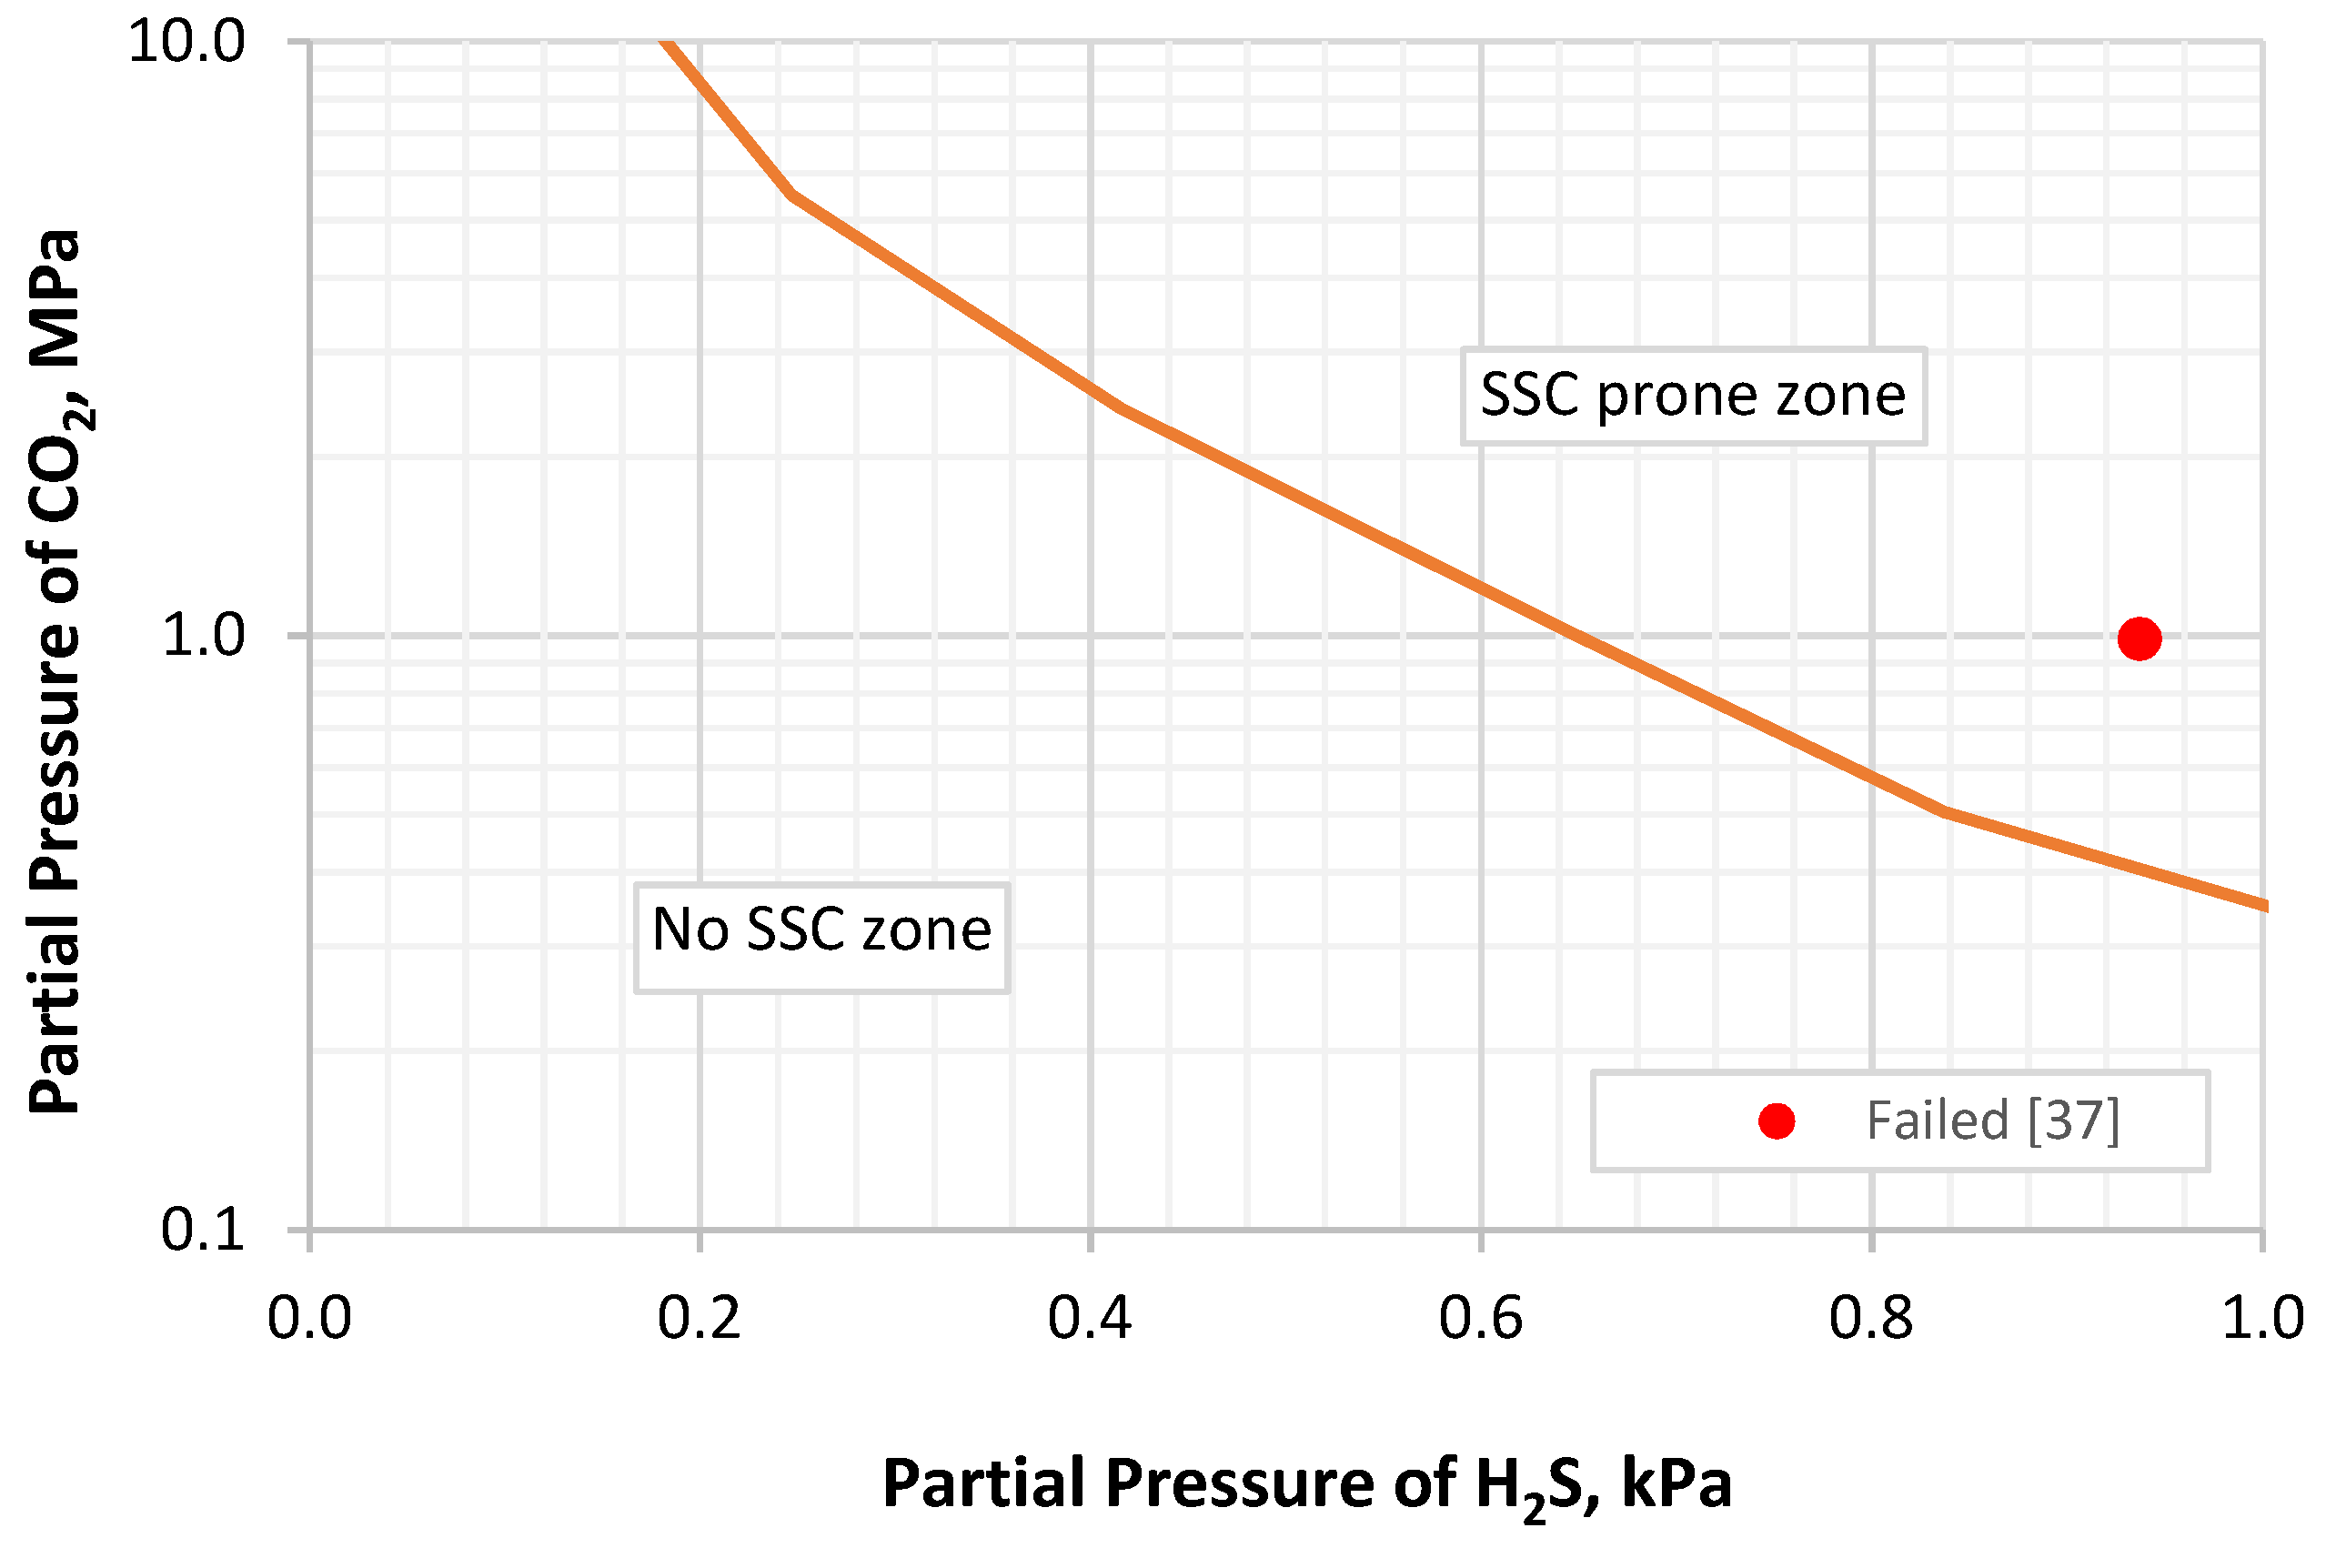
Furthermore, the SSC corrosion model can be utilized to predict the vulnerability of metal towards SSC-related failures under various environmental conditions having different concentrations of CO2 and H2S. Masouri and Zafari [37] presented measurements showing the failure of API grade carbon steel (L-80) under different sour conditions, varying partial pressures of CO2 and H2S in the gas phase. Using the experimental conditions and exposure time, the model is used to predict the susceptibility of the material to SSC failure. The predictions of the model show good agreement with experimental results (Figure 5).
3. Experimental Study
In addition to modeling, an experimental study was performed to investigate SSC corrosion of API carbon steel. All experiments were conducted at a temperature of 38 °C and high pressure 41.4 MPa (inside the minipipe). Two different experimental setups (tensile testing apparatus and SSC corrosion test setup) were utilized to evaluate the embrittlement of API grade C-110 carbon steel. The Tensile Strength Testing (TST) apparatus and SSC corrosion test setup were used in sequence to evaluate the embrittlement of the material.
3.1. SSC Corrosion Evaluation Method
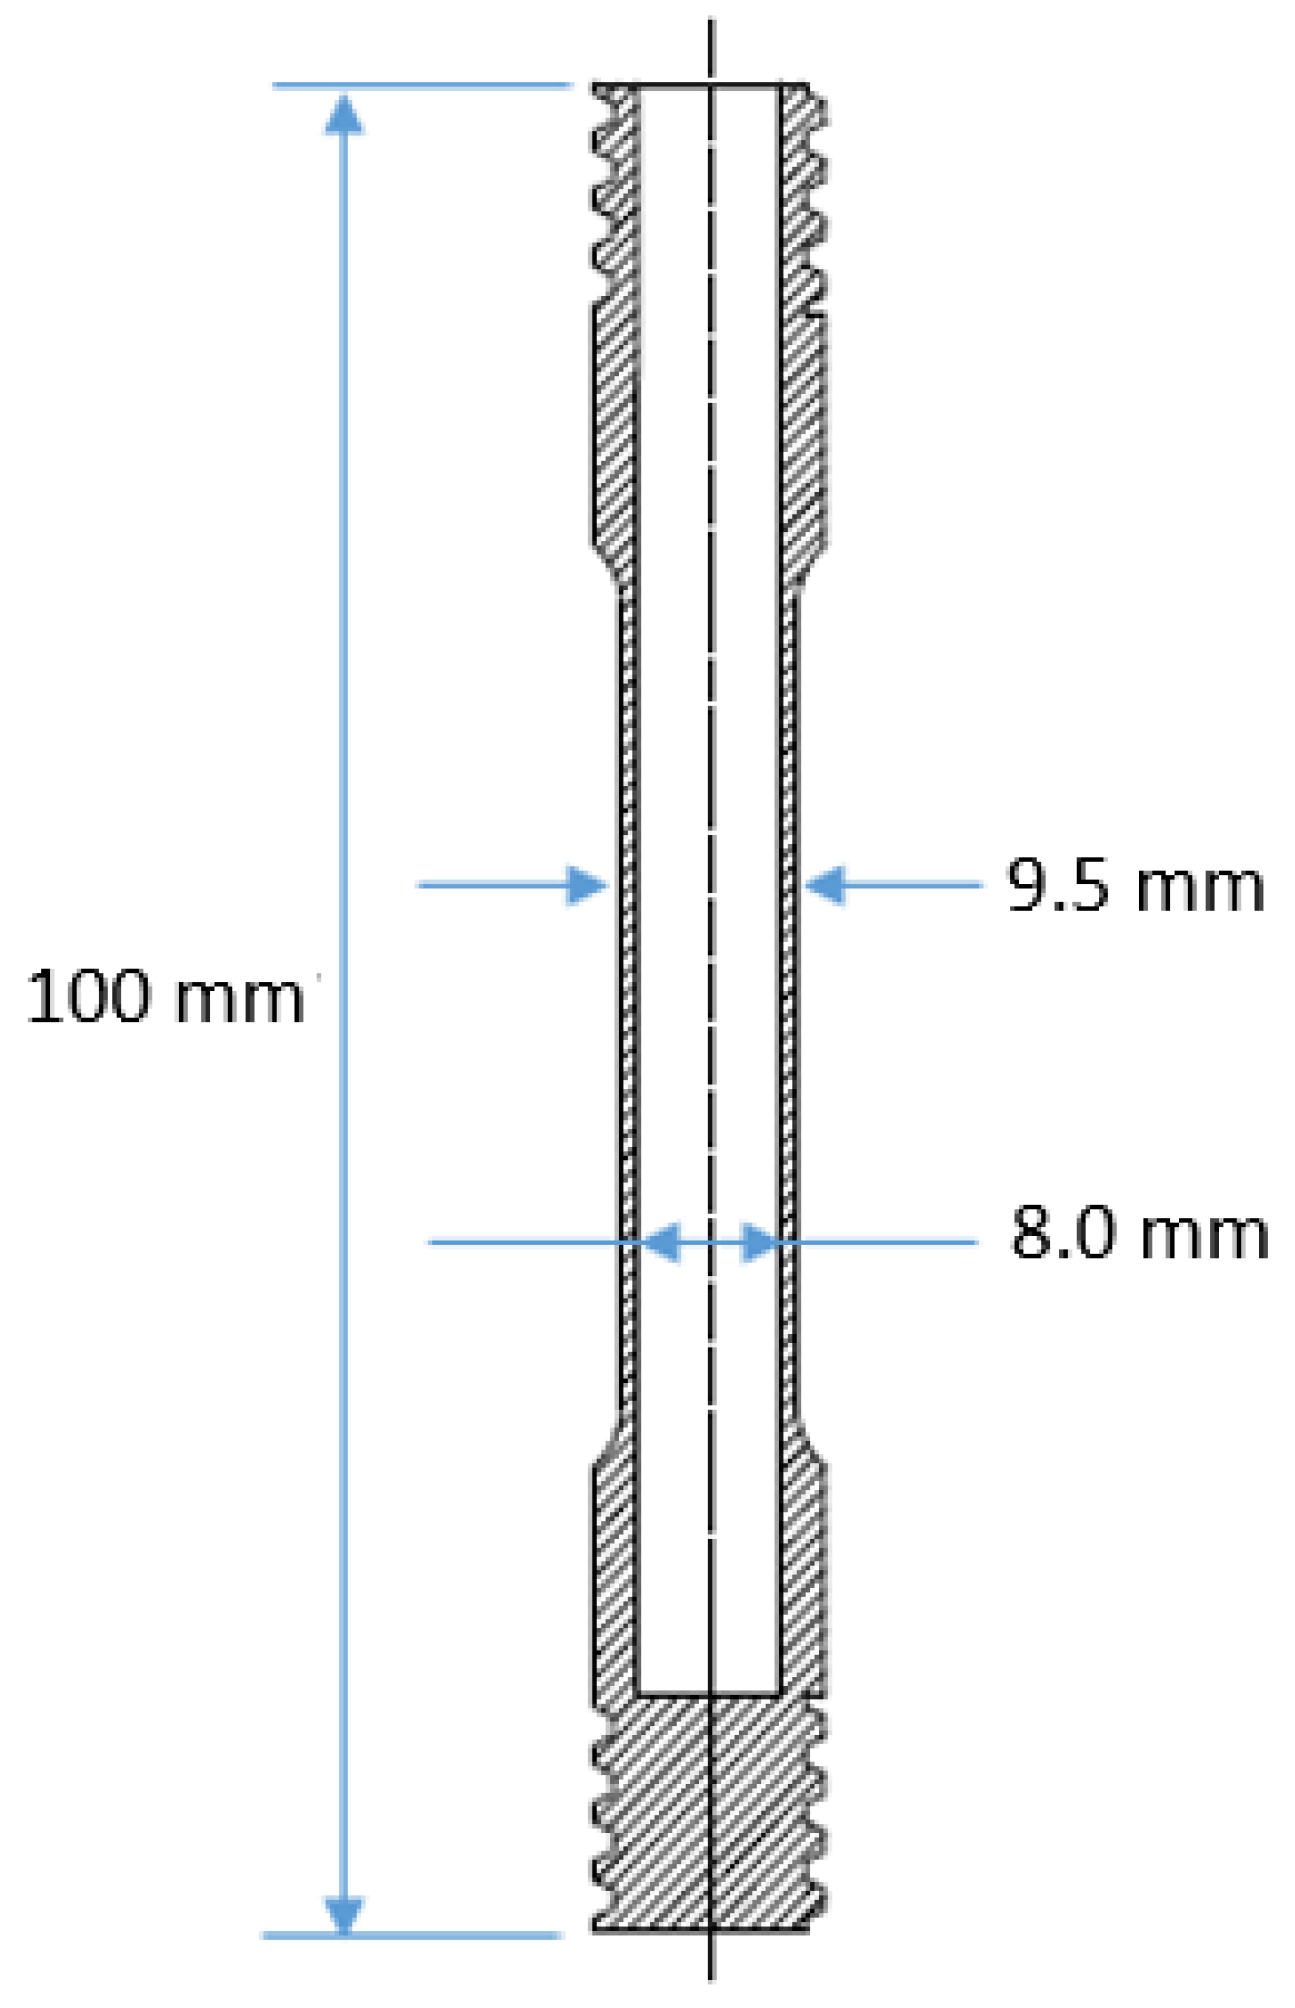
Minipipe specimens (Figure 6) that were cut from an API casing were used for testing SSC corrosion and the associated embrittlement of the test material. To increase accuracy and minimize machining-induced defects, water-jet cutting and milling machines were utilized in the manufacturing of the specimens. The following test procedure was used to evaluate embrittlement occurring after simultaneously exposing the specimens to the corrosive environment and constant stress load:
- Step 1.
- To test its fitness for the SSC experiment, the specimen was stretched three times to 80% of its elastic limit using the TST apparatus and examined for cracks and other mechanical defects.
- Step 2.
- The specimen was thoroughly (inside and outside surfaces) cleaned with methyl ethyl ketone and exposed to a sour environment in the SSC corrosion test setup for one week while being subjected to a stress level of 85% of its yield stress and inner part over-pressurization of 13.8 MPa.
- Step 3.
- The specimen was recovered from the SSC corrosion setup and strained to failure in the air using the TST apparatus to determine the mechanical properties of corroded specimen material.
Specimen failure during the corrosion test or change in mechanical properties after exposure indicates if the specimen experiences embrittlement.
3.2. TST Apparatus
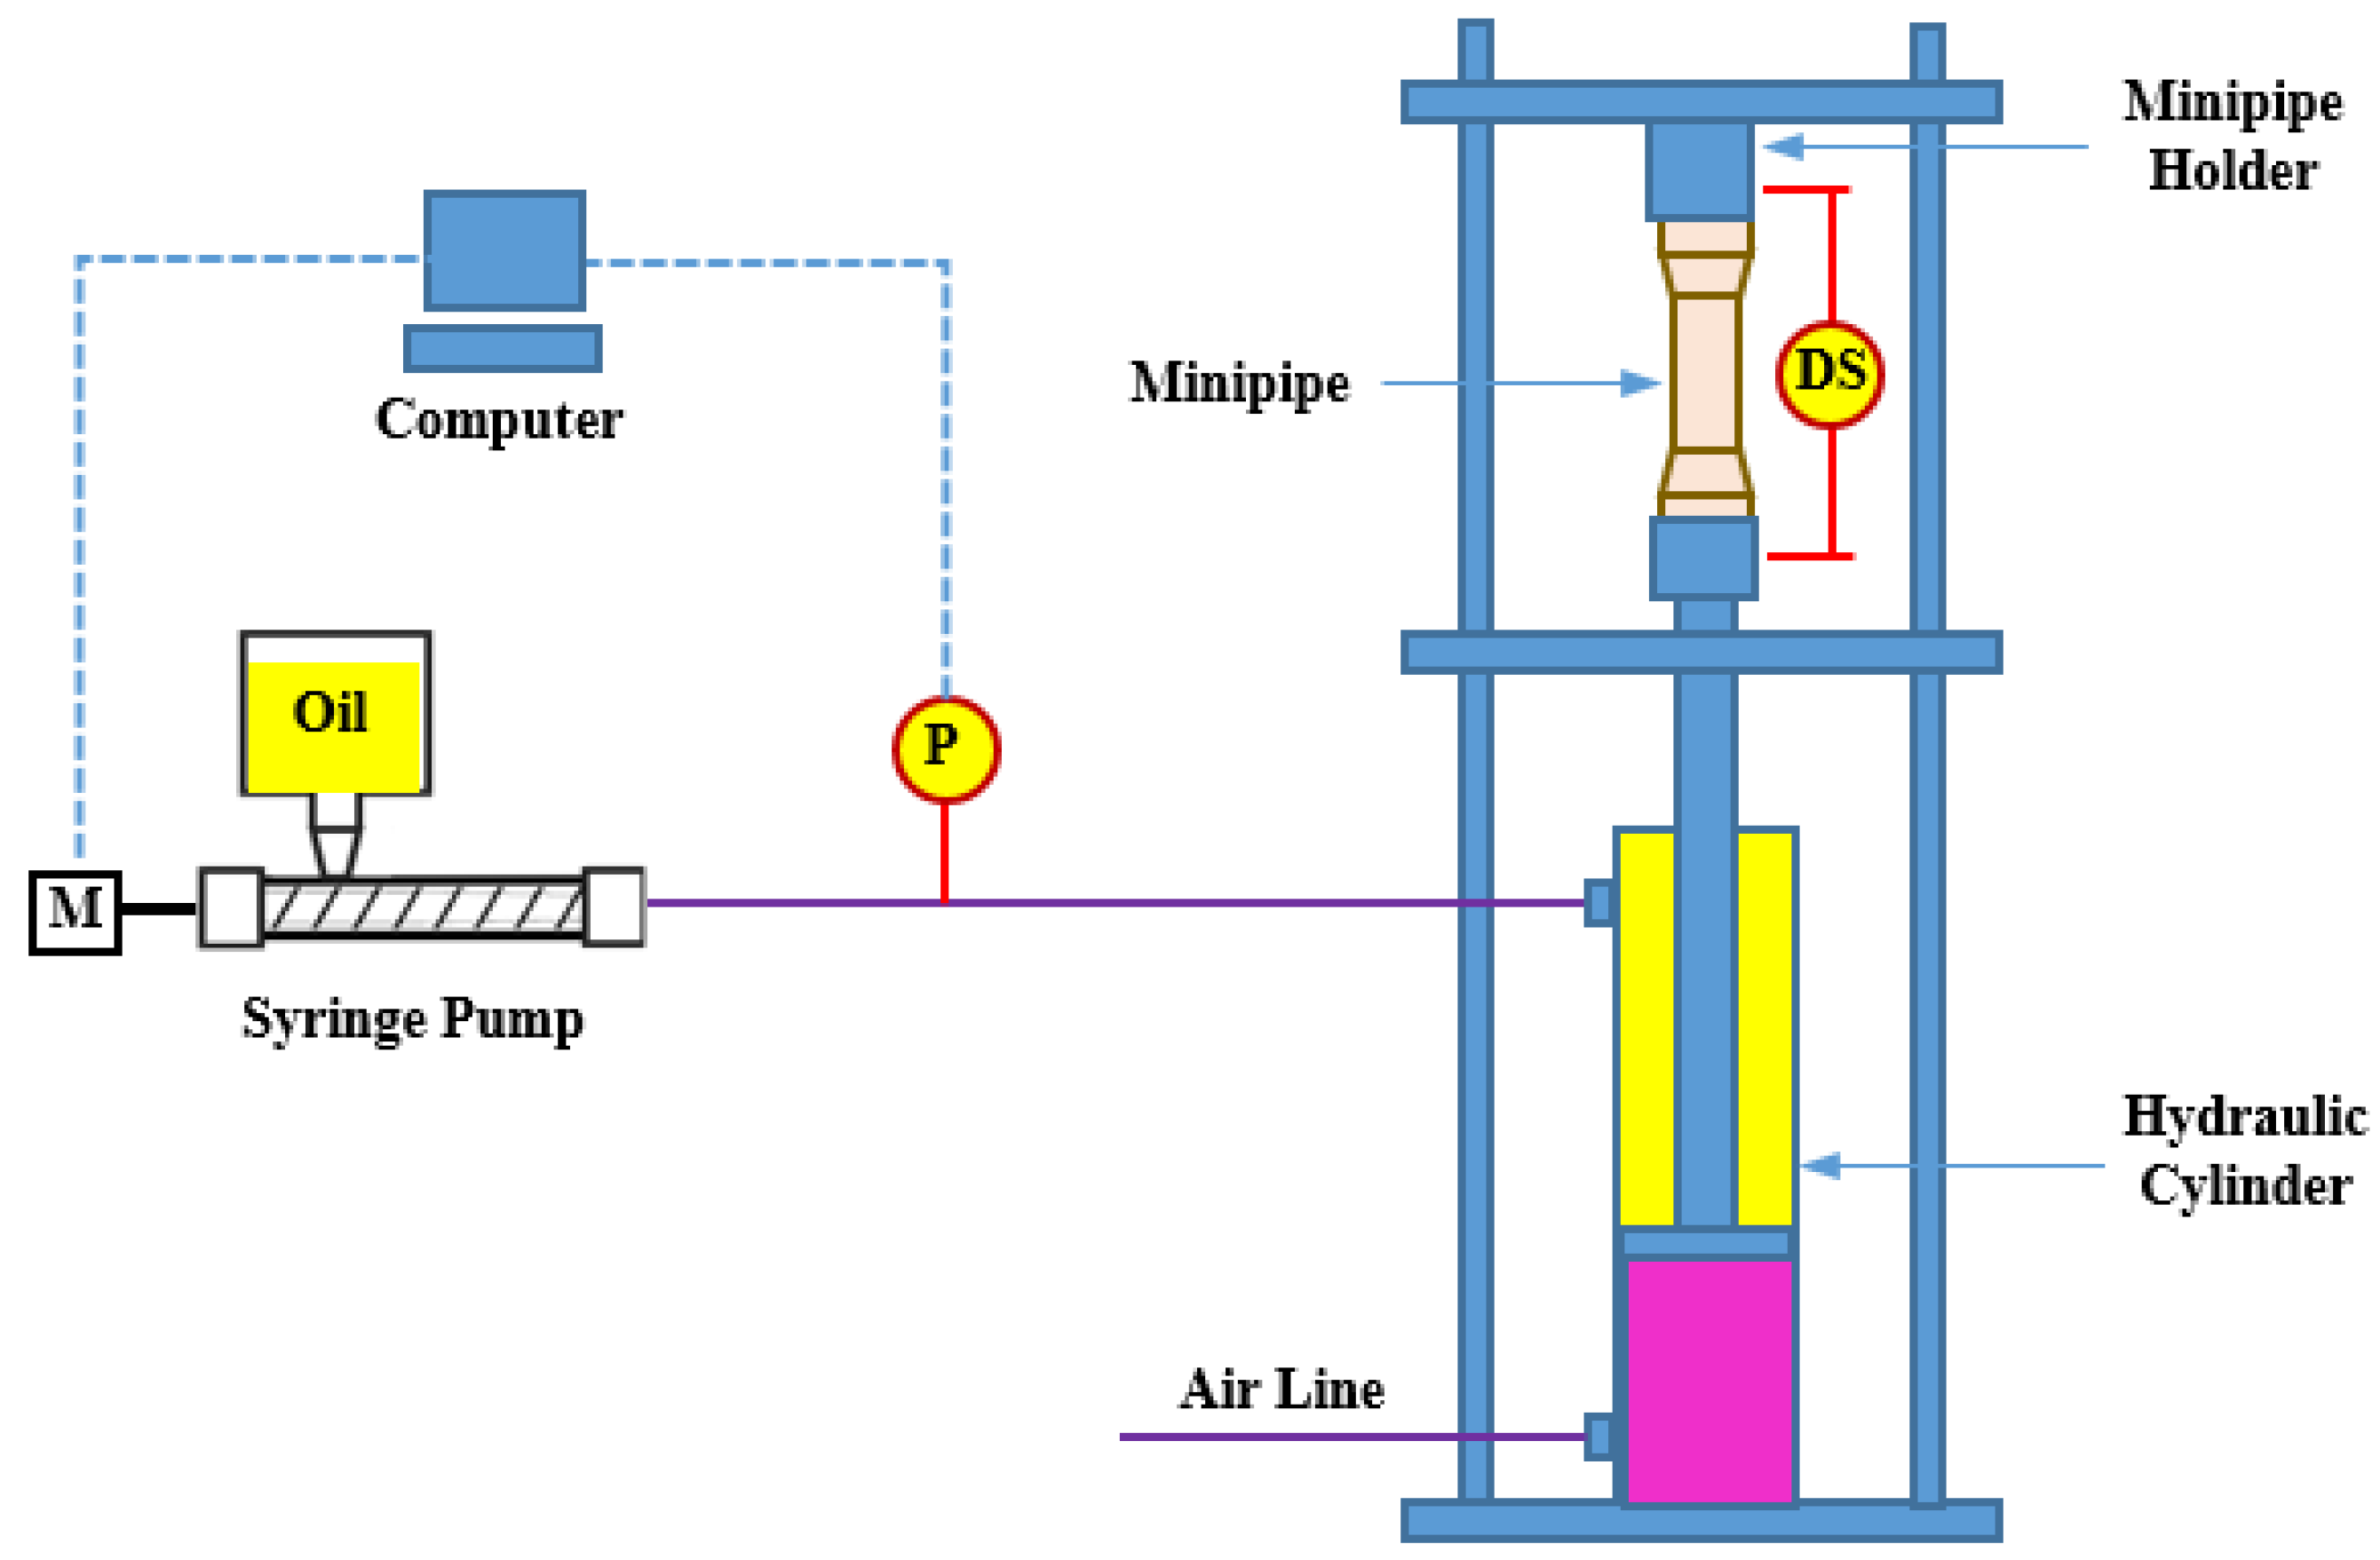
The TST apparatus (Figure 7) was used to strain specimens to failure. The device consists of: (i) structural frame made of four stud bolts and three rectangular flanges; (ii) double-acting hydraulic cylinder; (iii) two minipipe holders used at the top and bottom; (iv) syringe pump with speed controller; (v) measuring instrumentation (displacement sensor and pressure transmitter); and (vi) data acquisition card. During the experiment, a minipipe specimen was screwed to the top and bottom holders. The top holder was directly attached to a flange. The bottom holder was connected to the piston rod of the hydraulic cylinder using a coupler. The displacement sensor was used to measure the change in specimen length occurring during stretching, which is used to determine the strain. The pressure transmitter was utilized to measure oil pressure during the test. The stress developed in the minipipe during the experiment is calculated using the oil pressure data. According to the ASTM standard, the stress loading rate was maintained at 379 MPa per minute. The stress rate was accurately controlled by a computer equipped with a data acquisition and control system. The computer controlled the rate of stress applied on the minipipe by manipulating the syringe pump speed using a data acquisition system. The air injection line was used to actuate the cylinder for adjusting the piston position during the mounting of the minipipe on the setup.
3.3. SSC Corrosion Test Setup
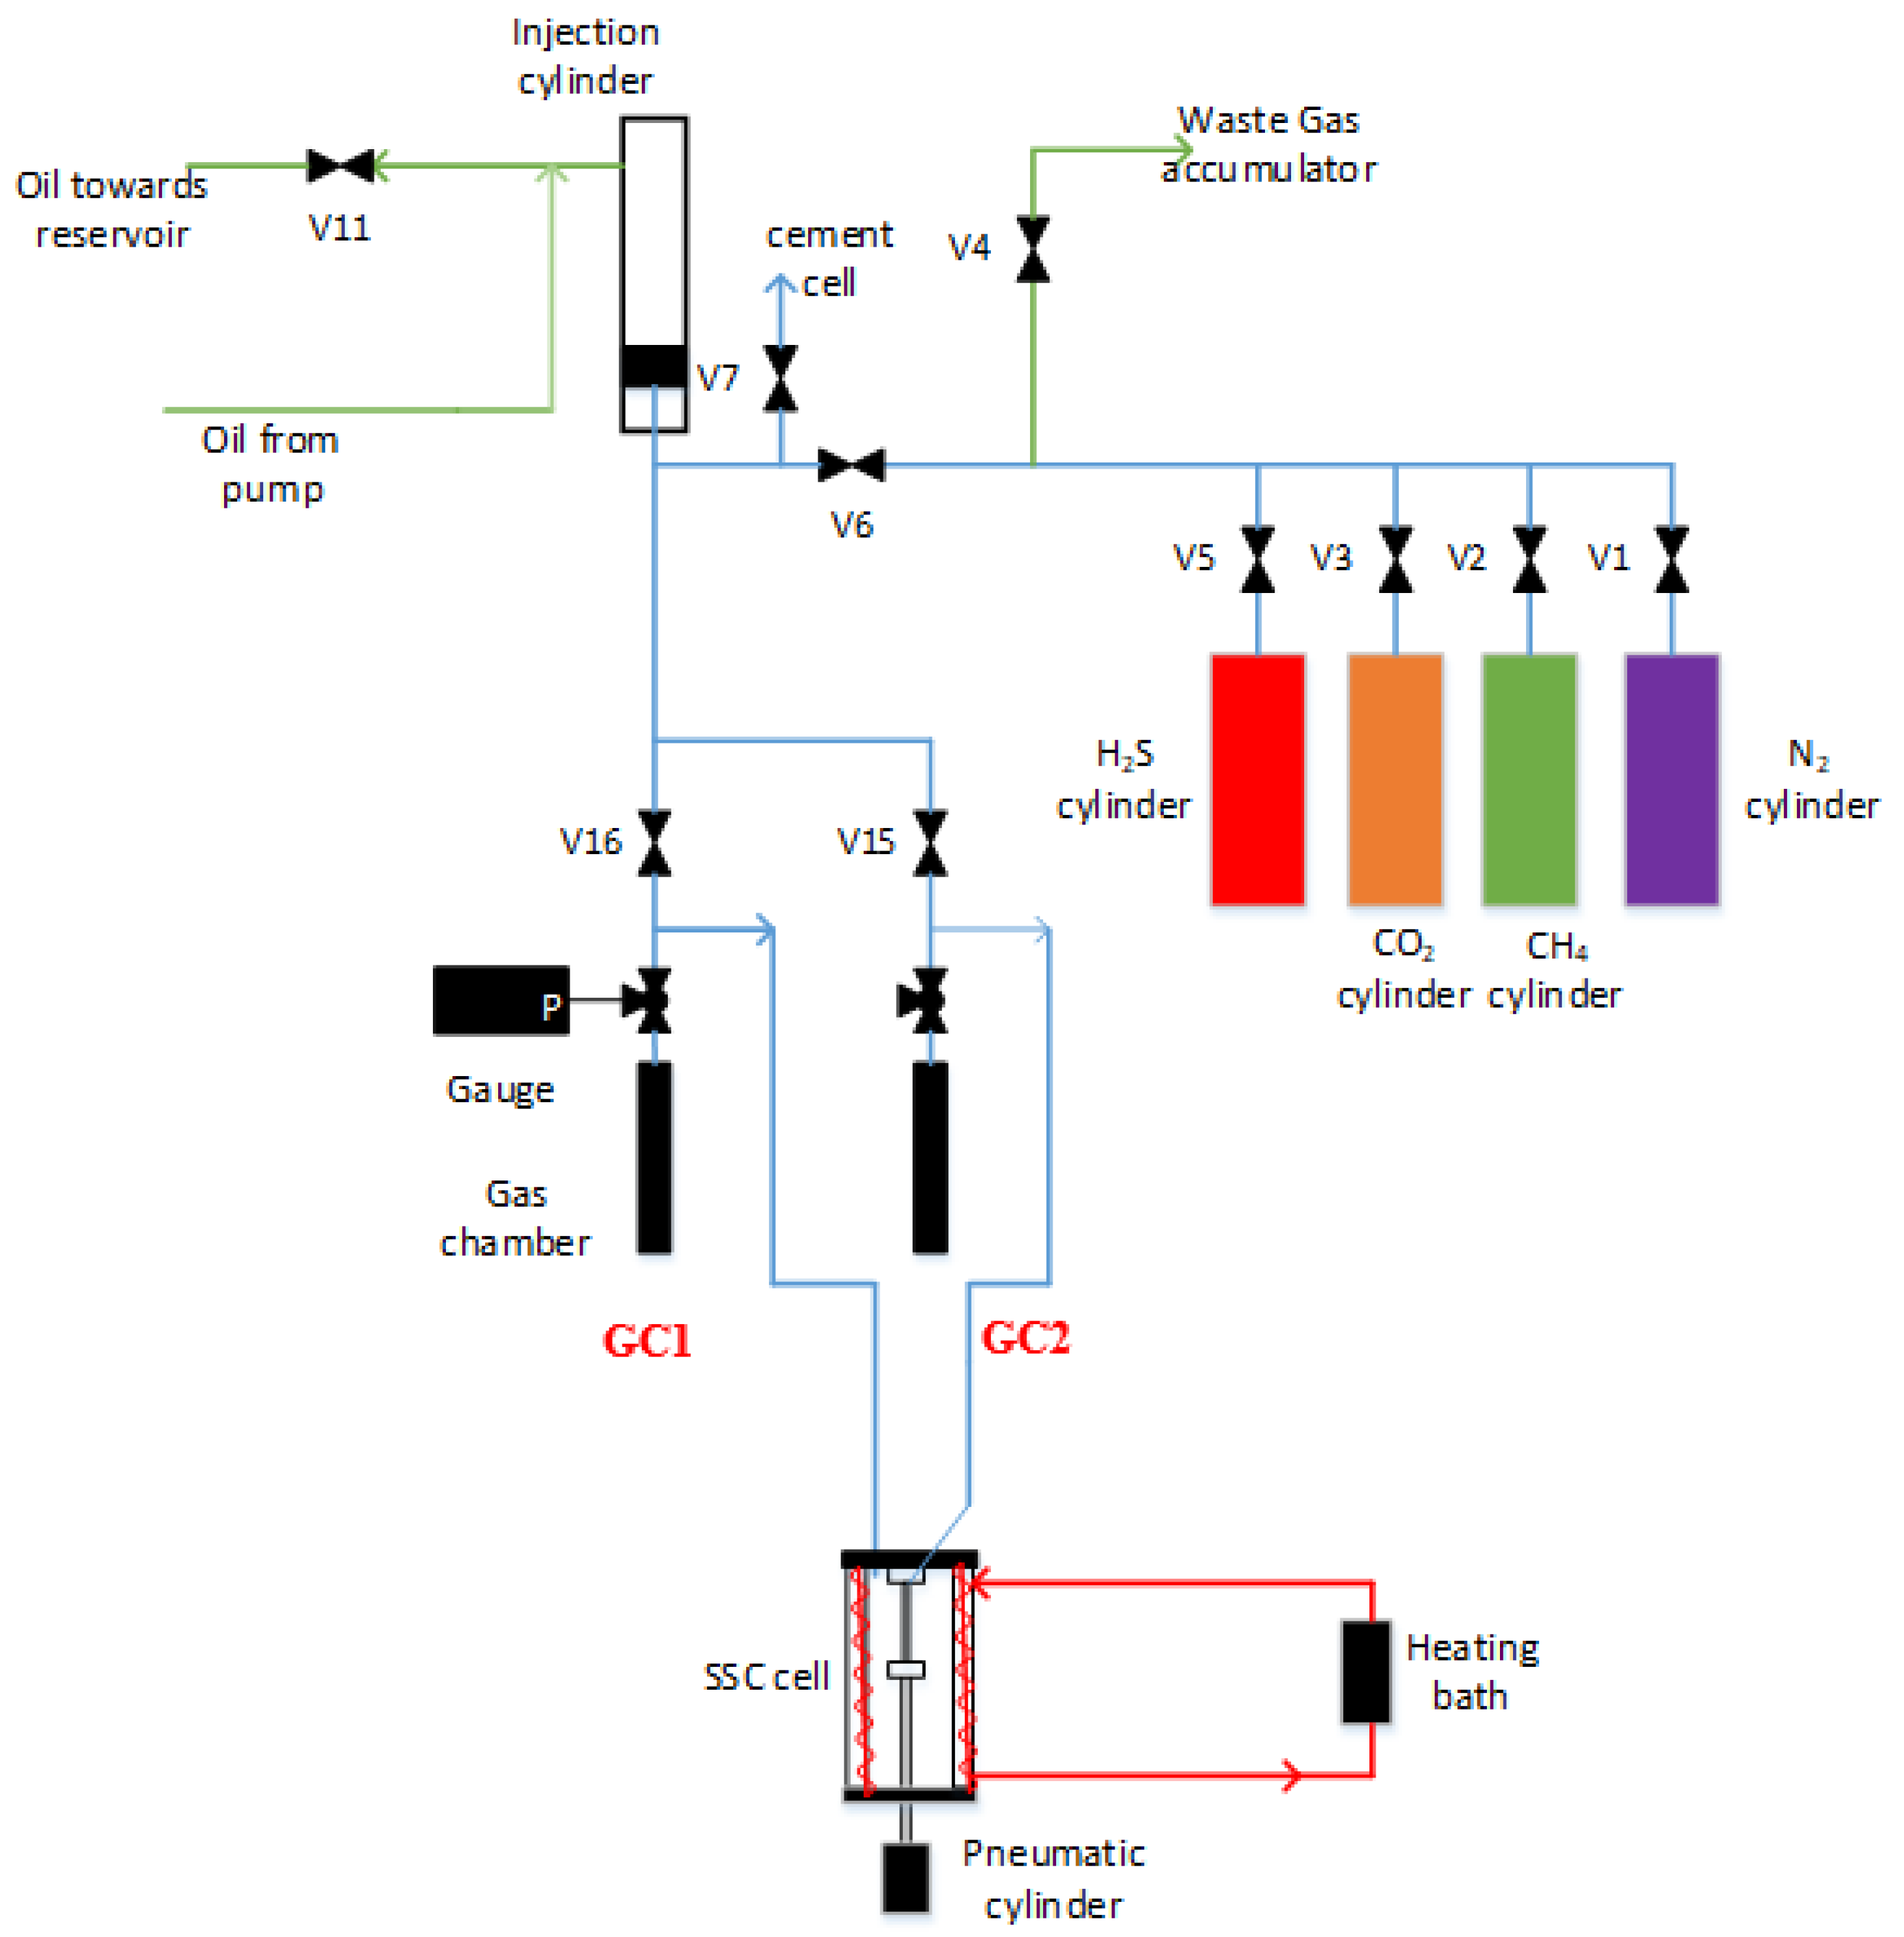
The SSC corrosion test was conducted by simulating the loading conditions in the field. Hence, the test specimen was subjected to complex loading conditions by applying tensile load and inner part over-pressurization at the same time. Both internal and external parts of the specimen were exposed to the corrosive environment. To perform the experiments, a new test setup has been designed and built. The schematic of the setup is shown in Figure 8. The setup consists of: (i) a jacketed SSC corrosion cell; (ii) two gas chambers (GC1 and GC2) used to store 250 mL gas during the test; (iii) gas injection cylinder needed for boosting the supply gas pressure; (iv) heating system, which circulates heating medium through the jacket of the corrosion cell; (v) pneumatic cylinder to apply a constant tensile load; (vi) measurement and instrumentation system to monitor and recover test pressure and temperature; and (vii) data acquisition system.
During the test, the specimen was first mounted in the SSC corrosion cell. The top side of the specimen was attached to the cell lid. The bottom side of the specimen was connected to the piston rod of the pneumatic cylinder. The inner part of the specimen and the annular space between the cell and specimen were filled with brine (2% NaCl solution). The cell was sealed by tightening the lid. Gas injection lines that were connected to the inner and outer parts of the specimen were attached to the cell. Test gases (methane, carbon dioxide, and hydrogen sulfide) required for the experiment were injected into the inner and outer parts of the minipipe simultaneously using the injection cylinder. This was performed by opening valves V15 and V16 and injecting the gas. During the injection, the gas chambers which were directly connected to the inside and outside of the minipipe were pressurized. The chambers served as gas accumulators because the volumetric capacities of the minipipe and SSC corrosion cell were insufficient to hold the gas phase in addition to the corrosive solution. The SSC corrosion tests were conducted maintaining the inside and outside of the minipipe at different pressures. The pneumatic cylinder was installed below the SSC cell to apply tensile load on the minipipe. The cylinder rod is directly connected to the bottom side of the specimen.
3.4. Corrosion Test Procedure
A specimen was first stretched three times to 80% of its elastic limit using the TST apparatus and examined for cracks and other mechanical defects. Then, the specimen was scrubbed using methyl-ethyl ketone to remove dirt materials such as oil and grease. After cleaning, the specimen was mounted on the piston rod and filled with brine (2% NaCl solution). Subsequently, the cell was filled with brine. The specimen was lowered into the cell to the appropriate position and the cell lid was assembled. Then, the cell cover was placed and bolted. The gas injection lines were connected to the cell. To deoxygenate the corrosive solution, the inner and outer parts of the specimen were purged with nitrogen at 13.8 MPa for 30 min. After purging, test gases were injected at the desired pressure into the inner and outer parts of the specimen. The inner part of the specimen was maintained at a higher pressure than its outside. During pressurization, both parts of the specimen were first pressurized simultaneously to the desired minipipe external pressure (27.6 MPa). Then, the outer part of the specimen was isolated and more gases were injected into its inner part to increase the pressure to 41.4 MPa. A differential pressure (13.8 MPa) was maintained between the outer and inner parts of the specimen to detect its failure during the test and also to simulate the actual wellbore condition with a certain level of differential pressure load. A tensile load that produces the stress level of 85% of the yield strength of the specimen material was applied using the pneumatic cylinder. The specimen was left in the cell for one week.
Materials that are vulnerable to SSC corrosion are expected to display cracks within one week of exposure [39]; therefore, the one-week time interval was selected for the experiments. Test parameters such as inner and outer specimen pressures, temperature, and pneumatic cylinder pressure were continuously monitored and recorded using the data acquisition system. Test pressures tend to slightly drop because of gas consumption due to the corrosion process and leaks occurring at the inlet connections. Hence, to maintain constant pressure, gas was injected into both sides of the specimen as needed. After seven days of exposure, the cell was depressurized and the specimen was recovered from the cell and examined for cracks.
3.5. Test Matrix
Table 1 shows the test conditions for SSC corrosion experiments. The minipipe specimen used in Test 2 was the baseline, which was not exposed to the corrosive environment. The baseline specimen was tested using the TST machine to obtain reference (uncorroded material) mechanical properties. The rest of the specimens were exposed to different sour conditions as shown in Table 1. All experiments were conducted at constant temperature (38 ± 1 °C) and H2S concentration (280 ± 20 ppm).
3.6. TST Test Procedure
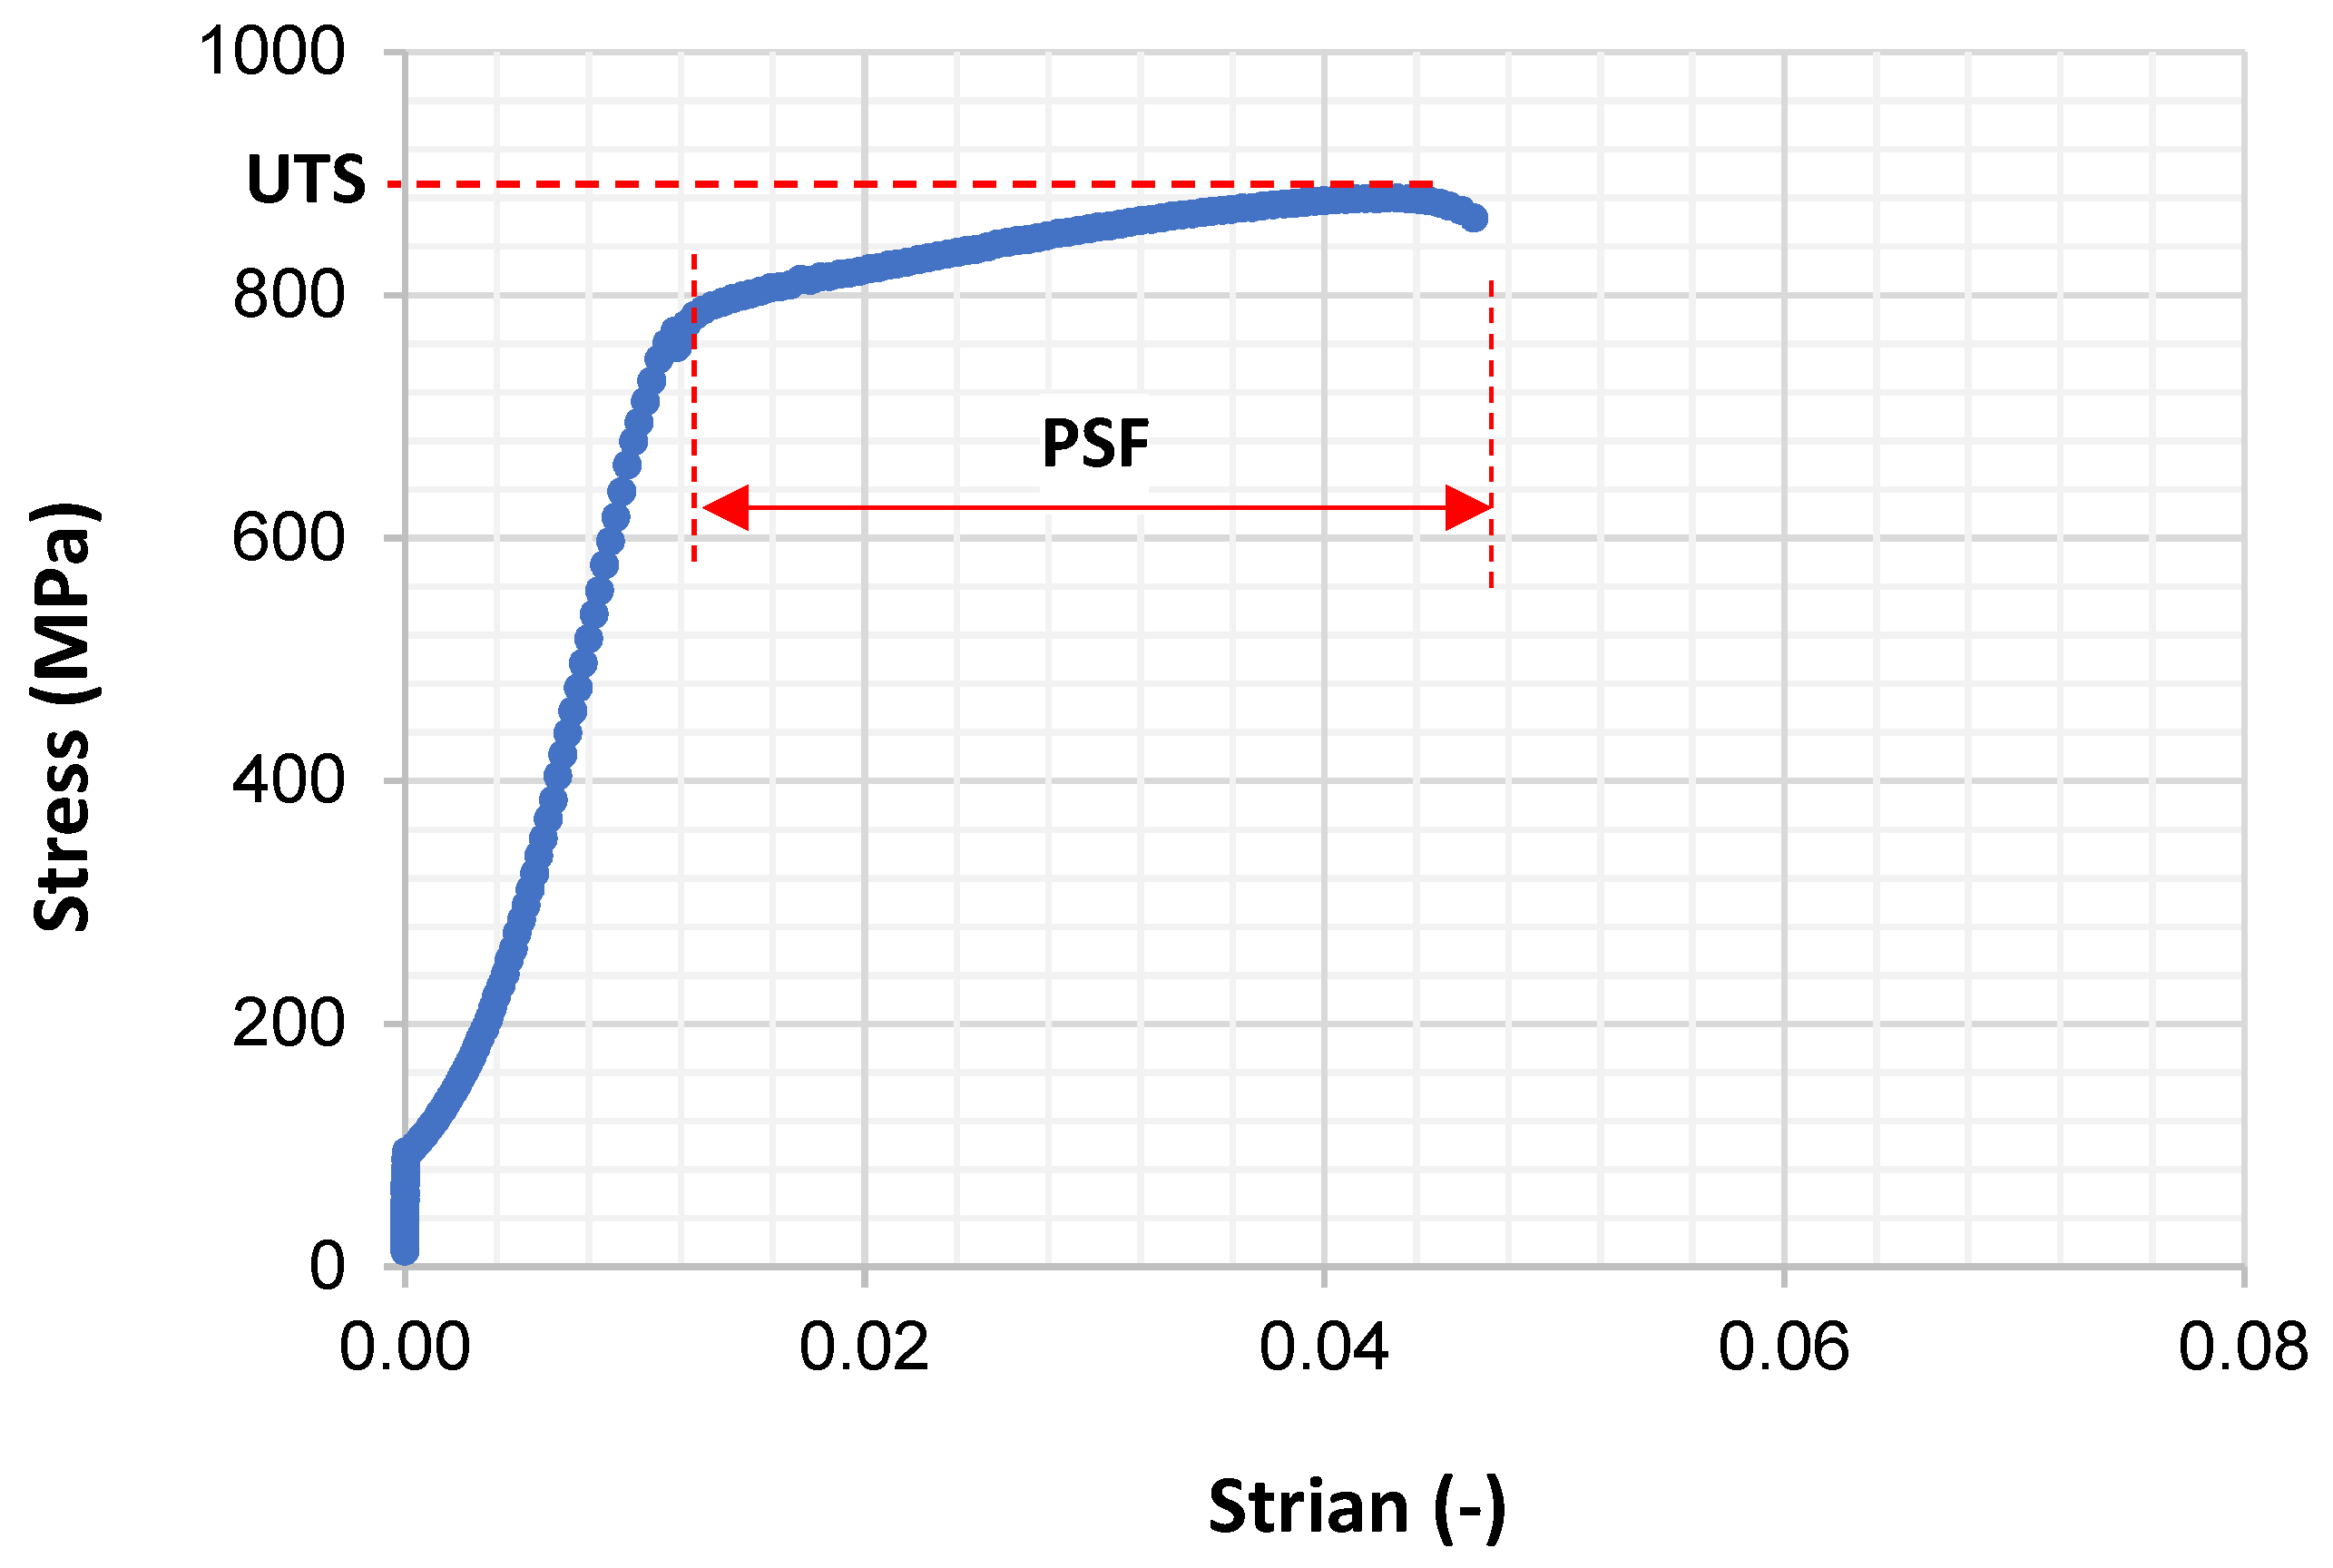
Specimens that did not fail during SSC corrosion experiments were stretched to failure using the TST apparatus. For this test, a specimen was mounted on the TST apparatus and stressed gradually at a controlled stress rate until failure. The ultimate tensile strength (UTS) and plastic strain to failure (PSF) were measured (Figure 9). PSF represents the non-elastic part of the total strain before failure [40]. The broken specimen was placed under an optical microscope for examination of the protective layer and the type of failure.
4. Experimental Results and Discussions
4.1. Mechanical Properties
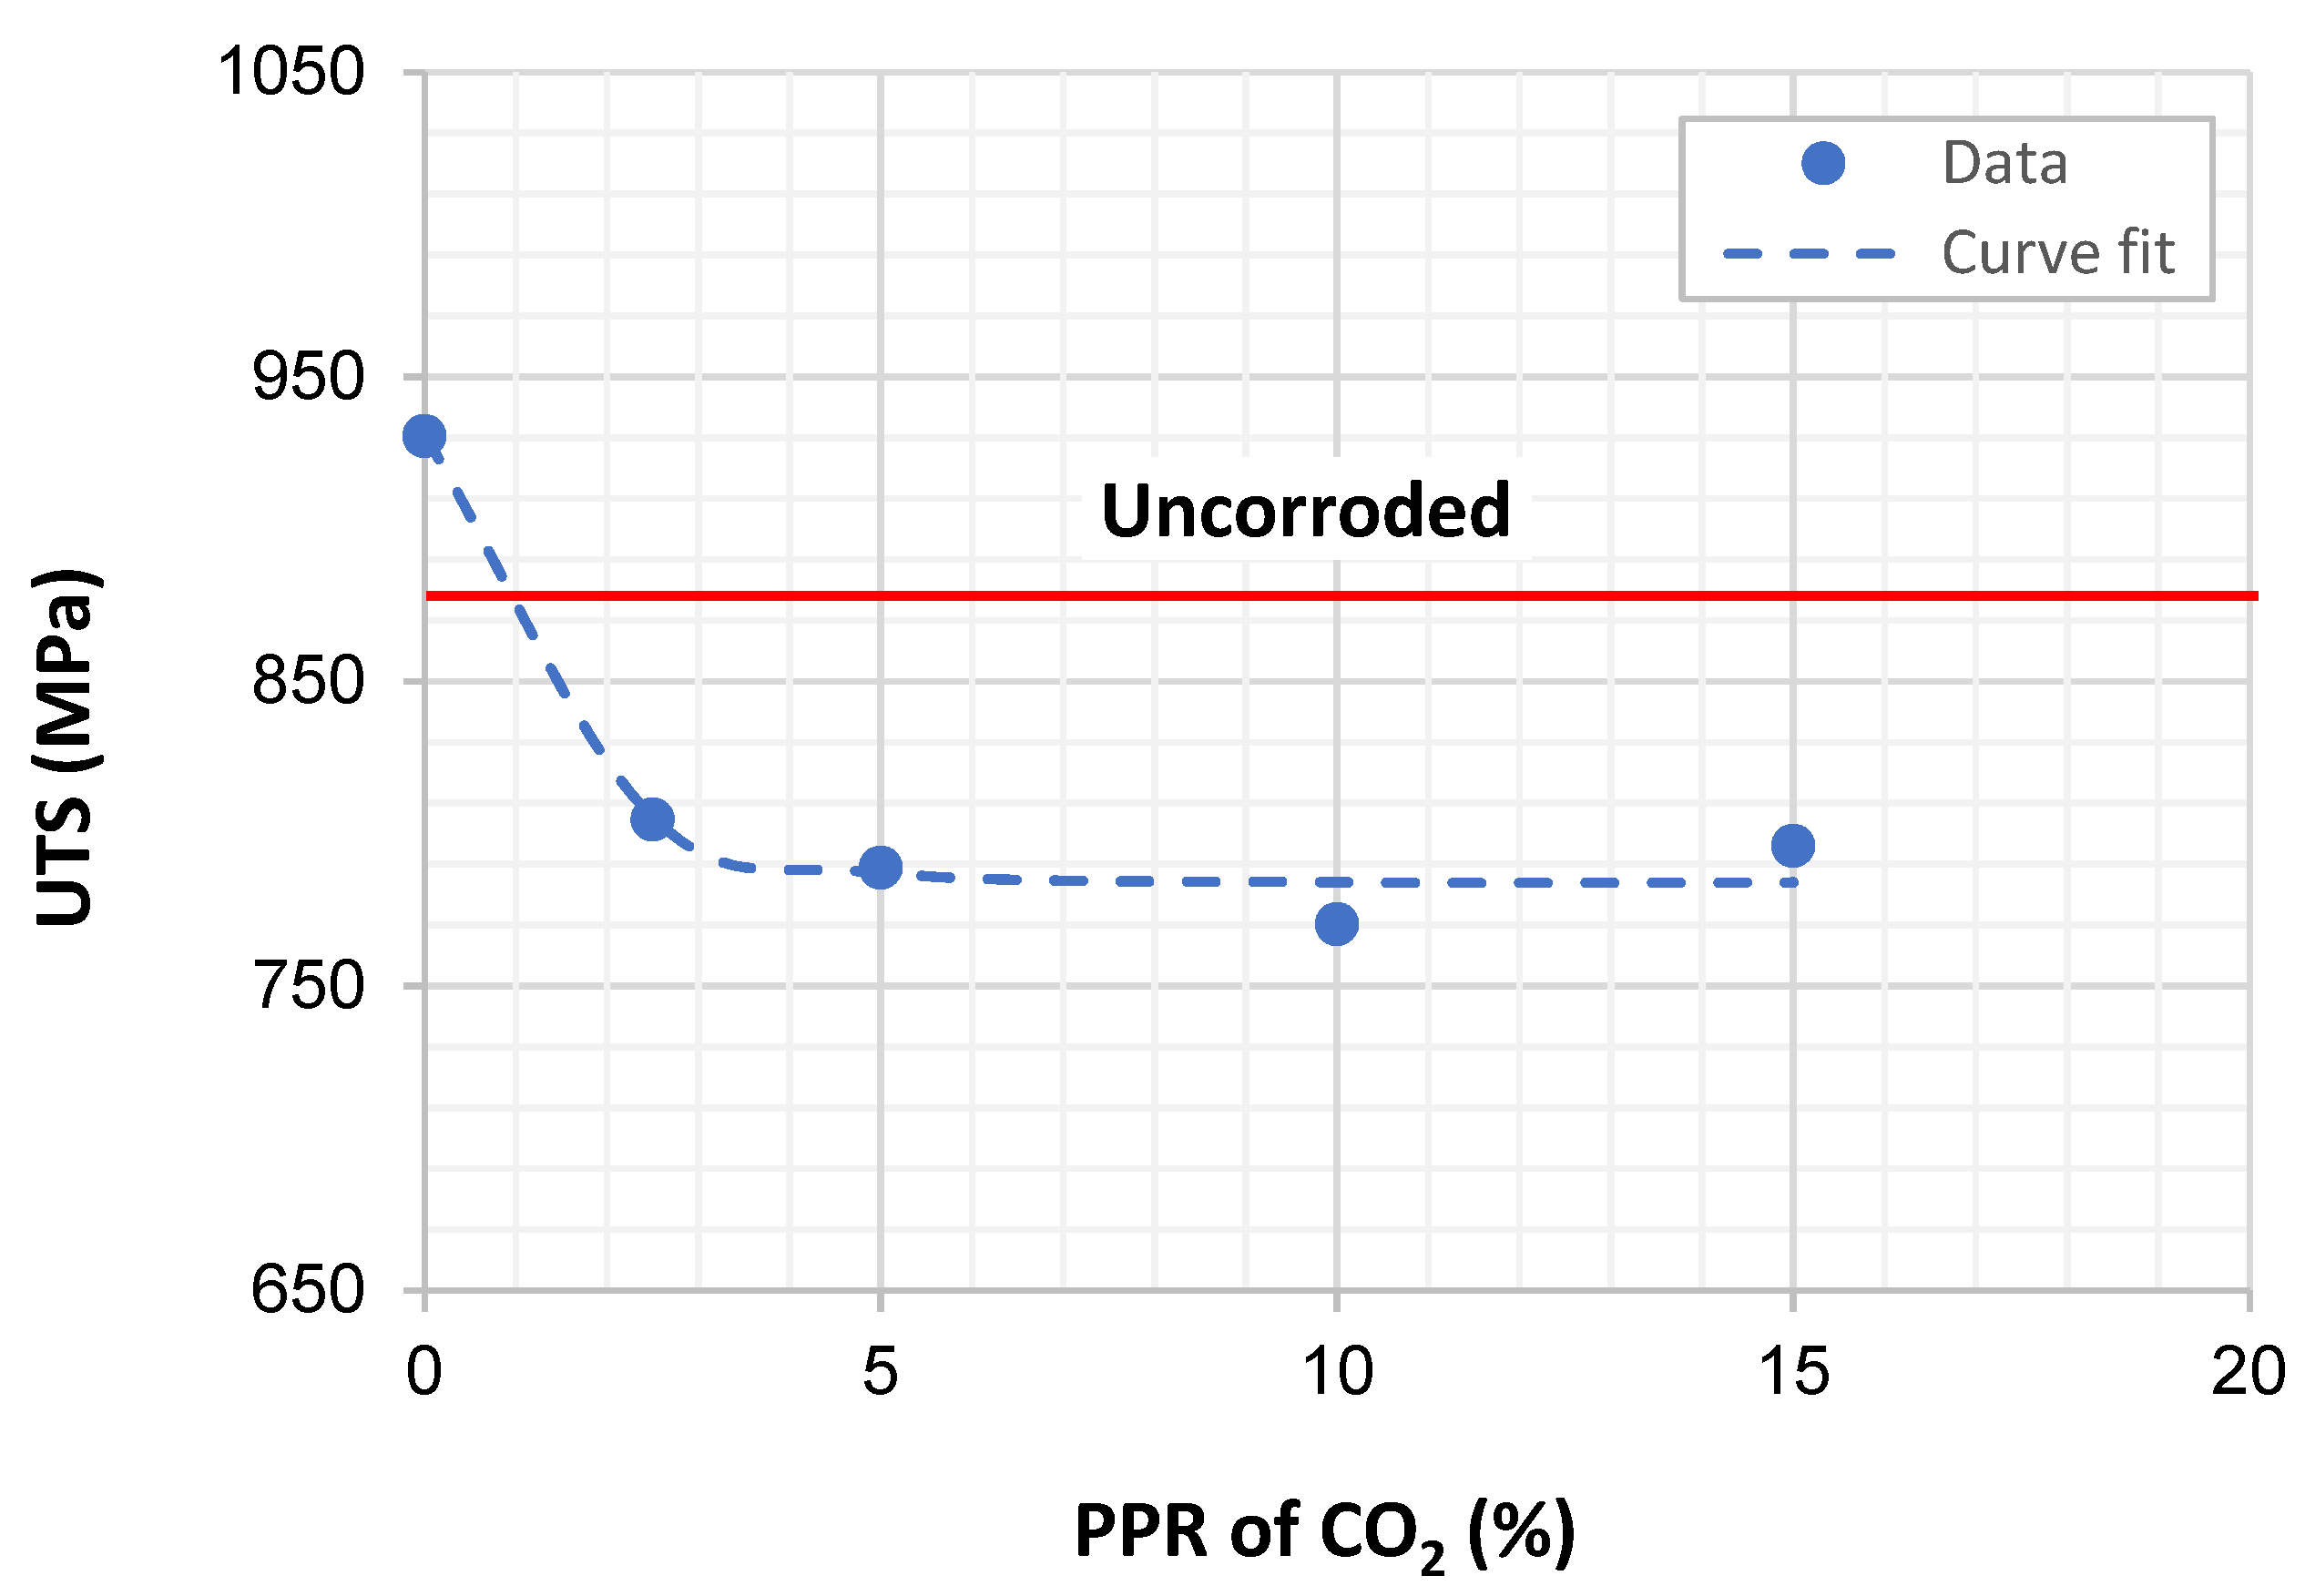
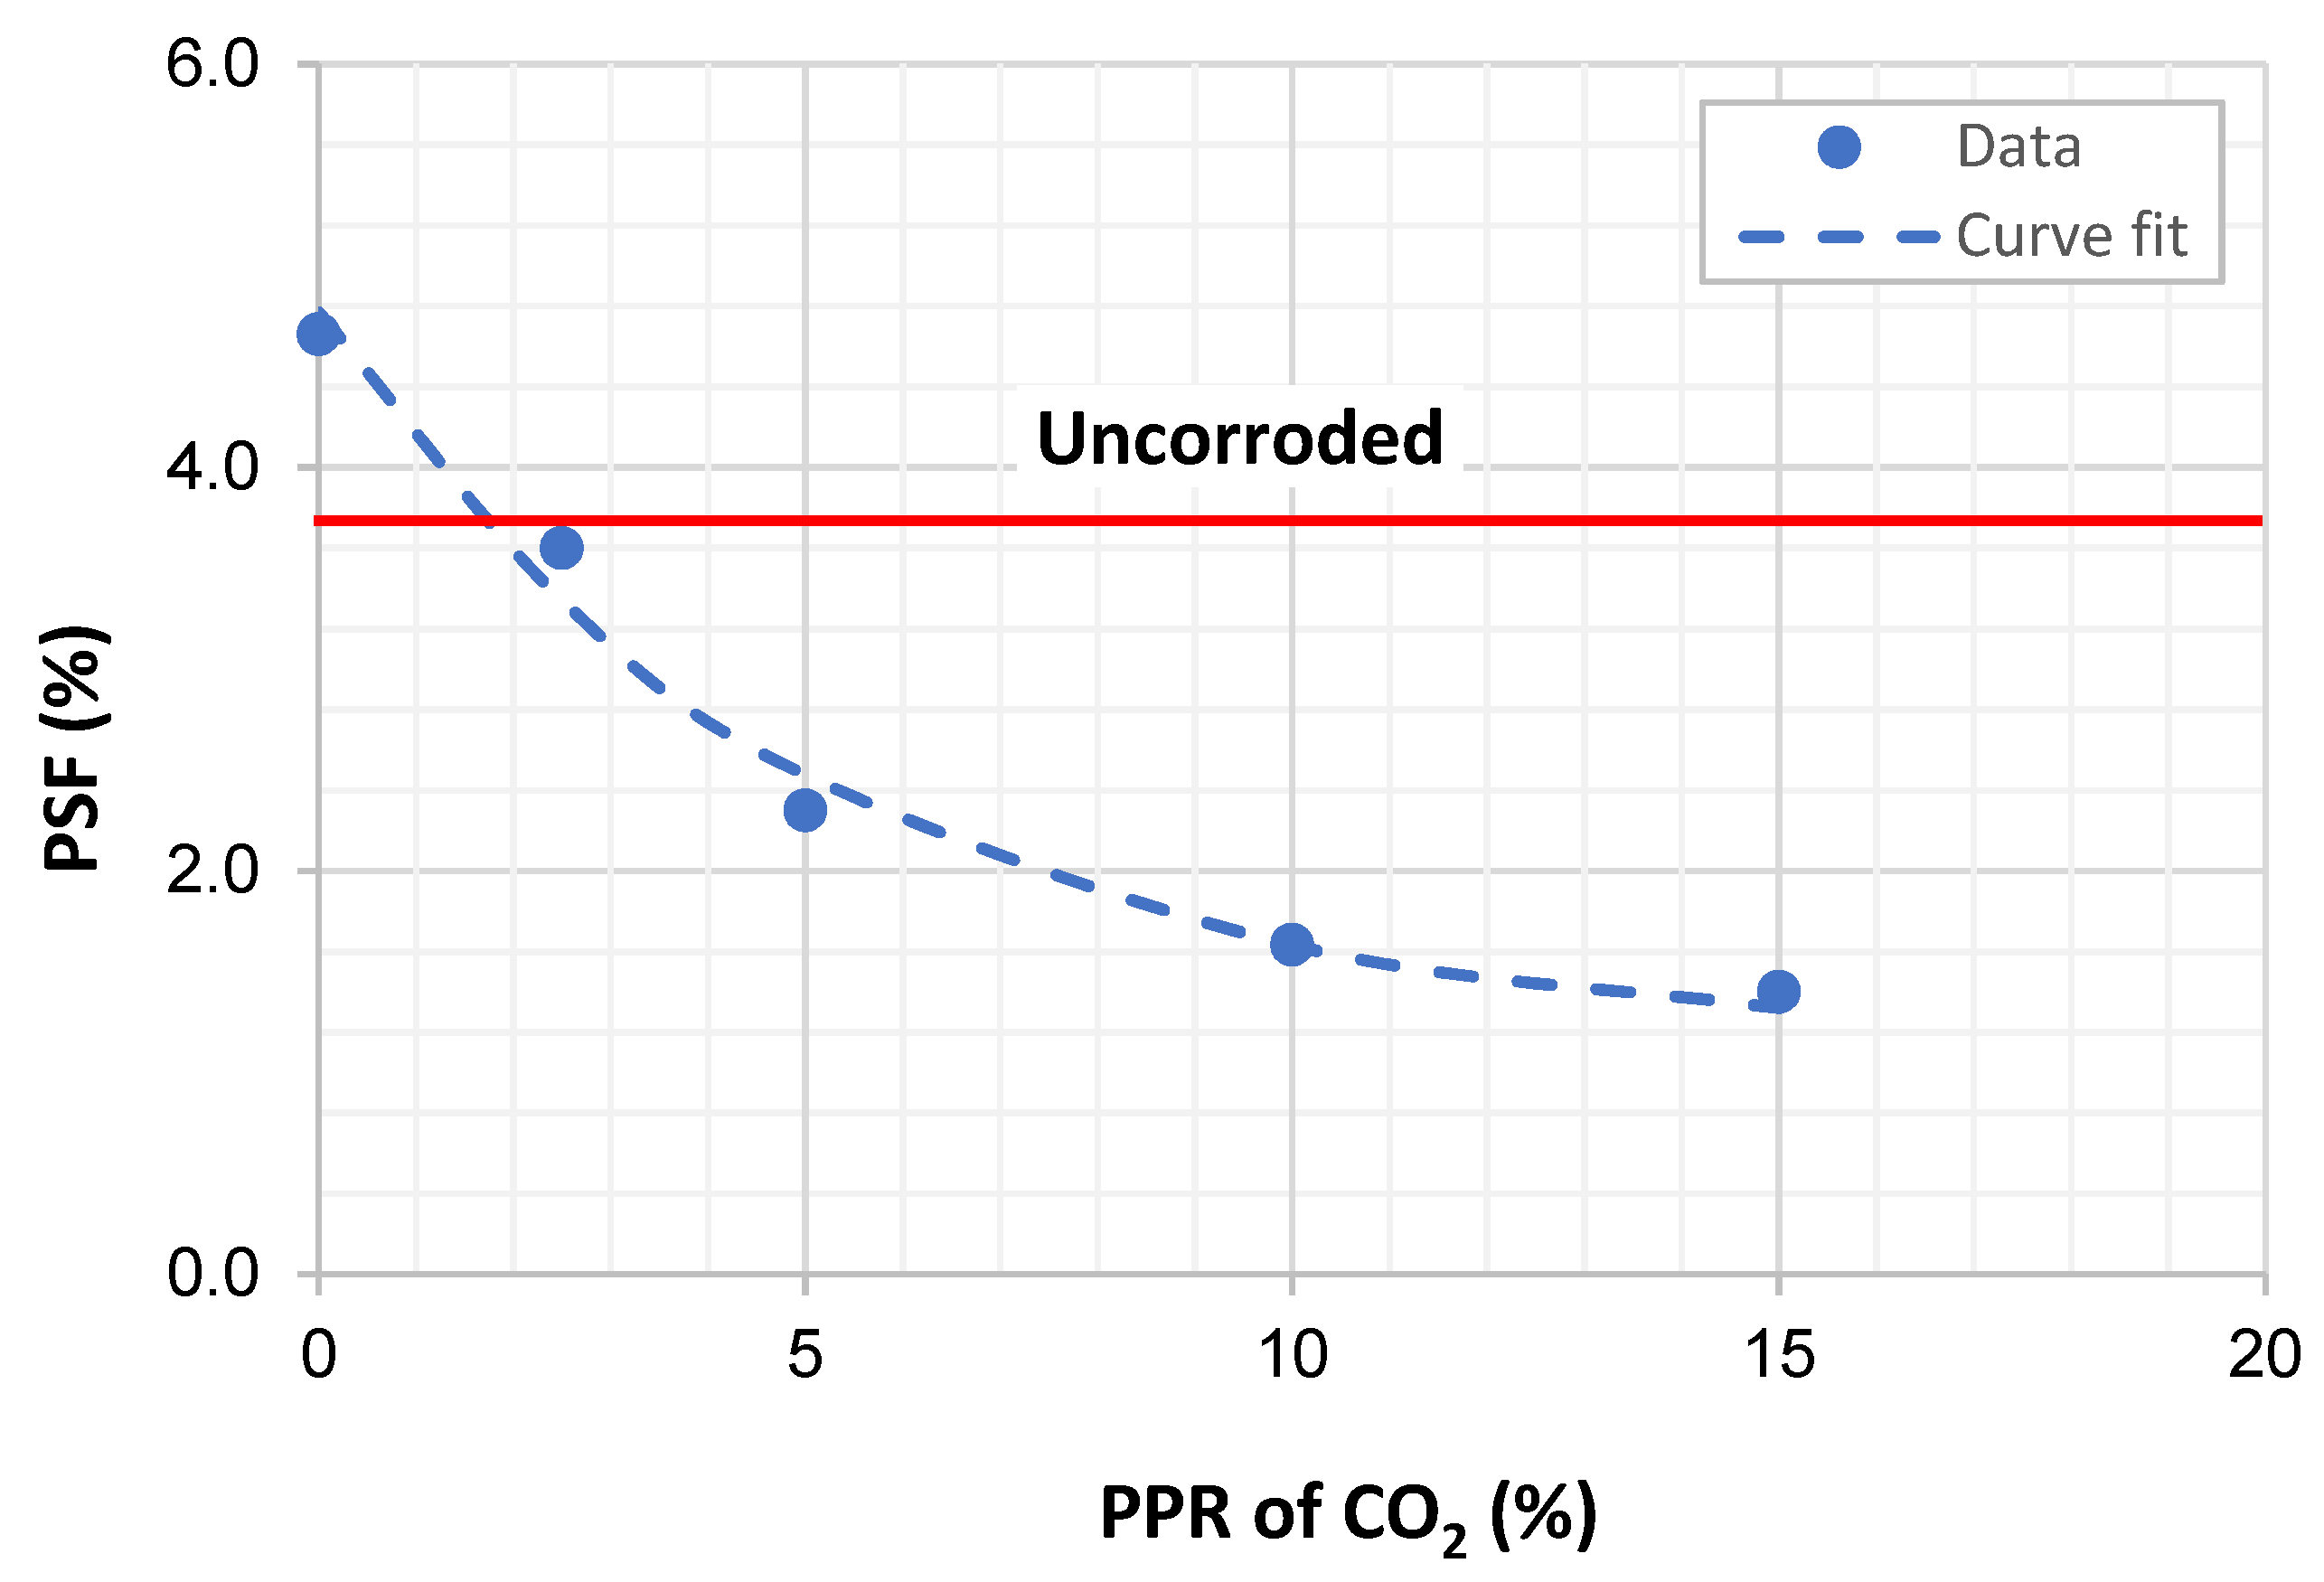
During the investigation, the PPR of CO2 was varied to examine its effect on SSC susceptibility. UTS and PSF are used to assess the susceptibility of material towards SSC in sour conditions. A number of studies [41,42,43,44,45] demonstrated the use of PSF for the assessment of SSC. Figure 10 and Figure 11 present the UTS and PSF of the specimens as a function of the PPR of CO2. The UTS and PSF of the specimens showed an exponential reduction with the PPR of CO2. The relationships are expressed as:
where xc represents the PPR of CO2 in percentage. The correlations are valid for the PPR of CO2 ranging from 0 to 15%. Test 3 was conducted four times because two of the specimens (Specimens 3 and 10) were broke inside the SSC cell. The UTS and PSF reduced rapidly (exponentially) as the PPR of CO2 was increased from 0 to 5%. As the PPR of CO2 was continued to increase above 5%, UTS measurements were stabilized while the PSF data exhibited a gradual reduction. All specimens exposed to the corrosive environment showed a reduction in UTS loss of mechanical strength. This could be explained by considering the effects of hydrogen embrittlement and on the change in mechanical properties (ductility and ultimate tensile strength) of the material. Hydrogen embrittlement is expected to reduce both UTS and PSF [46,47]. These reductions could be because of hydrogen permeation and the associated microstructural changes.
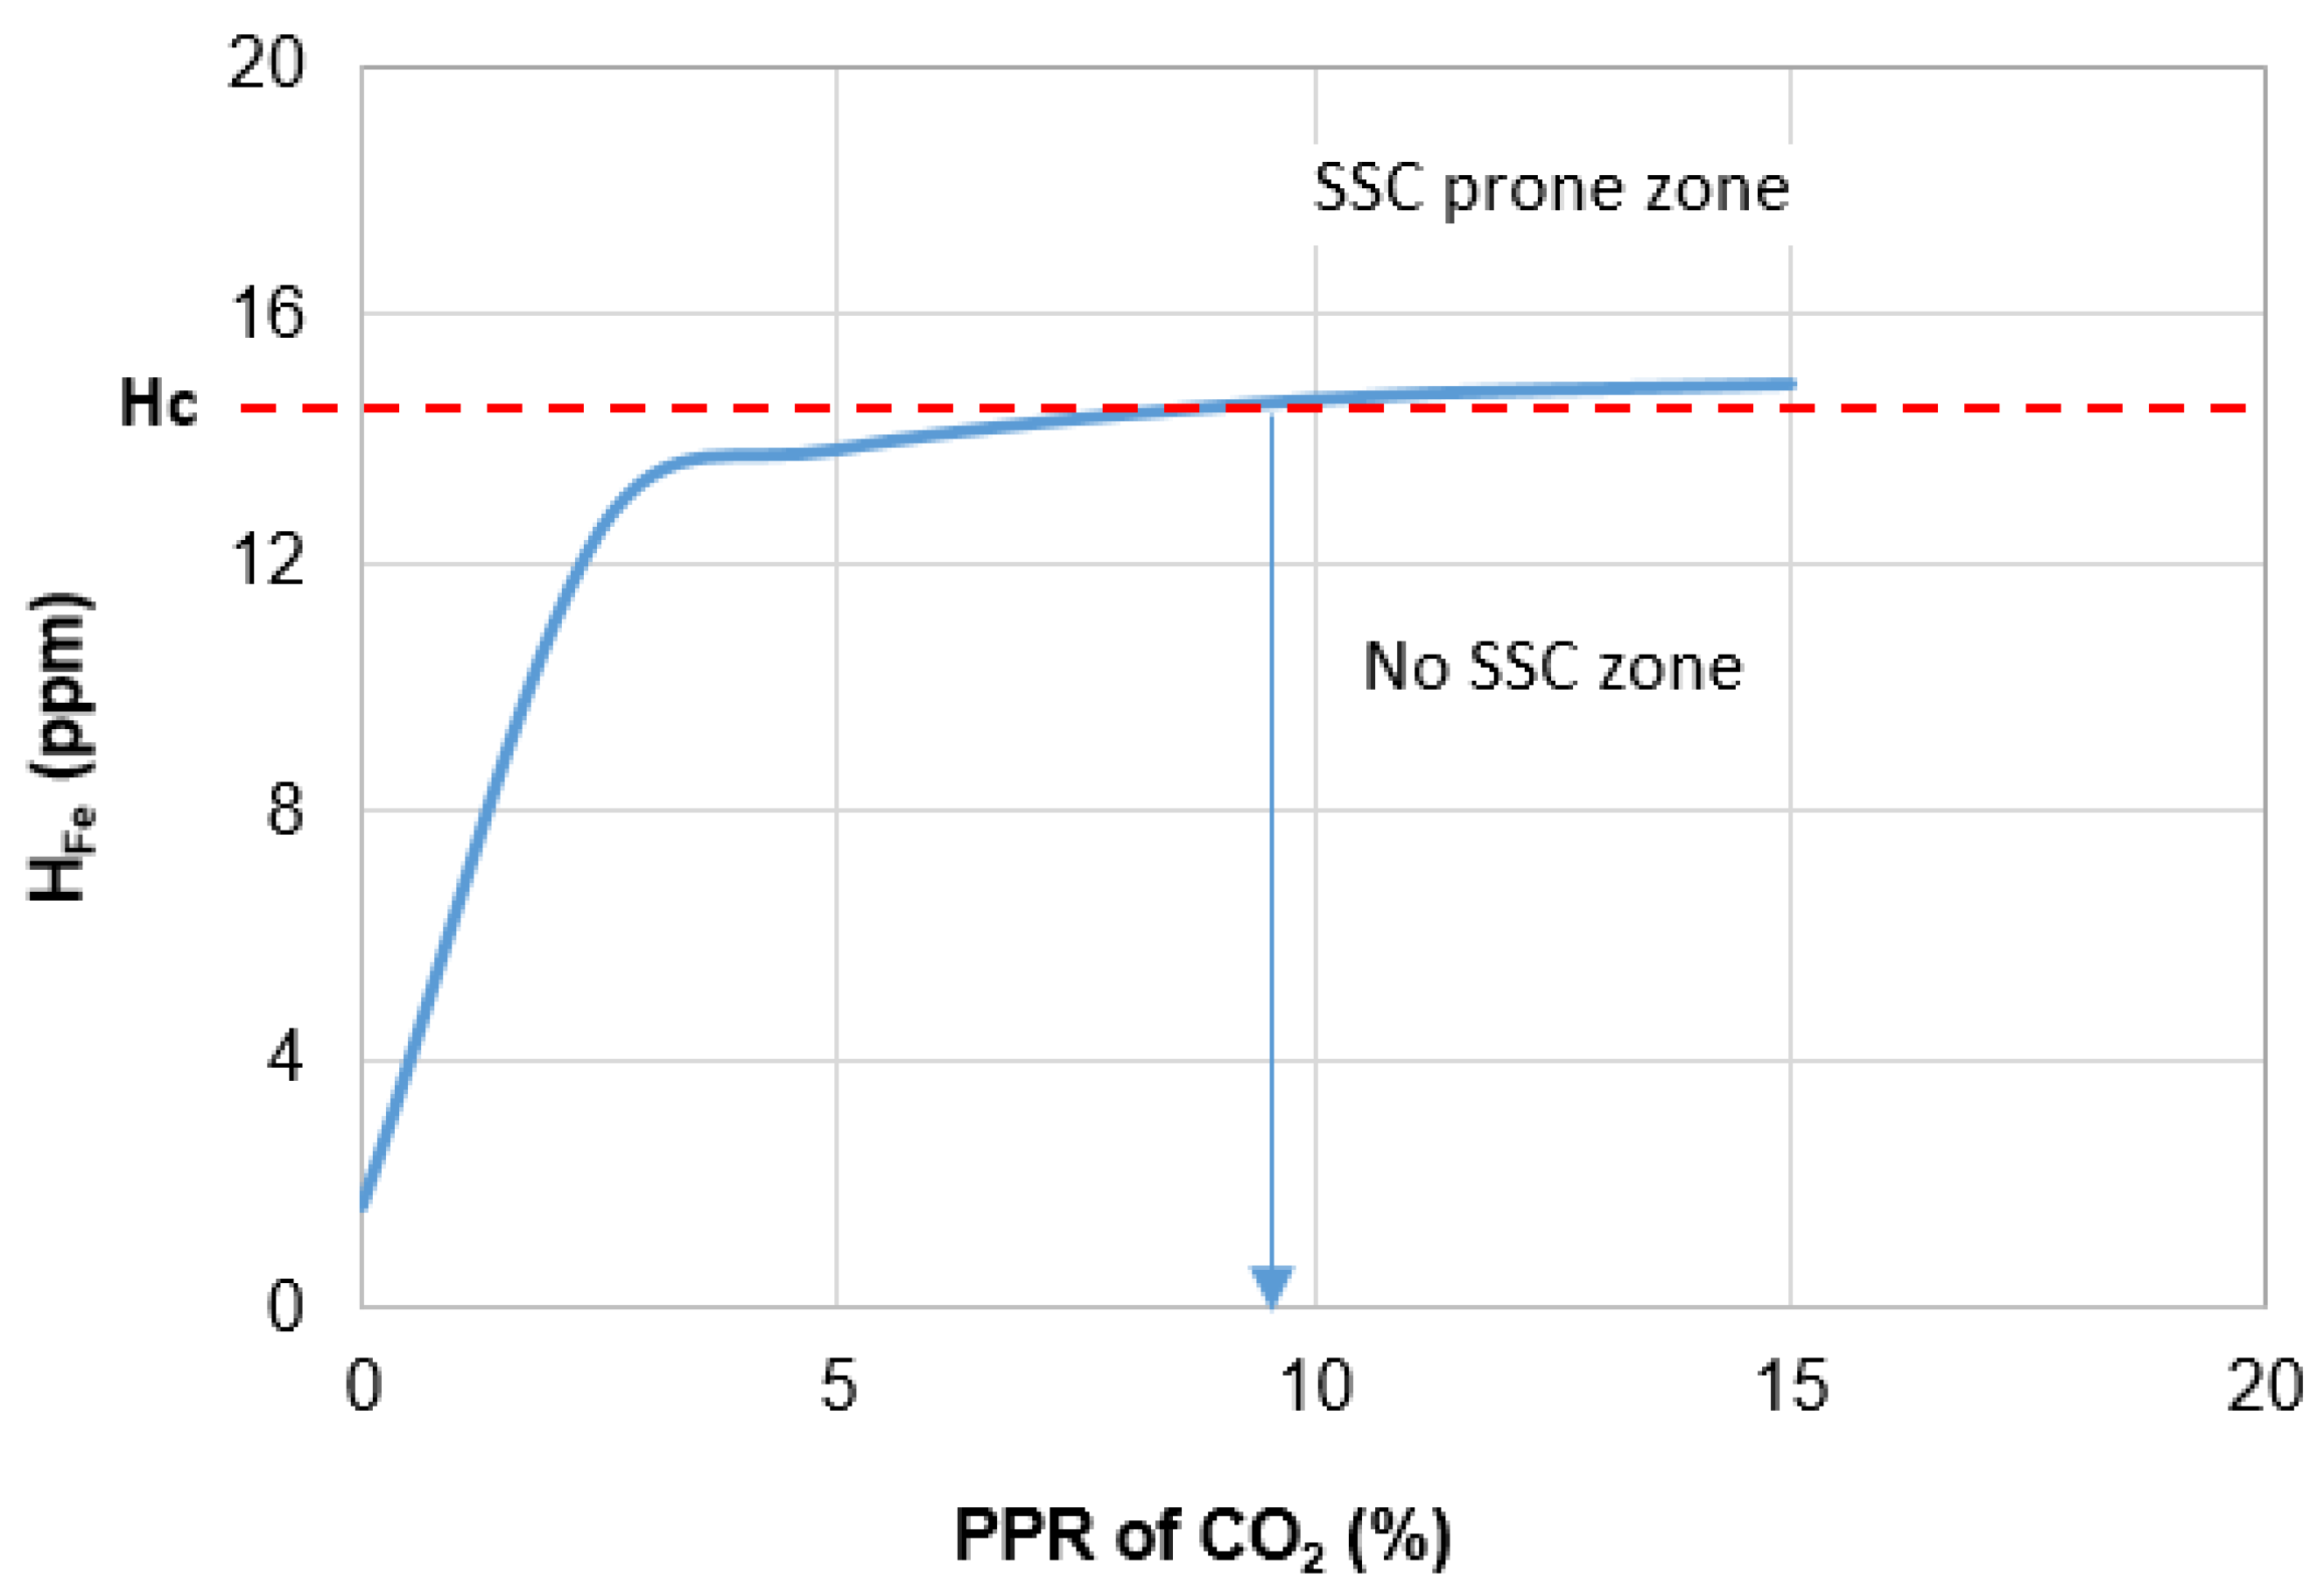
In addition to H2S, the presence of CO2 induces embrittlement in high-strength steels [48]. Hence, the presence of these two gases synergized the embrittlement process leading to significant reductions in UTS and PSF when small quantities of these gases (280 ppm of H2S and 0 to 5% of CO2) were introduced into the corrosive environment. However, when the PPR of CO2 was increased above 5%, the reduction in UTS with PPR vanished. The reduction of PSF with the PPR of CO2 also diminished gradually. These observations can be explained using the hydrogen permeation model. Figure 12 shows the model predicted atomic hydrogen concentration inside the material as a function of the PPR of CO2. Experimental data and model show a consistent trend for SSC susceptibility. At high PPRs of CO2 (greater than 3%), the pH of the corrosive environment is expected to reduce significantly, facilitating the hydrogen permeation process and leading to a high concentration of atomic hydrogen in the metal. As a result, the UTS and PSF of the material reduced sharply with the PPR of CO2 at low PPRs (between 0 and 5%) and exhibited minor variation at high PPRs (greater than 10%).
Using the model, the critical hydrogen atom concentration (Hc) for C-110 at 38 °C is 14.7 ppm. It indicates the critical PPR of CO2 above which the material is expected to fail due to SSC corrosion. Hence, an SSC failure is anticipated when the PPR of the corrosion environment is greater than 9.7%. Five specimens (Specimens 3, 6, 7, 8, and 10) tested above this CO2 PPR value and 40% of them (Specimens 3 and 10) failed due to SSC. This demonstrates that the model is conservative, as indicated earlier. However, no specimen tested below 9.7% PPR of CO2 failed due to SSC.
4.2. Analysis of Crack and Scale Characteristics
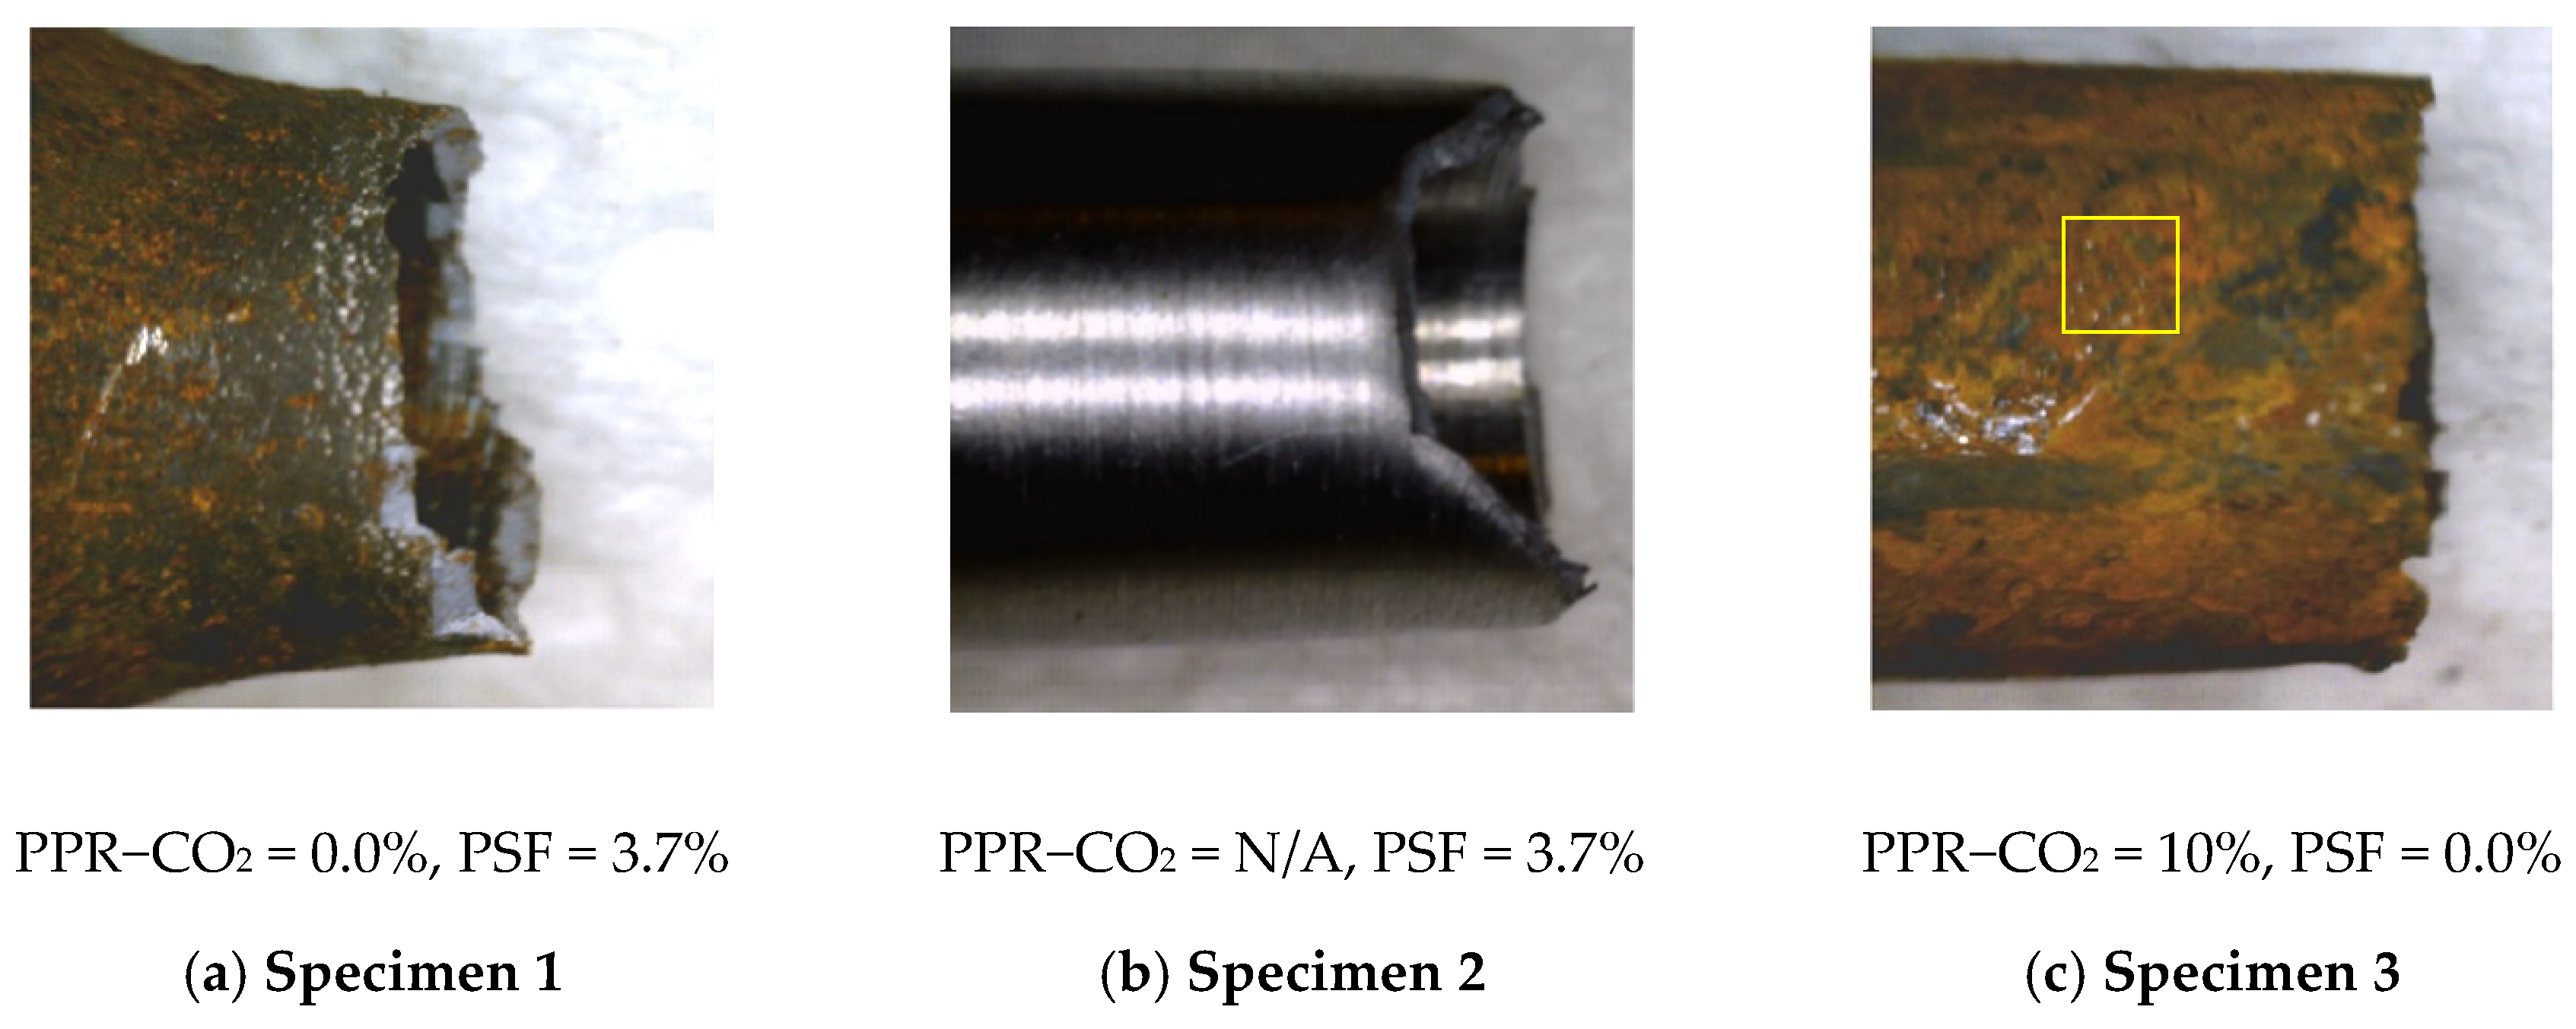
Ductile and brittle failures have different crack characteristics. Near the crack region, ductile failures display shear deformation and appear fibrous while brittle failures do not exhibit these characteristics [49,50]. Thus, examination of crack characteristics could be useful to assess the embrittlement of a specimen. The micrographs of the specimens (Figure 13 and Figure 14) were taken using a digital microscope after they were strained to failure during tensile strength test or broken in the SSC cell when they were exposed to a corrosive environment while strained to 85% of their yield stress. The crack tips of a specimen (Figure 13a) tested for 15 days without the presence of CO2 and H2S showed noticeable necking and fibrous regions. Besides this, the cracks propagated with shear deformation that characterizes ductile failure. The crack tips of the uncorroded specimen (Figure 13b) exhibited similar ductile characteristics. On the other hand, a specimen tested at 10% PPR of CO2 (Figure 13c) did not exhibit necking or shear deformation around the crack region, indicating the absence of ductile failure. The crack displayed almost no plastic deformation of the material at the crack tip confirming the presence of brittle failure.
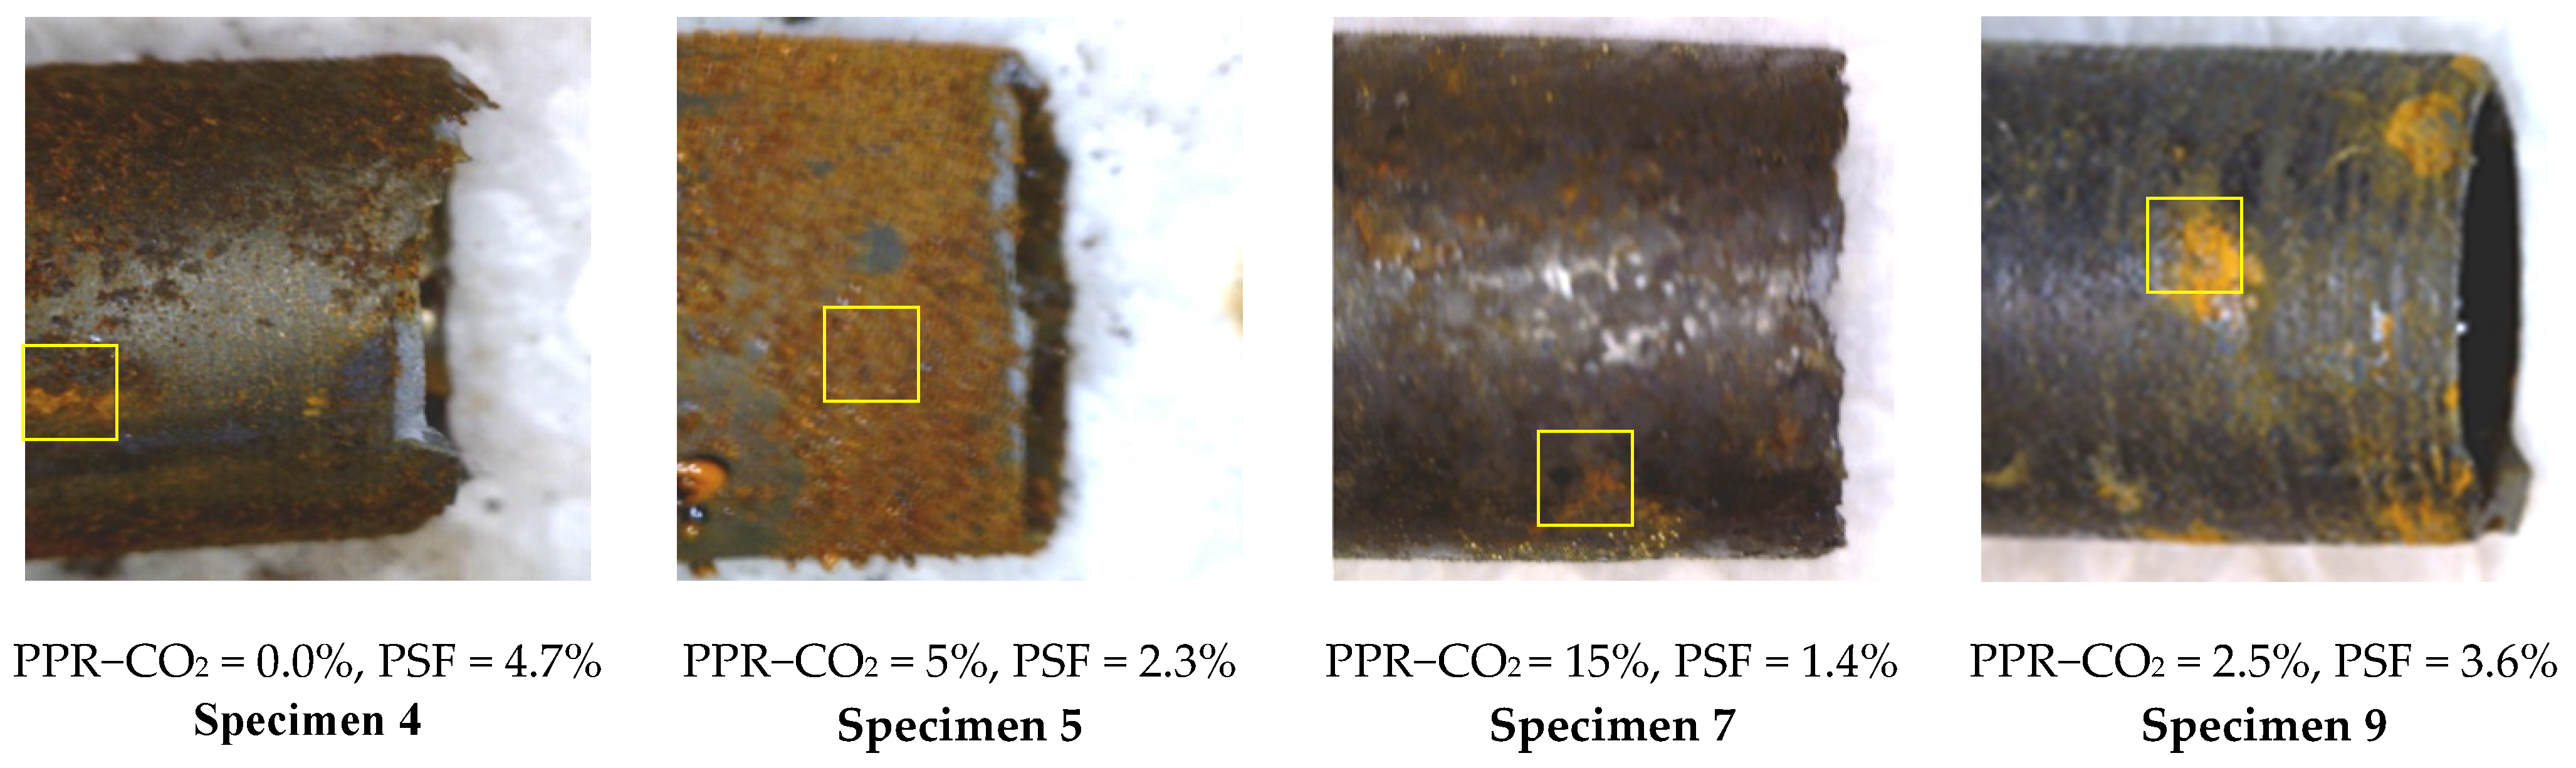
The micrographs of Specimens 4, 5, 7, and 9 that were taken after exposure or straining to failure are presented in Figure 14. Specimens 4, 5, and 9, which were tested at low PPRs of CO2 (≤5%), exhibited shear deformation and fibrous regions near the crack tips. Specimen 4, which was tested at 0 PPR of CO2 displayed the highest plastic deformation before failure. However, Specimen 7, which was corroded at 15% PPR of CO2, demonstrated strong brittle behavior with a low PSF value and lack of shear deformation and fibrous regions near the crack tip.
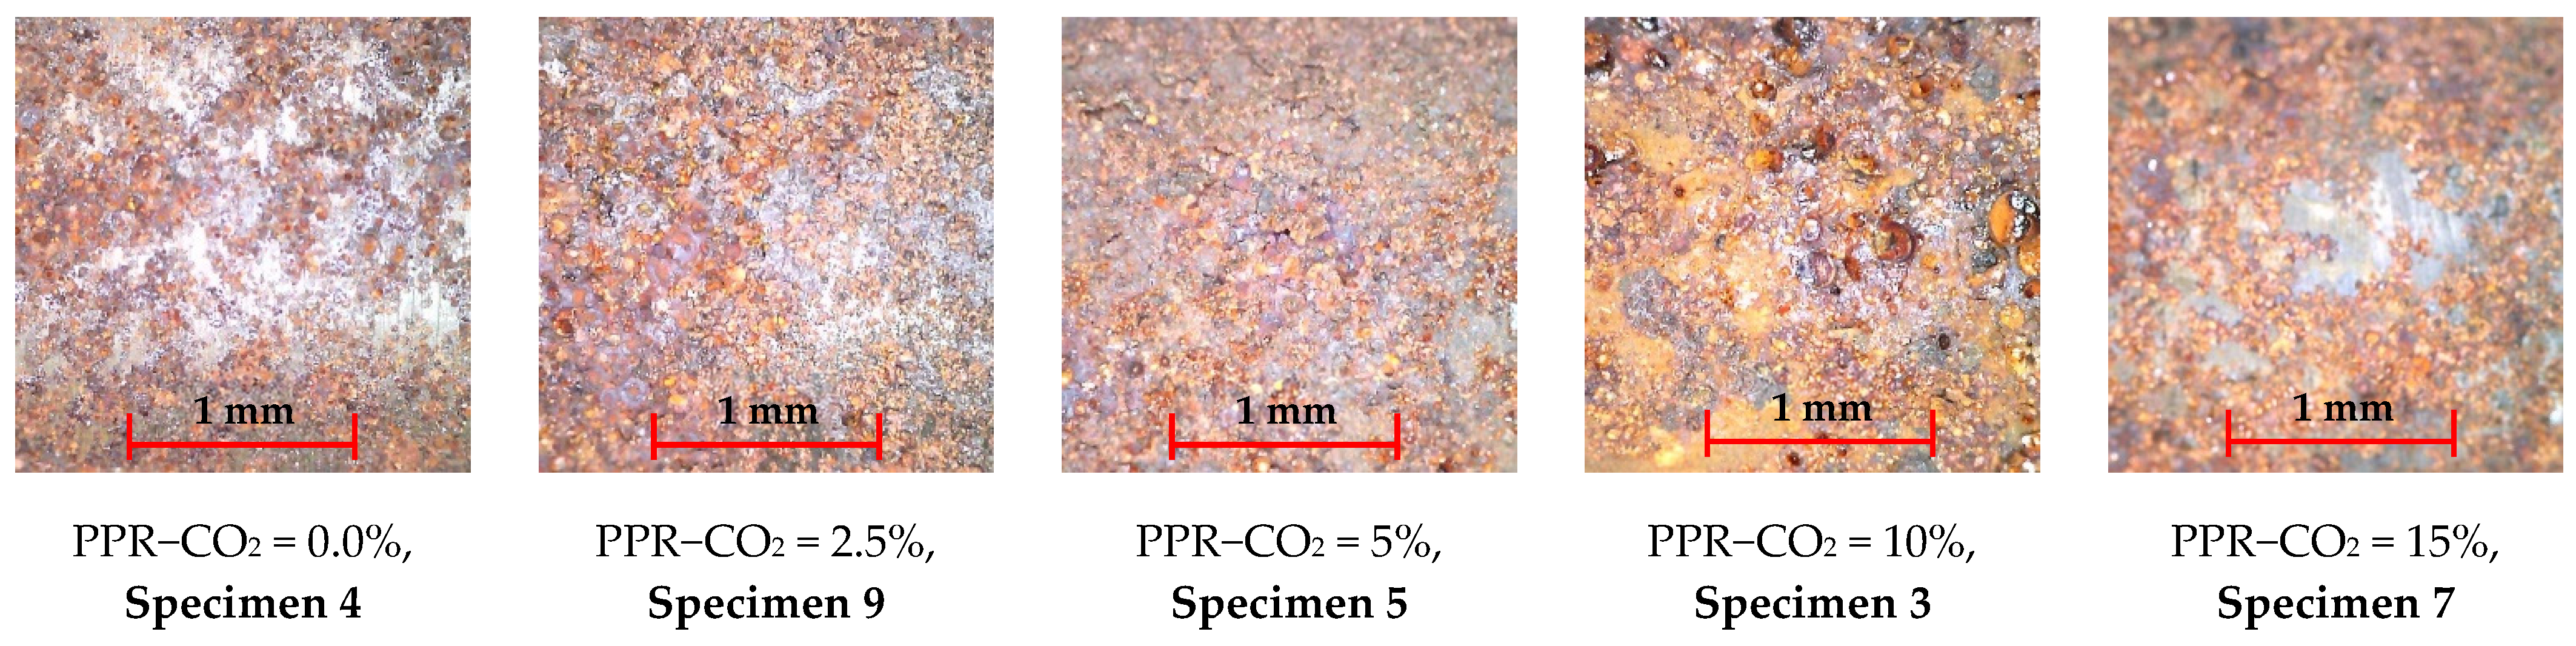
The micrographs of the corrosion scales of Specimens 3, 4, 5, 7, and 9 are presented in Figure 15. The images were obtained considering a square area (2 mm × 2 mm) on the surface of the specimens as shown in Figure 13 and Figure 14. Specimen 3 and 5 were mostly covered with thick flake-like and fragile corrosion scales. Scattered structures that look like fish-eyes were observed on the surface of Specimen 3. Corrosion scales formed on the surface of Specimens 4, 7, and 9 were thin and scattered.
5. Conclusions
The following conclusions can be drawn based on experimental and modeling investigations performed in this study:
- Variation in the PPR of CO2 affected the embrittlement of steel considerably when the PPR was between 1%–5% at H2S concentration of 280 ppm. When the PPR of CO2 was between 10 and 15 percent, the deterioration of mechanical properties by the CO2 content became saturated.
- The trend of hydrogen atom concentration with the PPR of CO2 predicted by the SSC model is consistent with those of measured UTS and PSF. The existence of CO2 decreases the pH of the surrounding solution and expedites the SSC process.
- In the absence of CO2, the pH of the corrosion environment is expected to be close to neutral, and only limited hydrogen ions present in the solution. As a result, experiments did not show noticeable embrittlement of specimens tested at low PPRs of CO2 in seven days of exposure.
- The SSC model predictions are mostly in agreement with existing and new measurements even though it provides a conservative forecast of failure.
Author Contributions
S.T. performed experiments, conducted data analysis, and prepared the original draft of the article. R.A. developed the research methodology, designed the test setup, developed the test procedure, and reviewed and edited the article. R.E. performed experiments and conducted data analysis. C.T. participated in material characterization and testing. All authors have read and agreed to the published version of the manuscript.
Funding
The research was funded by The Bureau of Safety and Environmental Enforcement (BSEE) under the award contract number [E12PC00035].
Institutional Review Board Statement
Not applicable.
Informed Consent Statement
Not applicable.
Data Availability Statement
Not applicable.
Acknowledgments
The authors would like to thank the Bureau of Safety and Environmental Enforcement (BSEE) for sponsoring this project (E12PC00035) and the University of Oklahoma for providing the necessary support. The technical contribution of the industry advisory board members is also highly appreciated.
Conflicts of Interest
The authors declare no conflict of interest.
Nomenclature
| a | Activity |
| The concentration of carbonic acid, mol/lit | |
| CH | Hydrogen concentration, ppm |
| Concentration of H2S (mol/kg) | |
| f | Fugacity |
| Hc | Critical hydrogen concentration (ppm) |
| HFe | Hydrogen concentration in steel (ppm) |
| Ka1 | Dissociation constant for acid, (mol/lit) |
| Ka2 | Dissociation constant for acid, (mol/lit) |
| KISSC | Critical Stress Intensity Factor |
| ksi | Kilo-pounds per square inch |
| Kw | Dissociation constant of water |
| MYS | Minimum yield strength (psi) |
| P | Pressure (bar) |
| Vapor pressure of water (bar) | |
| Pc | Critical Pressure (bar) |
| R | Universal gas constant (m3*bar/K/kgmol) |
| S | Salinity |
| T | Temperature (°K) |
| Tc | Critical temperature (°K) |
| V | Volume |
| x | Mole fraction in liquid phase |
| xc | Partial pressure ratio of CO2 in percent |
| y | Mole fraction ins gas phase |
| Z | Compressibility factor |
| Greek Letters | |
| µ | Chemical potential |
| Parameter for acentric factor | |
| λ | Empirical parameter for calculation of activity coefficient |
| ε | Empirical parameter for calculation of activity coefficient |
| ω | Acentric factor |
| Φ | Fugacity coefficient |
| ϒ | Activity coefficient |
| Subscript | |
| r | Reduced parameter |
| c | Critical |
| Superscript | |
| v | Vapor phase |
| l | Liquid phase |
| Acynoms | |
| API | American Petroleum Institute |
| ASTM | American Society for Testing and Materials |
| BSEE | Bureau of Safety and Environmental Enforcement |
| HRC | Rockwell Hardness |
| GC1 | Gas Chamber 1 |
| GC2 | Gas Chamber 2 |
| MRPPR | Maximum Reduction in Partial Pressure Ratio |
| MRUTS | Maximum Reduction in Ultimate Tensile Strength |
| NACE | National Association of Corrosion Engineers |
| PPR | Partial Pressure Ratio |
| SSC | Sulfide Stress Cracking |
| TST | Tensile Strength Testing |
| UTS | Ultimate Tensile Strength |
| YS | Yield Stress |
Appendix A. Solubility Model
The concentration of H2S is one of the most vital parameters for predicting SSC corrosion resistance of metals. It provides the equilibrium concentration of H2S in the liquid phase, which is in the vicinity of the metal. For the surrounding fluid system to be in equilibrium, the following conditions should be satisfied [51]: (i) uniform temperature and pressure in the system, (ii) chemical potential of each component should be the same in both phases present in the system, and (iii) the system is at its minimum Gibbs free energy level. The first condition denotes the thermal and chemical equilibrium criteria. The second condition can be described using fugacity of non-ideal gases as: , where f is fugacity and i represents the component “i”. For ideal gas-liquid mixtures, Raoult’s law or Henry’s law could be used to predict the solubility of corrosive gases at low pressures. However, these laws provide unrealistic predictions at high pressures (greater than 30 psi). Modified versions of these laws are utilized to predict gas solubility at high pressures. The modified Raoult’s law [52] is more accurate than modified Henry’s law [53] because it accounts for variation in chemical potential. Under equilibrium conditions, the chemical potential (µ) of each component should be the same in both phases. Thus: The chemical potential of hydrogen sulfide in liquid can be expressed as:
where is the activity of H2S and is the standard chemical potential of H2S in the liquid phase. is the mole fraction of H2S in the liquid phase. The activity of H2S can be expressed as:
where and . are the activity coefficient and activity of H2S, respectively. Combining Equations (A1) and (A2), the chemical potentials of H2S in the liquid and gas phases can be expressed as:
where . and are the standard chemical potentials of H2S in gas and liquid phases. is the fugacity of H2S, which is defined as:
where is the fugacity coefficient of H2S.
Combining Equations (A4) and (A5), the following expression for the chemical potential of H2S in the gas phase can be determined as:
The following formula for determining the solubility of H2S () in brine can be obtained by equating the liquid and gas phase chemical potentials of H2S and using the Equations from (A1) to (A6).
Applying a similar procedure, an equation for determining the solubility of CO2 () in brine can be established:
Equations (A7) and (A8) can be used to predict the solubility of H2S or CO2 at specific pressure and temperature, if the chemical potentials, fugacity coefficient, and activity coefficient are determined using appropriate models presented in Tale [54].
Appendix B. pH Model
In an aqueous solution saturated with mixed gas containing H2S and CO2, pH reduction is dominated more by CO2 than H2S (15). Hence, the carbon dioxide solubility model can be applied to predict the pH of aqueous solutions saturated with mixed gas containing H2S and CO2. The equation describing the dissolution of carbon dioxide in water is presented as:
Then, the dissolved gas reacts with water to form carbonic acid.
The first carbonic acid dissociation occurs forming bicarbonate and hydrogen ions.
The second dissociation produces carbonate and additional hydrogen ions.
The primary and secondary dissociation constants for carbonic acid in Equations (A11) and (A12) are expressed as:
Applying the carbonate balance, the initial concentration of carbonic acid in the solution can be expressed as:
Combining Equations (A13)–(A15), the initial concentration of carbonic acid is expressed as a function of dissociation constants, carbonate, and hydrogen ion concentrations.
Equation (A16) can be rearranged to express the concentration of carbonate ion:
Similarly, the concentration of bicarbonate ion can be given by:
Applying the concept of electroneutrality (charge balance), the concentrations of hydrogen ions can be determined as:
The following equation for hydrogen ion can be obtained after combining Equations from (A17) to (A19) and rearranging:
The dissociation constant of water is expressed as: . Inserting this relation into Equation (A20) yields:
Since the second dissociation constant of carbonic acid is considerably lower than the first dissociation constant, can be inserted on the numerator and denominator side in Equation (A21).
The following expression for hydrogen concentration can be obtained after rearranging Equation (A22):
Hydrogen concentration is considerably higher than the first dissociation constant at low solution pH and low temperatures (pH less than 4 and less than 150 °F). Hence Equation (A23) can be simplified as:
The first and the second dissociation constants of saline water are determined using the following equations [55]:
where S is the salinity of water in %, T is temperature. After determining the concentration of hydrogen ions, solution pH is computed as:
Appendix C. Hydrogen Permeation Model
The hydrogen permeation model predicts the concentration of hydrogen atoms in the steel matrix for a specific environmental condition with known solution pH and H2S concentration. Besides, it compares the hydrogen atom concentration in the steel matrix with a predetermined critical/threshold hydrogen atom concentration value to determine the susceptibility of the metal to SSC corrosion in a specific environment. The following empirical equation, developed by Asahi et al. [35], is used to determine hydrogen atom concentration () in the steel matrix.
where and are the concentrations of hydrogen ions and H2S in the solution. The empirical coefficient (13) in Equation (A28) depends on the steel type. The effect of temperature on the predictions of Equation (A28) is minimal.
The critical hydrogen atom concentration (Hc) represents the concentration of hydrogen atoms in the steel matrix below which the metal does not fail due to SSC corrosion at a stress level less than or equal to its yield strength. The following equations are developed to determine the critical hydrogen concentration (ppm) at different temperatures for carbon steels:
where MYS is the maximum yield strength in MPa.
References
- Valdes, A.; Case, R.; Ramirez, M.; Ruiz, A. The Effect of Small Amounts of H2S on CO2 Corrosion of a Carbon Steel. In Proceedings of the CORROSION 98, San Diego, CA, USA, 22–27 March 1998. NACE-98022. [Google Scholar]
- Brown, B.; Lee, K.; Nesic, S. Corrosion in Multiphase Flow Containing Small Amount of H2S. In Proceedings of the NACE International Corrosion Conference, San Diego, CA, USA, 16–20 March 2003; p. 3341. [Google Scholar]
- Lee, K.L.J. A Mechanistic Modeling of CO2 Corrosion of Mild Steel in the Presence of H2S. Ph.D. Thesis, Ohio University, Athens, OH, USA, 2004. [Google Scholar]
- Krishnan, K. Sulfide Stress Cracking (SSC) Resistance of AISI 420 Modified (13Cr) Martensitic Stainless Steel bar Stock. In Proceedings of the CORROSION 2017, New Orleans, LA, USA, 26–30 March 2017. NACE-2017-9645. [Google Scholar]
- Tang, H.; Cayard, M.S. Test Methods for Evaluation of Materials for Wet H2S Service. In Proceedings of the CORROSION 99, San Antonio, TX, USA, 25–30 April 1999. NACE-99421. [Google Scholar]
- Cernocky, E.; Aaron, V.; Paslay, P.; Wink, R. Combined Axial Tension/Compression and Internal Pressure Testing of Mini-Pipe Specimens in H2S Environment to Determine Three Dimensional (Triaxial) Stress States which Produce Crack Initiation Failure: Explanation of the New Test Fixture Mini-Pipe Specimen and Preliminary Test Results. In Proceedings of the SPE High Pressure/High-Temperature Sour Well Design Applied Technology Workshop, Woodlands, TX, USA, 17–19 May 2005. [Google Scholar]
- Kane, R.D.; Greer, J.B. Sulfide Stress Cracking of High-Strength Steels in Laboratory and Oilfield Environments. J. Pet. Technol. 1977, 29, 1483–1488. [Google Scholar] [CrossRef]
- Greer, J.B. Factors Affecting the Sulfide Stress Cracking Performance of High Strength Steels. Technical Report. Materials Performance (MP). Natl. Assoc. Corros. Eng. 1975, 14, 11–22. [Google Scholar]
- Liu, M.; Yang, C.D.; Cao, G.H.; Russell, A.M.; Liu, Y.H.; Dong, X.M.; Zhang, Z.H. Effect of microstructure and crystallography on sulfide stress cracking in API-5CT-C110 casing steel. Mater. Sci. Eng. A 2016, 671, 244–253. [Google Scholar] [CrossRef] [Green Version]
- Zhang, Z.H.; Liu, M.; Liu, Y.H.; Luo, M.; Zhang, C.X.; Wang, C.H.; Cao, G.H. A systematical analysis with respect to multiple hydrogen traps influencing sulfide stress cracking behavior of API-5CT-C110 casing steel. Mater. Sci. Eng. A 2018, 721, 81–88. [Google Scholar] [CrossRef]
- Morana, R.; Nice, P.I. Corrosion Assessment of High Strength Carbon Steel Grades P-110 Q-125 140 And 150 For H2S Containing Producing Well Environments. In Proceedings of the NACE International Corrosion Conference & Expo, Atlanta, GA, USA, 22–26 March 2009; p. 9093. [Google Scholar]
- Vera, J.R.; Case, R. The Relationship Between Hydrogen Permeation and Sulfide Stress Cracking Susceptibility of OCTG Materials at Different Temperatures and pH Values. In Proceedings of the Corrosion, New Orleans, LA, USA, 9–14 March 1997. [Google Scholar]
- Baldy, M.F. Sulfide Stress Cracking of Steels for API Grade N-80 Tubular products. Corrosion 1961, 17, 509–513. [Google Scholar] [CrossRef]
- Snape, E. Sulfide Stress Corrosion of Some Medium and Low Alloy Steels. Corrosion 1967, 23, 154–172. [Google Scholar] [CrossRef]
- Kane, R.D.; Cayard, M.S. Roles of H2S in the Behavior of Engineering Alloys: A Review of Literature and Experience. In Proceedings of the National Association of Corrosion Engineers Annual Conference, San Diego, CA, USA, 22–27 March 1998. NACE-98274. [Google Scholar]
- Kobayashi, K.; Ueda, M.; Nakamura, K.; Omura, T.T. Effect of Testing Temperature on SSC Properties of Low Alloy Steel. In Proceedings of the CORROSION, San Diego, CA, USA, 12–16 March 2006; p. 06127. [Google Scholar]
- Omura, T.; Kobayashi, T.; Ueda, M. SSC Resistance of High Strength Low Alloy Steel OCTG in High Pressure H2S Environments. In Proceedings of the NACE International Corrosion Conference and Expo, Atlanta, GA, USA, 22–26 March 2009. NACE-09102. [Google Scholar]
- Urband, P.; Bruce, E.; Morey, S. High Strength Sour Service C110 Casing. In Proceedings of the SPE/IADC drilling conference, Amsterdam, The Netherlands, 9–11 March 1999. SPE-52843-MS. [Google Scholar]
- Turconi, G.L.; Gluseppe, C.; Anelli, E.; Scoppio, L.; Perez, T.E.; Morales, C.; Echaniz, G. Improvement of Resistance to SSC Initiation and Propagation of High Strength OCTG Through Microstructure and Precipitation Control. In Proceedings of the Corrosion, Houston, TX, USA, 11–16 March 2001. NACE-01077. [Google Scholar]
- Koh, S.; Kim, J.; Yang, B.; Kim, K. Effect of Line Pipe Steel Microstructure on Susceptibility to Sulfide Stress Cracking. Corrosion 2004, 60, 244–253. [Google Scholar] [CrossRef]
- Kim, W.K.; Park, G.; Koh, S.U.; Jung, H.G.; Kim, K.Y. Determination of Critical Factors Affecting Hydrogen Induced Cracking and Type I Sulfide Stress Cracking of High Strength Linepipe Steel. In Proceedings of the Twentieth International Offshore and Polar Engineering Conference, Beijing, China, 20–25 June 2010. [Google Scholar]
- Kimura, M.; Kataoka, Y.; Nakano, Y. Sulfide Stress Corrosion Cracking Resistance of Low Cr Steel. In Proceedings of the Corrosion, Denver, CO, USA, 24–29 March 1996. NACE-96060. [Google Scholar]
- Ikeda, A.; Kaneko, T.; Ando, Y. On The Evaluation Method of Sulfide Stress Cracking Susceptibility of Carbon and Low Alloy Steels. Corros. Sci. 1987, 27, 1099–1115. [Google Scholar] [CrossRef]
- Waid, G.; Stiglitz, R. The Development of High Strength Casing Steels with Improved Hydrogen Sulfide Cracking Resistance for Sour Service. In Proceedings of the Offshore Technology Conference, Houston, TX, USA, 30 May–3 April 1979. OTC-3509-MS. [Google Scholar]
- Craig, B.; Brownlee, J.; Bruno, T. Sulfide Stress Cracking of Nickel Steels. Corrosion 1992, 48, 90–97. [Google Scholar] [CrossRef]
- Hashizume, S.; Inohara, Y. Effects of pH and PH2S on SSC Resistance of Martensitic Stainless Steels. In Proceedings of the Corrosion, Orlando, FL, USA, 26–31 March 2000; p. 0130. [Google Scholar]
- Ciaraldi, S.W. Some Factors that Affect the Sour-Service Performance of Carbon-Steel Oil-Country Tubulars. SPE Drill. Eng. 1986, 1, 233–241. [Google Scholar] [CrossRef]
- Szklarz, K.E. Sulfide Stress Cracking Resistance of Drilling Materials in a Simulated Underbalanced Drilling Environment. In Proceedings of the Corrosion, San Diego, CA, USA, 22–27 March 1998. NACE-98104. [Google Scholar]
- Masouri, D.; Zafari, M. Sulfide Stress Cracking of Stainless Steel 410 In Sour Crude Oil. In Proceedings of the Corrosion, New Orleans, LA, USA, 28 March–1 April 2004. NACE-04121. [Google Scholar]
- Zeng, D.; Chen, R.; Zhang, Z.; Shao, L.; Li, G.; Tian, G.; Shi, T. Research on Stress Corrosion Sensitivity of C-110 Casing in Wellbore Protection Fluid. Energy Procedia 2012, 16, 816–821. [Google Scholar] [CrossRef] [Green Version]
- Dvoracek, L. Sulfide Stress Corrosion Cracking of Steels. Corrosion 1970, 26, 177–188. [Google Scholar] [CrossRef]
- Crowder, B.; Buchanan, J.; Mishael, S.; Shockley, R. Sulfide Stress Cracking Susceptibility of Local Hard Areas in Carbon Steel Weld Heat Affected Zones. In Proceedings of the Corrosion, Houston, TX, USA, 13–17 March 2011. NACE-11105. [Google Scholar]
- Papavinasam, S. Corrosion Control in the Oil and Gas Industry; Elsevier: Amsterdam, The Netherlands, 2013; pp. 287–288, reprint. [Google Scholar]
- Chauveau, E.; Koschel, D.; Bouvier, N.; Mesquita, T.J. Influence of Metallurgy and Chemical Composition on the Sulphide Stress Cracking Resistance of Two Supermartensitics Stainless Steels. In Proceedings of the Corrosion, Salt Lake City, UT, USA, 11–15 March 2012. NACE-1284. [Google Scholar]
- Asahi, H.; Ueno, M.; Yonezawa, T. Prediction of Sulfide Stress Cracking in High-strength tubulars. Corrosion 1994, 50, 537–545. [Google Scholar] [CrossRef]
- Skogsberg, L. Fitness for Purpose Sulfide Stress Corrosion Testing for Alloys in Existing Wells in Deep Water Gulf of Mexico. In Proceedings of the CORROSION 2004, New Orleans, LA, USA, 28 March–1 April 2004. NACE-04148. [Google Scholar]
- Masouri, D.; Zafari, M. Sulfide Stress Cracking of Tubular Product-Case Histories. In Proceedings of the Corrosion, Houston, TX, USA, 3–7 April 2005. NACE-05460. [Google Scholar]
- Skogsberg, L.; Stockman, J.A.; Thompson, M.J. The Effect of Plastic Strain on Sulfide Stress Cracking. In Proceedings of the Corrosion, Houston, TX, USA, 11–16 March 2001. NACE-01073. [Google Scholar]
- Kermani, M.; MacCuish, R. Materials Assessment for Sour Service Applications. In Proceedings of the SPE Annual Technical Conference and Exhibition, New Orleans, LA, USA, 23–26 September 1990. SPE-20457-MS. [Google Scholar]
- Jankowski, A.F.; Chames, J.M.; Gardea, A.; Nishimoto, R.; Brannigan, E.M. The Softening Factor Cb of Commercial Titanium Alloy Wires; Report SAND2019-13934J; Sandia National Laboratory: Livermore, CA, USA, 2012. Available online: https://www.osti.gov/servlets/purl/1575255 (accessed on 6 June 2021).
- Luft, B.; Szklarz, K.E.; Nowinka, J.; Skrzypek, H. Evaluating the Fitness-for-Purpose of Coiled Tubing for Underbalanced Drilling of Sour Wells. In Proceedings of the CORROSION 2002, Denver, CO, USA, 7–11 April 2002. [Google Scholar]
- Contreras, A.; Salazar, M.; Albiter, A.; Galván, R.; Vega, O. Assessment of Stress Corrosion Cracking on Pipeline Steels Weldments Used in the Petroleum Industry by Slow Strain Rate Tests; InTech: London, UK, 2011. [Google Scholar] [CrossRef]
- Mishra, B. Corrosion Characterization of Advanced Steels for Use in the Oil & Gas Industry. Int. J. Metall. Eng. 2013, 2, 221–229. [Google Scholar] [CrossRef]
- Ouhiba, S. Hydrogen Induced Cracking and Sulfide Stress Cracking Evaluation of Low Alloy Casing Pipes. Master’s Thesis, University of Alberta, Edmonton, AB, Canada, 2017. [Google Scholar]
- Quej-Ake, L.M.; Rivera-Olvera, J.; Domínguez-Aguilar, Y.; Avelino-Jiménez, I.A.; Garibay-Febles, V.; Zapata-Peñasco, I. Analysis of the Physicochemical, Mechanical, and Electrochemical Parameters and Their Impact on the Internal and External SCC of Carbon Steel Pipelines. Materials 2020, 13, 5771. [Google Scholar] [CrossRef] [PubMed]
- Rudomilova, D.; Prošek, T.; Luckeneder, G. Techniques for investigation of hydrogen embrittlement of advanced high strength steels. Corros. Rev. 2018, 36, 413–434. [Google Scholar] [CrossRef]
- Bai, P.; Zhou, J.; Luo, B.; Zheng, S.; Wang, P.; Tian, Y. Hydrogen embrittlement of X80 pipeline steel in H2S environment: Effect of hydrogen charging time, hydrogen-trapped state and hydrogen charging–releasing–recharging cycles. Int. J. Miner. Metall. Mater. 2020, 27, 63. [Google Scholar] [CrossRef]
- Elgaddafi, R.; Ahmed, R.; Shah, S. The effect of fluid flow on CO2 corrosion of high-strength API carbon steels. J. Nat. Gas Sci. Eng. 2021, 86, 103739. [Google Scholar] [CrossRef]
- Zheiglei, L. Fracture. In Lecture notes MSE 2090 Introduction to Science and Engineering of Materials; University of Virginia: Charlottesville, VA, USA, 2010; pp. 2–10. [Google Scholar]
- Mouritz, A.P. Introduction to Aerospace Materials; Woodhead Publishing: Sawston, UK, 2012; Chapter 18; pp. 428–453. [Google Scholar] [CrossRef]
- Caroll, J. What is Henry’s Law? Chem. Eng. Prog. 1991, 86, 48–52. [Google Scholar]
- Duan, Z.; Sun, R.; Liu, R.; Zhu, C. Accurate Thermodynamic Model for the Calculation of H2S solubility in pure Water and Brines. Energy Fuels 2007, 21, 2056–2065. [Google Scholar] [CrossRef]
- Zirrahi, M.; Azin, R.; Hassanzadeh, H.; Moshfeghian, M. Mutual Solubility of CH4, CO2 and H2S and their Mixtures in Brine under Subsurface Disposal Conditions. Fluid Phase Equilibria 2012, 324, 80–93. [Google Scholar] [CrossRef]
- Tale, S. Sulfide Stress Cracking Behavior of Grade C-110 Steel Tubulars under High-Pressure Conditions. Master’s Thesis, The University of Oklahoma, Norman, OK, USA, 2014. [Google Scholar]
- Dickson, A.G.; Millero, F.J. A comparison of the equilibrium constants for the dissociation of carbonic acid in seawater media. Deep Sea Res. Part A Oceanogr. Res. Pap. 1987, 34, 1733–1743. [Google Scholar] [CrossRef]
Figure 1.
Operability window of different steels: (a) Q-125, (b) P-110, (c) Garde 140, and (d) Grade 150 (Redrawn from 11).
Figure 1.
Operability window of different steels: (a) Q-125, (b) P-110, (c) Garde 140, and (d) Grade 150 (Redrawn from 11).

Figure 2.
Threshold stress vs. HRC of carbon steel (Redrawn from Ciaraldi [27]).
Figure 2.
Threshold stress vs. HRC of carbon steel (Redrawn from Ciaraldi [27]).

Figure 3.
Numerical procedure for SSC corrosion model.

Figure 4.
Model predictions and measurements for SSC failure for different API grade carbon steels: (a) P-110, and (b) Q-125.
Figure 4.
Model predictions and measurements for SSC failure for different API grade carbon steels: (a) P-110, and (b) Q-125.

Figure 5.
Model predictions and measurements for SSC failure for API L-80 carbon steel.

Figure 6.
Minipipe specimen.

Figure 7.
Schematic of TST apparatus.

Figure 8.
Schematic of SSC corrosion test setup.

Figure 9.
Stress vs. strain curve for Specimen 1.

Figure 10.
Measured UTS versus PPR of CO2.

Figure 11.
Measured PSF versus PPR of CO2.

Figure 12.
Predicted hydrogen permeation concentration versus PPR of CO2.

Figure 13.
Crack characteristics of Specimens 1, 2, and 3.

Figure 14.
Crack characteristics of Specimens 4, 5, 7, and 9.

Figure 15.
Micrographs of the corrosion scales of Specimens 3, 4, 5, 7, and 9.


Table 1.
Test matrix for SSC experiment.
| Test # | Test Duration (Days) | Test Label | Temp. (°C) | Total | Partial Pressure Ratio | ||
|---|---|---|---|---|---|---|---|
| Pressure, MPa | |||||||
| Inside | Outside | CH4 (%) | CO2 (%) | ||||
| Test 1 | 15 | Specimen 1 | 38 | 41.4 | 27.6 | 100 | 0 |
| Test 2 | 0 | Specimen 2 | 0 | 0 | 0 | 0 | 0 |
| Test 3 | 7 | Specimen 3, 6, 8, 10 | 38 | 41.4 | 27.6 | 89.97 | 10 |
| Test 4 | 7 | Specimen 4 | 38 | 41.4 | 27.6 | 99.97 | 0 |
| Test 5 | 7 | Specimen 5 | 38 | 41.4 | 27.6 | 94.97 | 5 |
| Test 6 | 7 | Specimen 7 | 38 | 41.4 | 27.6 | 84.97 | 15 |
| Test 7 | 7 | Specimen 9 | 38 | 41.4 | 27.6 | 97.47 | 2.5 |
Publisher’s Note: MDPI stays neutral with regard to jurisdictional claims in published maps and institutional affiliations. |
© 2021 by the authors. Licensee MDPI, Basel, Switzerland. This article is an open access article distributed under the terms and conditions of the Creative Commons Attribution (CC BY) license (https://creativecommons.org/licenses/by/4.0/).
Share and Cite
MDPI and ACS Style
Tale, S.; Ahmed, R.; Elgaddafi, R.; Teodoriu, C. Sulfide Stress Cracking of C-110 Steel in a Sour Environment. Corros. Mater. Degrad. 2021, 2, 376-396. https://0-doi-org.brum.beds.ac.uk/10.3390/cmd2030020
AMA Style
Tale S, Ahmed R, Elgaddafi R, Teodoriu C. Sulfide Stress Cracking of C-110 Steel in a Sour Environment. Corrosion and Materials Degradation. 2021; 2(3):376-396. https://0-doi-org.brum.beds.ac.uk/10.3390/cmd2030020
Chicago/Turabian StyleTale, Sagar, Ramadan Ahmed, Rida Elgaddafi, and Catalin Teodoriu. 2021. "Sulfide Stress Cracking of C-110 Steel in a Sour Environment" Corrosion and Materials Degradation 2, no. 3: 376-396. https://0-doi-org.brum.beds.ac.uk/10.3390/cmd2030020