Role of Helicobacter pylori in Upper Gastrointestinal Bleeding Among Ischemic Stroke Hospitalizations: A Nationwide Study of Outcomes

 ,
,  ,
,
Abstract
:
1. Introduction
2. Materials and Methods
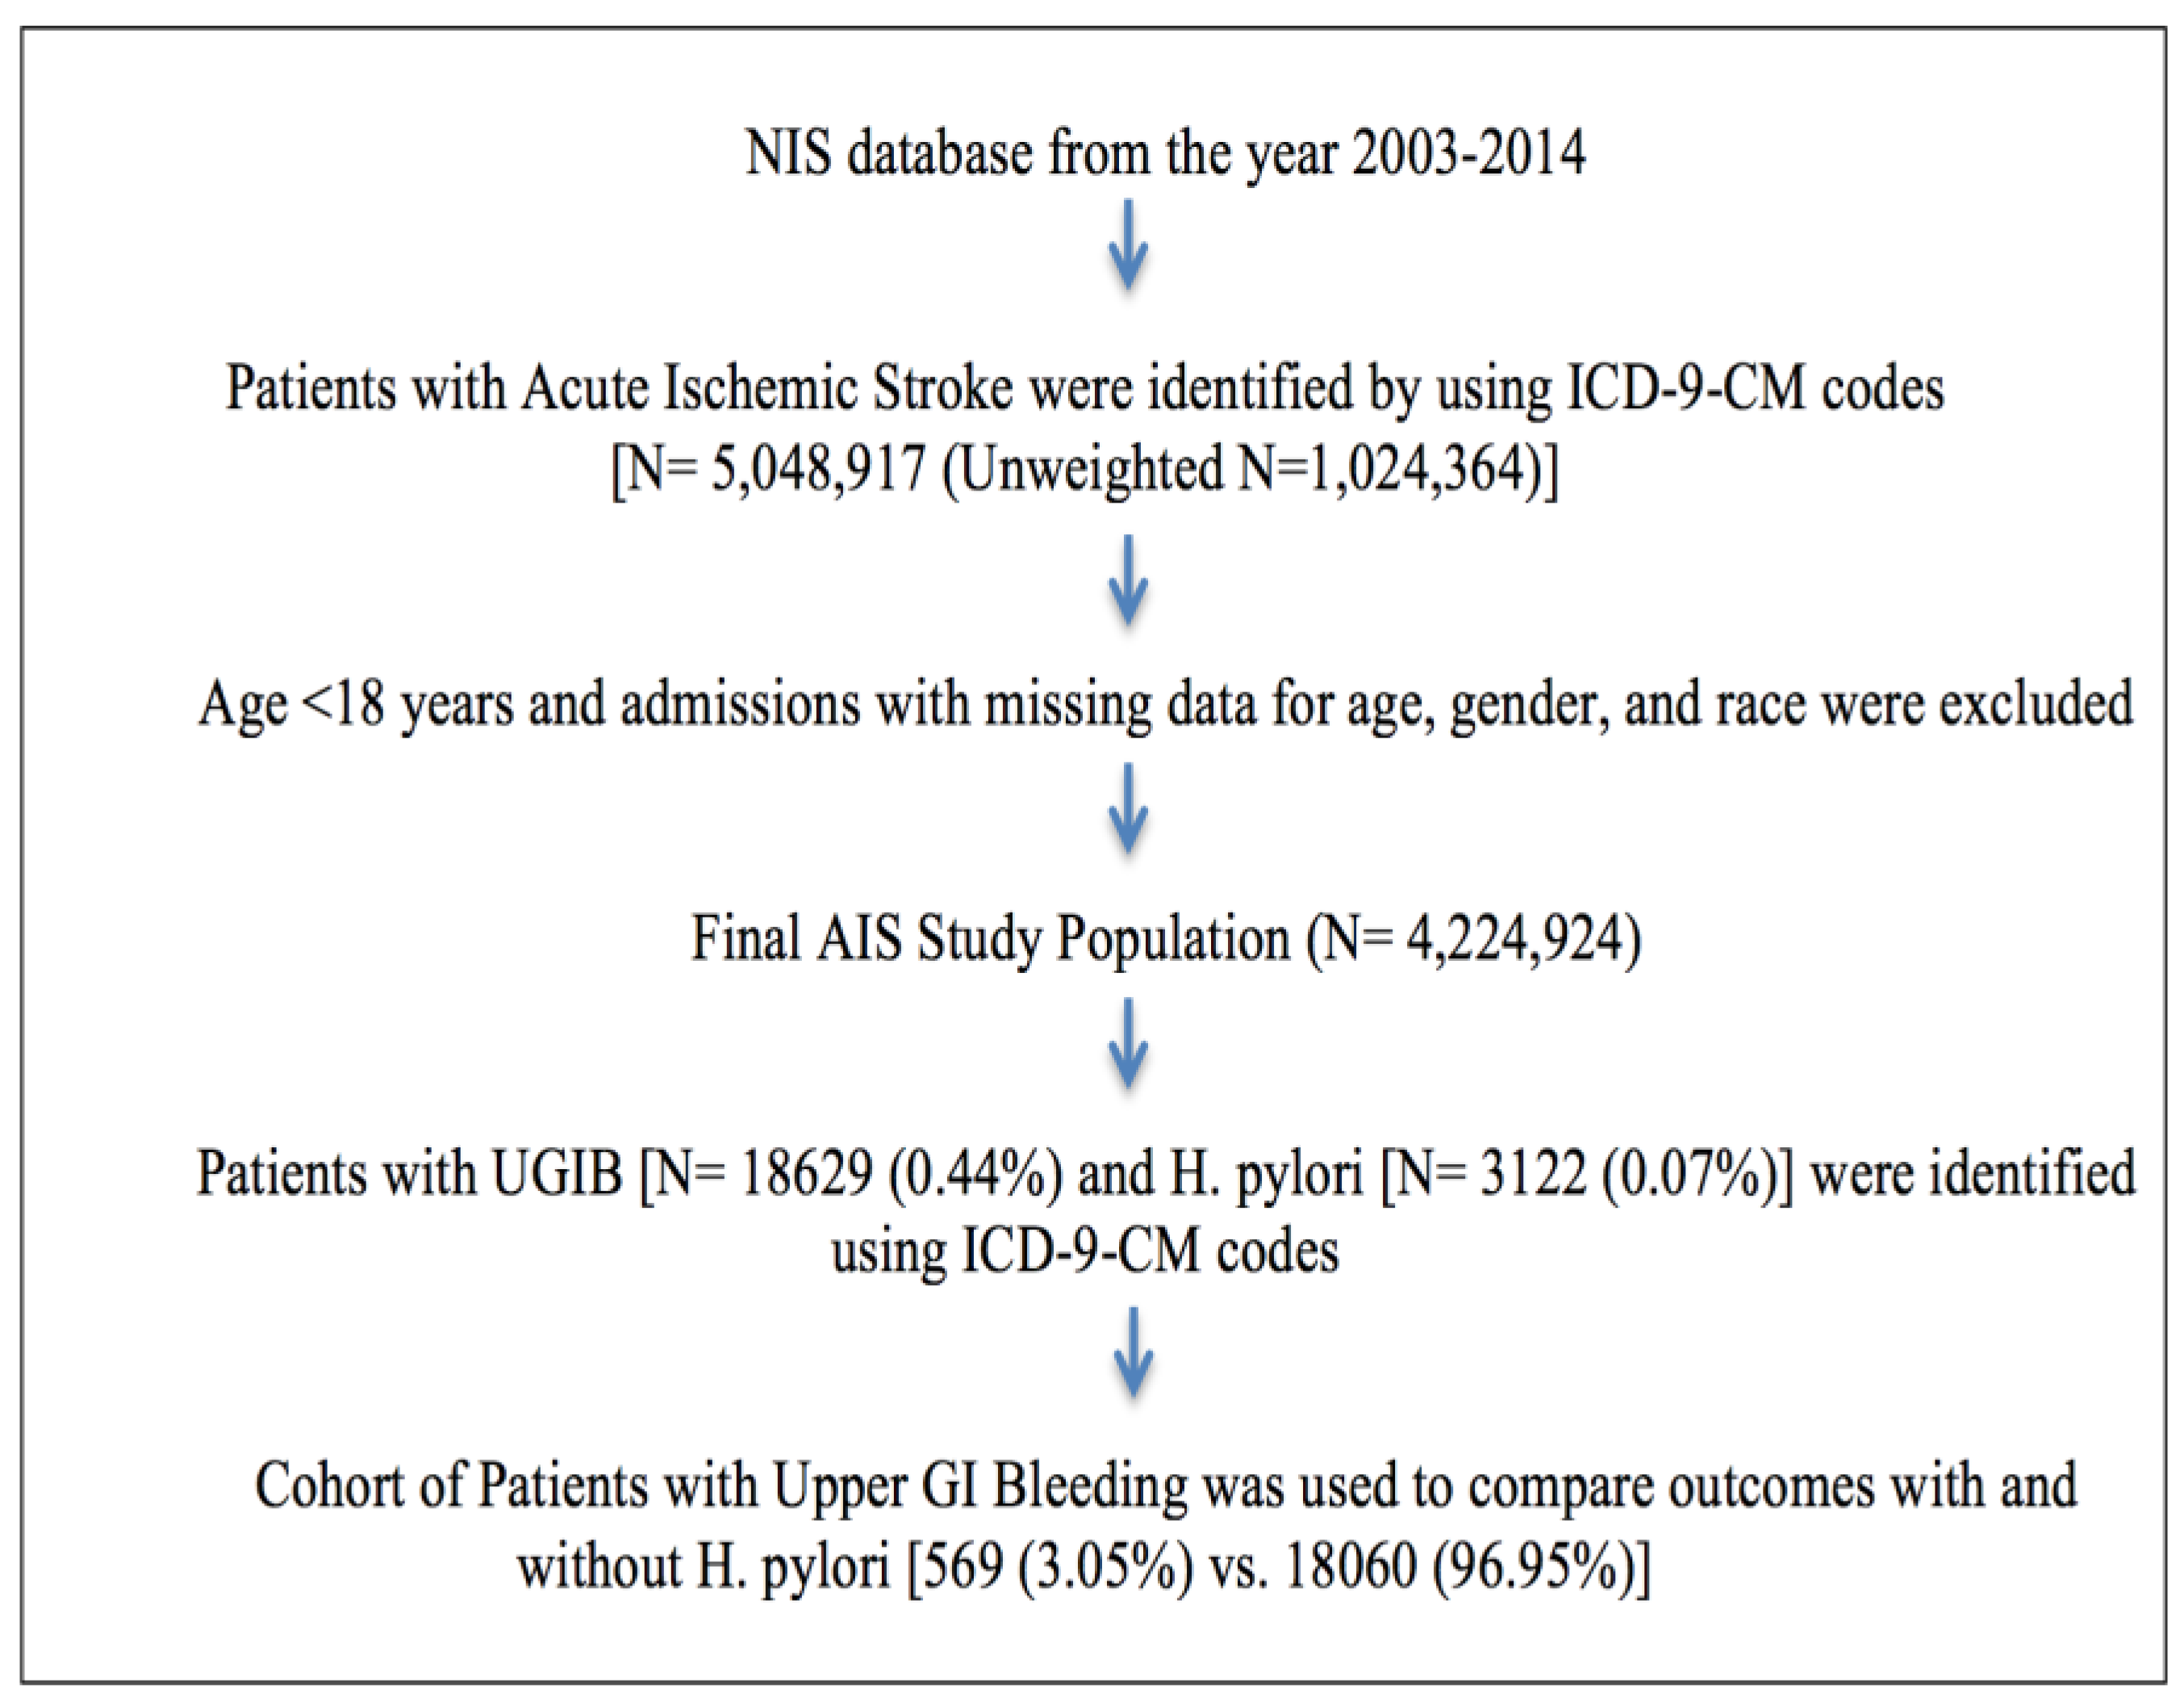
2.1. Study Population
2.2. Patient and Hospital Characteristics
2.3. Outcomes
2.4. Statistical Analysis
2.5. Informed Consent
3. Results
3.1. Disease Hospitalizations
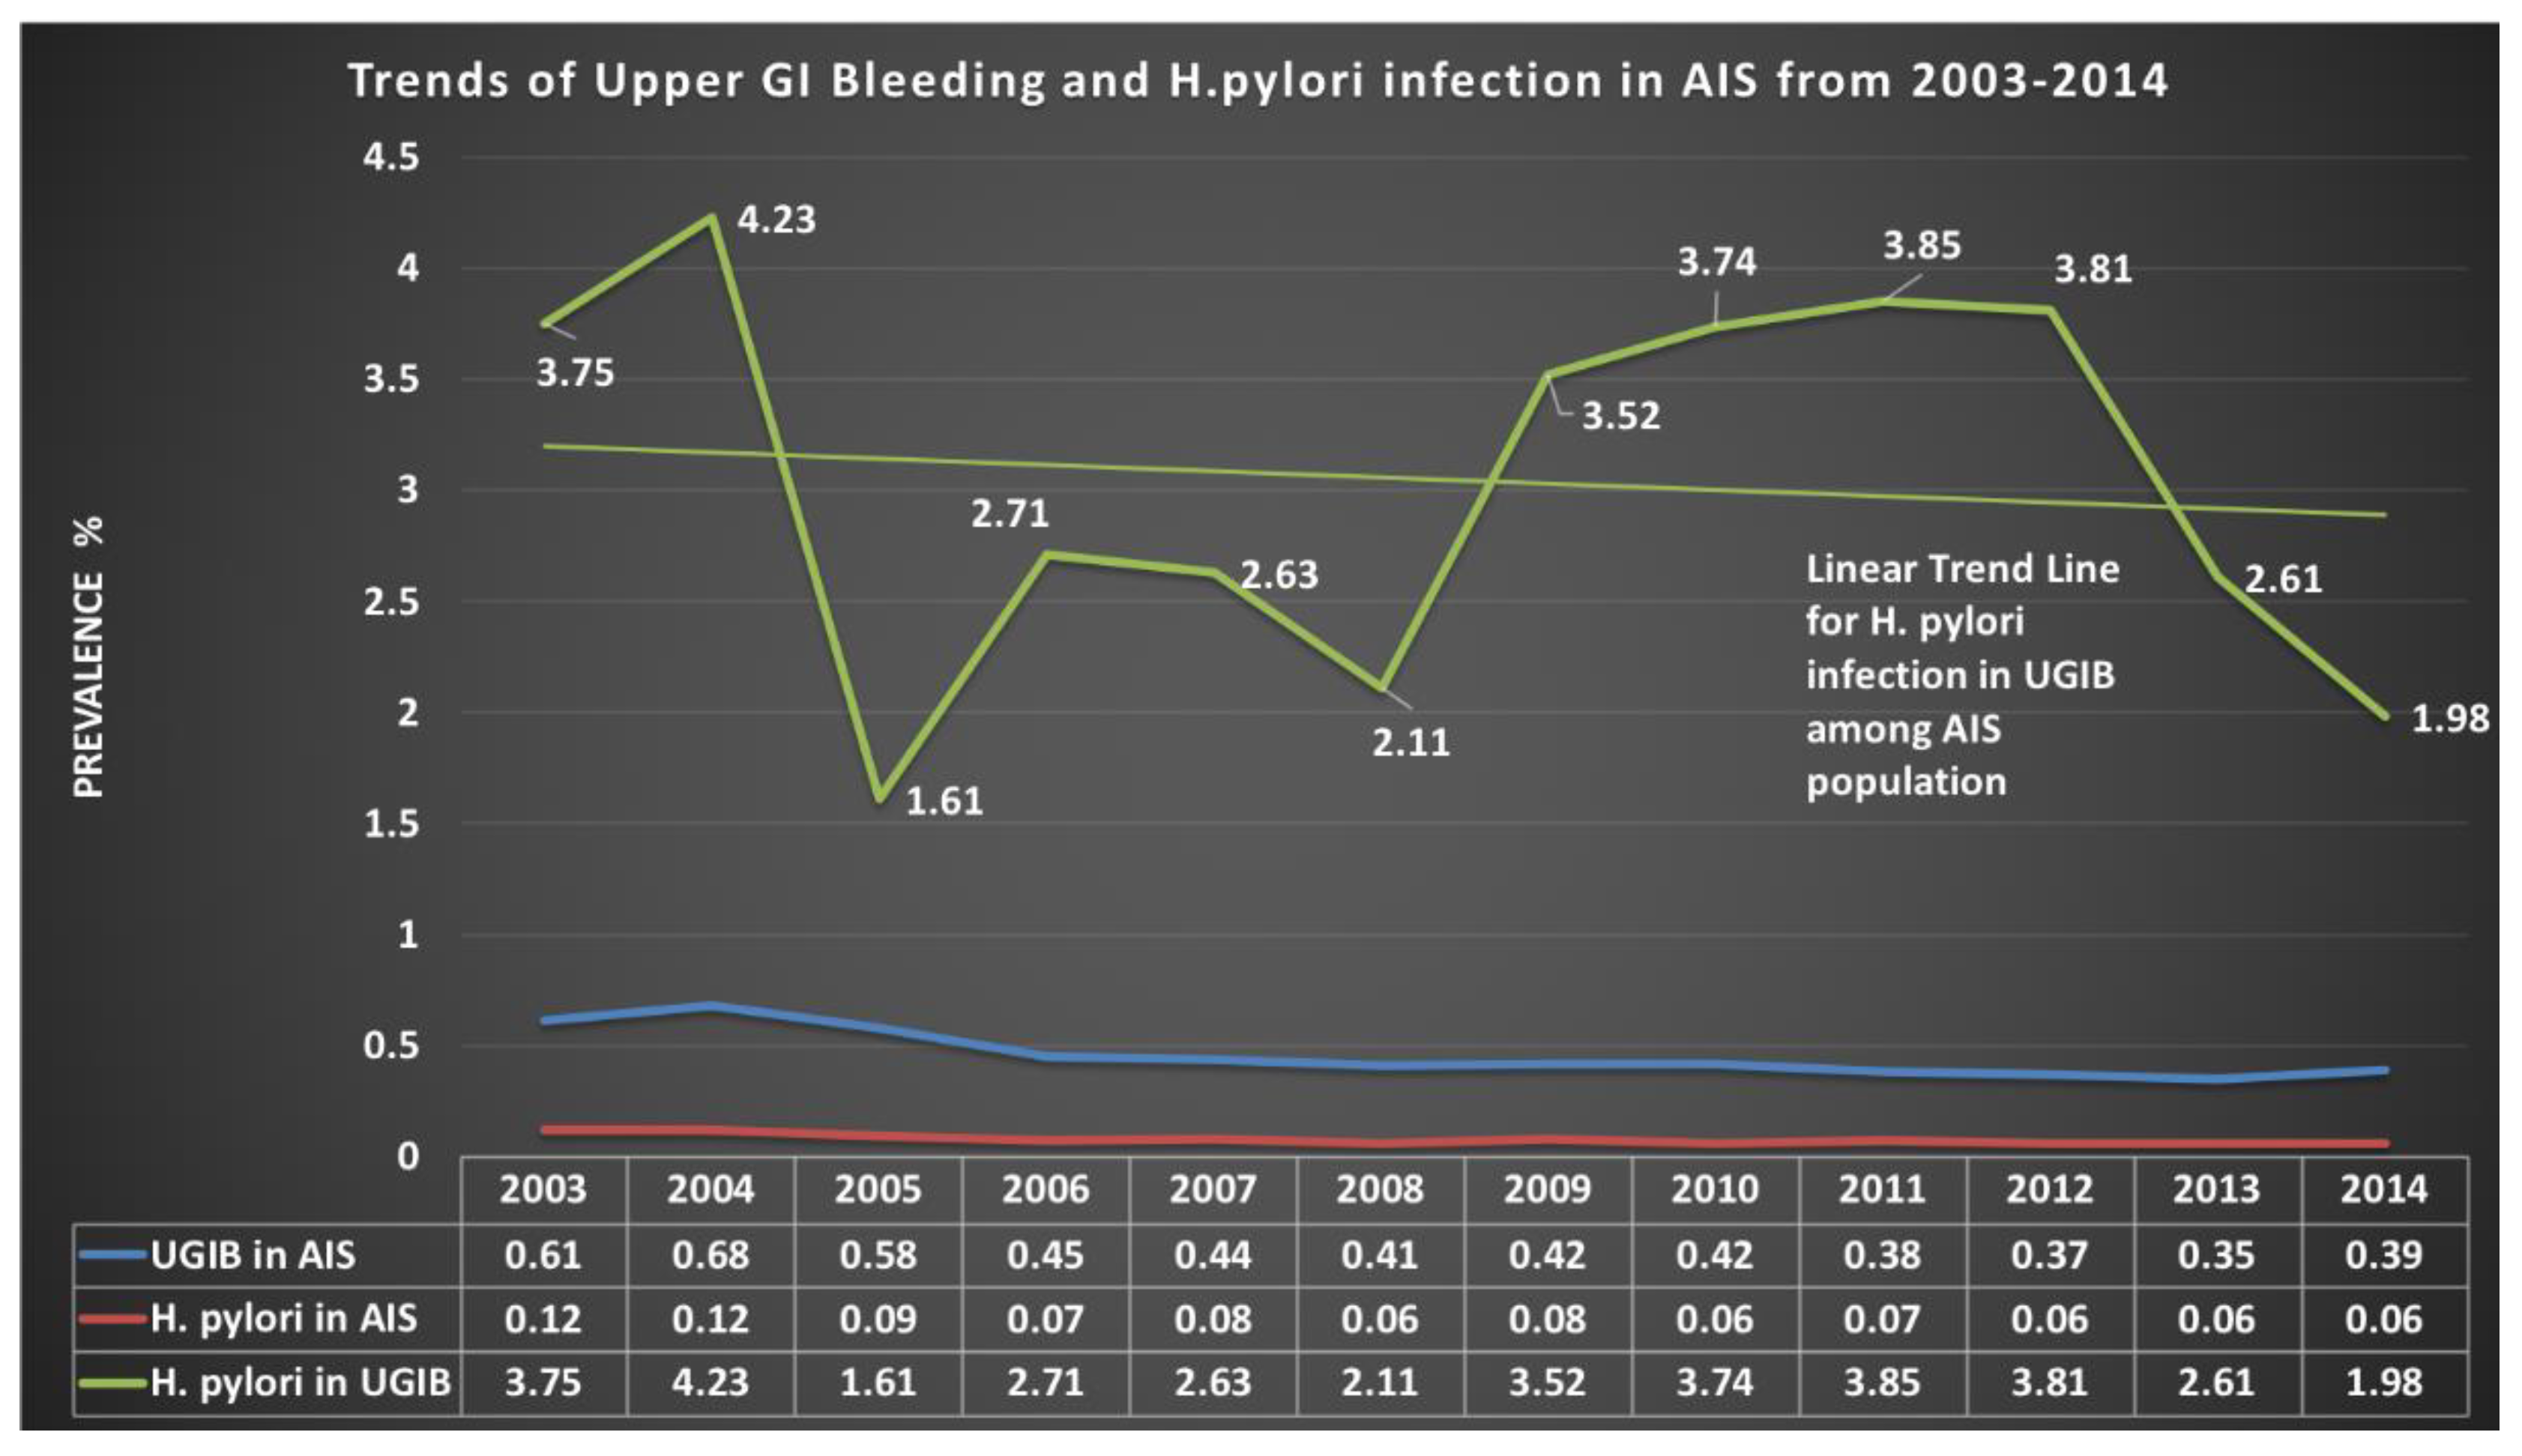
3.2. Prevalence Trends
3.3. Demographics, Patient and Hospital Characteristics, and Comorbidities
3.4. The Primary and Secondary Outcomes
3.5. Length of Stay and Cost of Hospitalization
3.6. Regression Model Derivation
3.7. Accuracy of the Model:
4. Discussion
5. Conclusions
Supplementary Materials
Author Contributions
Funding
Conflicts of Interest
References
- O’Donnell, M.J.; Karal, M.K.; Fang, J.; Saposnik, G.; Eikelboom, J.W.; Oczkowski, W.; Silva, J.; Gould, L.; D’Uva, C.; Silver, F.L. Gastrointestinal bleeding after acute ischemic stroke. Neurology 2008, 71, 650–655. [Google Scholar] [CrossRef]
- Hsu, H.L.; Lin, Y.H.; Huang, Y.C.; Weng, H.H.; Lee, M.; Huang, W.Y.; Lee, J.D. Gastrointestinal Hemorrhage after Acute Ischemic Stroke and Its Risk Factors in Asians. Eur. Neurol. 2009, 62, 212–218. [Google Scholar] [CrossRef]
- Chen, C.M.; Hsu, H.C.; Chuang, Y.W.; Chang, C.H.; Lin, C.H.; Hong, C.Z. Study on factors affecting the occurrence of upper gastrointestinal bleeding in elderly acute stroke patients undergoing rehabilitation. J. Nutr. Health Aging 2011, 15, 632–636. [Google Scholar] [CrossRef]
- Cannon, C.P.; Rhee, K.E.; Califf, R.M.; Boden, W.E.; Hirsch, A.T.; Alberts, M.J.; Cable, G.; Shao, M.; Ohman, E.M.; Steg, P.G.; et al. Current Use of Aspirin and Antithrombotic Agents in the United States Among Outpatients with Atherothrombotic Disease (from the Reduction of Atherothrombosis for Continued Health [REACH] Registry). Am. J. Cardiol. 2010, 105, 445–452. [Google Scholar] [CrossRef]
- Van Leerdam, M.E. Epidemiology of acute upper gastrointestinal bleeding. Best Pract. Res. Clin. Gastroenterol. 2008, 22, 209–224. [Google Scholar] [CrossRef]
- Hreinsson, J.P.; Kalaitzakis, E.; Gudmundsson, S.; Björnsson, E.S. Upper gastrointestinal bleeding: Incidence, etiology and outcomes in a population-based setting. Scand. J. Gastroenterol. 2013, 48, 439–447. [Google Scholar] [CrossRef]
- Enestvedt, B.K.; Gralnek, I.M.; Mattek, N.; Lieberman, D.A.; Eisen, G. An evaluation of endoscopic indications and findings related to nonvariceal upper-GI hemorrhage in a large multicenter consortium. Gastrointest. Endosc. 2008, 67, 422–429. [Google Scholar] [CrossRef]
- Farrell, J.J.; Friedman, L.S. Review article: The management of lower gastrointestinal bleeding. Aliment. Pharmacol. Ther. 2005, 21, 1281–1298. [Google Scholar] [CrossRef]
- Ghassemi, K.A.; Jensen, D.M. Lower GI Bleeding: Epidemiology and Management. Curr. Gastroenterol. Rep. 2013, 15, 333. [Google Scholar] [CrossRef]
- Abraham, N.S.; Hartman, C.; Richardson, P.; Castillo, D.; Street, R.L.; Naik, A.D. Risk of Lower and Upper Gastrointestinal Bleeding, Transfusions, and Hospitalizations with Complex Antithrombotic Therapy in Elderly Patients. Circulation 2013, 128, 1869–1877. [Google Scholar] [CrossRef]
- Wolf, A.T.; Wasan, S.K.; Saltzman, J.R. Impact of Anticoagulation on Rebleeding Following Endoscopic Therapy for Nonvariceal Upper Gastrointestinal Hemorrhage. Am. J. Gastroenterol. 2007, 102, 290–296. [Google Scholar] [CrossRef]
- Ahsberg, K.; Höglund, P.; Staël von Holstein, C. Mortality from peptic ulcer bleeding: The impact of comorbidity and the use of drugs that promote bleeding. Aliment. Pharmacol. Ther. 2010, 32, 801–810. [Google Scholar] [CrossRef]
- Lanas, A.; Aabakken, L.; Fonseca, J.; Mungan, Z.A.; Papatheodoridis, G.V.; Piessevaux, H.; Cipolletta, L.; Nuevo, J.; Tafalla, M. Clinical predictors of poor outcomes among patients with nonvariceal upper gastrointestinal bleeding in Europe. Aliment. Pharmacol. Ther. 2011, 33, 1225–1233. [Google Scholar] [CrossRef] [Green Version]
- Mose, H.; Larsen, M.; Riis, A.; Johnsen, S.P.; Thomsen, R.W.; Sorensen, H.T. Thirty-Day Mortality After Peptic Ulcer Bleeding in Hospitalized Patients Receiving Low-Dose Aspirin at Time of Admission. Am. J. Geriatr. Pharmacother. 2006, 4, 244–250. [Google Scholar] [CrossRef]
- Ortiz, V.; Ortuño, J.; Rodríguez-Soler, M.; Iborra, M.; Garrigues, V.; Ponce, J. Outcome of non-variceal acute upper gastrointestinal bleeding in patients with antithrombotic therapy. Digestion 2009, 80, 89–94. [Google Scholar] [CrossRef]
- Eikelboom, J.W.; Mehta, S.R.; Anand, S.S.; Xie, C.; Fox, K.A.; Yusuf, S. Adverse impact of bleeding on prognosis in patients with acute coronary syndromes. Circulation 2006, 114, 774–782. [Google Scholar] [CrossRef]
- Lau, J.Y.; Sung, J.; Hill, C.; Henderson, C.; Howden, C.W.; Metz, D.C. Systematic review of the epidemiology of complicated peptic ulcer disease: Incidence, recurrence, risk factors and mortality. Digestion 2011, 84, 102–113. [Google Scholar] [CrossRef]
- Sostres, C.; Lanas, A. Epidemiology and demographics of upper gastrointestinal bleeding: Prevalence, incidence, and mortality. Gastrointest. Endosc. Clin. N. Am. 2011, 21, 567–581. [Google Scholar] [CrossRef]
- Lee, I.; Cryer, B. Epidemiology and role of nonsteroidal antiinflammatory drugs in causing gastrointestinal bleeding. Gastrointest. Endosc. Clin. N. Am. 2011, 21, 597–612. [Google Scholar] [CrossRef]
- Garcia Rodriguez, L.A.; Barreales Tolosa, L. Risk of upper gastrointestinal complications among users of traditional NSAIDs and COXIBs in the general population. Gastroenterology 2007, 132, 498–506. [Google Scholar] [CrossRef]
- Lanza, F.L.; Chan, F.K.; Quigley, E.M. Guidelines for prevention of NSAID-related ulcer complications. Am. J. Gastroenterol. 2009, 104, 728–738. [Google Scholar] [CrossRef] [PubMed]
- Vijayvergiya, R.; Vadivelu, R. Role of Helicobacter pylori infection in pathogenesis of atherosclerosis. World J. Cardiol. 2015, 7, 134–143. [Google Scholar] [CrossRef] [PubMed]
- Birman-Deych, E.; Waterman, A.D.; Yan, Y.; Nilasena, D.S.; Radford, M.J.; Gage, B.F. Accuracy of ICD-9-CM Codes for Identifying Cardiovascular and Stroke Risk Factors. Med. Care 2005, 43, 480–485. [Google Scholar] [CrossRef] [PubMed]
- Andrade, S.E.; Gurwitz, J.H.; Chan, K.A.; Donahue, J.G.; Beck, A.; Boles, M.; Buist, D.S.; Goodman, M.; LaCroix, A.Z.; Levin, T.R.; et al. Validation of diagnoses of peptic ulcers and bleeding from administrative databases: A multi-health maintenance organization study. J. Clin. Epidemiol. 2002, 55, 310–313. [Google Scholar] [CrossRef]
- Thirumurthi, S.; Desilva, R.; Castillo, D.L.; Richardson, P.; Abraham, N.S. Identification of Helicobacter pylori infected patients, using administrative data. Aliment. Pharmacol. Ther. 2008, 28, 1309–1316. [Google Scholar] [CrossRef]
- Testerman, T.L.; Morris, J. Beyond the stomach: An updated view of Helicobacter pylori pathogenesis, diagnosis, and treatment. World J. Gastroenterol. 2014, 20, 12781–12808. [Google Scholar] [CrossRef]
- Huang, J.Q.; Sridhar, S.; Hunt, R.H. Role of Helicobacter pylori infection and non-steroidal anti-inflammatory drugs in peptic-ulcer disease: A meta-analysis. Lancet 2002, 359, 14–22. [Google Scholar] [CrossRef]
- Musumba, C.; Jorgensen, A.; Sutton, L.; Van Eker, D.; Moorcroft, J.; Hopkins, M.; Pritchard, D.M.; Pirmohamed, M. The relative contribution of NSAIDs and Helicobacter pylori to the aetiology of endoscopically-diagnosed peptic ulcer disease: Observations from a tertiary referral hospital in the UK between 2005 and 2010. Aliment. Pharmacol. Ther. 2012, 36, 48–56. [Google Scholar] [CrossRef]
- Tang, C.L.; Ye, F.; Liu, W.; Pan, X.L.; Qian, J.; Zhang, G.X. Eradication of Helicobacter pylori infection reduces the incidence of peptic ulcer disease in patients using nonsteroidal anti-inflammatory drugs: A meta-analysis. Helicobacter 2012, 17, 286–296. [Google Scholar] [CrossRef]
- Chan, F.K.; Chung, S.C.; Suen, B.Y.; Lee, Y.T.; Leung, W.K.; Leung, V.K.; Wu, J.C.; Lau, J.Y.; Hui, Y.; Lai, M.S.; et al. Preventing recurrent upper gastrointestinal bleeding in patients with Helicobacter pylori infection who are taking low-dose aspirin or naproxen. N. Engl. J. Med. 2001, 344, 967–973. [Google Scholar] [CrossRef]
- Cryer, B.; Mahaffey, K.W. Gastrointestinal ulcers, Role of aspirin, and Clinical outcomes: Pathobiology, Diagnosis, and Treatment. Journal of Multidisciplinary Healthcare. J. Multidiscip. Healthc. 2014, 7, 137–146. [Google Scholar] [CrossRef] [PubMed]
- Nazareno, J.; Driman, D.K.; Adams, P. Is Helicobacter pylori being treated appropriately? A study of inpatients and outpatients in a tertiary care centre. Can. J. Gastroenterol. Hepatol. 2007, 21, 285–288. [Google Scholar] [CrossRef]
- Howden, C.W.; Hunt, R.H. Guidelines for the management of Helicobacter pylori infection. Ad Hoc Committee on Practice Parameters of the American College of Gastroenterology. Am. J. Gastroenterol. 1998, 93, 2330–2338. [Google Scholar] [CrossRef] [PubMed]
- Loy, C.T.; Irwig, L.M.; Katelaris, P.H.; Talley, N.J. Do commercial serological kits for Helicobacter pylori infection differ in accuracy? A meta-analysis. Am. J. Gastroenterol. 1996, 91, 1138–1144. [Google Scholar]

| H. pylori | ||||
|---|---|---|---|---|
| Yes | No | Total | p Value | |
| H. pyloriin Upper GI Bleeding (%) | 569 (18.23) | 18,060 (0.43) | 18629 | <0.0001 |
| Demographics of Patients | ||||
| Mean Age ± Standard Error (Years) | 71 ± 1.3 | 72 ± 0.2 | 0.364 | |
| Age (Years) (%) | 0.0008 | |||
| 18–34 | <10 | 132 (0.73) | 137 (0.74) | |
| 35–49 | 28 (4.91) | 997 (5.52) | 1025 (5.50) | |
| 50–64 | 172 (30.26) | 4078 (22.58) | 4250 (22.81) | |
| 65–79 | 184 (32.43) | 6686 (37.02) | 6870 (36.88) | |
| ≥80 | 180 (31.60) | 6167 (34.15) | 6347 (34.07) | |
| Gender (%) | <0.0001 | |||
| Female | 203 (35.70) | 8159 (45.18) | 8363 (44.89) | |
| Male | 366 (64.30) | 9900 (54.82) | 10266 (55.11) | |
| Race (%) | <0.0001 | |||
| White | 266 (48.16) | 12,064 (68.50) | 12,330 (67.88) | |
| African American | 166 (29.95) | 3307 (18.78) | 3473 (19.12) | |
| Hispanic | 83 (14.93) | 1405 (7.98) | 1488 (8.19) | |
| Asian or Pacific Islander | 38 (6.96) | 743 (4.22) | 782 (4.30) | |
| Native American | 0 (0.00) | 92 (0.52) | 92 (0.51) | |
| Characteristics of Patients | ||||
| Median Household Income Category for patient’s Zip code (%) * | 0.0018 | |||
| 0–25th percentile | 201 (35.55) | 5310 (30.10) | 5511 (30.27) | |
| 26–50th percentile | 155 (27.52) | 4398 (24.93) | 4553 (25.01) | |
| 51–75th percentile | 112 (19.90) | 4127 (23.40) | 4239 (23.29) | |
| 76–100th percentile | 96 (17.03) | 3805 (21.57) | 3901 (21.43) | |
| Primary Payer (%) | <0.0001 | |||
| Medicare | 347 (61.00) | 12,772 (70.87) | 13,119 (70.56) | |
| Medicaid | 52 (9.20) | 1397 (7.75) | 1449 (7.80) | |
| Private Insurance | 84 (14.74) | 2663 (14.78) | 2747 (14.78) | |
| Other/Self-pay/No charge | 86 (15.06) | 1191 (6.61) | 1277 (6.86) | |
| Admission Type (%) | 0.1368 | |||
| Non- elective | 536 (94.19) | 17,231 (95.51) | 17,767 (95.47) | |
| Elective | 33 (5.81) | 810 (4.49) | 843 (4.53) | |
| Admission Day (%) | 0.0541 | |||
| Weekday | 445 (78.18) | 13,475 (74.61) | 13,920 (74.72) | |
| Weekend | 124 (21.82) | 4585 (25.39) | 4709 (25.28) | |
| Characteristics of Hospitals | ||||
| Bedsize of Hospital (%) † | 0.6877 | |||
| Small | 51 (9.05) | 1801 (10.01) | 1852 (9.98) | |
| Medium | 139 (24.72) | 4541 (25.24) | 4680 (25.22) | |
| Large | 373 (66.24) | 11651 (64.75) | 12,024 (64.80) | |
| Hospital Location & Teaching Status (%) | 0.3445 | |||
| Rural | 61 (10.80) | 1680 (9.34) | 1741 (9.38) | |
| Urban Non-teaching | 218 (38.68) | 7397 (41.11) | 7615 (41.04) | |
| Urban Teaching | 285 (50.52) | 8916 (49.55) | 9201 (49.58) | |
| Hospital Region (%) | <0.0001 | |||
| Northeast | 96 (16.81) | 3662 (20.27) | 3757 (20.17) | |
| Midwest | 65 (11.36) | 2989 (16.55) | 3053 (16.39) | |
| South | 238 (41.88) | 7706 (42.67) | 7944 (42.65) | |
| West | 170 (29.95) | 3703 (20.50) | 3873 (20.79) | |
| CM-Comorbidities of Patients (%) | ||||
| Diabetes Mellitus with/without complications | 218 (38.57) | 6017 (33.45) | 6235 (33.61) | 0.0114 |
| Drug abuse | 20 (3.49) | 411 (2.29) | 431 (2.32) | 0.0611 |
| Obesity | 24 (4.26) | 1049 (5.83) | 1073 (5.79) | 0.115 |
| Hypertension | 453 (80.36) | 13,121 (72.96) | 13,574 (73.18) | <0.0001 |
| Peripheral vascular disease | 63 (11.17) | 1820 (10.12) | 1883 (10.15) | 0.4133 |
| Renal failure | 107 (18.99) | 3266 (18.16) | 3374 (18.19) | 0.6172 |
| Coagulopathy | 15 (2.65) | 1293 (7.19) | 1308 (7.05) | <0.0001 |
| Solid tumor without metastasis | 25 (4.46) | 498 (2.77) | 523 (2.82) | 0.0166 |
| Other neurological disorders | <10 | 500 (2.78) | 505 (2.72) | 0.0044 |
| Deyo’s Charlson Comorbidity Index (CCI) | <0.0001 | |||
| 1 | 32 (5.60) | 2494 (13.81) | 2526 (13.56) | |
| 2 | 100 (17.62) | 3674 (20.34) | 3774 (20.26) | |
| 3 | 149 (26.24) | 3802 (21.05) | 3951 (21.21) | |
| 4 | 133 (23.33) | 3365 (18.63) | 3498 (18.77) | |
| ≥ 5 | 155 (27.21) | 4725 (26.16) | 4880 (26.19) | |
| H. pylori | ||||
|---|---|---|---|---|
| Yes | No | Total | p Value | |
| Primary Outcome: Upper GI Bleeding among AIS patients | ||||
| Patients WITHOUT Upper GI Bleeding | 2553 (81.77) | 4,203,743 (99.57) | 4,206,295 | |
| Patients WITH Upper GI Bleeding | 569 (18.23) | 18,060 (0.43) | 18,629 | <0.0001 |
| Secondary Outcomes in Upper GI Bleeding Population | ||||
| All Cause in Hospital Mortality (%) | <10 | 2544 (14.12) | 2553 (13.74) | <0.0001 |
| Discharge Disposition (%) | <0.0001 | |||
| Routine/Home | 184 (32.93) | 2693 (17.48) | 2877 (18.02) | |
| Transfer to Short-term Hospital | 32 (5.73) | 681 (4.42) | 713 (4.46) | |
| Transfer to SNF/ICF/Another Type of Facility | 264 (47.34) | 10,194 (66.15) | 10,458 (65.49) | |
| Home Health Care | 78 (14.01) | 1842 (11.95) | 1920 (12.03) | |
| Total Discharge other than Home (%) | 375 (67.07) | 12,716 (82.52) | 13,091 (81.98) | <0.0001 |
| APRDRG Severity/Loss of Function (%) | <0.0001 | |||
| Minor loss of function | 0 (0) | 0 (0) | 0 (0) | |
| Moderate loss of function | 59 (10.59) | 1191 (7.73) | 1250 (7.83) | |
| Major loss of function | 366 (65.91) | 8108 (52.62) | 8474 (53.08) | |
| Severe loss of function | 130 (23.50) | 6109 (39.65) | 6240 (39.09) | |
| Total Major/Severe Loss of Function (%) | 496 (89.41) | 14,218 (92.27) | 14,713 (92.17) | 0.0138 |
| APRDRG Likelihood of Death (%) | <0.0001 | |||
| Minor likelihood of death | 123 (22.12) | 1133 (7.35) | 1256 (7.87) | |
| Moderate likelihood of death | 224 (40.37) | 5234 (33.97) | 5458 (34.19) | |
| Major likelihood of death | 133 (23.97) | 5392 (34.99) | 5525 (34.61) | |
| Extreme likelihood of death | 75 (13.53) | 3650 (23.69) | 3725 (23.33) | |
| Total Major/Extreme likelihood of death (%) | 208 (37.50) | 9042 (58.68) | 9250 (57.94) | <0.0001 |
| Length of Stay Mean ± SE (Days) | 10.23 ± 0.69 | 12.77 ± 0.26 | 0.0008 | |
| Cost of Hospitalization Mean ± SE ($) | 68,945 ± 6834 | 94,812 ± 2421 | 0.0005 | |
| Model 1 * | Model 2 † | Model 3 @ | ||||||||||
|---|---|---|---|---|---|---|---|---|---|---|---|---|
| OR | CI | p value | OR | CI | p Value | OR | CI | p Value | ||||
| LL | UL | LL | UL | LL | UL | |||||||
| No H. pylori | Reference | |||||||||||
| H. pylori | 52.33 | 42.45 | 64.5 | <0.0001 | 27.64 | 20.99 | 36.4 | <0.0001 | 27.75 | 21.07 | 36.55 | <0.0001 |
| Age (Years) | ||||||||||||
| 18–34 | Reference | |||||||||||
| 35–49 | 1.28 | 0.84 | 1.96 | 0.2475 | 1.31 | 0.86 | 1.99 | 0.2152 | ||||
| 50–64 | 1.47 | 0.98 | 2.21 | 0.0629 | 1.5 | 1 | 2.25 | 0.0496 | ||||
| 65–79 | 1.44 | 0.95 | 2.19 | 0,0833 | 1.48 | 0.98 | 2.24 | 0.0641 | ||||
| ≥ 80 | 1.32 | 0.87 | 2 | 0.1935 | 1.37 | 0.9 | 2.07 | 0.1436 | ||||
| Gender | ||||||||||||
| Female | Reference | |||||||||||
| Male | 1.39 | 1.29 | 1.49 | <0.0001 | 1.39 | 1.29 | 1.49 | <0.0001 | ||||
| Race | ||||||||||||
| White | Reference | |||||||||||
| African American | 1.15 | 1.04 | 1.26 | 0.0049 | 1.12 | 1.01 | 1.23 | 0.0248 | ||||
| Hispanic | 1.08 | 0.95 | 1.23 | 0.2243 | 1.03 | 0.91 | 1.17 | 0.65 | ||||
| Asian or Pacific Islander | 1.6 | 1.35 | 1.9 | <0.0001 | 1.5 | 1.26 | 1.78 | <0.0001 | ||||
| Native American | 1.11 | 0.67 | 1.83 | 0.6809 | 1.11 | 0.68 | 1.83 | 0.6764 | ||||
| Median Household Income Category for Patient’s Zip Code | ||||||||||||
| 0–25th percentile | Reference | |||||||||||
| 26–50th percentile | 1.01 | 0.93 | 1.11 | 0.7606 | 1.01 | 0.92 | 1.11 | 0.8095 | ||||
| 51–75th percentile | 1.05 | 0.95 | 1.15 | 0.3506 | 1.03 | 0.93 | 1.13 | 0.6175 | ||||
| 76–100th percentile | 1.07 | 0.97 | 1.18 | 0.1669 | 1.05 | 0.95 | 1.16 | 0.3728 | ||||
| Primary Payer | ||||||||||||
| Medicare | Reference | |||||||||||
| Medicaid | 1.05 | 0.9 | 1.23 | 0.5592 | 1.03 | 0.88 | 1.21 | 0.678 | ||||
| Private Insurance | 0.84 | 0.74 | 0.94 | 0.0033 | 0.83 | 0.73 | 0.93 | 0.0019 | ||||
| Other/Self-pay/No charge | 1.02 | 0.87 | 1.2 | 0.8479 | 1 | 0.85 | 1.18 | 0.9779 | ||||
| Admission Type | ||||||||||||
| Non-elective | Reference | |||||||||||
| Elective | 1 | 0.85 | 1.17 | 0.9516 | 1.02 | 0.87 | 1.2 | 0.7788 | ||||
| Admission Day | ||||||||||||
| Weekday | Reference | |||||||||||
| Weekend | 0.98 | 0.91 | 1.06 | 0.5769 | 0.98 | 0.9 | 1.05 | 0.542 | ||||
| CM- Comorbidities of Patients | ||||||||||||
| Diabetes Mellitus with/without complications | 1.69 | 1.05 | 2.73 | 0.0305 | 1.65 | 1.02 | 2.65 | 0.0409 | ||||
| Drug abuse | 1.53 | 0.48 | 4.89 | 0.4761 | 1.49 | 0.47 | 4.77 | 0.5032 | ||||
| Obesity | 1.5 | 1.05 | 2.14 | 0.0254 | 1.48 | 1.04 | 2.11 | 0.029 | ||||
| Hypertension | 1.48 | 1.26 | 1.73 | <0.0001 | 1.46 | 1.24 | 1.71 | <0.0001 | ||||
| Peripheral vascular disease | 0.94 | 0.84 | 1.05 | 0.2863 | 0.94 | 0.84 | 1.05 | 0.2525 | ||||
| Renal failure | 0.81 | 0.72 | 0.9 | 0.0001 | 0.81 | 0.72 | 0.9 | 0.0001 | ||||
| Coagulopathy | 1.87 | 1.64 | 2.14 | <0.0001 | 1.85 | 1.61 | 2.11 | <0.0001 | ||||
| Solid tumor without metastasis | 1.28 | 1.04 | 1.57 | 0.0188 | 1.28 | 1.04 | 1.57 | 0.0188 | ||||
| Other neurological disorders | 3.4 | 2.72 | 4.25 | <0.0001 | 3.31 | 2.65 | 4.14 | <0.0001 | ||||
| Concurrent Conditions/Secondary Diagnosis | ||||||||||||
| Hyperlipidemia | 0.83 | 0.73 | 0.94 | 0.0028 | 0.83 | 0.73 | 0.94 | 0.0031 | ||||
| Atrial fibrillation | 1.13 | 1.03 | 1.23 | 0.0067 | 1.12 | 1.03 | 1.22 | 0.0107 | ||||
| Hemorrhagic conversion | 1.38 | 1.13 | 1.69 | 0.0018 | 1.34 | 1.1 | 1.64 | 0.0045 | ||||
| Alcohol abuse/dependence | 1.47 | 1.25 | 1.72 | <0.0001 | 1.47 | 1.26 | 1.72 | <0.0001 | ||||
| Tobacco current/past use | 0.63 | 0.57 | 0.69 | <0.0001 | 0.62 | 0.57 | 0.68 | <0.0001 | ||||
| Chronic use of NSAIDs | 3.18 | 1.63 | 6.19 | 0.0007 | 3.19 | 1.64 | 6.21 | 0.0006 | ||||
| Chronic use of Aspirin | 0.64 | 0.55 | 0.75 | <0.0001 | 0.63 | 0.54 | 0.74 | <0.0001 | ||||
| Use of Anti-platelet medicine | 0.67 | 0.5 | 0.91 | 0.0093 | 0.66 | 0.49 | 0.9 | 0.0077 | ||||
| Use of Anti-coagulant medicine | 0.66 | 0.55 | 0.79 | <0.0001 | 0.66 | 0.55 | 0.78 | <0.0001 | ||||
| Use of Recombinant tissue plasminogen activator (t-PA) | 0.95 | 0.81 | 1.11 | 0.4881 | 0.92 | 0.79 | 1.08 | 0.2974 | ||||
| Deyo’s Charlson Comorbidity Index (CCI) | ||||||||||||
| 1 | Reference | |||||||||||
| 2 | 2.29 | 2.01 | 2.6 | <0.0001 | 2.29 | 2.02 | 2.6 | <0.0001 | ||||
| 3 | 2.23 | 1.99 | 2.51 | <0.0001 | 2.22 | 1.98 | 2.5 | <0.0001 | ||||
| 4 | 3.32 | 2.91 | 3.78 | <0.0001 | 3.3 | 2.88 | 3.75 | <0.0001 | ||||
| ≥ 5 | 4.91 | 4.29 | 5.62 | <0.0001 | 4.85 | 4.24 | 5.55 | <0.0001 | ||||
| Bedsize of Hospital (# of beds in hospital) | ||||||||||||
| Small | Reference | |||||||||||
| Medium | 1.1 | 0.97 | 1.24 | 0.1411 | ||||||||
| Large | 1.15 | 1.03 | 1.29 | 0.0135 | ||||||||
| Hospital Location & Teaching Status | ||||||||||||
| Rural | Reference | |||||||||||
| Urban Non-teaching | 1.17 | 1.03 | 1.33 | 0.0175 | ||||||||
| Urban Teaching | 1.31 | 1.15 | 1.48 | <0.0001 | ||||||||
| Hospital Region | ||||||||||||
| Northeast | Reference | |||||||||||
| Midwest | 1.08 | 0.96 | 1.21 | 0.2198 | ||||||||
| South | 1.11 | 1.01 | 1.22 | 0.0322 | ||||||||
| West | 1.2 | 1.08 | 1.34 | 0.001 | ||||||||
| c-index | 0.515 | 0.705 | 0.706 | |||||||||
© 2019 by the authors. Licensee MDPI, Basel, Switzerland. This article is an open access article distributed under the terms and conditions of the Creative Commons Attribution (CC BY) license (http://creativecommons.org/licenses/by/4.0/).
Share and Cite
Patel, U.K.; Dave, M.; Lekshminarayanan, A.; Patel, N.; Lunagariya, A.; Jani, V.; Dhamoon, M.S. Role of Helicobacter pylori in Upper Gastrointestinal Bleeding Among Ischemic Stroke Hospitalizations: A Nationwide Study of Outcomes. Gastrointest. Disord. 2019, 1, 358-371. https://0-doi-org.brum.beds.ac.uk/10.3390/gidisord1030029
Patel UK, Dave M, Lekshminarayanan A, Patel N, Lunagariya A, Jani V, Dhamoon MS. Role of Helicobacter pylori in Upper Gastrointestinal Bleeding Among Ischemic Stroke Hospitalizations: A Nationwide Study of Outcomes. Gastrointestinal Disorders. 2019; 1(3):358-371. https://0-doi-org.brum.beds.ac.uk/10.3390/gidisord1030029
Chicago/Turabian StylePatel, Urvish K., Mihir Dave, Anusha Lekshminarayanan, Nidhi Patel, Abhishek Lunagariya, Vishal Jani, and Mandip S. Dhamoon. 2019. "Role of Helicobacter pylori in Upper Gastrointestinal Bleeding Among Ischemic Stroke Hospitalizations: A Nationwide Study of Outcomes" Gastrointestinal Disorders 1, no. 3: 358-371. https://0-doi-org.brum.beds.ac.uk/10.3390/gidisord1030029