1. Introduction
Concrete is widely considered to be the most used material in structures. Its heterogeneity and complex microstructure show exceptional diversity in comparison with other common building materials [
1]. One of its main advantages is the ability to bear different natures of admixtures and Supplementary Materials [
2]. Studying the microstructure of a concrete specimen, it is simply observed that this diversity is a result of three different phases that occur within the material. These phases are accountable for significant mechanical properties and concrete behavior. An interfacial transition zone amid aggregates and cement paste takes place in the form of a thin film with a thickness of up to 50 μm, around coarse aggregates. This zone is acknowledged to be a starting point of primary defects leading crack propagation paths and carriage of assailing agents that threaten the durability of concrete. In the interest of monitoring the structural doings of freshly poured concrete, nondestructive tests in reference to the assessment of passive and active sound waves have been put forward. Ultrasound techniques have been used in the nondestructive testing field to observe the behavior of concrete strength gain and is repeatedly used for the monitoring of the setting and hardening of concrete at early ages [
3,
4,
5,
6,
7,
8,
9,
10]. Various approaches in the study of concrete’s setting and hardening process trust that the transmission and reflection of longitudinal and shear waves respectively are efficient measurement methods. Generally, measuring devices for longitudinal wave transmission are premeditated to automatically record the longitudinal wave velocity, frequency range, and relative energy [
6,
10]. Only the longitudinal wave velocity is considered as an index of the hydration process. Hardened concrete shows nonlinear properties that can therefore be linked to microcracking formation [
11]. Numerous studies have been published on the early stages of the concrete hydration process that puts forward the influence it has on the durability of the specimens. During this process, it is observed that the physical properties of concrete are subjected to a critical phase change behavior, from the liquid to the solid state. The hydration process of cement is known to be a highly exothermic reaction and results in concrete hardening [
12]. The chemical reactions that occur when dry cement interacts with water, affect the microstructure of the later hardened slump/mix.
It is quite uncertain if studies can provide the monitoring of both linear and dynamic nonlinear elastic parameters in the course of phase change. In recent years, there has been considerable interest in the linear elastic properties of concrete during hardening using active ultrasonic echographic measurements [
1,
13,
14]. Boumiz [
15,
16] and Morin [
17] reported that active ultrasonic measurements impart the linear elastic coefficients of the material, together with measurements of volumetric shrinkage, to describe the development of a high-performance concrete during hardening. Keating et al. [
18,
19] noted that after mixing cement slurries, the velocity of longitudinal waves shows a three-stage evolution. Several studies, for example, have been carried out, showing similar patterns using measurements of ultrasonic pulse velocity on cement-based materials, and associated results together with other physical parameters related to the hydration process [
3,
7,
15,
16,
17,
18,
19,
20,
21,
22,
23,
24,
25,
26]. Ultrasonic propagates through solids and interacts with the microstructure of the material. Other studies, for instance, assessed the setting and hardening properties of cementitious materials in the virtue of elastic wave propagation performance in suspensions [
14,
27,
28].
The broad use of ultrasonic nondestructive evaluation is to comprehend the wave-material interaction and estimate the pursued material properties from the aberration of an ideal, unspoiled medium [
1]. This definition applies to solid materials whose properties remain constant during the experiments. Ultrasonic experiments study the abnormalities caused by the adjustments in material properties. In the field of nondestructive testing and concrete technology, ultrasonic pulse velocity is the leading method for monitoring strength gain [
29,
30,
31] and observing the setting and hardening of cementitious materials at early ages [
3,
4,
5,
6,
7,
8,
9,
10]. An earlier research [
20], reports that parameters reminiscent of the composition of concrete, temperature, and hardening do not have the same impact on enhancing concrete compressive strength and ultrasonic wave velocity although numerous correlations can be demonstrated in the literature. As a result, a reliable regression model for estimating the compressive strength is needed [
32]. In regard to the shear wave reflection method, the observations indicate an almost linear correlation with the development of concrete strength [
33,
34]. A significant preeminence of the above-mentioned technique is that it can be applied in-situ and only one side of the specimen requires to be available for testing. Passive energy, recorded using Acoustic Emission techniques, has been utilized to evaluate early-age structural activity in concrete, indicating phases of increased microstructural changes in the material during the hardening process [
16]. Concrete is attracting considerable interest due to its complex structure and remarkable properties and is an interesting choice for studying the phase changes that occur over a small amount of time after mixing and hence one can analyze the material numerous times during this change. Analyzing the properties of cement-based materials is crucial in the prediction of material behavior and tenability.
This paper presents an effective attempt at monitoring the early stages of fresh cement-paste composites during the hydration process, by means of nonlinear elastic wave propagation. Experiments were carried out with the assistance of a purpose-built monitoring integrated system based on nondestructive techniques consisting of a contact ultrasonic transducer and a noncontact optical detection measurement device. The operation principle of the noncontact optical detection system (laser vibrometer) is based on the principle of the Doppler effect. Through this technique, the assessment of the amplitudes of harmonic vibrations of an elastic wave with a specific fundamental frequency propagating through the material could result in the evaluation of important material characteristics.
2. Theoretical Background
The technological materials are by nature nonlinear media, so a fundamental elastic wave (sin
ωt) propagating in such material will deform [
26,
35,
36]. The introduction of nonlinear terms into the stress–strain relationship during acoustic wave propagation through a material involves the inclusion of higher-order elastic constants.
The material nonlinearity is expressed by a nonlinearity parameter, β.
A pure longitudinal wave propagating in a solid medium generates second harmonics. The differential equation of motion can be written in a form in which the linear and nonlinear terms are separated with a coefficient for each term,
where
α and
δ are the expressions of the elastic constants for each term. It should be noted that the coefficient
α is expressed in terms of second-order elastic constants only but
δ is expressed in terms of both second- and third-order elastic constants [
36,
37].
Considering a perturbation solution to Equation (1) of the form
u =
uo +
u’ and by making appropriate substitutions, an approximated solution involving the second harmonic can be derived:
where
cο = (
α/
ρ0)
1/2 is the phase velocity.
The ultrasonic nonlinearity parameter
β is defined as the negative ratio of the nonlinear term to the linear term in the wave equation. Equation (3) can then be rewritten as:
The amplitude A in the first term and the expression
in the second term of Equation (3), are respectively, the fundamental amplitude
A1 and the second harmonic amplitude
A2. Therefore, the second-order nonlinearity parameter,
β2, can be expressed in terms of amplitudes
A1 and
A2:
where
a is the propagation distance and
k = 2π/λ is the propagation constant.
Similarly, the third-order nonlinearity parameter,
β3, can be written as a function of the fundamental amplitude
A1 and the third harmonic amplitude
A3, as follows:
The nonlinearity parameters relate to the material’s higher order elastic constants [
36,
38,
39]. In this study, noncontact vibration measurements were performed to measure the harmonics’ amplitudes and derive the nonlinearity parameters.
3. Materials and Methods
The detection of the second and third harmonic amplitudes is based on the propagation of a single frequency ultrasonic wave through the sample and the detection of the harmonic signals at the other end. A narrow bandwidth transducer was used to transmit the signal through the material, at a given frequency f. The transmitted acoustic waves were recorded by a laser Doppler vibrometer. Laser Doppler Vibrometry (LDV) is a method that offers very high velocity and displacement resolution and is used in many fields of contracture and mechanical science. In addition, is widely used for nondestructive flaw detection, in all kinds of materials, and for the measurement of structural dynamics. Light as a sensor does not influence the sample, making it noninvasive and therefore enabling measurements to be taken on any structure.
The operating principle of LDV is based on the Doppler phenomenon. If a wave is reflected by a moving object and detected by an instrument, such as an LDV, the measured frequency shift fD of the wave can be termed as:
where
v is the object’s velocity and
λ is the wavelength of the emitted wave.
In order to determine the velocity of a moving object, the Doppler frequency shift is measured at a given wavelength. This is the basis of laser interferometry [
40]. The laser beam by the LDV is directed to the surface of the material and the vibration amplitude, as well as the frequency, are extracted from the Doppler shift frequency of the reflected laser beam due to the motion of the surface. In this study, the scanning vibrometer system that was used is PSV-400 by Polytec.
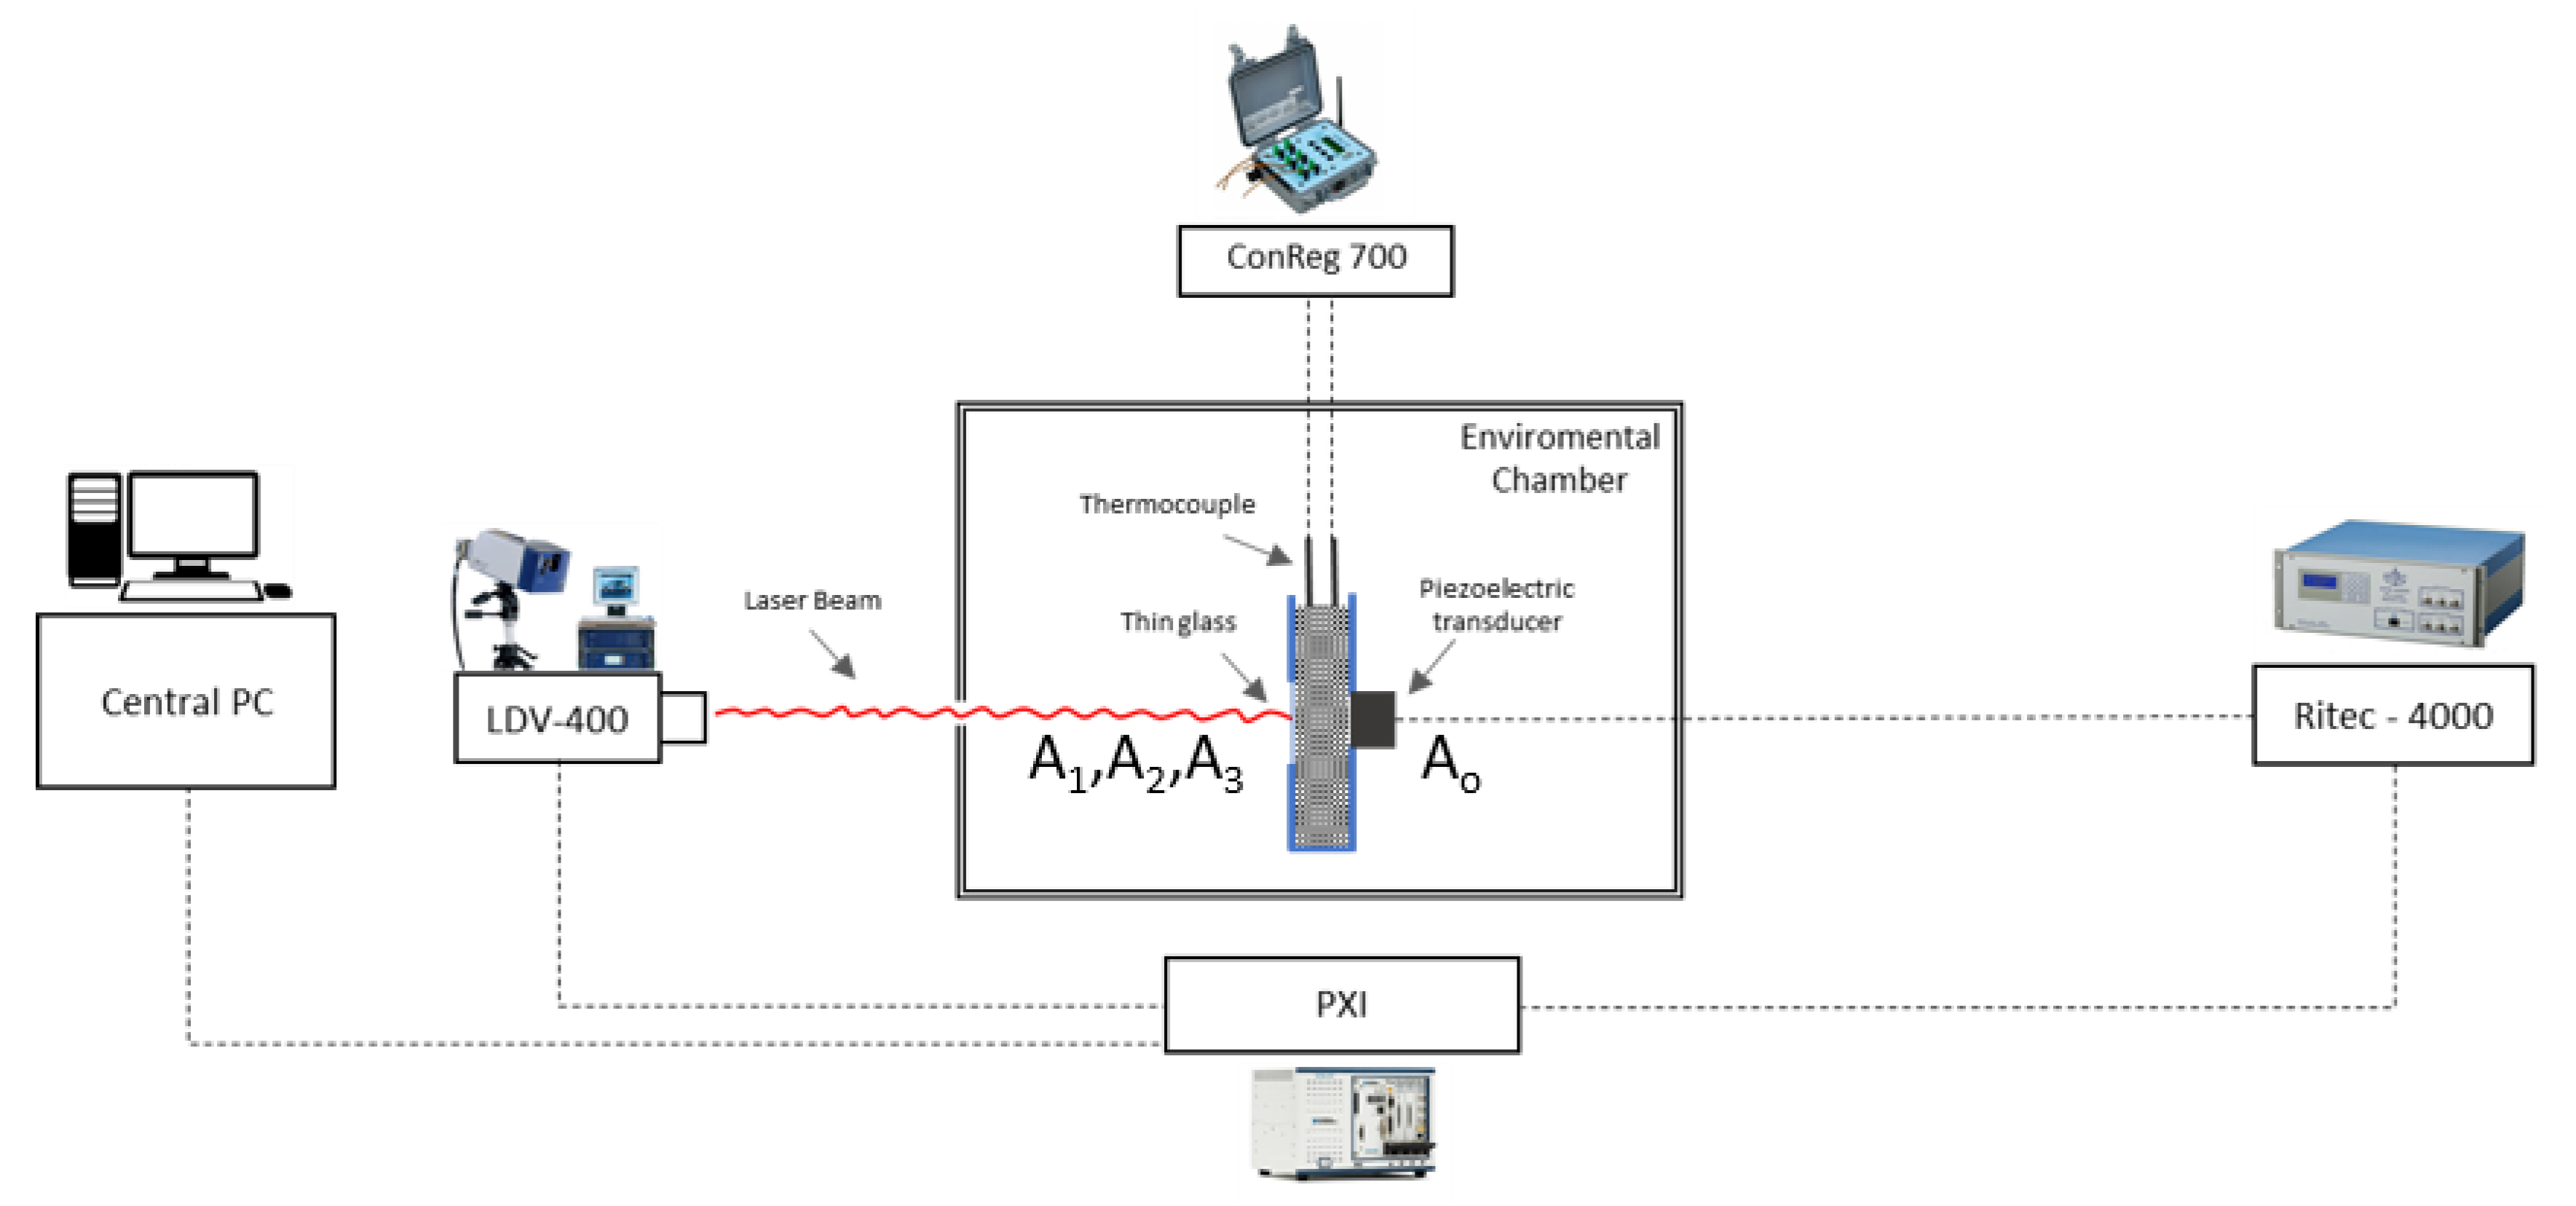
The experiments for monitoring the hardening process were performed using a mold of volume 150 × 170 × 50 mm3 during the first 48 h. The mold consisted of a circular opening on the backside in order for a longitudinal piezoelectric transducer for the active ultrasonic measurements to be fit. To avoid leakage, a thin film was placed around the hole. On the other side, a cubic hole was opened and a special glass 1 mm thick was installed in order for the creation of harmonious oscillations by the glass to be prevented. For the perfect contact between the transducer and fresh mortar, the mold was placed on a vice and the clamping force was adjusted by a torque wrench. The transducer had a peak frequency of 0.20 ΜHz and its distance from the thin glass was 50 mm. In addition, an absolute linear pulser, RPR-4000-VHP High Power Pulser Receiver System by Ritec, was used so as the creation of nonlinear oscillations by equipment would be zero. Moreover, a thermocouple was placed in order for the maturity process to be monitored. Maturity is an index value that represents the progression of concrete hardening and is an accurate way for the real-time strength values of hardening concrete to be determined. This method is based on the ASTM C1074 standard and calculates the concrete strength, considering concrete temperature and time. The experimental equipment that is used for recording maturity values was ConReg-700. ConReg Maturity Meter registers and presents a concrete construction’s temperature development while it is in progress. The strength is continuously calculated.
In order for the outside temperature to be completely controlled, the setup with the fresh concrete was placed on an environmental chamber, Model VC
3 4018 by Vötsch. The wave propagation parameters (tone burst signal cycles, frequency, and high-power voltage) were determined from the beginning of the experiment via LABVIEW software that communicated with the RITEC instrument. More specifically, data collection was done through a National Instrument PXIe-1071 (PXI Chassis) that consists of three digitalization cards. A PXIe-8360 (PXI Remote Control Module), which was connected with a central PC; a PXI-8430/2 (PXI Serial Interface Module), which was connected with Ritec-4000; and finally a PXI-5105 (PXI Oscilloscope) with an 8-channel 12-Bit 60 MS/s which recorded the data and waveforms. The coordination of the experimental equipment (Ritec-4000, LDV), except ConReg-700, became via the central PC (
Figure 1). For this study, 18 different mixtures were produced, 9 mixtures of cement paste, 3 for each ratio of w/c 0.4, 0.5, 0.6, and respectively 9 mixtures for mortar mixtures for the same w/c ratio. Mixes were performed according to the BS EN 196-1 standard. The experimental measurements were recorded every 4 min for 48 h.
4. Results and Discussion
The relationship of sound velocity, strength, and the difference in temperature as a function of time during the cement paste hardening process is shown in
Figure 2. The temperature difference is calculated as the difference between the temperature of cement paste or mortar and the environmental temperature. Time zero in
Figure 3 means the time when the cement-based material was placed on the mold and at that time, only air existed in the form. During the first stage, a sharp increase in temperature was observed which lasted about 8 h, as concerned the cement paste with water to cement ratio equal to 0.4. According to an earlier study [
14], there are three stages of the hardening process of cement paste.
The three stages are very evident in the diagram of the strength curve that is depicted by the change of inclination of the curve.
In the first stage, the sound velocity starts with the value to be close to the air’s (340 m/s) and is increased gradually up to levels close to 1500 m/s, which is similar to the water sound velocity.
The second stage is between 1500 m/s and 3000 m/s. The increase in sound velocity is explained by a reduction in the water volume and a raise of the hydration products during the hydration process in the cement paste [
14,
23,
41].
Finally, stage 3 is the time after stage 2 until the end of the measurement.
It is worth noting in this point that during the first stage, in the first 3 to 4 h period that is considered the connection period of small particles, an inability to record ultrasound signal is observed, which has also been reported in previous researches [
1,
16]. This inability is not easy to be explained but is probably happening due to the high attenuation of fresh cement paste/mortar.
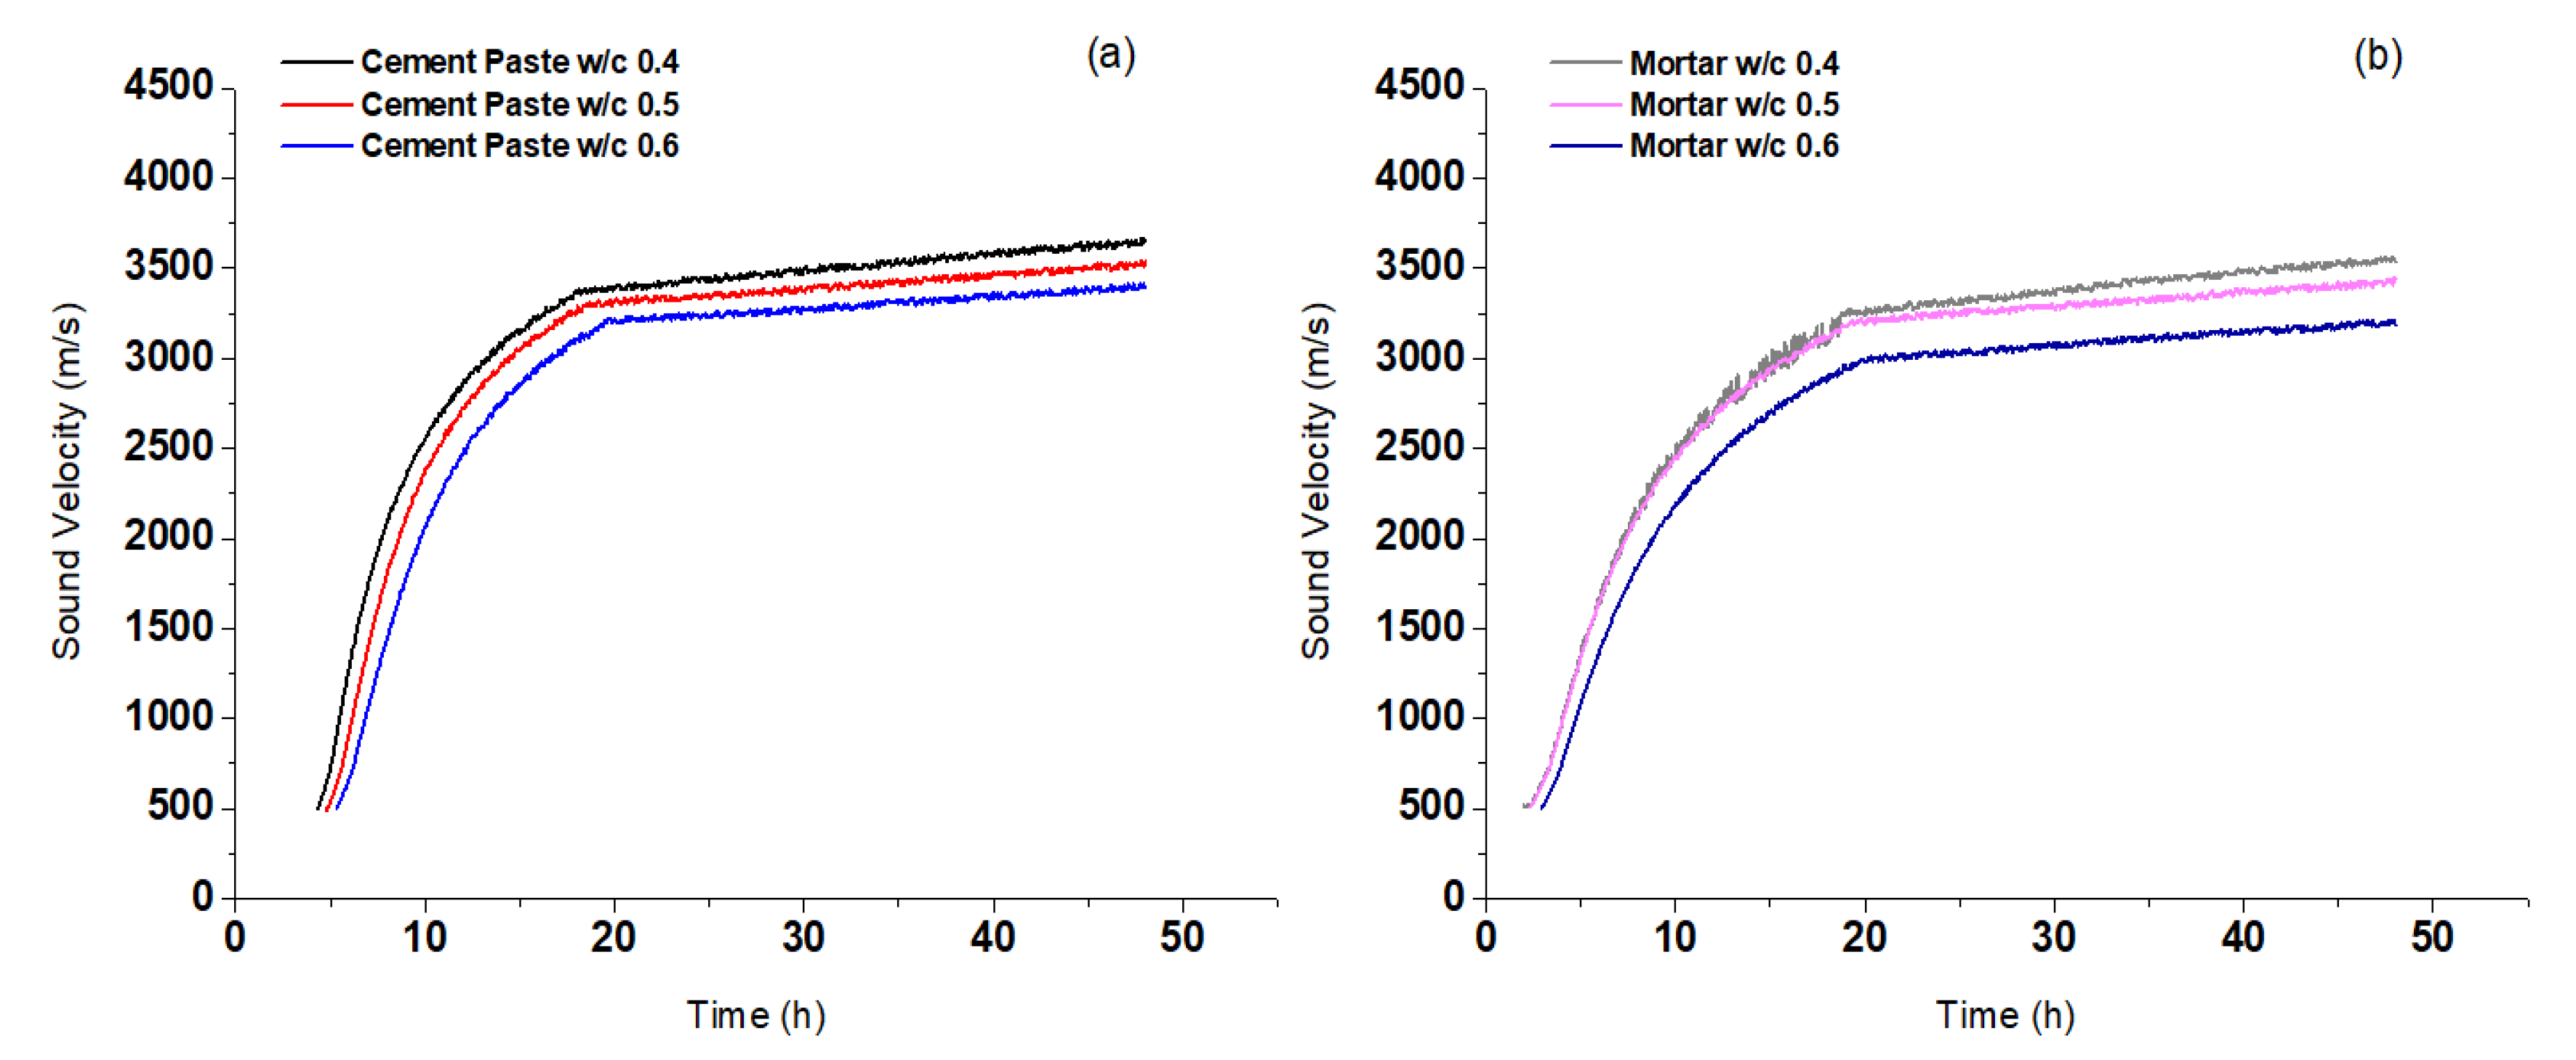
Figure 3 shows the change of sound velocity as a function of time during the cement paste hardening process. It is observed that the sound velocity increases with time. This is expected since hardening results in increasing the material density. Also, the lower the w/c ratio, in both cement paste and mortar, the higher is wave speed. The most important observation is that during the first stage and when there is an inability of the ultrasound signal to record, the sound velocity record starts earlier for the mortar specimens (
Figure 3b) in comparison with the cement paste that took twice as long (
Figure 3a). This is due to the presence of fine aggregates because they absorb water and thus bind a percentage of the water that would make the mixture waterier. However, the first ultrasound waves were recorded at the same levels, about 500 m/s, for both types of mixtures. In addition, during stage 1 and stage 2, there was a rapid increase in sound velocity. It is considered that the chemical properties of the materials changed sharply, and the cement paste/mortar texture became denser so the elastic wave velocity increased [
14]. After that, at stage 3 and within 30 h, the wave velocity increased only 250 m/s.
Previous research has shown that the sound velocity is related to the strength of the cementitious material [
29,
42,
43,
44]. It is also widely accepted that lower w/c ratios give higher mechanical strengths. From the above, it is clearly understood that the strength curves should be similar to the velocity curves.
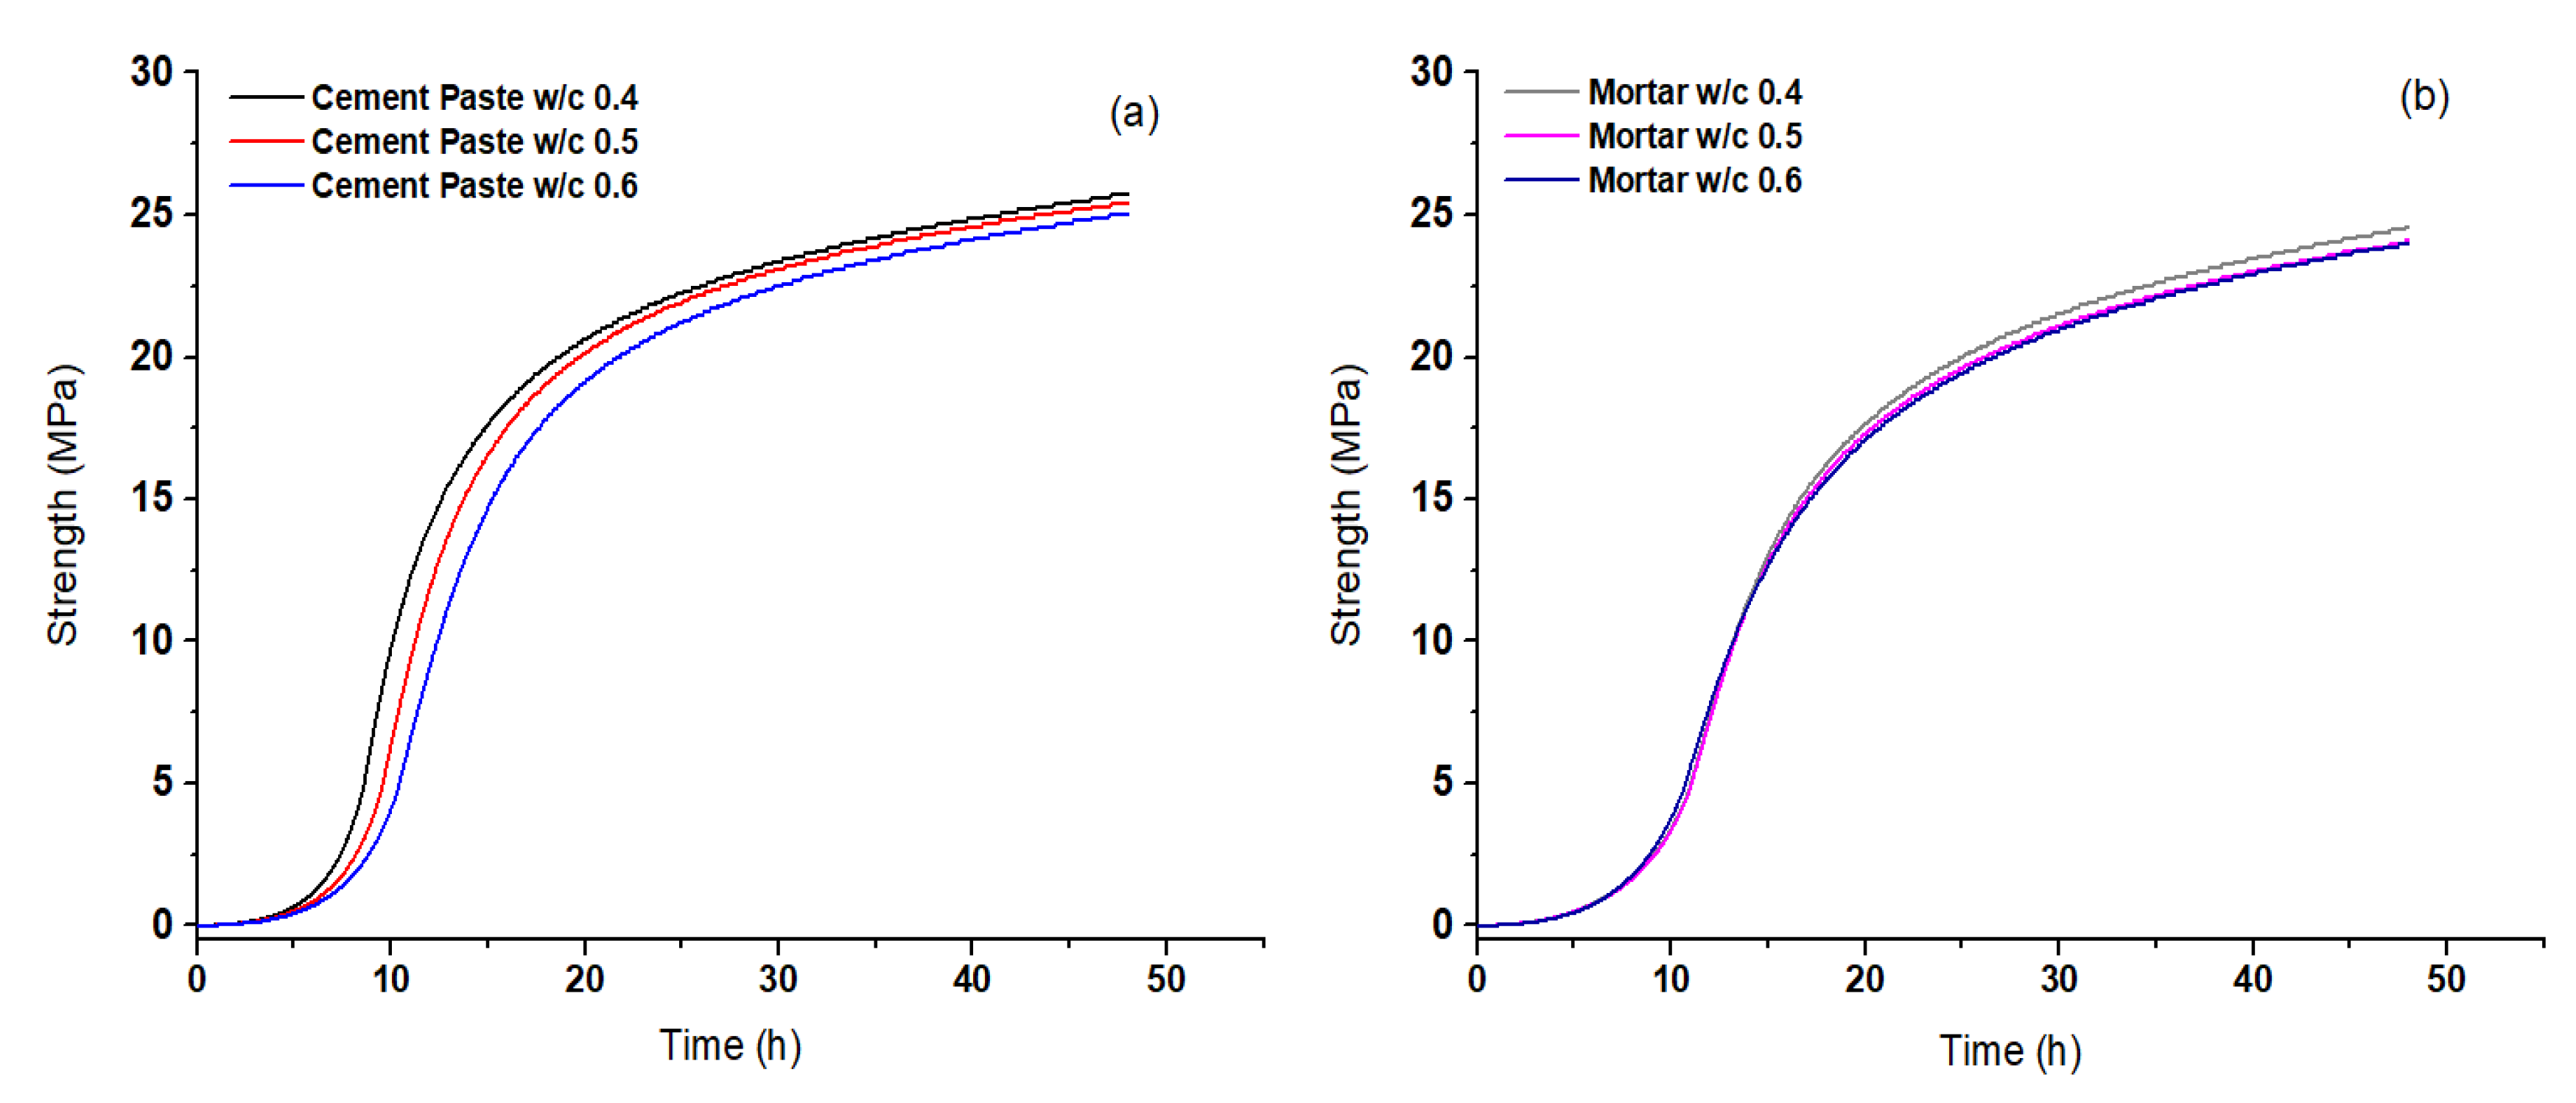
Figure 4 shows the strength curves for both types of mixtures as a function of time during the hardening process. It is confirmed that the stress curves follow the pattern of sound velocity curves. The results are also in line with the results of previous research regarding the w/c ratio. In addition, as in the sound velocity diagrams, the cement paste specimens had slightly higher strengths than the mortar specimens. These higher strength values occurred because the cement paste reached a higher hydration rate than the mortar. This was due to the fact that an amount of the water was bounded by the aggregates, as also mentioned above.
In addition, the following observations were extracted from the velocity and strength curves. The first waveforms were recorded when the strength ceased to be zero and started to increase, as illustrated in
Figure 5. This is the point when the largest solid particles are created, and the temperature is nearing the peak. This is happening because at this time, the mixture is passing from the liquid phase to the solidification phase. During the first stage of the maturity process, the attenuation level is too high, and it was impossible for an ultrasound wave to be transmitted through the fresh slurry.
The hardening process of fresh cement-based materials constitutes an essential issue in materials research that leads to the quality assessment of the testing material. During the first stage of the hardening process, a sharp increase in temperature is observed, which lasts about 8 h. At every single moment, the temperature difference was calculated as the difference between cement paste or mortar temperature and environmental temperature. According to previous investigations, during this stage, the most clustering between the different particles is established. Firstly, the smallest particles are created and then the largest particles follow [
3,
21]. After that, the temperature decreases and tends to become the same as the environment temperature.
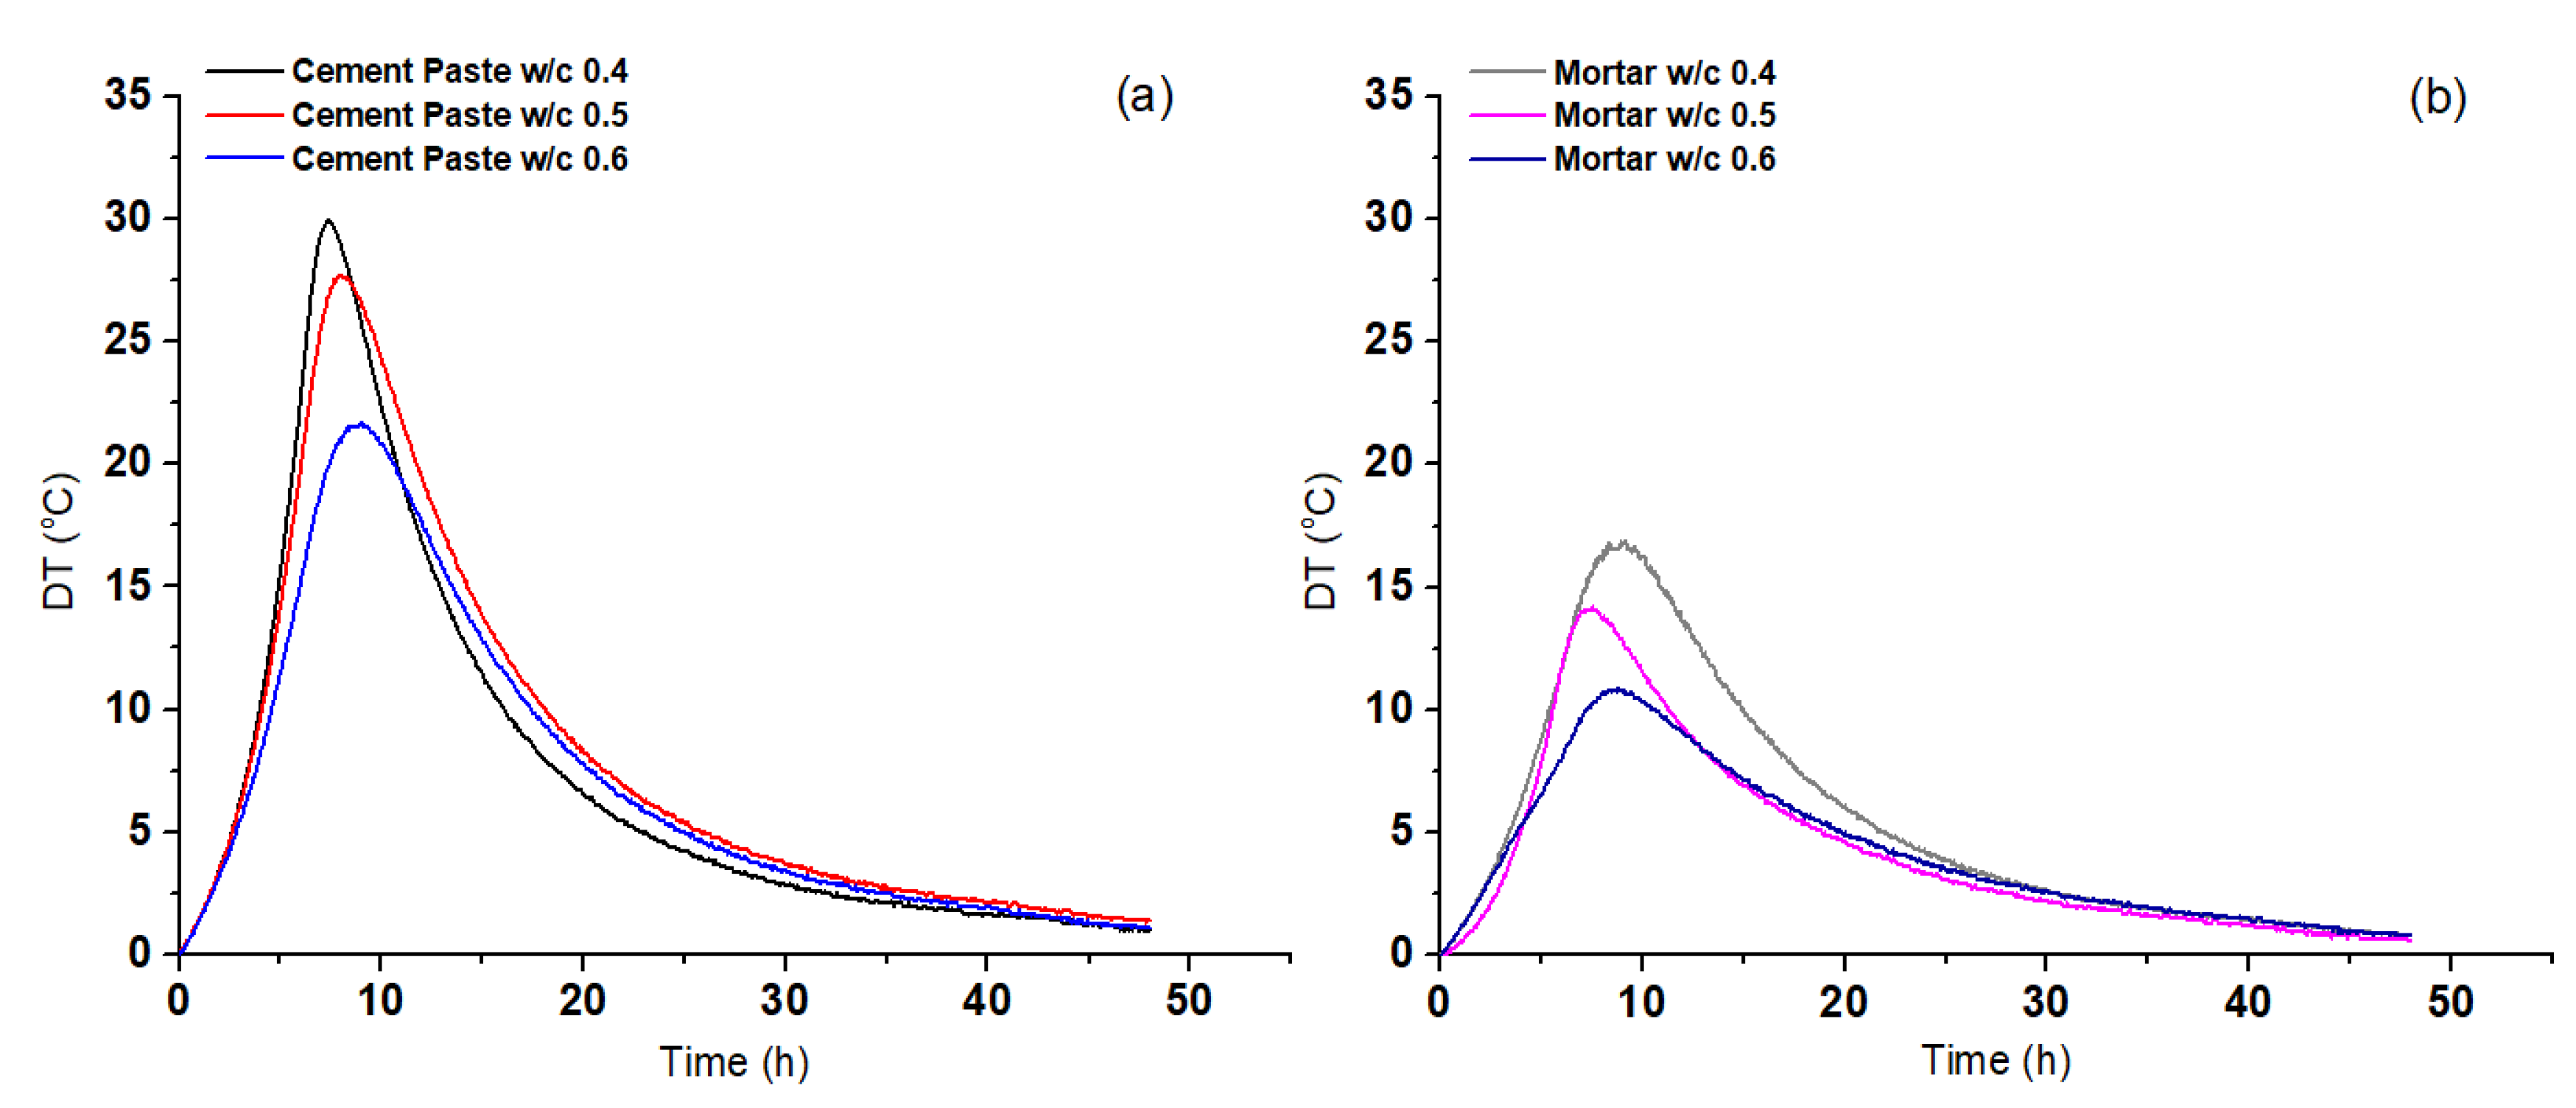
Figure 6 shows the temperature variation during the cement paste hardening process. It was observed that the peaks of temperature curves for cement paste specimens were higher than those for the mortar specimens. It is widely known that the chemical reaction of cement-water is an exothermic reaction. The higher value of temperature shows that more cement reacts with water, for the same period of time, which leads to the release of more heat. This result was completely expected because for the same volume of a specimen, double the amount of cement was used for the tests that included cement paste. In addition, it was observed that the released temperature was higher for specimens with lower w/c ratios. As the w/c ratio goes up the temperature-released decreases, as the case with the strength diagrams. This shows that the energy released is directly related to strength properties.
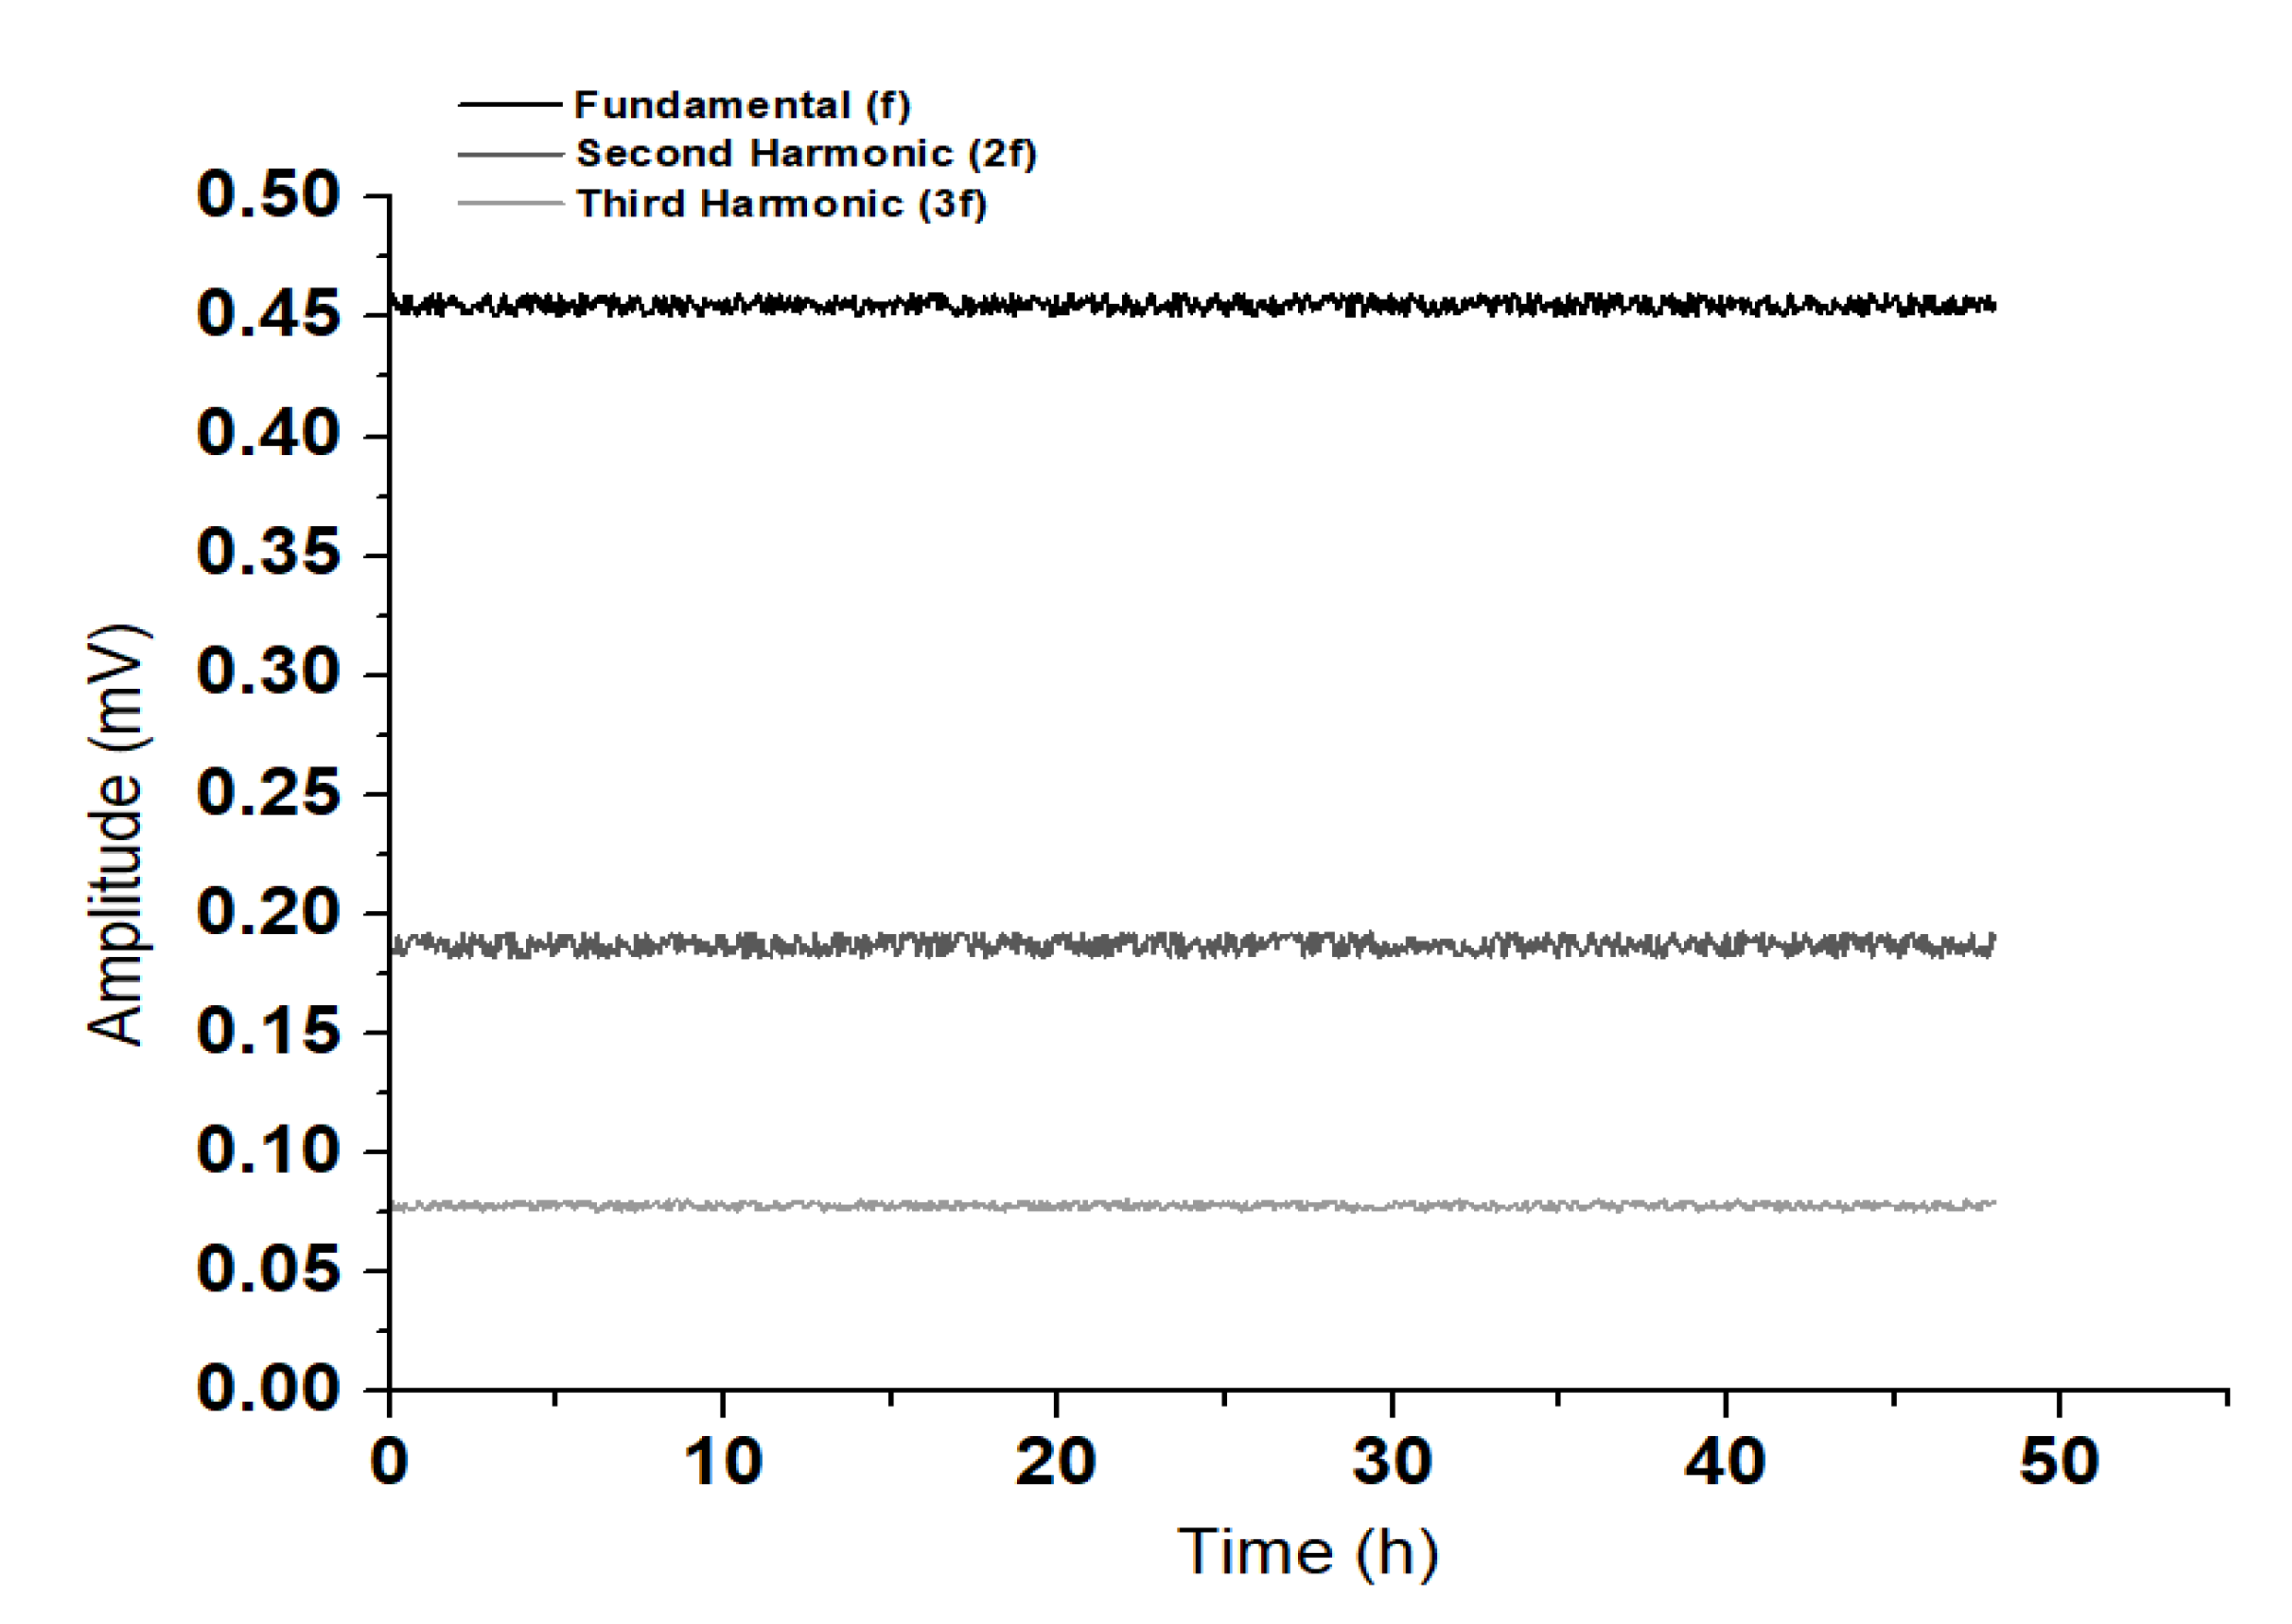
Any reliable measurement of nonlinear acoustic behavior should be based on the use of time stable and linear experimental devices. This is essential in order that the measured harmonic amplitudes and related nonlinearity parameters reflect the material intrinsic nonlinear elastic behavior rather than artificial harmonic generation produced by the measuring electronics.
Therefore, since the measurement required a relatively long time, the stability of the system over a period time of 48 h was assessed. This 48-h test was performed in an already 28-day hardened specimen with the same dimensions, and the results about the system’s stability are shown in
Figure 7.
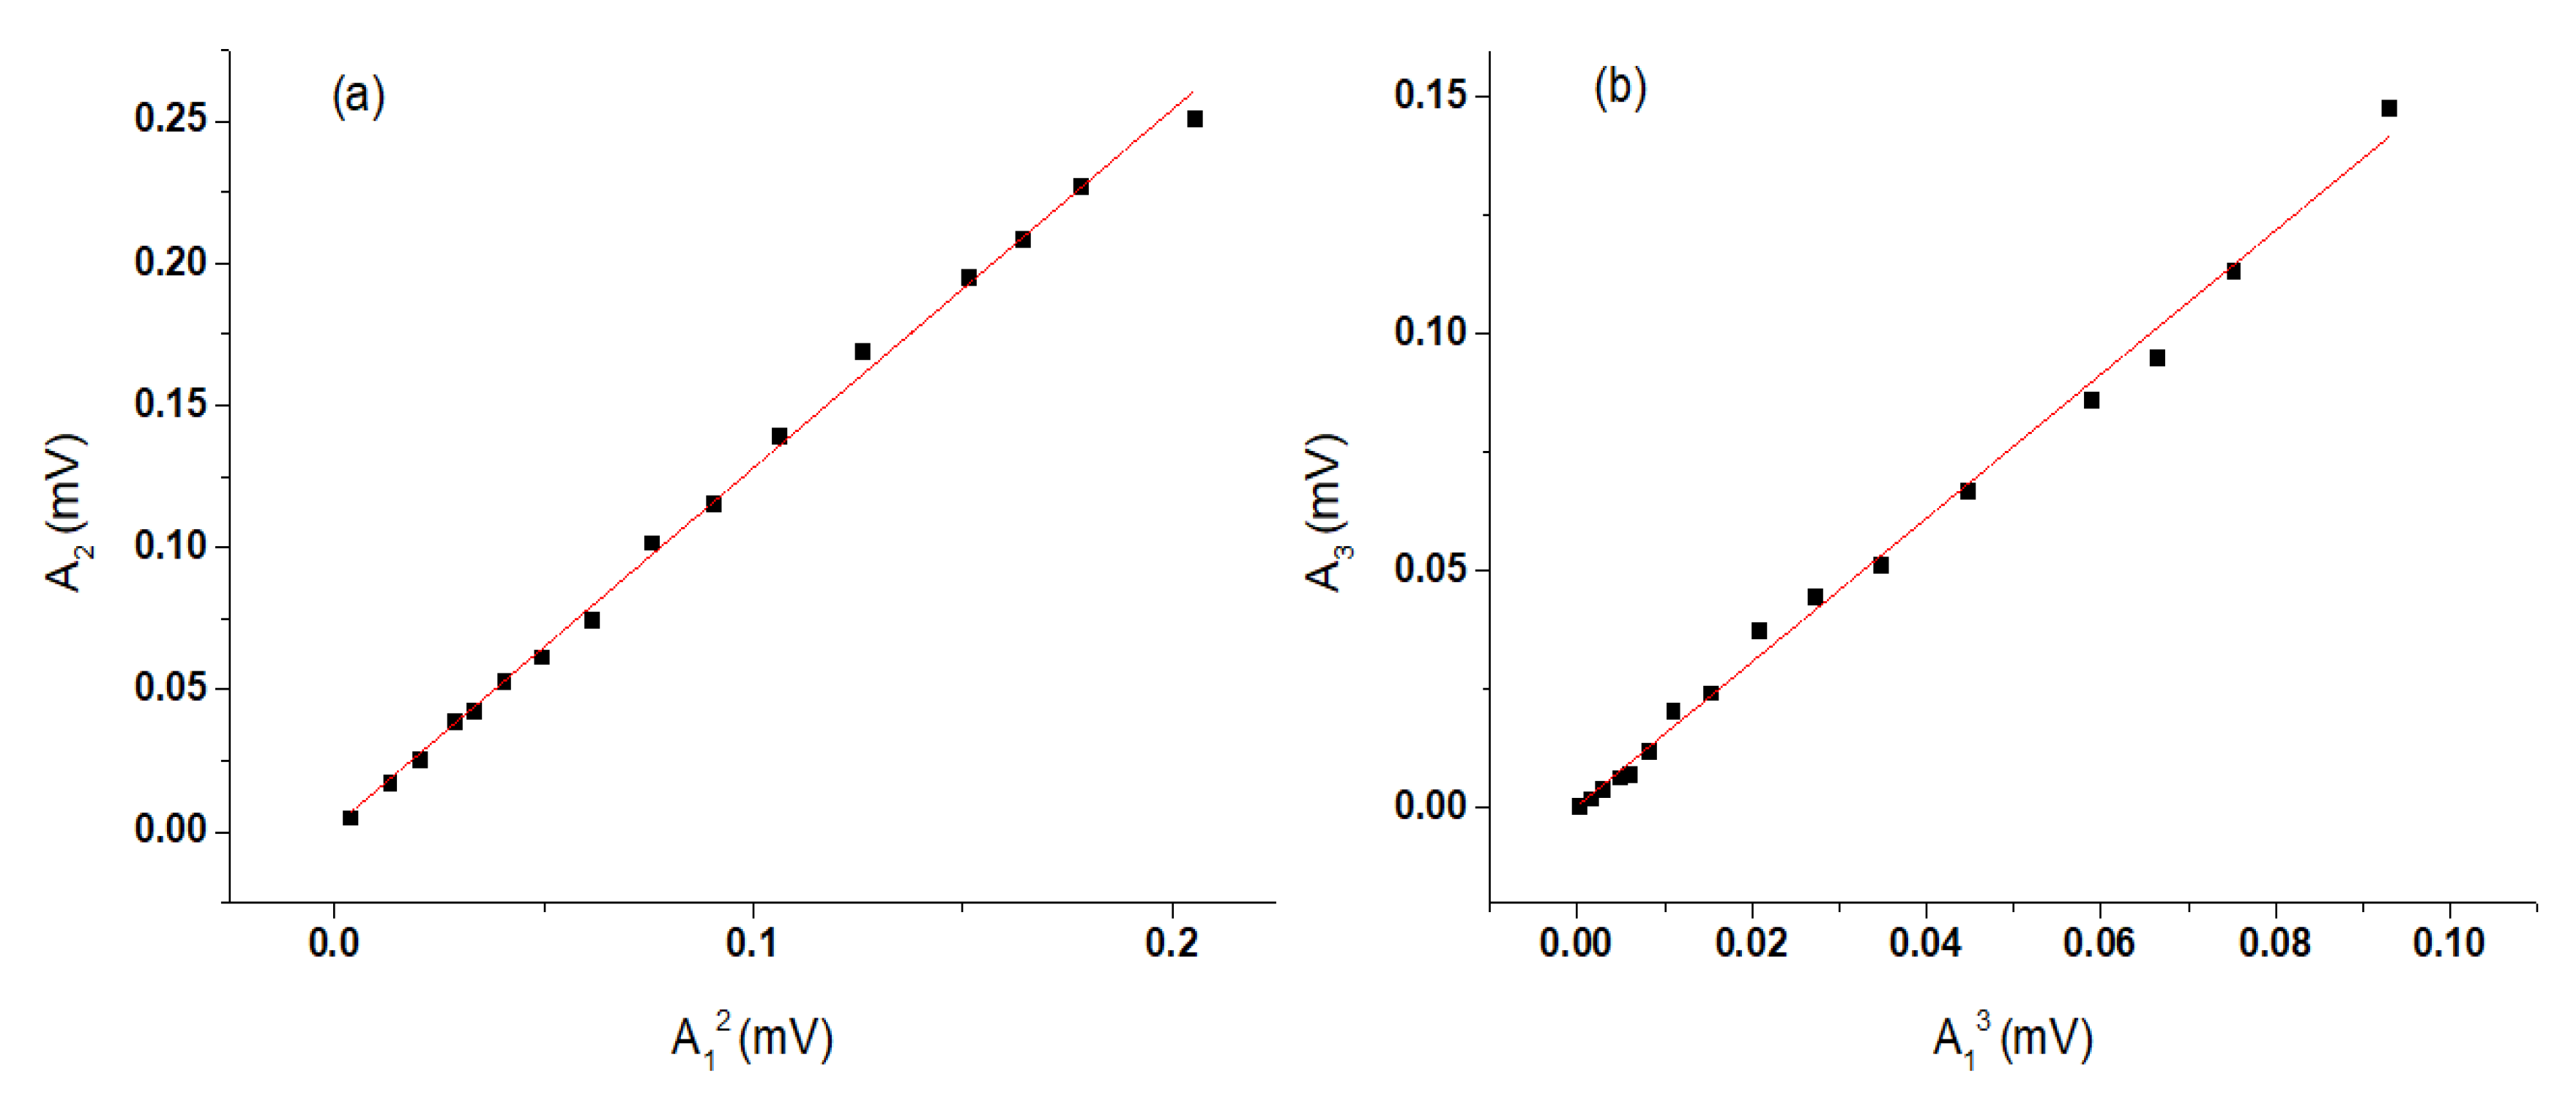
In addition, it had to be verified that the measuring system was linear. Otherwise, it would be impossible to distinguish whether the nonlinearity data were due to the material under investigation or were coming from the system itself. The results below demonstrate that the experimental system used in this study was fully linear and did not create any harmonics.
The nonlinearity parameter β was calculated based on the equalization A
2 = β
2A
12 (for the second harmonic) as well as on A
3 = β
3A
13 (for the third harmonic) [
37,
39,
45,
46,
47,
48,
49]. Based on the above acceptance, it is clear that the amplitude ratio, defamed as the nonlinearity parameter, A
2/A
12 should have a single slope because other factors such as the length of the specimen and the ultrasonic frequency used remain constants throughout the experiment. For this reason, the following simple experiment was performed. In a 28-day hardened mortar specimen, the amplitudes of fundamental and harmonics oscillations were measured by modifying the input voltage to the transmitting probe. If the system itself has nonlinear behavior responding to an input signal, then the slope A
2/A
12 would not be linear [
37]. The results regarding the linearity of the experimental system used in this study are shown in
Figure 8. It is demonstrated that the equipment that is used in the present study is linear.
Earlier studies [
1] tried to record the harmonic oscillations but this was only possible after a lot of time, 28–30 h later. In this study, we were able to obtain measurements at a much earlier time, generally in the fluid phase, when the attenuation is too high and measuring the harmonics becomes difficult. This difficulty was overcome, but it was not entirely eliminated, using the High Power Pulser (RPR-4000). Through the nonlinearity parameter, and during the hardening process, there was an indication of the way the micromechanical structure changes. As it was mentioned before, during the first few hours, the attenuation was too high, nevertheless, the chemical activity inside the material was developing, hence a sharp decrease of nonlinearity parameters was observed. This was attributed to the micromechanical connection of the particles. In this phase of hydration, the capillary pore filling is created and the creation of shrinkage microcracks can be activated by longitudinal waves [
50].
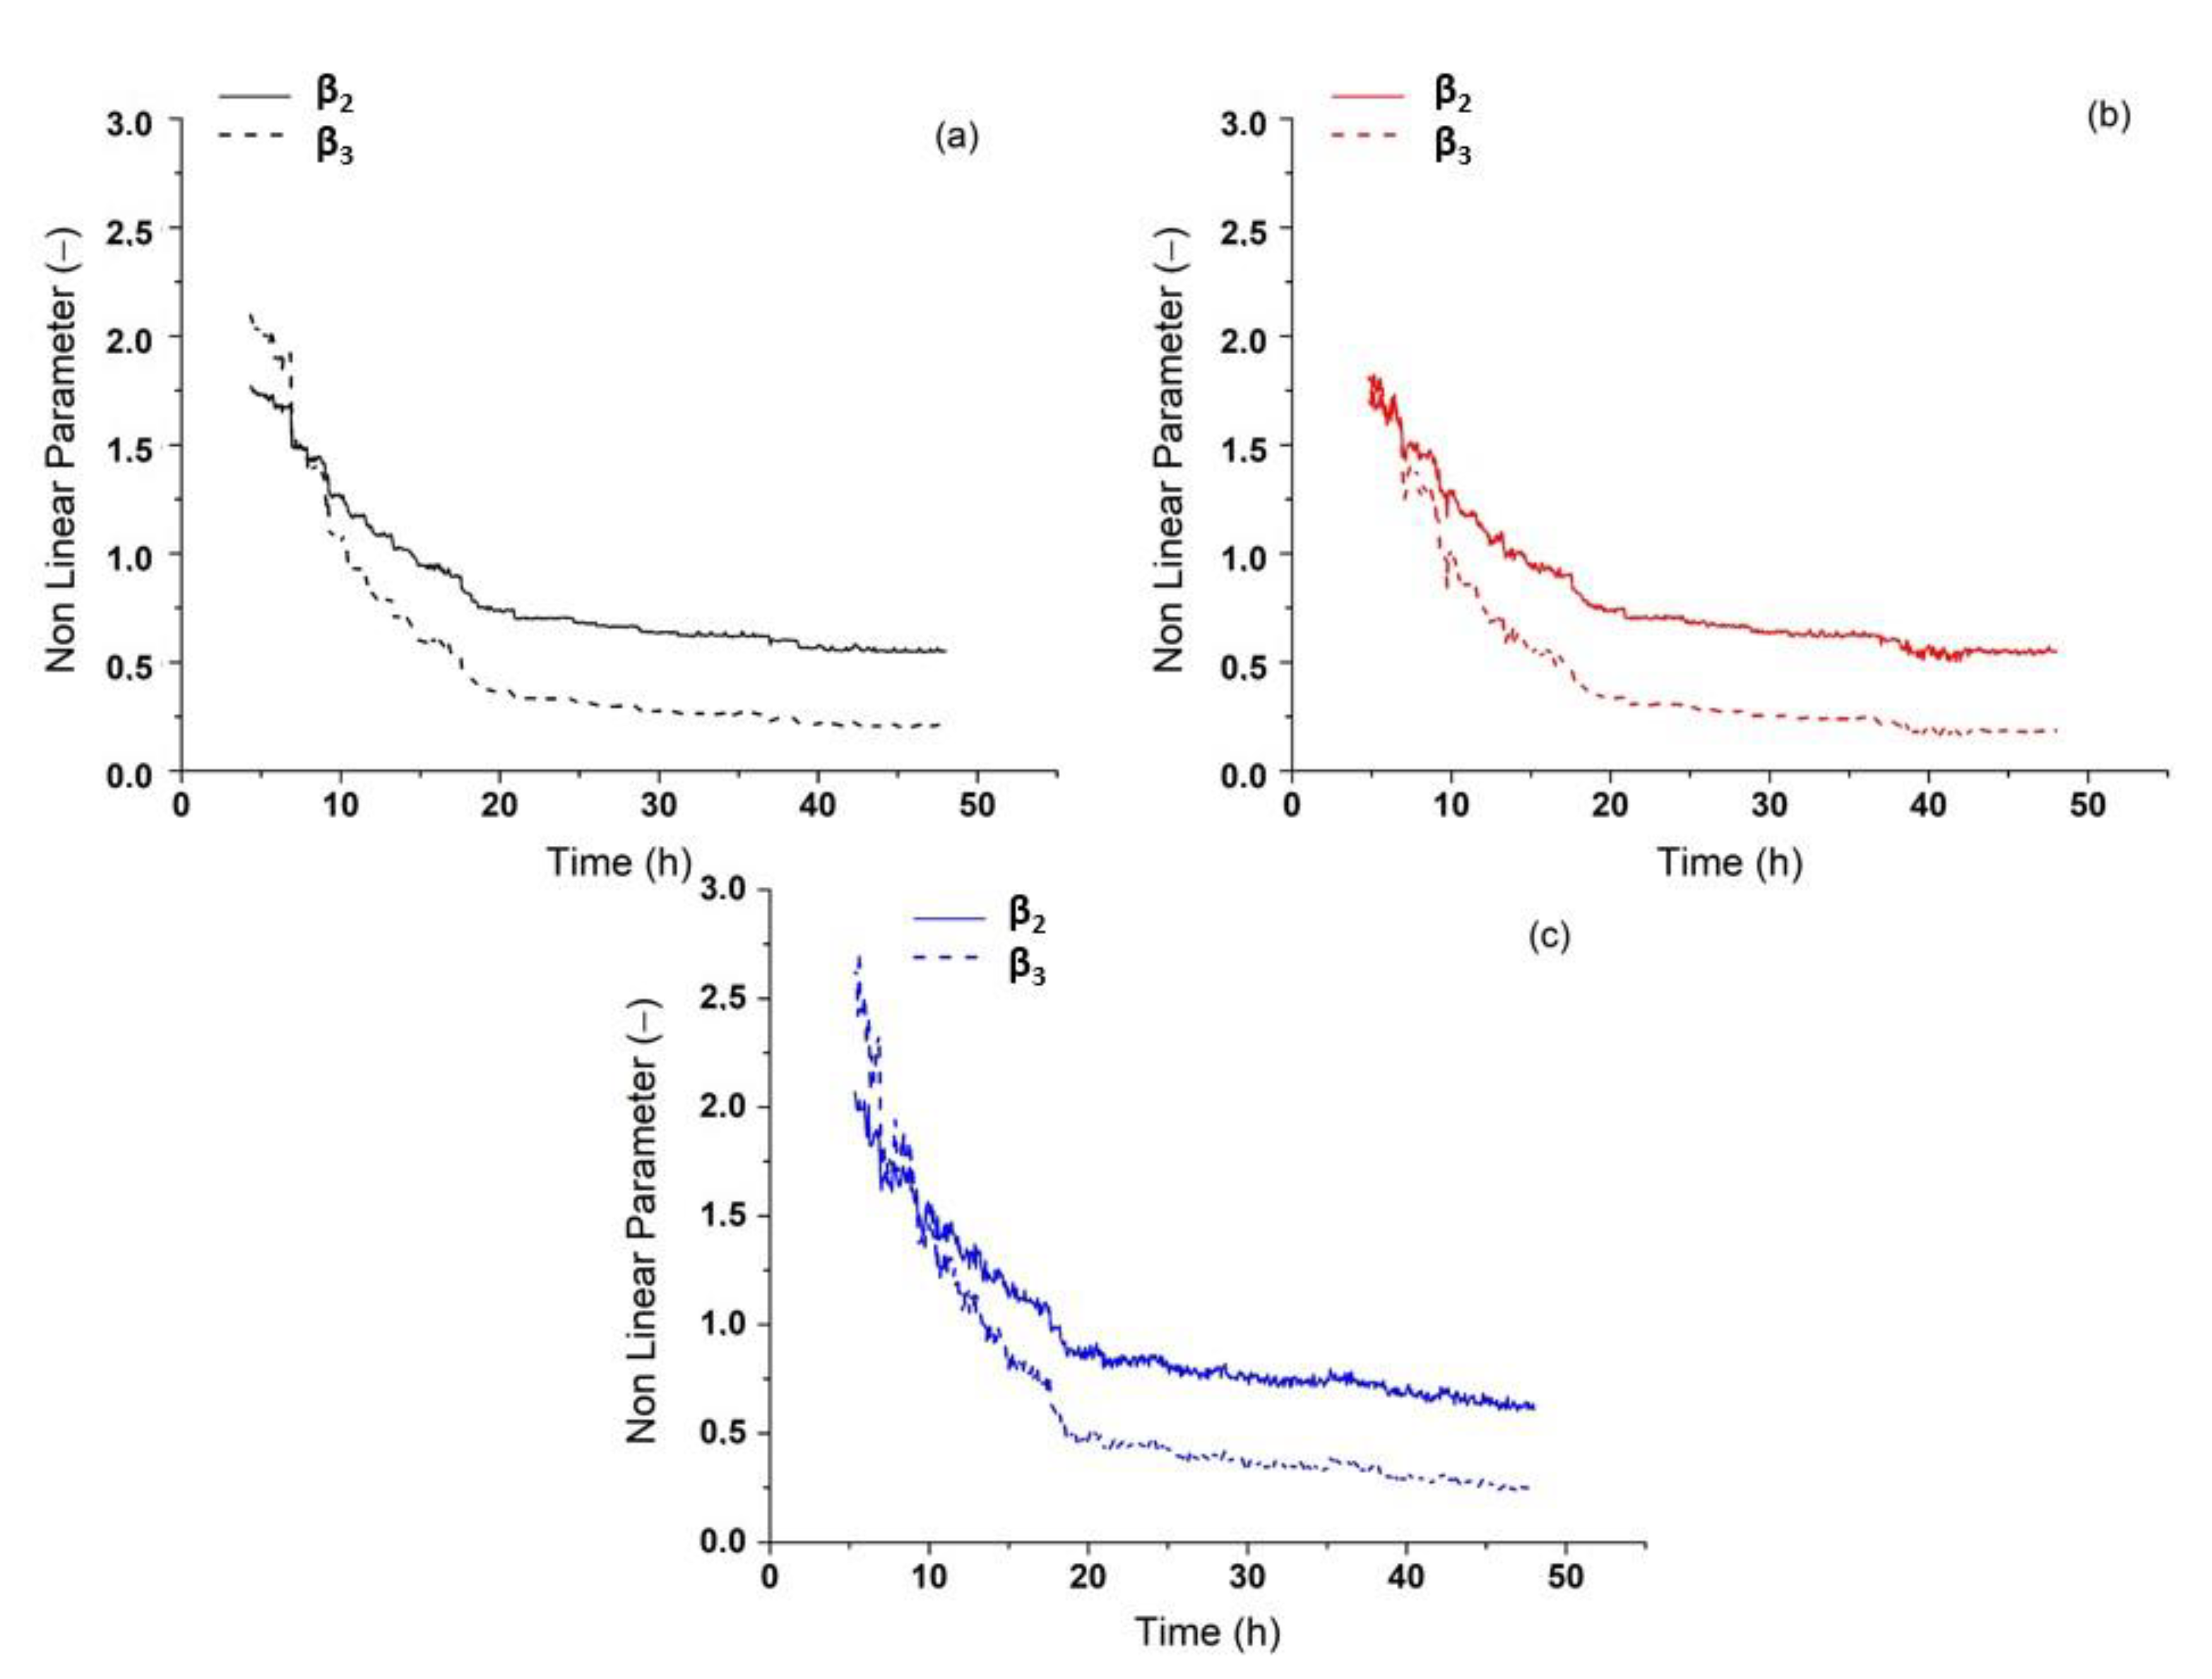
Figure 9 shows the typical monitoring results of nonlinearity parameters β
2 and β
3 of cement paste for all w/c ratios.
During the first 20 h the non-linear values were higher; of the order of approximately 2.3 and approximately 1.83 for β
2 and β
3 respectively, compared to the following hours where a stable value of approximately 0.52 and 0.25 was obtained for β
2 and β
3 respectively, with slight decreases as the hours increased. In fact, the changes of the third harmonic parameter were much more pronounced, which shows that the third harmonic oscillation (related to the third-order elastic constant) is much more sensitive to the microstructural changes of the material. During the first few hours when micromechanical changes occur in the fresh paste, the sample undergoes progressive mechanical setting (such as mechanical shrinkage), and also the chemical reactions in the material are rapid. After this phase, those changes are less dramatic. The results of mortar samples were similar to those of cement paste samples.
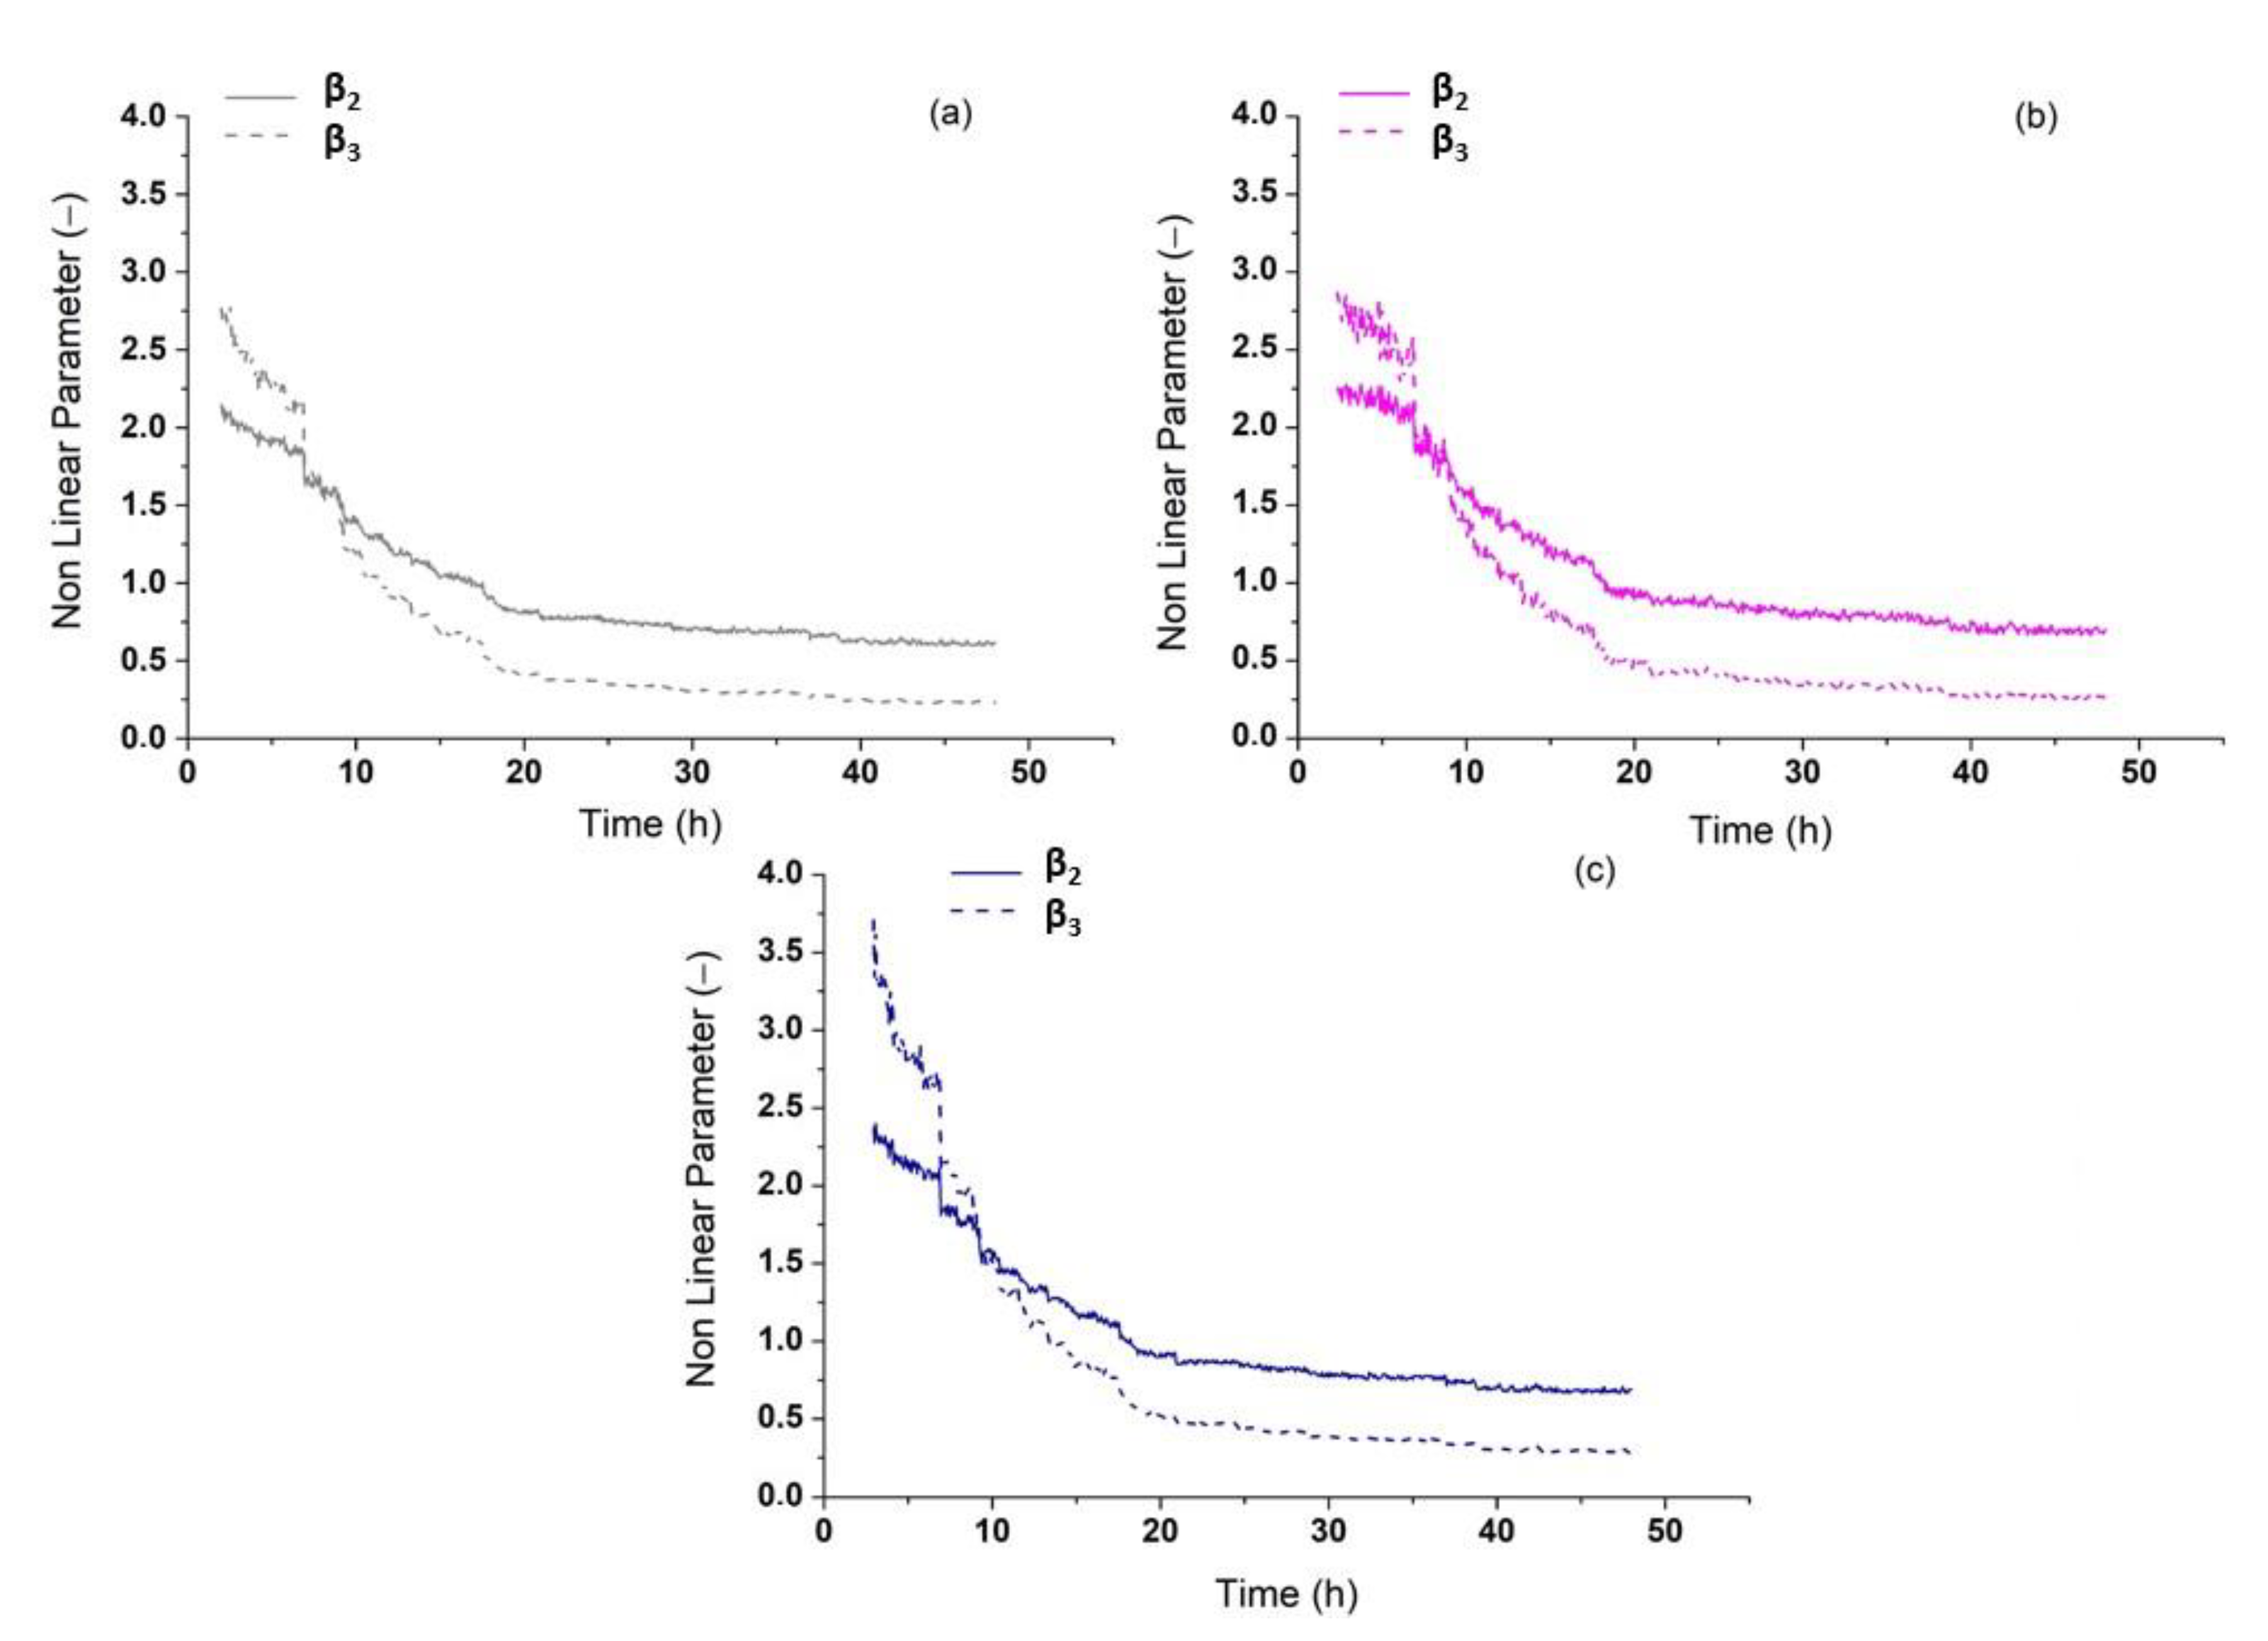
Figure 10 shows a typical result of nonlinearity parameters β
2 and β
3 monitoring of mortars for different w/c ratios.
Figure 10 and
Figure 11 show that the changes in nonlinearity for mortar samples are higher than those in paste samples. This is because a greater amount of the created capillary pores occur in mortar than in cement paste, which affects the harmonics oscillations. Finally, the nonlinearity parameter tends to become steady after 20 h, since the mixture is already solidified.
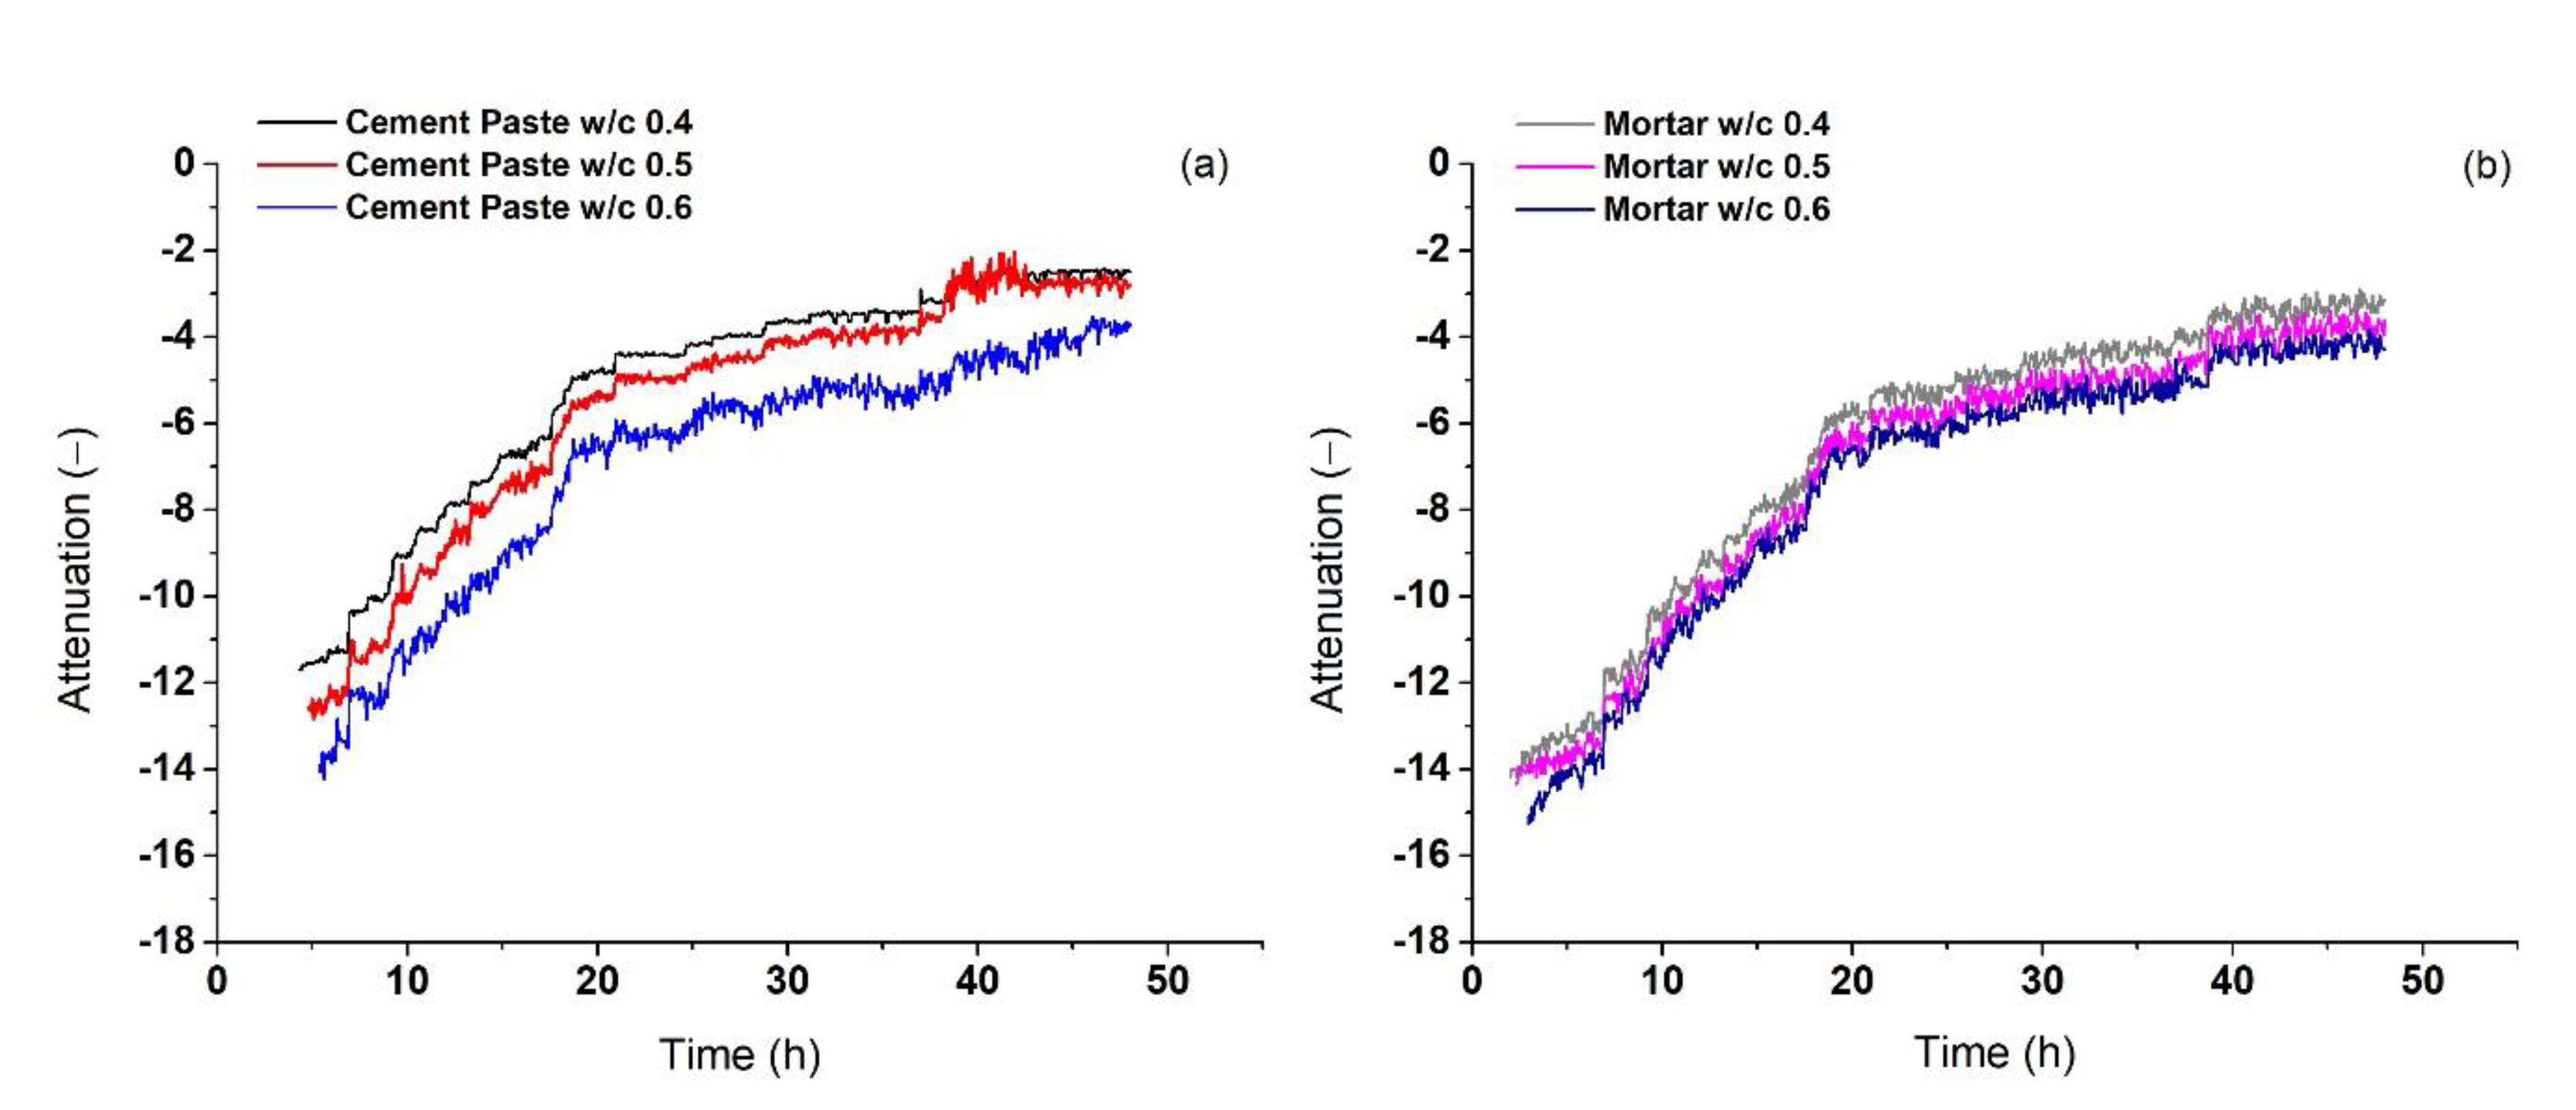
Figure 11 depicts the attenuation of fundamental oscillation, calculated using the equation 20 log (A
1/A
0). The evolution of the attenuation coefficient index for all the kinds of tested specimens follows a similar trend. They present a sharp increase, at the very early age, in about the first 20 h and then the changes in the attenuation coefficient become smoother. The changes in attenuation happen because of the formation of some hydration products; mainly alumina, ferric oxide, and trisulfate as the mortar/cement paste harden. These products fill the capillary pores and thus reduce the scattering. Therefore, the attenuation coefficient index, as well as the nonlinearity parameters are more sensitive in comparison to the wave velocity.


