
Study and Improvement of Acoustic Conditions in Public Spaces of Shopping Malls


1
Theoretical Department, Andreyev Acoustics Institute, 117036 Moscow, Russia
2
Power Engineering Department, Bauman Moscow State Technical University, 105005 Moscow, Russia
3
Acoustic Consulting Department, Acoustic Group, 115054 Moscow, Russia
Acoustics 2021, 3(1), 137-155; https://0-doi-org.brum.beds.ac.uk/10.3390/acoustics3010011
Submission received: 25 January 2021
/
Revised: 16 February 2021
/
Accepted: 19 February 2021
/
Published: 22 February 2021
(This article belongs to the Special Issue Indoor Soundscape: Integrating Sound, Experience and Architecture)
Abstract
:Acoustic comfort in shopping malls is one of the aspects that influence the shopping environment. Making enjoyable and comfortable retail and public spaces is demanded when designing and managing properties. This paper focuses on the study of the public spaces with a large volume in the operating malls, which are perceived as acoustically uncomfortable. The main reason for poor acoustic conditions is a too long reverberation, as the measured reverberation time reached 4–5 s at middle frequencies. The usual way to improve the acoustics is to apply sound-absorbing materials on space surfaces. Two examples of improving acoustic conditions in food courts are given. In both cases, the reverberation time was reduced by about half, and changes in acoustics were considered significant and positive. It is shown the Sabine’s equation is valid for considered spaces. Average absorption coefficients are found by means of the Sabine’s equation and can be used for quick estimation of the reverberation time in similar spaces without the absorbing treatment. Based on the analysis of this and other studies, a method for qualitative assessment of the public space acoustics is proposed.
Keywords:
acoustic comfort; reverberation time; noise; shopping mall; public spaces; food court; soundscape1. Introduction
Success of the retail industry is strongly connected with an enjoyable and comfortable shopping environment. A range of physical characteristics such as lighting, indoor air quality, thermal comfort, interior layout, and acoustics have an impact on employees and shoppers. Most retail sounds are inappropriate and accidental and have a dramatic effect on sales. When experiencing a dreadful sound in a store, a significant number of customers are inclined to leave faster or not even enter at all. According to [1,2] bad retail soundscapes can lead to a 28% decrease in sales. On the other hand, the revenue of retail shops can go up by 5–10% when the acoustic environment is optimized. A particular problem occurs in large public spaces where a lot of people can meet, communicate with each other and make too much noise. Some shopping mall owners and managers recognize these features and therefore pay attention to the acoustics during the design of new malls or try to improve the acoustics of operating ones.
Different retail spaces have been considered in the literature [3,4,5,6]. A large-scale subjective survey of six shopping malls conducted by Meng et al. [3] determined the influence of the social and behavioral characteristics of users on their evaluation of subjective loudness and acoustic comfort. It showed that income, education level, occupation, reasons for visit, frequency of visit, and length of stay influenced the evaluation, whereas gender and age were statistically insignificant. There was no significant difference between the different space types of shopping malls. Meng et al. [4] also investigated the sound environment in underground shopping spaces, taking into account many physical factors including sound pressure level, air temperature, relative humidity, luminance and visual aspect. They found that the subjective evaluation of the acoustic comfort was higher in square-type than in street-type spaces.
Sound pressure levels are primarily used for objective evaluation of the acoustic environment. They depend on both ambient noise and noise induced by people. Usually, in large spaces human noise dominates; there are several known models [7,8,9] for prediction of the noise level due to many people speaking in a room. The noise level depends on the number of speaking persons, the room sizes, and the equivalent absorption area [8]. So the sound pressure levels cannot be considered as the acoustic characteristic of a room itself. These characteristics are only room acoustic parameters, in particular the reverberation time, which is directly related to the equivalent absorption area.
Loudness is an indicator frequently used to evaluate the acoustic conditions in different spaces. Many papers inform about noise impact in shopping malls including atria and food courts [4,5,6,10,11,12,13,14]. Because of their large volume and occupancy, they are almost always the nosiest areas in the malls and the most critical from an acoustic point of view. Ordinarily the sound pressure level is 70–80 dB(A) in the occupied spaces and sometimes can reach much greater values [14].
The important issue is the comfort and health of employees working for long periods in shopping centers. Alnuman and Altaweel [6] studied noise variations in occupied public spaces at different times of the day over a period of one week and their correlation to the subjective acoustic comfort and the experience of loudness of the staff working at these locations. They showed a stronger direct relationship between the reverberation time and the subjective rating of loudness.
If the spaces have no special acoustic treatment, the reverberation time is too long [5,10,12,15]. Nowicka [16] proposed an easy-to-use assessment of different types of commercial spaces, which focuses on the reverberation time and other parameters related to speech intelligibility. Acoustic quality is characterized by an index depending on a set of architectural and acoustic parameters. The spaces with a large volume (>4000 m3) and long reverberation time (>2.5 s) have satisfactory or poor acoustic quality. Although the method is intended only for architects or designers and based on very common information about a room, it points out the potential hazards of bad acoustics. Architects and designers should always take it into account and introduce relevant modifications of architecture and acoustics.
Commonly poor acoustic conditions in shopping mall spaces are only understood after a few months or years of operation. This paper contains a survey of the results of objective acoustic evaluation of several public spaces in operating shopping malls located in different Russian cities. Section 2 contains description and geometrical characteristics of studied public spaces. Results of on-site measurements and their analysis are given in Section 3. In all cases the main problem is too long reverberation, which can be solved by means of sound-absorbing treatment. In two cases such solutions were applied in food courts and their acoustics were significantly improved (Section 4). A quality assessment of the acoustics is required for both the designed and operating spaces. In Section 5 a scale for the reverberation time based on the presented results is proposed for an objective evaluation. Presented results are discussed in Section 6.
2. Studied Public Spaces
Shopping mall spaces with a lot of people usually have poor acoustic comfort because of high noise levels. The largest spaces are located in the center part of the shopping mall and contain restaurants and a sitting area for food stores. Almost all visitors go to the food court and spend some time there. Due to the uncomfortable conditions the visitors may feel tired and leave the mall earlier than they planned. For this reason, designers, marketing specialists and owners are trying to create the most comfortable spaces for everyone. So the first type of public spaces in the malls surveyed in this paper is the food court.
The second type is long corridors or galleries in which walls are glass facades of numerous stores. The galleries often contain boutiques, small cafes and local areas for short rest. Shoppers spend less time here than at the food courts, but the acoustic environment may affect people’s behavior as well. So acoustics of the galleries attracts the attention of specialists who create the atmosphere of shopping malls.
2.1. Food Courts
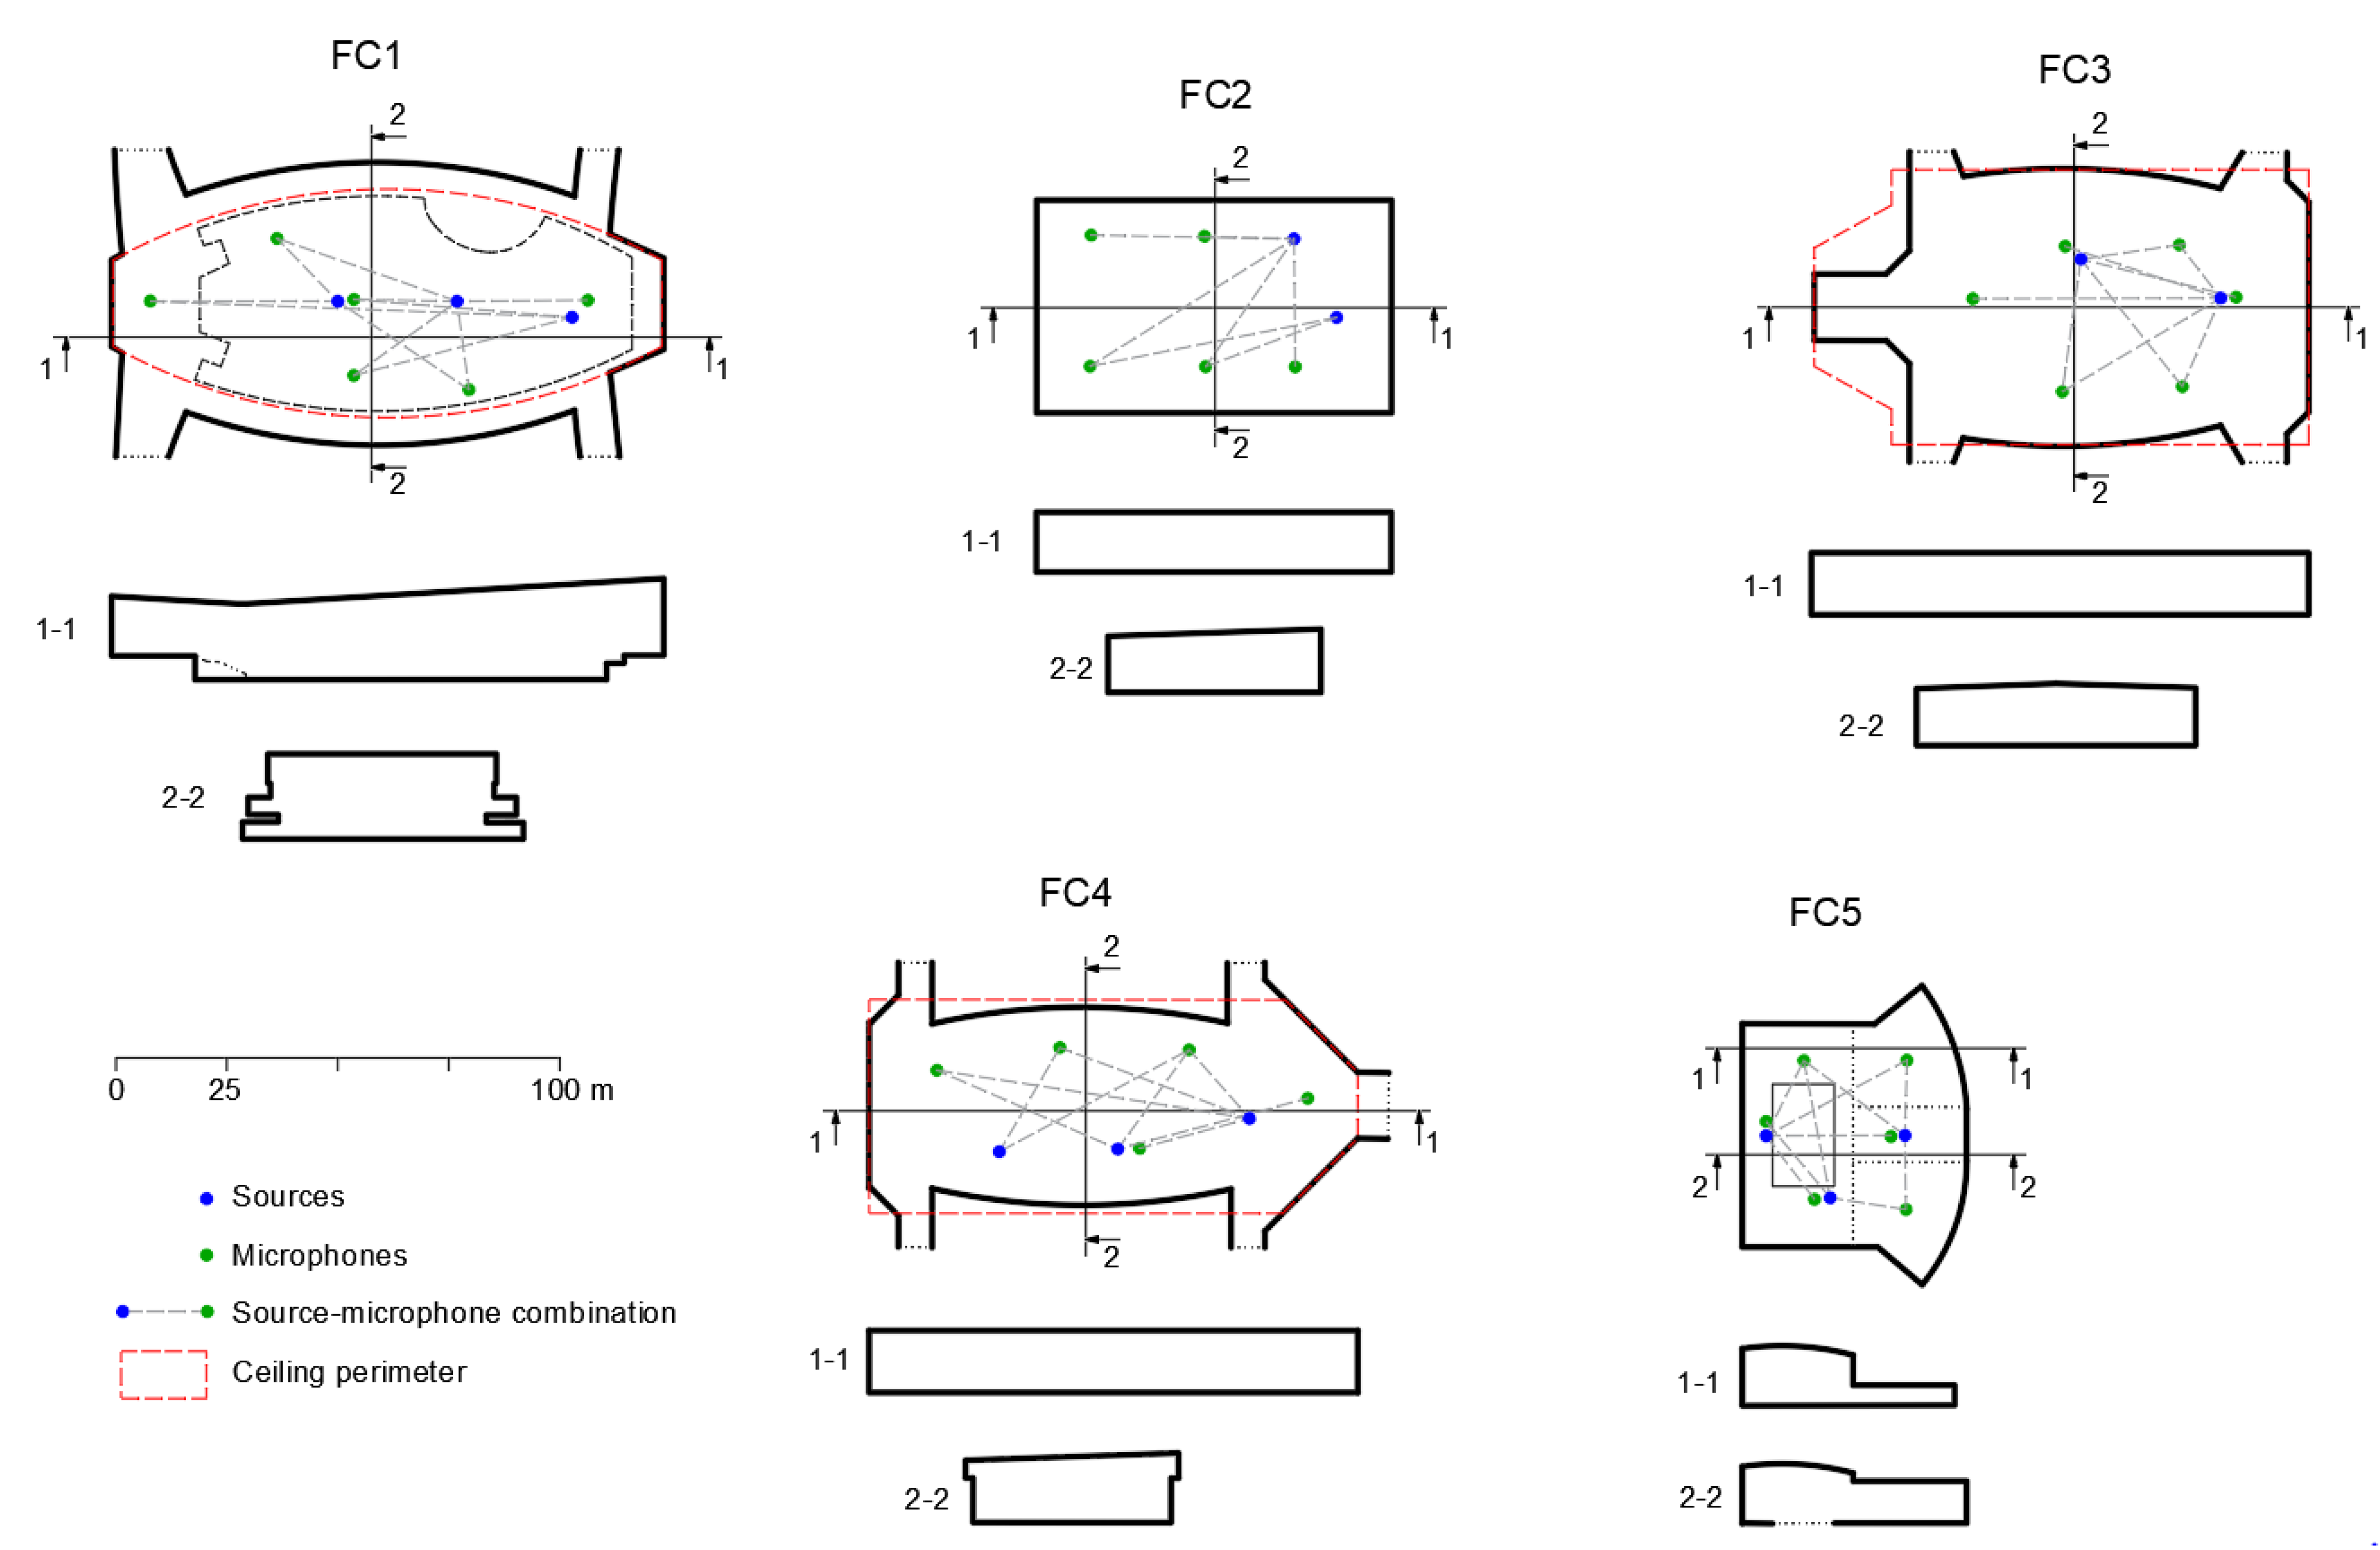
Acoustics of the five food courts in different shopping malls were evaluated. Sketches of their plans at the main floor level and sections are shown in Figure 1. All food courts have different forms, and ratios between horizontal dimensions and height are similar. The height is much smaller for both the length and width, which corresponds to their acoustic similarity. The main geometric characteristics are given in Table 1.
The food court FC1 has the largest volume, which exceeds 100,000 m3. Due to the height exceeding 17 m there are two levels. The first one is an ordinary food court with a seating area surrounded by food service stores, and the second one with small shops is on the balcony shown by the black dotted line in Figure 1. The shape of the ceiling does not match the shape of the floor and is shown by the red line. The space FC1 is connected to four galleries, which are parts of a shopping area.
The food court FC2 has the simplest form, and it is almost rectangular parallelepiped. Only the ceiling is not parallel to the floor and the angle between them is about 2°. The food courts FC3 and FC4 look like FC1, but their heights are smaller. There is only one level with food stores and shops. We can see that the ceiling shapes are different from the floor shapes as well.
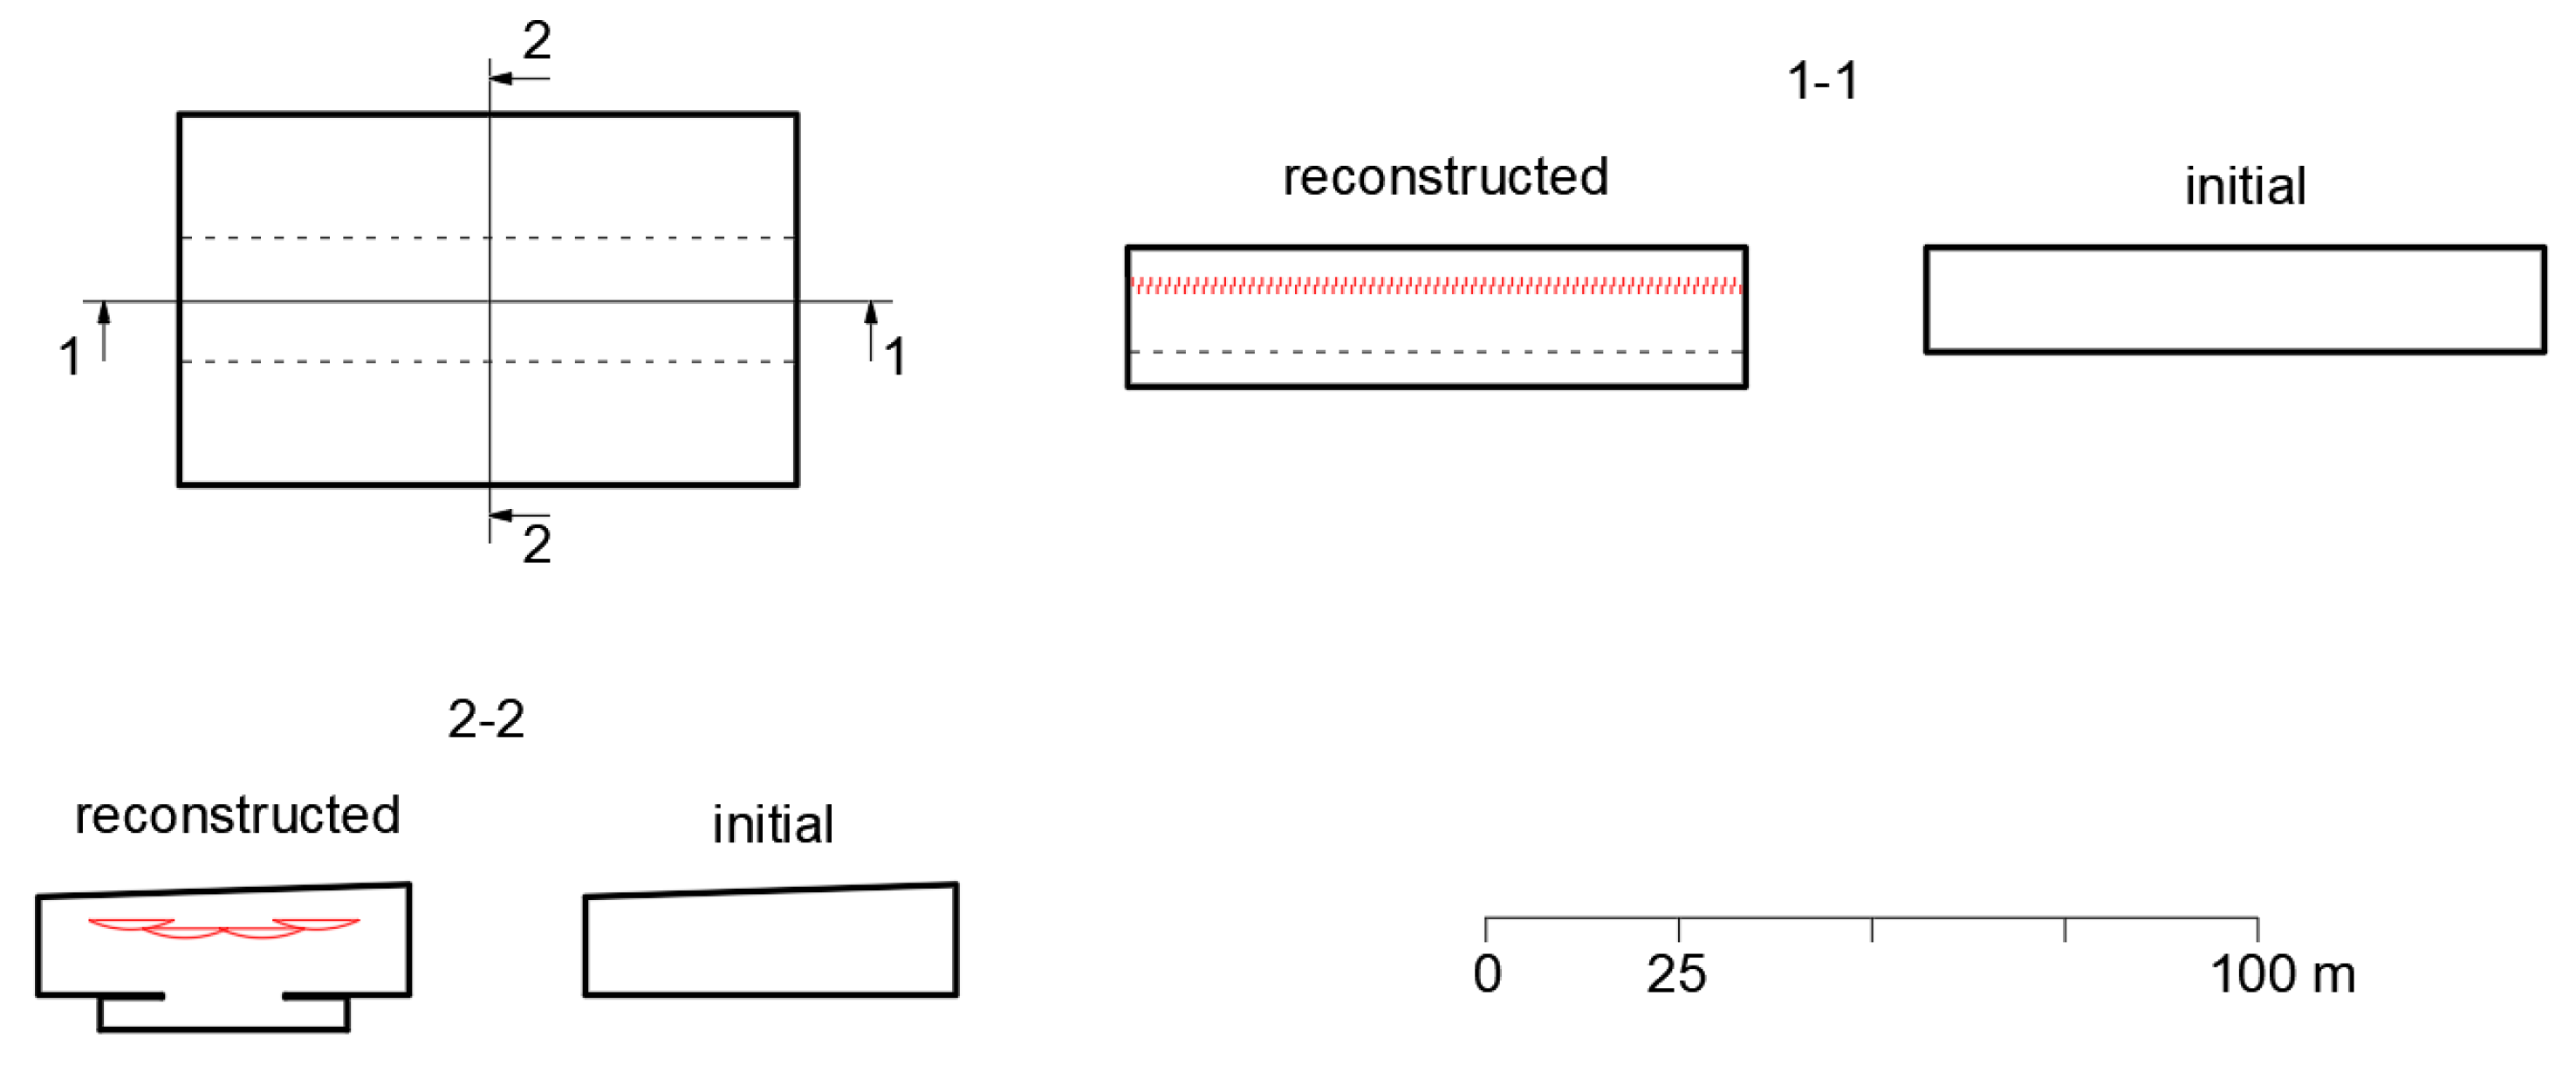
The smallest food court FC5 has the most complex form. There are three levels of the ceiling divided by the dotted lines in Figure 1. The highest one is approximately 13 m and has a curved shape, as shown in the left part of 1-1 and 2-2 (Figure 1). The second level of 9 m height is shown in 2-2 (Figure 1), the area here is used for entertainment events. The lowest ceiling of 4 m height we can see in the right part of the sections 1-1, which is the seating area. Beside it there is an opening in the floor that connects the food court with the space of the lower floors.
All food courts have similar surface finishes. The floor is made of granite tiles, and the floor is covered with carpet only in the playing areas. The ceiling surface is profiled metal sheets laid on metallic structures, which are usually used for light roofs. The walls are covered by decorative panels made of thin metal, gypsum boards, glass, high-pressure laminate panels (HPL) and medium-density fiberboard (MDF) panels. All furniture is hard; tables, chairs and decorative elements are made of plastic, wood, metal and other hard materials.
A common feature of all food courts is the absence of sound-absorbing surfaces on the ceiling and walls. This is the reason for the long reverberation making the spaces acoustically uncomfortable. Special subjective evaluation of the acoustic conditions and their effect on visitors and workers, such as a questionnaire, was not carried out. However, the bad acoustics of the spaces was too obvious for the management of shopping malls, so they initiated acoustic surveys to find objective parameters.
2.2. Galleries
The second type of the studied public spaces in shopping malls was galleries, which are corridors connecting different areas of the mall. The long walls of the galleries consist of store facades made of glass. Three galleries in different malls were studied; their plans and cross sections are shown in Figure 2, and their main geometrical parameters are given in Table 2. As we can see, they are long enclosures with almost square cross sections. The length varies from 112 to 234 m, the cross-sectional dimensions are 10–15 m, so the ratios of the length to the width or height are more than 10.
The gallery G1 has entrances at its ends connecting the gallery with a food court and another gallery. The galleries G2 and G3 have two connections with galleries similar to G1 at the side walls. The connections are indicated by triangular extensions in Figure 2. Part of the ceiling of the gallery G3 marked by a blue hatch is made of glass for natural light during the daytime.
As in the food courts, sound-absorbing finishing materials are not applied in the galleries. The ceilings are made of sheet metal, the lower parts of the walls are glass, and the upper parts are covered by hard panels. The main area of the floor is free of any furniture; there are only small island stores and cafes, advertising stands and decorative elements.
3. Acoustics Measurements
The reverberation time can characterize the acoustic conditions of a space itself. The main goal of this survey was to evaluate room acoustics, so measurements were focused on the reverberation time. However, the sound pressure levels were measured in one food court, and these results are presented here as well.
3.1. Method
The reverberation time was measured in all spaces in accordance with the requirements of ISO 3382 for the engineering level of accuracy [17]. It means that sound sources, sound receivers, their locations, as well as the number of measurements were selected in accordance with the recommendations of [17]. The measurements were carried out in a non-occupation mode in the night time after the closing of the mall.
Firecrackers were chosen as impulsive sound sources to simplify the measurement procedure. Sound emission by the firecrackers has been studied [18] and compared with traditional and alternative sound sources [19]. They have the omnidirectional directivity even at high frequencies, cause high sound pressure levels in a wide frequency range. Almost all features of firecrackers completely fulfill requirements [17], and they are the best sound sources excluding dodecahedron speakers [19]. Before on-site measurements many different types of the firecrackers were tested; one of them was selected. It provided the biggest amplitude of the sound impulse, the widest frequency range and the least amount of smoke. Only in some cases the radiated sound power was not sufficient to find T30 at 125,250 and 500 Hz, whereas T20 was measured at all frequencies. Positions of the sound source are shown in Figure 2 and Figure 3.
Room impulse responses were recorded by means of an omnidirectional receiver positioned as shown in Figure 2 and Figure 3 by blue points. The receiver was a ½″ free-field pressure microphone VMK-205 produced by Vibropribor LLC (Yaroslavl, Russia). The condenser microphone with 200 V polarization voltage had a nominal sensitivity of 50 mV/Pa, a frequency range (±1.7 dB) of 20–5000 Hz, a dynamic range upper limit of 146 dB. The signals were recorded using a data acquisition system integrated into a sound level meter Ecophysica-110A produced by Octava-Electrondesign (Moscow, Russia). The recorded files were analyzed using Easera software by AFMG (Berlin, Germany).
Both the source and the microphone were at height of 1–1.5 m from floor level. Note that not all possible combinations of the source and microphone were used because of the time limit for making measurements, and combinations with nearby sources and microphones were not used as well. Also a few responses were excluded from the analysis due to errors detected during post-processing. Used source-microphone combinations in the food courts are marked in Figure 1. It was possible to use all combinations in the galleries excluding nearby positions. Table 3 contains the numbers of the source positions, the microphone positions and the analyzed responses.
The values of T20 and T30 were calculated for each impulse response by ordinary technique [17] and used in further analysis.
3.2. Reverberation Time
3.2.1. Measured T20
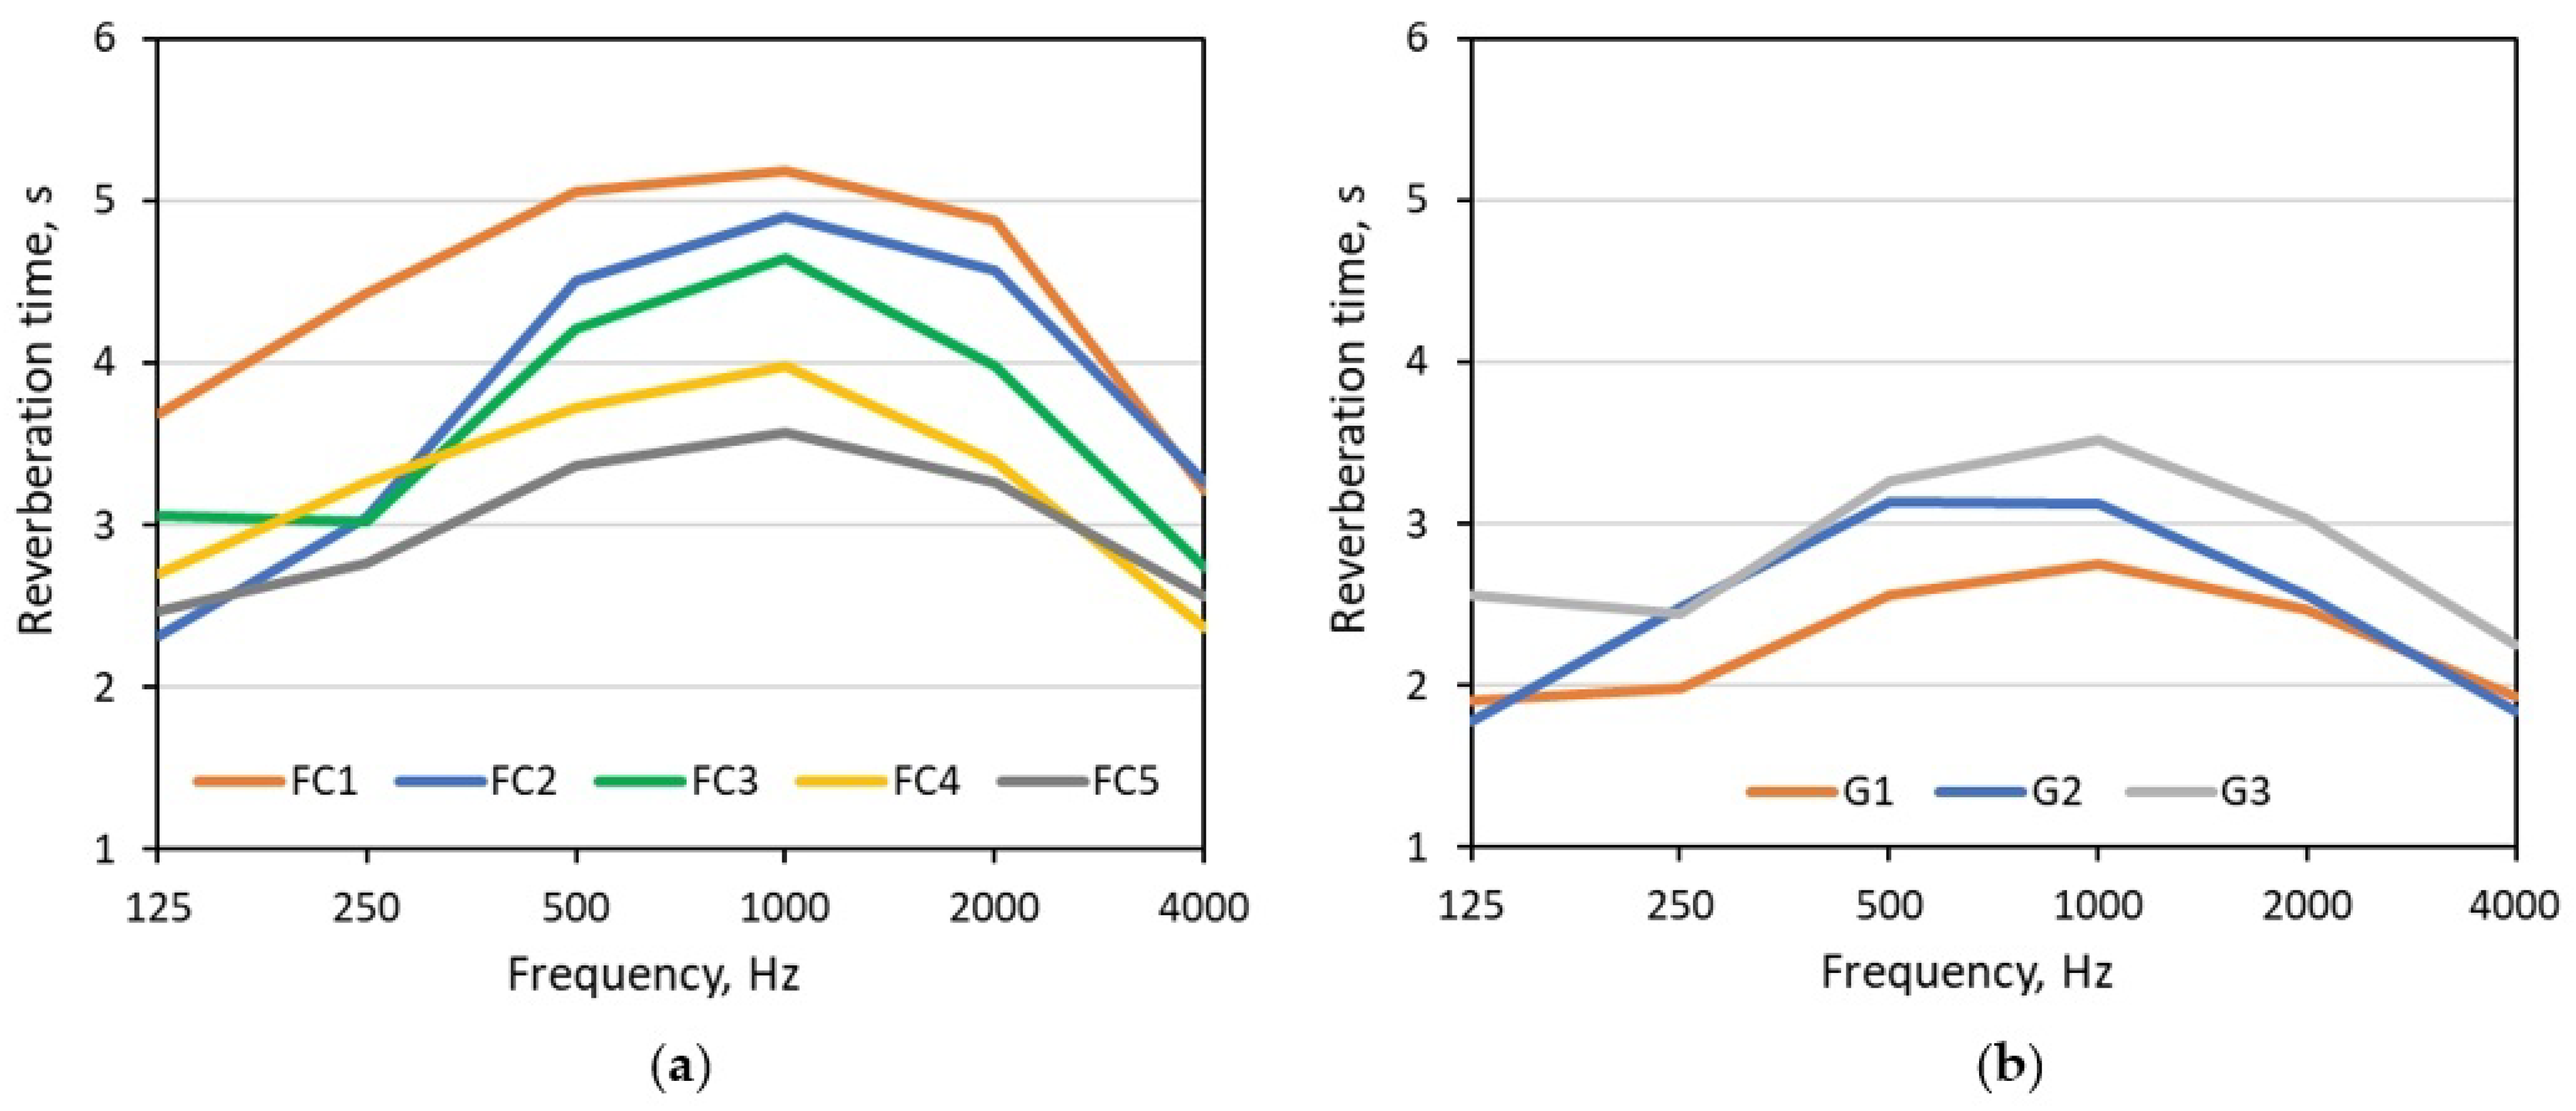
The reverberation time T20 averaged over all measured values is shown in Figure 3. To characterize the quality of the measurements the uncertainties of the measured reverberation time were estimated according to [20]. The expanded uncertainty corresponding to a particular level of confidence 95% is shown in Table 4. As we can see, the values of the expanded uncertainty were not great. To estimate their significance we compared them with a just noticeable difference (JND) characterizing the sensitivity of listeners to small changes of acoustic parameters. The JND of the reverberation time was 5% [17] or 0.15–0.25 s for the considered spaces. Therefore, the variation of the reverberation time was almost unobservable. It means that the quality of the performed measurements could be considered quite high despite the relatively small number of the room impulse responses and a non-standard sound source.
We see in Figure 3 that the reverberation times were long enough [16], however in all spaces the frequency dependances were similar. The reverberation time was maximal at middle frequencies and it dropped at low and high frequencies. Its reduction at high frequencies was caused by sound absorption in air, which grew with frequency [21]. At low frequencies it depended on sound absorption properties of surfaces. As mentioned above, the ceiling and walls are usually made of thin panels of glass, metal, gypsum board and similar materials. Due to low mass per unit area, they behaved like panel sound absorbers and their absorption coefficient reached 0.1–0.2 at 125 Hz, whereas it was about 0.05 at 500–1000 Hz [22].
The longest reverberation time at 1000 Hz was in the food court FC1, which exceeded 5 s. The smallest food court FC5 had the reverberation time of about 3.5 s. The galleries were less reverberant because of smaller volumes. Known measurements [5,10,12,15] in other public spaces without acoustical treatment showed similar results. It is convenient to characterize the reverberation time by a single value instead of six octave band values. Let us introduce the middle frequency reverberation time [23] as follows:
where T500 and T1000 are the reverberation times in the octave bands 500 and 1000 Hz. The parameter Tm is considered in this paper as a main room acoustic parameter.
If a room with a sound-absorbing treatment has a desired reverberation time at middle frequencies, normally the reverberation time at high frequencies has similar or lower values. Whereas the low frequency reverberation can be longer because absorption coefficients of ordinary sound-absorbing materials at low frequencies are smaller in comparison with middle and high frequencies. To estimate the low frequency reverberation an additional parameter can be used. The parameter named “bass ratio” or BR is widely used in concert hall acoustics [23] and defined by
where T125 and T250 are the reverberation times in the octave bands 125 and 250 Hz.
The parameters Tm and BR found by means of (1) and (2) are in Table 5 summarizing results of acoustic investigation of the public spaces in the shopping malls. We can see that the parameter BR was significantly less than 1. This means that the reverberation time at low frequencies was lower than that at middle frequencies.
3.2.2. Relation with Space Volumes
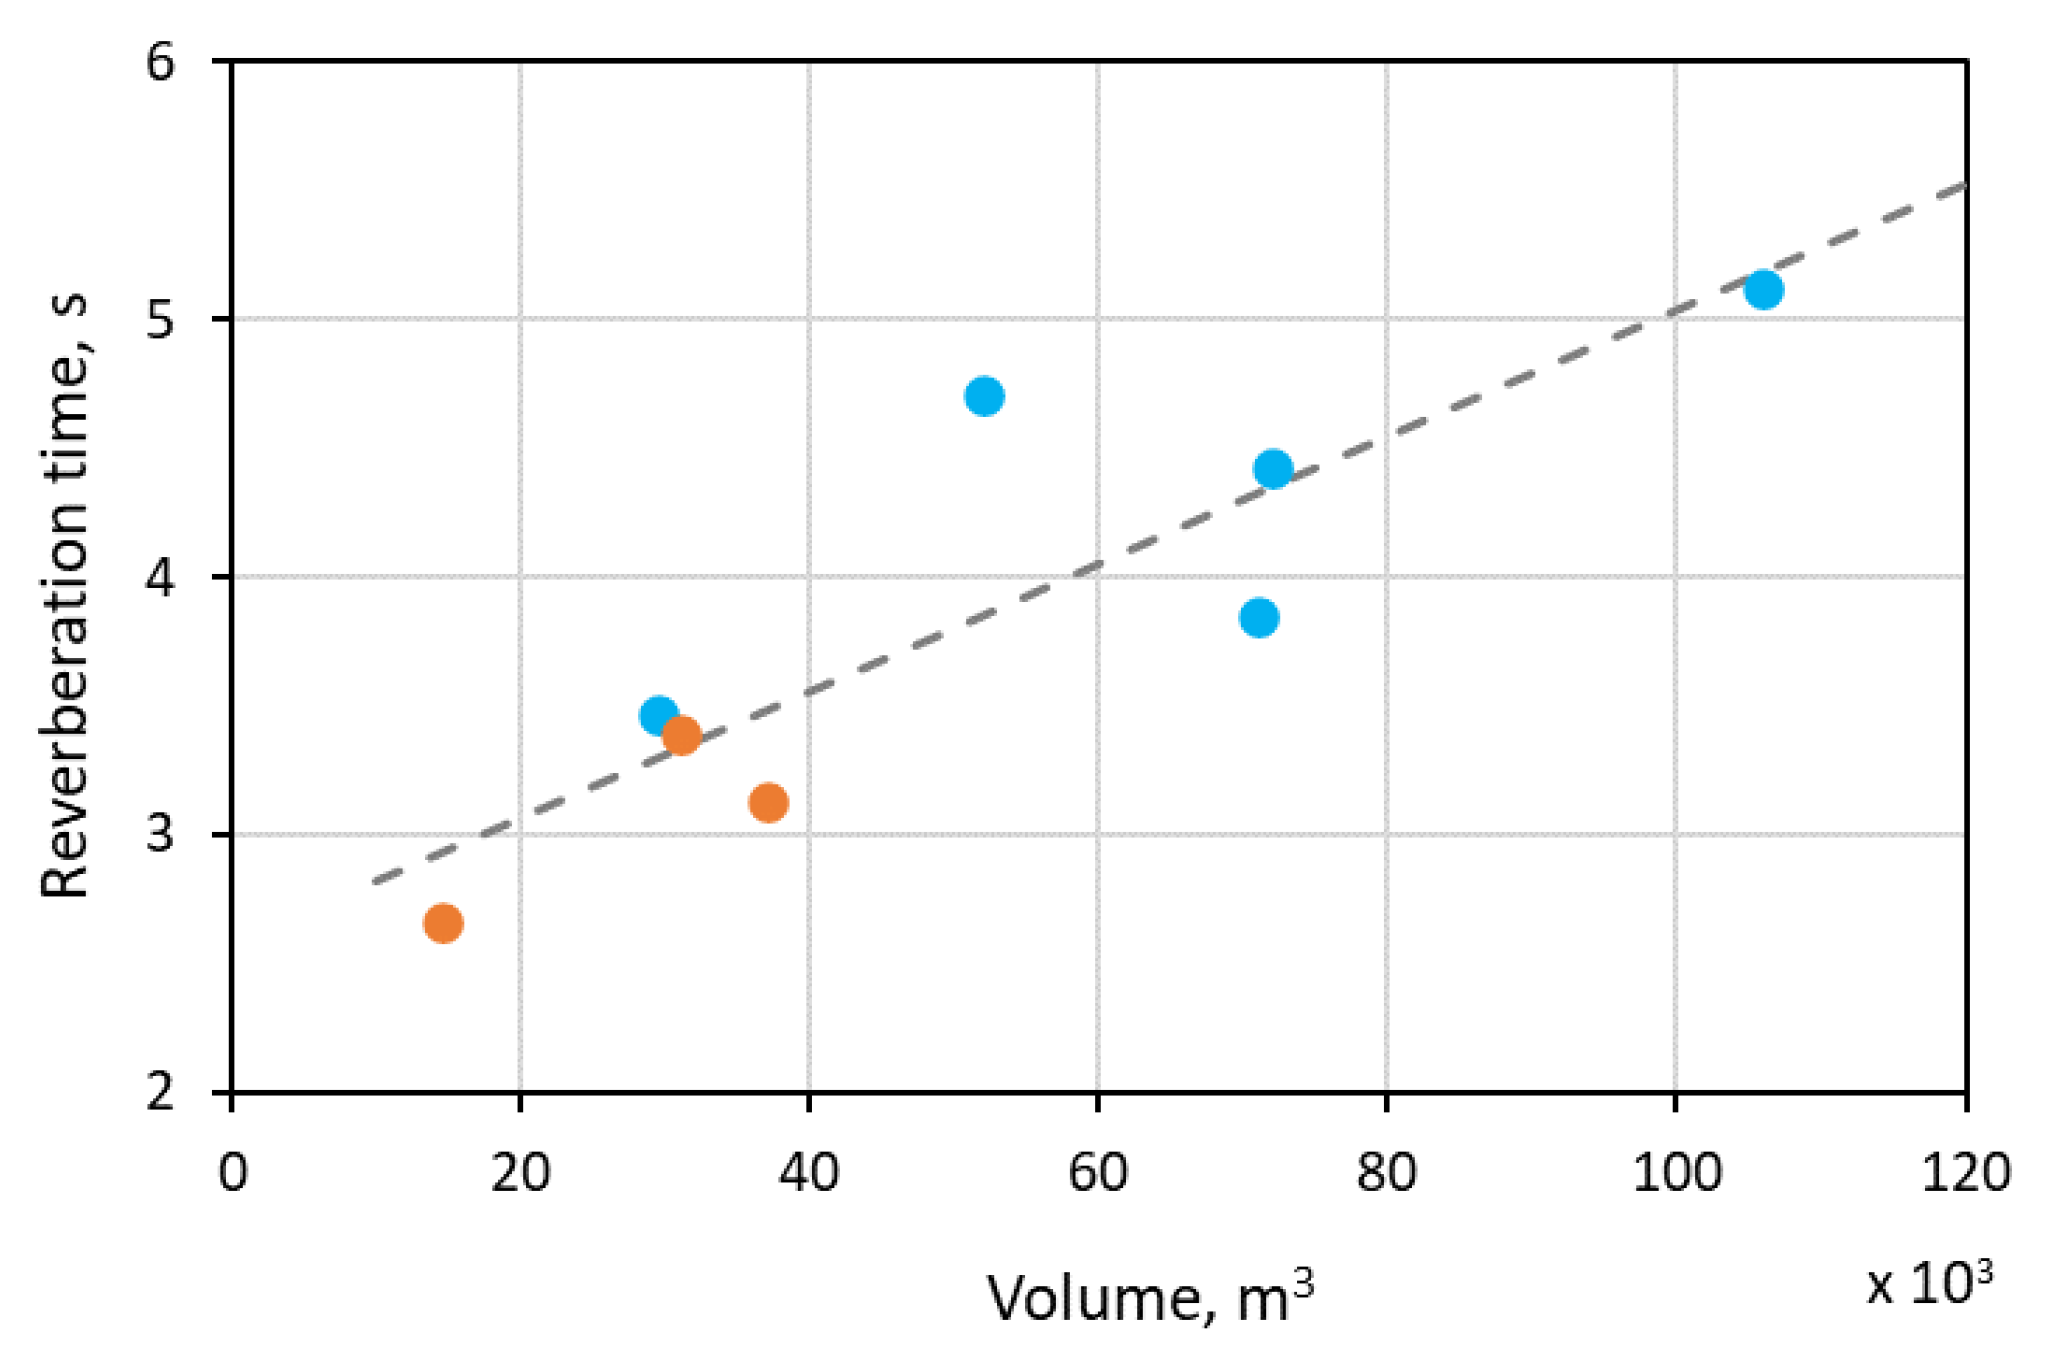
Figure 3 shows the dependence of the reverberation time on the space volume. The largest food court FC1 had the highest reverberation time and the smallest gallery G1 had the lowest one. To find the relation with the space volume we consider Tm, whose values for all studied spaces are given in Figure 4. The food courts and galleries are marked by points of different colors, but we can see the growth of the reverberation time with the space volume V. In spite of the different geometries of the two type of spaces they have a similar relation between Tm and V. Therefore, we can try to find the function describing the measured values Tm in all spaces. The best matching linear function is
where V is the space volume, m3. The linear correlation coefficient is R2 = 0.76, which is not too enough to apply the dependence (3) as fairly accurate.
Expression (3) can be used for rough estimations. More specific calculations of the reverberation time can be made using Sabine’s or Eyring’s equations. For this study, we stuck to a qualitative assessment using statistical approaches.
3.2.3. Validity of Sabine’s Equation
The Sabine’s equation for calculation of the reverberation time of a room is widely used in practice [22,23] and can be written as
where V is the room volume, m3; S is the area of inner room surfaces, m2; α is the average absorption coefficient; m is the air attenuation coefficient, m−1.
An important question is whether Equation (4) can be applied in the spaces under consideration. The most important assumption upon which the Sabine’s equation is derived is that sound in the room is diffuse. Special measurements of sound diffuseness in the food courts and galleries were not carried out, but we can rely on the known conditions under which the sound field is diffuse and Equation (4) is valid.
First of all, we notice that all studied spaces were without sound-absorbing treatment on their surfaces. A sufficient condition of validity for Sabine’s equation is that both the absorption be weak and the enclosure be mixing [24]. The first part of the condition can be easily verified by calculating the absorption coefficient α from the measured reverberation time T. According to [22] the Sabine equation is most accurate in rooms where the average absorption coefficient is less than 0.25. As we will see in the next section, estimated values of α at almost all frequencies satisfy this limit.
The second part of the condition concerns the form of the room. Physically, the mixing or ergodic form should spread any initial sound field into a uniform isotropic sound field throughout the room volume. Generally the forms of the studied spaces (Figure 1 and Figure 2) do not seem to be complicated, so we cannot conclude that the spaces are ergodic. The problem is that a sound decay in non-ergodic rooms can be non-exponential [25,26]. At the same time, the sound decay in the non-ergodic rooms with a uniform absorption distribution [26,27] is close to exponential and the reverberation time is close to values given by Equation (4).
Irregularities of the surfaces should also be taken into account, because they reflect diffusely incident sound. Metal ceiling constrictions with a profiled metal deck diffuse sound at mid and high frequencies. Balconies, edges, openings in food storefronts, escalators, stairs as well as furniture and decorative elements on the floor provide low frequency diffusion. Simulations of the reverberation in rectangular rooms show that the decay curve is defined by the Sabine’s law if a coefficient of diffuse reflection exceeds 0.2 [27,28,29]. This value can reasonably be provided by the usual unevenness of the surfaces.
Similar arguments are valid for long rooms, if a source–receiver distance is greater than a cross-sectional size [30]. As mentioned above, a non-diffuse sound field can cause non-exponential decay curves in the rooms with both simple [26,31] and complex [32] forms. Analysis of such curves gives different values of T20 and T30 [17]. To quantify this difference let us apply a curvature parameter:
Typical values of C are 0% to 5%, values higher than 10% indicate that the measured decay curve is far from the exponent. The calculated parameters (5) are presented in Table 6. At some frequencies T30 could not be found because of significant background noise; the parameter C was not found as well. The difference between T20 and T30 was insignificant in both the food courts and galleries at all frequencies.
Taking into account the low and uniform absorption, significant roughness of the surfaces and exponential sound decays in the studied spaces we can accept the validity of Equation (4).
3.3. Absorption Coefficient
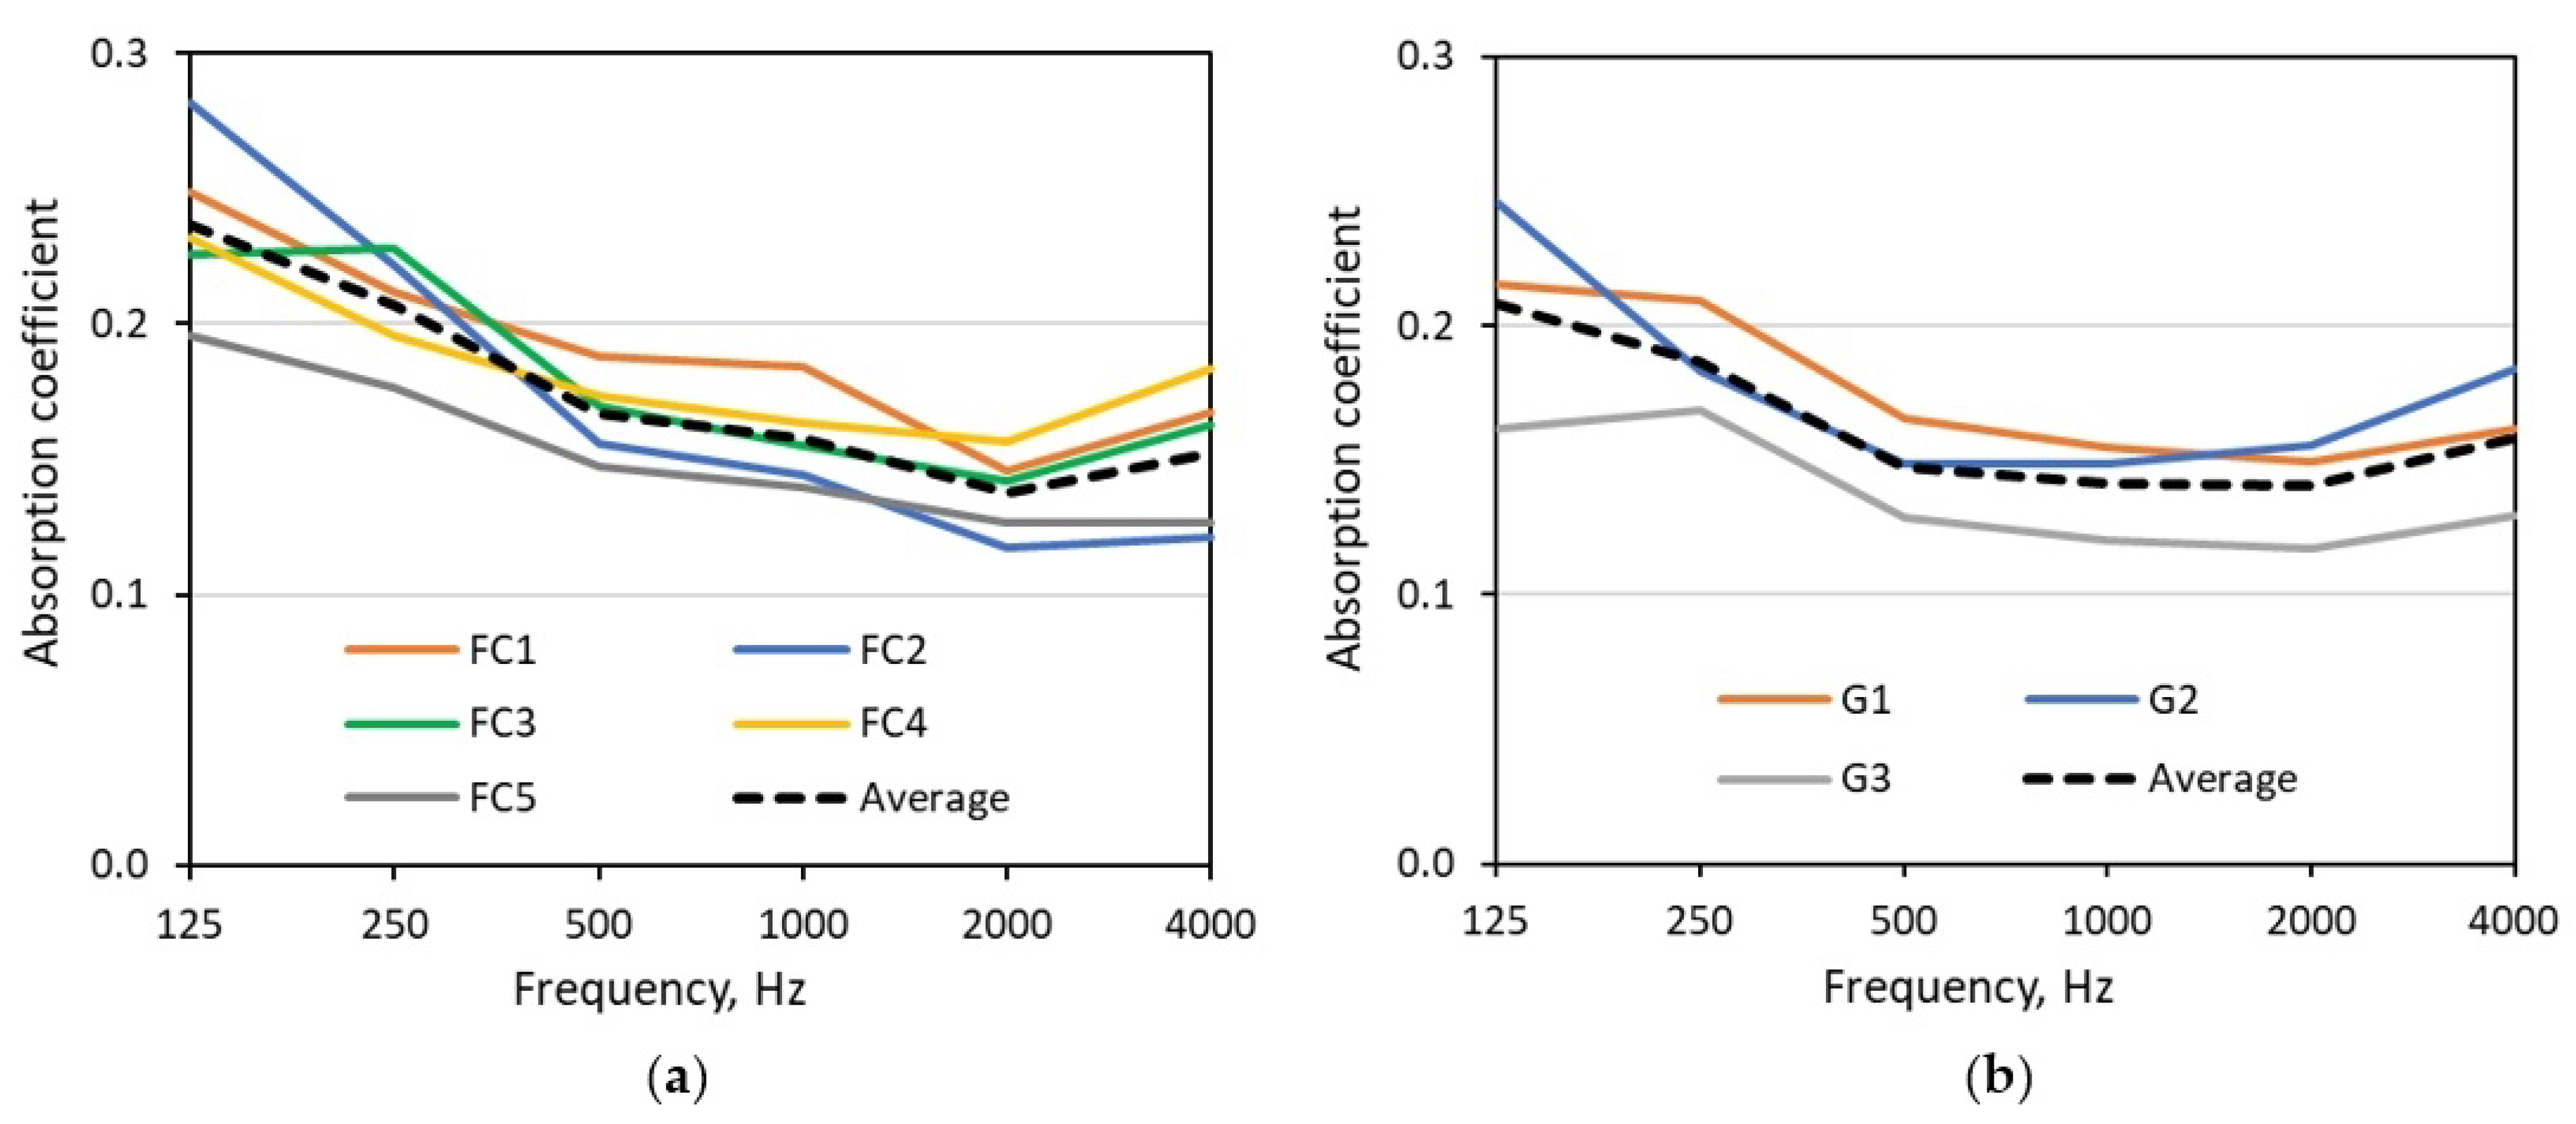
Assuming the validity of Equation (4) for the studied spaces, the sound absorption coefficient can be calculated. Figure 5 shows the frequency dependances of the absorption coefficient for the food courts and galleries. We note that they have similar values, so their average values can be considered as an approximate estimation of the absorption of the similar spaces without the acoustic treatment. The average values are given in Table 7.
So the reverberation time of the large public spaces with reflective surfaces and sufficient diffusion can be very roughly estimated by Equation (3). More accurate calculation can be performed by means of the Sabine’s Equation (4) with the values of the absorption coefficient given in Table 7. Surely the most accurate predictions are obtained as a result of simulations taking into account all the features of the space geometry and the absorption and diffusion distribution [15,33].
3.4. Sound Pressure Level
Detailed measurement of noise levels was made only in the food court FC1. The sound pressure levels were measured using a sound level meter Ecophysica-110A under two conditions: with and without visitors. The unoccupied food court was studied after the end of working hours, when all visitors had left the shopping mall. At the same time all sound sources including background music and HVAC systems were not turned off. The food court with people was studied during normal working hours, when approximately 70% of the sitting area was occupied. So the only difference between the two measurements was the presence of people, which gives information about how people themselves affect the noise level.
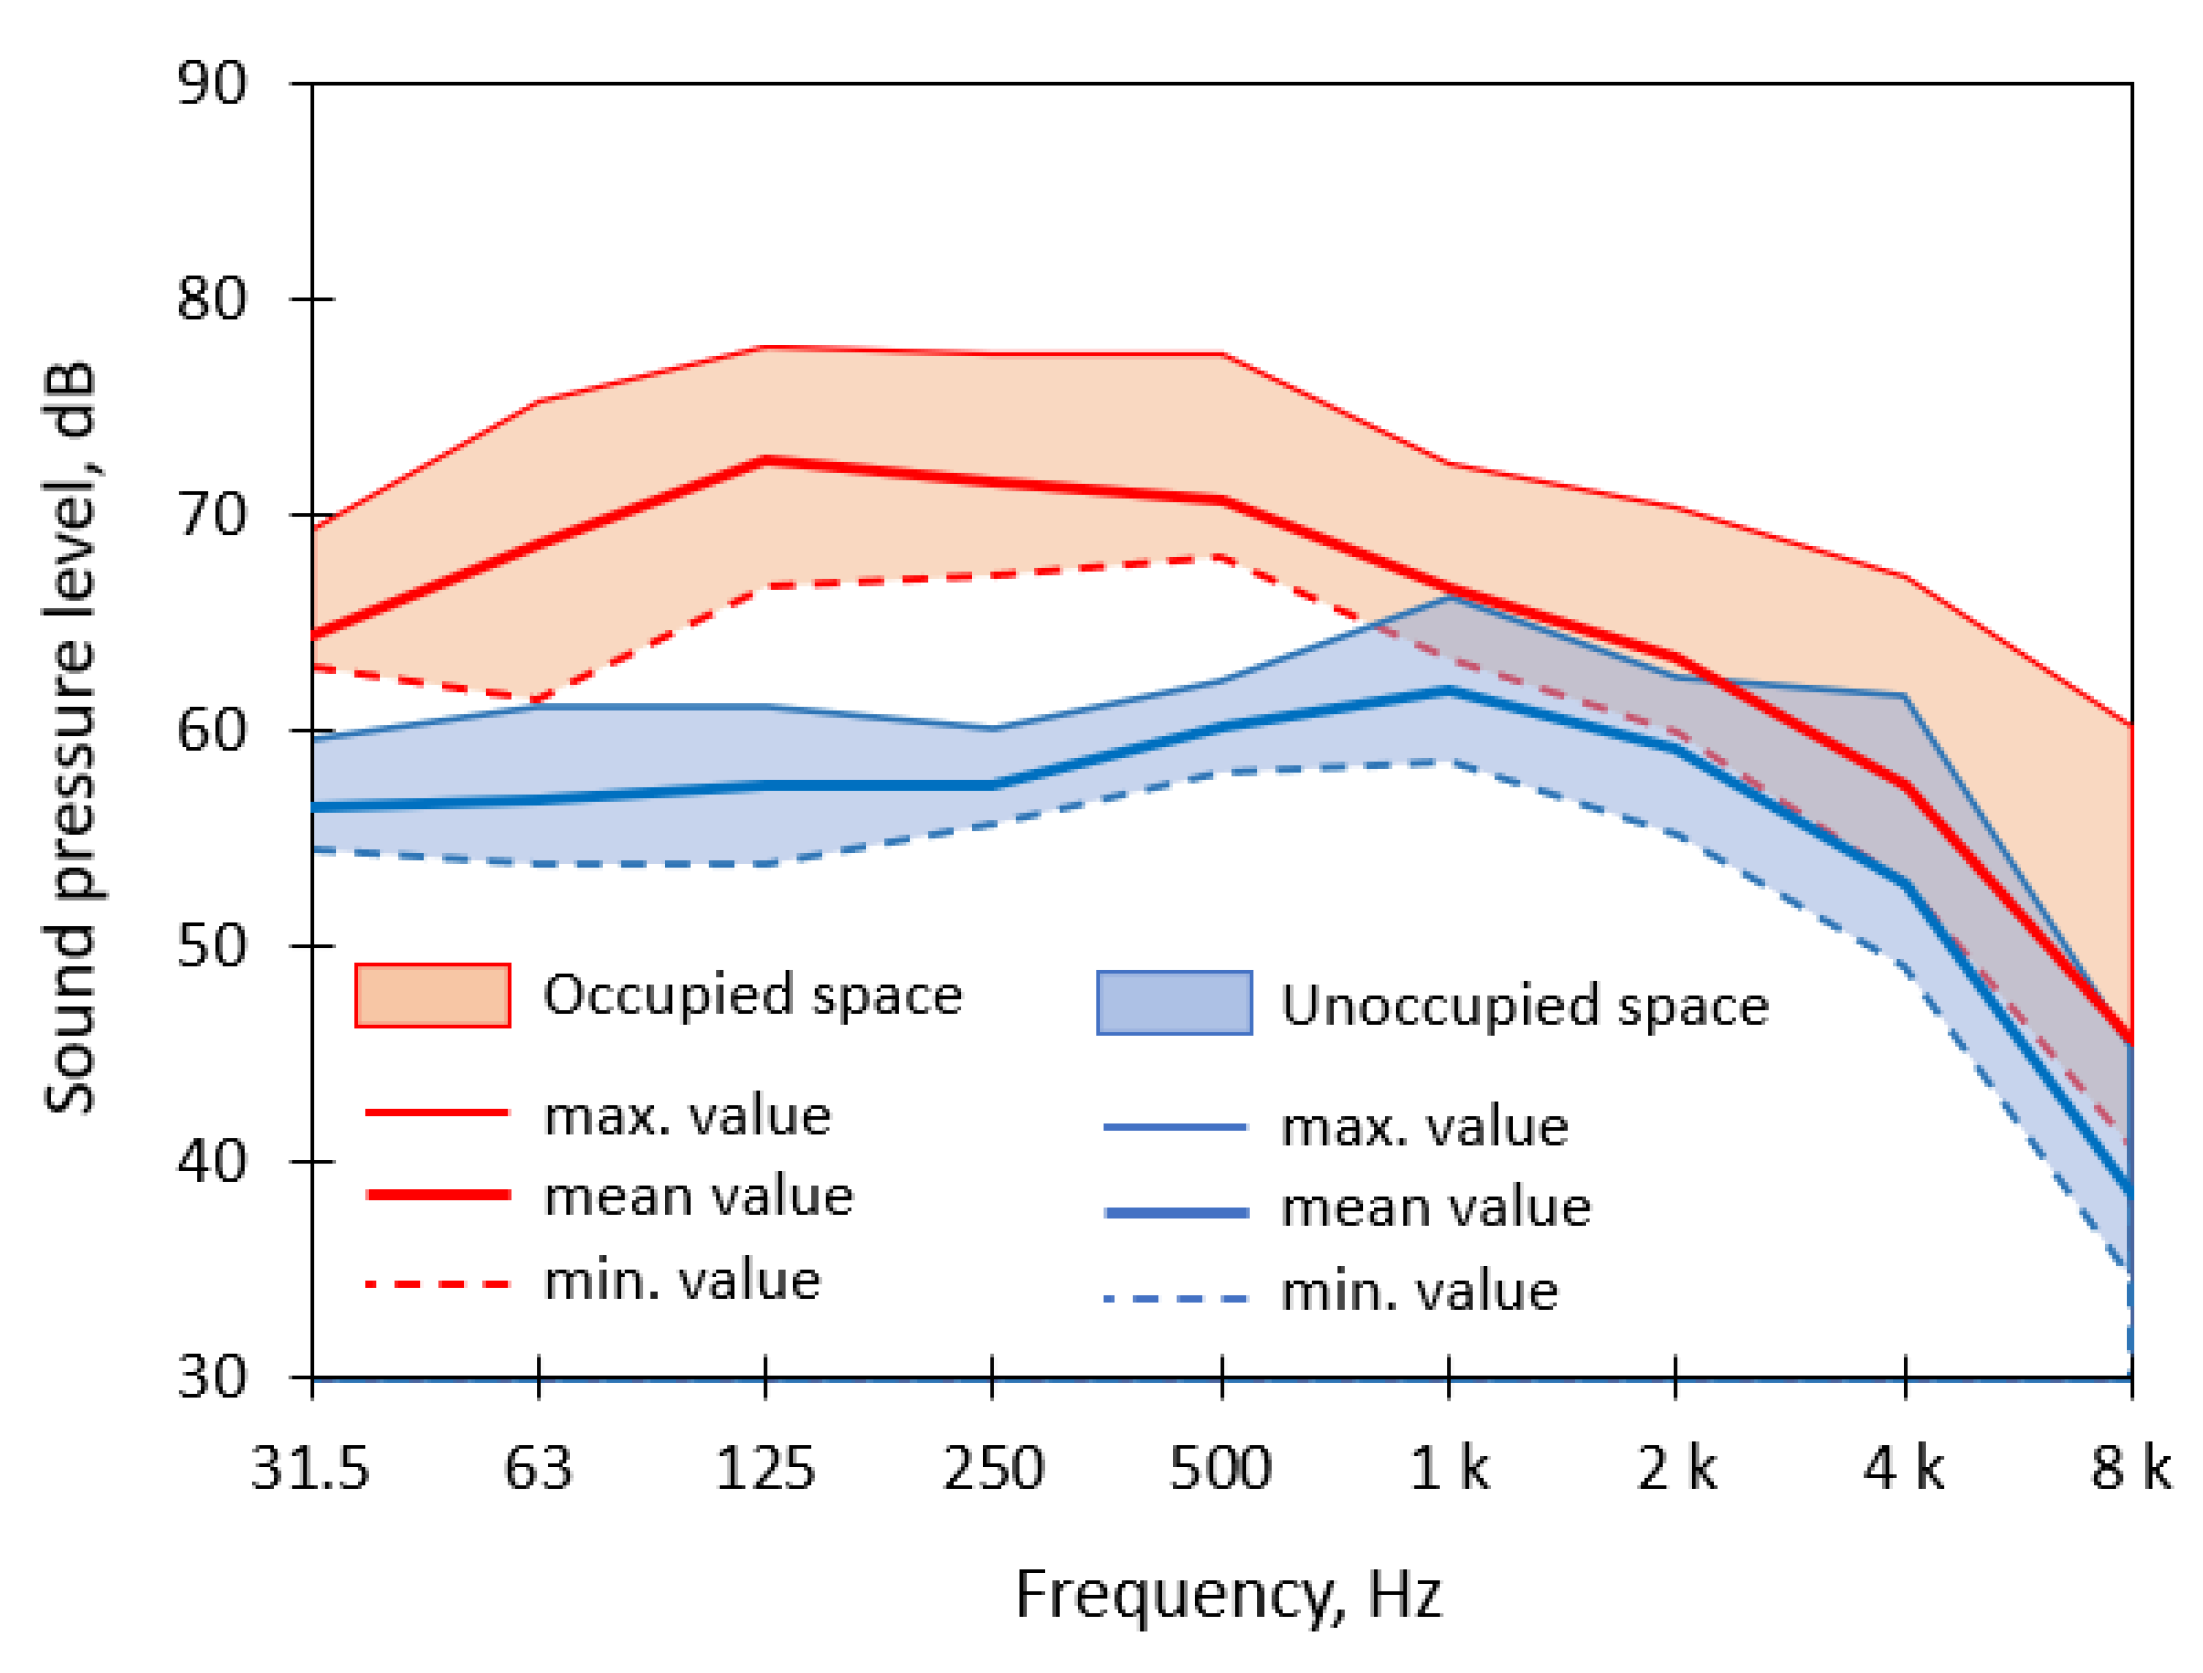
Octave band measurements were carried out in 24 point evenly distributed over the food court area. The sound pressure levels were obtained using 60 s integration for nine octave bands from 31 Hz to 8 kHz. Spectra of measured noise are given in Figure 6. There are two fields on the plot, the first one indicated by the red hatch corresponds to the occupied food court, the second one corresponds to the unoccupied food court. Each field contains the mean octave band spectrum as well as the minimum and maximum octave bands levels.
We can infer the shoppers are the main noise source in the food court. At middle frequencies the sound pressure levels were 7–10 dB higher in the occupied space. Normal voice levels at a distance of 1 m were about 60 dB(A), raised voices created 65–70 dB(A) levels. So noise condition in the food court is not comfortable for speech communication, and the space is too noisy for a long stay.
4. Improvement of Acoustic Conditions
It is necessary to apply the sound-absorbing treatment at the design stage of the shopping malls, but often the acoustical treatment is not designed. Poor quality of the acoustic environment in the public spaces is only recognized after the opening of the shopping mall and several months or years of its operation. Changes of the acoustic conditions are usually possible during repair or reconstruction of the spaces. In this section we will consider two cases of acoustic improvement of the food court spaces.
4.1. Food Court FC1
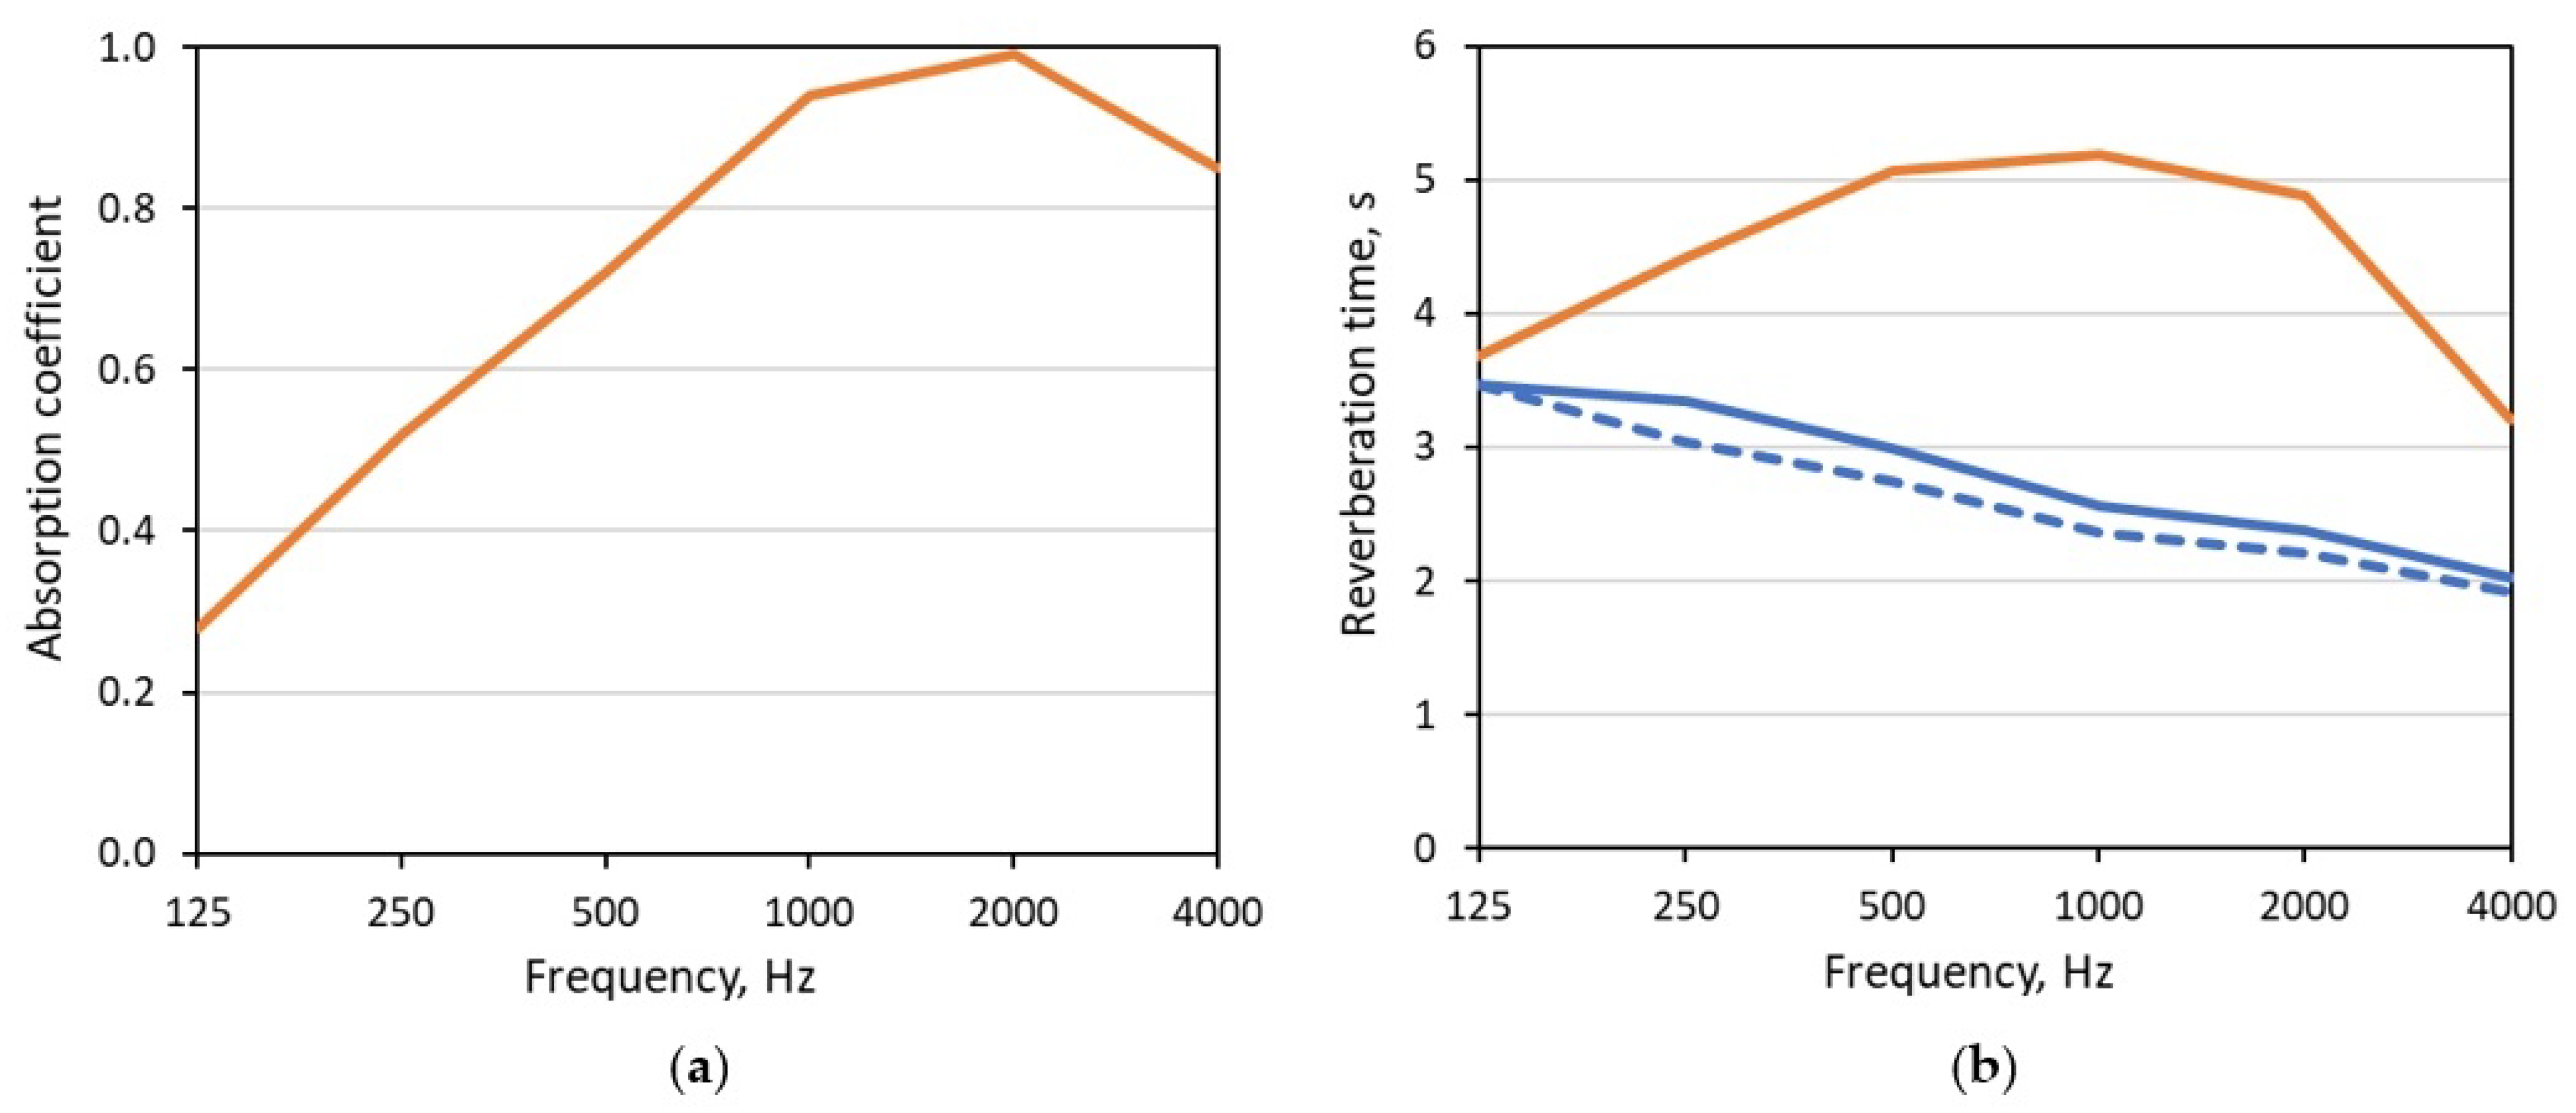
After more than 10 years of operation, it was decided to reconstruct the food court in accordance with actual requirements for retail spaces; improvement of acoustic conditions was planned as well. As stated above, the acoustic measurement (Figure 3) showed very long reverberance at middle frequencies. The simplest approach to reduce it was chosen: a sound-absorbing porous coating with a thickness of 25 mm was applied at the ceiling. The absorption coefficient of the coating is shown in Figure 7a. The reverberation time was calculated by means of the Sabine’s equation; its designed values are given in Figure 7b. It was expected to decrease significantly at middle and high frequencies.
The desired result was achieved, as can be seen in Figure 7b presenting the comparison of the reverberation time measured before and after reconstruction. Due to the acoustic treatment the value of Tm became 2.8 s instead of 5.1 s. Note that the highest reverberation time was in the octave band 1 kHz; after reconstruction it reduced from 5.18 s to 2.57 s. In the octave band 125 Hz the reverberation time was reduced by only 0.22 s, so the parameter BR increased to 1.22 and the low frequency reverberation became dominant. The measured and designed reverberation times differed by less than 10% at all frequencies.
Subjective evaluation of the changes of acoustic environment was not performed in ways used today for soundscape analysis. But several personal opinions of shopping mall managers and specialists from various fields involved in the reconstruction process pointed to significant positive changes in the food court acoustics.
Certainly, using more efficient materials and installing them on the walls would lead to a greater reduction in the reverberation time.
4.2. Food Court FC2
The food court FC2 was reconstructed after several years of operation. However, its reconstruction was more difficult than the reconstruction of the food court FC1. The fact is that in addition to changing the finishing and interior, the volume of the space was increased. A part of the ground floor used for parking before the reconstruction was joined with the main volume. The sections 1-1 and 2-2 in Figure 8 show this change. At the first floor level there are two wide balconies with the seating area. The food stores are located on both the ground and first floor levels. The attached volume is about 11,000 m3, so the volume of the food court after reconstruction is 63,000 m3.
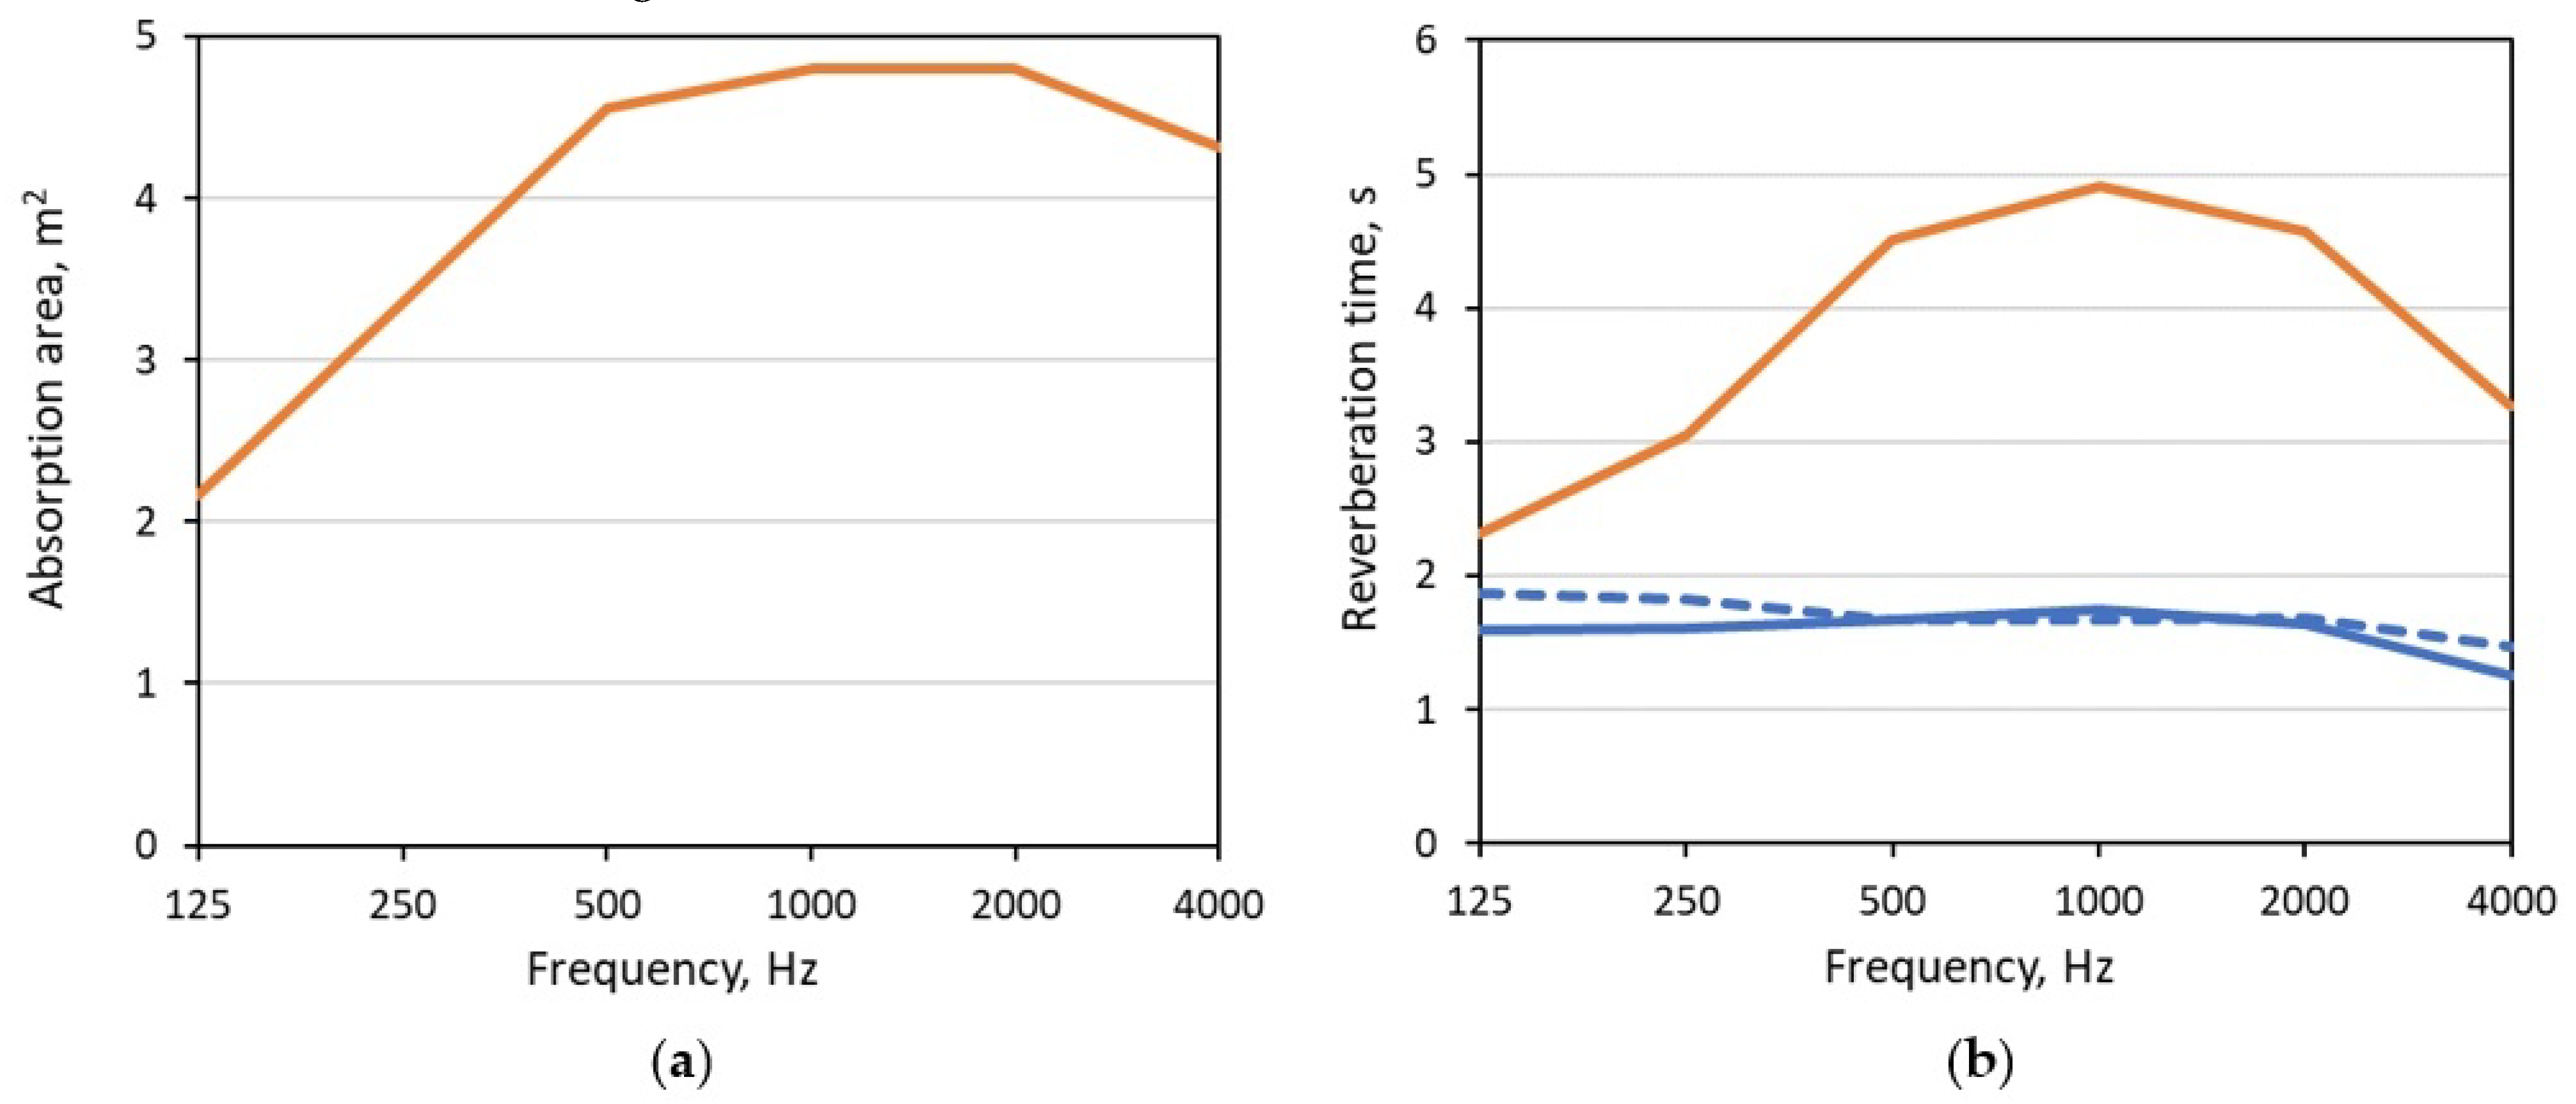
The increase in the space volume should have led to an increase in the reverberation time, which was already quite long. It was obvious that the sound-absorbing treatment was strongly required to improve acoustic conditions. Absorbing elements or baffles were applied below the ceiling by 3 m, as shown in Figure 8. The baffles have an arc shape, so they have both acoustic and decorative functions. The length of the baffle is 11 m, its maximal height is 1.2 m. The number of the baffles is 434, the distance between them is 0.8 m. Therefore, they form a fairly dense array, which effectively absorbs sound waves. The absorption area of one baffle is shown in Figure 9a. The designed reverberation time is in Figure 9b.
The reverberation time measured before and after reconstruction is shown in Figure 9b. We can see that it significantly reduced at all frequencies including 125 Hz. The value of Tm reduced from 4.7 s to 1.7 s. The bass ratio was 0.94, which means that the reverberation time at low frequencies was reduced as successfully as at mid frequencies. We can see good coincidence between designed and measured reverberation time at middle frequencies, whereas at low frequencies the reverberation time was lower than was expected. We assume that the reason for the difference is that the distance between the baffles is small compared to the wavelength and, therefore, they do not absorb independently. In this case the absorption area of the baffle array is not equal to the sum of the baffle absorption areas.
We can conclude that the acoustic changes in the food court FC2 are more significant that in the food court FC1 due to more effective sound-absorbing treatment. It is clear that the baffles at a gap of several meters from the ceiling absorb better than the thin porous layer on the ceiling.
5. Reverberation Time of Public Spaces
Acoustic studies of shopping mall spaces and other public areas of a large capacity choose different optimal values for the reverberation time. It would be useful to have any references for choosing the acoustic criteria, including the requirement for the reverberation time.
5.1. Room Acoustic Criterium
As stated in many studies the sound pressure levels are the main physical parameter used for objective evaluation of the acoustical environment. Ambient noise is usually low, so occupants are the dominant noise sources in public spaces. Noise levels are strongly dependent of a number of people, their behavior, space geometry and reverberance. In the unoccupied space a long reverberation may be weakly felt, but when at least a few people start talking, the reverberation becomes noticeable. In the occupied space people respond primarily to surrounding noise and not the reverberation, moreover, in a noisy room it is difficult to determine subjectively the reverberation of the space. Therefore, the sound pressure level is a function depending on different parameters [7,8,9] and cannot be used as a room acoustic criterium.
Several parameters are used for evaluation of room acoustics. The reverberation time is surely the most famous of them and it influences other parameters. The local parameters (EDT, D50, C80, Central time and so on) depend on location of sources and receivers, whereas under diffuse sound field conditions the reverberation time does not depend on initial sound field and a place of measurement. So, recommendations for the reverberation time can be chosen as a room acoustic criterium for the public spaces of large volume.
5.2. Target Reverberation Time
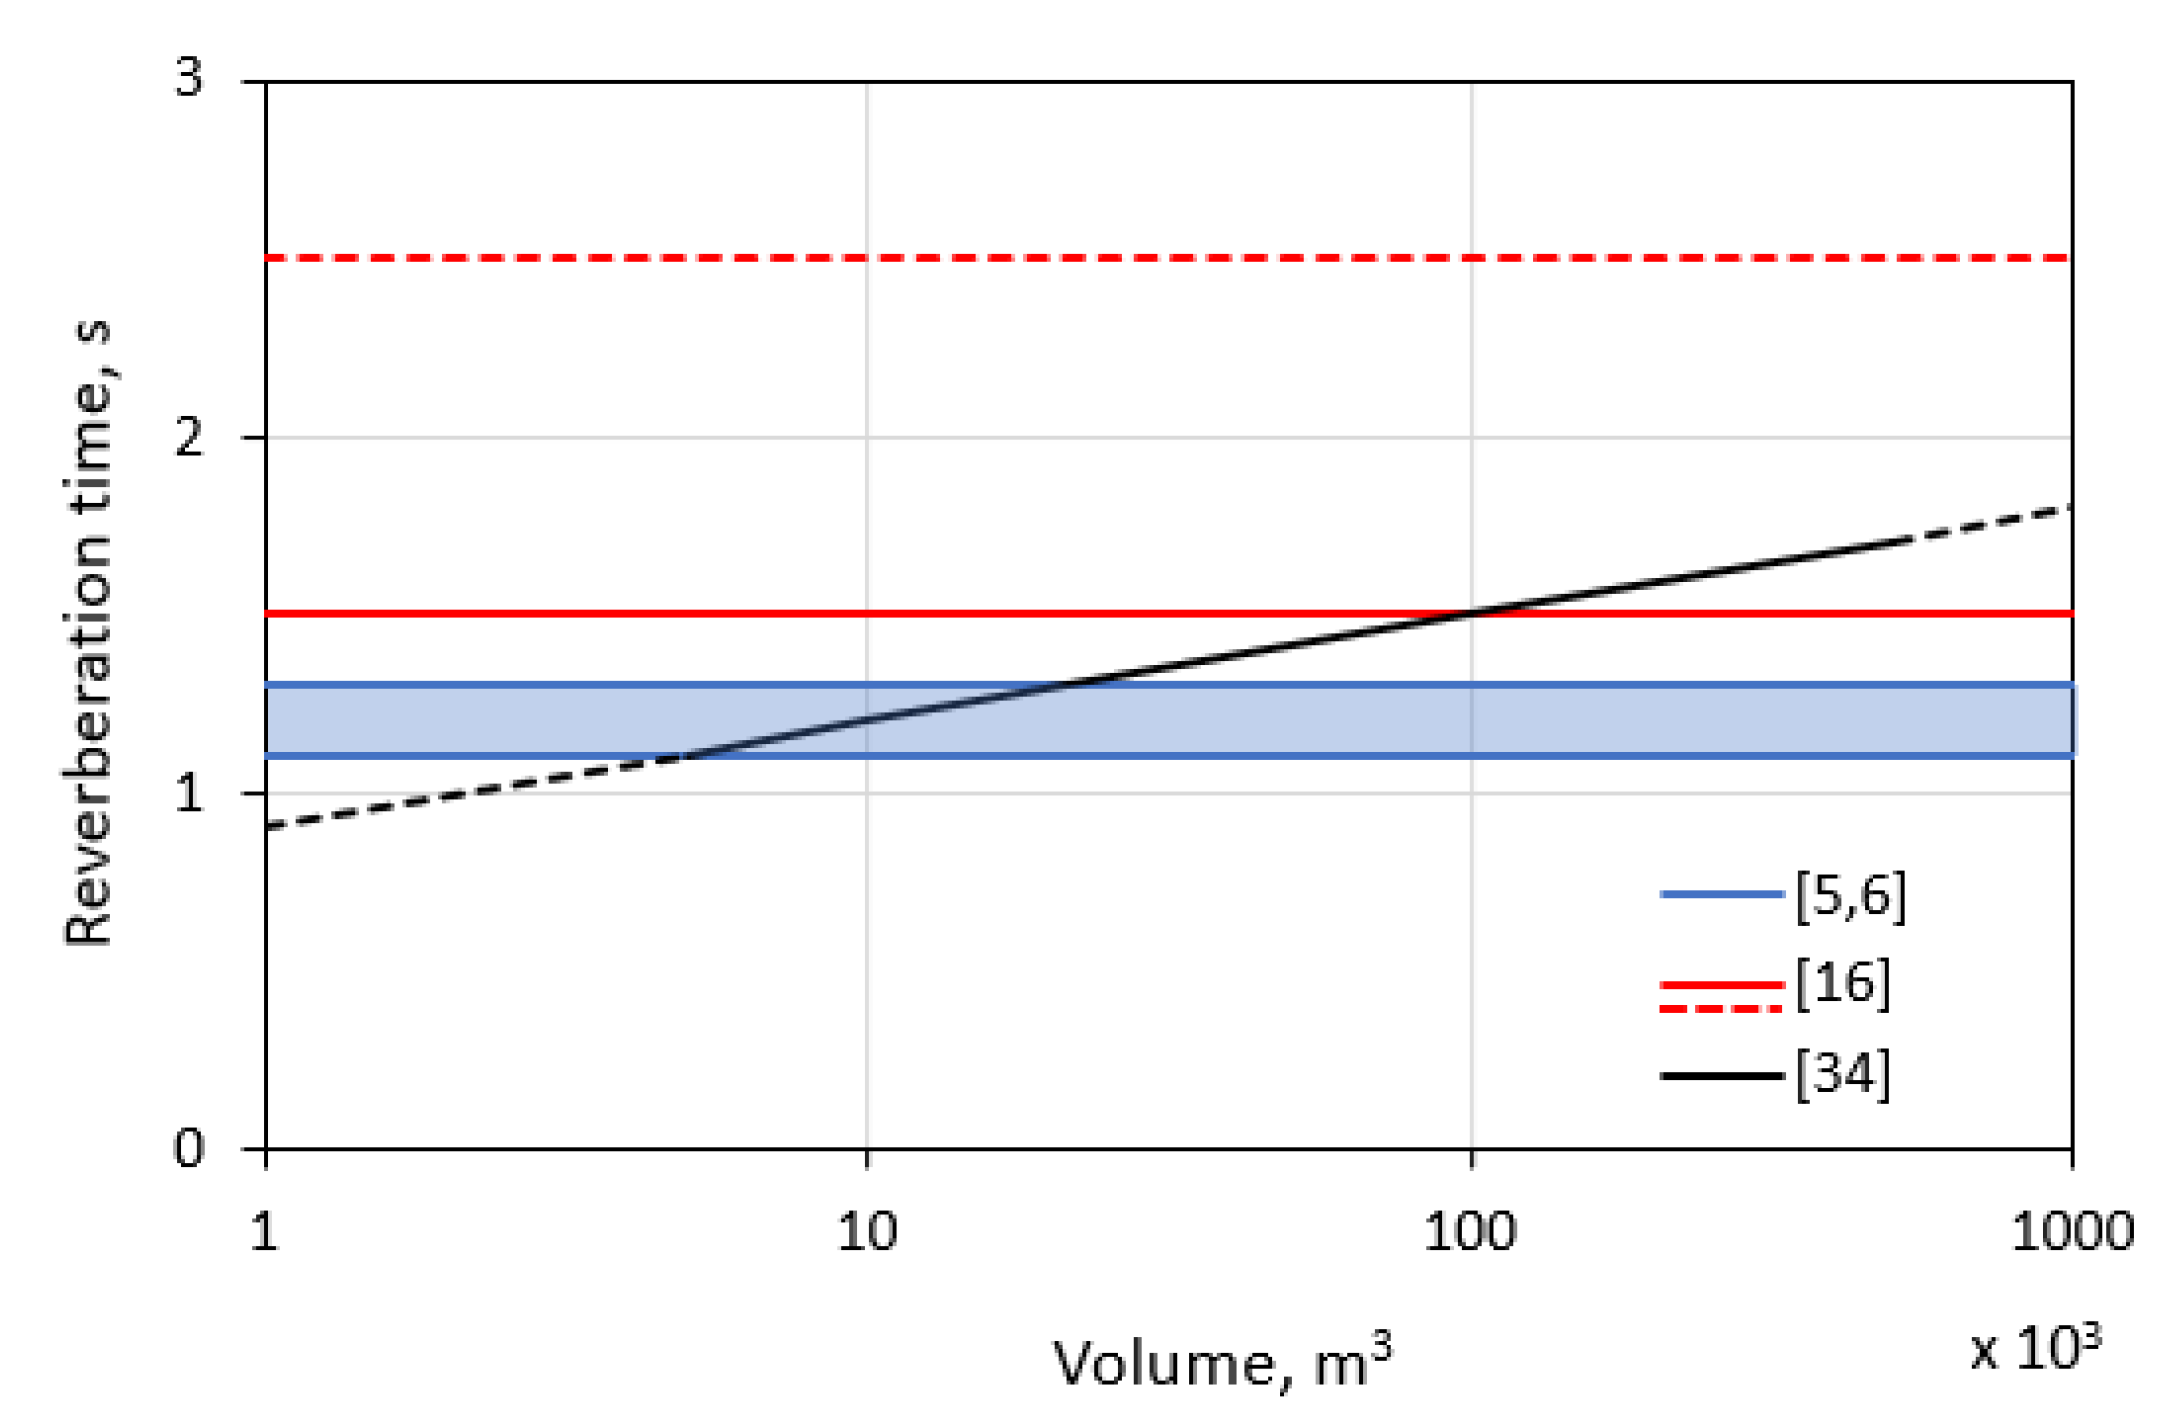
A desired reverberation time is defined by various authors in different ways. Sometimes the aim is to achieve the very low reverberation time, for example, 1.1–1.3 s at middle frequencies [5,6]. The assessment method [16] proposes a differential approach. For the spaces of any volume a reverberation time longer than 2.5 s is bad, and a reverberation time shorter than 1.5 s is good. Russian standard [34] recommends the reverberation time at mid frequencies for public transport spaces, which are comparable in volume and functional purposes with the public spaces of the shopping malls. All mentioned recommendations are summarized in Figure 10. We see that good acoustic conditions are related to similar reverberation times in the range 1.1–1.5 s. The reverberation time depends necessarily on the space volume, so it is reasonable that the desired reverberation time would increase with the volume, like the black line in Figure 10.
Obviously, to ensure good acoustic conditions in the public spaces the reverberation time has to be as short as possible. But it should be taken into account that the reverberation times in the range 1.1–1.5 are difficult to achieve in practice in very large volume spaces. In this case the use of the term “optimal reverberation time” is not entirely correct, since the optimality implies that a value can be either greater or less than an optimal one. The recommended reverberation time can be considered as a target to be achieved. We propose to apply the term “target reverberation time.” As before, we mean Tm given by (1) as a parameter of the reverberation in large public spaces.
5.3. Efficiency of the Acoustic Treatment
It is important to understand whether the target reverberation time is achievable under the usual constraints in retail spaces. The main constraint is the limited area of surfaces suitable for sound-absorbing treatment. Usually the absorbing materials can be installed on the ceiling, as in the food courts FC1 and FC2 during the reconstruction. Sometimes it is possible to apply them to the walls, but no more than half of the wall area can be used because of the store facades.
To estimate the minimal value of the reverberation time Tm let us calculate it in the studied food courts and galleries by means of the Sabine’s Equation (4) in two cases. In the first case we assume that the entire ceiling is covered by a material with the absorption coefficient α = 0.9 at 500 and 1000 Hz. In the second case the same material is on the ceiling and half the area of the walls. The sound absorption coefficient of the other surfaces is taken from Table 7. The areas of the ceiling and walls and the total area of inner surfaces as well as the calculated reverberation time at 500 and 1000 Hz for two acoustic treatment configurations are given in Table 8.
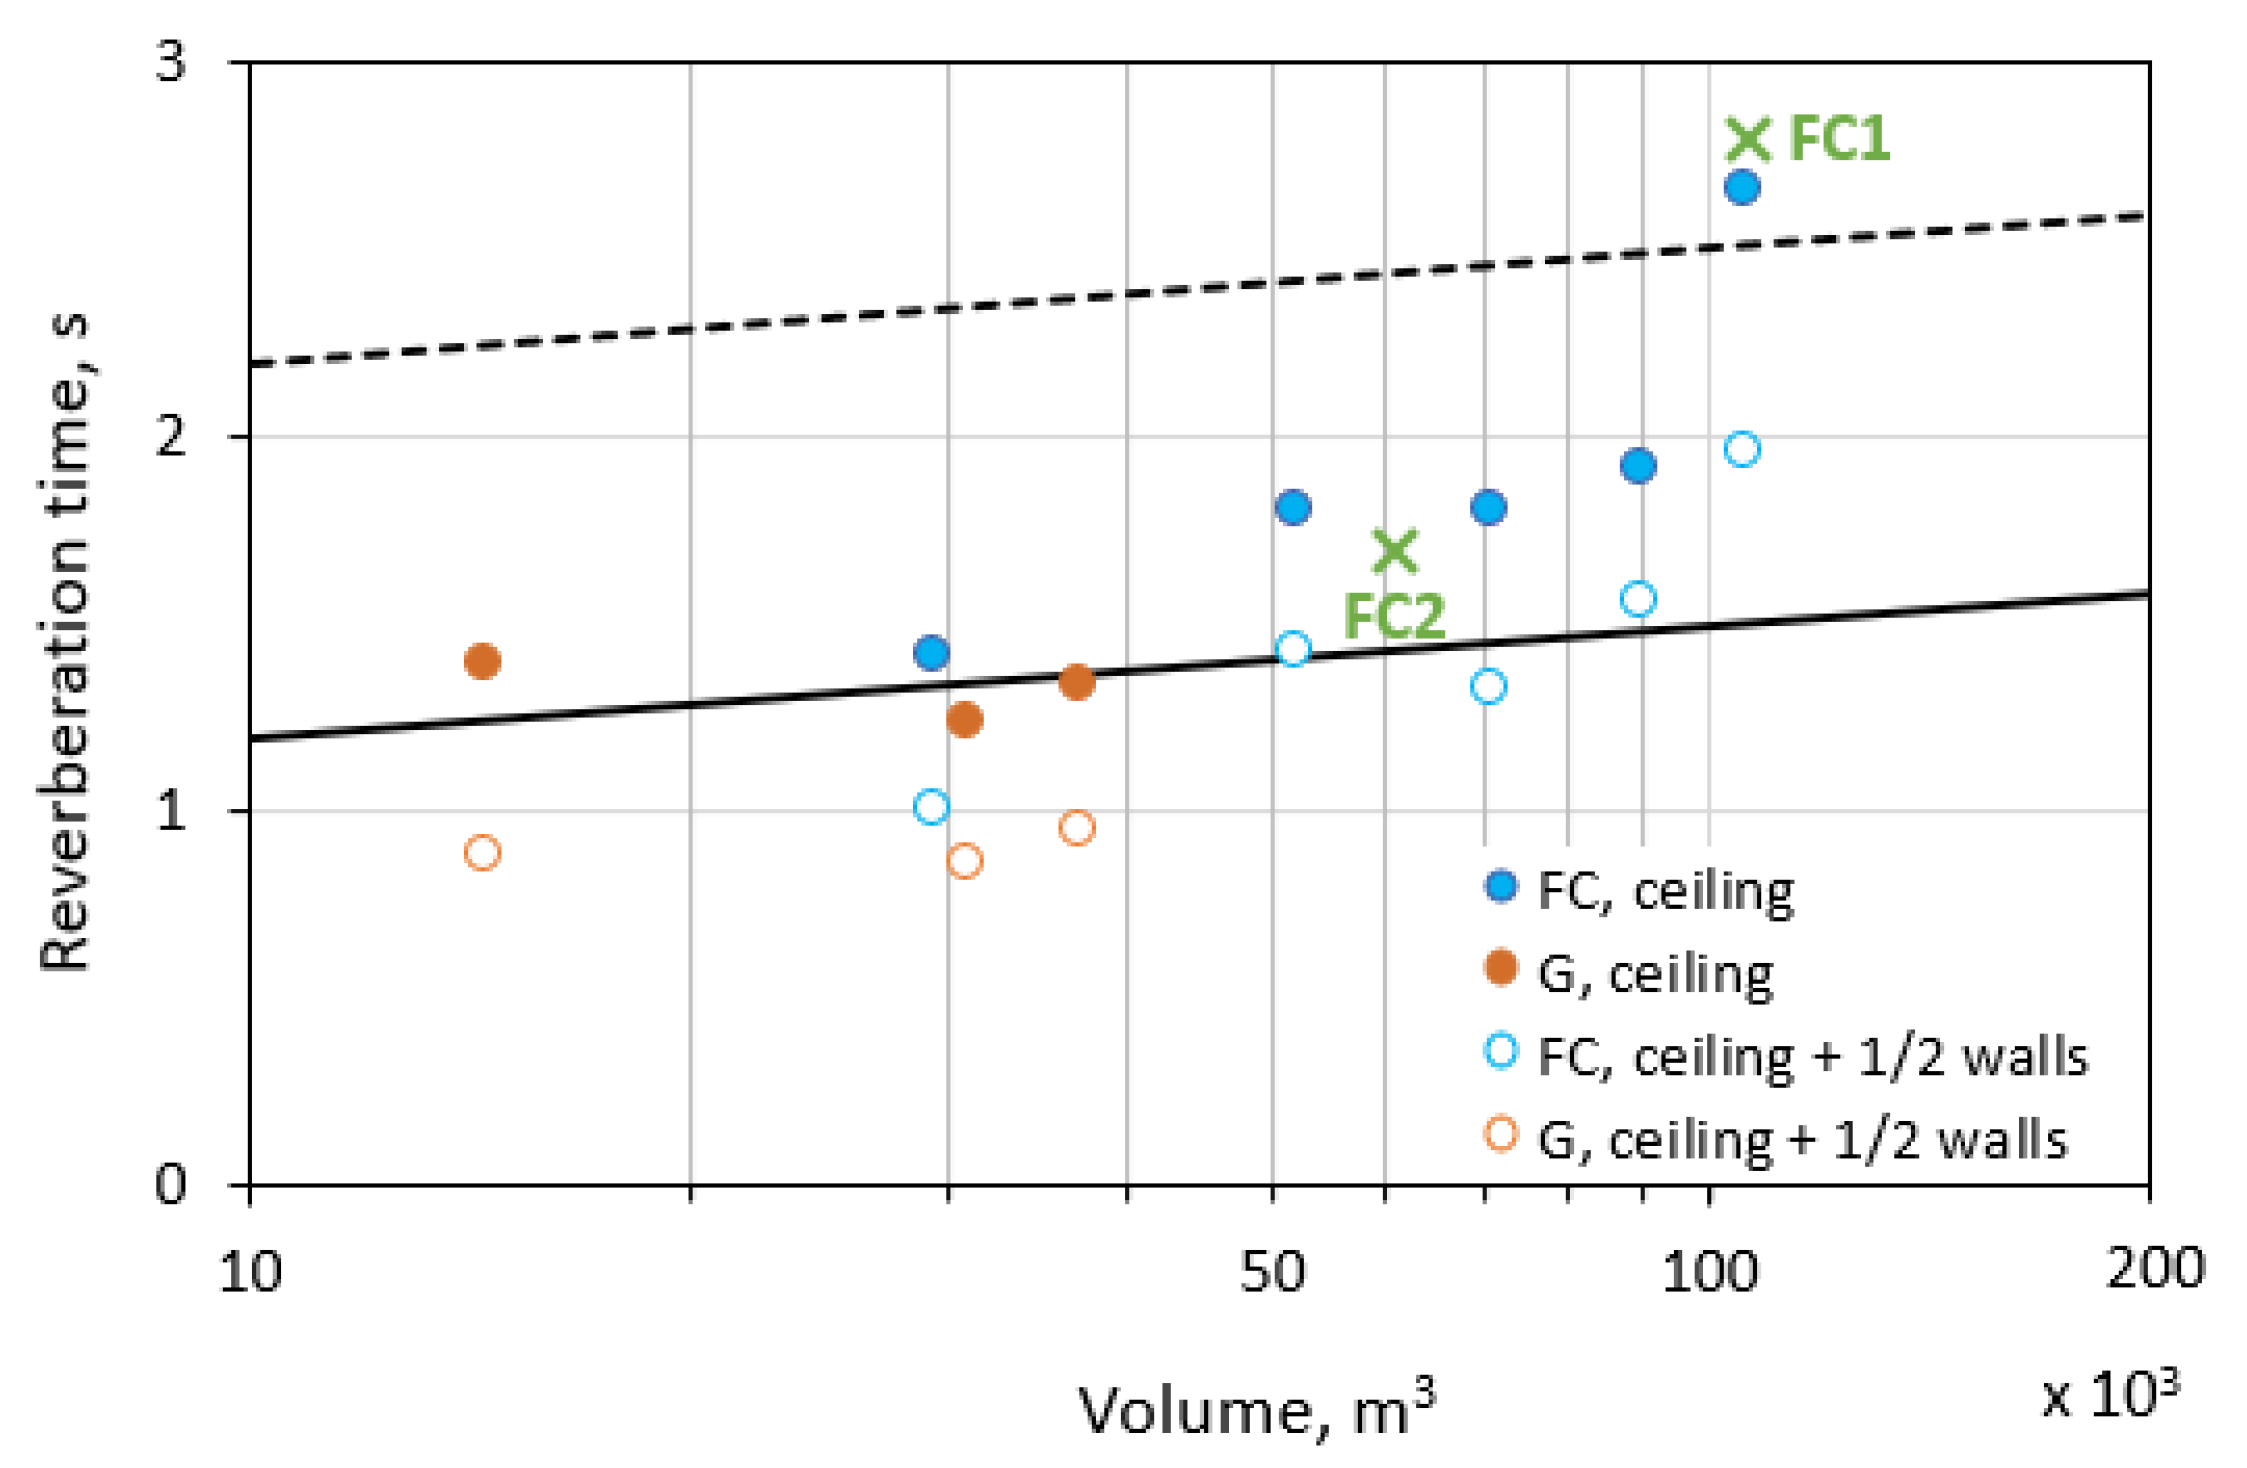
Figure 11 shows the results of the calculation of Tm for two types of the spaces. The solid black line corresponds to the recommended reverberation time according to [34]. The acoustic treatment of the ceiling is not sufficient in the food courts, whereas in the galleries the recommended reverberation time is achieved. If the absorbing material is on the ceiling and half the area of the walls, the desired reverberation time is provided in almost all spaces. The reverberation times measured in the food courts FC1 and FC2 after the reconstruction are shown in Figure 11 as well. In the food court FC2 the recommended value is almost reached due to sound absorbing baffles, but in the food court FC1 the reverberation time is far from the black line. Despite the significant reverberance in the food court FC1 its acoustic conditions were greatly improved and the reverberation time became close to 2.5 s, which was the boundary between bad and satisfactory ranges of the reverberation times [16] represented by the dotted black line parallel to the solid one in Figure 11.
The estimation showed that the applying the sound-absorbing material can provide the reverberation time recommended in literature [5,6,16,34], however the absorption only on the ceiling is not sufficient in all cases. It means that the reverberation time shown by the solid line in Figure 11 corresponds not only to comfortable acoustic conditions, but it is quite achievable for the studied spaces. So, it can be accepted as a target reverberation time.
On the other hand, the gap between the reverberation times in the spaces with and without the absorbing treatment is great enough, to improve the acoustic environment it should be reduced from 3–5 s to 1.5 s. Such a reduction is not always possible because of many practical constraints. Nevertheless, even a smaller reduction like in the food court FC1 (Figure 7b) results in the noticeable improvement. It would be useful to have an intermediate threshold separating acceptable and unacceptable values of the reverberation time. The value of 2.5 s suggested in [16] seems reasonably appropriate. Taking into account the dependence of the reverberation time on the space volume yields the dependence shown by the dotted line in Figure 11. The proposed threshold can be considered as a condition for minimum acoustic comfort. Thus, we have obtained a differential scale for characterization of the acoustic conditions in the public spaces including two thresholds for reverberation time values. The primary threshold is the target reverberation time, the secondary one corresponds to minimum acoustic comfort and can be named a maximum acceptable reverberation time.
6. Discussion
An acoustic survey of several shopping malls has shown that public spaces without sound-absorbing treatment are too reverberant and the acoustic conditions are not comfortable. It affects the noise level and intelligibility, although these parameters depend not only on the acoustic characteristics of an enclosure. The reverberation time at middle frequencies determined by Equation (1) was chosen as the acoustic characteristic of the room itself. The reverberation times were in the range 3.5–5.1 s in the food courts and 2.7–3.4 s in the galleries.
It was shown that the Sabine’s sound decay low is valid for the studied spaces. On the basis of the Sabine’s low the average sound absorption coefficient is estimated. In spaces of different volume and geometry the sound absorption coefficients are similar, so it was concluded that the spaces without any absorbing treatment have comparable absorbing properties. It is proposed to use the average absorption coefficients given in Table 7 to estimate the reverberation time in the non-absorbing unoccupied spaces in accordance with Equation (4). It allows to make quick calculation of the reverberation time for preliminary evaluation of acoustic conditions, but more accurate calculations can be performed by means of simulations.
It is convenient to have a scale providing a qualitative assessment of the space by the reverberation time. Some literature sources give similar recommendations for the reverberation time in the public spaces of the shopping malls. Estimations based on the Sabine’s equation show that an effective absorber on the ceiling is not always enough to provide the desired reverberation time; the absorption should be added on the walls as well. So, the recommendations can be considered as a target that we need to get as close to as possible. This leads to the idea of a target reverberation time instead of an optimal reverberation time. The target threshold can be overcome when the reverberation time is shorter the target value and the overcoming is not an acoustic disadvantage of the space, while the optimal value concept considers as a disadvantage a deviation in any direction from the optimal value.
The usual way to improve the acoustic conditions in the public spaces is to apply sound-absorbing materials on ceiling and walls. The reverberation time in two considered food courts was significantly reduced due to the acoustical treatment. In the food court FC2 it changed from 4.7 s to 1.7 s and almost reached the target value. So the result of the acoustic correction can be regarded as sufficient and successful. In the food court FC1 the reverberation time decreased from 5.1 s to 2.8 s, the reached value was quite far from the target value. It would be possible to assess this result as insufficient, but the reverberation time was reduced by almost half and the food court became less reverberant and more comfortable. To assess such results an additional threshold separating appropriate and inappropriate values of the reverberation time is proposed. This threshold corresponds to the minimal acoustic comfort. It is important that the reverberation time is related to the space volume, therefore the thresholds have to depend on the volume as well.
Based on the analysis of the experimental data presented in this work and other studies [5,6,16,34], a scale for assessment of the reverberation time Tm is proposed. All values of Tm are divided into three ranges by the target reverberation time Ttar and the maximal acceptable reverberation time Tcom corresponding to minimal acoustic comfort:
- Tm < Ttar—good acoustics;
- Ttar < Tm < Tcom—appropriate acoustics;
- Tcom < Tm—bad acoustics.
The thresholds Ttar and Tcom are shown in Figure 11 by the solid and dotted lines, respectively. Also they can be expressed by the equations
where V is the space volume, m3.
Acoustic quality of the public spaces can be assessed by means of the proposed scale at the design stage. In case of negative predictions, the acoustics can be improved by means of architectural methods including changing the space geometry, increasing sound diffusion and application of sound-absorbing materials. For the operating spaces it helps to evaluate the acoustics objectively due to measurements and choose the desired reverberation time with regard to the existing constrains.
It should be emphasized that this study did not conduct a full assessment including evaluation by the visitors, employees and retail experts. However, the acoustic changes have to be subjectively evaluated to understand the relevance of the improvement caused by an absorbing treatment and compare them with the measurements. The parallel study of objective and subjective assessments of the acoustic improvement of public spaces is the goal of further research on this topic. The second point for future work is to collect data based on case studies to confirm or modify the proposed scale given by Equations (6) and (7).
7. Conclusions
Acoustics of public spaces in shopping malls is one of the factors determining comfortable environment for visitors. It is recognized that the creation of comfortable conditions in the shopping malls is important for their commercial success. This study, as well as many others, shows that large-volume spaces without a sound-absorbing treatment are always acoustically uncomfortable. The spaces are too reverberant and noisy, speech intelligibility is usually low. Good acoustic conditions can be provided only by the absorption, which is placed on a ceiling and walls. Presented examples of the food courts whose acoustics was improved and calculations show that a significant part of the space surfaces should be covered by the absorbing materials.
Two thresholds (target and maximum acceptable) and three ranges (good, appropriate and bad) for the reverberation time values were proposed for assessing the acoustic quality of the public spaces. This scale is intended primarily for the design stage and can be used by architects or acoustic consultants to analyze the soundscape and imply the necessary amount of sound-absorbing materials for surfaces or volume absorbers. At the same time the scale can be used for the existing spaces to assess their acoustic quality and, in case of a negative assessment, find a solution to improve the acoustics.
Funding
This research received no external funding.
Institutional Review Board Statement
Not applicable.
Informed Consent Statement
Not applicable.
Data Availability Statement
The data presented in this study are available on request from the author.
Acknowledgments
The author thanks Ilnur Basharov, Alex Fadeev, Sergey Karataev, Daniil Kursky and Anton Peretokin for their help in carrying out the acoustic measurements.
Conflicts of Interest
The author declares that he was involved as an acoustic consultant for objective acoustic evaluation of the considered spaces. The clients had no role in the design of the evaluation; in the collection, analyses, or interpretation of data; in the writing of the manuscript, or in the decision to publish the results. To exclude all suspicions of conflicts of interest the paper does not contain any indications of the locations of shopping malls, their photos and descriptions of non-acoustic features that allow identifying the malls.
References
- Biggar, S.; McAdams, D. Time Is Money: Shoppers Buy More When They Stay Longer; Path Intelligence: Portsmouth, UK, 2007. [Google Scholar]
- Treasure, J. Sound Business, 2nd ed.; Management Books 2000: Gloucestershire, UK, 2011. [Google Scholar]
- Meng, Q.; Kang, J. Influence of social and behavioural characteristics of users on their evaluation of subjective loudness and acoustic comfort in shopping malls. PLoS ONE 2013, 8, e54497. [Google Scholar] [CrossRef] [PubMed]
- Meng, Q.; Kang, J.; Jin, H. Field study on the influence of spatial and environmental characteristics on the evaluation of subjective loudness and acoustic comfort in underground shopping streets. Appl. Acoust. 2013, 74, 1001–1009. [Google Scholar] [CrossRef] [Green Version]
- Carvalho, A.; Pereira, C.F. Sound and noise in shopping malls. In Proceedings of the New-England NOISECON 16, Providence, RI, USA, 13–15 June 2016; pp. 70–77. [Google Scholar]
- Alnuman, N.; Altaweel, M.Z. Investigation of the acoustical environment in a shopping mall and its correlation to the acoustic comfort of the workers. Appl. Sci. 2020, 10, 1170. [Google Scholar] [CrossRef] [Green Version]
- Hodgson, M.; Steininger, G.; Razavi, Z. Measurement and prediction of speech and noise levels and the Lombard effect in eating establishments. J. Acoust. Soc. Am. 2007, 121, 2023–2033. [Google Scholar] [CrossRef]
- Rindel, J.H. Verbal communication and noise in eating establishments. Appl. Acoust. 2010, 71, 1156–1161. [Google Scholar] [CrossRef]
- Rindel, J.H. The acoustics of palaces for social gathering. In Proceedings of the Euronoise, Maastricht, The Netherlands, 31 May–3 June 2015; pp. 2429–2436. [Google Scholar]
- Bradley, J.S. Acoustical Measurements in 10 Atria; National Research Council of Canada: Ottawa, ON, Canada, 1998.
- Pimentel, R.L.; Esmeraldo, L.B.S.; Navarro, M.P.N. Sound pressure levels in food courts of shopping centers. Noise Vib. Worldw. 2008, 39, 26–30. [Google Scholar] [CrossRef]
- Chen, B.; Kang, J. Acoustic comfort in shopping mall atrium spaces—A case s in Sheffield Meadowhall. Archit. Sci. Rev. 2004, 47, 107–114. [Google Scholar] [CrossRef]
- Dökmeci, P.N.; Yılmazer, S. Relationships between measured levels and subjective ratings: A case study of the food-court area in CEPA shopping center, Ankara. Build. Acoust. 2012, 19, 57–73. [Google Scholar] [CrossRef]
- Meng, Q.; Liu, S.; Kang, J. Effect of children on the sound environment in fast-food restaurants. Appl. Acoust. 2020, 162, 107201. [Google Scholar] [CrossRef]
- Urban, D.; Zrnekova, J.; Zatko, P.; Maywald, C.; Rychtarikova, M. Acoustic comfort in atria covered by novel structural skins. Proc. Eng. 2016, 155, 361–368. [Google Scholar] [CrossRef] [Green Version]
- Nowicka, E. The acoustical assessment of the commercial spaces and buildings. Appl. Acoust. 2020, 169, 107491. [Google Scholar] [CrossRef]
- ISO 3382–2:2008. Acoustics—Measurement of Room Acoustic Parameters—Part 1: Reverberation Time in Ordinary Rooms; International Organization for Standardization: Geneva, Switzerland, 2008. [Google Scholar]
- Arana, M.; Vela, A.; San Martin, L. Calculating the impulse response in rooms using pseudo-impulsive acoustic sources. Acta Acust. United Acust. 2003, 89, 377–380. [Google Scholar]
- Papadakis, N.M.; Stavroulakis, G.E. Review of Acoustic Sources Alternatives to a Dodecahedron Speaker. Appl. Sci. 2019, 9, 3705. [Google Scholar] [CrossRef] [Green Version]
- ISO/IEC Guide 98-3:2008. Uncertainty of Measurement—Part 3: Guide to the Expression of Uncertainty in Measurement; ISO/IEC: Geneva, Switzerland, 2008. [Google Scholar]
- Harris, C.M. Absorption of sound in air versus humidity and temperature. J. Acoust. Soc. Am. 1966, 40, 148–159. [Google Scholar] [CrossRef] [Green Version]
- Everest, F.A.; Pohlmann, K.C. Master Handbook of Acoustics, 5th ed.; McCraw-Hills: New York, NY, USA, 2009. [Google Scholar]
- Beranek, L. Concert Halls and Opera Houses: Music, Acoustics, and Architecture, 2nd ed.; Springer: New York, NY, USA, 2004. [Google Scholar]
- Joyce, W.B. Sabine’s reverberation time and ergodic auditorium. J. Acoust. Soc. Am. 1975, 58, 643–655. [Google Scholar] [CrossRef]
- Kuttruff, H. Room Acoustics; Spon Press: London, UK, 2000. [Google Scholar]
- Kanev, N. Sound decay in a rectangular room with impedance walls. Acoust. Phys. 2012, 58, 603–609. [Google Scholar] [CrossRef]
- Kanev, N. Sound decay in a rectangular room with specular and diffuse reflecting surfaces. In Proceedings of the Forum Acusticum, Aalborg, Denmark, 27 June–1 July 2011; pp. 1935–1940. [Google Scholar]
- Hodgson, M. Evidence of diffuse surface reflections in rooms. J. Acoust. Soc. Am. 1991, 89, 765–771. [Google Scholar] [CrossRef]
- Kuttruff, H. A simple iteration scheme for the computation of decay constants in enclosures with diffusely reflecting boundaries. J. Acoust. Soc. Am. 1995, 96, 288–293. [Google Scholar] [CrossRef]
- Kang, J. Reverberation in rectangular long enclosures with geometrically reflecting boundaries. Acta Acust. United Acust. 1996, 82, 509–516. [Google Scholar]
- Kanev, N. Reverberation in a trapezoidal room. Acoust. Phys. 2013, 59, 559–564. [Google Scholar] [CrossRef]
- Mortessagne, F.; Legrand, O.; Sornette, D. Role of the absorption distribution and generalization of exponential reverberation law in chaotic rooms. J. Acoust. Soc. Am. 1993, 94, 154–161. [Google Scholar] [CrossRef]
- Zhao, W.; Kang, J.; Jin, H. Effects of geometry on the sound field in atria. Build. Simul. 2017, 10, 25–39. [Google Scholar] [CrossRef]
- SP 51.13330.2011. Noise Protection; Standartinform: Moscow, Russia, 2017.
Figure 1.
Floor plans and sections of the studied food courts. Red lines show the ceiling contour if it does not coincide with the floor contour.
Figure 1.
Floor plans and sections of the studied food courts. Red lines show the ceiling contour if it does not coincide with the floor contour.

Figure 2.
Floor plans and sections of the studied galleries.

Figure 3.
Measured reverberation time in the food courts (a) and galleries (b).

Figure 4.
Reverberation time Tm in dependence on the volume of the food courts (blue points) and galleries (red points). Dotted line shows the linear approximation (3) of this dependance.
Figure 4.
Reverberation time Tm in dependence on the volume of the food courts (blue points) and galleries (red points). Dotted line shows the linear approximation (3) of this dependance.

Figure 5.
Absorption coefficients of food courts (a) and galleries (b).

Figure 6.
Average noise levels and the range of noise levels measured in the food court FC1 with (red) and without (blue) visitors.
Figure 6.
Average noise levels and the range of noise levels measured in the food court FC1 with (red) and without (blue) visitors.

Figure 7.
Absorption coefficient (a) of a porous coating on the ceiling in the food court FC1 and reverberation time (b) measured before (red) and after (blue) reconstruction in comparison with the expected one (blue, dotted).
Figure 7.
Absorption coefficient (a) of a porous coating on the ceiling in the food court FC1 and reverberation time (b) measured before (red) and after (blue) reconstruction in comparison with the expected one (blue, dotted).

Figure 8.
Change of the food court space and location of sound-absorbing baffles (red) in the food court FC2.
Figure 8.
Change of the food court space and location of sound-absorbing baffles (red) in the food court FC2.

Figure 9.
Absorption area (a) of baffles on the ceiling in the food court FC2 and reverberation time (b) measured before (red) and after (blue) reconstruction in comparison with the expected one (blue, dotted).
Figure 9.
Absorption area (a) of baffles on the ceiling in the food court FC2 and reverberation time (b) measured before (red) and after (blue) reconstruction in comparison with the expected one (blue, dotted).


Figure 11.
Estimated reverberation time Tm in the studied food courts (blue points) and galleries (red points) with two types of acoustic treatment; measured reverberation time (×) in the food courts FC1 and FC2. The solid line is recommended reverberation time according to [34], the dotted line is 1 s higher than the solid one.


Table 1.
Geometrical characteristics of the food courts.
| Food Court | Volume, m3 | Ceiling Area, m2 | Average Height, m |
|---|---|---|---|
| FC1 | 106,000 | 5100 | 18.2 |
| FC2 | 52,000 | 3850 | 13.5 |
| FC3 | 72,000 | 6450 | 13.4 |
| FC4 | 71,000 | 5000 | 15.5 |
| FC5 | 29,500 | 2600 | 9.2 |
Table 2.
Geometrical characteristics of the galleries.
| Gallery | Volume, m3 | Ceiling Area, m2 | Length, m |
|---|---|---|---|
| G1 | 14,500 | 1240 | 112 |
| G2 | 37,000 | 3590 | 215 |
| G3 | 31,000 | 3200 | 234 |
Table 3.
Number of analyzed room impulse responses (RIRs).
| Space | Source Positions | Microphone Positions | Analyzed RIRs |
|---|---|---|---|
| FC1 | 3 | 6 | 10 |
| FC2 | 2 | 5 | 7 |
| FC3 | 2 | 6 | 9 |
| FC4 | 3 | 5 | 9 |
| FC5 | 3 | 6 | 10 |
| G1 | 2 | 3 | 5 |
| G2 | 4 | 4 | 9 |
| G3 | 3 | 4 | 8 |
Table 4.
Expanded uncertainty of the measured reverberation time T20, s.
| Space | 125 Hz | 250 Hz | 500 Hz | 1 kHz | 2 kHz | 4 kHz |
|---|---|---|---|---|---|---|
| FC1 | 0.10 | 0.07 | 0.06 | 0.08 | 0.08 | 0.12 |
| FC2 | 0.17 | 0.12 | 0.17 | 0.05 | 0.09 | 0.06 |
| FC3 | 0.10 | 0.13 | 0.08 | 0.06 | 0.08 | 0.11 |
| FC4 | 0.15 | 0.07 | 0.11 | 0.14 | 0.14 | 0.14 |
| FC5 | 0.12 | 0.13 | 0.19 | 0.18 | 0.10 | 0.10 |
| G1 | 0.12 | 0.11 | 0.12 | 0.10 | 0.11 | 0.12 |
| G2 | 0.20 | 0.15 | 0.17 | 0.18 | 0.13 | 0.10 |
| G3 | 0.12 | 0.11 | 0.15 | 0.16 | 0.20 | 0.18 |
Table 5.
Measured acoustic parameters of the studied spaces.
| Space | Tm, s | Bass Ratio |
|---|---|---|
| FC1 | 5.1 | 0.79 |
| FC2 | 4.7 | 0.57 |
| FC3 | 4.4 | 0.69 |
| FC4 | 3.9 | 0.77 |
| FC5 | 3.5 | 0.75 |
| G1 | 2.7 | 0.73 |
| G2 | 3.1 | 0.68 |
| G3 | 3.4 | 0.74 |
Table 6.
Curvature parameter C, %.
| Space | 125 Hz | 250 Hz | 500 Hz | 1 kHz | 2 kHz | 4 kHz |
|---|---|---|---|---|---|---|
| FC1 | - | 0.3 | 0.0 | 0.4 | 1.5 | 4.9 |
| FC2 | 0.5 | 0.4 | 1.8 | 1.0 | 0.7 | 1.9 |
| FC3 | - | 2.3 | 1.2 | 0.1 | 0.3 | 4.3 |
| FC4 | - | 2.5 | 1.6 | 4.0 | 1.5 | 4.8 |
| FC5 | - | - | - | 1.0 | 2.1 | 5.0 |
| G1 | 1.9 | 1.0 | 1.4 | 2.2 | 1.5 | 2.7 |
| G2 | 0.8 | 1.9 | 2.0 | 4.1 | 4.4 | 4.2 |
| G3 | - | 2.3 | 1.8 | 0.7 | 1.4 | 1.3 |
Table 7.
Average absorption coefficients.
| Space | 125 Hz | 250 Hz | 500 Hz | 1 kHz | 2 kHz | 4 kHz |
|---|---|---|---|---|---|---|
| Food courts | 0.24 | 0.21 | 0.17 | 0.16 | 0.14 | 0.15 |
| Galleries | 0.21 | 0.19 | 0.15 | 0.14 | 0.14 | 0.16 |
Table 8.
Calculated reverberation time due to acoustic improvement.
| Space | Area, 103 m2 | Acoustic Treatment Configuration | |||||
|---|---|---|---|---|---|---|---|
| Ceiling | Ceiling + ½ Walls | ||||||
| Ceiling | Walls | Total | T500, s | T1000, s | T500, s | T1000, s | |
| FC1 | 5.1 | 6.2 | 16.4 | 2.64 | 2.68 | 1.95 | 1.97 |
| FC2 | 3.9 | 3.4 | 11.1 | 1.79 | 1.82 | 1.41 | 1.43 |
| FC3 | 6.5 | 4.6 | 17.5 | 1.89 | 1.92 | 1.55 | 1.56 |
| FC4 | 5.0 | 6.3 | 16.3 | 1.79 | 1.82 | 1.31 | 1.33 |
| FC5 | 2.6 | 3.8 | 9.0 | 1.40 | 1.42 | 0.99 | 1.00 |
| G1 | 1.2 | 2.6 | 5.1 | 1.38 | 1.41 | 0.87 | 0.88 |
| G2 | 3.6 | 4.8 | 12.0 | 1.33 | 1.35 | 0.95 | 0.95 |
| G3 | 3.2 | 4.8 | 11.2 | 1.23 | 1.24 | 0.85 | 0.86 |
Publisher’s Note: MDPI stays neutral with regard to jurisdictional claims in published maps and institutional affiliations. |
© 2021 by the author. Licensee MDPI, Basel, Switzerland. This article is an open access article distributed under the terms and conditions of the Creative Commons Attribution (CC BY) license (http://creativecommons.org/licenses/by/4.0/).
Share and Cite
MDPI and ACS Style
Kanev, N. Study and Improvement of Acoustic Conditions in Public Spaces of Shopping Malls. Acoustics 2021, 3, 137-155. https://0-doi-org.brum.beds.ac.uk/10.3390/acoustics3010011
AMA Style
Kanev N. Study and Improvement of Acoustic Conditions in Public Spaces of Shopping Malls. Acoustics. 2021; 3(1):137-155. https://0-doi-org.brum.beds.ac.uk/10.3390/acoustics3010011
Chicago/Turabian StyleKanev, Nikolay. 2021. "Study and Improvement of Acoustic Conditions in Public Spaces of Shopping Malls" Acoustics 3, no. 1: 137-155. https://0-doi-org.brum.beds.ac.uk/10.3390/acoustics3010011