
The Difference in Subjective Experience Related to Acoustic Treatments in an Ordinary Public Room: A Case Study


Abstract
:1. Introduction
1.1. Room Acoustics in Ordinary Rooms
1.2. Room Acoustics and Subjective Experience
1.3. Study Objective and Principal Conclusion
2. Materials and Methods
2.1. Acoustic Treatment
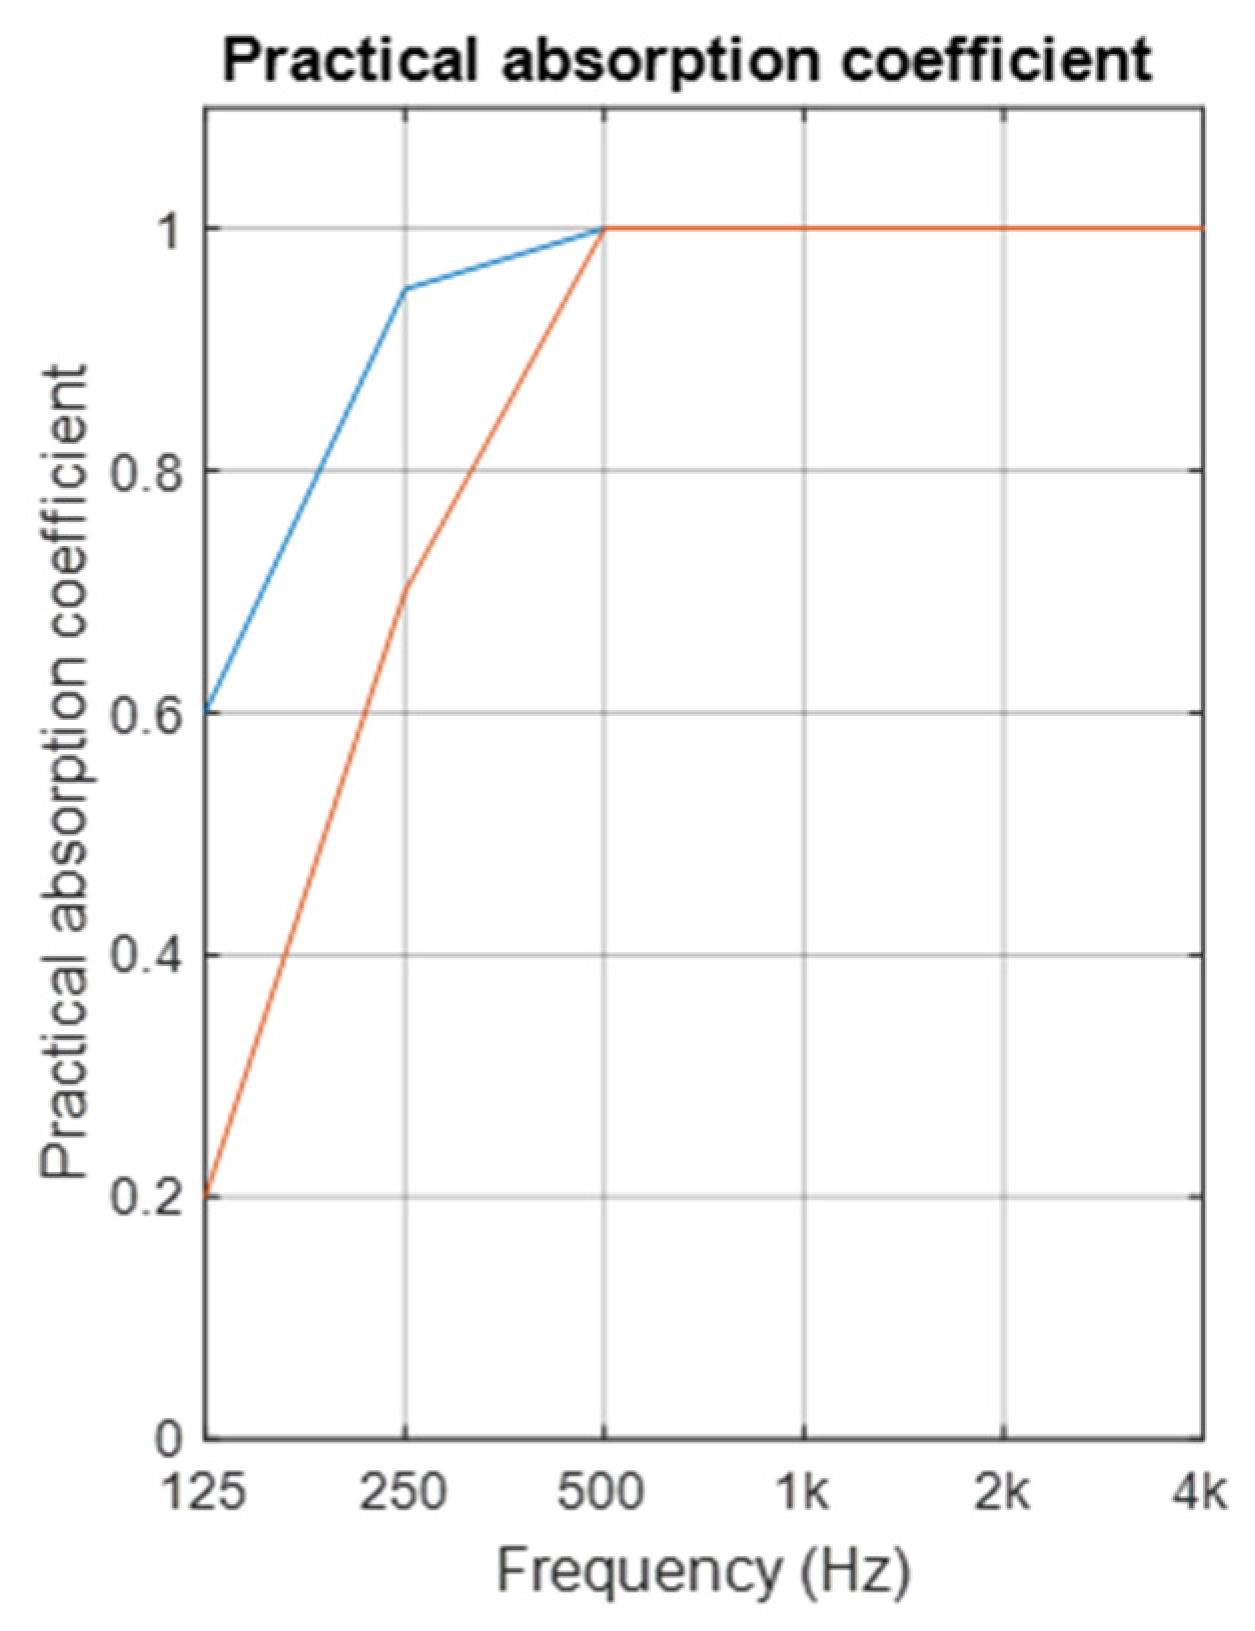
2.1.1. Porous Absorber
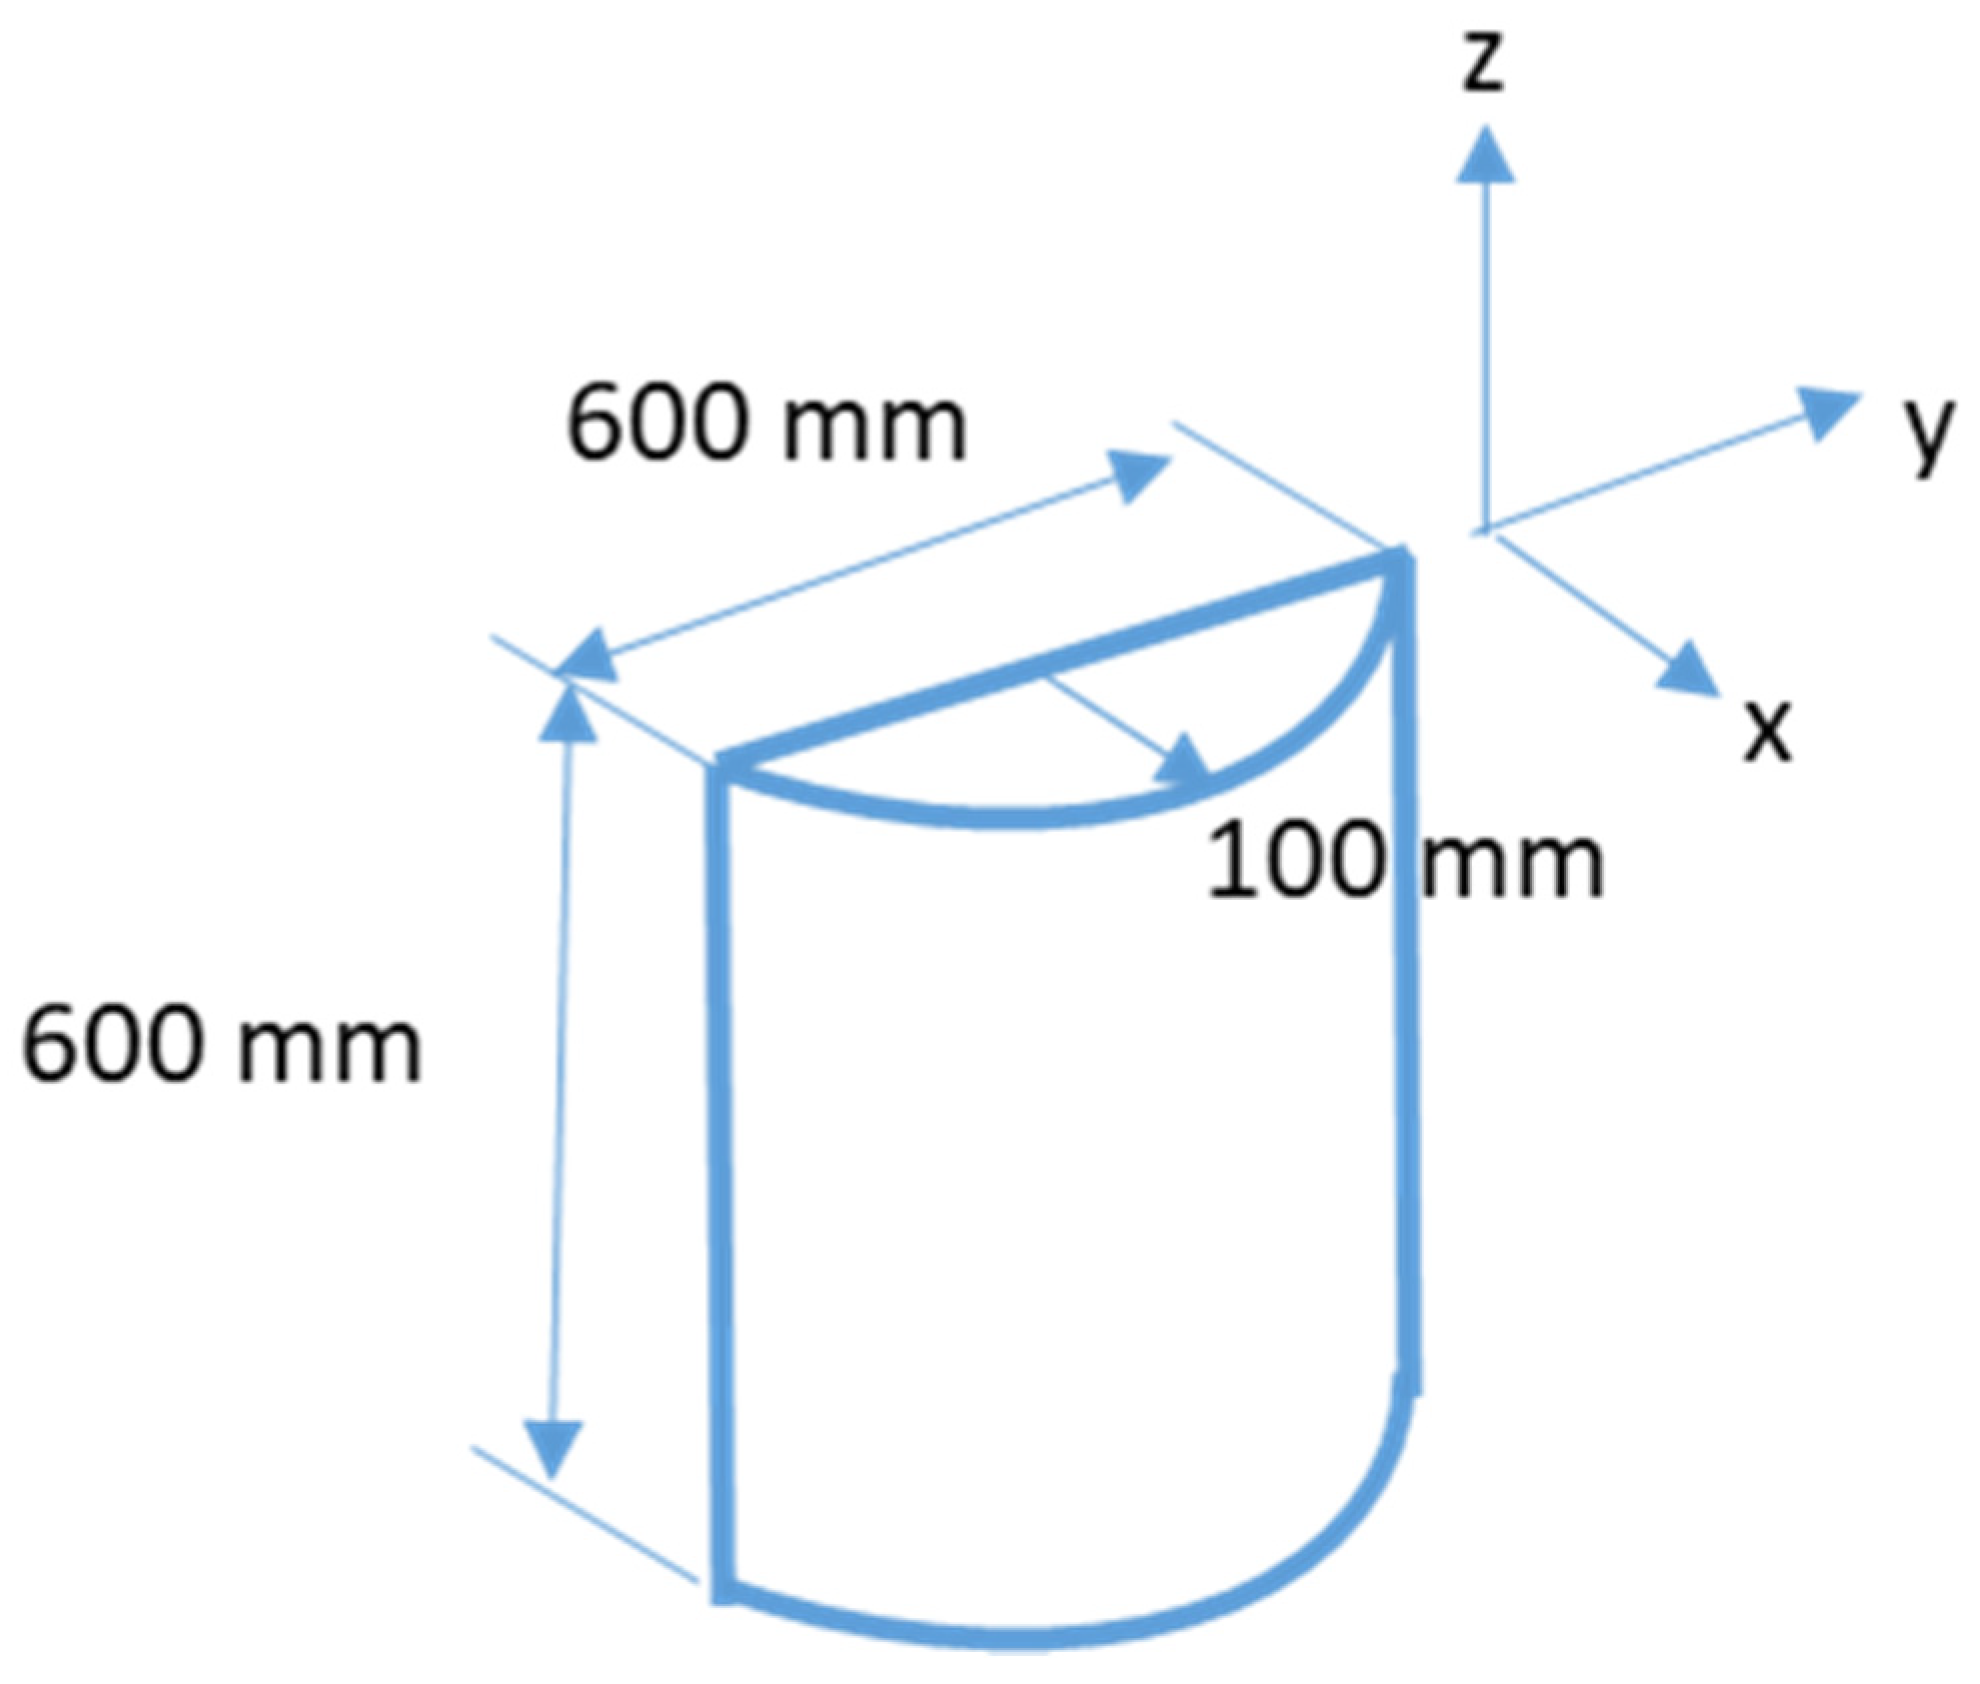
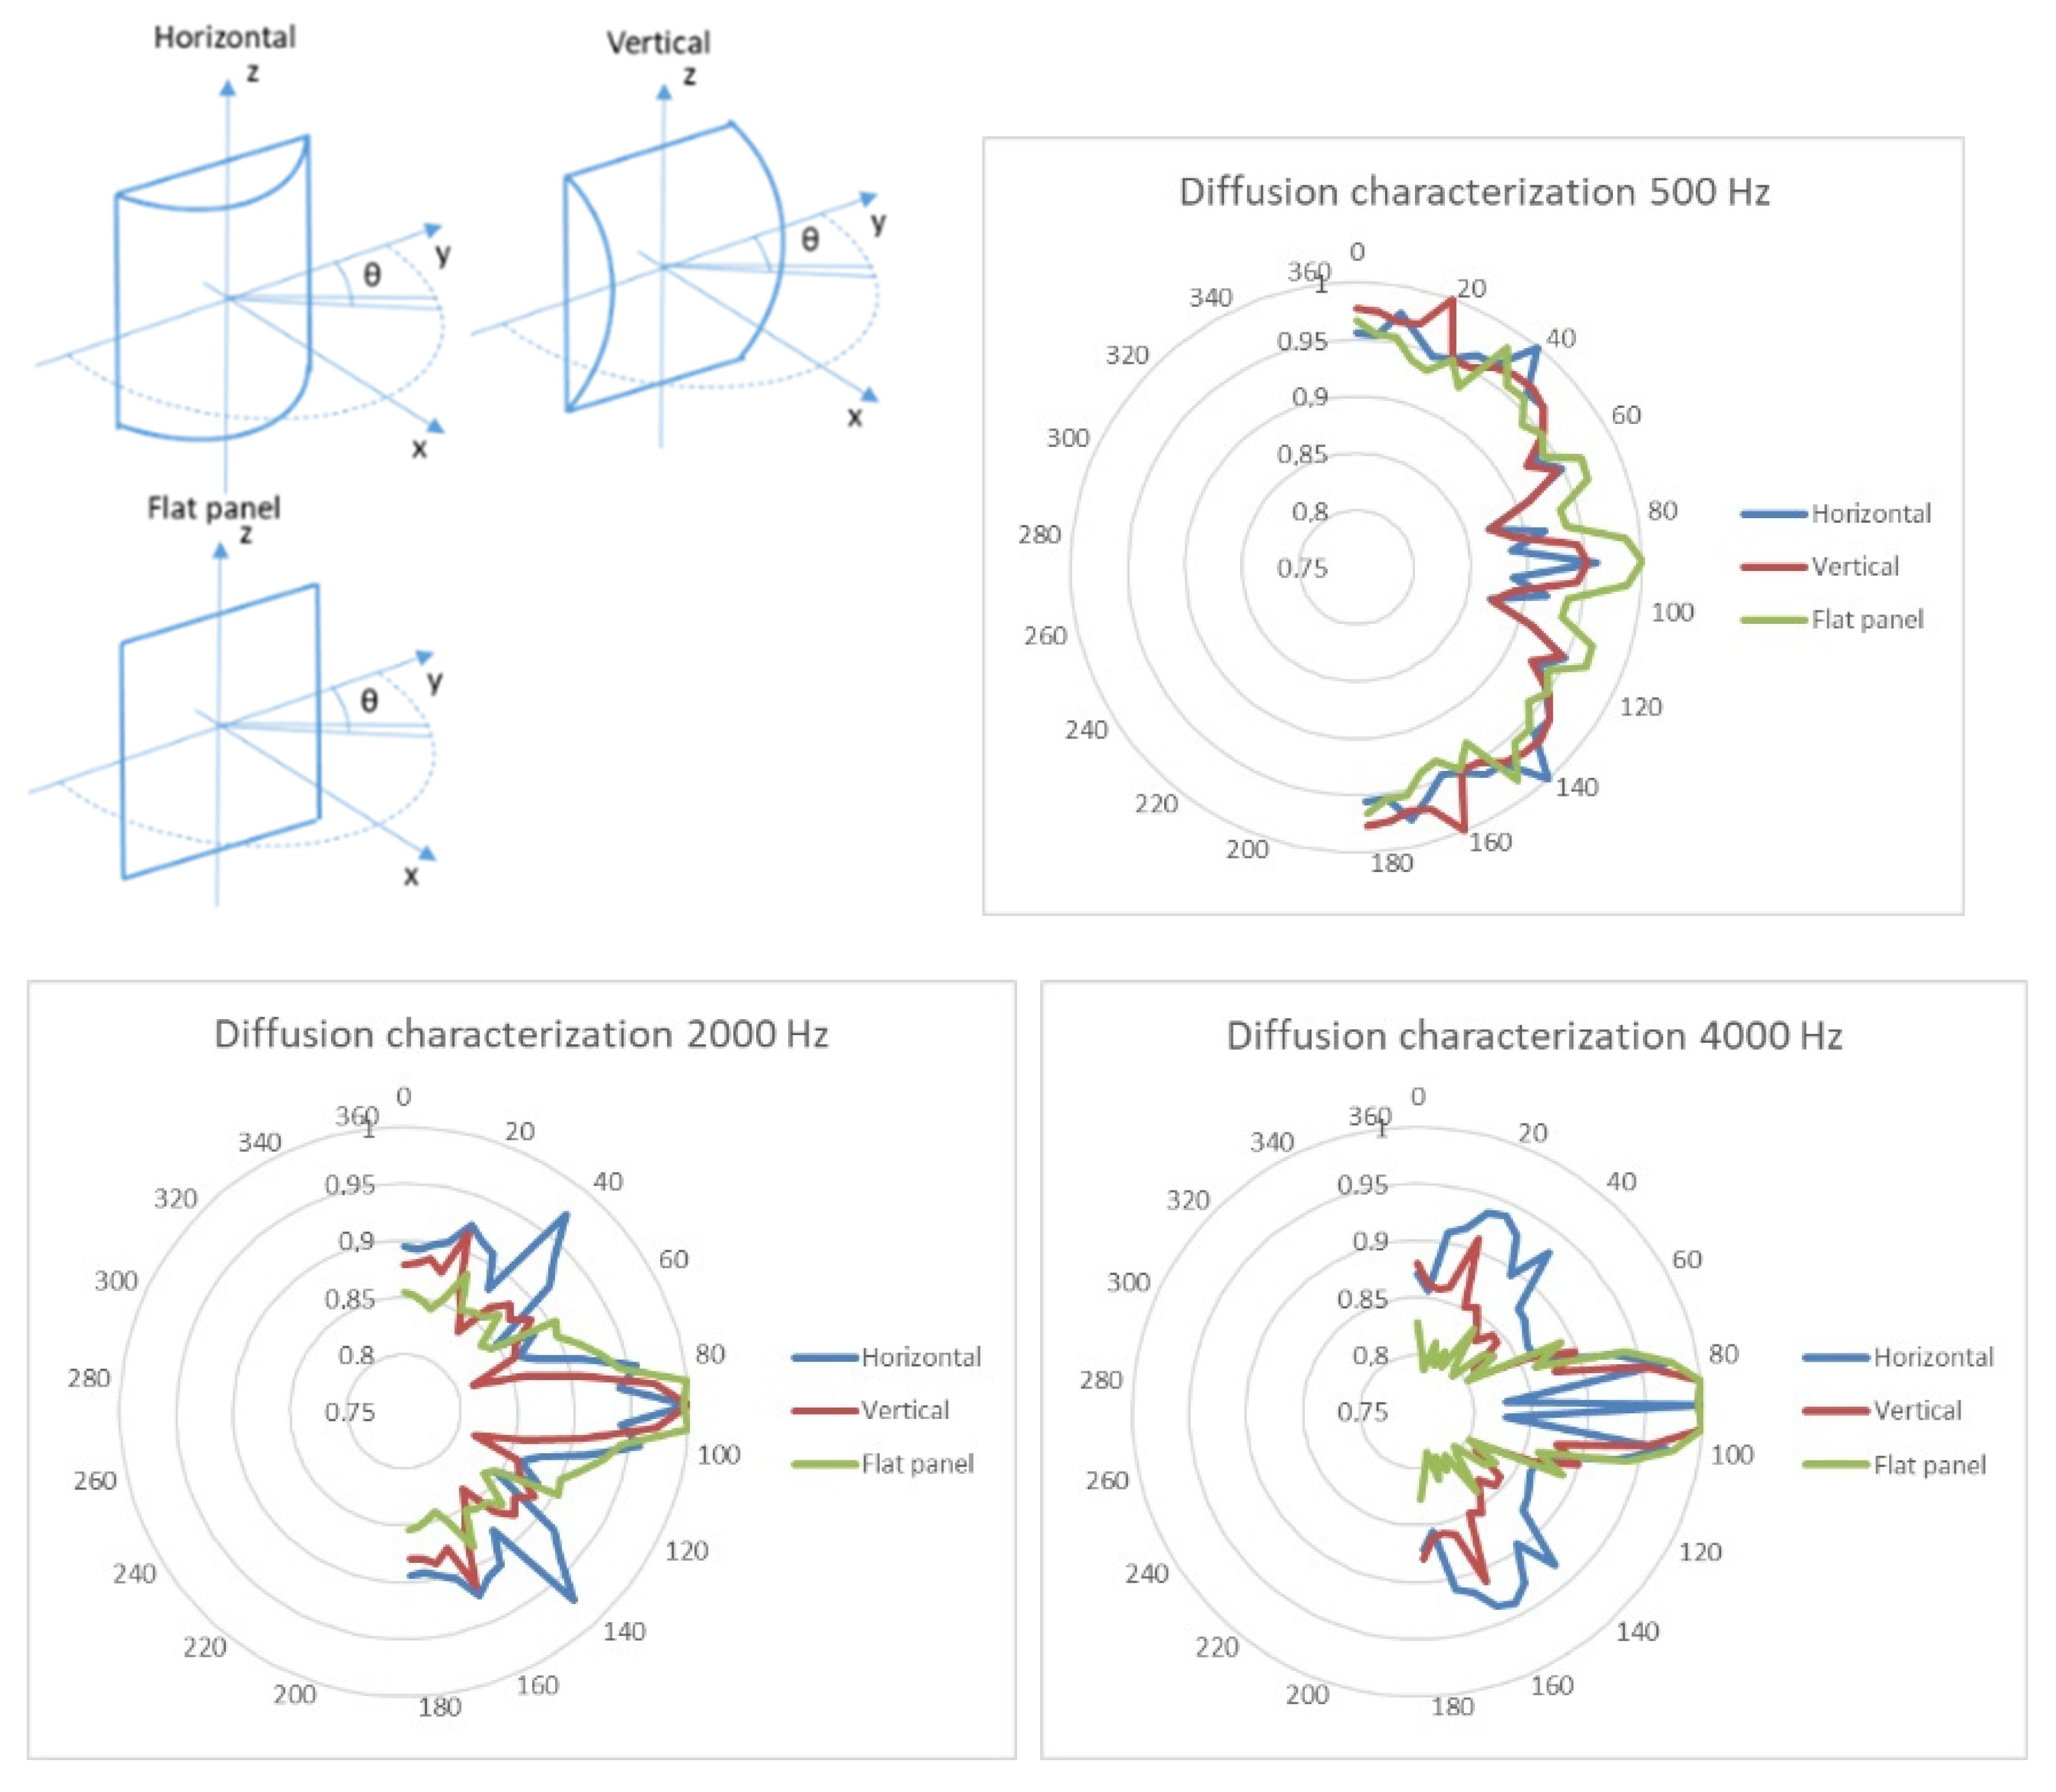
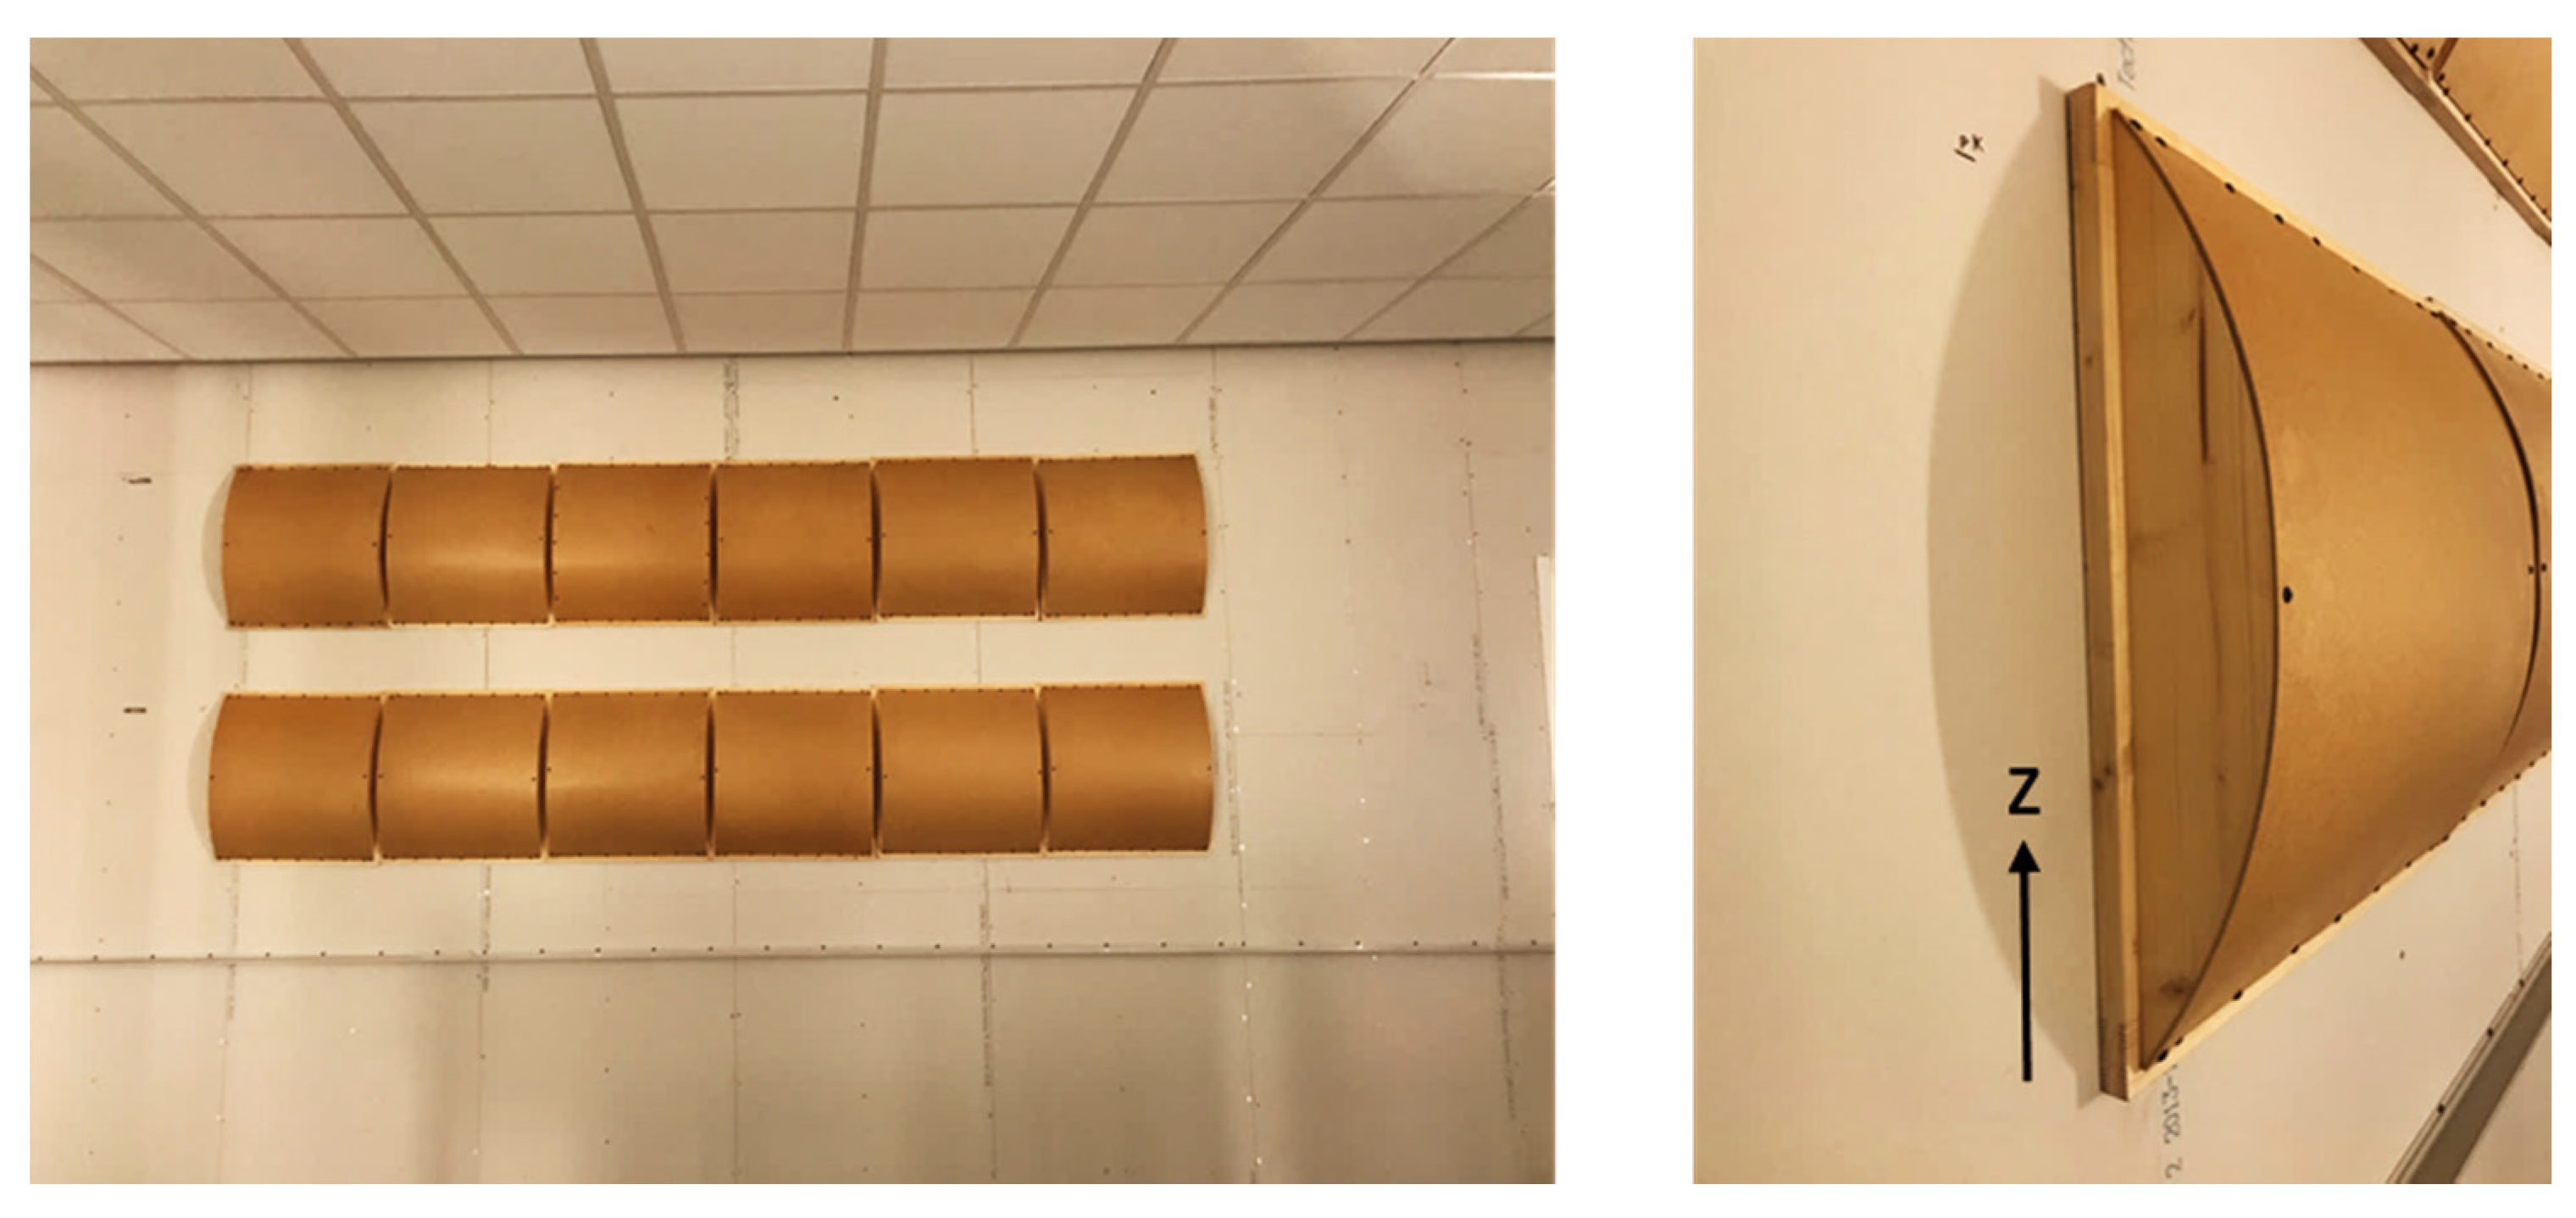
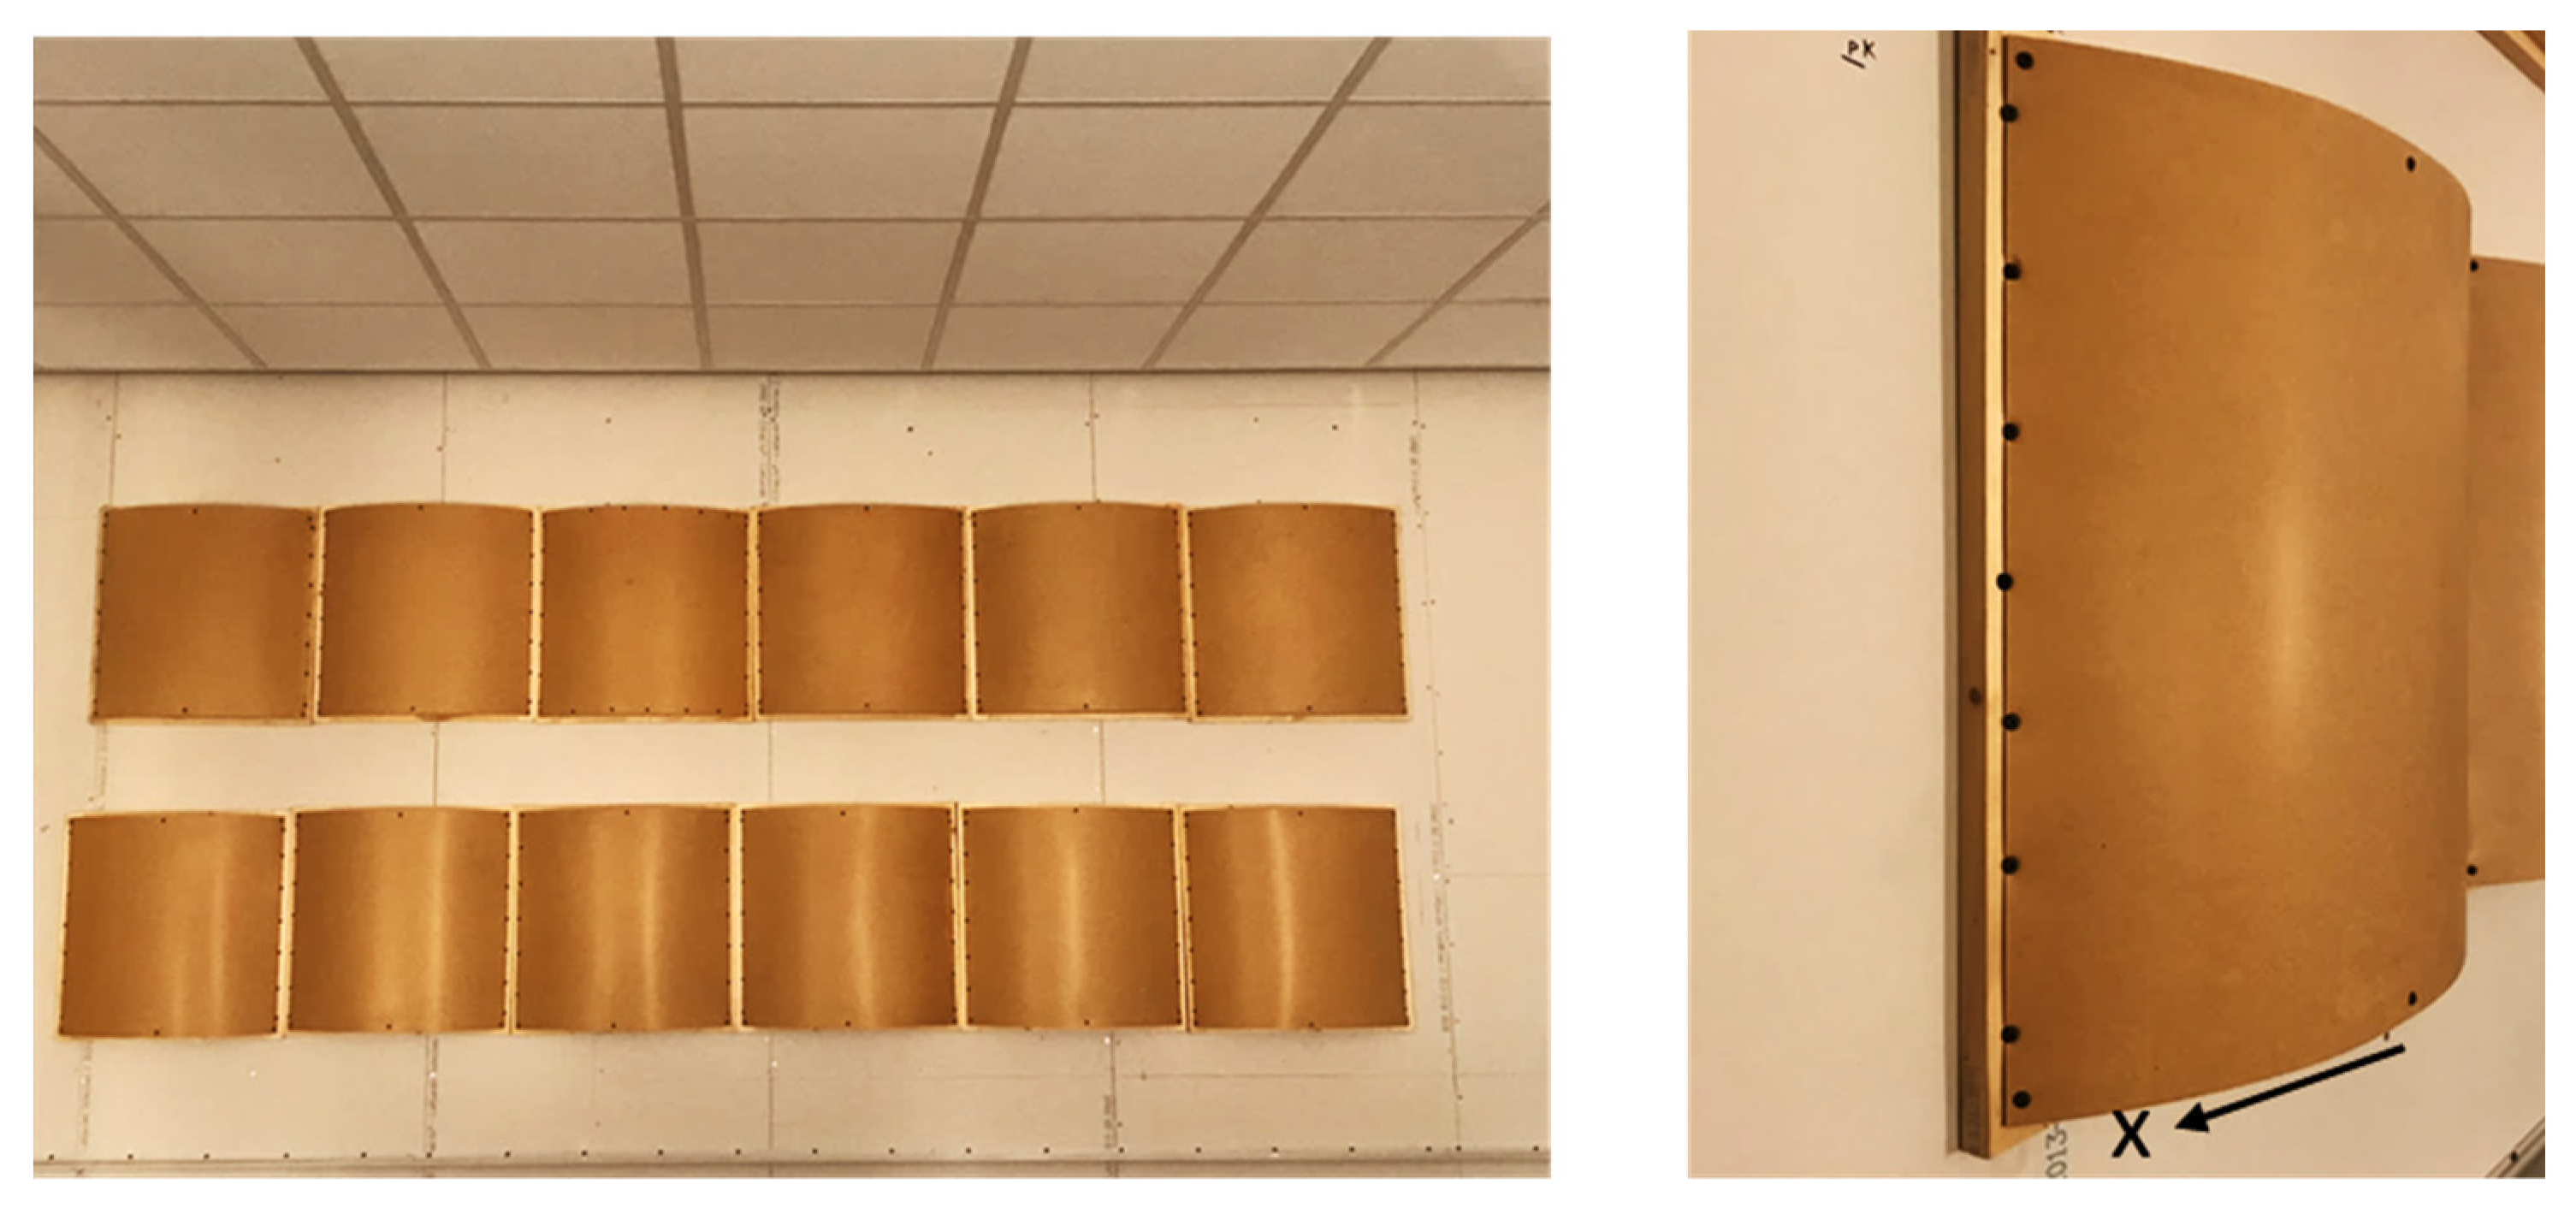
2.1.2. Diffusers
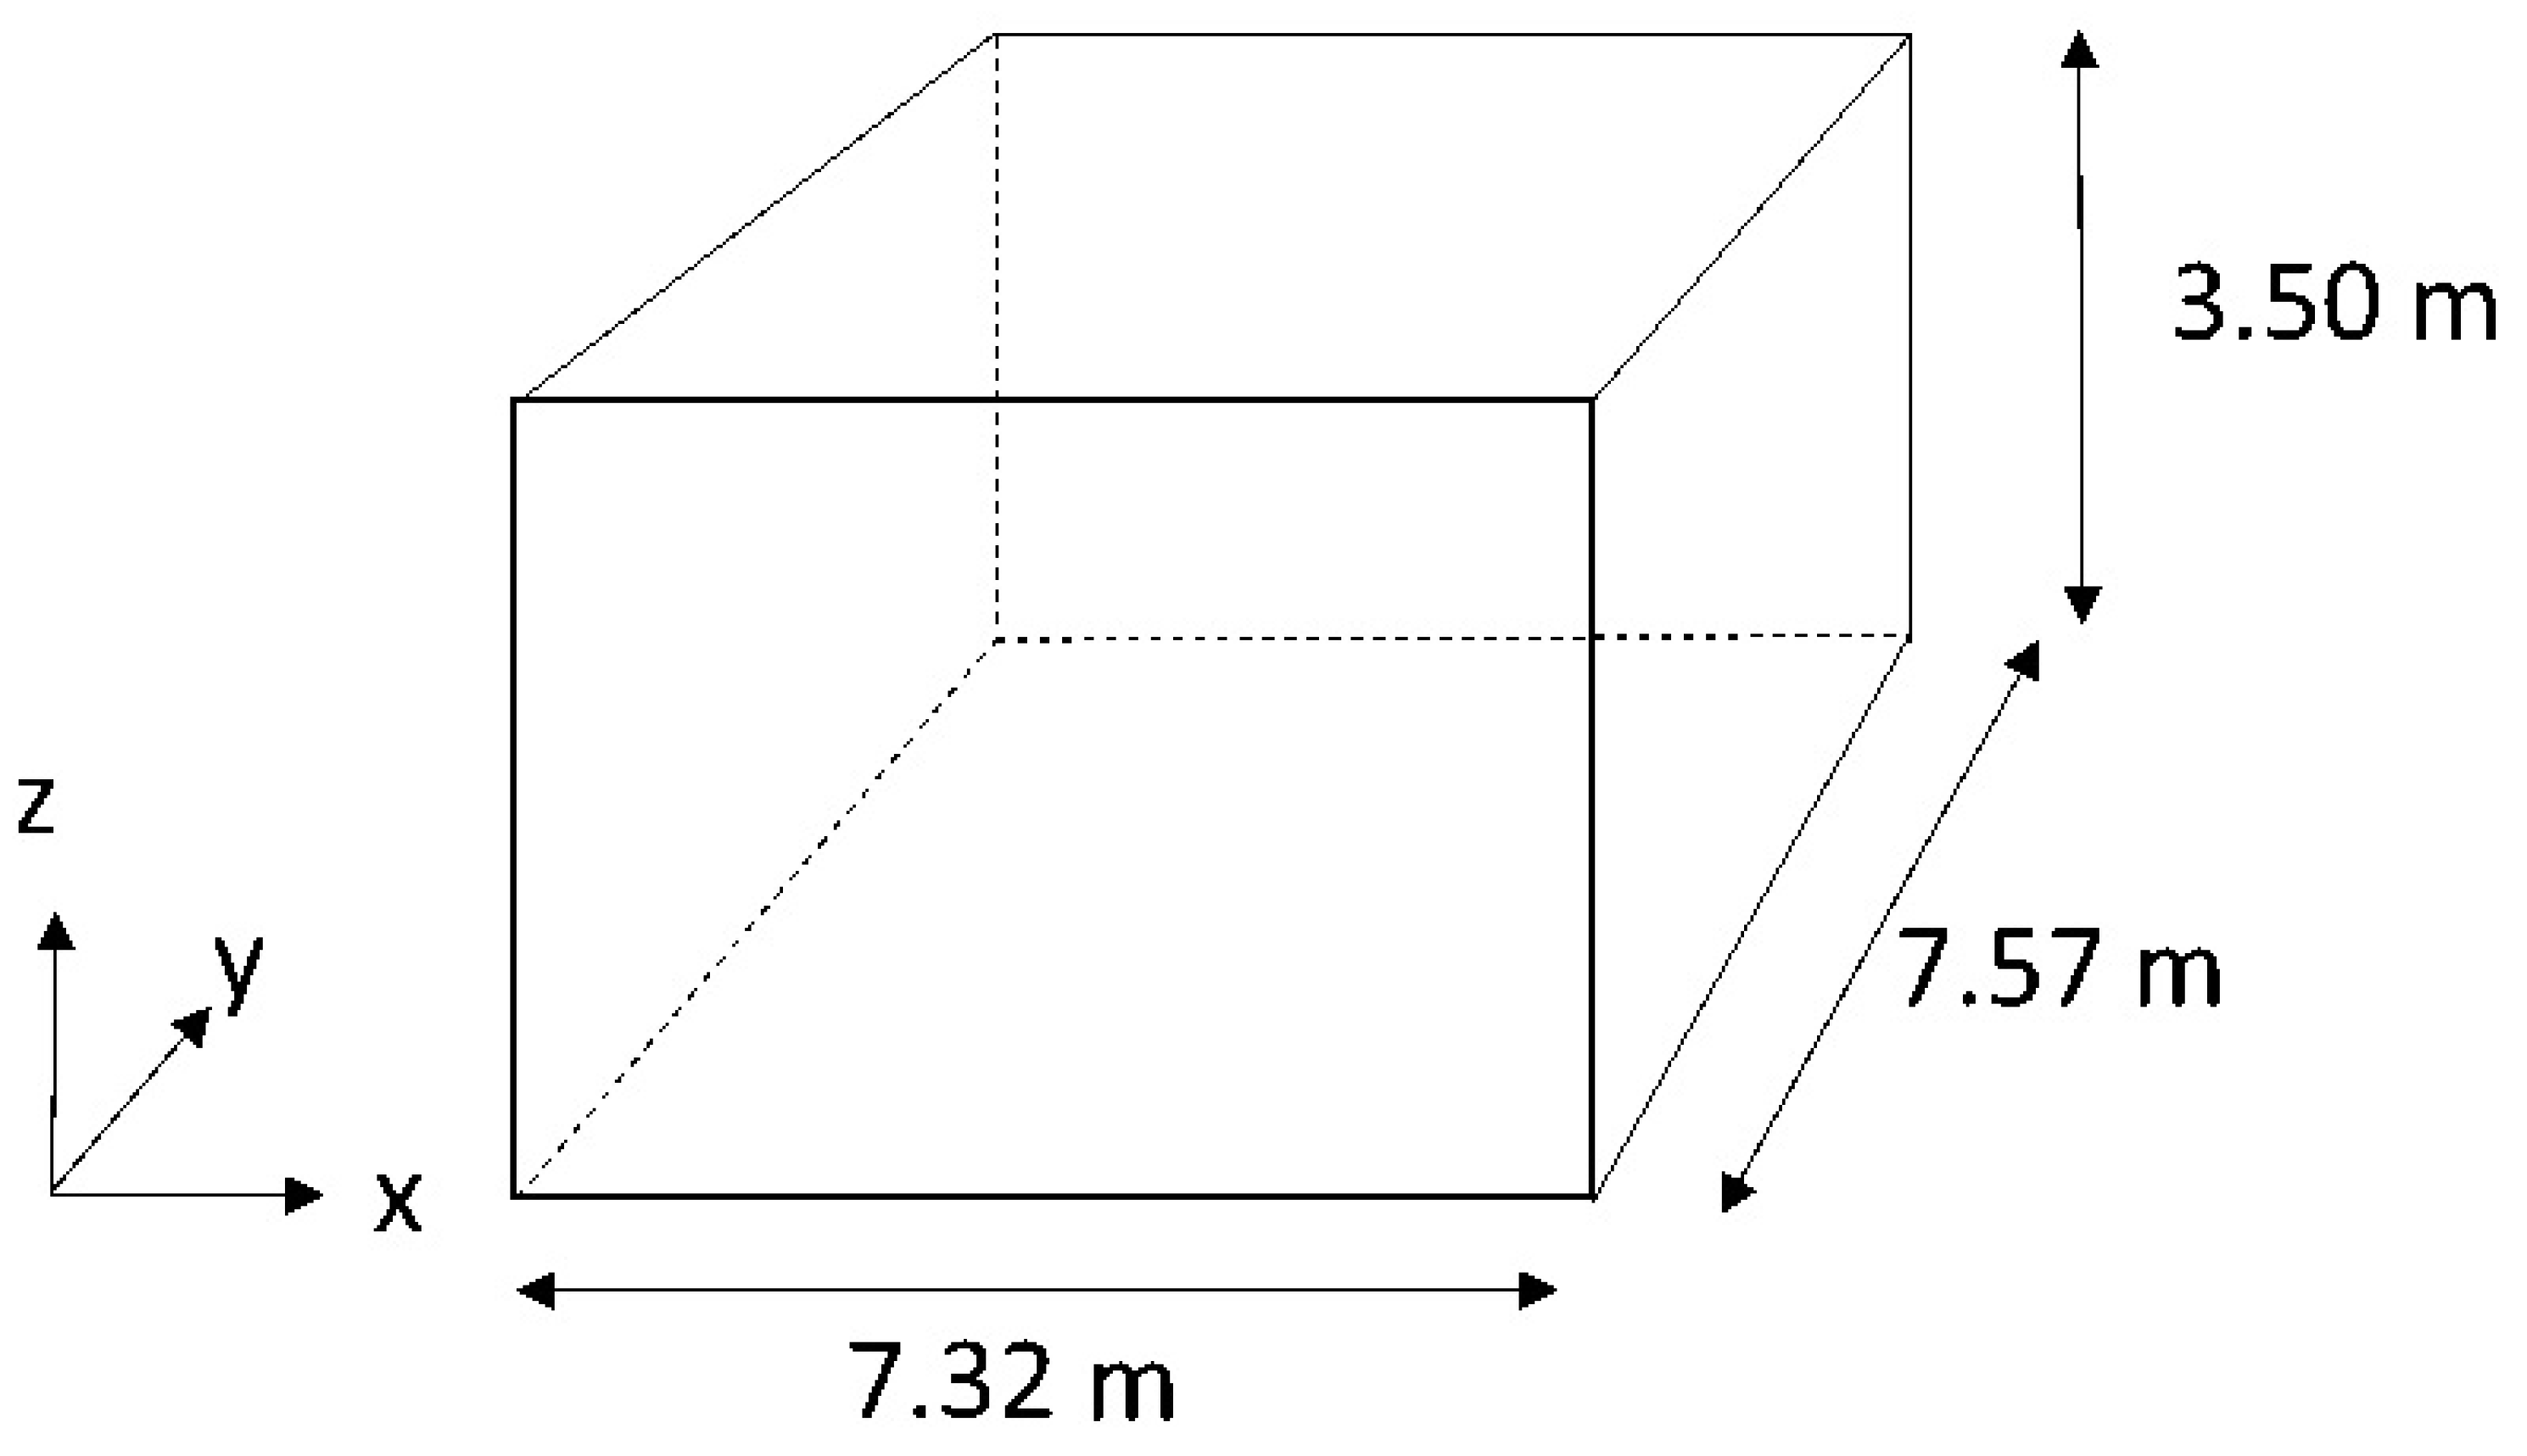
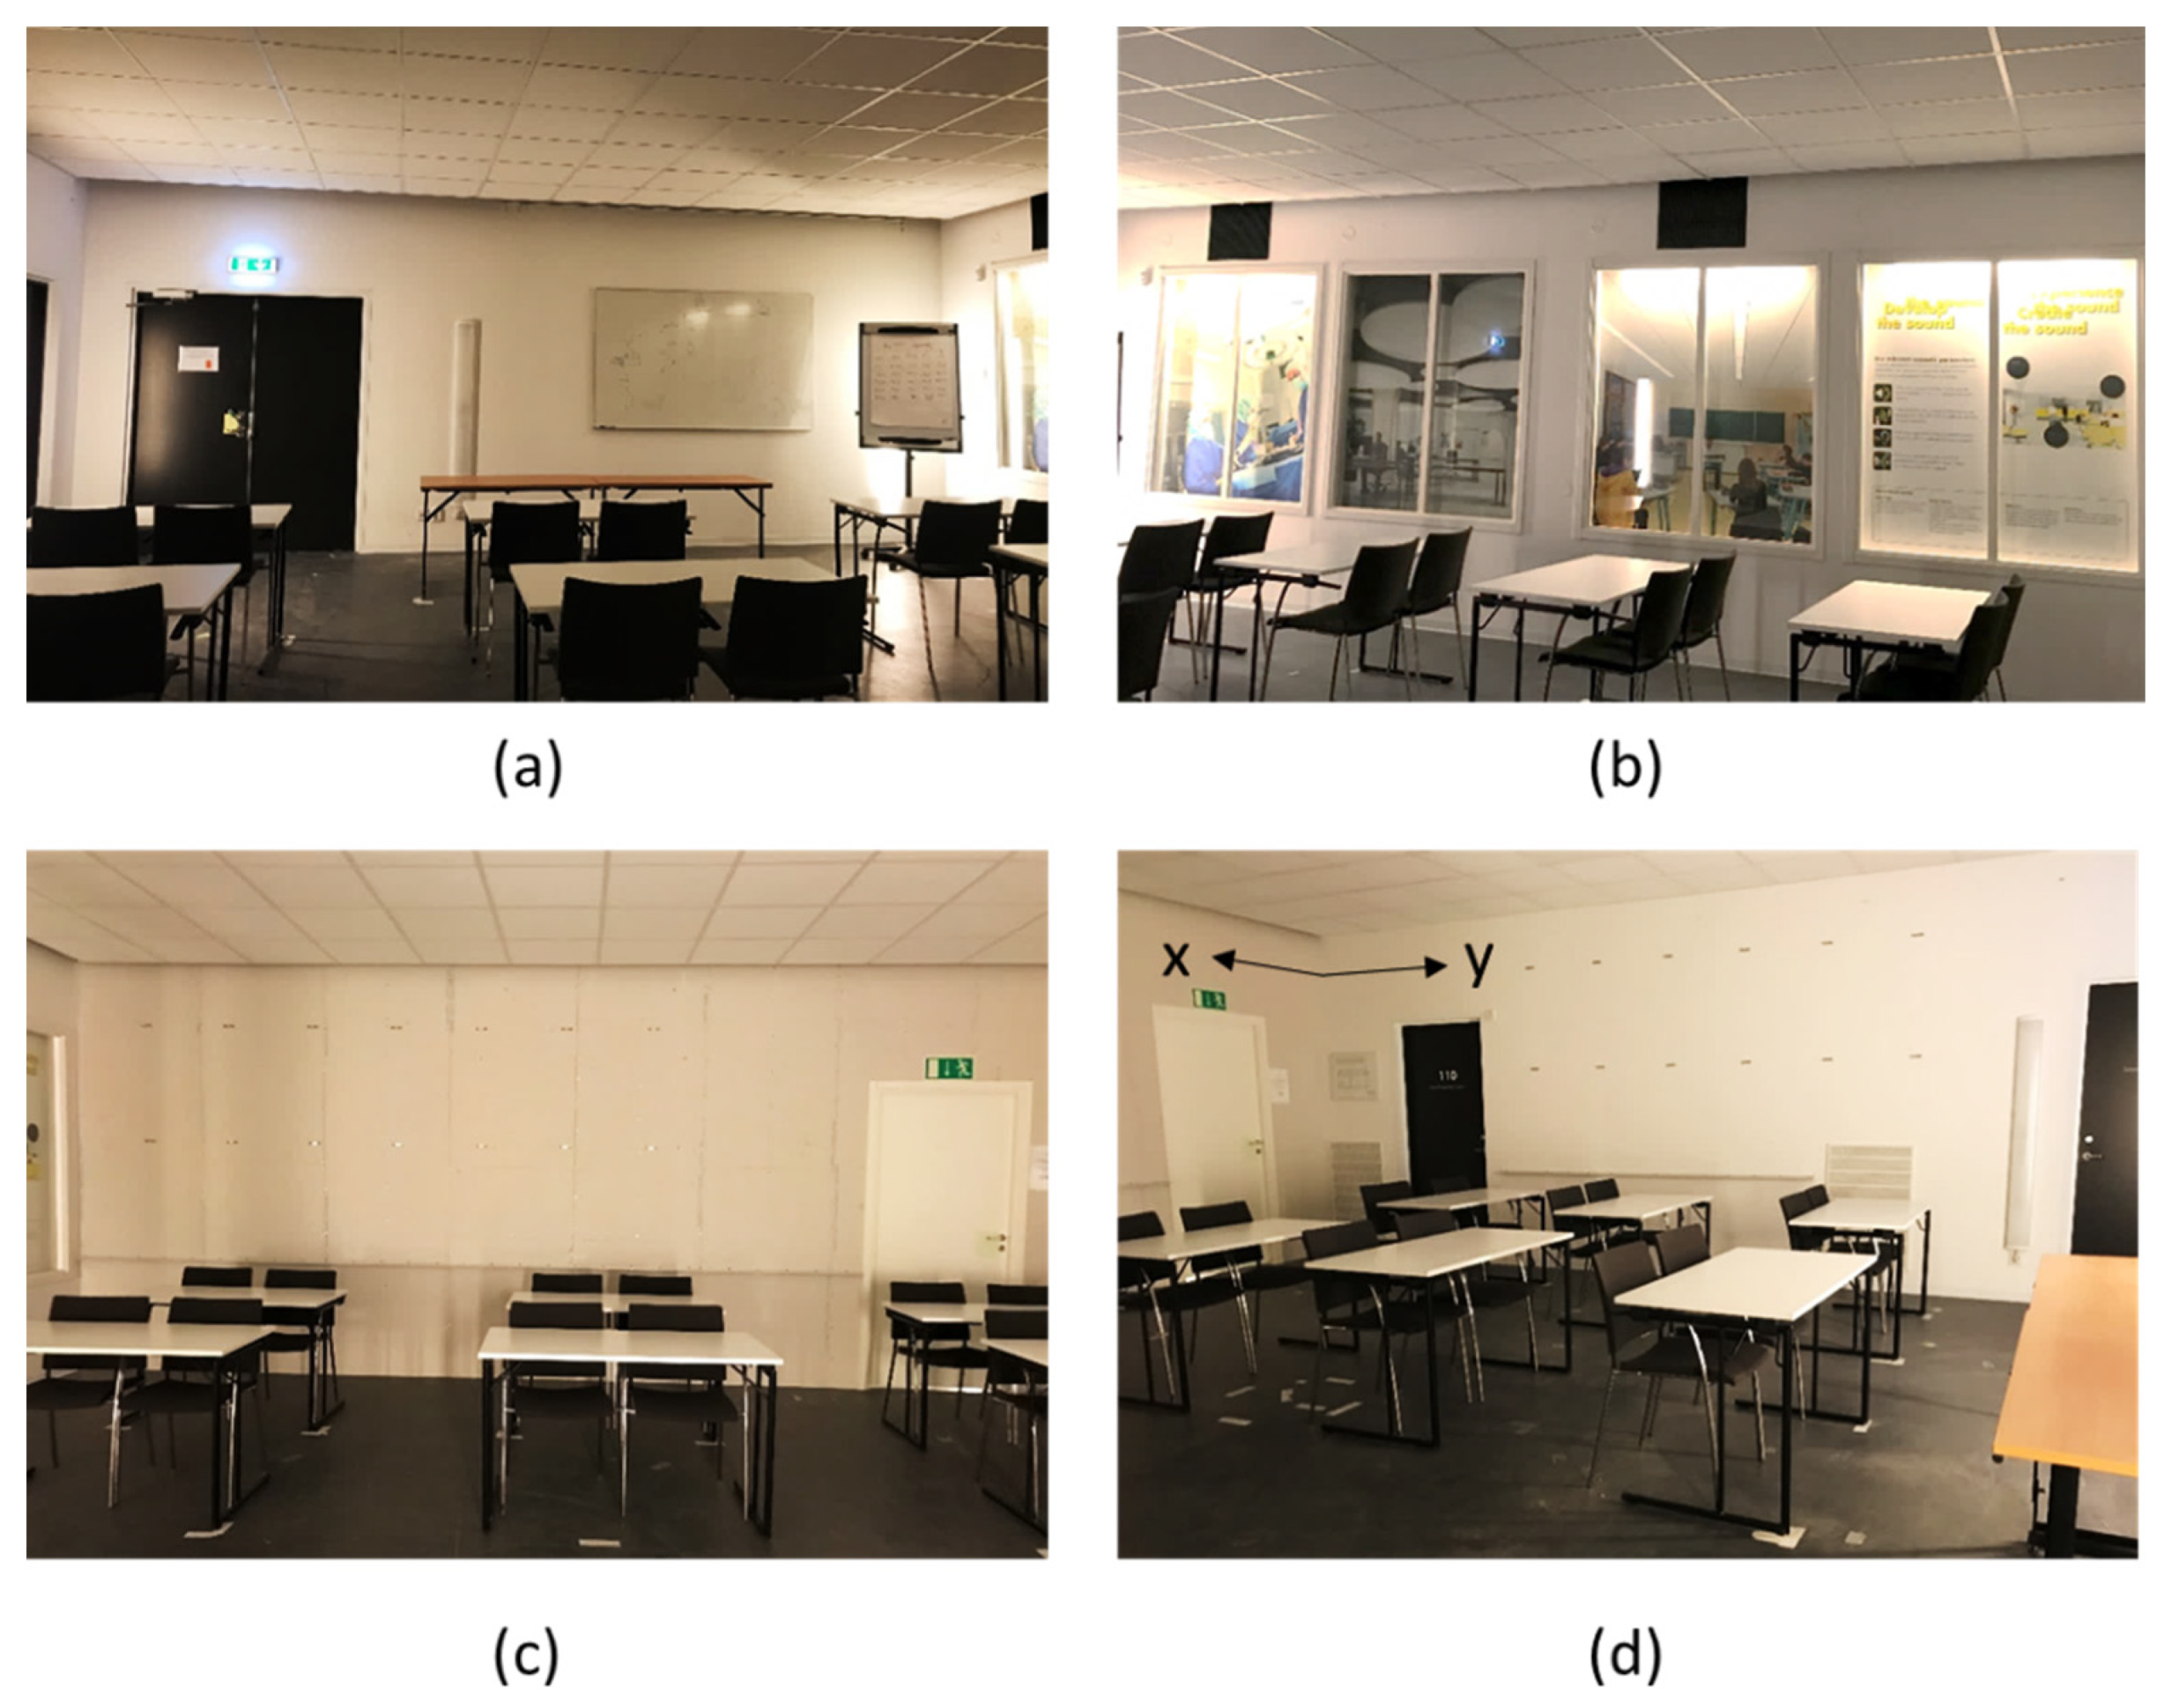
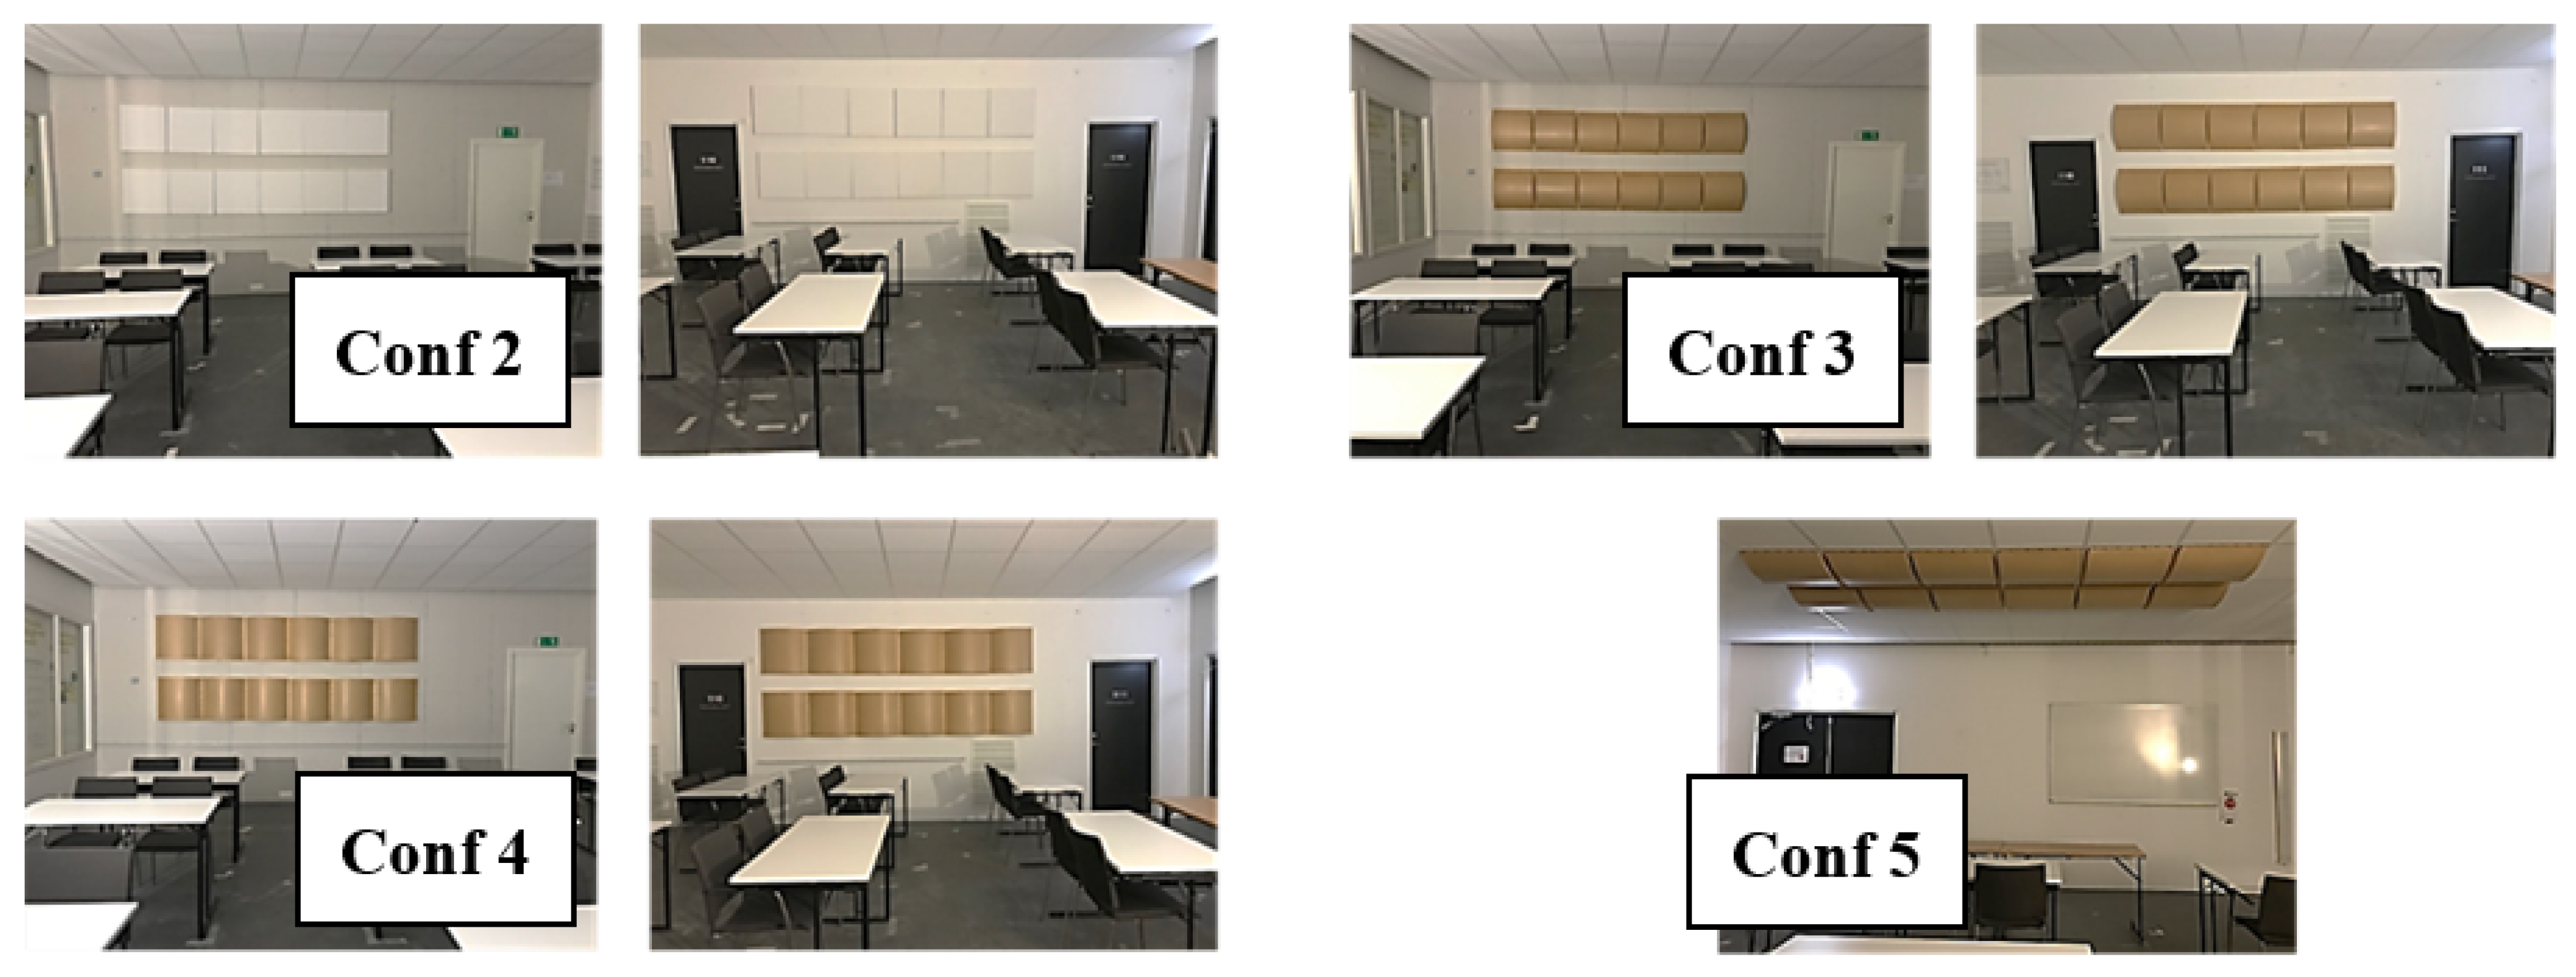
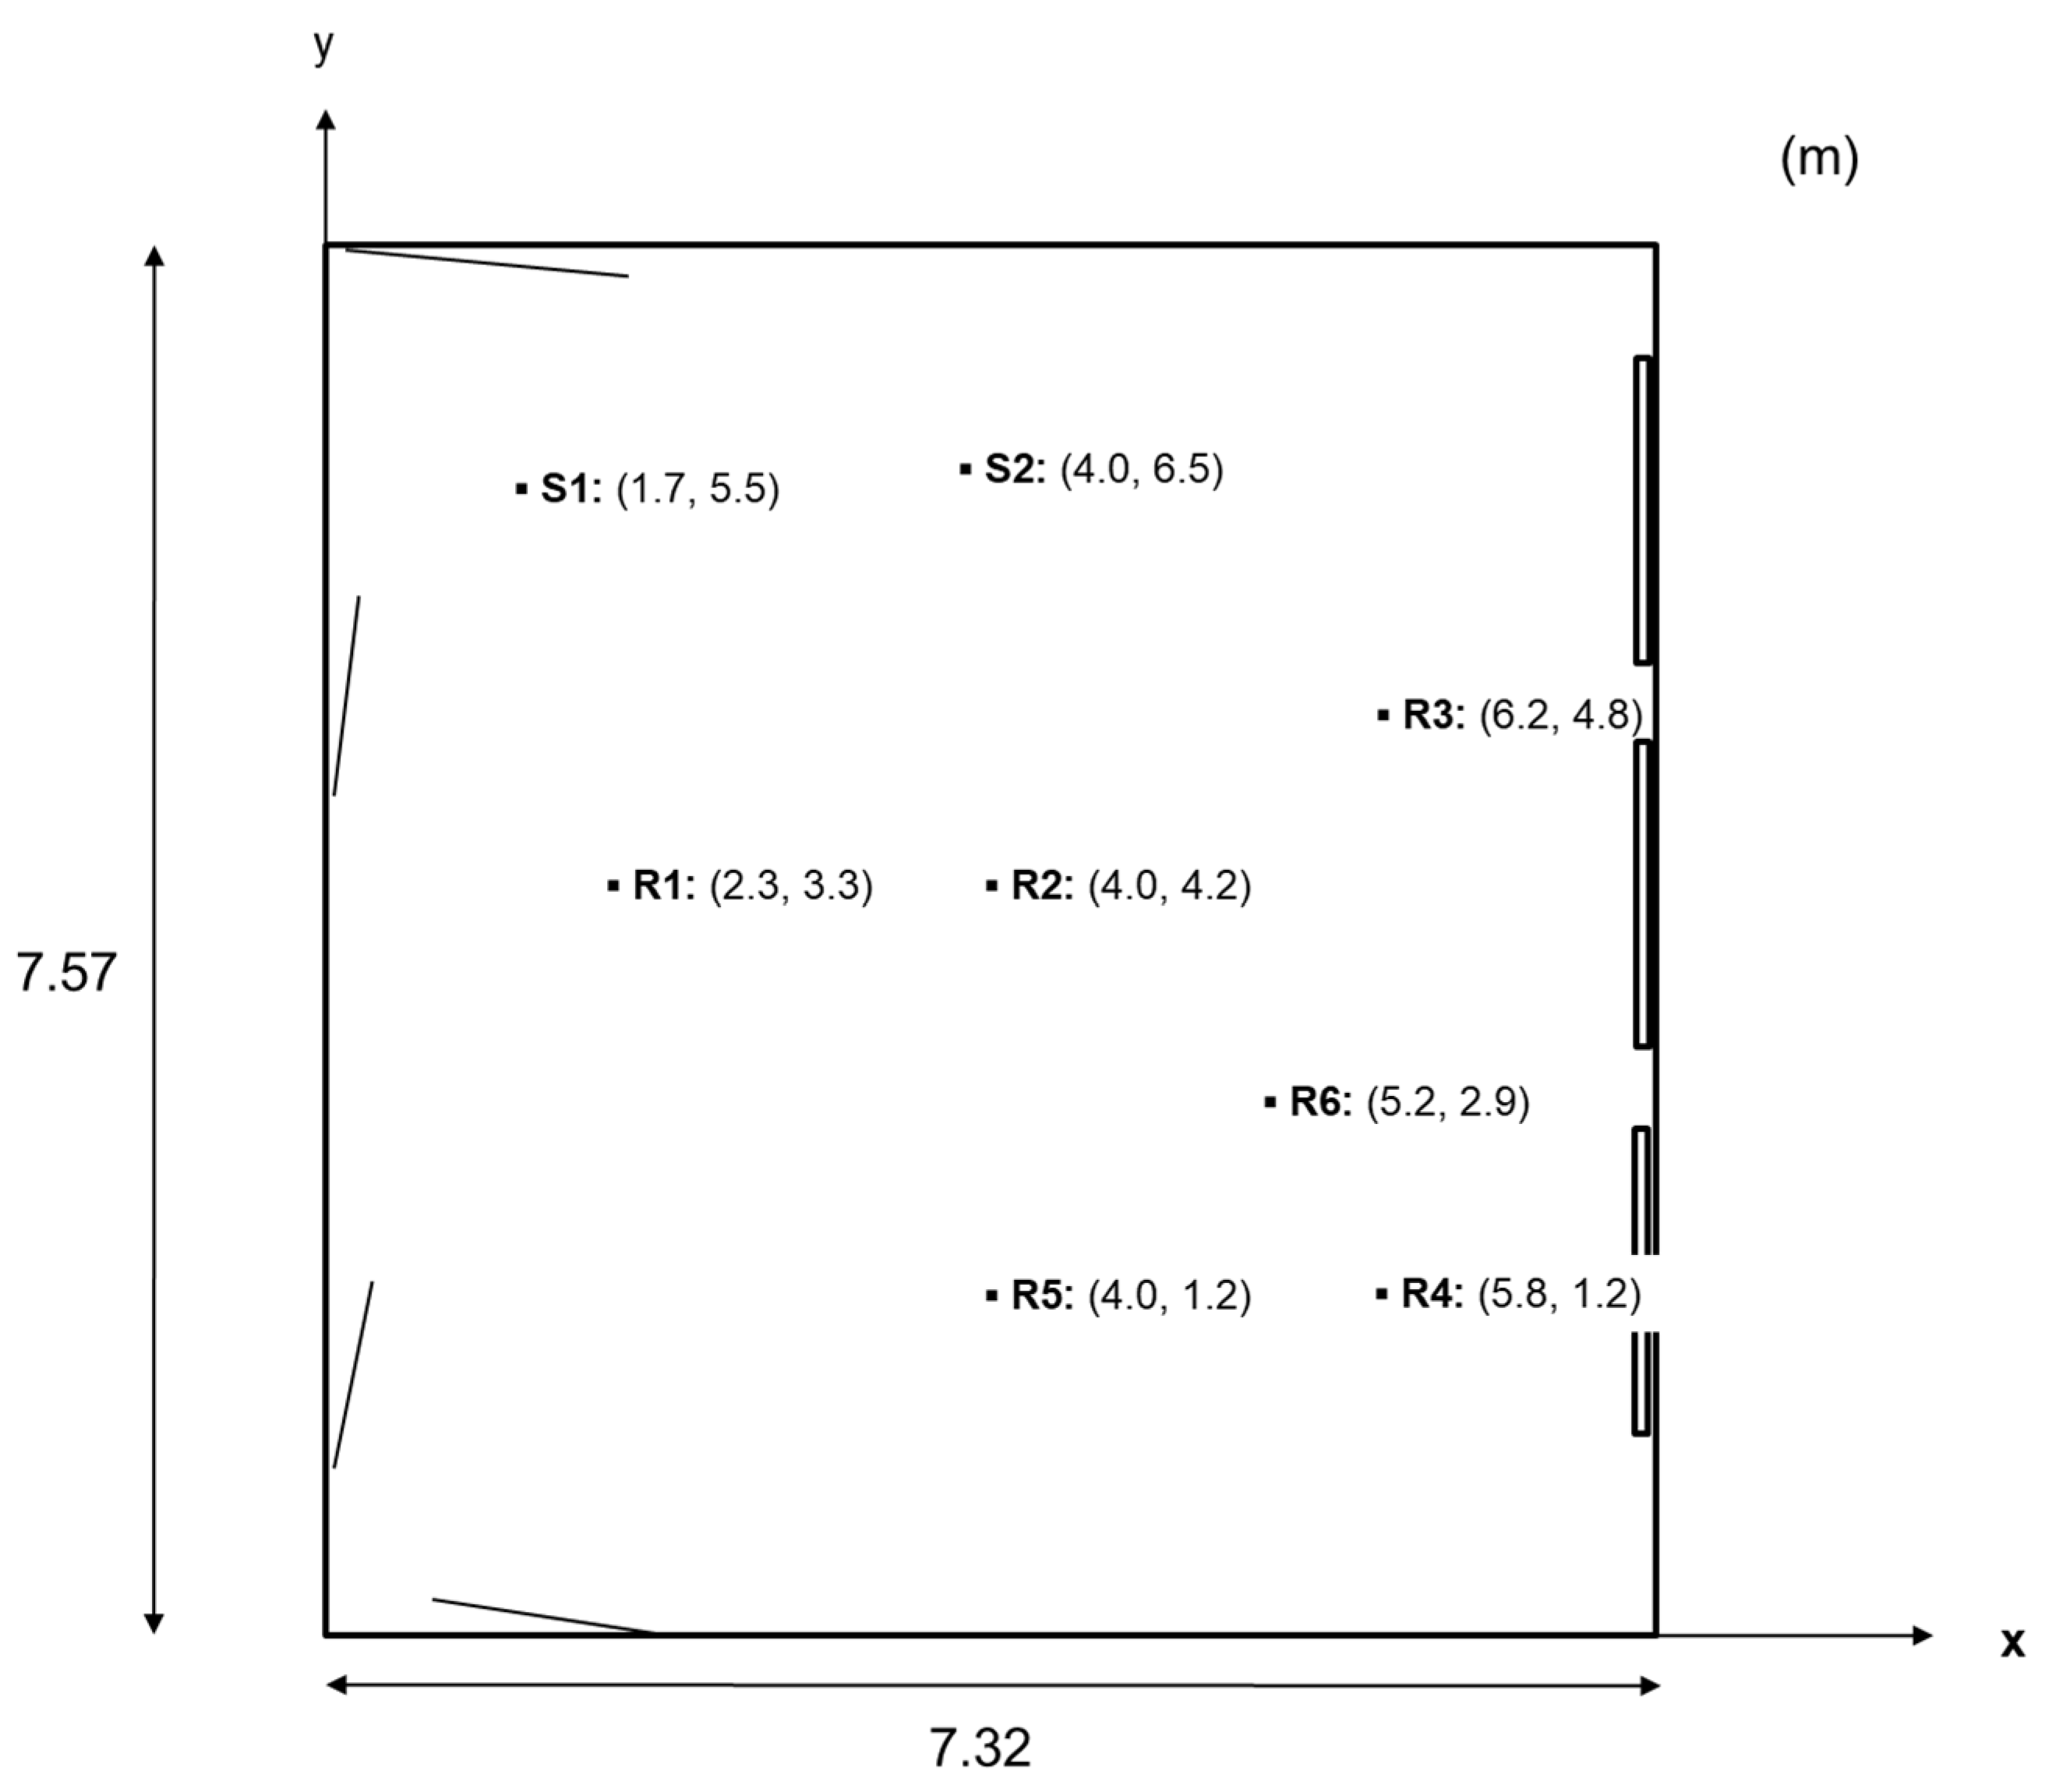
2.2. Mock-Up and Configurations
2.3. Room Acoustic Parameters and Measurements
- h(t) is the impulse response.
- h10m is the impulse response at 10 m in a free field.
2.4. Listening Test
2.4.1. Sound Sampling Set-Up
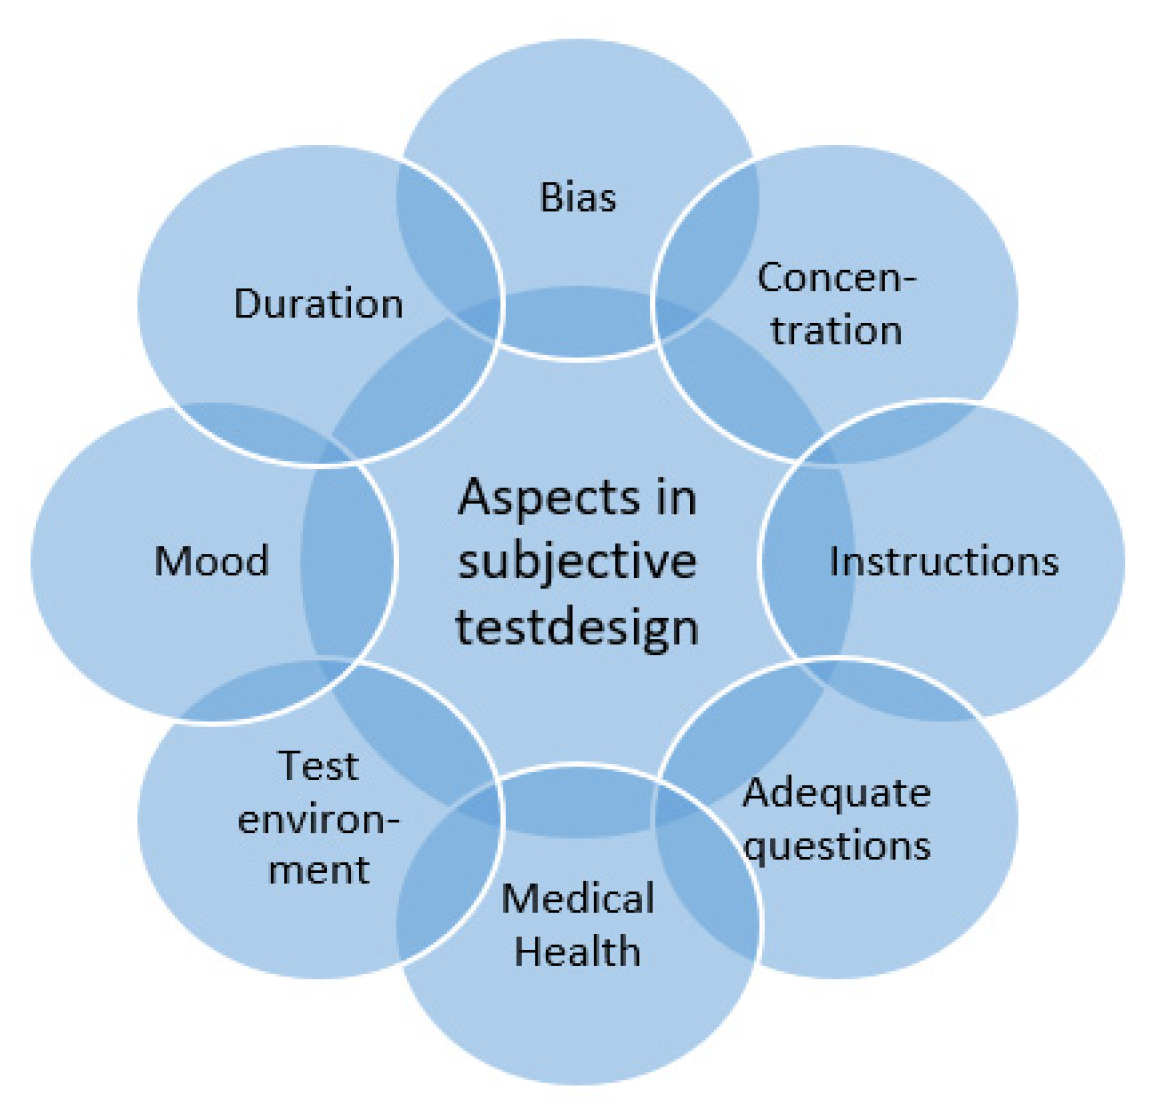
2.4.2. Test Design
2.4.3. Performance of Listening Test
- ▪
- Age;
- ▪
- Self-judgement of hearing capability;
- ▪
- Their mood at the time;
- ▪
- Previous experience of listening tests;
- ▪
- Education or particular interest in the area of acoustics, as well as music.
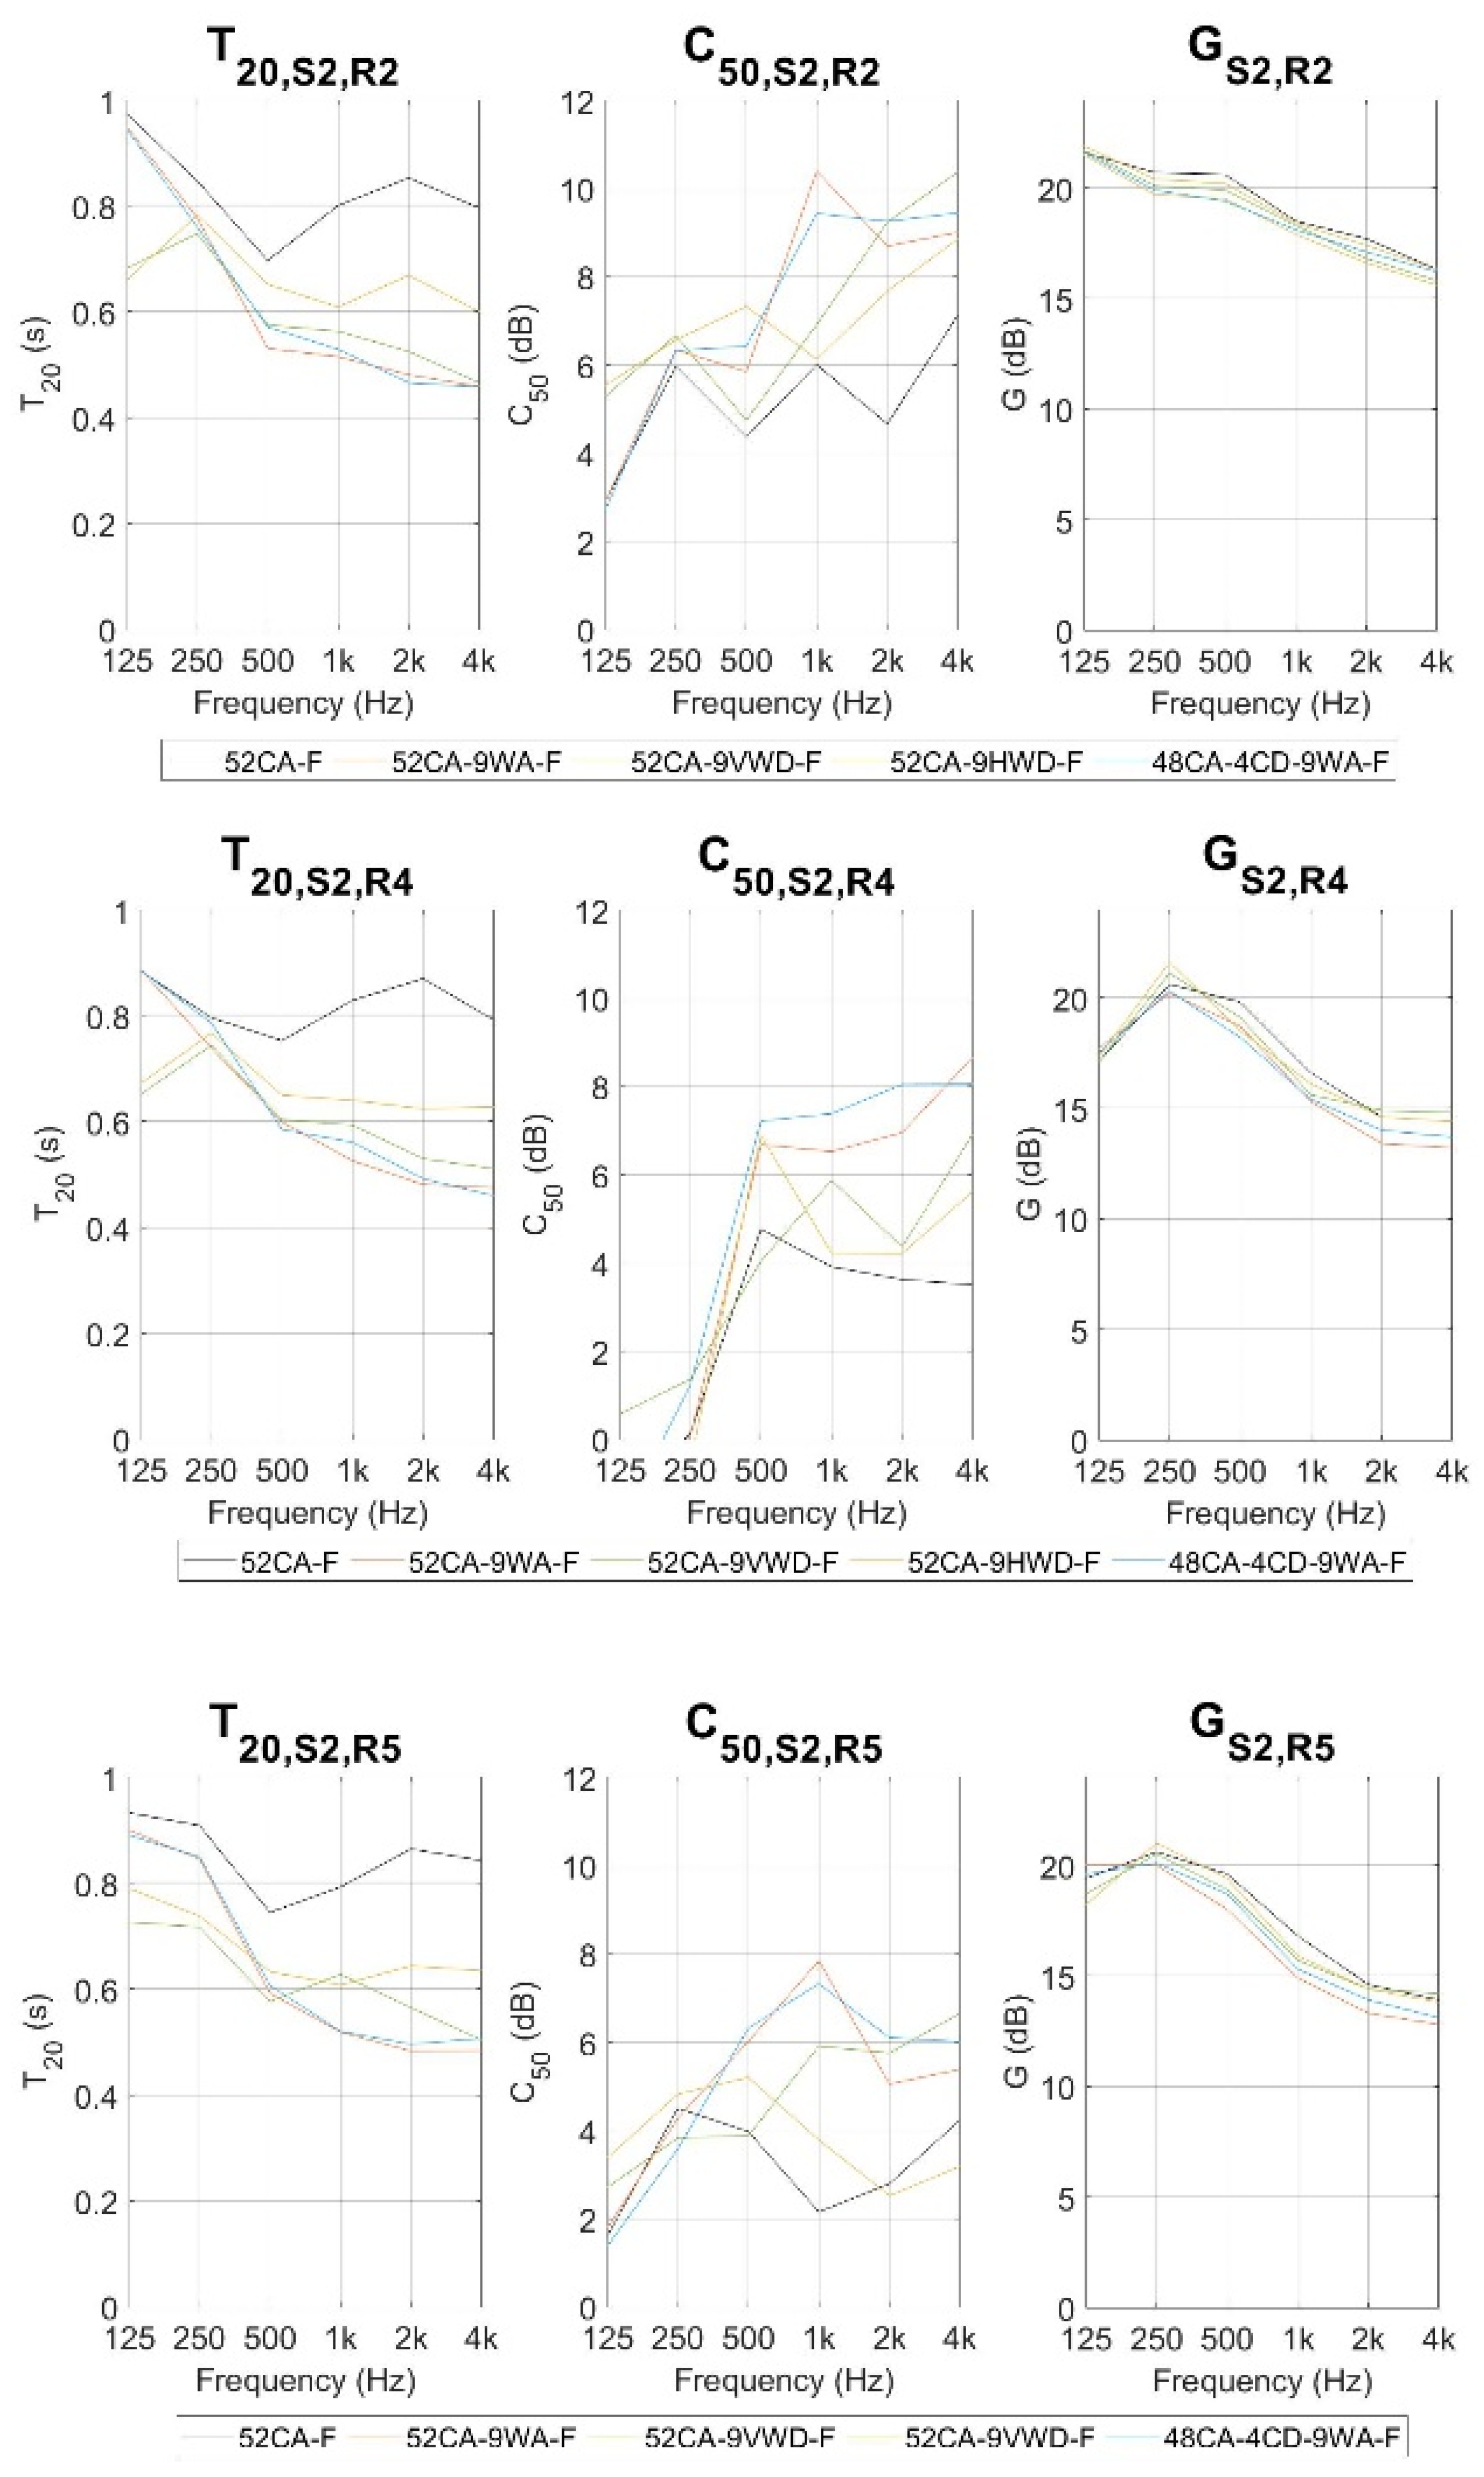
3. Results
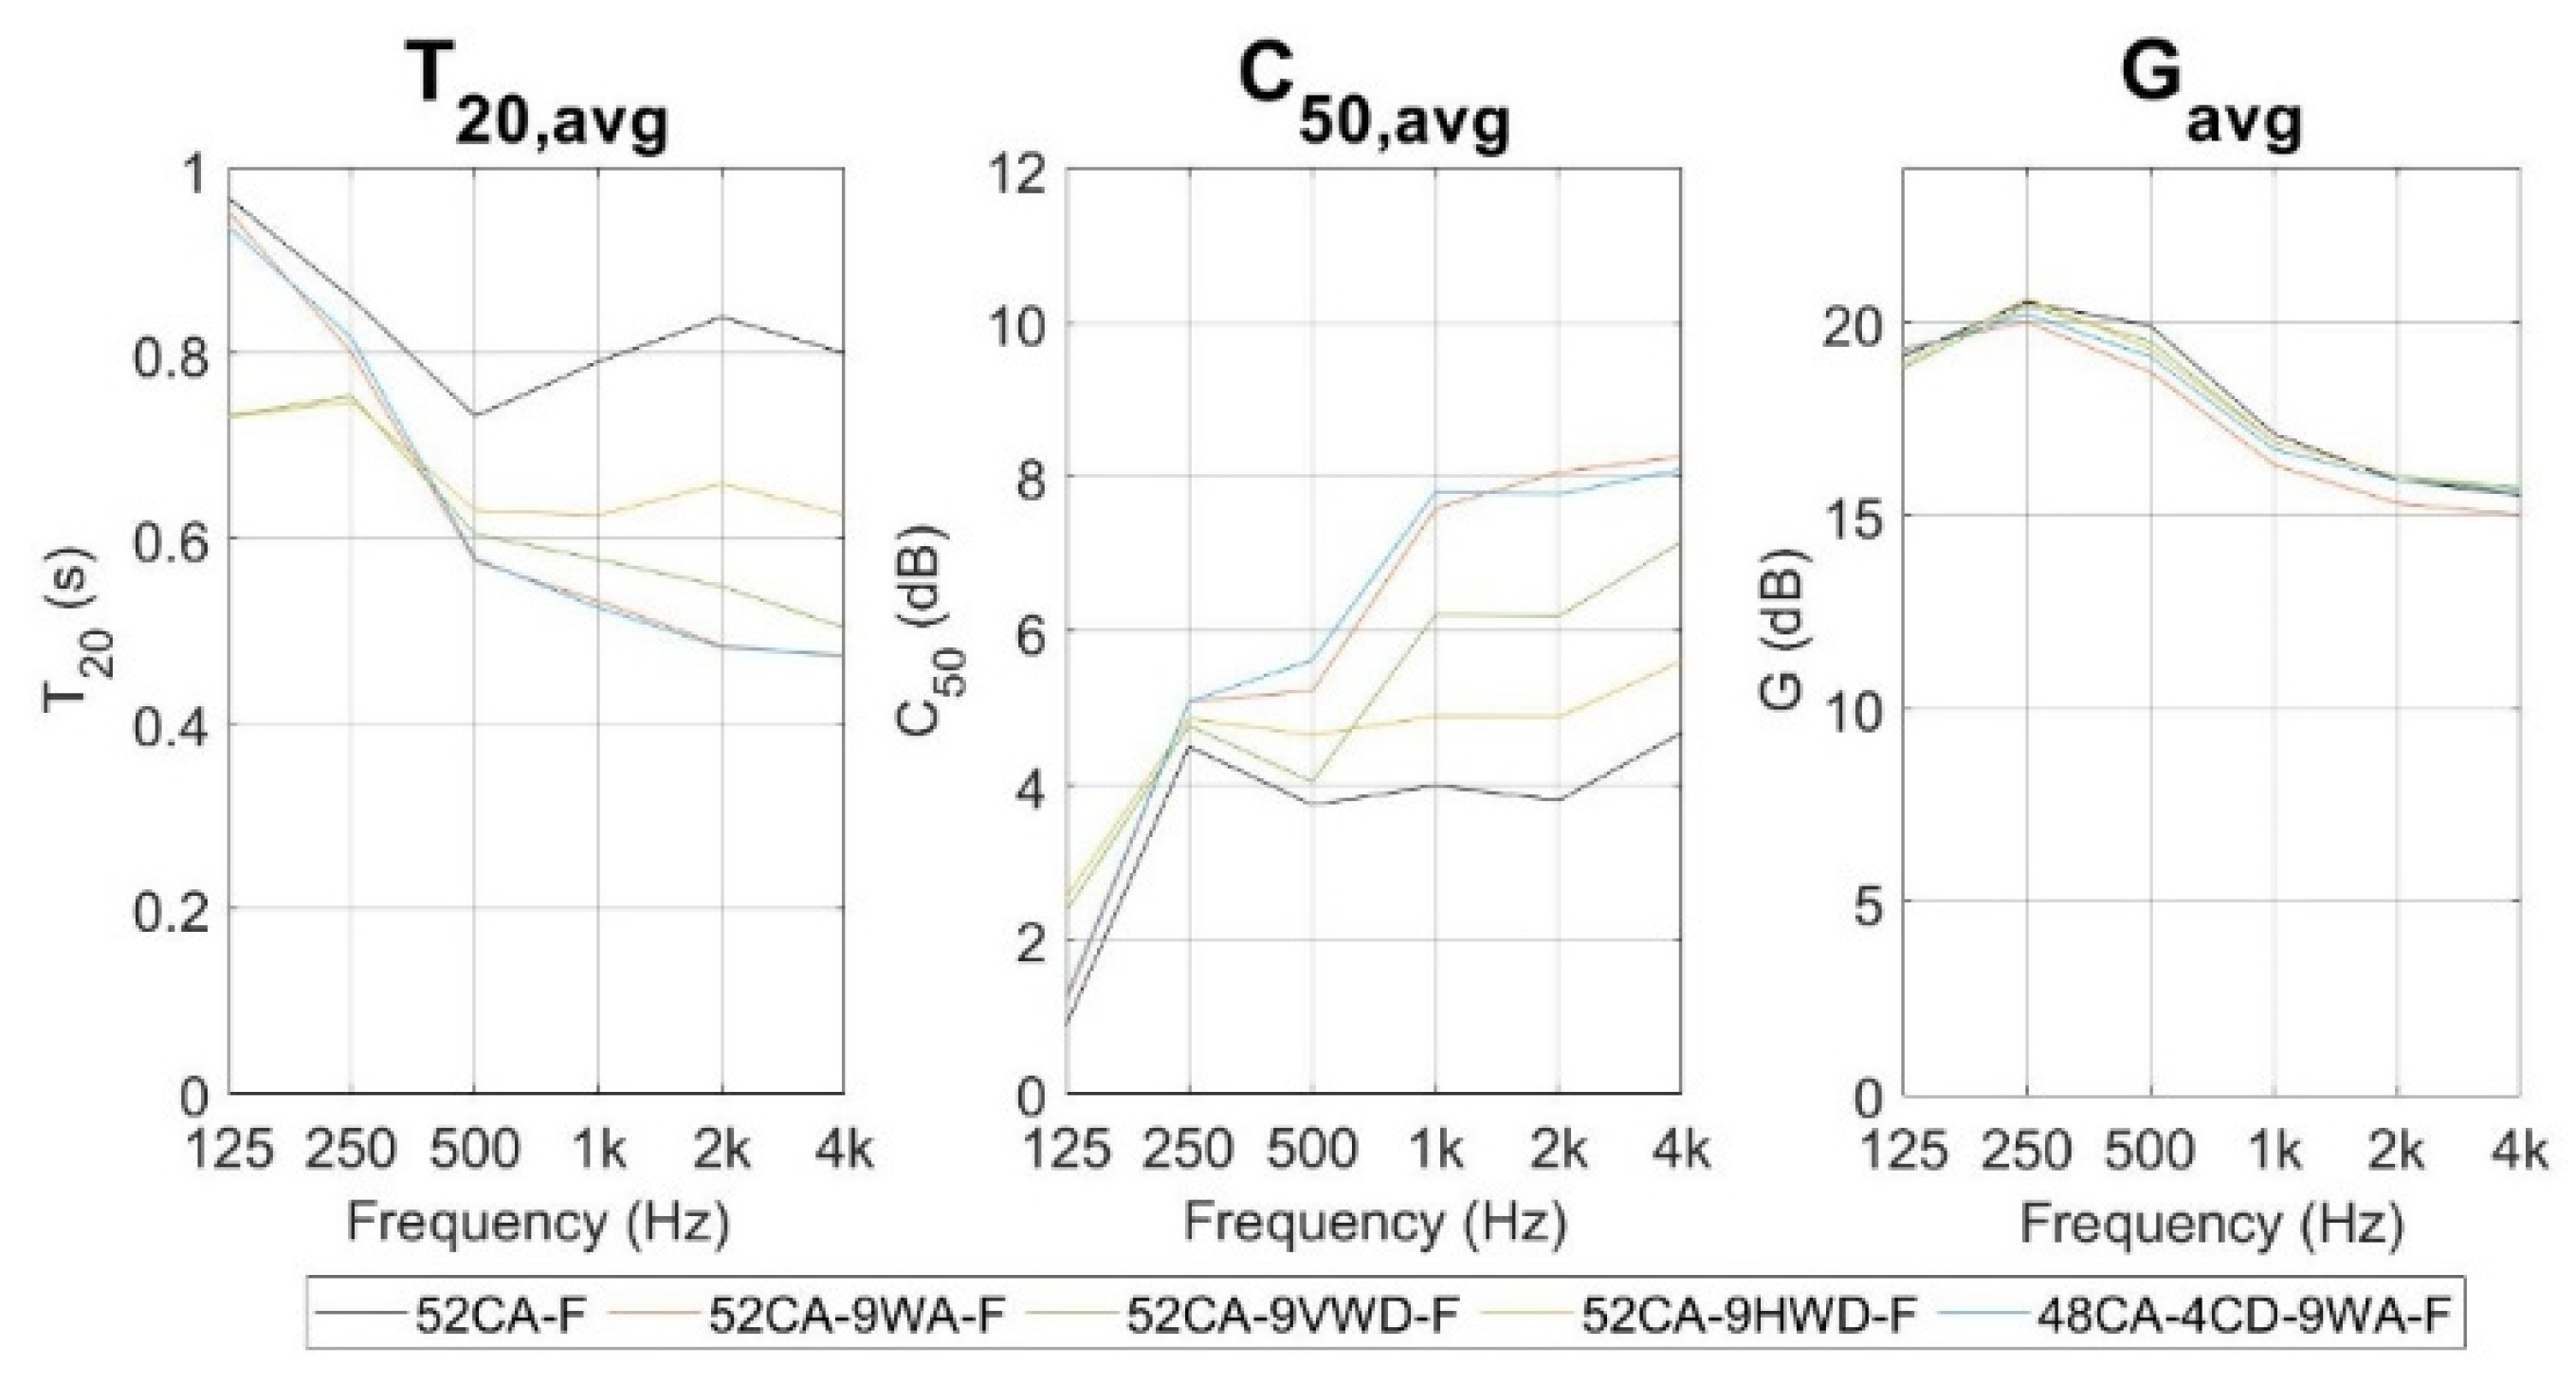
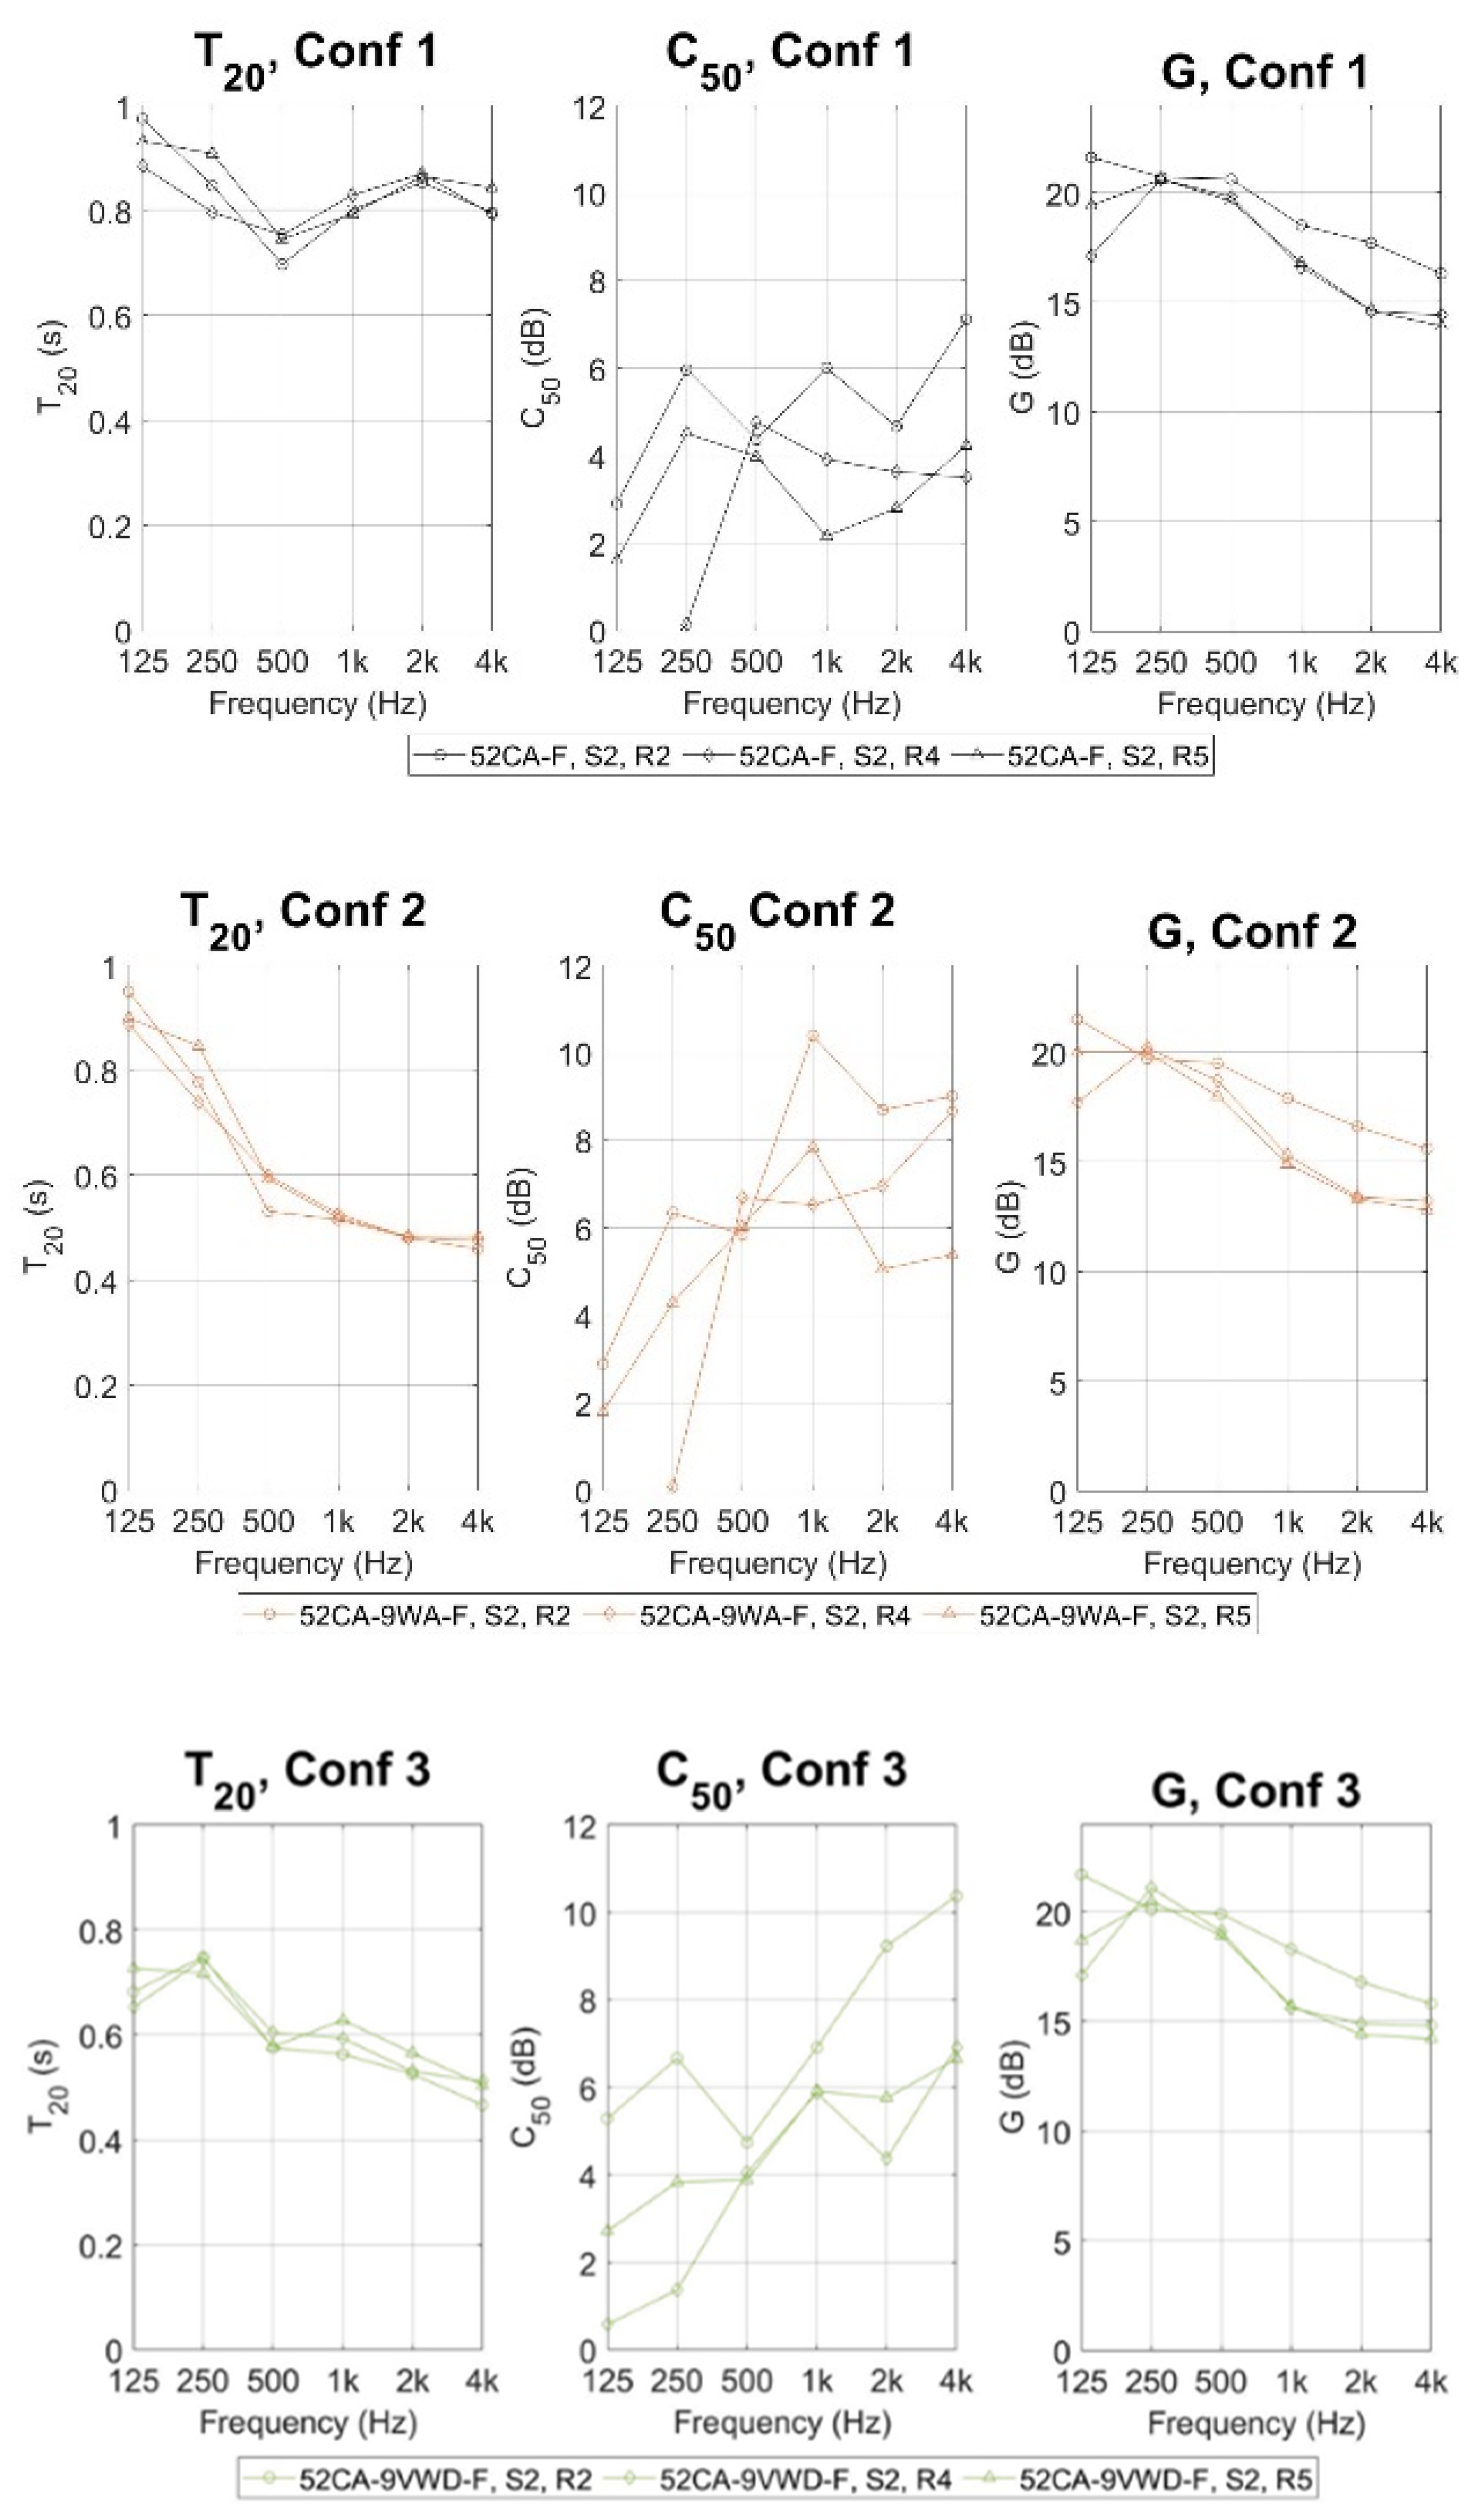
3.1. Room Acoustics
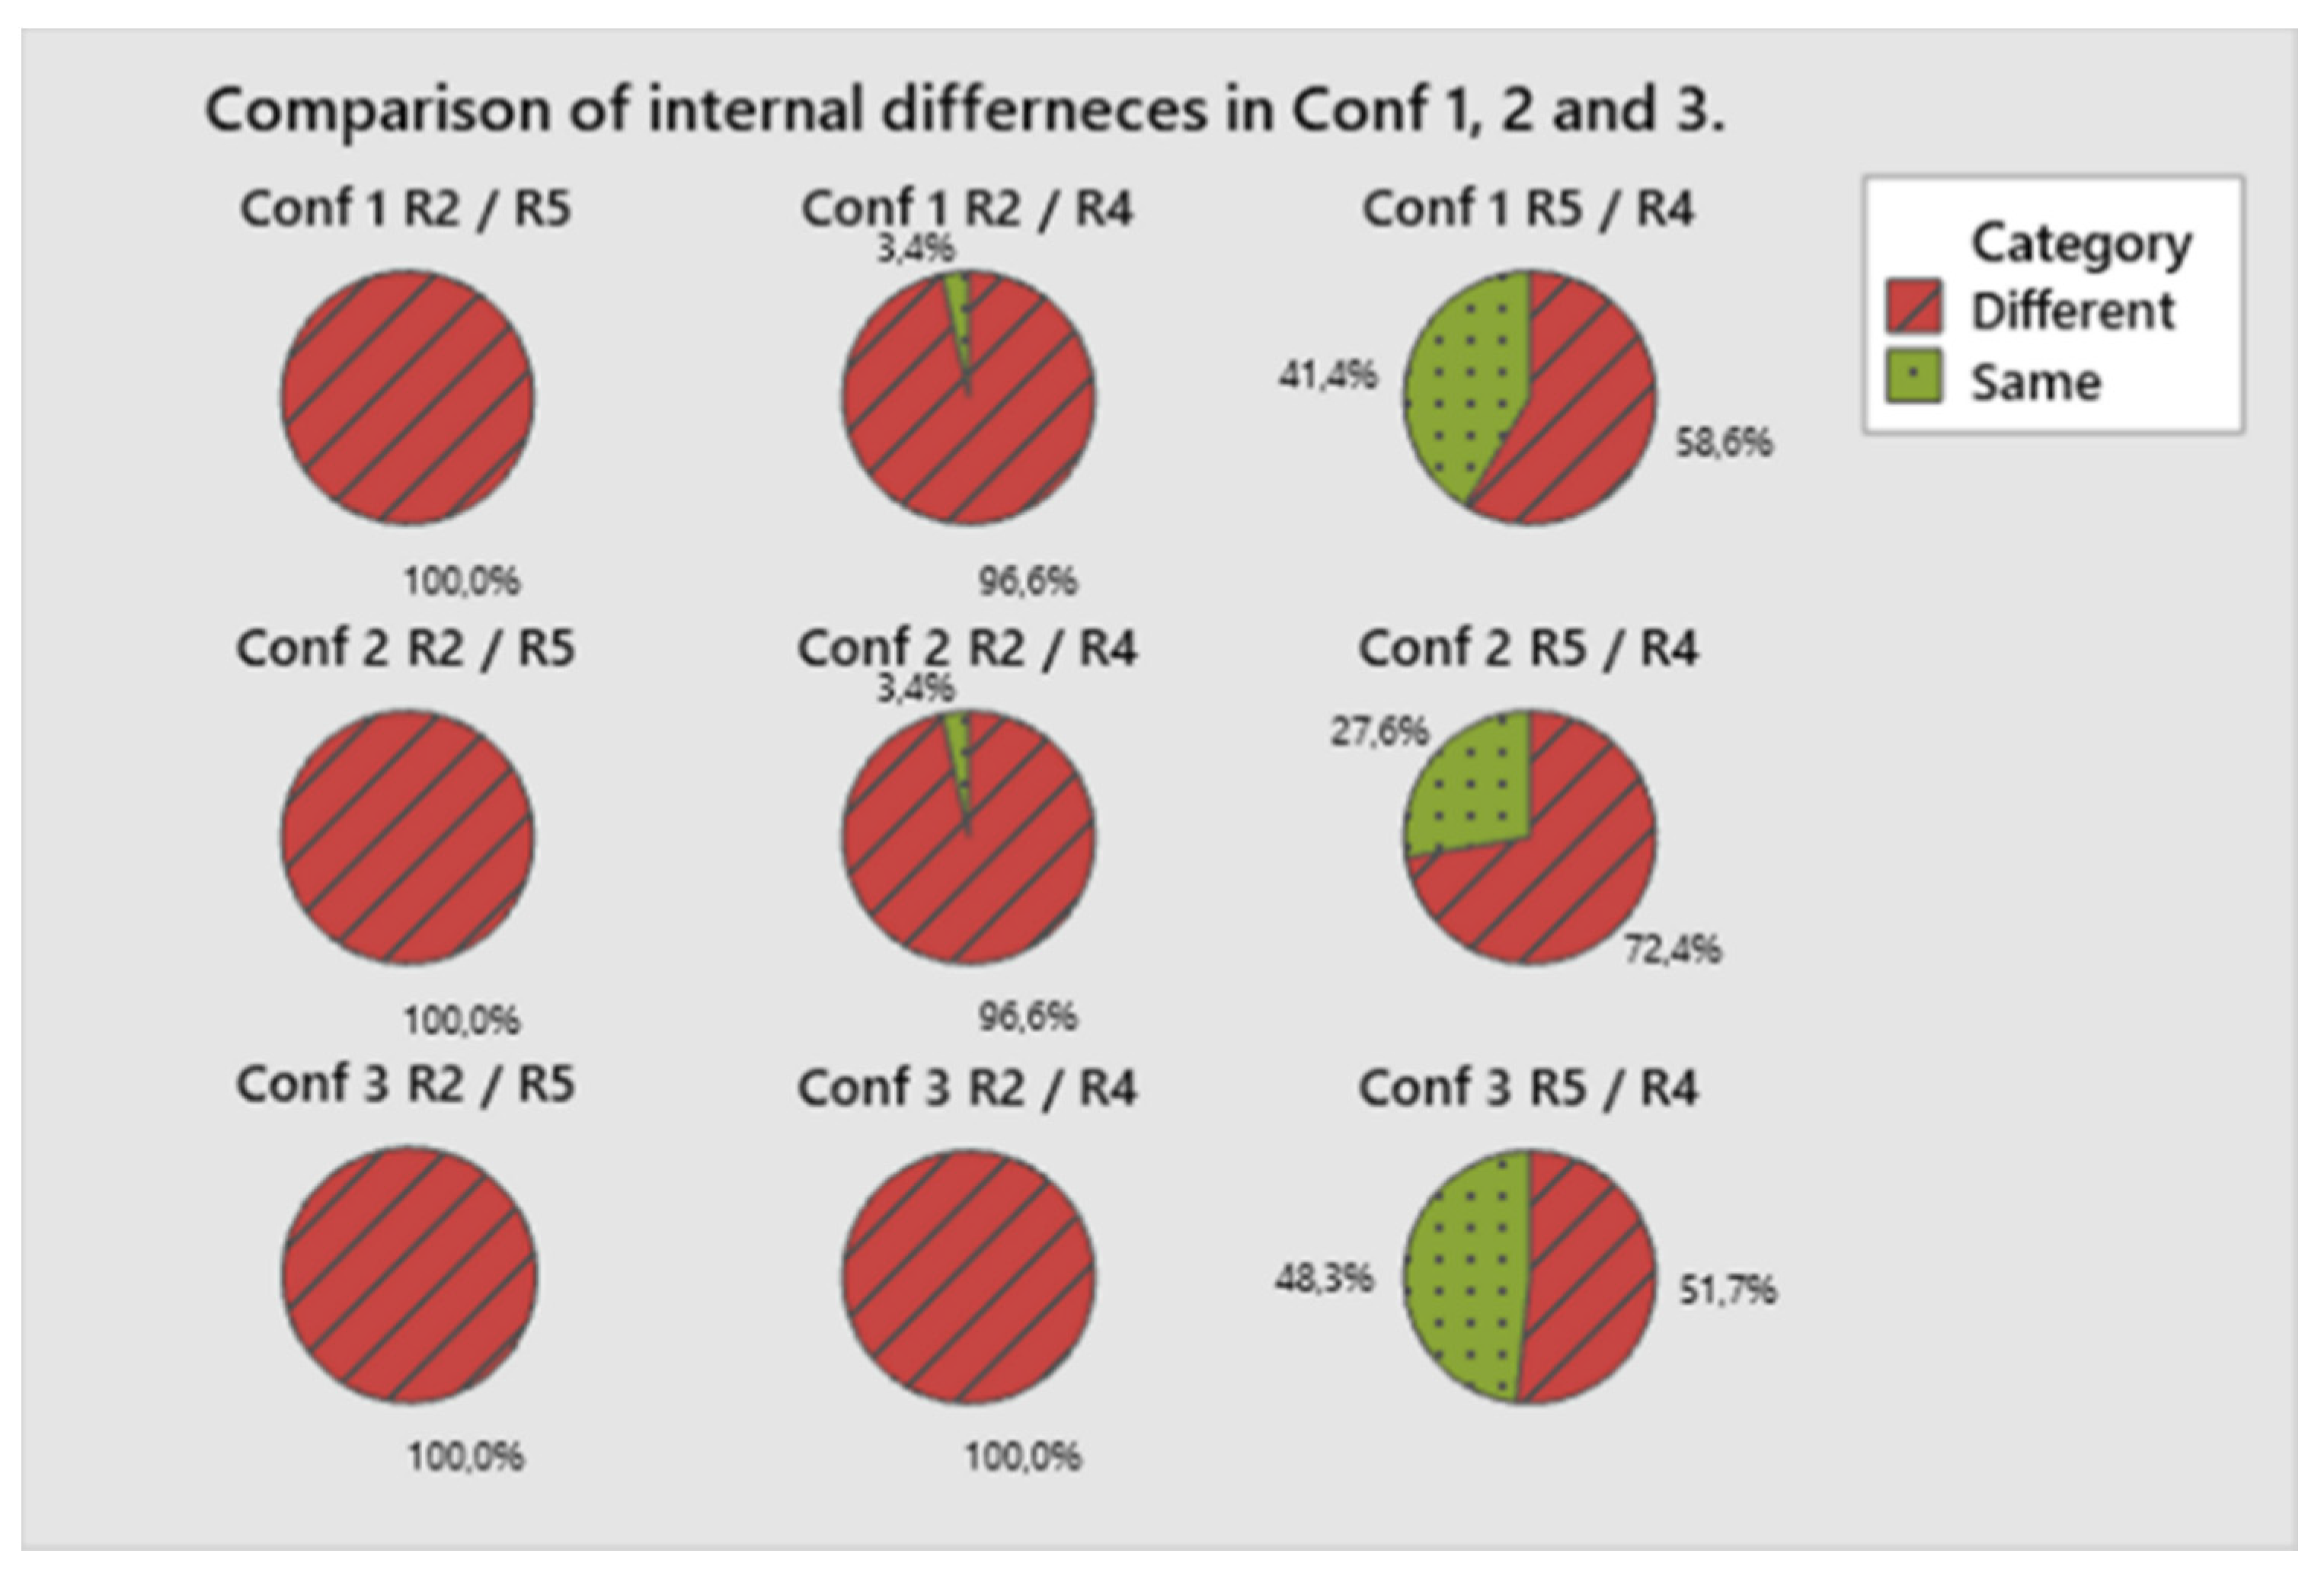
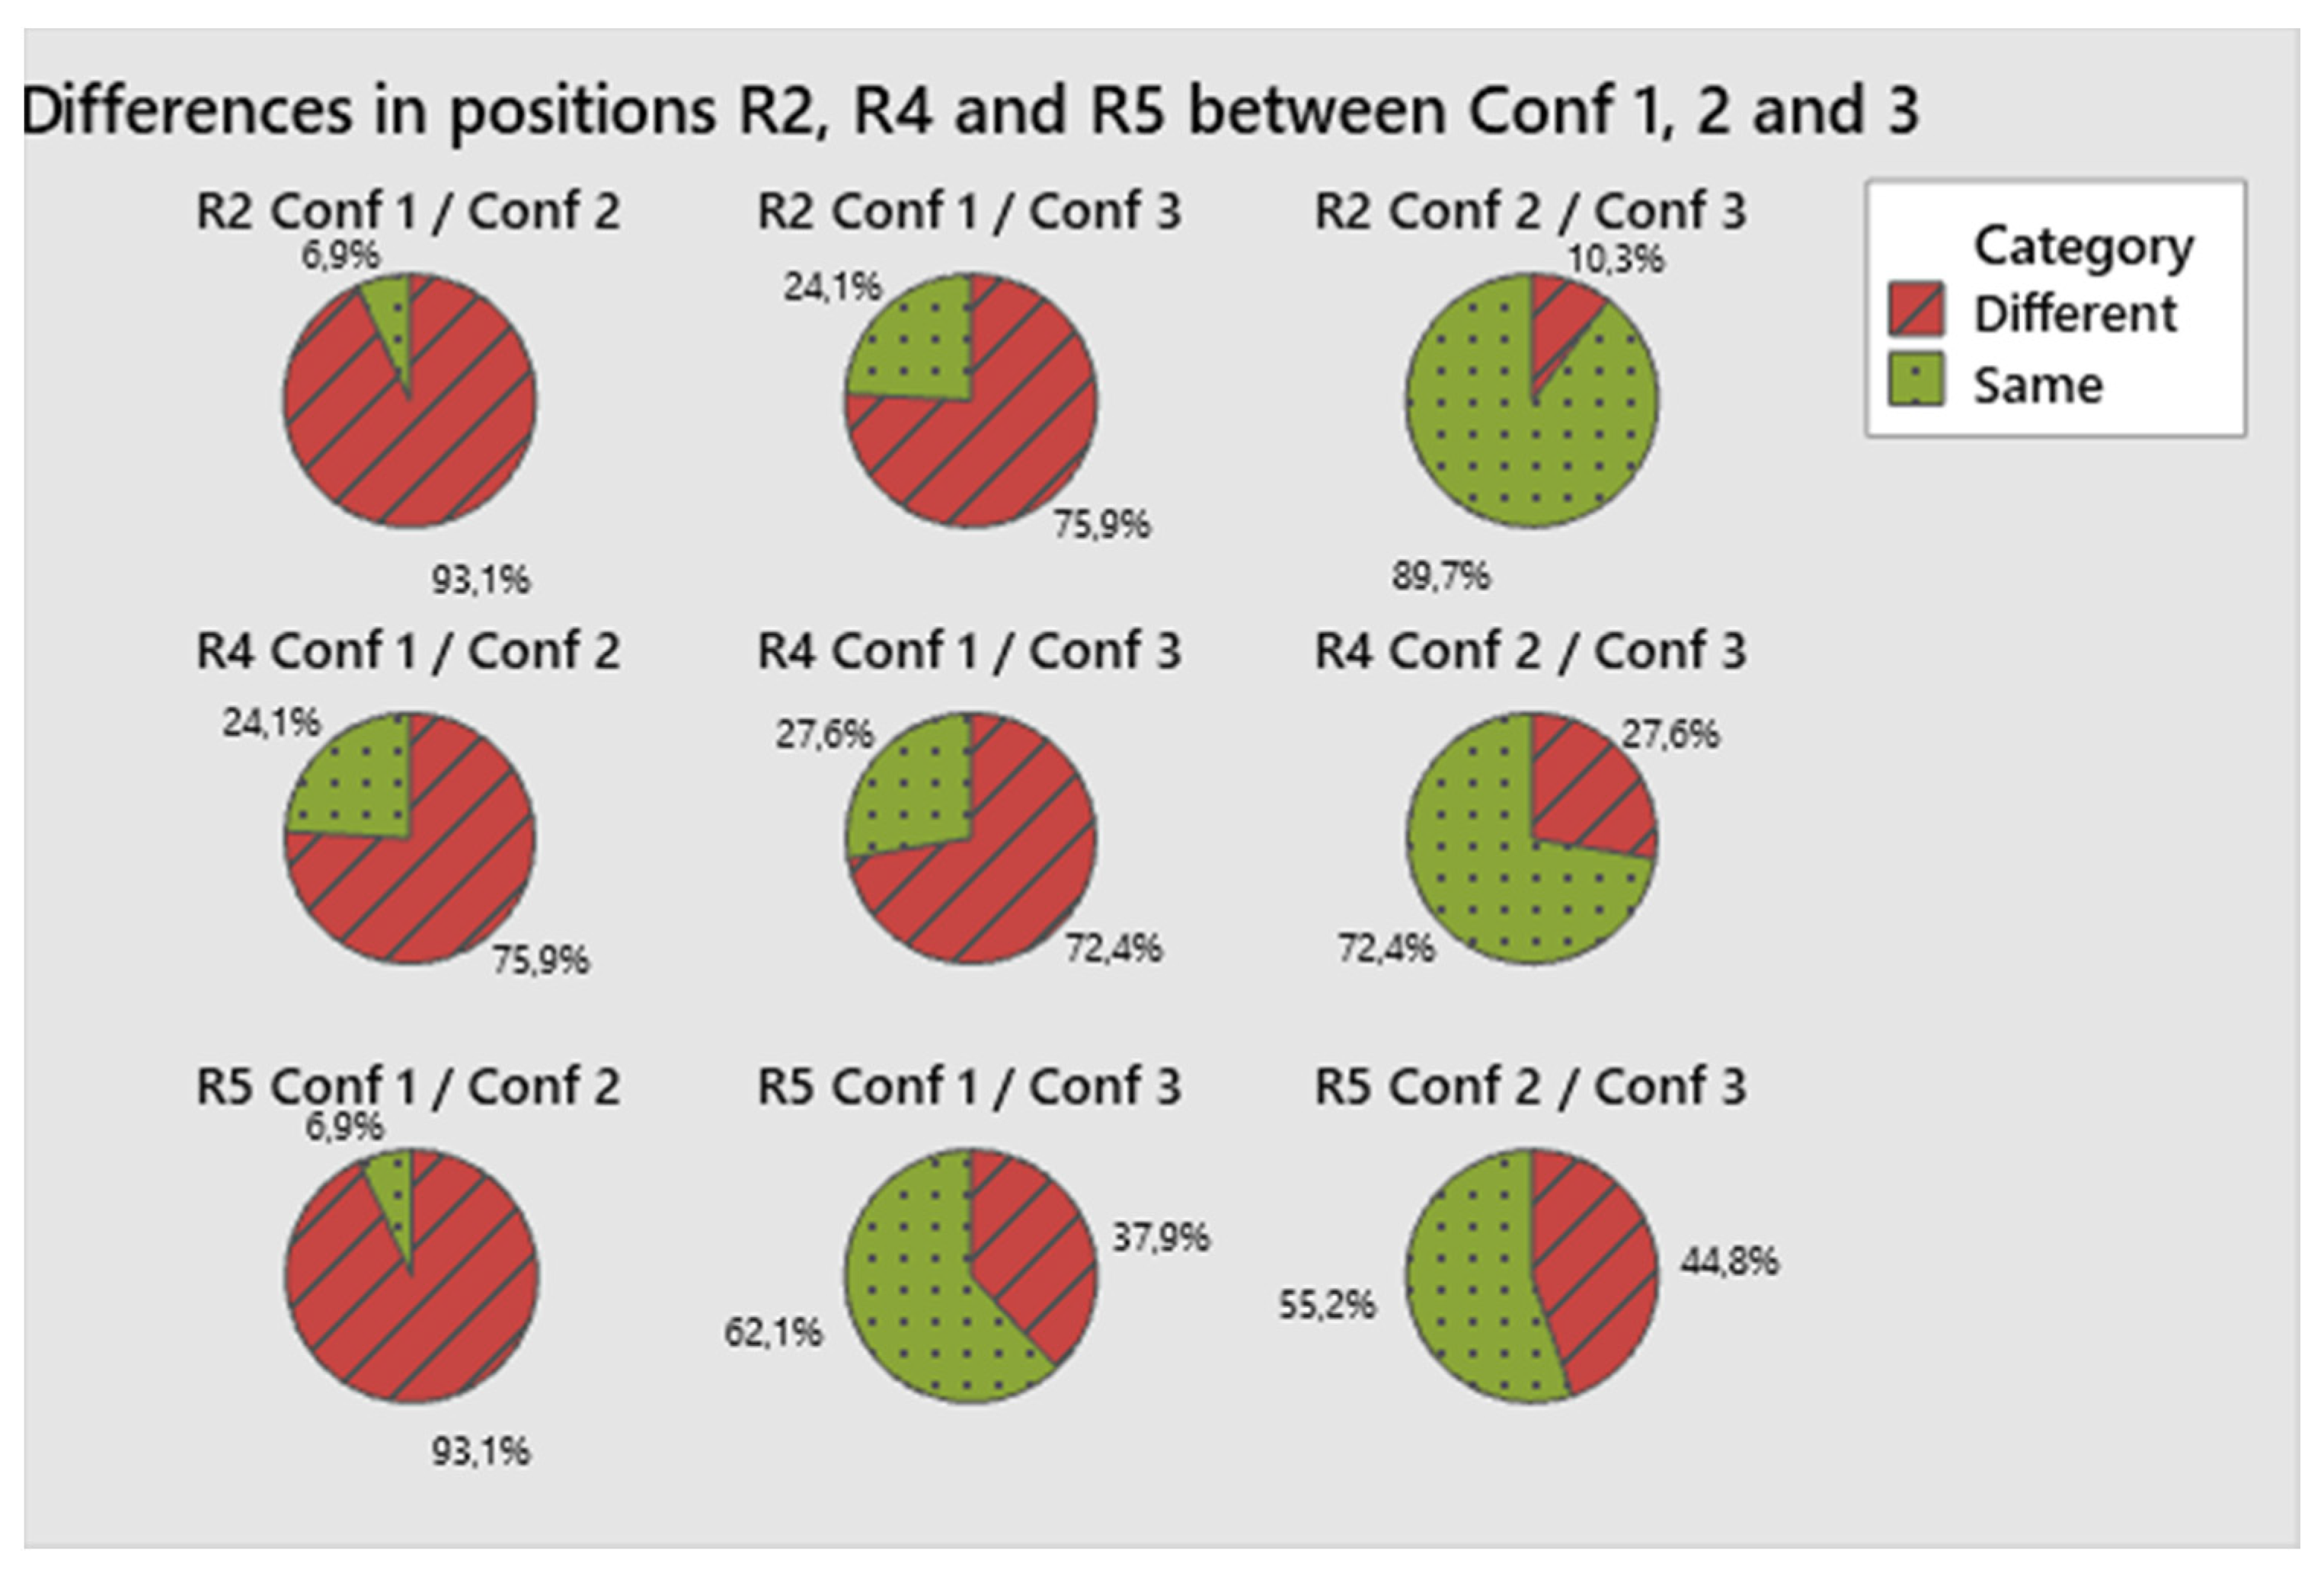
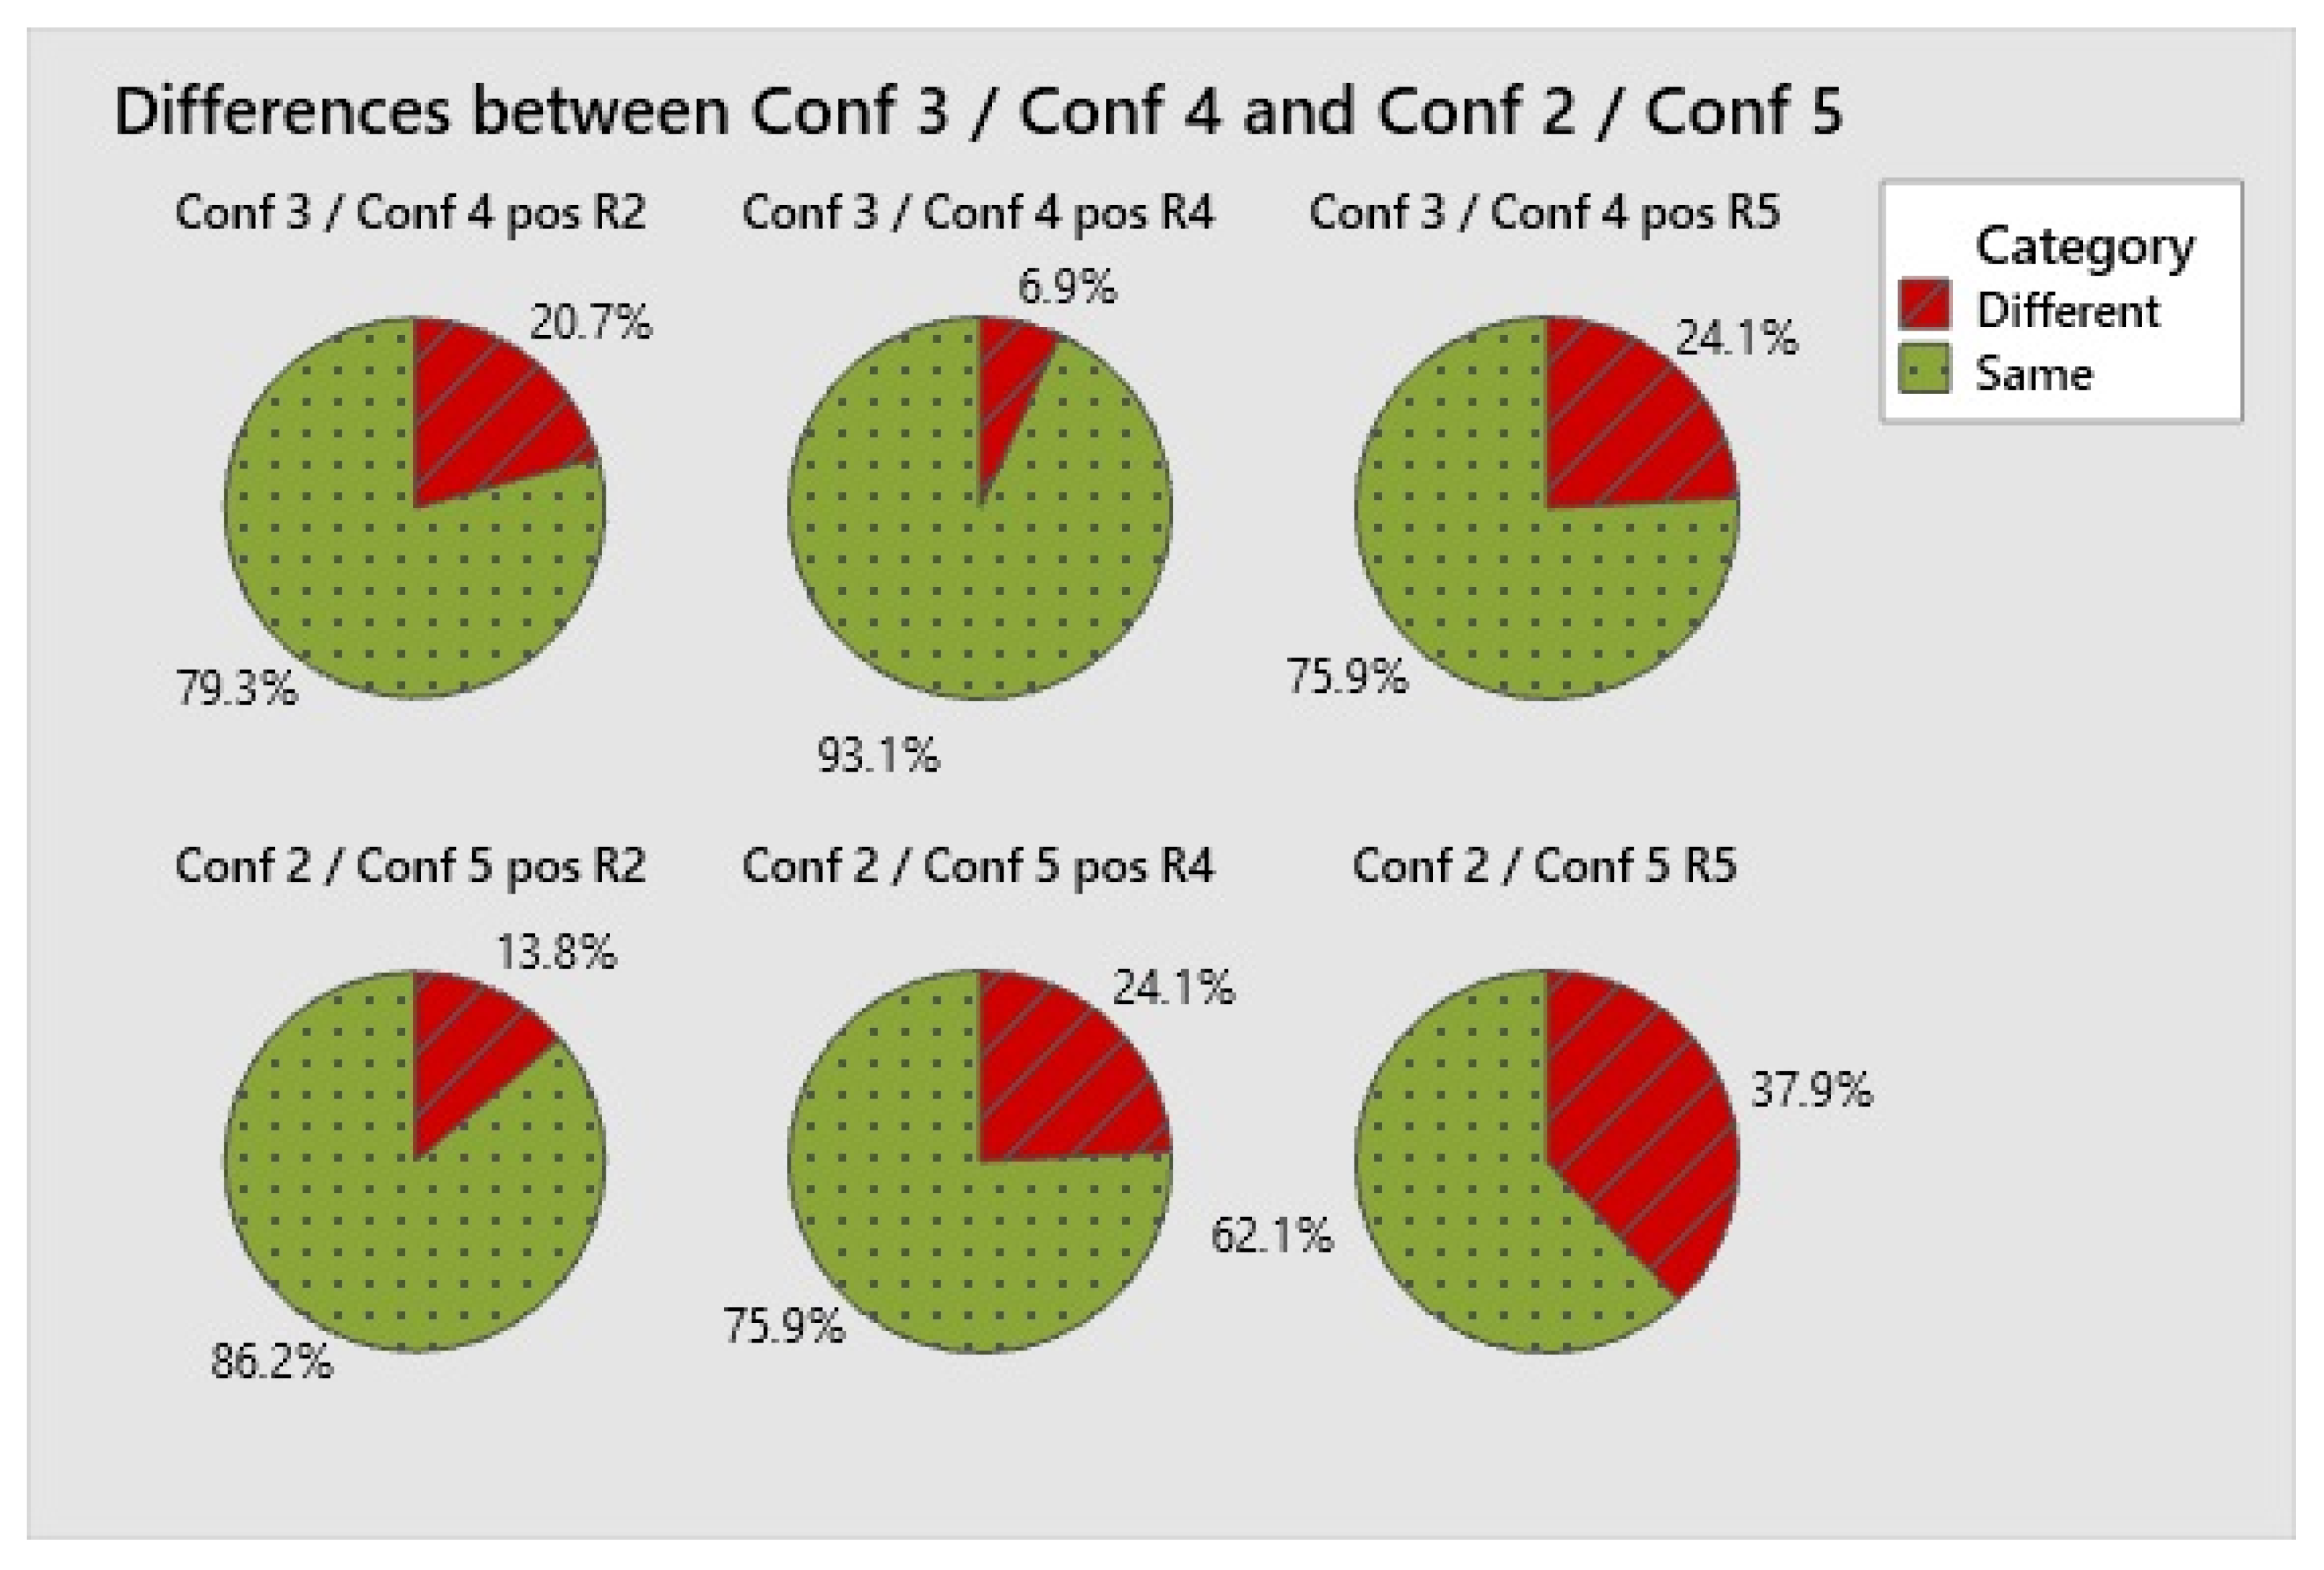
3.2. Listening Test
4. Discussion
5. Conclusions
Author Contributions
Funding
Institutional Review Board Statement
Informed Consent Statement
Data Availability Statement
Acknowledgments
Conflicts of Interest
Appendix A
References
- Barron, M.; Lee, L.J. Energy relations in concert auditoriums. I. J. Acoust. Soc. Am. 1988, 84, 618–628. [Google Scholar] [CrossRef]
- Barron, M. Theory and measurement of early, late and total sound levels in rooms. J. Acoust. Soc. Am. 2015, 137, 3087–3098. [Google Scholar] [CrossRef] [PubMed]
- Beranek, L. The sound strength parameter G and its importance in evaluating and planning the acoustics of halls for music. J. Acoust. Soc. Am. 2011, 129, 3020–3026. [Google Scholar] [CrossRef] [PubMed]
- Svensk Standard Ss-En Iso 3382-1:2009; Swedish Standards Institute: Stockholm, Sweden, 2009.
- Sato, H.; Bradley, J.S. Evaluation of acoustical conditions for speech communication in working elementary school classrooms. J. Acoust. Soc. Am. 2008, 123, 2064–2077. [Google Scholar] [CrossRef] [Green Version]
- Åhlander, V.L.; Rydell, R.; Löfqvist, A. Speaker’s Comfort in Teaching Environments: Voice Problems in Swedish Teaching Staff. J. Voice 2011, 25, 430–440. [Google Scholar] [CrossRef] [PubMed]
- Brunskog, J.; Gade, A.C.; Bellester, G.P.; Calbo, L.R. Increase in voice level and speaker comfort in lecture rooms. J. Acoust. Soc. Am. 2009, 125, 2072–2082. [Google Scholar] [CrossRef] [PubMed] [Green Version]
- Pelegrín-García, D.; Brunskog, J.; Lyberg-Åhlander, V.; Löfqvist, A. Measurement and prediction of voice support and room gain in school classrooms. J. Acoust. Soc. Am. 2012, 131, 194–204. [Google Scholar] [CrossRef] [PubMed]
- Pelegrín-García, D.; Brunskog, J. Speakers’ comfort and voice level variation in classrooms: Laboratory research. J. Acoust. Soc. Am. 2012, 132, 249–260. [Google Scholar] [CrossRef] [PubMed]
- Lochner, J.; Burger, J. The influence of reflections on auditorium acoustics. J. Sound Vib. 1964, 1, 426–454. [Google Scholar] [CrossRef]
- Bradley, J.S.; Sato, H.; Picard, M. On the importance of early reflections for speech in rooms. J. Acoust. Soc. Am. 2003, 113, 3233–3244. [Google Scholar] [CrossRef] [Green Version]
- Bradley, J.S.; Reich, R.D.; Norcross, S.G. On the combined effects of signal-to-noise ratio and room acoustics on speech intelligibility. J. Acoust. Soc. Am. 1999, 106, 1820–1828. [Google Scholar] [CrossRef]
- Choi, Y.-J. An Optimum Combination of Absorptive and Diffusing Treatments for Classroom Acoustic Design. Build. Acoust. 2014, 21, 175–179. [Google Scholar] [CrossRef]
- Choi, Y.-J. The Application of Diffusers for Classroom Acoustical Design. Noise Vib. Worldw. 2014, 45, 8–16. [Google Scholar] [CrossRef]
- Arvidsson, E.; Nilsson, E.; Hagberg, D.B.; Karlsson, O.J.I. The Effect on Room Acoustical Parameters Using a Combination of Absorbers and Diffusers—An Experimental Study in a Classroom. Acoustics 2020, 2, 505–523. [Google Scholar] [CrossRef]
- DIN 18041:2016-3. Acoustic Quality in Rooms—Specifications and Instructions for the Room Acosutic Design; Deutsches Institut für Normung e., V.: Berlin, Germany, 2016. [Google Scholar]
- UNI 11532-2. Internal Acoustical Characteristics of Confined Spaces—Design Methods and Evaluation Techniques—Part 2 Educational Sector; UNI: Milan, Italy, 2020. [Google Scholar]
- Azad, H.; Meyer, J.; Siebein, G.; Lokki, T. The Effects of Adding Pyramidal and Convex Diffusers on Room Acoustic Parameters in a Small Non-Diffuse Room. Acoustics 2019, 1, 618–643. [Google Scholar] [CrossRef] [Green Version]
- Cucharero, J.; Hänninen, T.; Lokki, T. Influence of Sound-Absorbing Material Placement on Room Acoustical Parameters. Acoustics 2019, 1, 644–660. [Google Scholar] [CrossRef] [Green Version]
- Berardi, U.; Iannace, G.; Trematerra, A. Acoustic treatments aiming to achieve the italian minimum environmental criteria (cam) standards in large reverberant. Can. Acoust. 2019, 47, 73–80. [Google Scholar]
- Shtrepi, L.; Astolfi, A.; Puglisi, G.E.; Masoero, M.C. Effects of the Distance from a Diffusive Surface on the Objective and Perceptual Evaluation of the Sound Field in a Small Simulated Variable-Acoustics Hall. Appl. Sci. 2017, 7, 224. [Google Scholar] [CrossRef] [Green Version]
- Visentin, C.; Pellegatti, M.; Prodi, N. Effect of a single lateral diffuse reflection on spatial percepts and speech intelligibility. J. Acoust. Soc. Am. 2020, 148, 122–140. [Google Scholar] [CrossRef]
- Shtrepi, L.; Astolfi, A.; D’Antonio, G.; Guski, M. Objective and perceptual evaluation of distance-dependent scattered sound effects in a small variable-acoustics hall. J. Acoust. Soc. Am. 2016, 140, 3651–3662. [Google Scholar] [CrossRef] [PubMed]
- Visentin, C.; Prodi, N.; Cappelletti, F.; Torresin, S.; Gasparella, A. Using listening effort assessment in the acoustical design of rooms for speech. Build. Environ. 2018, 136, 38–53. [Google Scholar] [CrossRef]
- Sanavi, A.; Schäffer, B.; Heutschi, K.; Eggenschwiler, K. On the Effect of an Acoustic Diffuser in Comparison with an Absorber on the Subjectively Perceived Quality of Speech in a Meeting Room. Acta Acust. United Acust. 2017, 103, 1037–1049. [Google Scholar] [CrossRef]
- Lam, Y.W. A comparison of three diffuse reflection modeling methods used in room acoustics computer models. J. Acoust. Soc. Am. 1996, 100, 2181. [Google Scholar] [CrossRef]
- Kjellberg, A.; Ljung, R.; Hallman, D. Recall of words heard in noise. Appl. Cogn. Psychol. 2008, 22, 1088–1098. [Google Scholar] [CrossRef]
- Ljung, R.; Kjellberg, A. Long Reverberation Time Decreases Recall of Spoken Information. Build. Acoust. 2009, 16, 301–311. [Google Scholar] [CrossRef]
- Ljung, R.; Israelsson, K.; Hygge, S. Speech Intelligibility and Recall of Spoken Material Heard at Different Signal-to-noise Ratios and the Role Played by Working Memory Capacity. Appl. Cogn. Psychol. 2012, 27, 198–203. [Google Scholar] [CrossRef]
- Hygge, S. Classroom noise and its effect on learning. In Proceedings of the 11th International Congress on Noise as a Public Health Problem (ICBEN), Nara, Japan, 1–5 June 2014; Available online: http://urn.kb.se/resolve?urn=urn:nbn:se:hig:diva-17206 (accessed on 10 April 2021).
- Puglisi, G.E.; Prato, A.; Sacco, T.; Astolfi, A. Influence of classroom acoustics on the reading speed: A case study on Italian second-graders. J. Acoust. Soc. Am. 2018, 144, EL144–EL149. [Google Scholar] [CrossRef] [PubMed]
- Astolfi, A.; Puglisi, G.E.; Murgia, S.; Minelli, G.; Pellerey, F.; Prato, A.; Sacco, T. Influence of Classroom Acoustics on Noise Disturbance and Well-Being for First Graders. Front. Psychol. 2019, 10, 2736. [Google Scholar] [CrossRef] [PubMed] [Green Version]
- Bradley, J. Review of objective room acoustics measures and future needs. Appl. Acoust. 2011, 72, 713–720. [Google Scholar] [CrossRef]
- Bradley, J.; Reich, R.; Norcross, S. A just noticeable difference in C 50 for speech. Appl. Acoust. 1999, 58, 99–108. [Google Scholar] [CrossRef]
- BS EN ISO 354:2003: Acoustics. Measurement of Sound Absorption in a Reverberation Room. 2003. Available online: https://0-bsol-bsigroup-com.brum.beds.ac.uk/en/Bsol-Item-Detail-age/?pid=000000000030103215 (accessed on 10 April 2021).
- Acoustics—Sound Absorbers for Use in Buildings—Rating of Sound Absorption (ISO 11654:1997). Byggakustik—Ljudabsorbenter—Värdering av Mätresultat och Klassindelning; SIS, Swedish Standards Institute: Stockholm, Sweden, 2002.
- Prida, D.D.L.; Pedrero, A.; Azpicueta-Ruiz, L.A.; Navacerrada, M.Á.; Díaz, C. Does the method matter? A review of the main testing methods for the subjective evaluation of room acoustics through listening tests. In Proceedings of the Integrating 4th EAA Euroregio, Aachen, Germany, 9–13 September 2019; Available online: https://search.datacite.org/works/10.18154/rwth-conv-239793 (accessed on 10 April 2021). [CrossRef]


| Abbreviation | Description | Comments |
|---|---|---|
| CA | Ceiling absorptive | XX before any abbreviation describes the m2 used for the material, e.g., 52 CA stands for 52 m2 absorptive ceiling |
| WA | Wall absorption | |
| VWD | Vertically oriented wall diffusor | |
| HWD | Horizontally oriented wall diffusor | |
| F | Furniture | Sparsely furnished |
| Configuration | Ceiling | Wall Treatment | Furnished | |
|---|---|---|---|---|
| No | Abbreviation | |||
| 1 | 52CA_F | 52 m2 absorptive | - | Sparsely |
| 2 | 52CA_9WA_F | 52 m2 absorptive | 9 m2 absorptive tiles distributed on two walls | Sparsely |
| 3 | 52CA_9VWD_F | 52 m2 absorptive | 9 m2 vertically oriented diffusers distributed on two walls | Sparsely |
| 4 | 52CA_9HWD_F | 52 m2 absorptive | 9 m2 horizontally oriented diffusers distributed on two walls | Sparsely |
| 5 | 48CA_4CD_9WA_F | 48 m2 absorptive ceiling, 4 m2 diffusing elements | 9 m2 absorptive tiles distributed on two walls | Sparsely |
| Gavg (dB) | C50, avg (dB) | T20, avg (s) | |
|---|---|---|---|
| 125 Hz | ±0.61 | ±0.56 | ±0.077 |
| 250 Hz | ±0.30 | ±0.29 | ±0.018 |
| 500 Hz | ±0.40 | ±0.29 | ±0.010 |
| 1000 Hz | ±0.25 | ±0.27 | ±0.006 |
| 2000 Hz | ±0.37 | ±0.38 | ±0.010 |
| 4000 Hz | ±0.36 | ±0.36 | ±0.008 |
| Step | Object for Evaluation | Pairwise Sound Judgement | |
|---|---|---|---|
| 1 | Difference internally Conf 1 |
| |
| 2 | Difference internally Conf 2 |
| |
| 3 | Difference internally Conf 3 |
| |
| 4 | Differences for position R2 |
|
|
| 5 | Differences for position R4 |
|
|
| 6 | Differences for position R5 |
|
|
Publisher’s Note: MDPI stays neutral with regard to jurisdictional claims in published maps and institutional affiliations. |
© 2021 by the authors. Licensee MDPI, Basel, Switzerland. This article is an open access article distributed under the terms and conditions of the Creative Commons Attribution (CC BY) license (https://creativecommons.org/licenses/by/4.0/).
Share and Cite
Arvidsson, E.; Nilsson, E.; Bard Hagberg, D.; Karlsson, O.J.I. The Difference in Subjective Experience Related to Acoustic Treatments in an Ordinary Public Room: A Case Study. Acoustics 2021, 3, 442-461. https://0-doi-org.brum.beds.ac.uk/10.3390/acoustics3020029
Arvidsson E, Nilsson E, Bard Hagberg D, Karlsson OJI. The Difference in Subjective Experience Related to Acoustic Treatments in an Ordinary Public Room: A Case Study. Acoustics. 2021; 3(2):442-461. https://0-doi-org.brum.beds.ac.uk/10.3390/acoustics3020029
Chicago/Turabian StyleArvidsson, Emma, Erling Nilsson, Delphine Bard Hagberg, and Ola J. I. Karlsson. 2021. "The Difference in Subjective Experience Related to Acoustic Treatments in an Ordinary Public Room: A Case Study" Acoustics 3, no. 2: 442-461. https://0-doi-org.brum.beds.ac.uk/10.3390/acoustics3020029