Article

A Basic Study on the Absorption Properties and Their Prediction of Heterogeneous Micro-Perforated Panels: A Case Study of Micro-Perforated Panels with Heterogeneous Hole Size and Perforation Ratio

Environmental Acoustics Laboratory, Department of Architecture, Graduate School of Engineering, Kobe University, Kobe 657-8501, Japan
*
Author to whom correspondence should be addressed.
Submission received: 27 May 2021 / Revised: 28 June 2021 / Accepted: 30 June 2021 / Published: 5 July 2021

Abstract

:
Micro-perforated panels (MPPs) are one of the most promising alternatives to conventional porous sound-absorbing materials. Traditionally, the theory of the sound absorption properties of MPPs is based on the assumption that MPPs are a homogeneous material with identical pores at regular intervals. However, in recent years, some MPPs have not met these conditions, and although a variety of designs have been created, their properties and prediction methods were studied in only fewer works. In this paper, considering the wide variety of MPP designs, we made a trial production of heterogeneous MPPs, which are MPPs with holes of different diameters, and studied the prediction method applicable to these MPPs. We measured the normal incidence sound absorption characteristics of those MPPs, backed by a rigid backing and air-cavity in-between, in an impedance tube. The prediction method proposed in this work is to treat the heterogeneous MPPs as combinations of several homogeneous components, and to combine them after applying the existing theory on homogeneous MPPs to each component. As a result, except in a few cases, the measured and predicted values of the absorption properties agreed relatively well. We also found that the arrangement of the holes in the material and the depth of the back cavity affected the agreement between the measured and predicted results.

1. Introduction

Recently, micro-perforated panels (MPPs) [1] have become widely known as one of the most promising alternatives to conventional porous absorbers due to their durability, hygiene benefit, recyclability, and designability.
Maa [2,3] first studied the absorption structure of MPPs and proposed a prediction method for the absorption characteristics. Since Maa’s pioneering works, there have been many studies on implementation [4,5,6], and various usage and applications have been comprehensively reviewed in [7,8]. Not only these developments in research works, but recently there have been various new sound absorbing products using MPPs with sophisticated designs [9]. Another theory for designing the acoustical properties of MPPs, proposed by Guo et al. [10], is considered to be useful: It is similar to Maa’s theory, but can include various resistive end correction treatments, and is applicable to holes with an arbitrary cross-sectional shape. Both Maa’s and Guo’s theories assume that MPPs have uniformly sized holes at a constant distance from each other, i.e., they assume homogeneous MPPs taking the average of the impedances of holes and non-hole parts.
On the other hand, inhomogeneous absorption structures using MPPs, which are combinations of alternately placed MPP absorbers with different specifications or MPP absorbers with different air-cavity depths, have also been studied [11,12,13]. However, there are few studies on the effect of the distribution of parameters in an MPP. Carbajo et al. studied the acoustical properties of a heterogeneous perforated panel by the admittance sum method (ASM), parallel transfer matrix (PTM), equivalent circuit method (ECM), and finite element method (FEM) with the JCA model, and compared the results [14]. They did not give the experimental results but reported that all these analytical and numerical methods provide similar results. In addition, Carbajo et al. remarked that special attention must be paid to the type of back cavity configuration.
More recently, in a case study on the absorption characteristics of an MPP with distributed hole diameters due to the lower production accuracy, Pan and Martellotta showed that a relatively good prediction of absorption characteristics was possible using the mean hole diameter in the case that the deviation is smaller [15]. On the contrary, Sakagami et al. [16] reported a case study of MPPs produced by a 3D printer of non-professional use, in which hole diameters were distributed randomly due to the lower production accuracy: It was shown that the predicted values, using the mean hole diameter as the representative diameter in the existing theory, were not in good agreement with the measured results. Works discussing the effect of heterogeneity of a sound absorber on its acoustic properties have been performed in previous papers in relation to the manufacturing accuracy for various sound absorbing materials, e.g., Helmholtz resonator, porous type, etc., in which the heterogeneity is observed and the discussion of its effect was given [17,18,19]. Hereafter, MPPs with heterogeneous parameter distribution are defined as heterogeneous MPPs, and are distinguished from inhomogeneous absorption structures that have different MPP absorbers periodically [11,12,13].
In the conventional design of MPP, the fixed-diameter holes are at fixed intervals. In other words, conventional MPPs are homogeneous in many cases However, in order to increase the variety of the design, a combination of holes with different diameters is also used nowadays [20]. This was expected to have a visual effect as if the number of holes was reduced using a combination of larger holes and hardly visible smaller holes. In such a case, it is difficult to predict the acoustic properties of the system properly by the usual prediction methods. Therefore, it is necessary to explore the prediction method.
In this work, first as a case study to show examples of the sound absorption characteristics of heterogeneous MPP absorbers with an air-cavity and rigid-backing, heterogeneous MPP specimens, i.e., MPPs with different hole diameters, are designed and produced by precision micro-drilling. For these specimens, their normal absorption characteristics are measured in an impedance tube. Next, in order to explore a prediction, the method for these heterogeneous MPPs is discussed. For the prediction, we assume a homogeneous part of the MPP, which is a collection of holes of equal diameter from the heterogeneous MPP, apply Guo’s theory [10] to them to obtain the impedance, and then try to combine the impedance of each part obtained. Then, the measured results are compared with the predicted values to confirm the usability of the prediction method.

2. Prototype of the Test Specimen and the Experimental Procedure

In order to assess the acoustical properties of heterogeneous MPPs with different hole diameters, precision manufactured samples were prepared and an impedance tube test was performed. In this section, the specimens used and the outline of the experiment are described.

2.1. Specimens

For the experiment, four types of heterogeneous MPP specimens with different hole diameters were prepared: Specimens (A), (B), (C), and (D). They are all made from an aluminum plate of 0.5 mm thickness and perforated by a computer-controlled micro-drilling machine, of which accuracy is +/−25 μm in hole diameters and hole positions that is high enough. Their specifications are as follows, and their parameters are as shown in Table 1. It should be noted that, as the perforation ratio is not constant over the surface of these specimens, the perforation ratio shown in the table is the average value over the whole surface of each material, i.e., the value gained by dividing all the holes’ surface area by the surface area of each specimen.
-
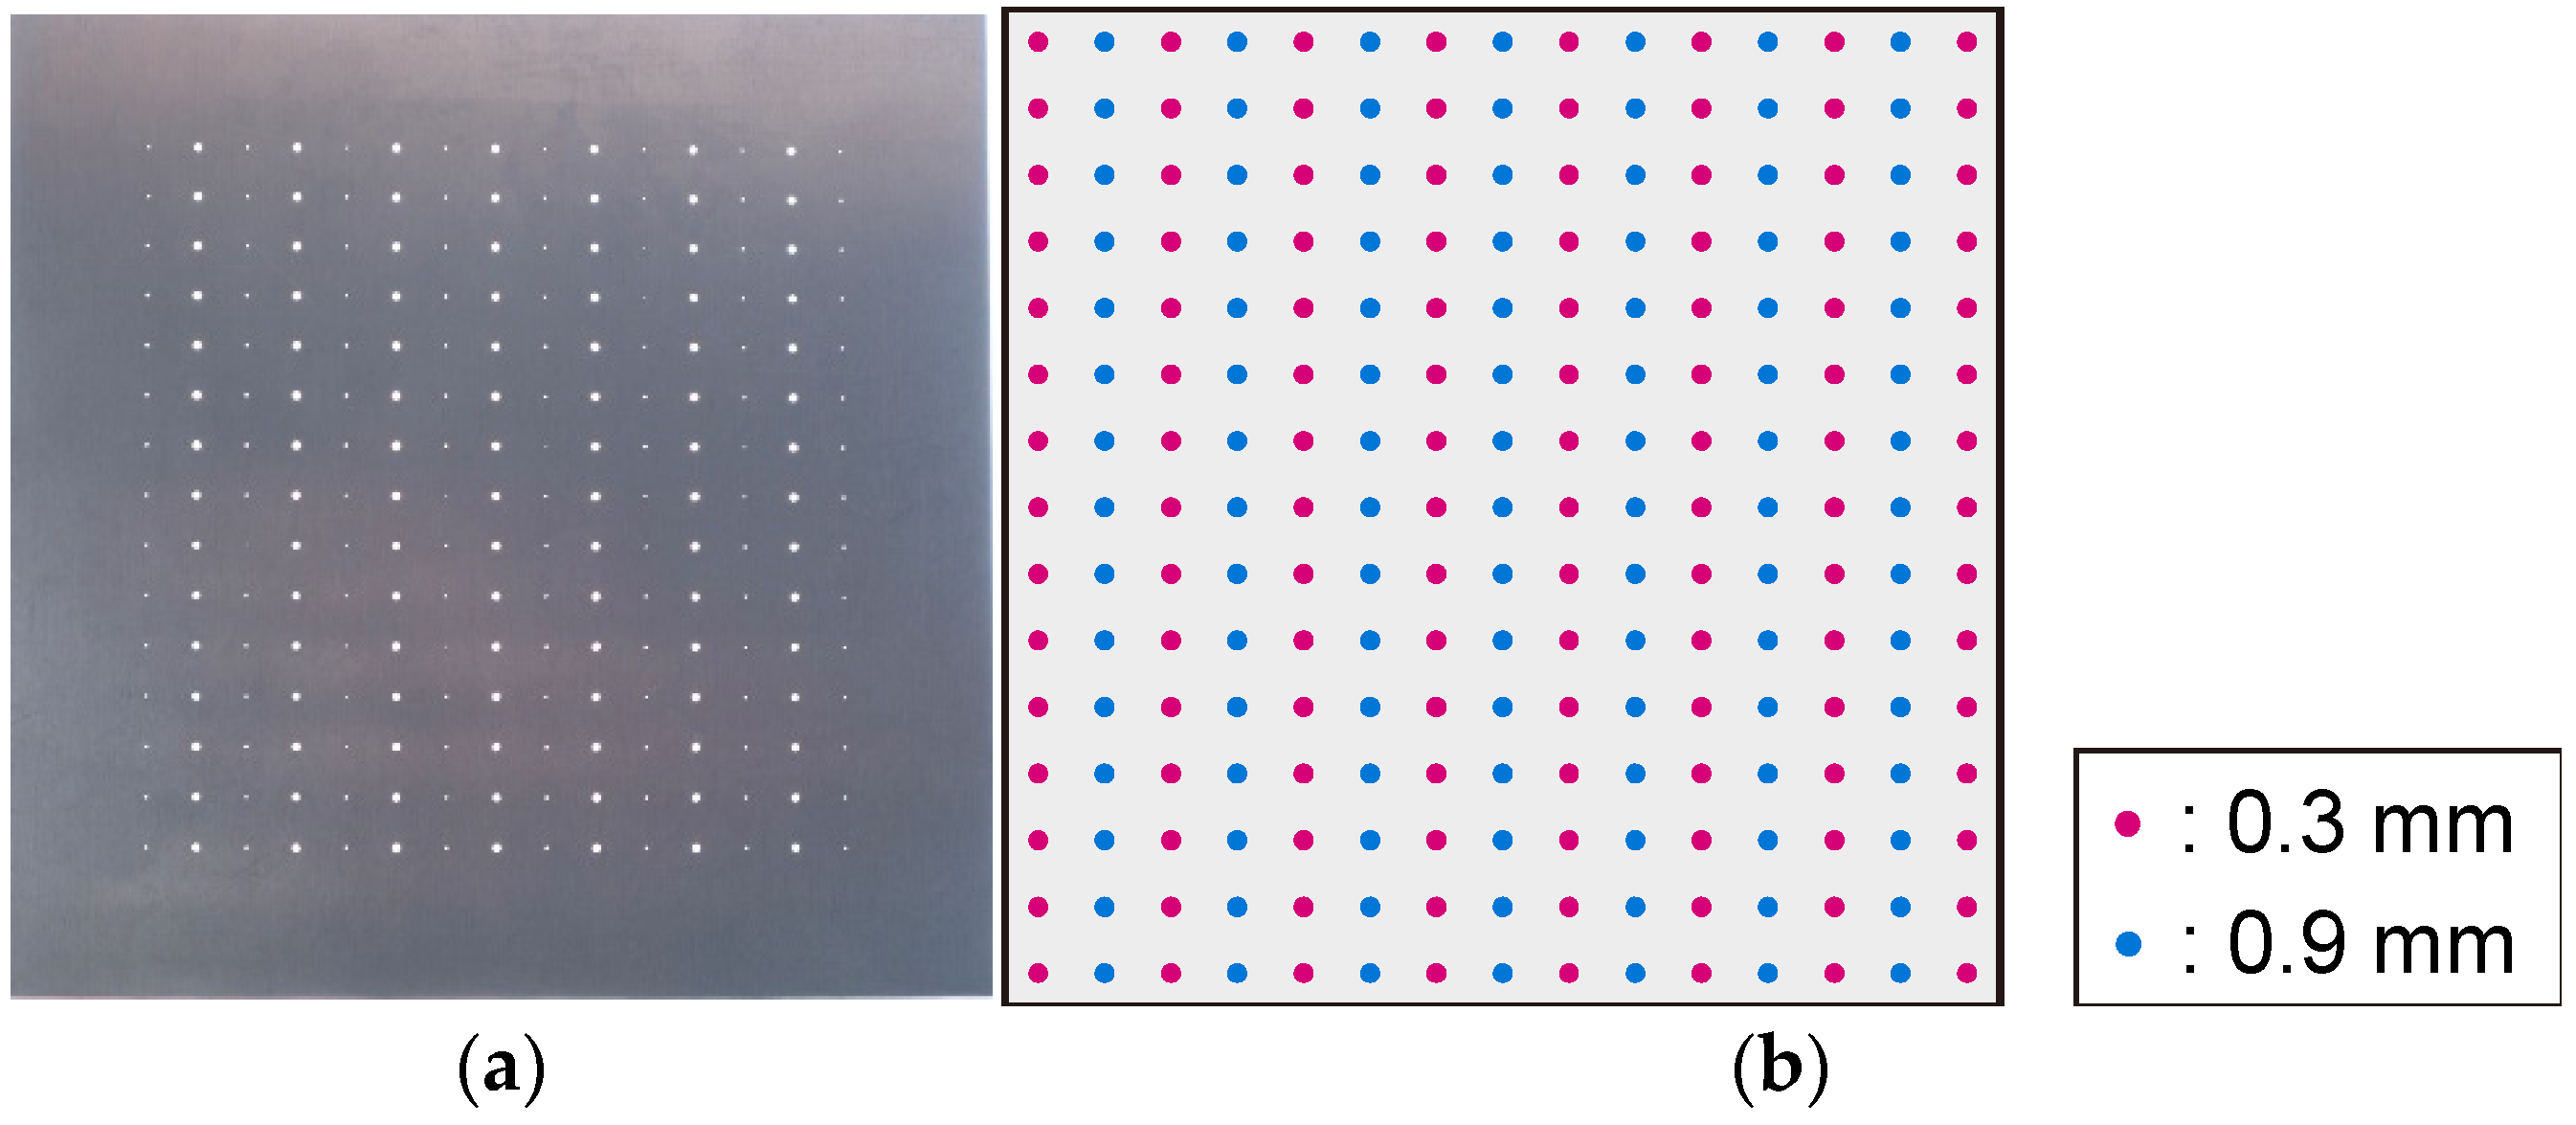
Specimen (A): An MPP with holes of 0.3 and 0.9 mm in diameter (Figure 1). These two types of holes are placed in alternate rows. The holes are arranged in a row (15 holes per row), but the number of rows is not the same for each diameter. In this case, the number of rows for holes of 0.3 mm diameter was 8 and the number of holes was 120, while the number of rows for holes of 0.9 mm was 7 and the number of holes was 105.
-
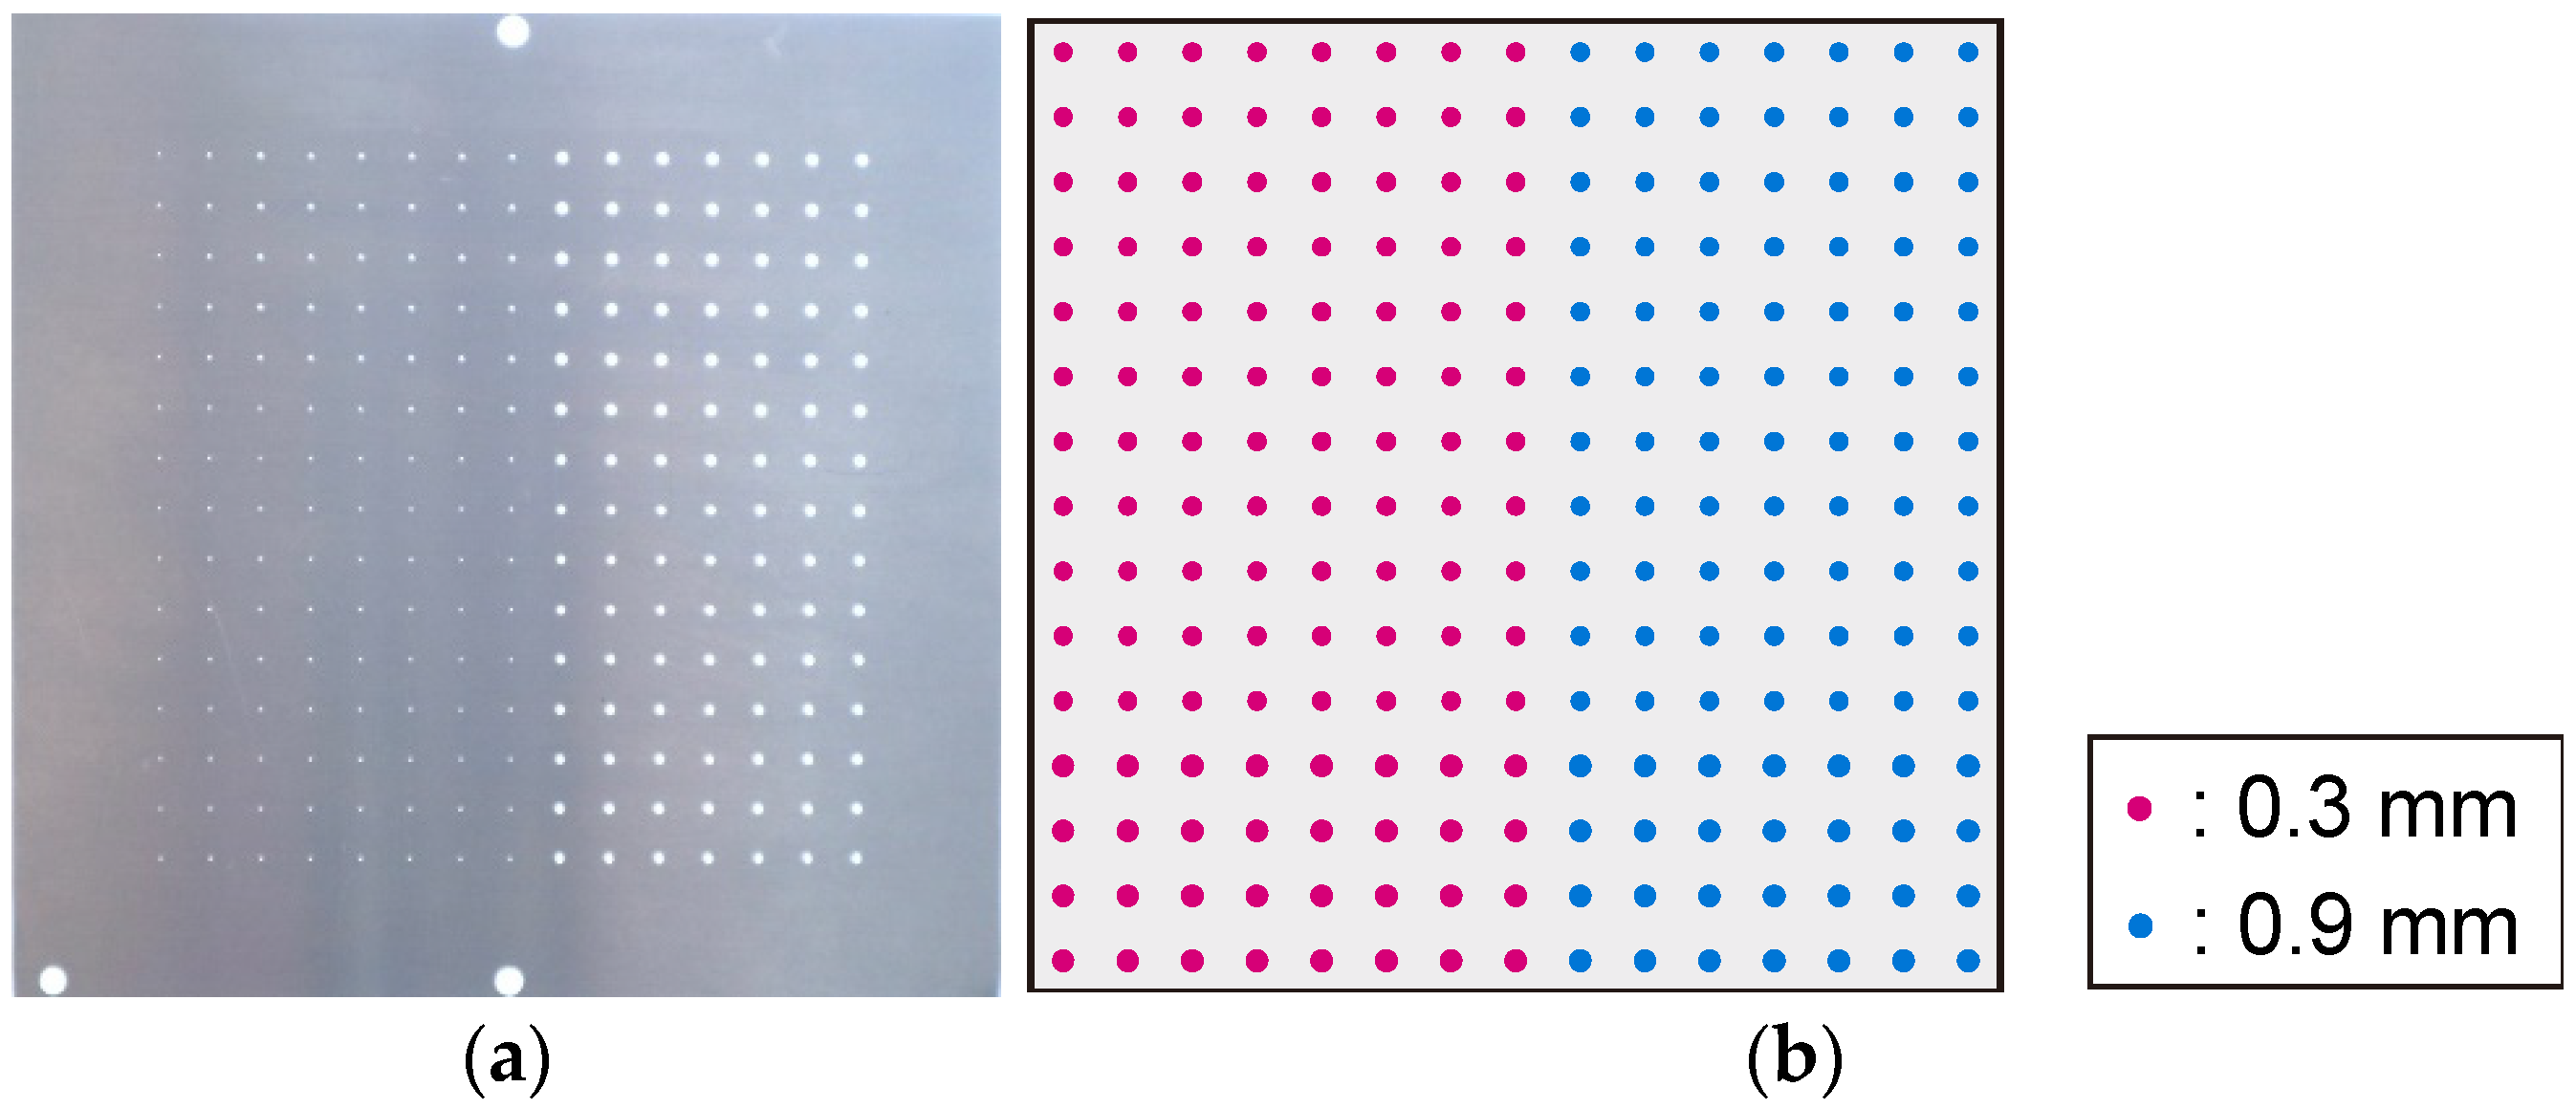
Specimen (B): An MPP with a 0.3 mm diameter hole and a 0.9 mm diameter hole, arranged separately on the left and right sides (Figure 2). The number of holes for each diameter is the same as for specimen (A).
-
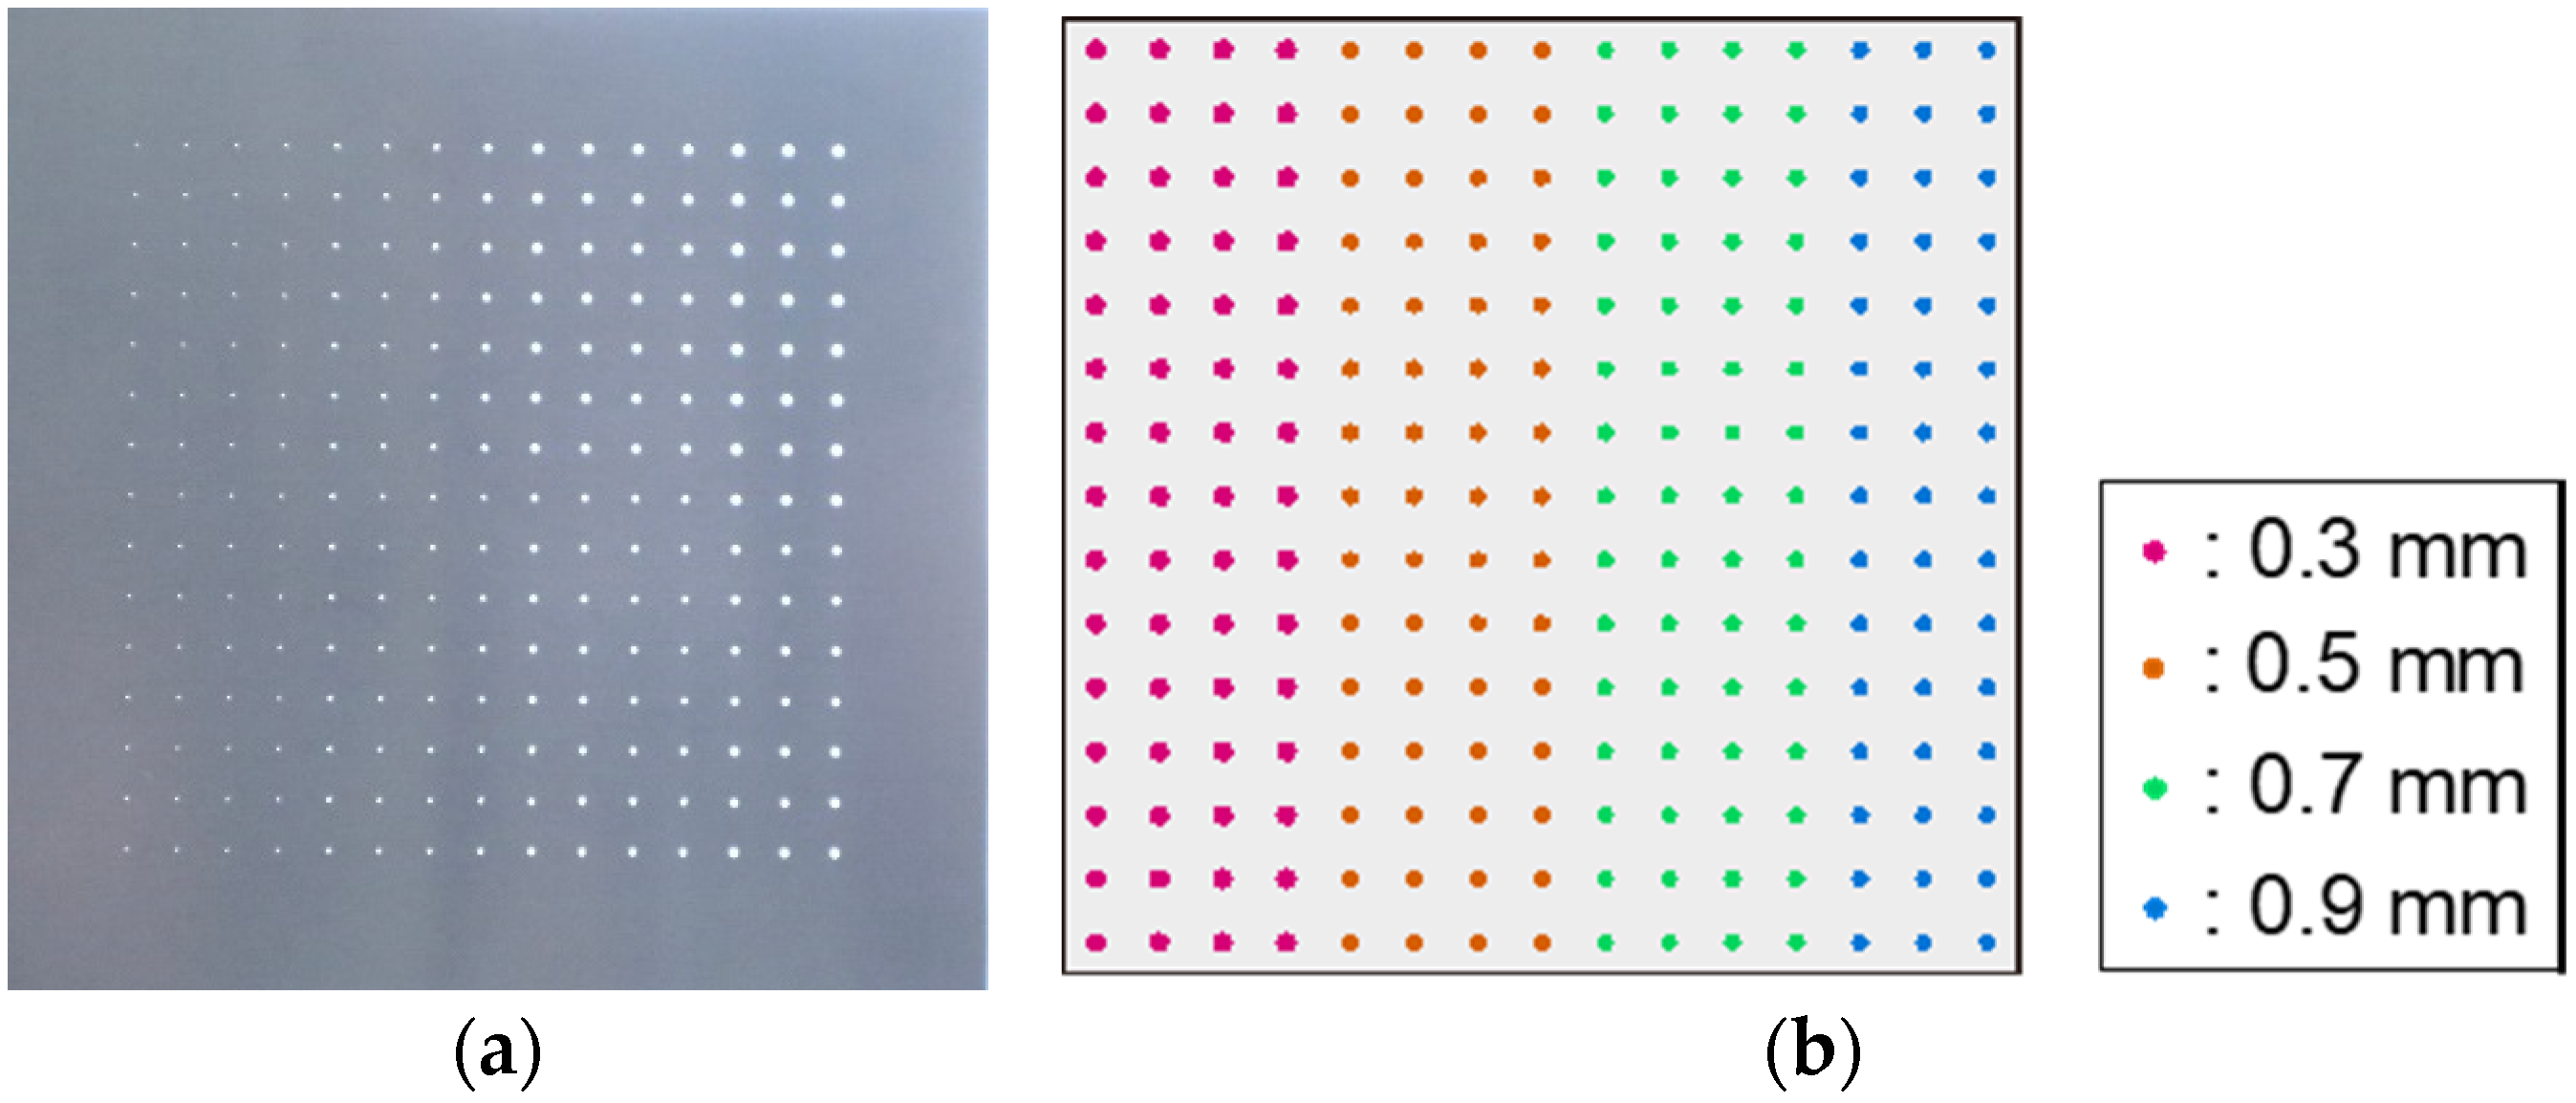
Specimen (C): An MPP with holes of diameters 0.3, 0.5, 0.7, and 0.9 mm, arranged so as to increase from smallest to largest (Figure 3). The number of rows for each hole diameter is not constant: For the 0.9 mm diameter holes there are 3 rows, whereas for the other diameter holes there are 4. The numbers of the holes are: 60 (0.3, 0.5, 0.7 mm), and 45 (0.9 mm).
-
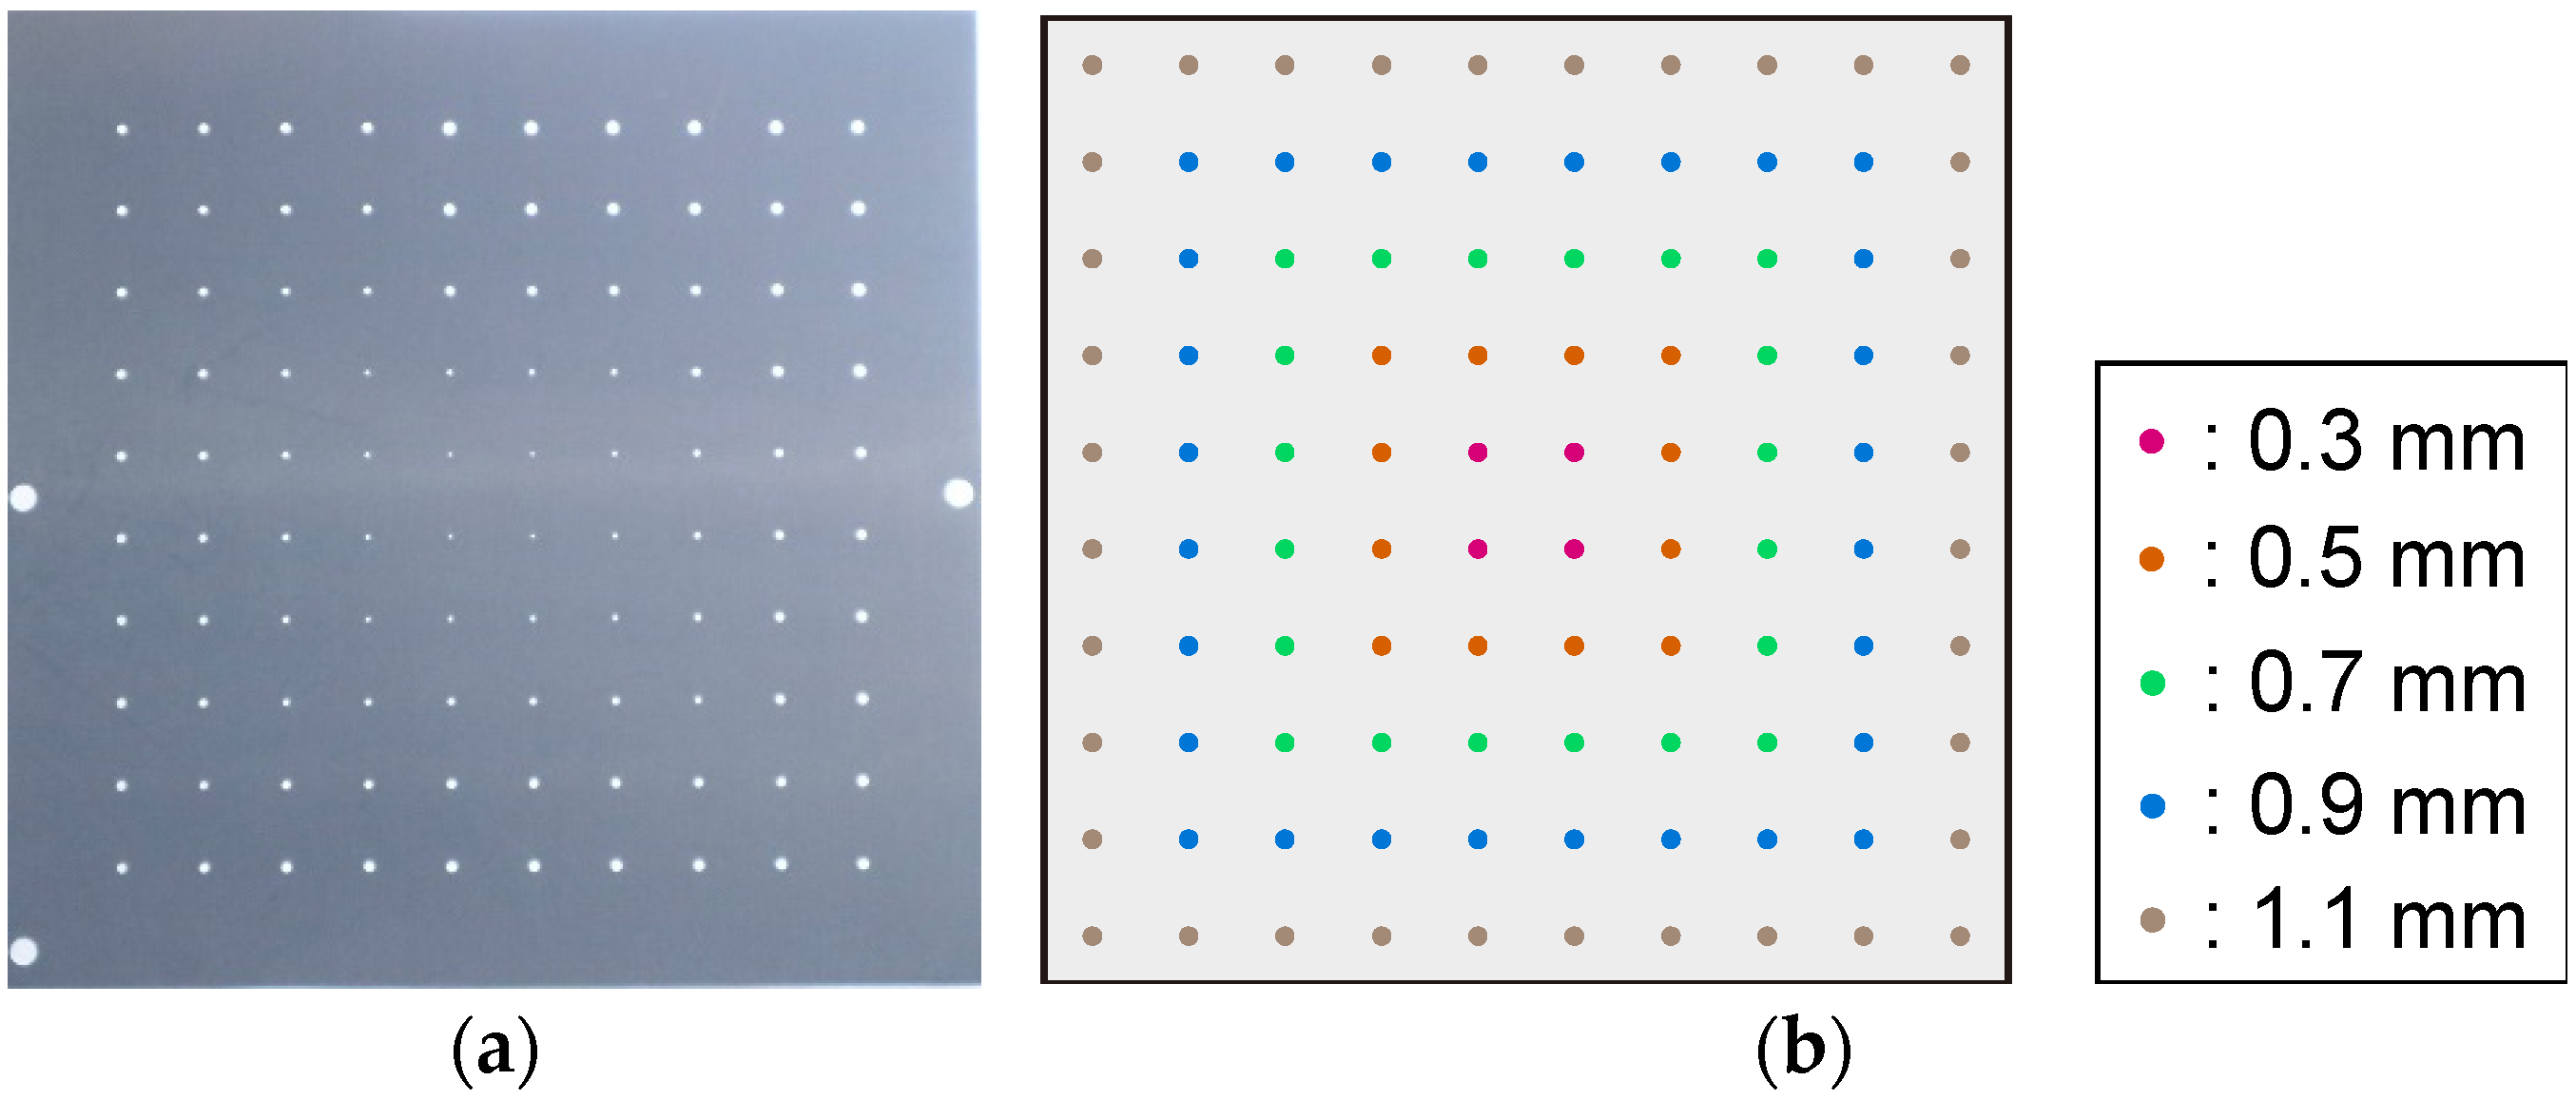
Specimen (D): As shown in Figure 4, specimen (D) consists of five different hole diameters, 0.3, 0.5, 0.7, 0.9, and 1.1 mm, arranged from the center to the periphery, with the diameter increasing as one moves towards the outside. The numbers of the holes are: 4 (0.3 mm), 12 (0.5 mm), 20 (0.7 mm), 28 (0.9 mm), and 36 (1.1 mm).

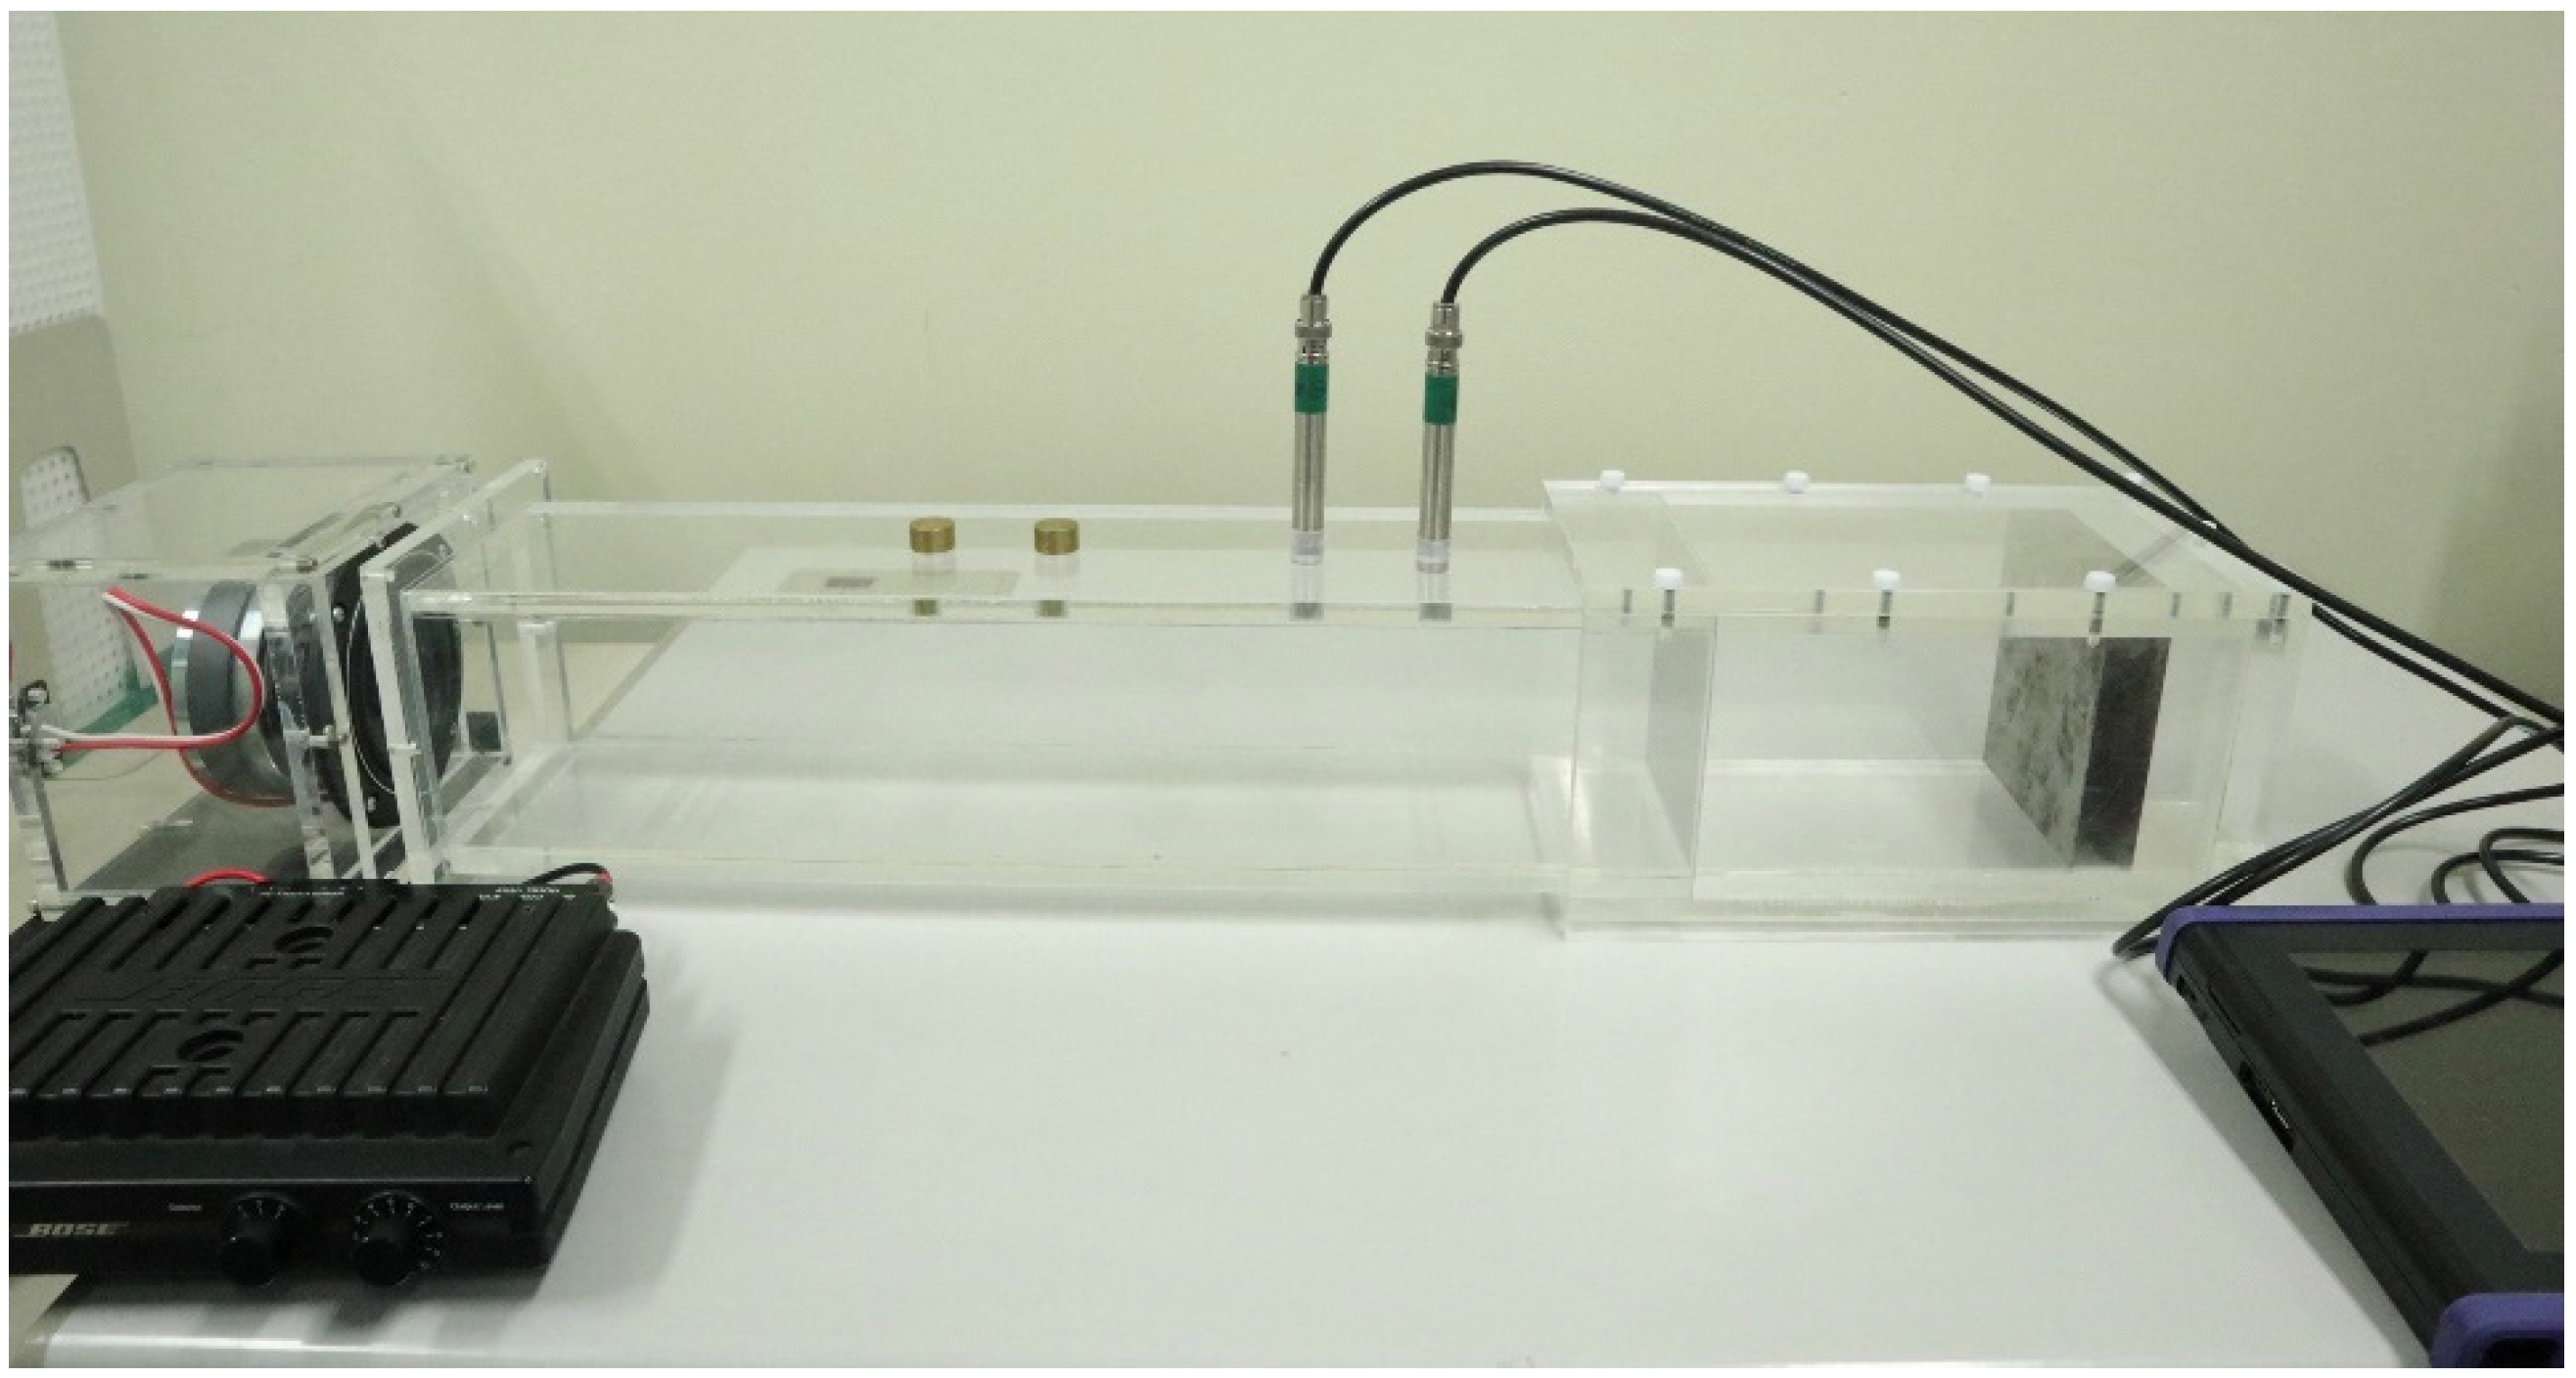
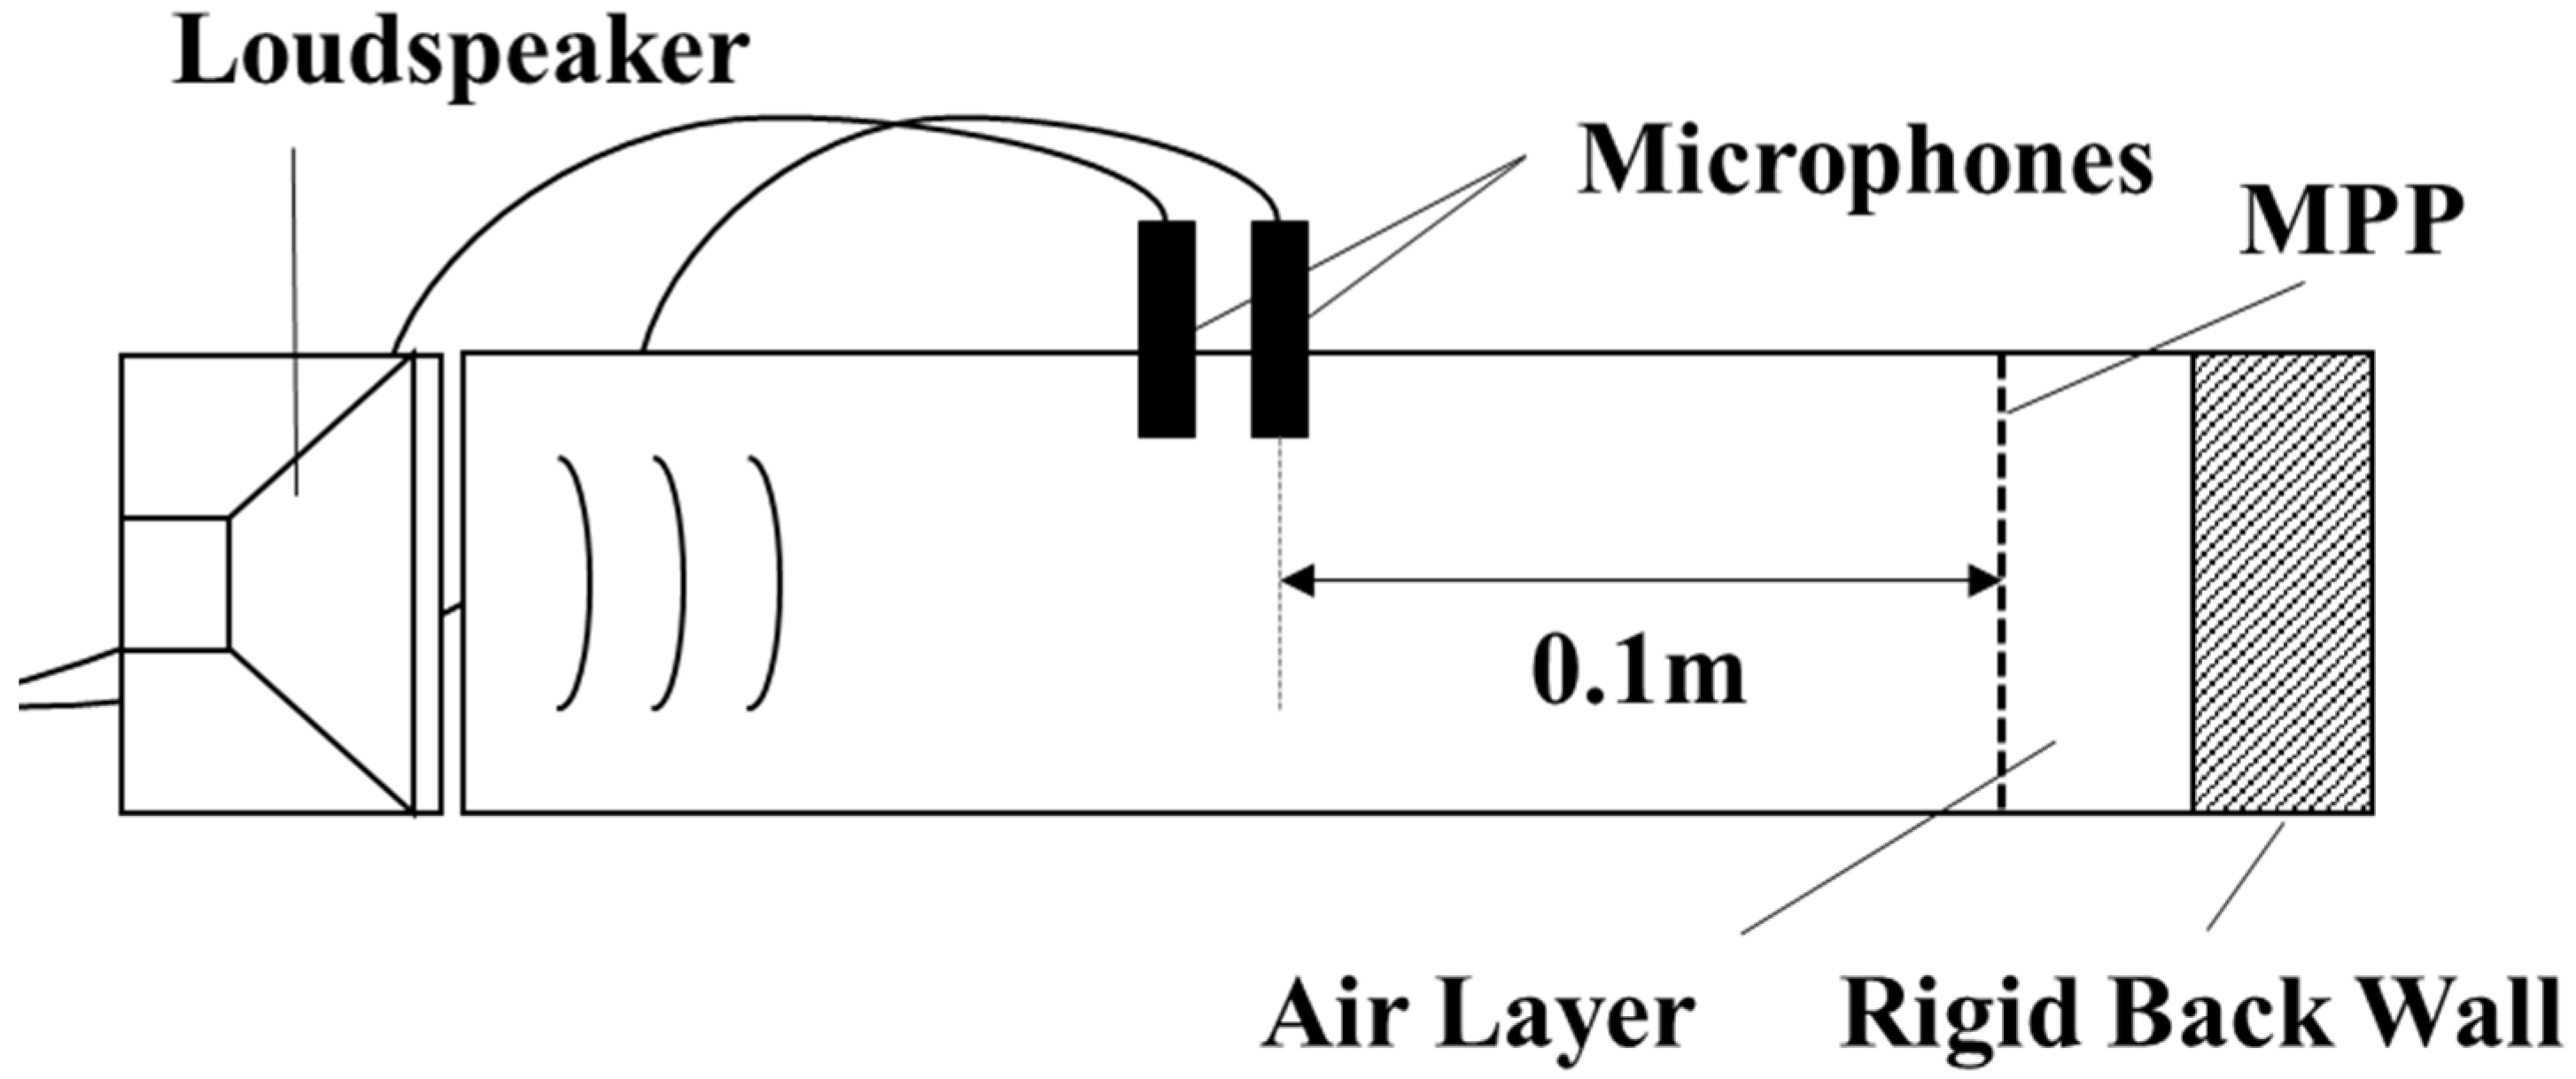
2.2. Measurement Setup

The normal incidence absorption coefficient was measured in accordance with JIS A 1405-2 [21] (ISO 10534-2 compatible [22]) using an impedance tube (with a square cross-sectional shape, a size of 10 by 10 cm, and a maximum measurement frequency of 1700 Hz. The distance of the microphones is 50 mm), as shown in Figure 5. The air-back cavity between a specimen and the rigid-back wall were set to the three cases: 25, 50, and 75 mm. Figure 6 shows diagrams of the measurement equipment. The measurement was made at 1.25 Hz steps from 125 to 1700 Hz.

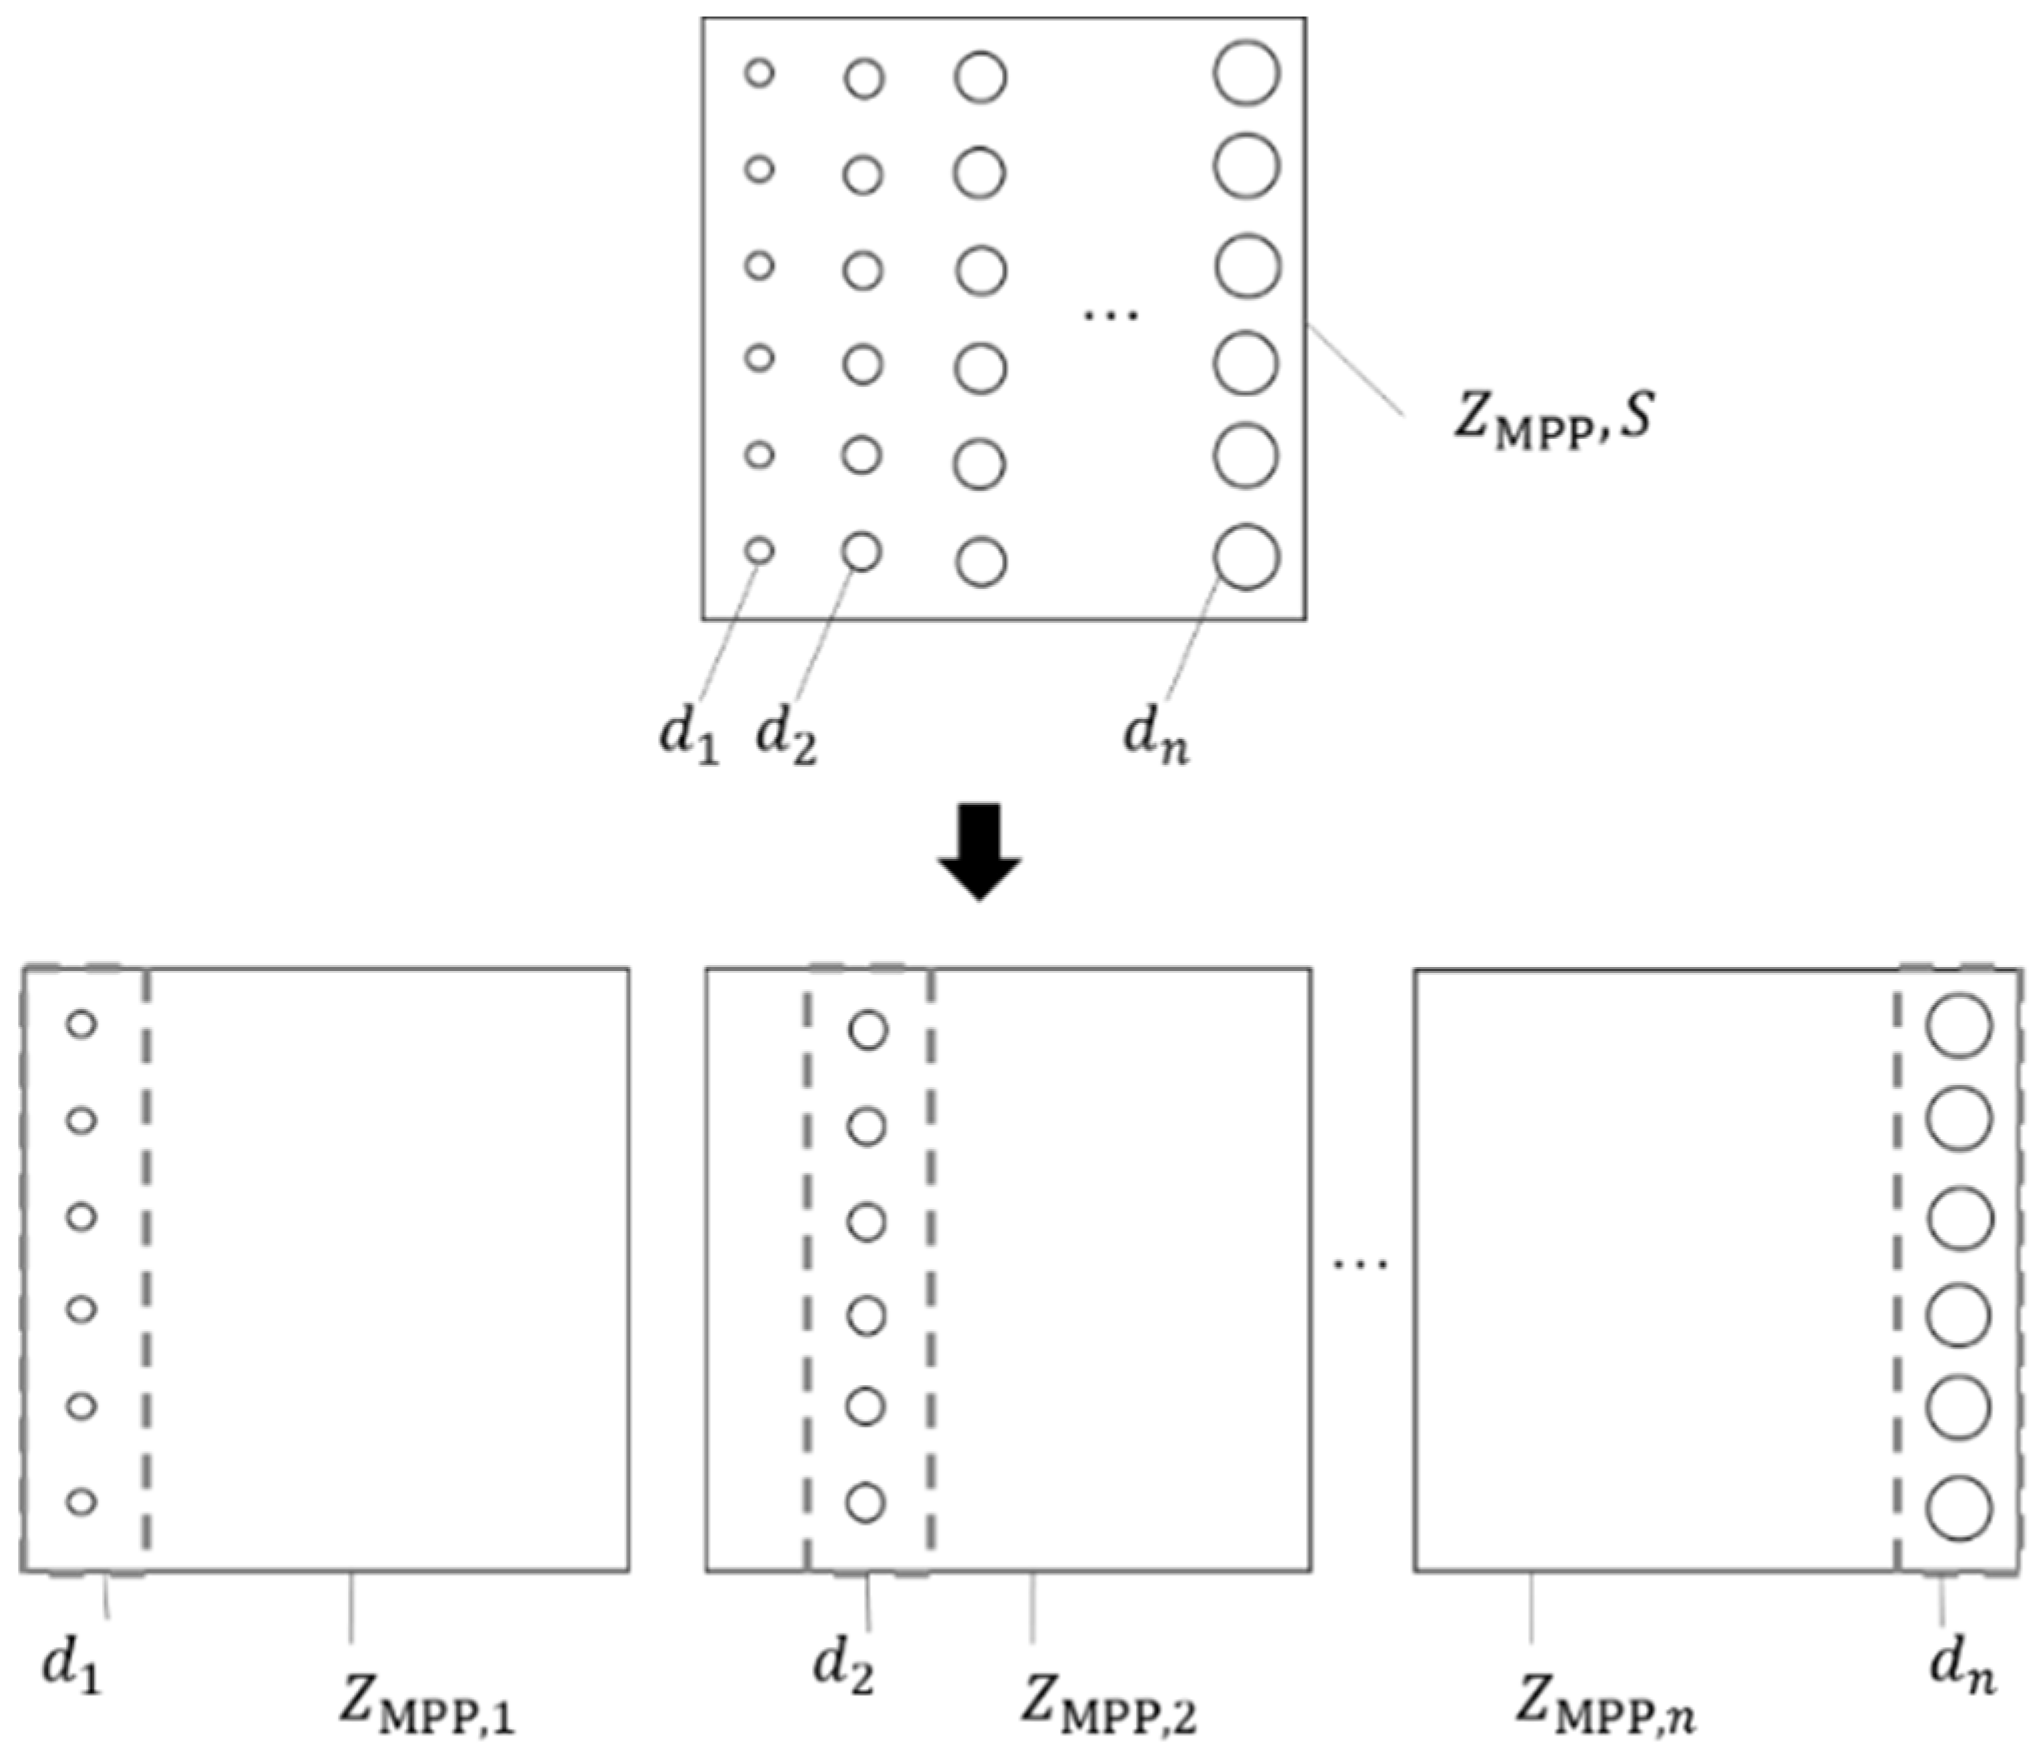
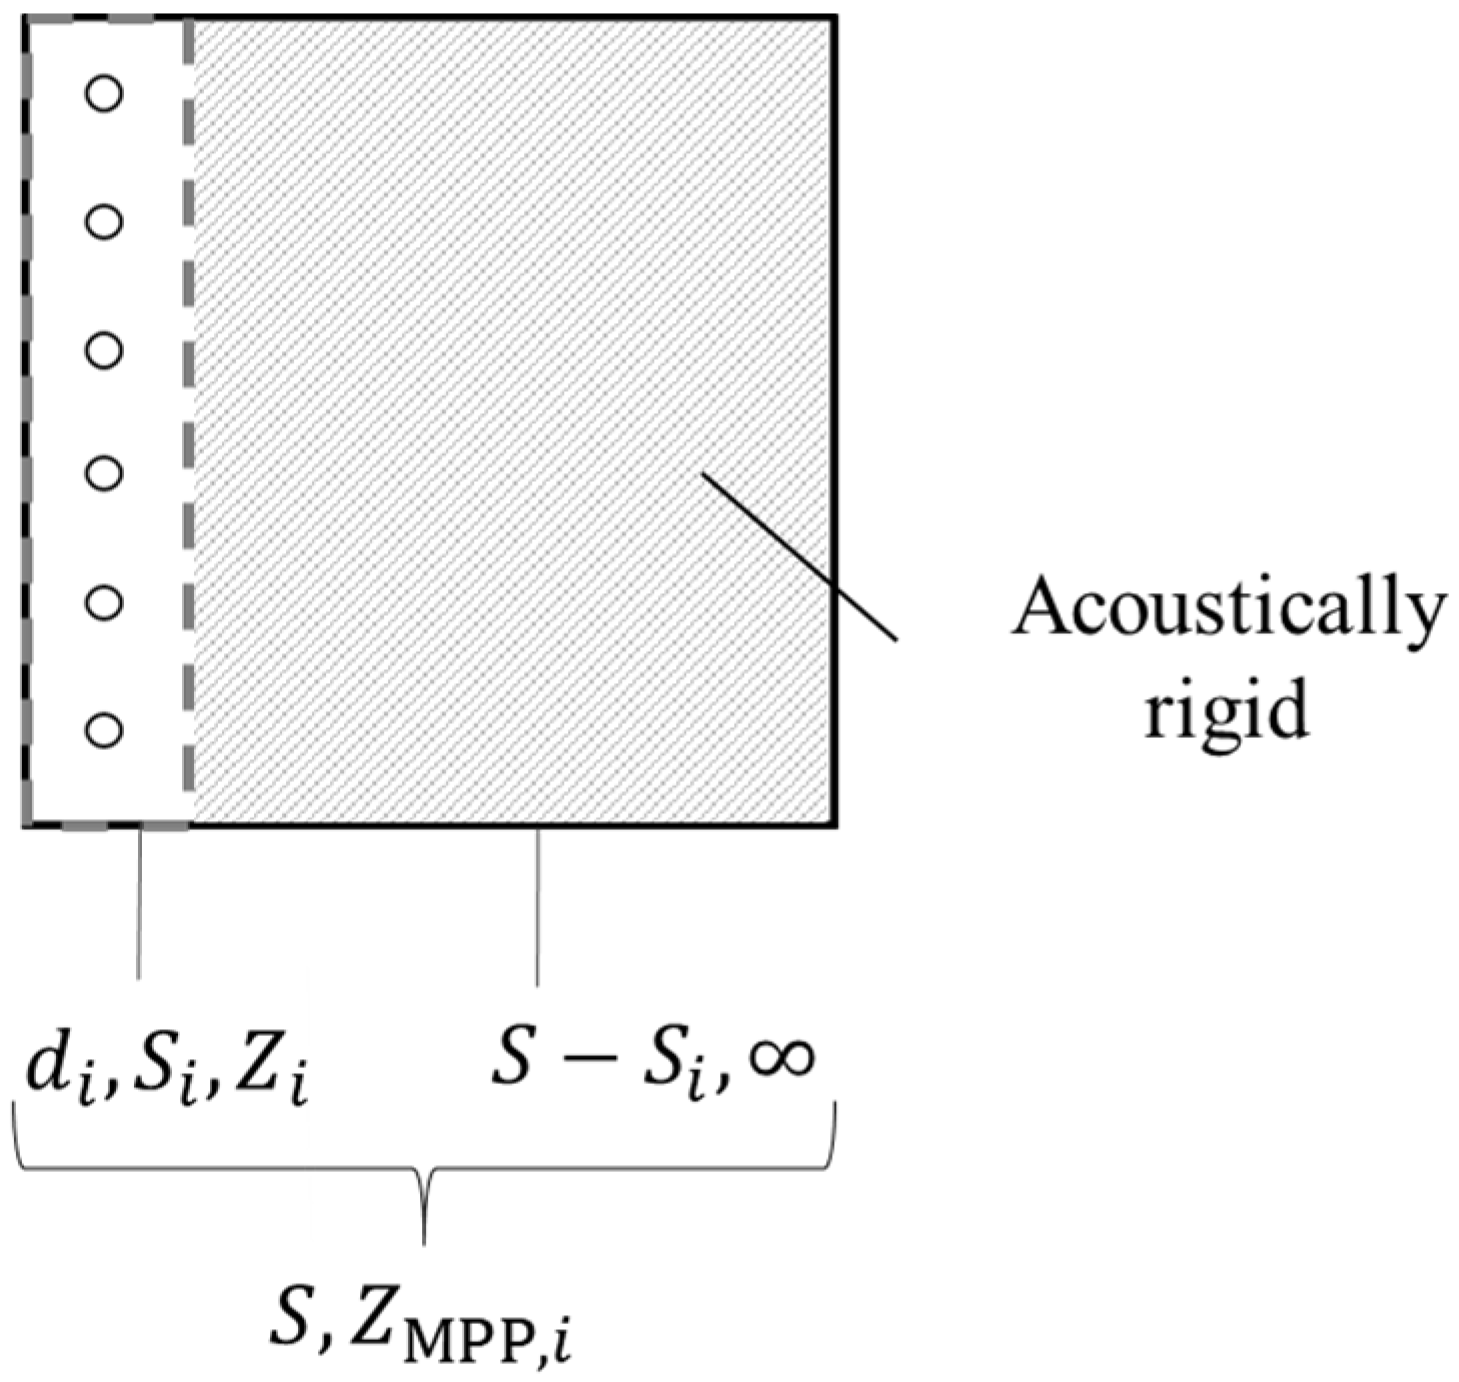
3. Prediction Method

As mentioned earlier, the widely used theories for determining the acoustic impedance of MPPs, such as Maa’s theory, Guo’s theory, etc., all treat the acoustic properties as being homogeneous over the entire surface of the material. For heterogeneous MPPs, such as the ones considered in this study, it is not possible to obtain appropriate predictions using the averaged parameters over the entire surface with the general theory [16]. On the other hand, the material treated in this study is locally homogeneous in each part, even if it is heterogeneous on the whole. Therefore, it can be considered that each sample consists of hypothetical MPPs, in which the holes of each diameter are arranged in a homogeneous way. Thus, in the following, we will apply Guo’s theory of homogeneous MPP to each hypothetical MPP on the specimen to obtain the acoustic properties of the hypothetical MPP, and then synthesize them to obtain the overall acoustic properties (for the outline of Guo’s theory, see Appendix A).
Considering a specimen of surface area S with different holes of diameters d1, d2, …, dn, its surface impedance is defined as ZMPP. Then, assuming the hypothetical MPPs with holes of each specific diameter only in surface area S, the impedance of each MPP is defined as ZMPP,1, ZMPP,2, …, ZMPP,n. Namely, when the impedance of the hypothetical MPP with the hole of diameter d1 is ZMPP,1, the impedance of the hypothetical MPP with the hole of diameter d2 is ZMPP,2; the other hypothetical MPPs are considered in the same way (see Figure 7).
The surface impedance of the original specimen ZMPP is considered to be the impedance that is obtained by synthesizing impedances of the hypothetical MPPs, ZMPP,1, ZMPP,2, …, ZMPP,n. Therefore, ZMPP is derived by the following equation:
Z MPP = 1 i = 1 n 1 Z MPP , i
where ZMPP,i is the impedance of a hypothetical MPP with holes of di.
The impedances of the hypothetical MPPs are calculated as follows: A hypothetical impedance ZMPP,i is considered as the synthesized impedance of the part with the holes and that of the other part without holes, which are acoustically rigid. The surface area of the part with holes is Si, and its impedance is Zi. For deriving Zi, the perforation ratio is calculated by dividing the total area of the holes in the part, by the area of this part Si. Si was determined by assuming that each hole has an area equal to the square of the distance between the holes, i.e., Si = Npi2, where N is the number of the holes of diameter di, and pi is their hole separation. The surface area of the part without holes is (SSi), and its impedance is considered to be infinity. Therefore, ZMPP,i is expressed by the following equation, with Zrigid as the acoustic impedance of a rigid panel, i.e., infinity. This calculation procedure is shown in Figure 8:
Z MPP , i = 1 1 Z i S i S + 1 Z r i g i d S S i S = S S i Z i
The values of ZMPP,1, ZMPP,2, …, ZMPP,n are calculated by Equation (2) and substituted into Equation (1), then ZMPP become as follows:
Z MPP = 1 i = 1 n S i S Z i = S i = 1 n S i Z i = 1 i = 1 n r i Y i = ( i = 1 n r i Y i ) 1
By denoting Zi−1 as Yi, the acoustic admittance and factor ri, the equation can be written in the form of the admittance sum method (ASM). In the following calculation, Si is set to the area occupied by a row of holes, which is determined by the spacing of the holes.

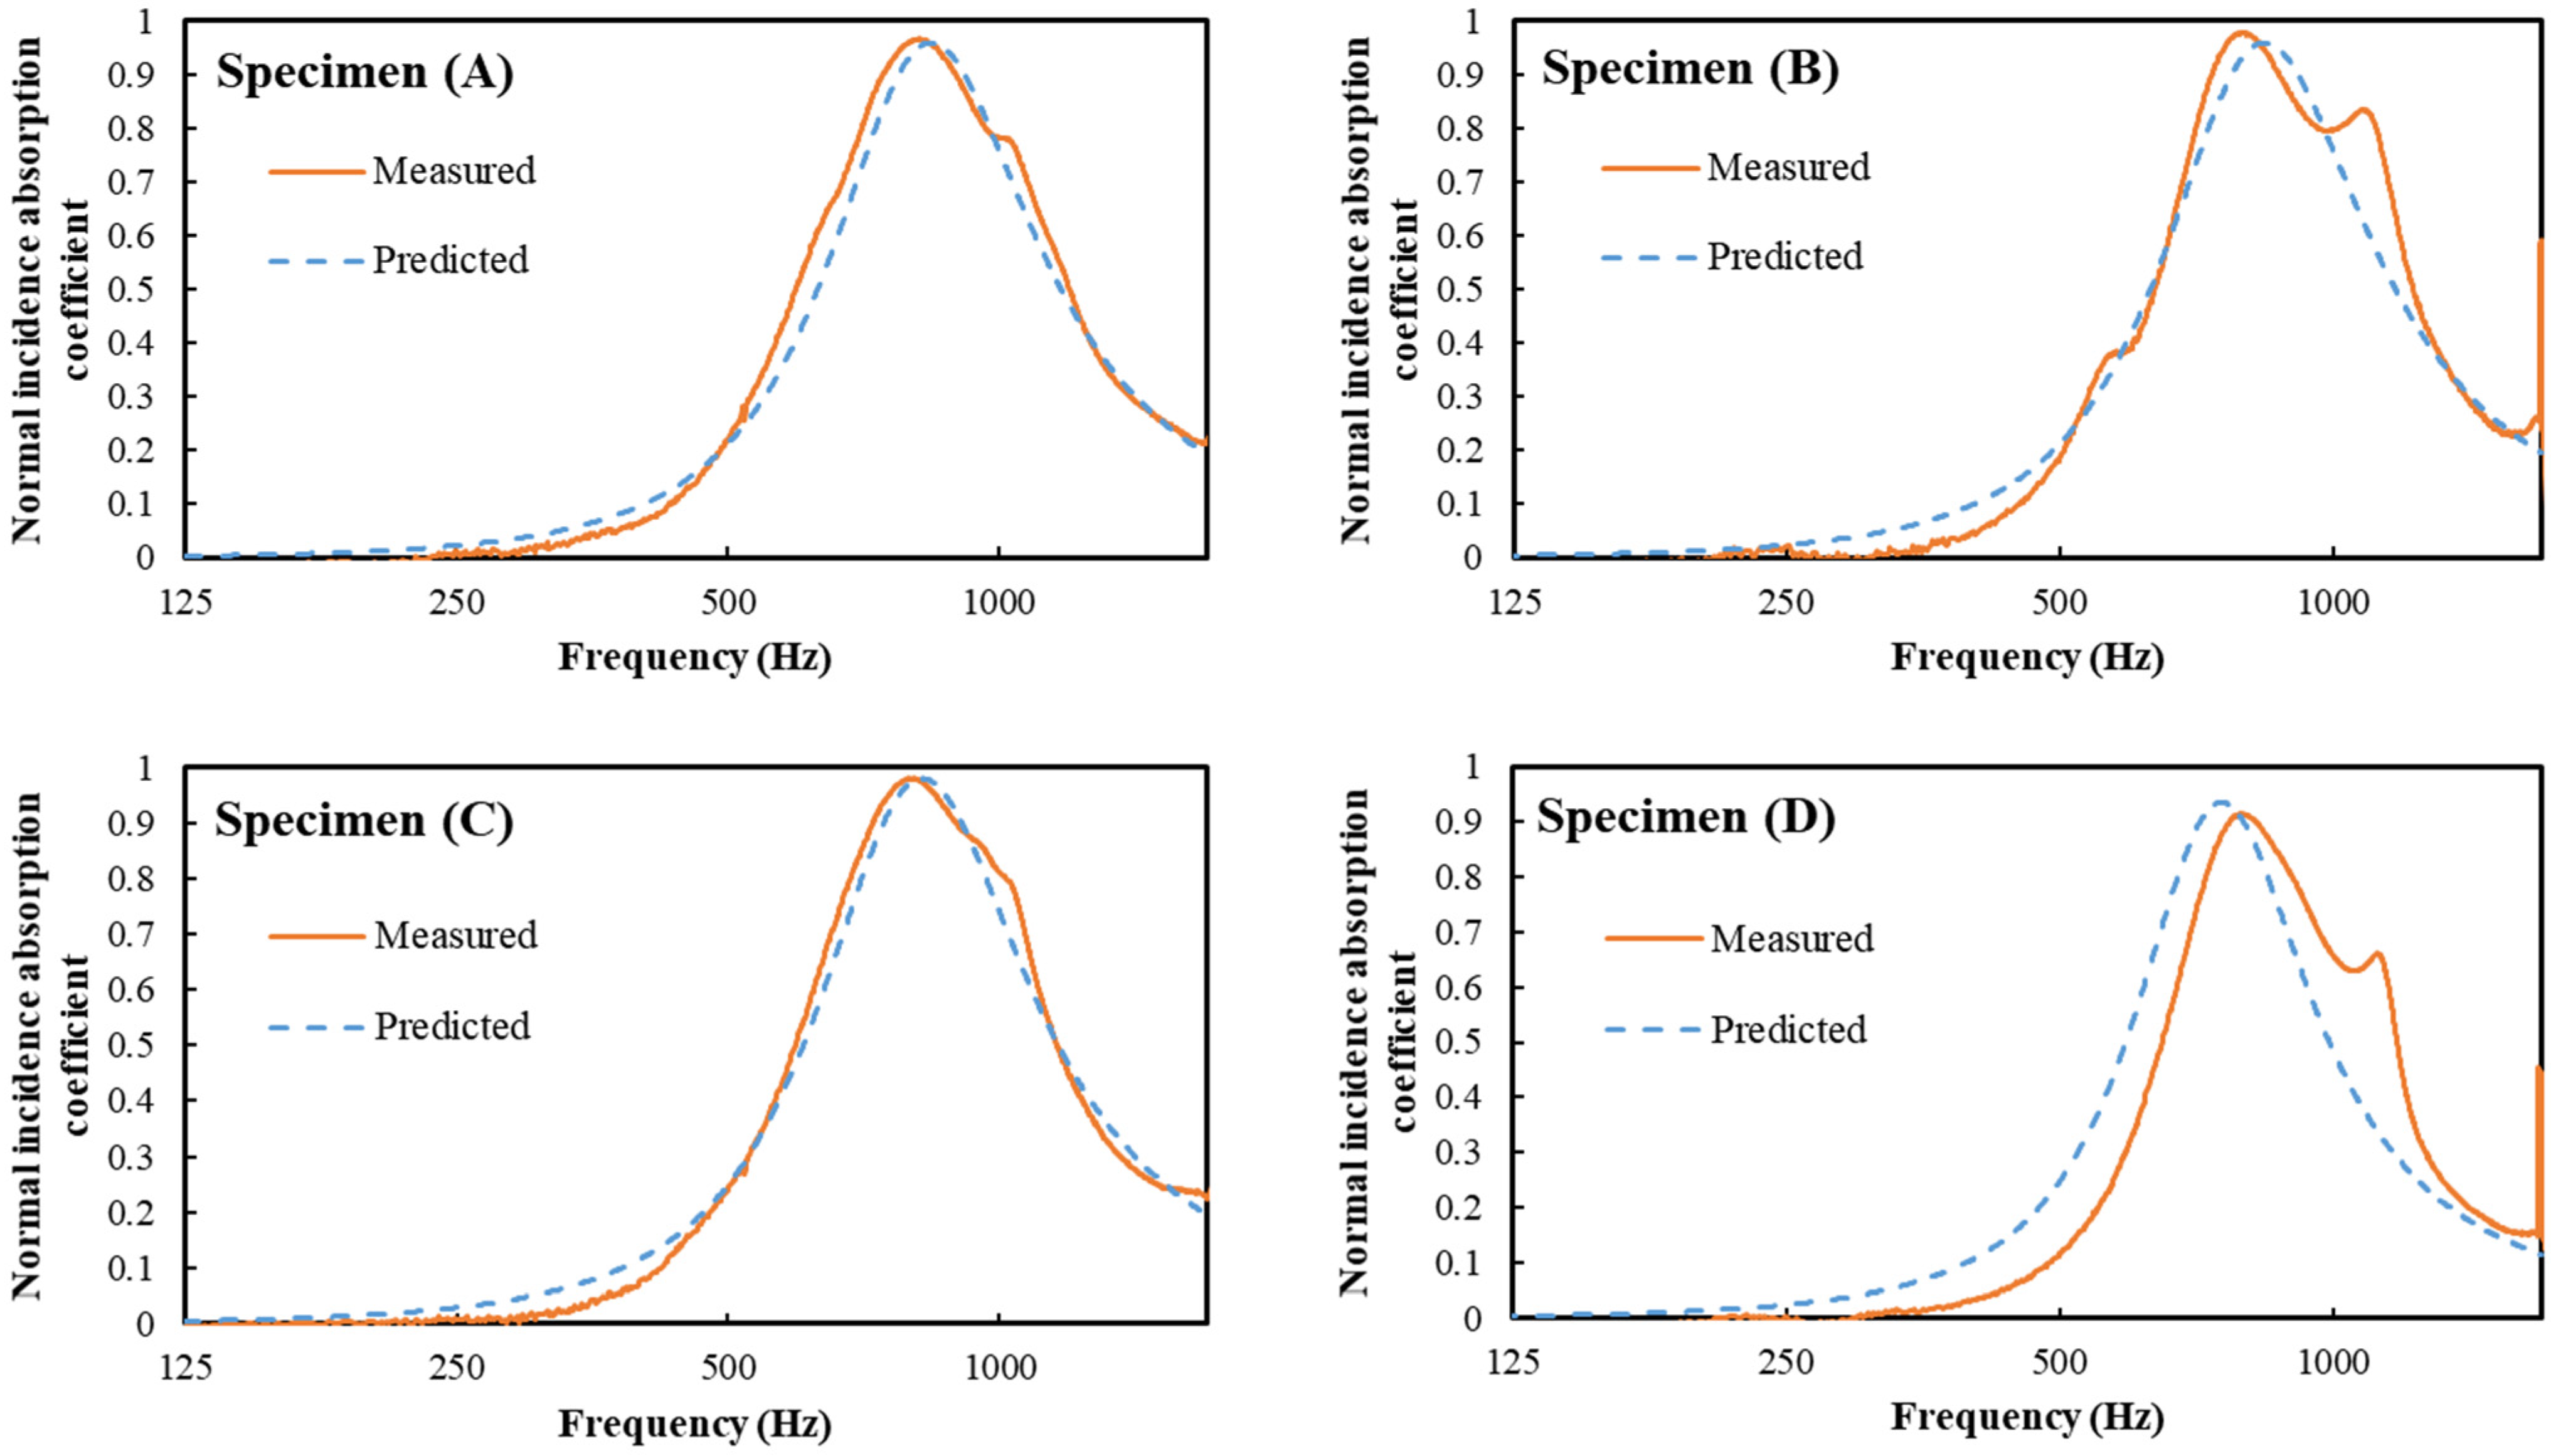
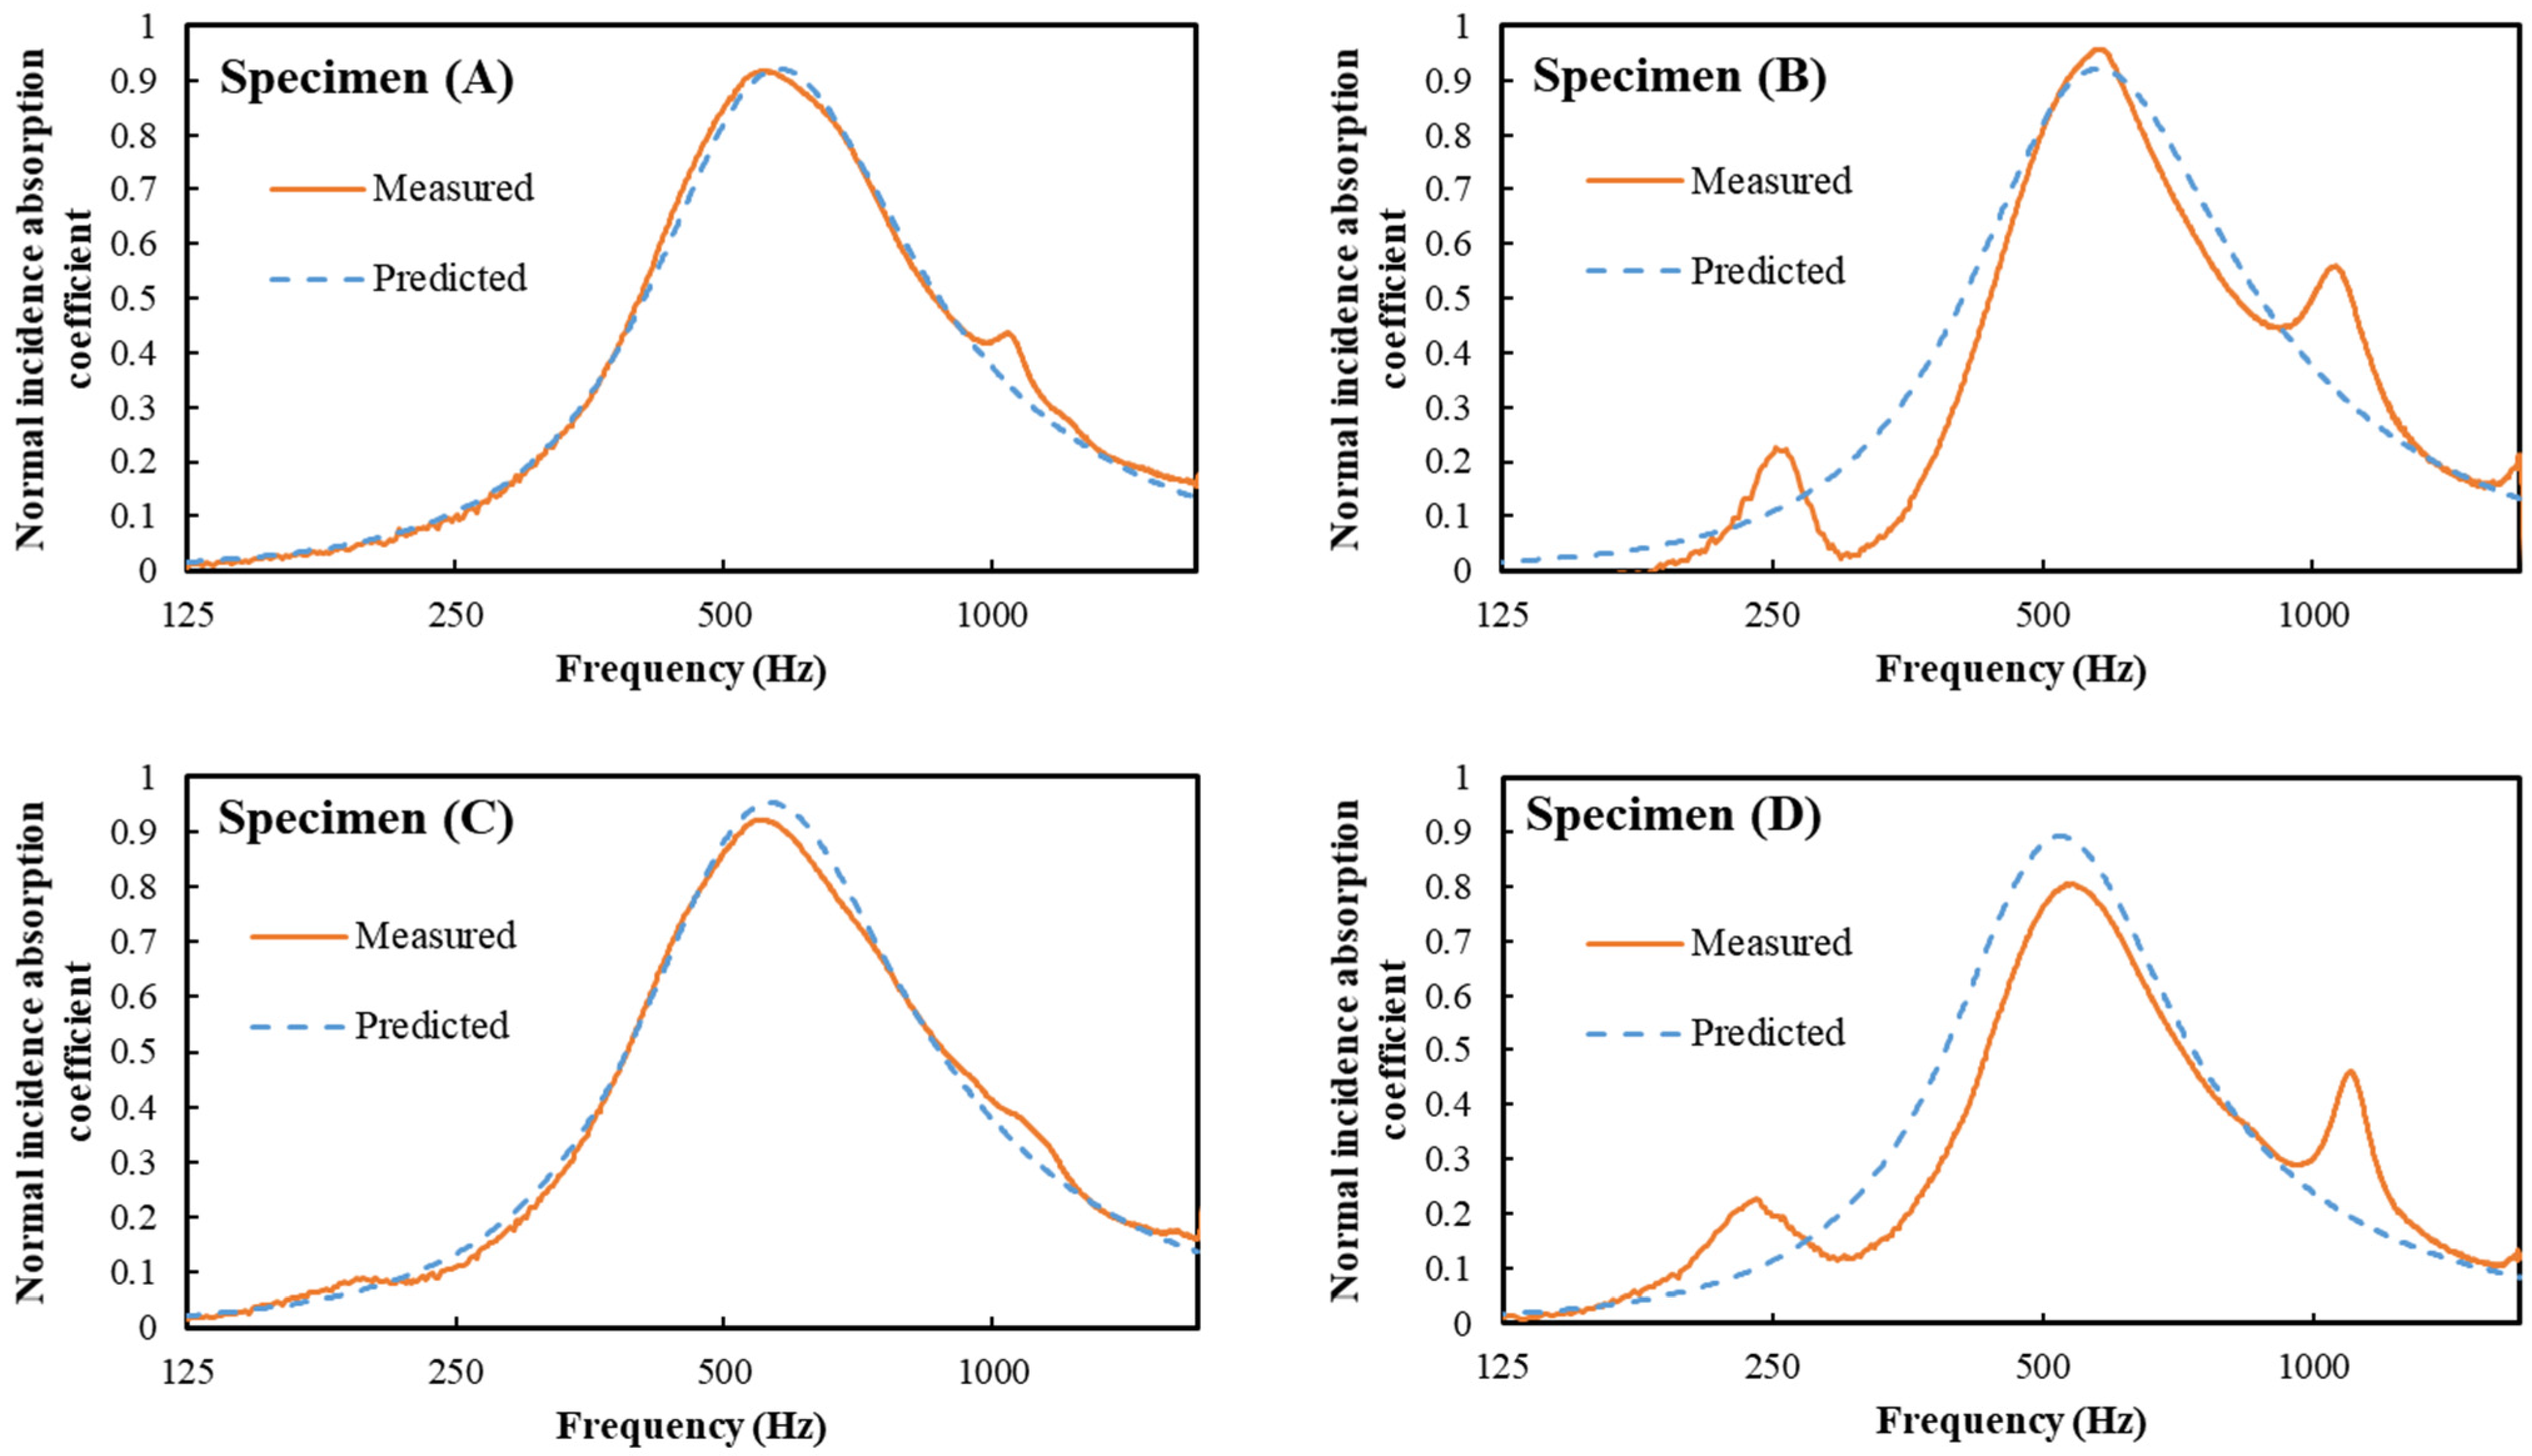
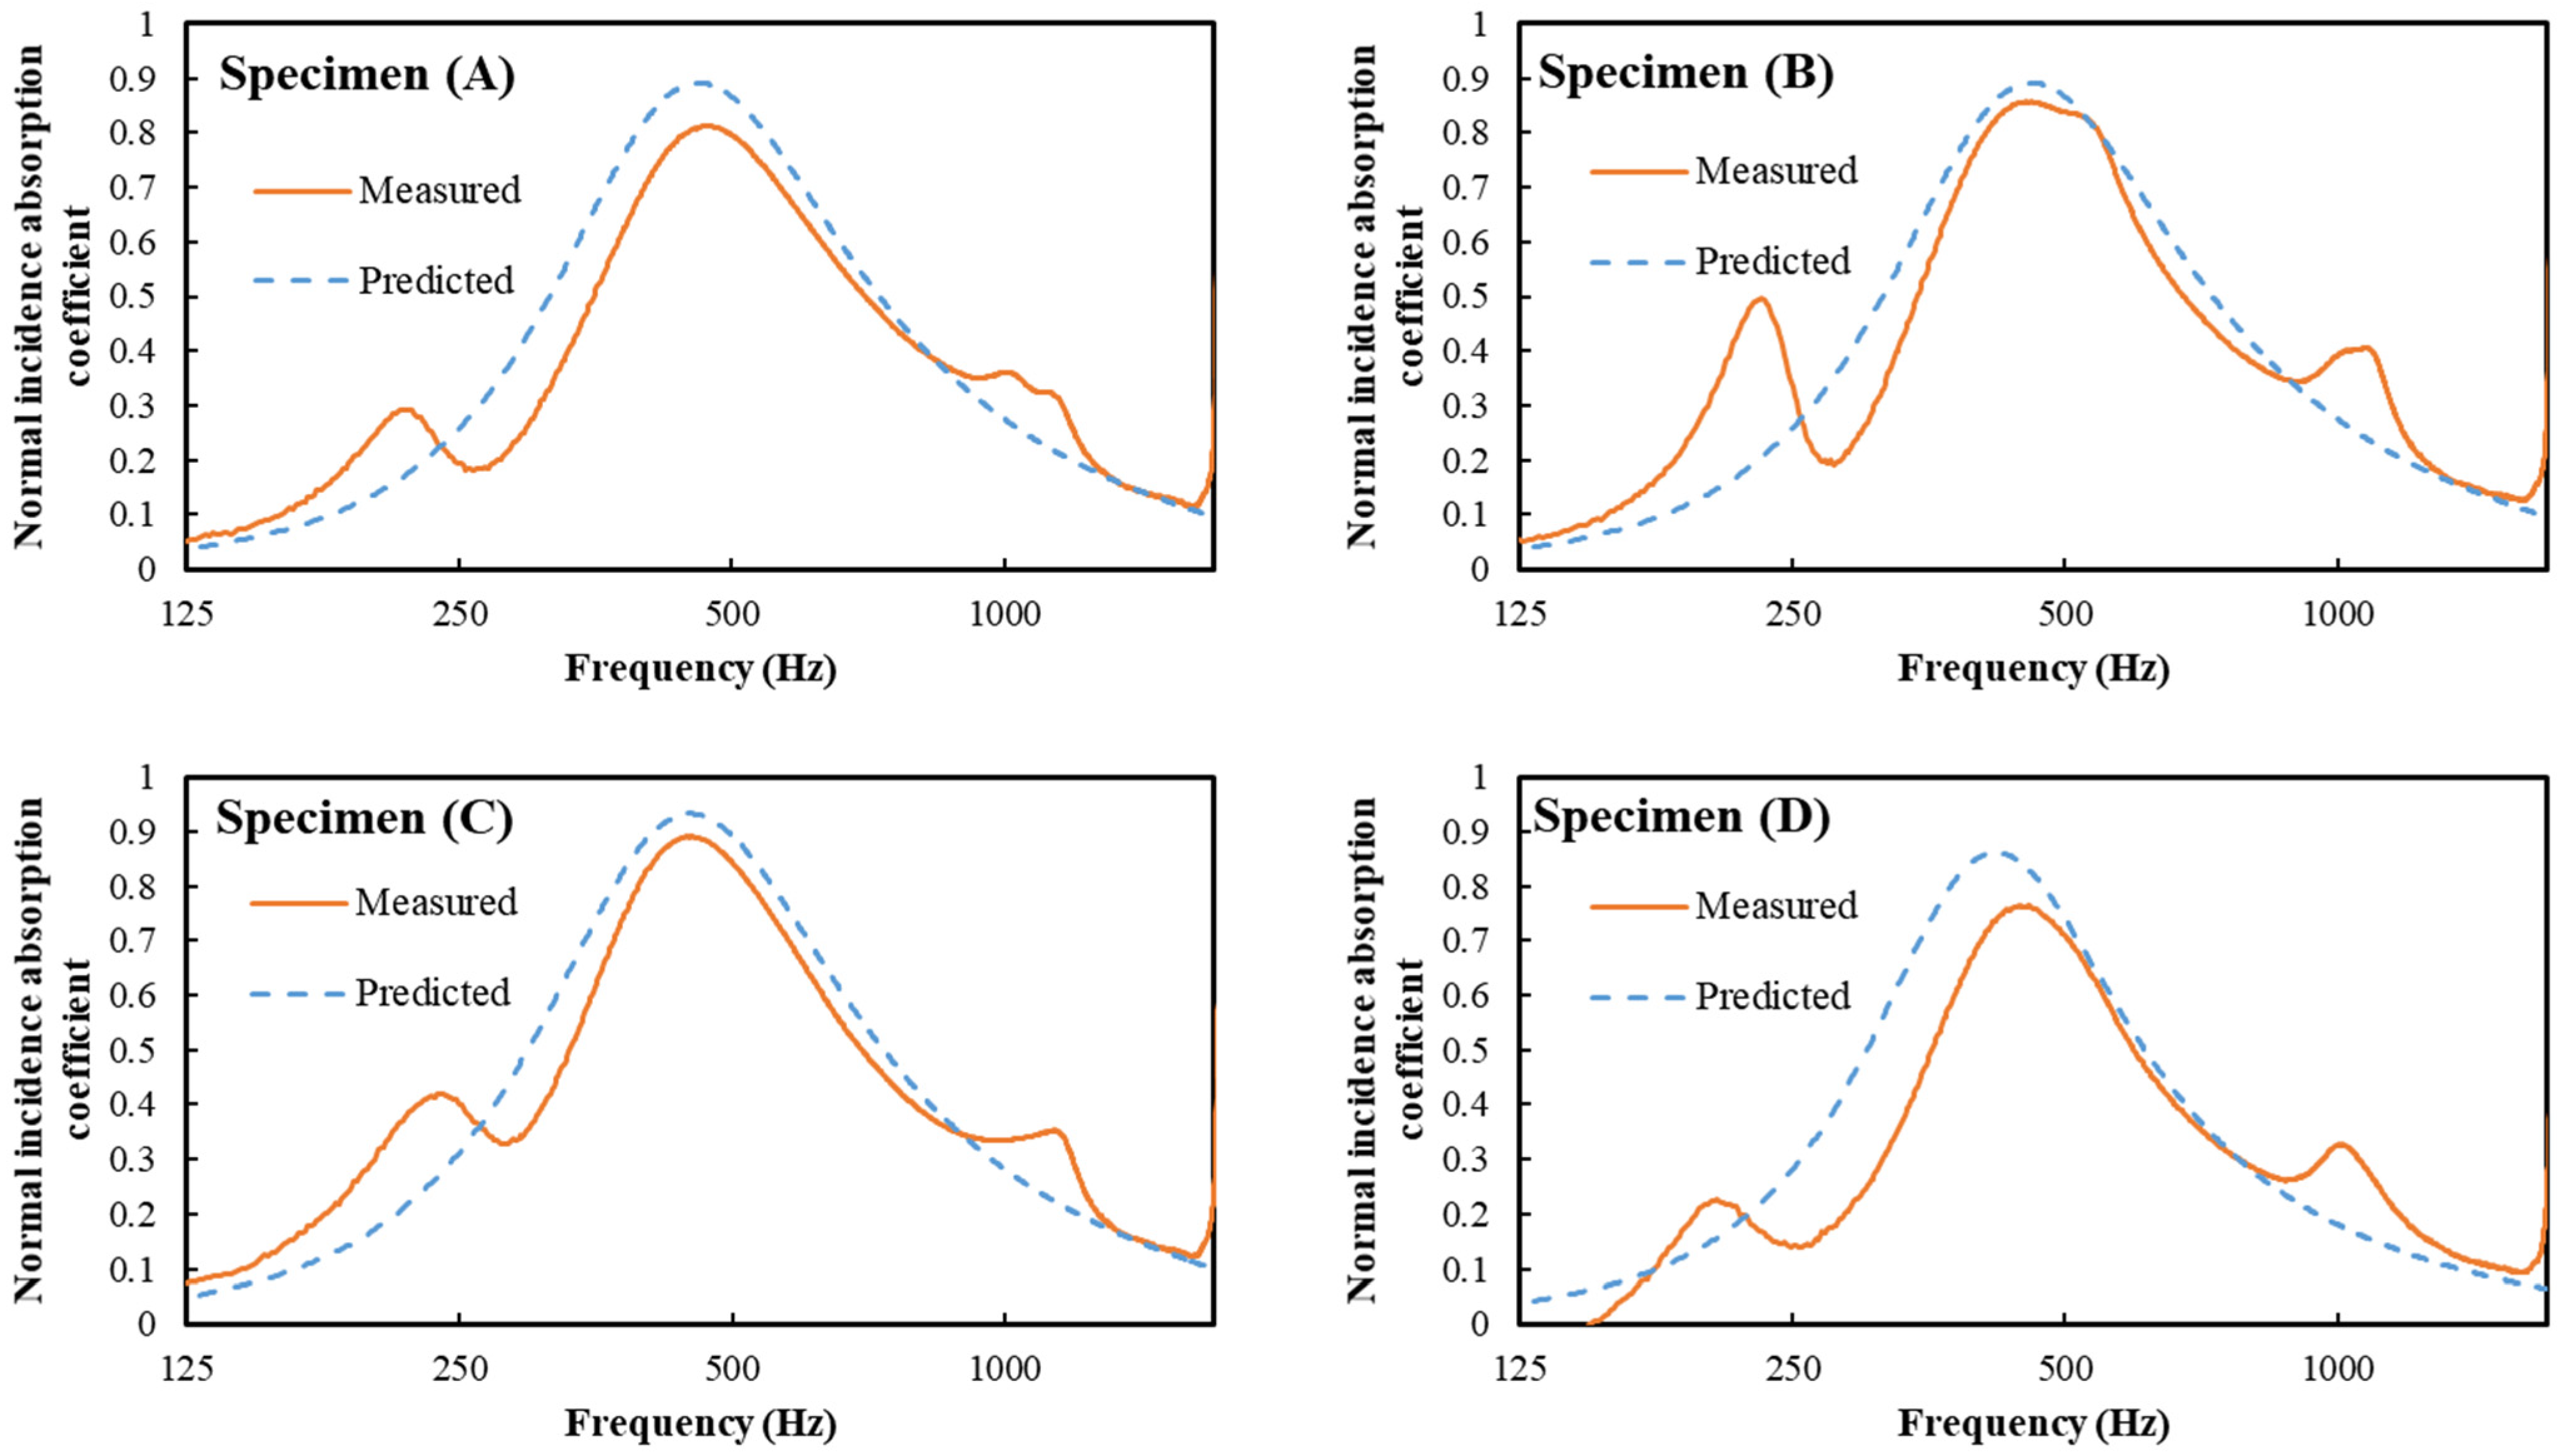
4. Results and Discussion

In this section, measured and predicted results are shown in comparison for discussing the applicability of the present method of the prediction given above. The measured and predicted results of normal incidence absorption coefficient are shown in comparison in Figure 9, Figure 10 and Figure 11. In the case of a cavity depth of 25 mm, the measured and predicted curves are in good agreement, except for specimen (D).
In the case of a cavity depth of 50 mm, the two curves are also in relatively good agreement, except for specimen (D). In some cases, there are small peaks in addition to the resonator peak. However, they do not affect the agreement around the main peak. In the case of a 75 mm cavity depth, all the measured results show three (in some cases four) peaks, i.e., the one that should be the resonator peak typical to MPPs is at the middle frequency, and two or three additional peaks are observed in several cases at higher and lower frequencies. Regarding these additional peaks, they appear at almost the same frequencies in all cases, i.e., they do not move when the cavity depth is changed. It may, therefore, be considered that this is an effect of the natural vibration of the sample plate, since they moved a little when the cavity depth was changed. We confirmed that the natural frequencies of 100 mm square aluminum plate (simple support case) are 248 Hz for (1,1) mode, and 1240 Hz for (1,3) and (3,1) modes (degenerated). Therefore, the peaks at around 200–250 Hz and 1200 Hz are considered to be caused by the natural vibration of the sample plate. In some cases, a sharp peak at around 1700 Hz is found, which can also be attributed to the natural vibration of the sample plate, i.e., (2,3) and (3,2) modes (degenerated) at 1612 Hz.
On the other hand, the two curves agree to some extent around the middle frequency peak, except for specimen (D). In the case of specimen (D), a much larger discrepancy is observed at whole frequency ranges: The shape of the curve of the absorption coefficient is different, even around the peak. Therefore, it is concluded that the measured curve does not agree with the predicted curve well when the air cavity is deep. This discrepancy could be considered as follows: The plane wave in the back cavity, which is used in the theoretical calculation, may not work well due to the stronger heterogeneity of the sample.
Next, in order to discuss the effect of the arrangement of holes, the results of specimens (A) and (B) are examined in detail. These two specimens consist of the same combination of holes, while their arrangements of holes differ. This difference can be interpreted as follows: Specimen (A) is an MPP in which holes of two different diameters are arranged alternately row by row, whereas specimen (B) is an MPP in which the holes are arranged separately on the left and right sides. In these cases, the predicted value naturally becomes the same, though the measured values are different. Comparing them, a larger discrepancy between the measured and predicted results is observed for specimen (B). This difference in arrangement causes the difference in acoustic properties between these specimens. This may be caused by the change in the sound field in the impedance tube: In the case of specimen (B), the plane wave in the tube might be distorted by the asymmetry of the specimen.
On the other hand, the largest discrepancy is observed in the case of specimen (D), which has different numbers of holes of different diameters and therefore has the largest heterogeneity in the arrangement of holes over the specimen surface. The above results suggest that the larger heterogeneity in the arrangement of holes over the specimen surface results in a larger discrepancy between the measured and the predicted absorption characteristics.
For reference, the error of the predicted value is numerically calculated and summarized. The RMS error of the predicted results over all frequencies is calculated by the following equation and shown in Table 2:
RMS   error   = 1 n i = 1 n ( α pre α mea ) 2
where αpre is the predicted absorption coefficient, αmea is the measured absorption coefficient, and n is the number of measured data points. In order to confirm that these error values are comparable with the error of the theoretical values calculated by Guo’s theory in the case of a homogeneous MPP, the RMS error of the theoretical value for a homogeneous MPP is also calculated and shown. The homogeneous MPP is made of an aluminum plate perforated by micro-drilling in the same manufacturer. Its parameters are shown in Table 3. The measurements were conducted in the same way as shown in Section 2.
In most cases, RMS errors of heterogeneous MPP specimens are almost the same range as the homogeneous cases. However, RMS errors in the case of specimen (D) are the largest among the four heterogeneous specimens in all air-cavity depth cases, and much larger than those in the homogeneous MPP case. In a comparison of specimens (A) and (B), larger error values appear for specimen (B). In addition, larger errors tend to appear when the air cavity is deep, while no such tendency is recognized in the homogeneous MPP case. These tendencies are observed in Figure 9, Figure 10 and Figure 11.
Regarding the shifts of the peak frequencies, the relative error is calculated as follows:
| f pre f mea | / f mea × 100   ( % )
where fpre and fmea are the peak frequencies of the predicted and measured values. For specimens (A), (B), and (C), the value is around 5.18%, and there was no clear tendency. This range of relative error is similar to the homogeneous case (5.06% at maximum). However, for specimen (D), the error was larger than 5% and 8.1% maximum. Thus, for the prediction of the peak frequency, the largest error was also found in the case of specimen (D).

5. Conclusions

In this paper, heterogeneous MPPs with some different hole diameters were produced. Those absorption characteristics, with a back-air cavity and a rigid wall, measured in the impedance tube were compared with those predicted by the proposed method.
We found that the present prediction method is in relatively good agreement with the measured values, except for some cases where the air cavity is deep or the specimen has relatively large heterogeneity. Therefore, it is possible to predict the absorption properties of heterogeneous MPPs with different hole diameters using the proposed method. The large discrepancy in the absorption characteristics in the case of a deep air cavity can be attributed to the differences in the sound field inside the air cavity due to the heterogeneity of the material. Therefore, the present method gives a more appropriate prediction of the normal incidence sound absorption coefficient by the acoustic tube method when the air back cavity is relatively small. However, the method may not be applicable when the heterogeneity in the arrangement of holes over the specimen surface is too large. Examining the applicability of this method by experiments using additional specimens with other combinations of holes and additional cases of air-cavity depth will be a matter of future study.

Author Contributions

Conceptualization, M.K. and K.S.; methodology, M.K.; formal analysis, M.K.; investigation, M.K. and T.O.; data curation, M.K.; writing—original draft preparation, M.K.; writing—review and editing, K.S. and T.O.; supervision, K.S. and T.O.; project administration, K.S. All authors have read and agreed to the published version of the manuscript.

Funding

This research received no external funding.

Institutional Review Board Statement

Not applicable.

Informed Consent Statement

Not applicable.

Data Availability Statement

The data presented in this study are available on request from the corresponding author.

Acknowledgments

The authors are indebted to Shigeyuki Kido and Daichi Yamaguchi from NC Industry, Co. Ltd. for their cooperation in the trial production in the specimens used in the experiments.

Conflicts of Interest

The authors declare no conflict of interest.

Appendix A. Outline of Guo’s Theory

In this work, Guo’s model was used for the calculation of the acoustic impedance of an MPP. Guo’s model [10] is introduced and summarized in Bolton and Kim [23], Herdtle et al. [24], and Okuzono et al. [25]. Here, only the outline of Guo’s model is given for the readers’ convenience.
The surface impedance of a single-layer MPP absorber with an air-back cavity and a rigid back wall, Zsurf, is written by the following equation, with the transmission impedance of the MPP, Zt, and the backing impedance of the rigid-backed air layer:
Z s u r f = Z t j ρ 0 c 0 cot ( k 0 L )
where j, ρ0, c0, k0, and L are the imaginary unit, air density (1.205 (kg/m3)), sound speed in air (m/s), wavenumber in air, and the depth of the air-back cavity (m), respectively.
Zt is expressed as follows:
Z t = j ω ρ e t ε + α 2 R s ε + j ω ρ 0 δ ε
where ω, t, ε, and δ are the angular frequency (rad/s), panel thickness (m), perforation ratio (-), and end correction factor, respectively. Note that when α = 2, Guo’s theory becomes the same as Maa’s theory in [2], which is widely used.
The first term of Equation (A2) signifies the effect of viscous energy loss inside the hole: Here, ρe is the effective density, which is expressed by the following equation in the case of a circular hole:
ρ e = ρ 0 / [ 1 2 s j J 1 ( s j ) J 0 ( s j ) ]
where J0 and J1 are Bessel functions of the first kind of zero-th and first orders, respectively. The parameter s is defined in the case of a circular hole:
s = r ω ρ 0 / η
where r is the radius (m) and η is the viscosity of the air (kg/m/s). In the case of a microperforation of arbitrary cross-sectional shape, ρe is given as follows:
ρ e = ρ 0 ( 1 + σ φ j ω ρ 0 G c ( s ) )
where σ is the flow resistivity (Pa·s/m2), which becomes σ = 7η/rp2 in the case of a square hole, with rp as the parameter defined by the perimeter of the cell l (m) and the cross-sectional area S (m2), which is the equivalent radius rp = 2S/l (m). Gc (s) is given as follows:
G c ( s ) = s 4 j J 1 ( s j ) J 0 ( s j ) / [ 1 2 s j J 1 ( s j ) J 0 ( s j ) ]
with
s = c 8 ω ρ 0 / σ ϕ
The second term in Equation (A2) signifies the end correction due to the surface admittance, and the parameter Rs is given by the following equation:
R s = 2 η ρ 0 ω / 2
The coefficient α in the second term of Equation (A2) is dependent on the shape of the edge of the perforation. This means that Guo’s model depends on the sharpness of the edge: When the cross section of the hole edge is rounded, it is 2.0, if it is sharp, the value is 4.0. The third term is the end correction, expressed by δ, which is for a circular hole δ = δc as follows:
δ c = 0.85 d ( 1 1.13 ε 1 / 2 0.09 ε + 0.27 ε 3 / 2 )

References

  1. Maa, D.Y. Theory and design of microperforated panel sound-absorbing constructions. Sci. Sin. 1975, 17, 55–71. [Google Scholar]
  2. Maa, D.Y. Microperforated-panel wideband absorbers. Noise Control Eng. J. 1987, 29, 77–84. [Google Scholar] [CrossRef]
  3. Maa, D.Y. Potential of microperforated panel absorber. J. Acoust. Soc. Am. 1998, 104, 2861–2866. [Google Scholar] [CrossRef]
  4. Kang, J.; Fuchs, H.V. Predicting absorption of open weave textiles and micro-perforated membranes backed by an air space. J. Sound. Vib. 1999, 220, 905–920. [Google Scholar] [CrossRef]
  5. Fuchs, H.V.; Zha, X.; Zhou, X.; Drotleff, H. Creating low-noise environments in communication rooms. Appl. Acoust. 2001, 62, 1375–1396. [Google Scholar] [CrossRef]
  6. Zha, X.; Fuchs, H.V.; Drotleff, H. Improving the acoustic working conditions for musicians in small spaces. Appl. Acoust. 2002, 63, 203–221. [Google Scholar] [CrossRef]
  7. Herrin, D.; Liu, J.; Seybert, A. Properties and applications of microperforated panel. Sound Vib. 2011, 45, 6–9. [Google Scholar]
  8. Herrin, D. A guide to the applications of microperforated panel absorbers. Sound Vib. 2017, 51, 12–18. [Google Scholar]
  9. Adams, T. Sound Materials: A Compendium of Sound Absorbing Materials for Architecture and Design; Frame Pub: Amsterdam, The Netherlands, 2017. [Google Scholar]
  10. Guo, Y.; Allam, S.; Abom, M. Micro-perforated plates for vehicle applications. In Proceedings of the Inter-Noise 2008, Shanghai, China, 26–29 October 2008. [Google Scholar]
  11. Sakagami, K.; Nagayama, Y.; Morimoto, M.; Yairi, M. Pilot study on wideband sound absorber obtained by combination of two different microperforated panel (MPP) absorbers. Acoust. Sci. Technol. 2009, 30, 154–156. [Google Scholar] [CrossRef] [Green Version]
  12. Yairi, M.; Sakagami, K.; Takebayashi, K.; Morimoto, M. Excess sound absorption at normal incidence by two microperforated panel absorbers with different impedance. Acoust. Sci. Technol. 2011, 32, 194–200. [Google Scholar] [CrossRef] [Green Version]
  13. Mosa, A.I.; Putra, A.; Ramlan, R.; Esraa, A. Wideband sound absorption of a double-layer microperforated panel with in-homogeneous perforation. Appl. Acoust. 2020, 161, 107167. [Google Scholar] [CrossRef]
  14. Carbajo, J.; Ramis, l.; Godinho, L.; Amado-Mendes, P. Assessment of methods to study the acoustic properties of heterogene-ous perforated panel absorbers. Appl. Acoust. 2018, 133, 1–7. [Google Scholar] [CrossRef]
  15. Pan, L.; Martellotta, F. A parametric study of the acoustic performance of resonant absorbers made of micro-perforated membranes and perforated panels. Appl. Sci. 2020, 10, 1581. [Google Scholar] [CrossRef] [Green Version]
  16. Sakagami, K.; Kusaka, M.; Okuzono, T.; Nakanishi, S. The effect of deviation due to the manufacturing accuracy in the pa-rameters of an MPP on its acoustic properties: Trial production of MPPs of different hole shapes using 3D printing. Acoustics 2020, 2, 605–616. [Google Scholar] [CrossRef]
  17. Liu, Z.; Zhan, J.; Fard, M.; Davy, J.L. Acoustic properties of multilayer sound absorbers with a 3D printed micro-perforated panel. Appl. Acoust. 2017, 121, 25–32. [Google Scholar] [CrossRef]
  18. Boulvert, J.; Costa-Baptista, J.; Cavalier, T.; Perna, M.; Fosting, E.R.; Romero-Garcia, V.; Ross, A.; Mardjono, J.; Groby, J.-P. Acoustic modelling of micro-lattice obtained by additive manufacturing. Appl. Acoust. 2020, 164, 107244. [Google Scholar] [CrossRef] [Green Version]
  19. Nakanishi, S. Sound absorption of Helmholtz resonator included a winding built-in neck extension. In Proceedings of the Inter-Noise 2016, Hamburg, Germany, 21–24 August 2016. [Google Scholar]
  20. Sakagami, K.; Kusaka, M.; Okuzono, T.; Kido, S.; Yamaguchi, D. Application of Transparent Microperforated Panel to Acrylic Partitions for Desktop Use: A Case Study by Prototyping. 2021, 1. UCL Open: Environment Preprint. Available online: https://ucl.scienceopen.com/document?vid=42d011c5-c09b-41ac-a124-8c5a8803cc44 (accessed on 5 July 2021).
  21. JIS A 1405-2: 2007. Acoustics—Determination of Sound Absorption Coefficient and Impedance in Impedance Tubes—Part 2: Transfer-Function Method; JIS: Tokyo, Japan, 2007. [Google Scholar]
  22. ISO 10534-2:1998. Acoustics—Determination of Sound Absorption Coefficient and Impedance in Impedance Tubes—Part 2: Transfer-Function Method; ISO: Geneva, Switzerland, 1998. [Google Scholar]
  23. Bolton, J.S.; Kim, N. Use of CFD to calculate the dynamic resistive end correction for microperforated materials with tapered holes. Acoust. Aust. 2010, 38, 134–144. [Google Scholar]
  24. Herdtle, T.; Bolton, J.S.; Kim, N.; Alexander, J.H.; Gardes, R.W. Transfer impedance of microperforated materials with tapered holes. J. Acoust. Soc. Am. 2013, 134, 4752–4762. [Google Scholar] [CrossRef]
  25. Okuzono, T.; Nitta, T.; Sakagami, K. Note on microperforated panel model using equivalent-fluid-based absorption elements. Acoust. Sci. Technol. 2019, 40, 221–224. [Google Scholar] [CrossRef] [Green Version]
Figure 1. (a) Photograph of specimen (A); (b) profile sketch of specimen (A).
Acoustics 03 00031 g001
Figure 2. (a) Photograph of specimen (B); (b) profile sketch of specimen (B).
Acoustics 03 00031 g002
Figure 3. (a) Photograph of specimen (C); (b) profile sketch of specimen (C).
Acoustics 03 00031 g003
Figure 4. (a) Photograph of specimen (D); (b) profile sketch of specimen (D).
Acoustics 03 00031 g004
Figure 5. A photograph of the measurement setup using an impedance tube.
Acoustics 03 00031 g005
Figure 6. A diagram of the measurement equipment. The distance between the two microphones was 50 mm.
Acoustics 03 00031 g006
Figure 7. Diagrams of the hypothetical MPPs. The upper MPP is the original MPP, and the lower MPPs are the hypothetical MPPs, which have holes of each diameter only in surface area S.
Acoustics 03 00031 g007
Figure 8. A diagram of the calculation procedure for the impedance of a hypothetical MPP. The area surrounded by the dashed line is the part with holes, and the hatched area is the part without holes, which is acoustically rigid.
Acoustics 03 00031 g008
Figure 9. Measured results for the normal incidence absorption coefficient and their comparison with predicted values when the air cavity is 25 mm. Solid line: Measured; dashed line: Predicted. The parameters of Specimens (AD) are detailed in Table 1 and Figure 1, Figure 2, Figure 3 and Figure 4.
Acoustics 03 00031 g009
Figure 10. Measured results for the normal incidence absorption coefficient and their comparison with predicted values when the air cavity is 50 mm. Solid line: Measured; dashed line: Predicted. The parameters of Specimens (AD) are detailed in Table 1 and Figure 1, Figure 2, Figure 3 and Figure 4.
Acoustics 03 00031 g010
Figure 11. Measured results for the normal incidence absorption coefficient and their comparison with predicted values when the air cavity is 75 mm. Solid line: Measured; dashed line: Predicted. The parameters of Specimens (AD) are detailed in Table 1 and Figure 1, Figure 2, Figure 3 and Figure 4.
Acoustics 03 00031 g011
Table 1. Parameters of the specimens. Note that the perforation ratios denote average values.
SpecimensParameters
Hole Diameters (mm)Perforation Ratio (%)Thickness (mm)
Specimen (A)0.3/0.90.7530.5
Specimen (B)0.3/0.90.7530.5
Specimen (C)0.3/0.5/0.7/0.90.6770.5
Specimen (D)0.3/0.5/0.7/0.9/1.10.6240.5
Table 2. RMS error in all conditions.
Thickness of Air CavityMPP Specimens
Specimen (A)Specimen (B)Specimen (C)Specimen (D)Homogeneous MPP
25 mm0.039960.072540.034920.130200.05439
50 mm0.027100.091560.026320.095700.04160
75 mm0.069450.082510.067050.092180.03386
Table 3. Parameters of the homogeneous MPP used for reference.
Parameters
Hole Diameter (mm)Perforation Ratio (%)Thickness (mm)
Homogeneous MPP0.50.7850.5
Publisher’s Note: MDPI stays neutral with regard to jurisdictional claims in published maps and institutional affiliations.

