Mobility Management-Based Autonomous Energy-Aware Framework Using Machine Learning Approach in Dense Mobile Networks

 ,
,  , ,
, ,  , and
, and
Abstract
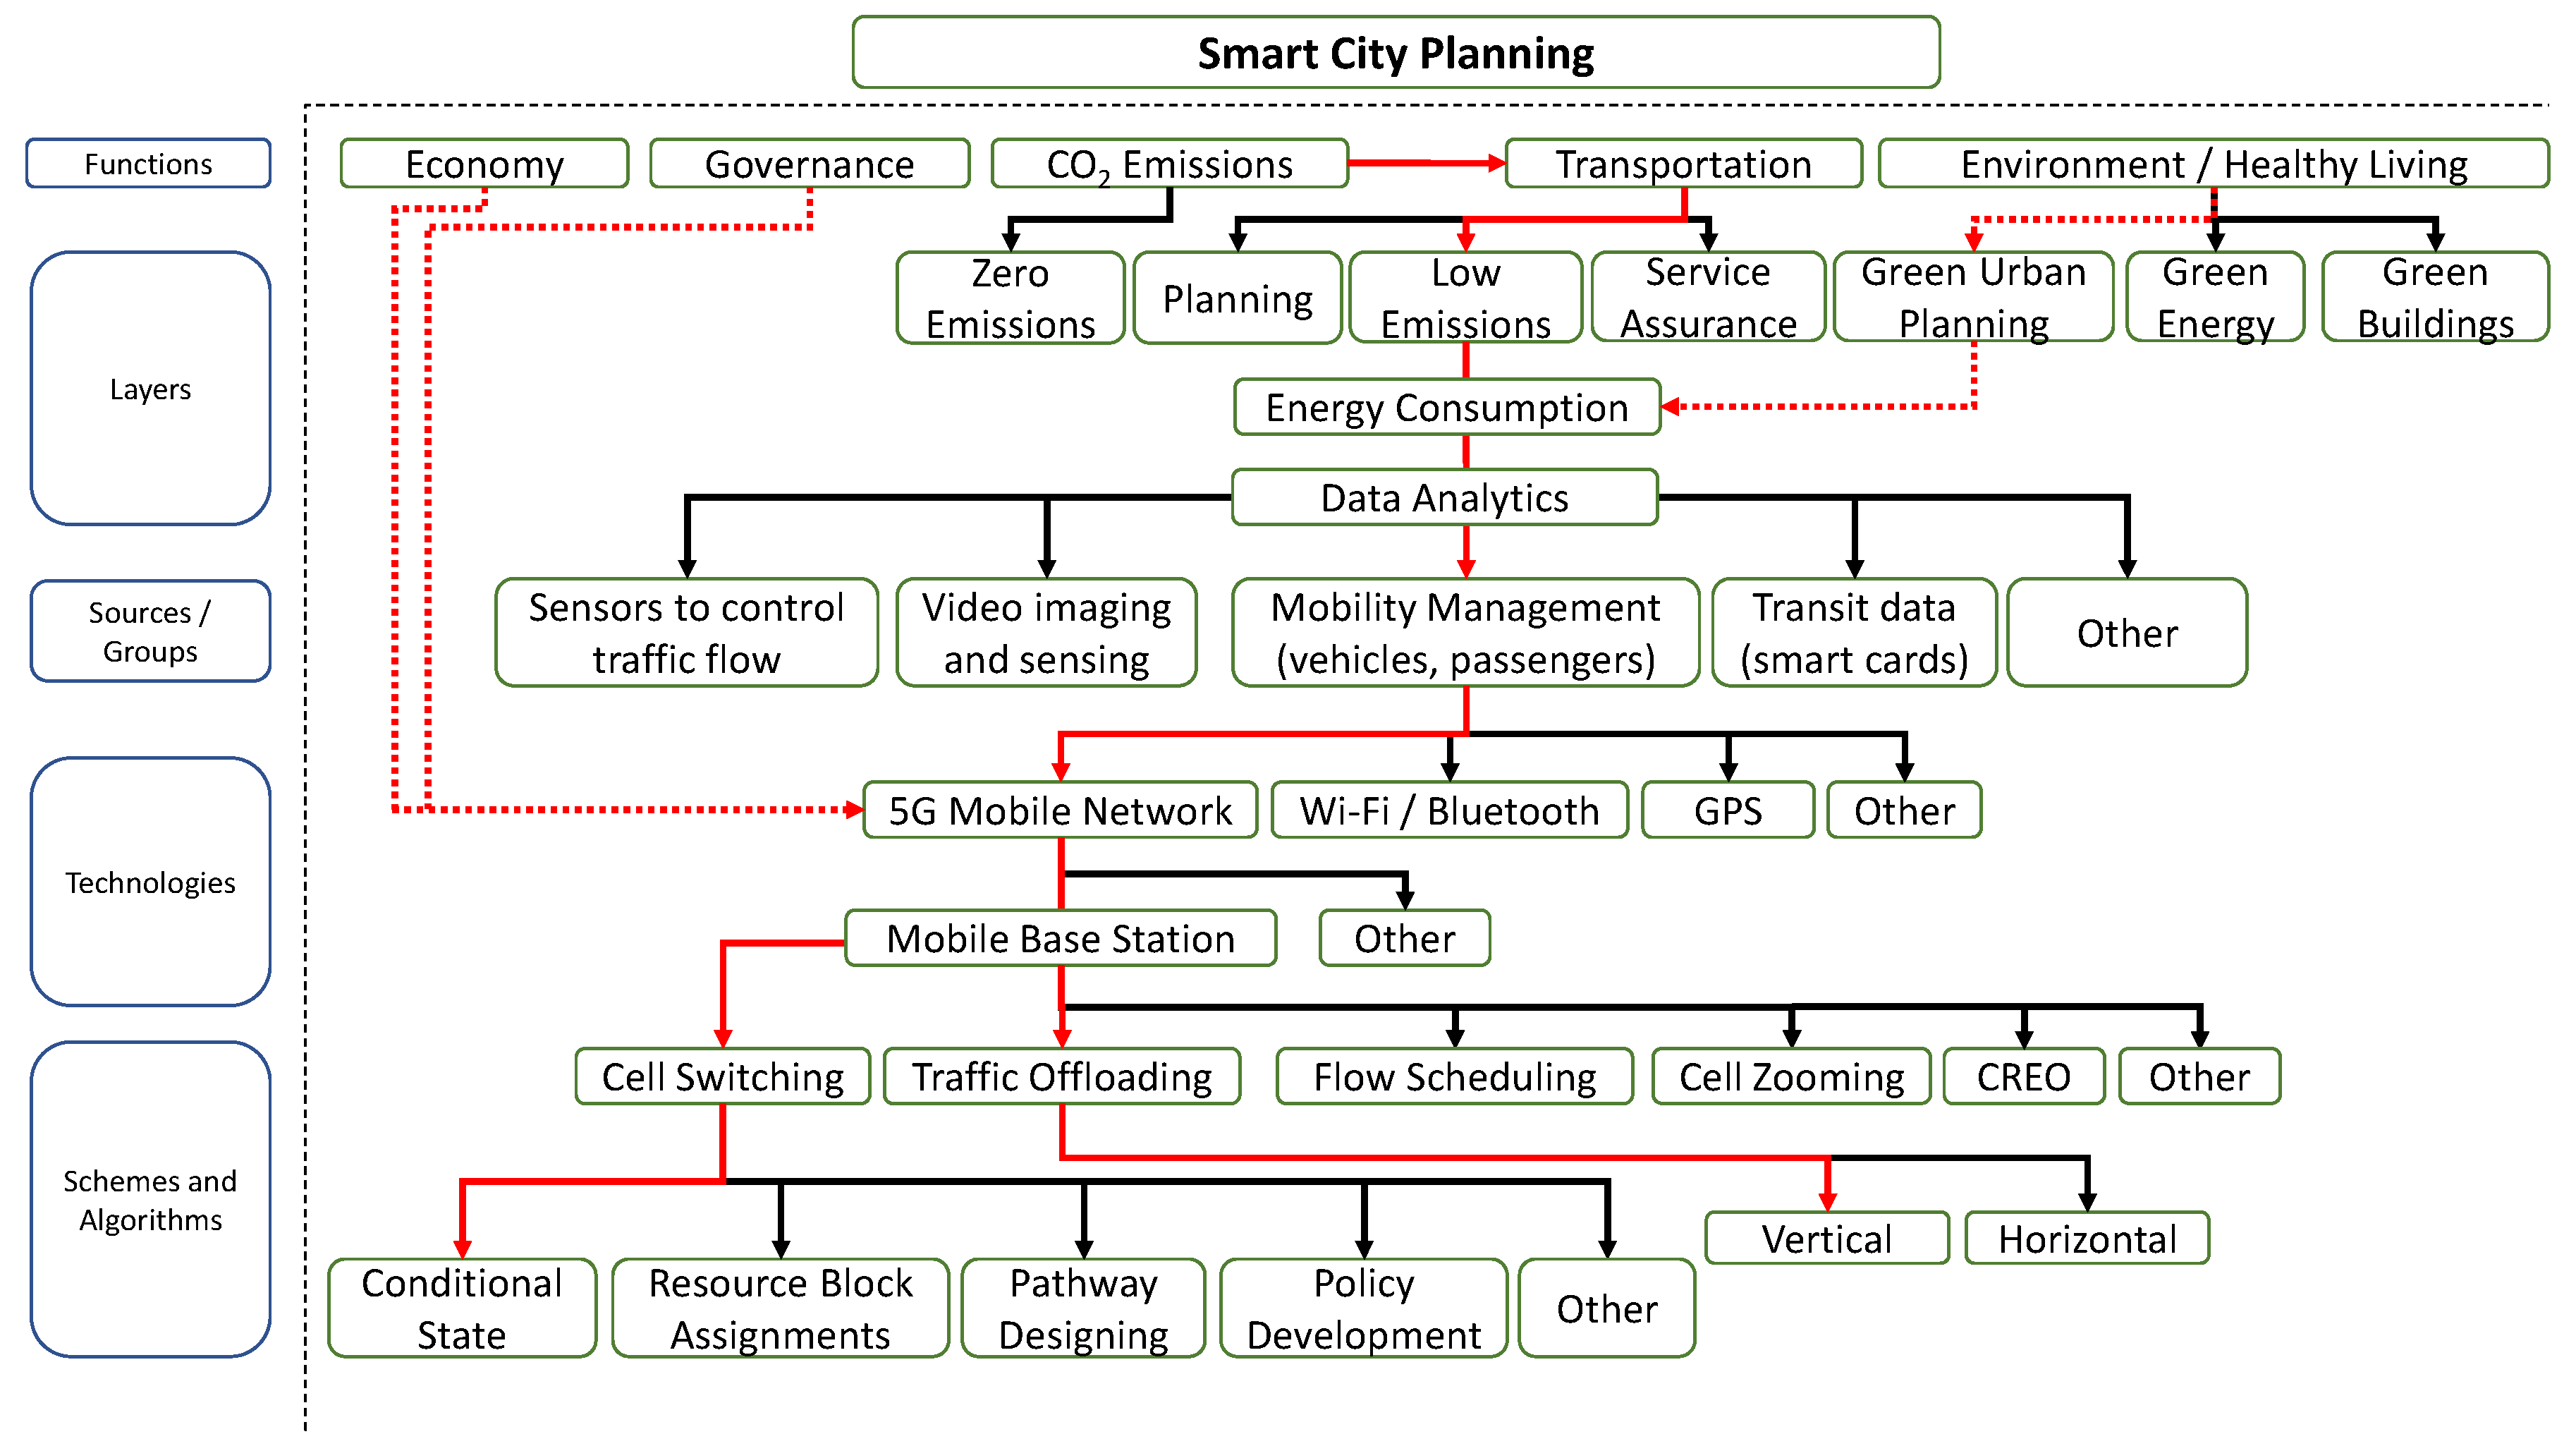
:1. Introduction
1.1. Related Work
- Sensitive mode of operation: Typical ES SON algorithms are susceptible to reaction that achieves ES at the expense of QoS after an event has been completed. Given the well-populated city dynamics with bus passenger ridership in relation to deployed cellular environment, by the time SCs overloading or underloading is detected and a realistic algorithm is opted to solve the known issue, the conditions may already change [7]. In the 5G environment, this problem can further escalate when disparate passenger ridership and plethora of cell types responsible to support smart city eco-system are not in harmony.
- SCs wake up time: Sleeping SCs require a specific amount of time to wake up [27]. Any passenger entering a SC footprint that is still in a sleeping state would add high latency experience. Thus, there is a need to modernise conventional paradigms pro-actively to maintain low latency requirements of 5G in a more agile fashion, i.e., pro-active ES by passenger’s mobility management.
- User Association to sleeping SCs: A key challenge in the HetNet cell On–Off switching strategy is to establish user associations (bus passengers ridership association) to the correct serving SCs that are switched ON while passengers are within its coverage footprint [17], thus contributing to overhead challenges. Existing ES schemes have not apparently provided evidence to address this challenge where 5G QoS demands low-overhead, low-costs and highly efficient architectures.
- SON upright design: Conventional ES solutions when implemented together in a HetNet environment are susceptible to conflicts [5] that require intelligence to resolve. SON use-cases that are liable to be conflicted are: traffic offloading while SC switching [3,13] and prediction of passengers to neighbouring cells [6]. For the first conflict, Cell Individual Offsets (CIOs) along with transmission power settings play a major role, whereas a correct distancing metric for the classification of mobility predictions is used for the second one. Furthermore, traffic offloading through vertical, horizontal or both is an important method when BS transmit power is concerned [25]. In horizontal offloading, SCs have low transmit powers within the certain cell range to offload the traffic of neighbouring cells.Therefore, between SCs, horizontal offloading cannot always be realised. Consequently, vertical offloading often becomes the only choice for some SCs to go into sleep mode if its neighbouring SCs are not in the proximity.
1.2. Contributions Organisation
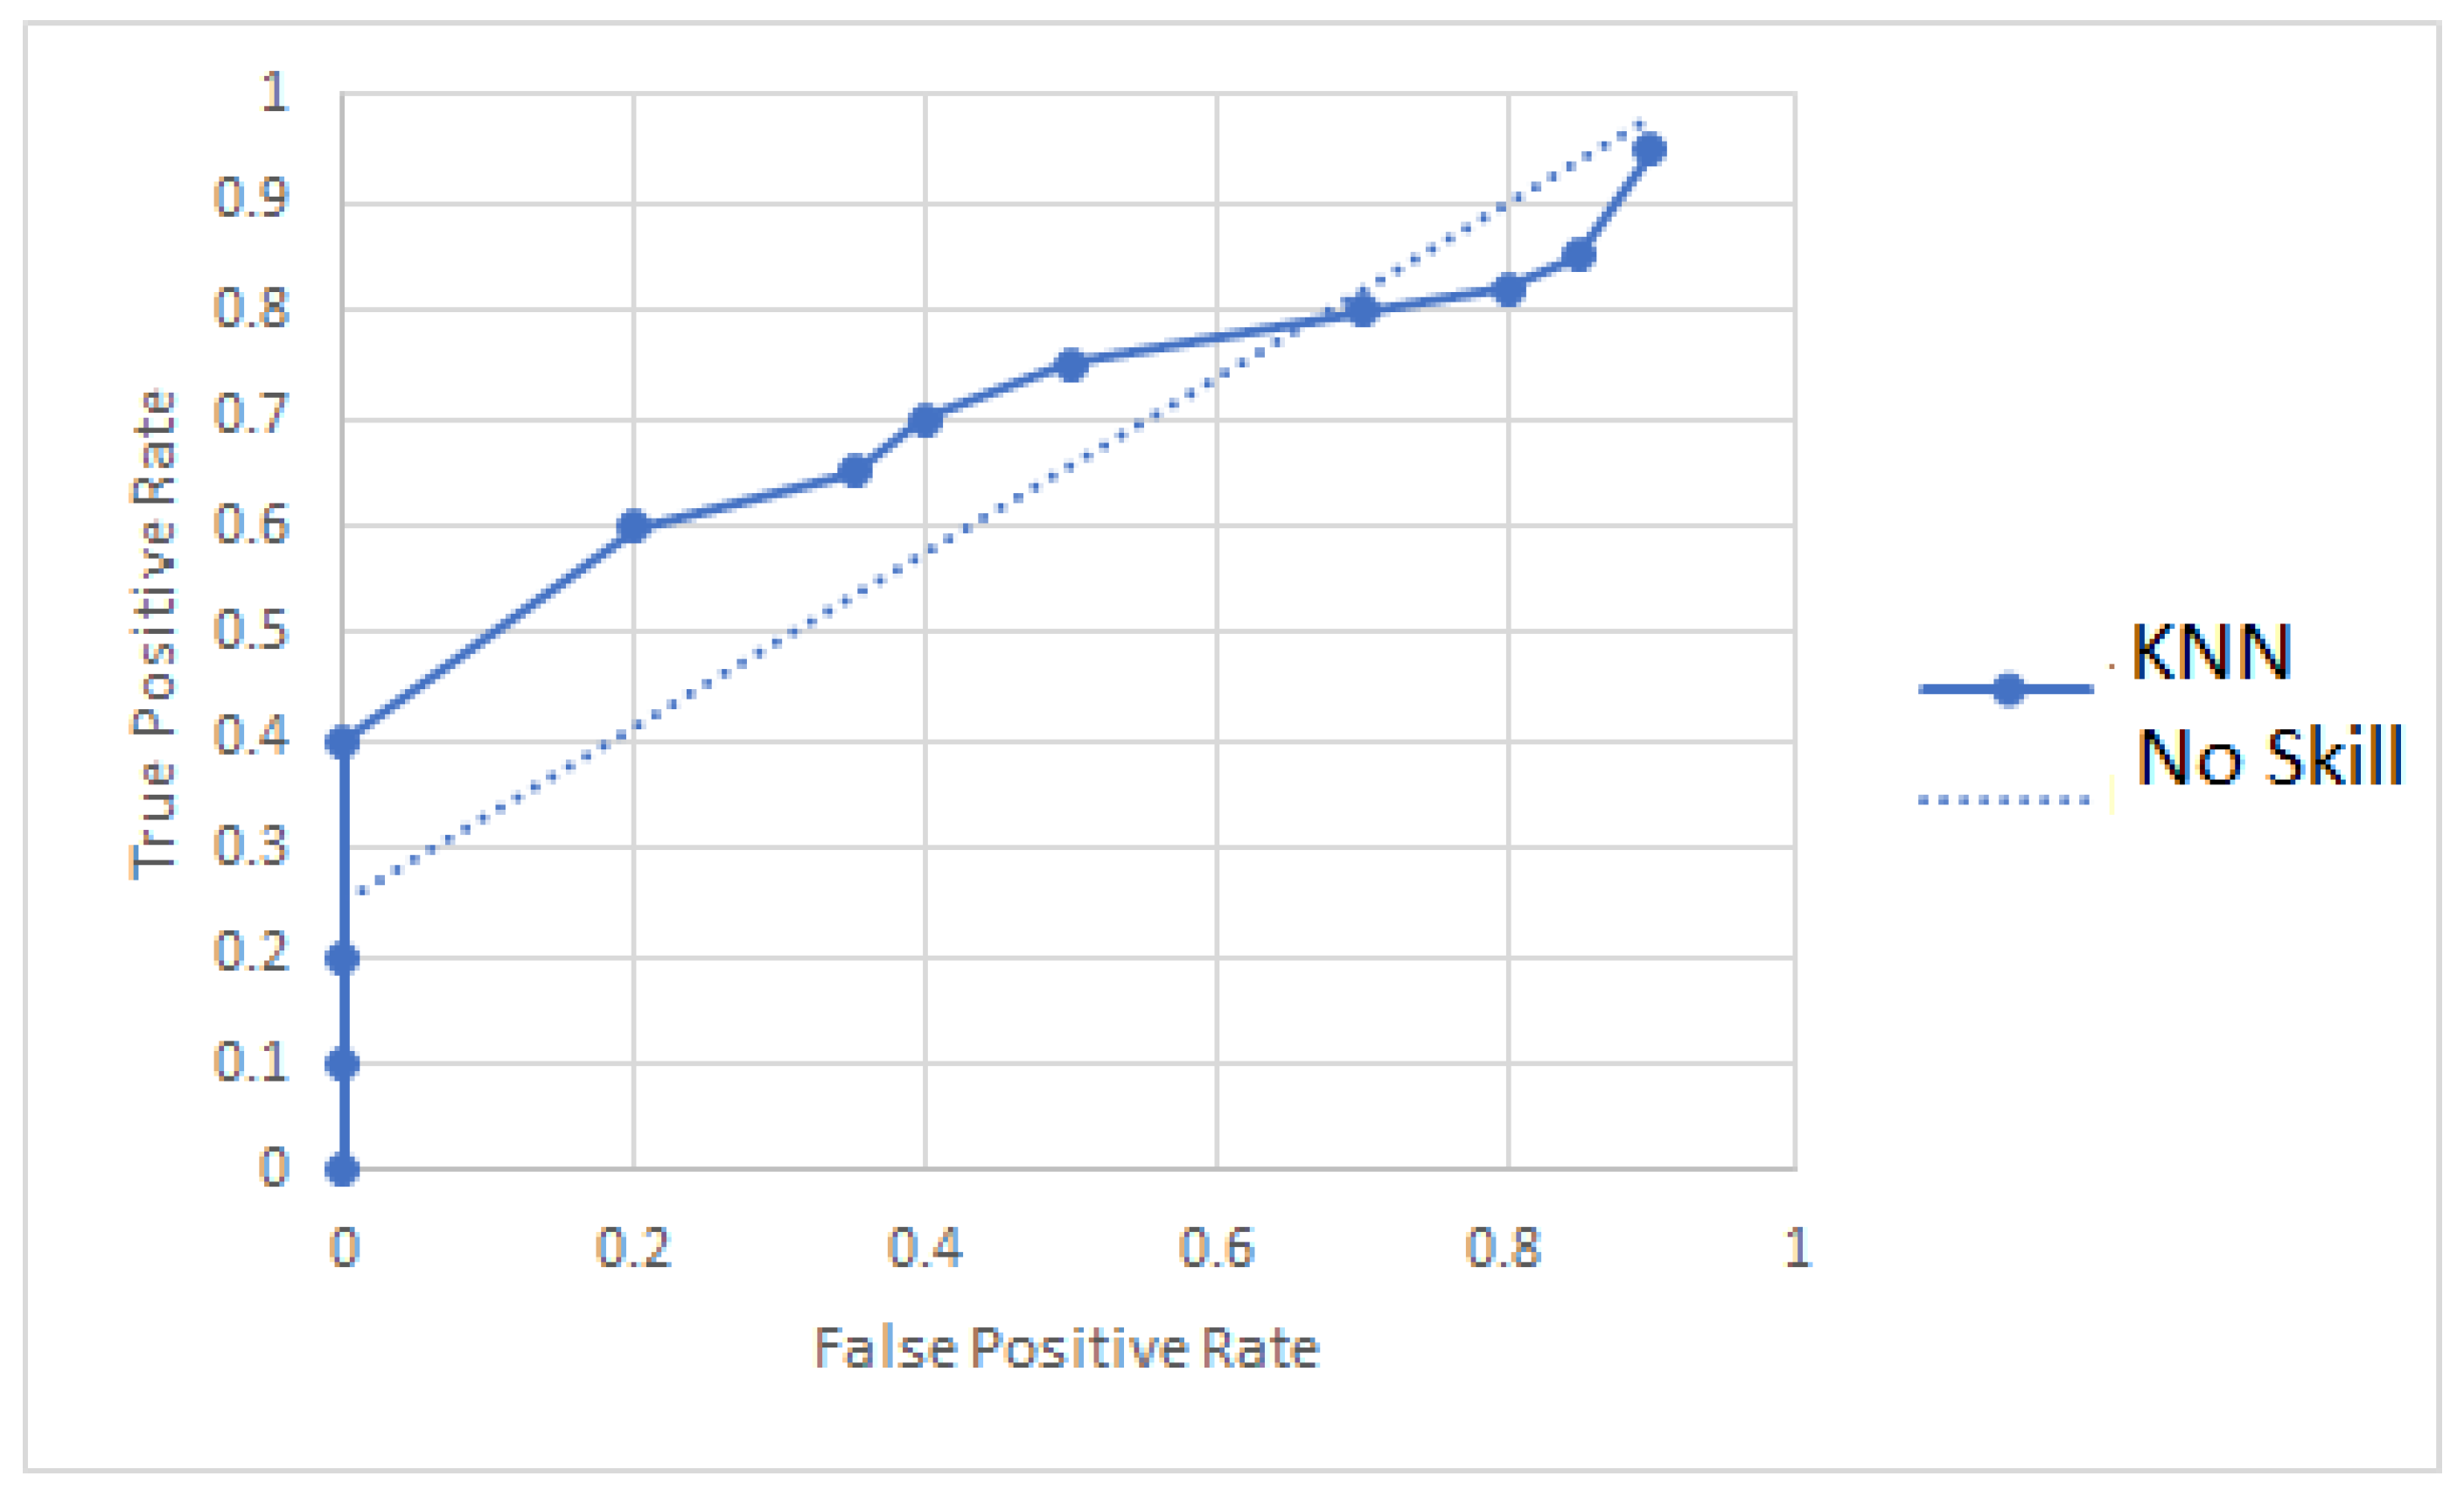
- As a building block of novel Energy-Aware Framework, we develop a spatiotemporal mobility prediction framework by analysing a statistical K-Nearest Neighbour (KNN) model which would modernise ES conventional limitations.
- A novel method of passengers future location estimation is proposed to map the next cell spatiotemporal Handover (HO) based on the idea of landmarks using multiple K values in KNN model and a detailed comparison.
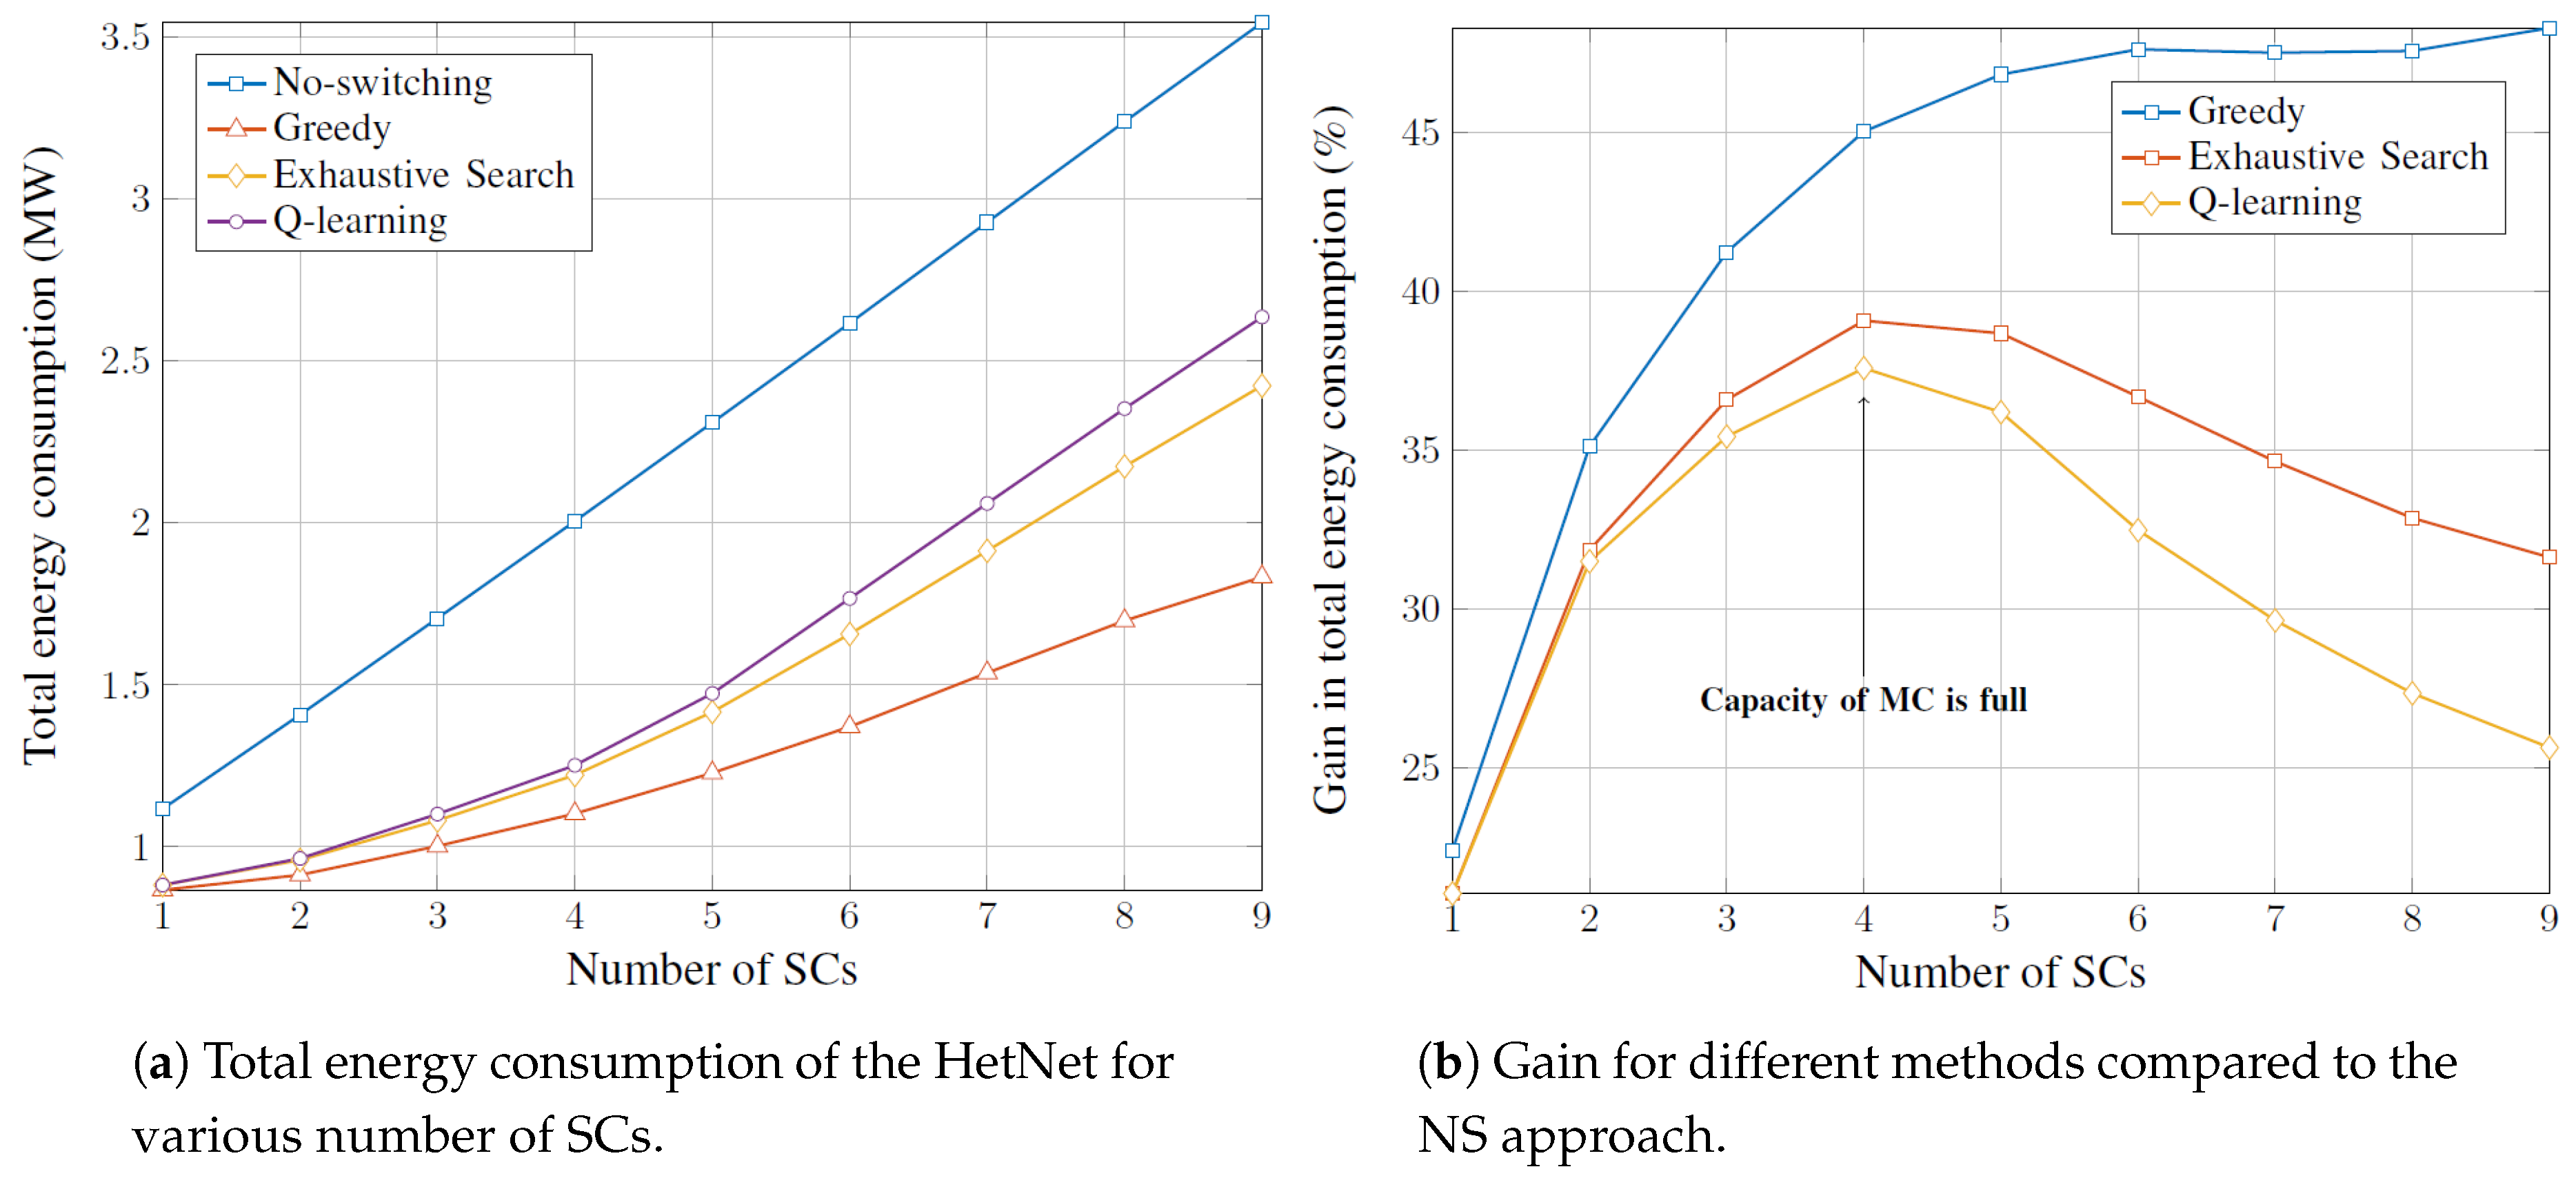
- Another novelty of this proposal is that, based on the future cell load information and CIOs as optimisation variables for load balancing among SCs, a proactive ES optimisation problem is formulated to reduce power and energy consumption by switching off lightly loaded, idle or underutilised HetNet SCs. Intelligence in load balancing would exploit specifically lightly loaded SCs to be switched off while satisfying QoS.
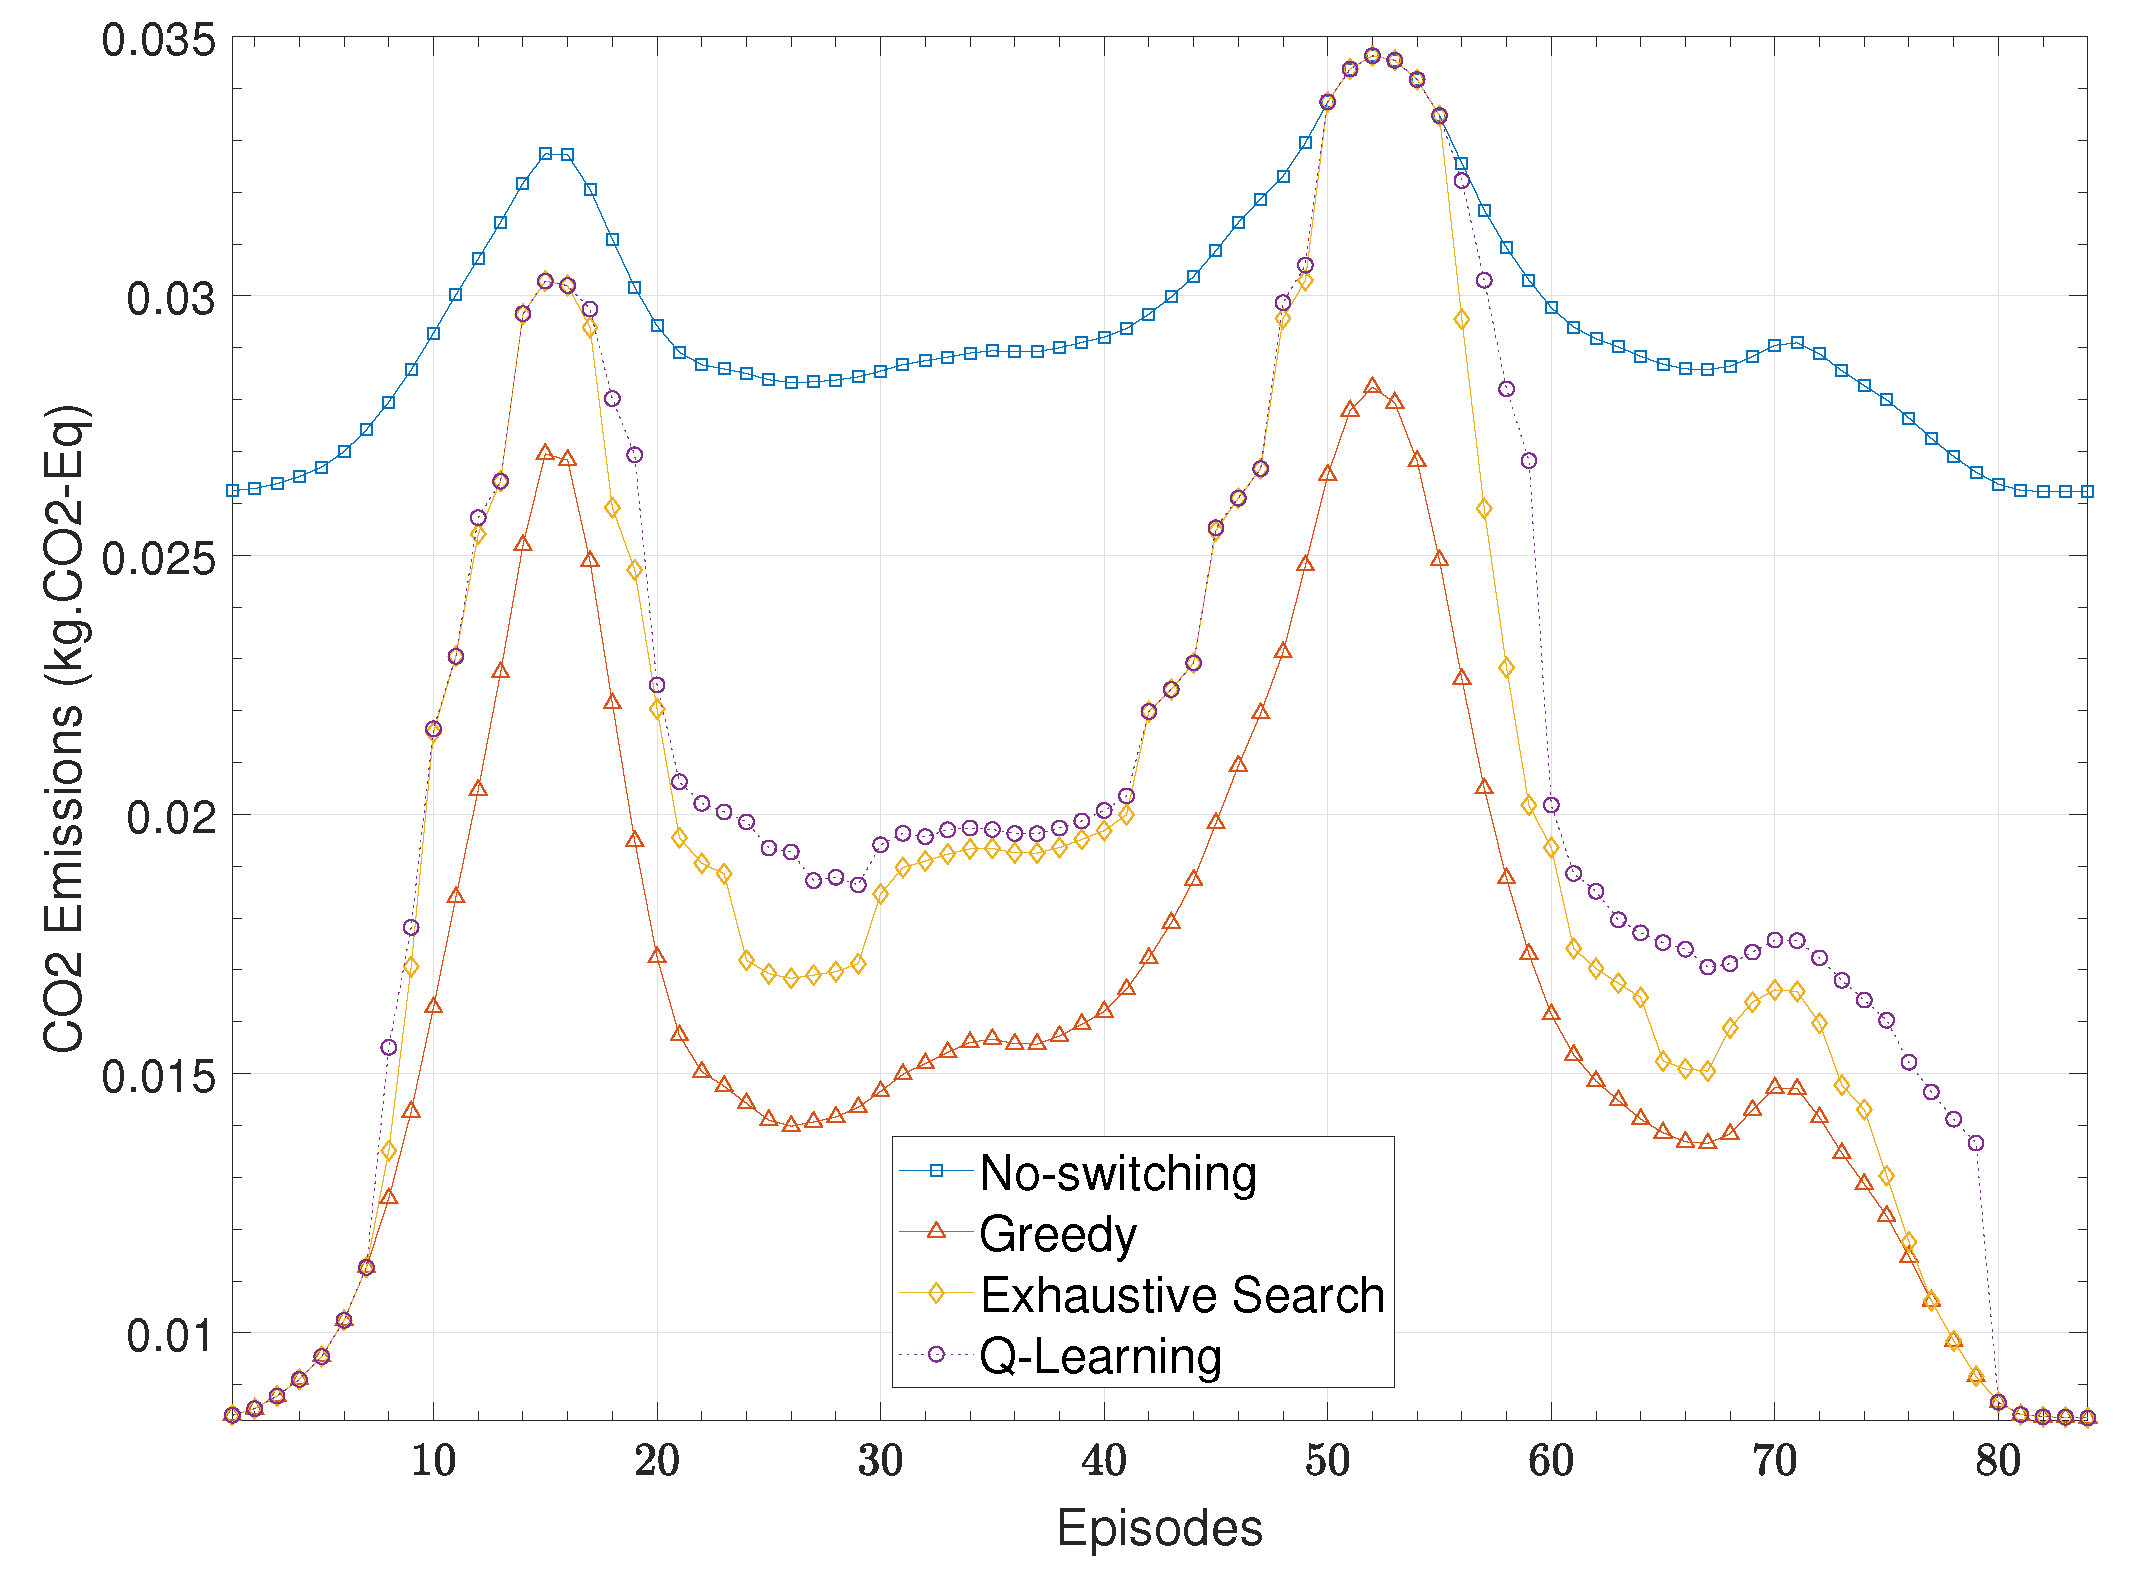
- Based on the information achieved from mobility management of passengers ridership and ES awareness, a novel scheme for CO2 reductions is also quantified.
2. System Model
- Statistical KNN-based Passengers Mobility Prediction
- Passengers Future Location Estimation
- Proactive-Energy Saving Optimisation based on CO2 Reduction
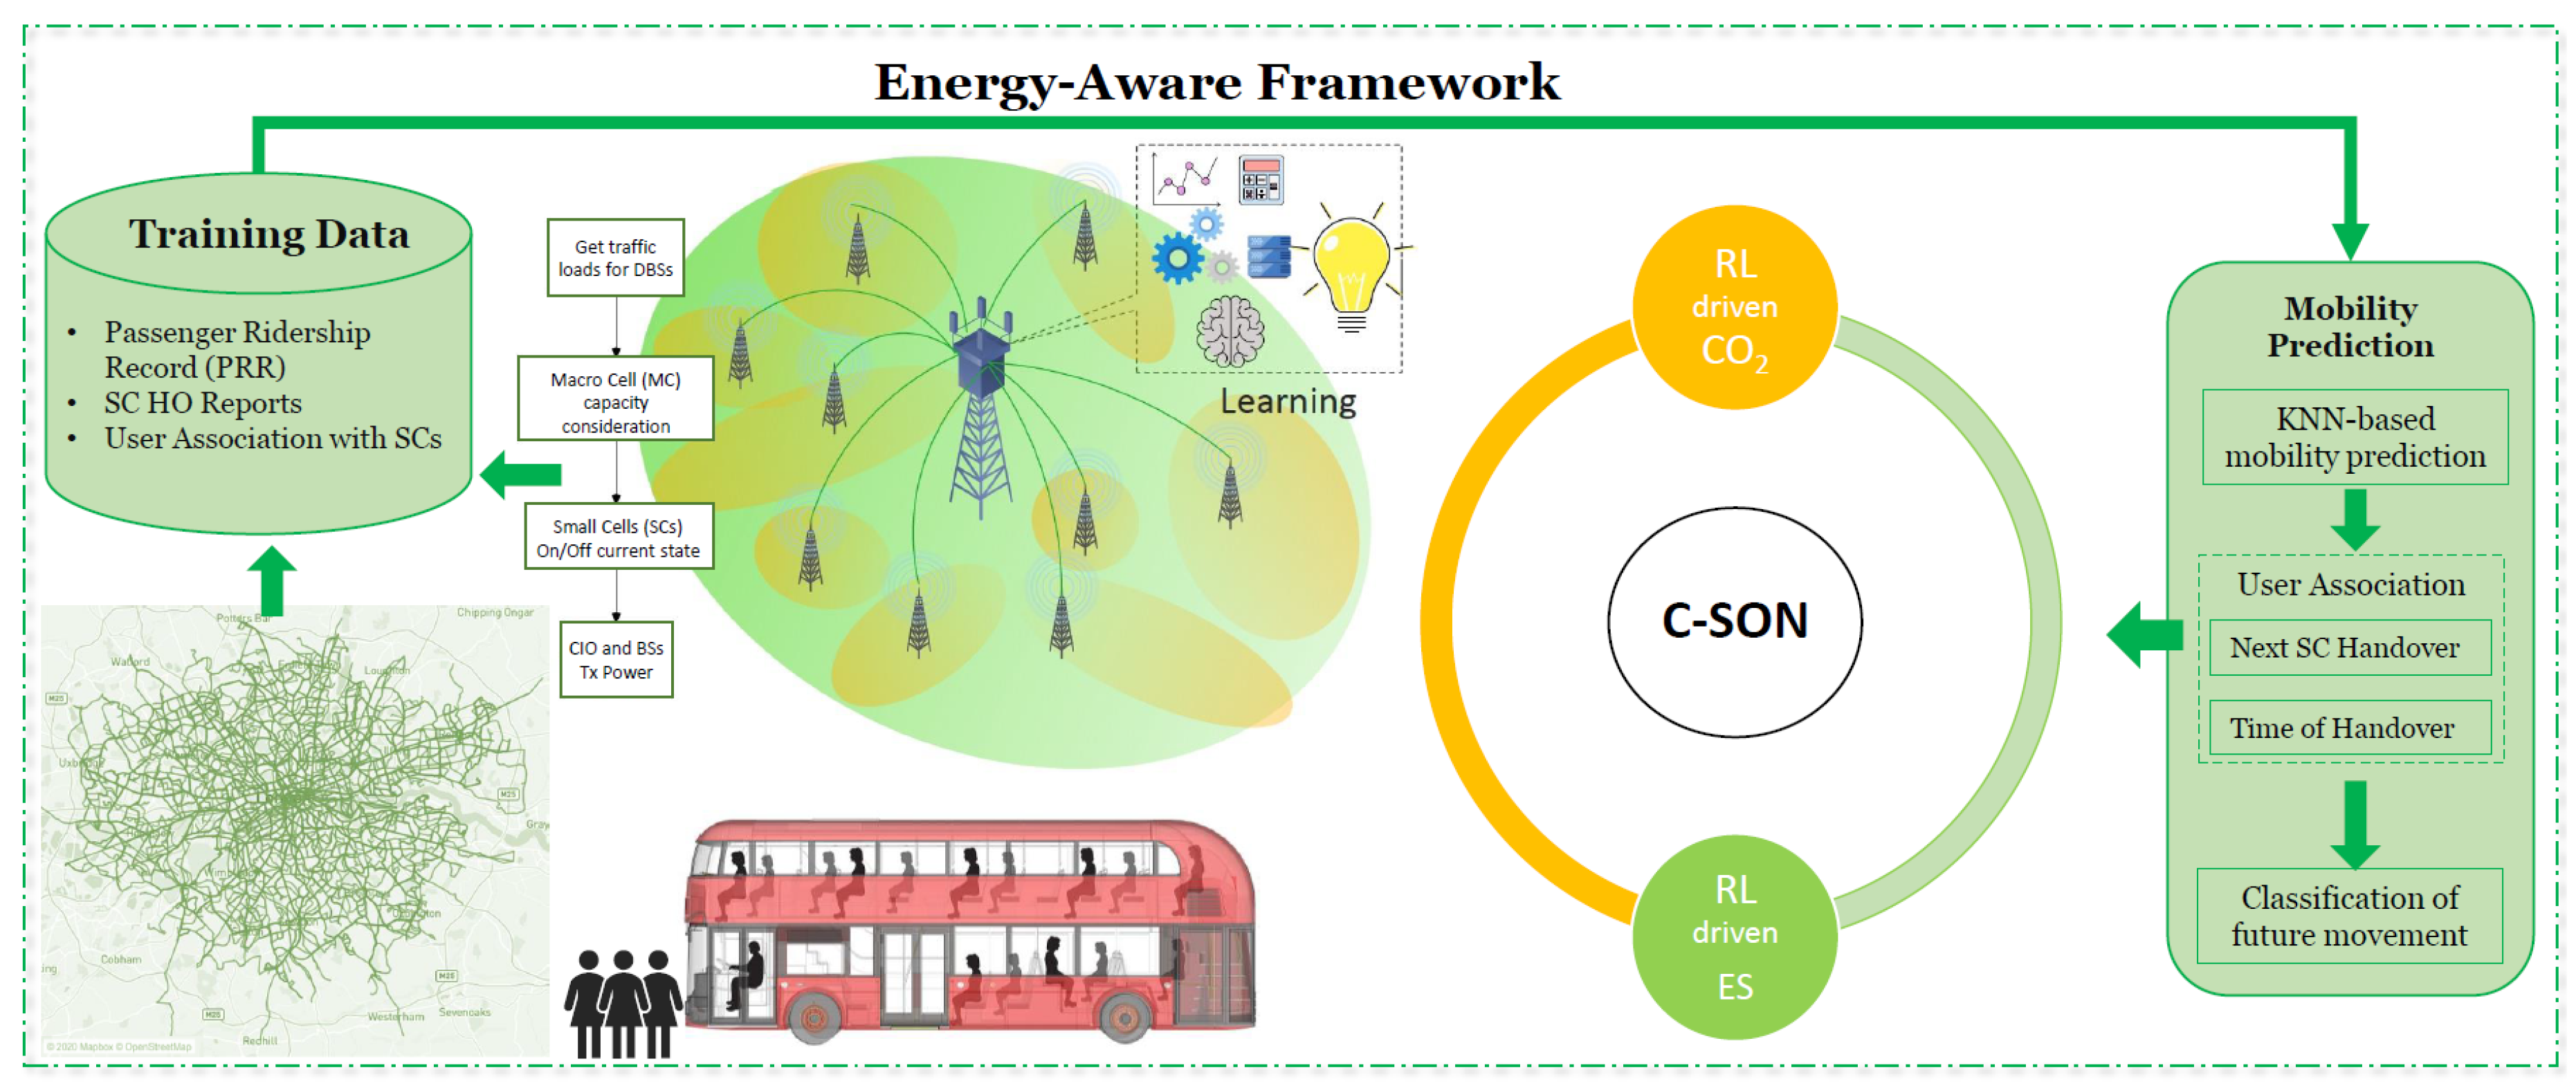
2.1. Energy-Aware Framework
2.2. Statistical KNN-Based Passengers Mobility Prediction
2.3. Passengers Future Location Estimation
| Algorithm 1: Deep channel residual learning |
 |
2.4. Proactive-Energy Saving Optimisation Based CO2 Reduction
3. Proposed Approach
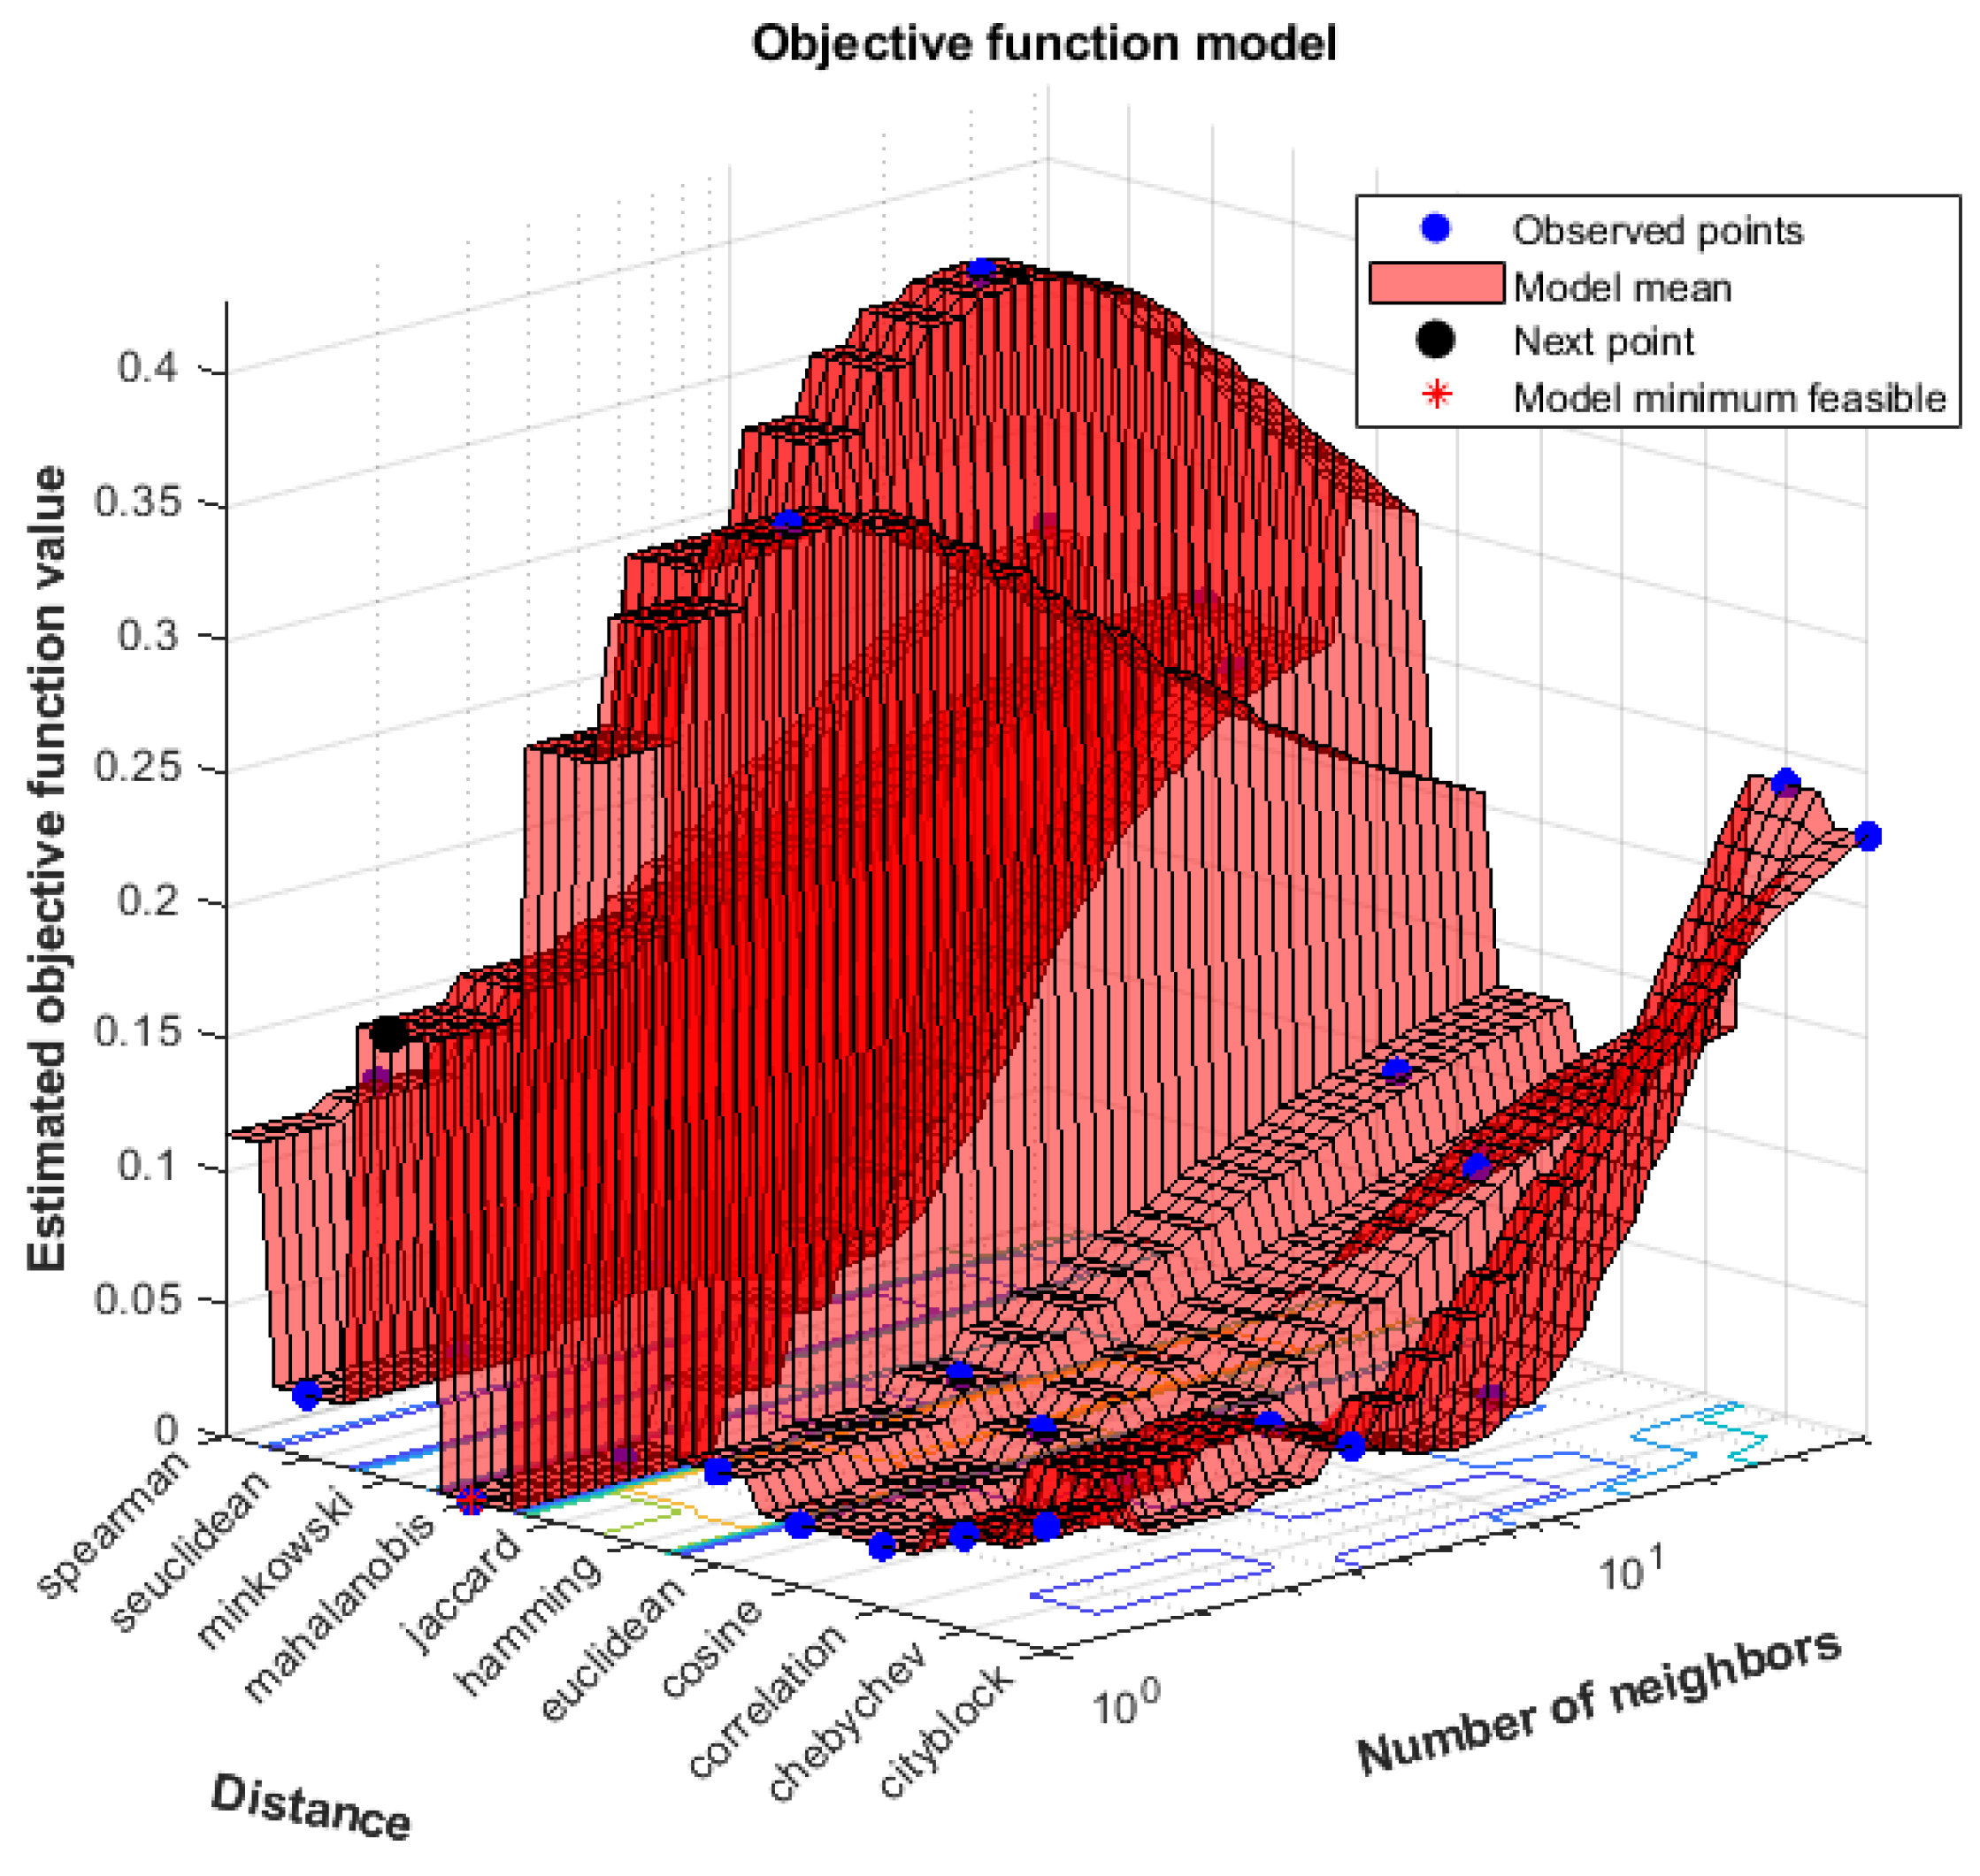
3.1. Machine Learning (ML) Driven Classification Accuracy
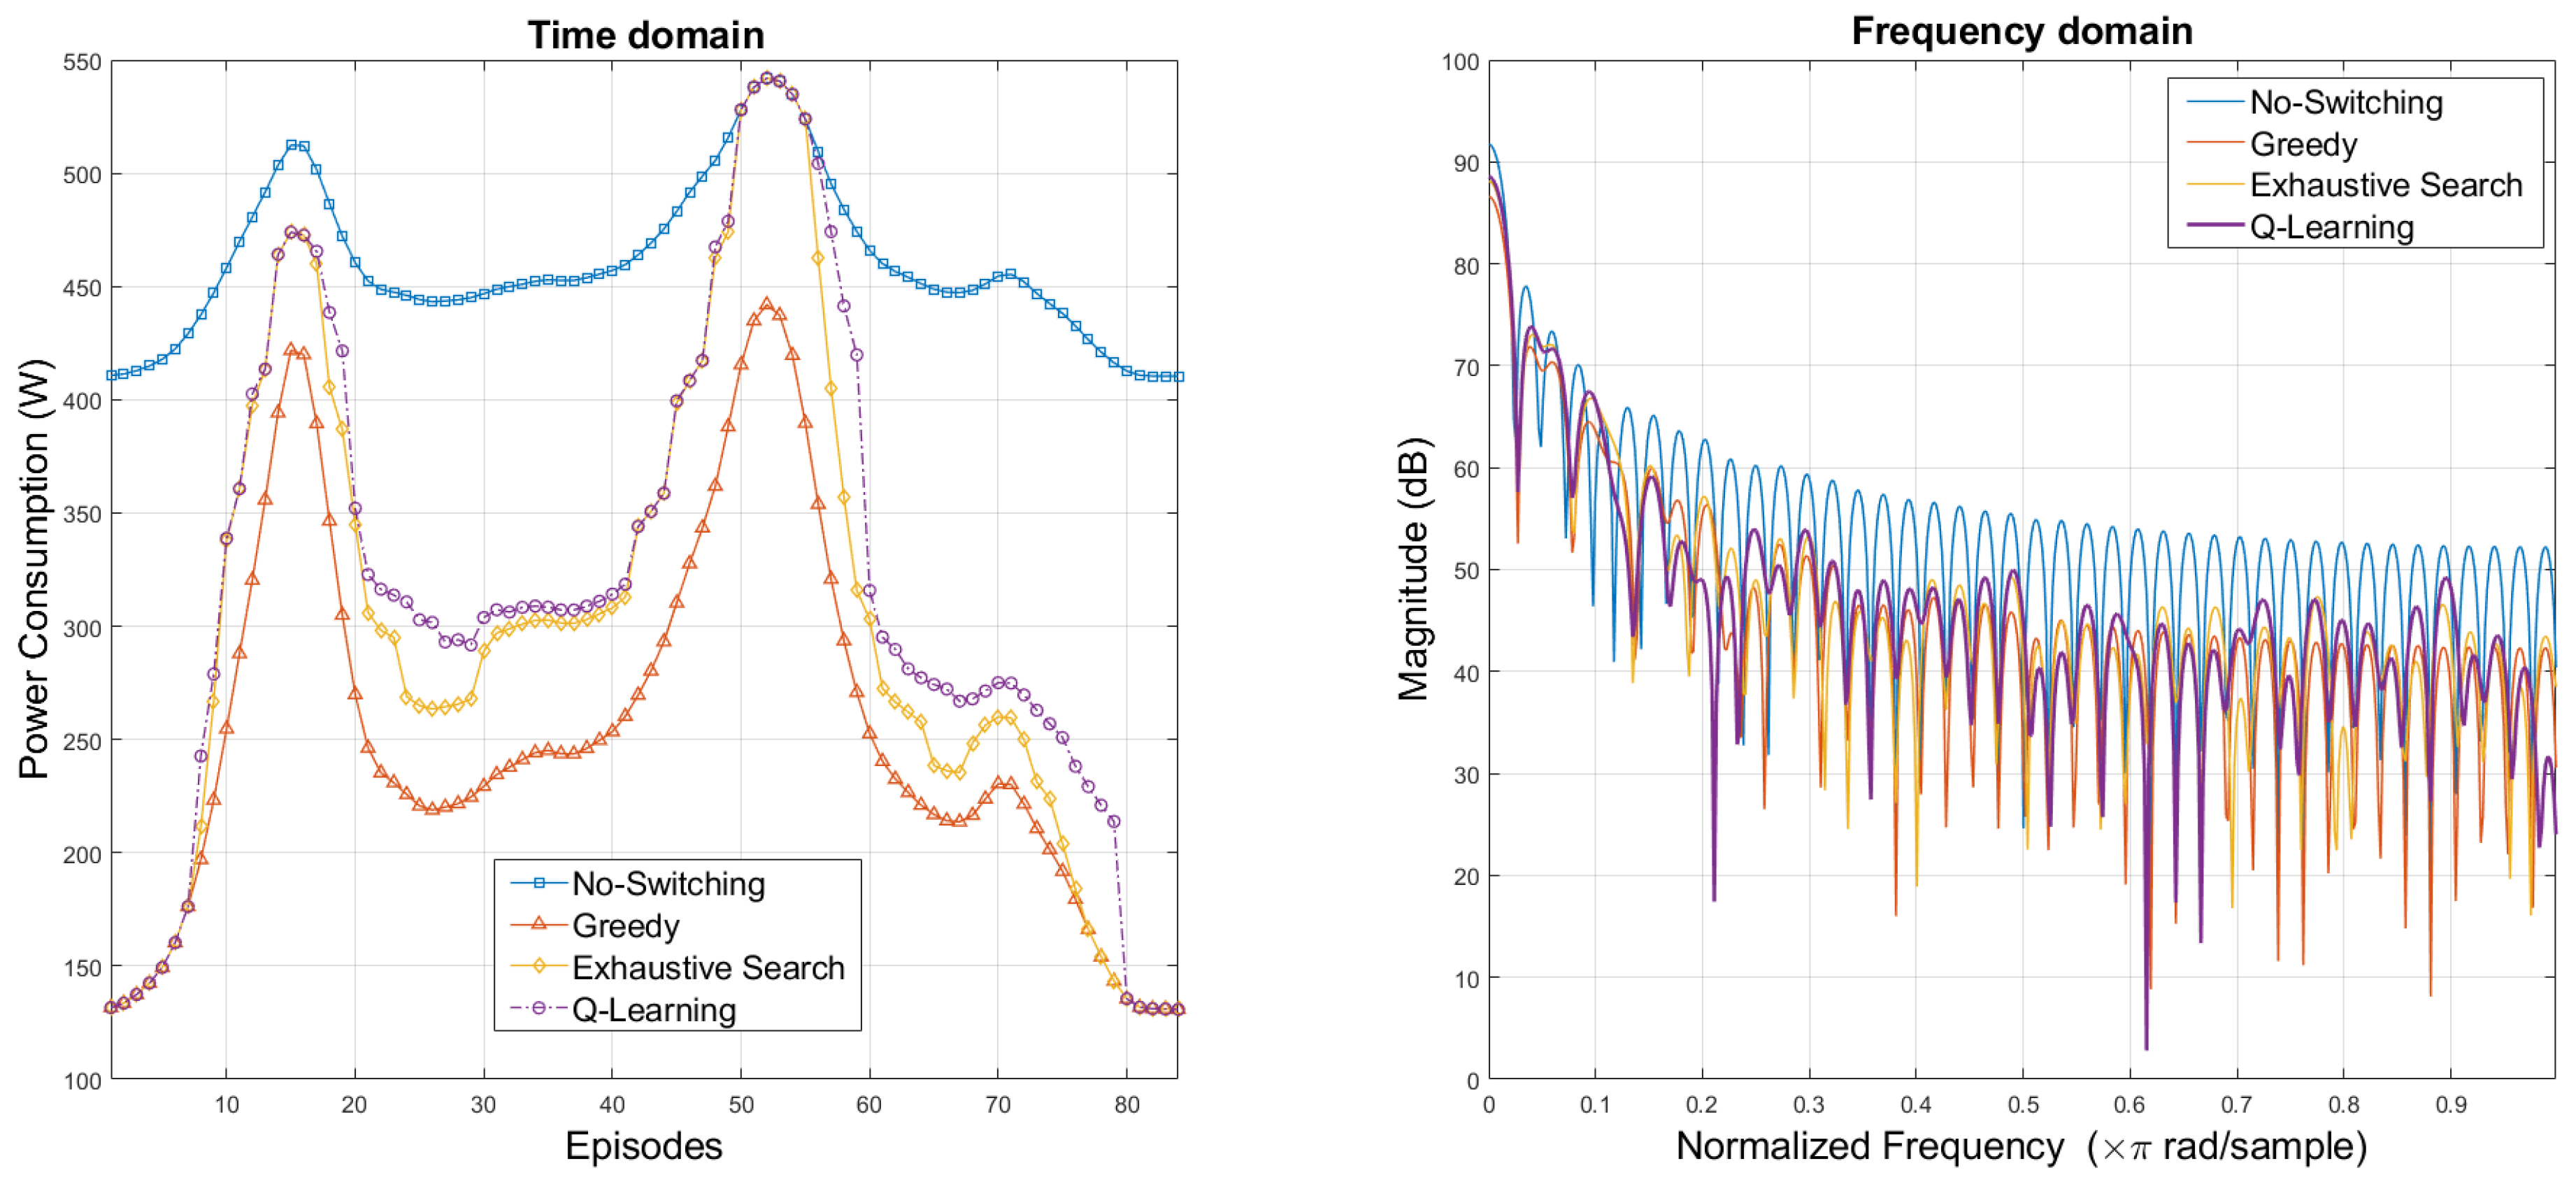
3.2. Reinforcement Learning (RL) Driven Energy Savings
4. Performance Evaluation
4.1. Classification Prediction Accuracy
4.2. Energy Saving, Benchmarking and Metrics
5. Conclusions
Author Contributions
Funding
Conflicts of Interest
References
- Oh, E.; Krishnamachari, B.; Liu, X.; Niu, Z. Toward dynamic energy-efficient operation of cellular network infrastructure. IEEE Commun. Mag. 2011, 49, 56–61. [Google Scholar] [CrossRef]
- Malmodin, J.; Lunden, D.; Moberg, A.; Andersson, G.; Nilsson, M. Life cycle assessment of ICT: Carbon footprint and operational electricity use from the operator, national, and subscriber perspective in Sweden. J. Ind. Ecol. 2014, 18, 829–845. [Google Scholar] [CrossRef]
- Asad, S.; Ozturk, M.; Rais, R.N.B.; Zoha, A.; Hussain, S.; Abbasi, Q.H.; Imran, M.A. Reinforcement Learning driven Energy Efficient Mobile Communication and Applications. In Proceedings of the 2019 IEEE International Symposium on Signal Processing and Information Technology (ISSPIT), Ajman, UAE, 10–12 December 2019; pp. 1–7. [Google Scholar]
- Cisco. Cisco Visual Networking Index: Global Mobile Data Traffic Forecast Update; Cisco White Paper; Cisco: San Jose, CA, USA, 2012. [Google Scholar]
- Imran, A.; Zoha, A.; Abu-Dayya, A. Challenges in 5G: How to empower SON with big data for enabling 5G. IEEE Netw. 2014, 28, 27–33. [Google Scholar] [CrossRef]
- Asad, S.; Ahmad, J.; Hussain, S.; Zoha, A.; Abbasi, Q.; Imran, M. Mobility Prediction-Based Optimisation and Encryption of Passenger Traffic-Flows Using Machine Learning. Sensors 2020, 20, 2629. [Google Scholar] [CrossRef]
- Fehske, A.J.; Viering, I.; Voigt, J.; Sartori, C.; Redana, S.; Fettweis, G.P. Small-Cell Self-Organizing Wireless Networks. Proc. IEEE 2014, 102, 334–350. [Google Scholar] [CrossRef]
- Badic, B.; O’Farrrell, T.; Loskot, P.; He, J. Energy Efficient Radio Access Architectures for Green Radio: Large versus Small Cell Size Deployment. In Proceedings of the 2009 IEEE 70th Vehicular Technology Conference Fall, Anchorage, AK, USA, 20–23 September 2009; pp. 1–5. [Google Scholar]
- Auer, G.; Giannini, V.; Desset, C.; Godor, I.; Skillermark, P.; Olsson, M.; Imran, M.; Sabella, D.; Gonzalez, M.; Blume, O.; et al. How much energy is needed to run a wireless network? IEEE Wireless Commun. 2011, 18, 40–49. [Google Scholar] [CrossRef]
- Mohamed, A.; Onireti, O.; Imran, M.A.; Imran, A.; Tafazolli, R. Control-Data Separation Architecture for Cellular Radio Access Networks: A Survey and Outlook. IEEE Commun. Surv. Tutor. 2015, 18, 446–465. [Google Scholar] [CrossRef] [Green Version]
- Ye, J.; He, Y.; Ge, X.; Chen, M. Energy Efficiency Analysis of 5G Ultra-dense Networks Based on Random Way Point Mobility Models. In Proceedings of the IEEE International Symposium on (WPMC), Shenzhen, China, 14–16 November 2016. [Google Scholar]
- Zhou, X.; Zhao, Z.; Li, R.; Zhou, Y.; Palicot, J.; Zhang, H. Human Mobility Patterns in Cellular Networks. IEEE Commun. Lett. 2013, 17, 1877–1880. [Google Scholar] [CrossRef]
- Abubakar, A.; Ozturk, M.; Hussain, S.; Imran, M.A. Q-learning Assisted Energy-Aware Traffic Offloading and Cell Switching in Heterogeneous Networks. In Proceedings of the 2019 IEEE 24th International Workshop on Computer Aided Modeling and Design of Communication Links and Networks (CAMAD), Limassol, Cyprus, 11–13 September 2019. [Google Scholar]
- Yuan, Q.; Cardei, I.; Wu, J. An Efficient Prediction-Based Routing in Disruption-Tolerant Networks. IEEE Trans. Parallel Distrib. Syst. 2012, 23, 19–31. [Google Scholar] [CrossRef]
- Samarakoon, S.; Bennis, M.; Saad, W.; Latva-Aho, M. Opportunistic sleep mode strategies in wireless small cell networks. In Proceedings of the 2014 IEEE International Conference on Communications (ICC), Sydney, NSW, Australia, 10–14 June 2014; pp. 2707–2712. [Google Scholar]
- Gorawski, M.; Grochla, K. Review of Mobility Models for Performance Evaluation of Wireless Networks; Springer: Cham, Switzerland, 2014; Volume 242, pp. 567–577. [Google Scholar]
- Farooq, H.; Asghar, A.; Imran, A. Mobility Prediction-Based Autonomous Proactive Energy Saving (AURORA) Framework for Emerging Ultra-Dense Networks. IEEE Trans. Green Commun. Netw. 2018, 2, 958–971. [Google Scholar] [CrossRef]
- Lee, J.K.; Hou, J.C. Modeling Steady-State and Transient Behaviors of User Mobility: Formulation, Analysis, and Application. In Proceedings of the 7th ACM International Symposium on Mobile Ad Hoc Networking and Computing; Association for Computing Machinery; New York, NY, USA, 2006; pp. 85–96. [Google Scholar] [CrossRef]
- Murphy, K.P. MachineArtificial Neural Networks-Based Learning: A Probabilistic Perspective; The MIT Press: Cambridge, MA, USA; London, UK, 2012. [Google Scholar]
- Pathirana, V.K. Nearest Neighbor Foreign Exchange Rate Forecasting with Mahalanobis Distance. Ph.D. Thesis, University of South Florida, Tampa, FL, USA, 2015. Available online: https://scholarcommons.usf.edu/etd/5757/ (accessed on 20 May 2020).
- Chen, M.; Challita, U.; Saad, W.; Yin, C.; Debbah, M. Artificial Neural Networks-Based Machine Learning for Wireless Networks: A Tutorial. IEEE Commun. Surv. Tutor. 2019, 21, 3039–3071. [Google Scholar] [CrossRef] [Green Version]
- Zoha, A.; Saeed, A.; Farooq, H.; Rizwan, A.; Imran, A.; Imran, M.A. Leveraging Intelligence from Network CDR Data for Interference Aware Energy Consumption Minimization. IEEE Trans. Mob. Comput. 2018, 17, 1569–1582. [Google Scholar] [CrossRef] [Green Version]
- Lee, K.; Hong, S.; Kim, S.J.; Rhee, I.; Chong, S. SLAW: Self-Similar Least-Action Human Walk. IEEE/ACM Trans. Netw. 2012, 20, 515–529. [Google Scholar] [CrossRef]
- Fettweis, G.; Zimmermann, E. ICT Energy Consumption—Trends and Challenges. Available online: http://citeseerx.ist.psu.edu/viewdoc/download?doi=10.1.1.139.4150&rep=rep1&type=pdf (accessed on 20 May 2020).
- Zhang, S.; Zhang, N.; Zhou, S.; Gong, J.; Niu, Z.; Shen, X. Energy-Aware Traffic Offloading for Green Heterogeneous Networks. IEEE J. Sel. Areas Commun. 2016, 34, 1116–1129. [Google Scholar] [CrossRef]
- Chen, X.; Wu, J.; Cai, Y.; Zhang, H.; Chen, T. Energy-Efficiency Oriented Traffic Offloading in Wireless Networks: A Brief Survey and A Learning Approach for Heterogeneous Cellular Networks. IEEE J. Sel. Areas Commun. 2015, 33, 627–640. [Google Scholar] [CrossRef]
- Samdanis, K.; Rost, P.; Maeder, A.; Meo, M.; Verikoukis, C. Green Communications: Principles, Concepts and Practice; Wiley: Hoboken, NJ, USA, 2015. [Google Scholar]
- Chang, C.H.; Liu, C.L.; Chao, H.L.; Huang, K.L.; Lin, Y.B. A novel LIPA scheme for LTE VoIP services with home eNBs. J. Wirel. Mob. Netw. Ubiquitous Comput. Dependable Appl. 2013, 4, 1–22. [Google Scholar]
- Cao, F.; Fan, Z. The tradeoff between energy efficiency and system performance of femtocell deployment. In Proceedings of the 2010 7th International Symposium on Wireless Communication Systems, York, UK, 19–22 September 2010; pp. 315–319. [Google Scholar]
- Shah, S.A.; Fan, D.; Ren, A.; Zhao, N.; Yang, X.; Tanoli, S.A.K. Seizure episodes detection via smart medical sensing system. J. Ambient Intell. Humaniz. Comput. 2018, 1–13. [Google Scholar] [CrossRef] [Green Version]
- Mondal, M.A.; Rehena, Z. Identifying Traffic Congestion Pattern using K-means Clustering Technique. In Proceedings of the International Conference on Internet of Things: Smart Innovation and Usages (IoT-SIU), Ghaziabad, India, 18–19 April 2019. [Google Scholar]
- Wang, G.; Zeng, X.; Yuan, T. Study on the influence of train control system on service quality of rail transit. In Proceedings of the International Conference on Service Systems and Service Management, Dalian, China, 16–18 June 2017; pp. 1–4. [Google Scholar]
- Asif, M.T.; Dauwels, J.; Goh, C.Y.; Oran, A.; Fathi, E.; Xu, M.; Dhanya, M.M.; Mitrovic, N.; Jaillet, P. Spatiotemporal Patterns in Large-Scale Traffic Speed Prediction. IEEE Trans. Intell. Transp. Syst. 2014, 15, 794–804. [Google Scholar] [CrossRef] [Green Version]
- Huang, L.; Bi, S.; Zhang, Y.J.A. Deep Reinforcement Learning for Online Computation Offloading in Wireless Powered Mobile-Edge Computing Networks. IEEE Trans. Mob. Comput. 2019, 19, 2581–2593. [Google Scholar] [CrossRef] [Green Version]
- Sutton, R.S.; Barto, A.G. Reinforcement Learning: An Introduction; MIT Press: Cambridge, MA, USA, 2018. [Google Scholar]
- Lin, Y.B.; Wang, L.C.; Lin, P. SES: A Novel Yet Simple Energy Saving Scheme for Small Cells. IEEE Trans. Veh. Technol. 2017, 66, 8347–8356. [Google Scholar] [CrossRef]
- Ozturk, M.; Jaber, M.; Imran, M.A. Energy-Aware Smart Connectivity for IoT Networks: Enabling Smart Ports. Wirel. Commun. Mob. Comput. 2018, 2018. [Google Scholar] [CrossRef] [Green Version]


| Data Type | Value |
|---|---|
| Number of BS | 10 (1 MC and 9 SCs) |
| Bandwidth | 20 MHz |
| Frequency | 2.6 GHz |
| Physical Resource Blocks (PRBs) | 100 |
| Number of iterations for RL | 100 |
| Number of iterations for ML | 100 |
| Total bus routes | 673 |
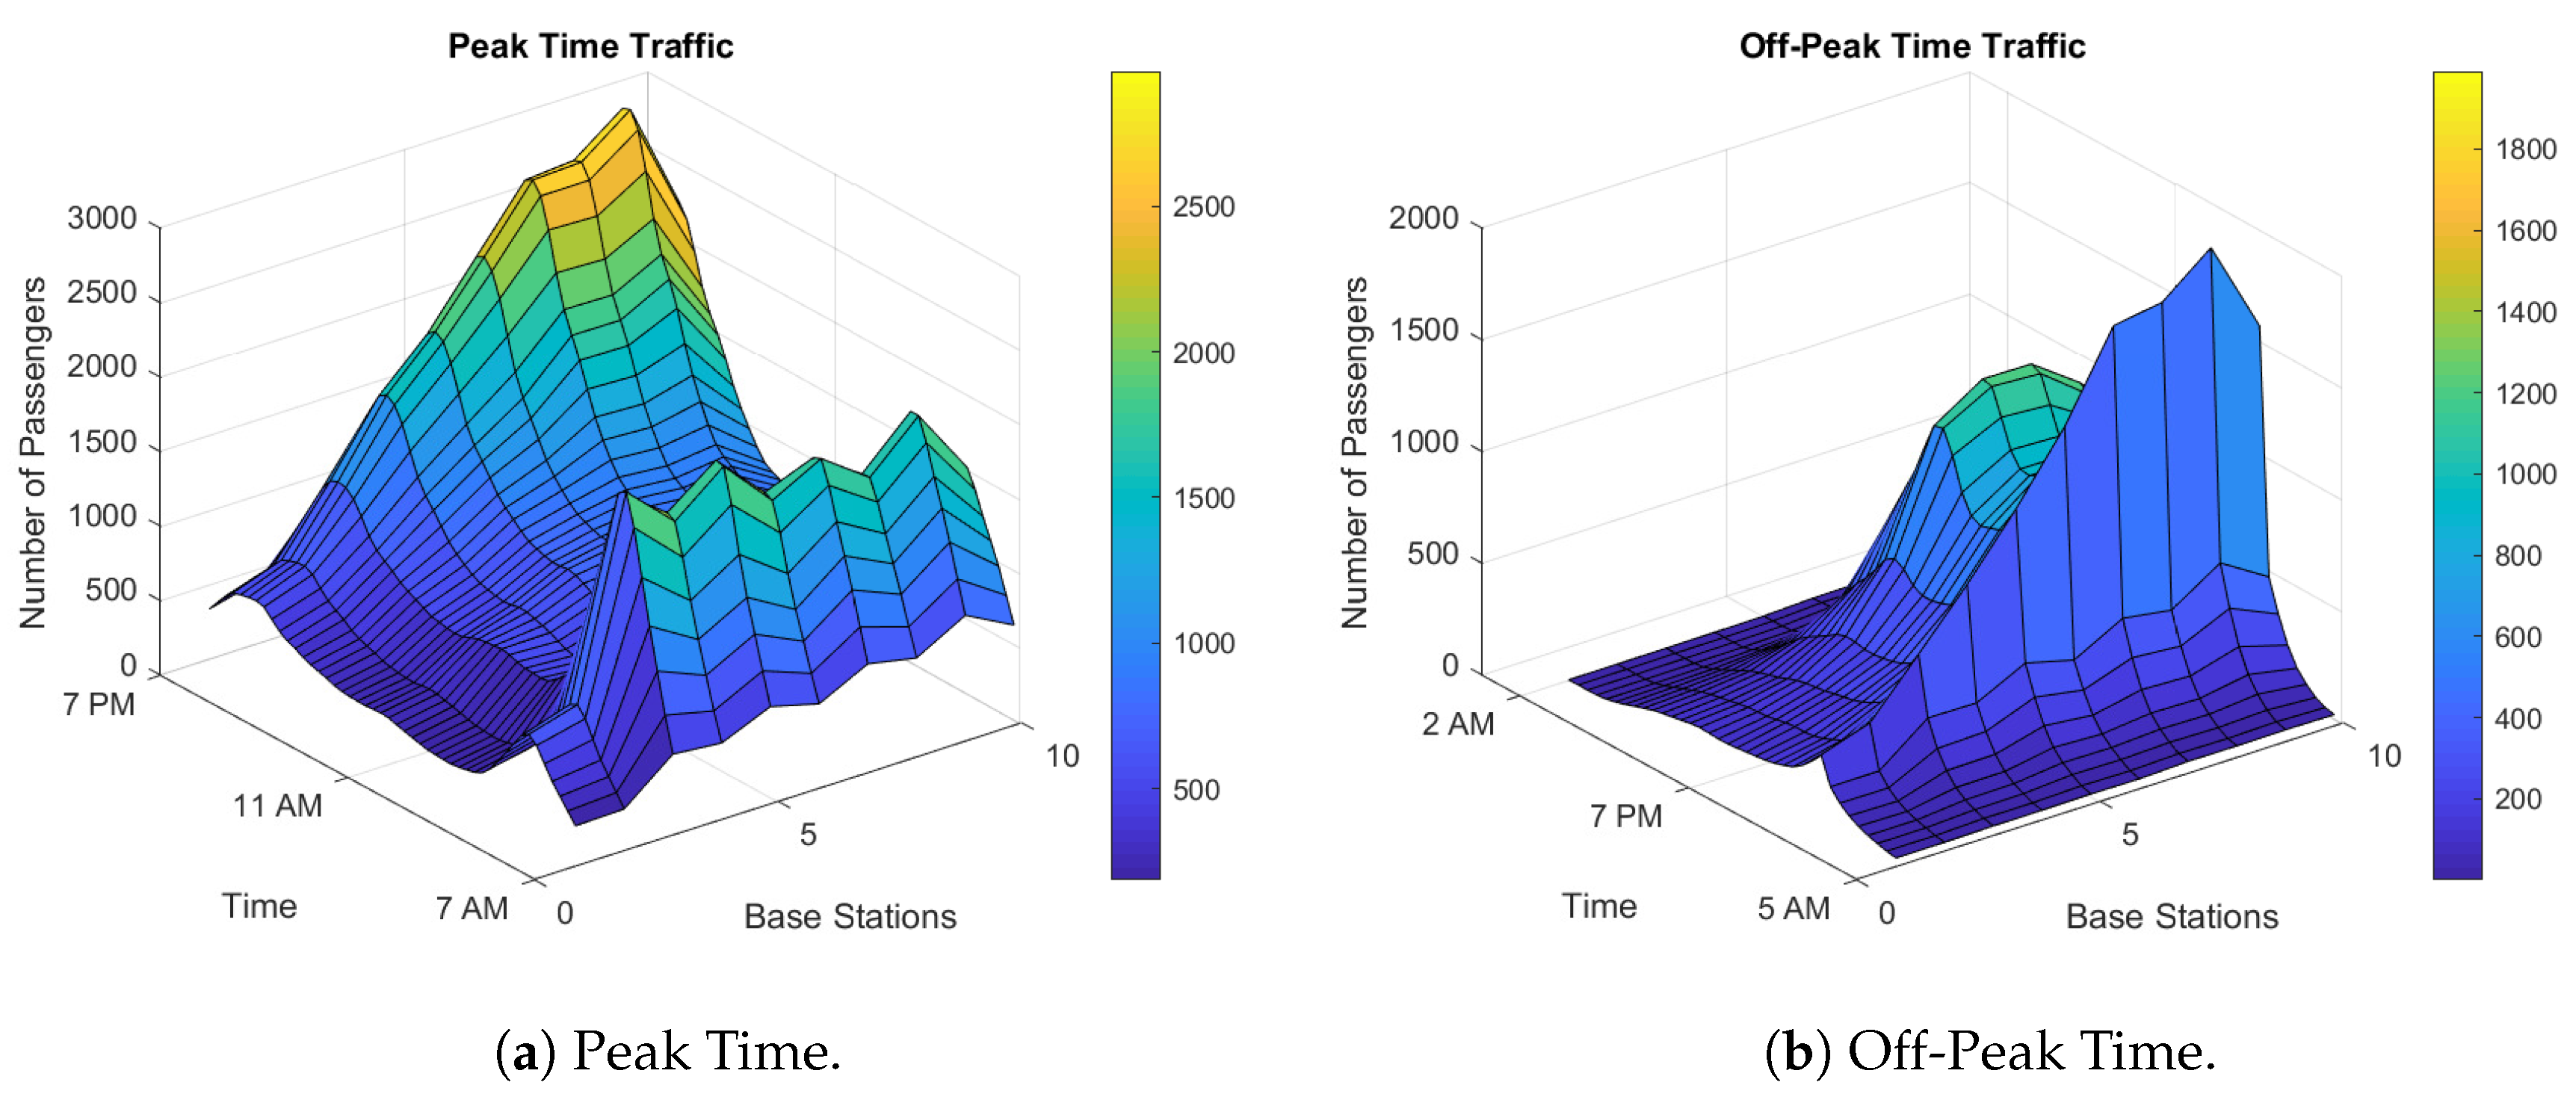
| Total number of passengers (Peak) | 0.5 M |
| Total number of passenger (Off-Peak) | 0.2 M |
| Number of classes | 2 |
| Area of passenger movement probability | 100% |
| Total simulation duration | 21 h |
| Machine Learning Algorithm | Accuracy | Precision | Recall | F-Measure |
|---|---|---|---|---|
| K-Nearest Neighbour (KNN) | 98.82% | 0.97 | 0.96 | 0.97 |
| Discriminant Analysis (DA) | 98.75% | 0.96 | 0.96 | 0.96 |
| Support Vector Machine (SVM) | 98.75% | 0.97 | 0.95 | 0.95 |
| Decision Tree (DT) | 97.78% | 0.97 | 0.96 | 0.97 |
| Naive Bayes (NB) | 86.94% | 0.86 | 0.85 | 0.86 |
| Artificial Neural Network (ANN) | 73.08% | 0.73 | 0.72 | 0.73 |
Publisher’s Note: MDPI stays neutral with regard to jurisdictional claims in published maps and institutional affiliations. |
© 2020 by the authors. Licensee MDPI, Basel, Switzerland. This article is an open access article distributed under the terms and conditions of the Creative Commons Attribution (CC BY) license (http://creativecommons.org/licenses/by/4.0/).
Share and Cite
Asad, S.M.; Ansari, S.; Ozturk, M.; Rais, R.N.B.; Dashtipour, K.; Hussain, S.; Abbasi, Q.H.; Imran, M.A. Mobility Management-Based Autonomous Energy-Aware Framework Using Machine Learning Approach in Dense Mobile Networks. Signals 2020, 1, 170-187. https://0-doi-org.brum.beds.ac.uk/10.3390/signals1020010
Asad SM, Ansari S, Ozturk M, Rais RNB, Dashtipour K, Hussain S, Abbasi QH, Imran MA. Mobility Management-Based Autonomous Energy-Aware Framework Using Machine Learning Approach in Dense Mobile Networks. Signals. 2020; 1(2):170-187. https://0-doi-org.brum.beds.ac.uk/10.3390/signals1020010
Chicago/Turabian StyleAsad, Syed Muhammad, Shuja Ansari, Metin Ozturk, Rao Naveed Bin Rais, Kia Dashtipour, Sajjad Hussain, Qammer H. Abbasi, and Muhammad Ali Imran. 2020. "Mobility Management-Based Autonomous Energy-Aware Framework Using Machine Learning Approach in Dense Mobile Networks" Signals 1, no. 2: 170-187. https://0-doi-org.brum.beds.ac.uk/10.3390/signals1020010