Time-Frequency Analysis of Daily Activities for Fall Detection

1
Department of Biomedical Engineering, The Catholic University of America, Washington, DC 20064, USA
2
School of Electrical Engineering, International University, Vietnam National University, Ho Chi Minh City 700000, Vietnam
*
Author to whom correspondence should be addressed.
Signals 2021, 2(1), 1-12; https://0-doi-org.brum.beds.ac.uk/10.3390/signals2010001
Submission received: 30 July 2020
/
Revised: 28 October 2020
/
Accepted: 17 December 2020
/
Published: 8 January 2021
(This article belongs to the Special Issue Signals in Health Care)
Abstract
:Fall events in elderly populations often result in serious injury and may lead to long-term disability and/or death. While many fall detection systems have been developed using wearable sensors to distinguish falls from other daily activities, detection sensitivity and specificity decreases when exposed to more rigorous activities such as running and jumping. This research uses time-frequency analysis of accelerometer-only activity data to develop a strategy for improving fall detection accuracy. In this study, a wireless sensor system (WSS) consisting of a three-axis accelerometer, microprocessor and wireless communications module is used to collect daily activities performed following a script in the laboratory setting. Experiments were conducted on 36 healthy human subjects performing four types of falls (i.e., forward, backward, and left/right sideway falls) as well as normal movements such as standing, walking, stand-to-sit, sit-to-stand, stepping, running and jumping. In total, 1227 different activities were collected and analyzed. The developed algorithm computes the magnitude of three-axis accelerometer data to detect if a critical fall threshold is passed, then analyzes the power spectral density within a critical fall duration window (500 ms) to differentiate fall events from other rigorous activities. Fall events were observed with high energy in the 2–3.5 Hz range and distinct from other rigorous activities such as running (3.5–5.5 Hz) and jumping (1–2 Hz). Preliminary results indicate the power spectral density (PSD)-based algorithm can detect falls with high sensitivity (98.4%) and specificity (98.6%) using lab-based daily activity data. The proposed algorithm has the benefit of improved accuracy over existing time-domain only strategies and multisensor strategies.
1. Introduction
Fall detection, especially in older populations, has been receiving increasing attention in recent years. Falls are a significant cause of injury for elderly individuals resulting in disabling fractures that can potentially lead to death due to complications, such as infection or pneumonia or lasting disability. More than one-third of elderly individuals over 75 years old fall each year, 24% of whom experience serious injuries [1]. Accurate and reliable fall detection is necessary for protecting health and mitigating long-term disability. Automated recognition of a fall event can provide round-the-clock surveillance for elders living at home or in nursing homes. Robust, timely alerts to caregivers and family members may mitigate the lasting, long-term damage resulting from a fall.
Prior research on fall detection has utilized accelerometers for detecting fall events. Key algorithms monitor changes in body kinematics and critical peak amplitudes to detect falls and characterize daily activities [2,3,4,5]. These systems successfully detect fall events with sensitivities greater than 85% and specificities between 88–94%. However, focusing only on large acceleration can result in many false positives from other activities where large impacts occur, such as running and jumping.
To address these complexities, prior studies have implemented sophisticated machine learning techniques [6] such as neural networks [7,8,9,10,11], support vector machines (SVM) [12,13], Markov models [14], or k-Nearest Neighbors (k-NN) [13,15] to detect the falls and classify daily activities. However, fall detection accuracy is not substantially improved over simpler thresholding methods. Additional drawbacks of machine learning techniques include the excessive computational resources required, lack of real-time response, and, perhaps most limiting, the need for training with large datasets. In falls research, ecologically accurate datasets collected in the target population (i.e., elderly) and in real-world, in-home settings are scarce for safety reasons and, as such, a barrier to a machine learning approach.
Some fall detection algorithms rely upon detection of the final posture, assuming the faller ends up lying prone after a fall event [4,16,17]. These strategies are less effective when a person’s fall posture is not horizontal, e.g., fall happen on stairs.
In our previous study [18], we proposed a multisensor combination of accelerometer and gyroscope to improve fall detection accuracy (i.e., sensitivity, specificity). Whereas the accelerometer detects impacts, the gyroscope adds complementary information related to biomechanical movement. The addition of angular velocity information reduces false positives resulting from rigorous activity such as running. However, the angular velocity of jumping occasionally overlaps with fall events slightly reducing system specificity. The disadvantages of a multisensor approach include increased sensor cost, but more importantly additional computational, storage, and data communication costs. Energy consumption and battery requirements are key drawbacks of gyroscope inclusion in a fall detection strategy that is implemented on a wearable device. Power requirements for a gyroscope can be several hundred times greater than that for an accelerometer [19]
Several studies have studied frequency domain characteristics of daily activities. Attal et al. [20] demonstrated the usefulness of the power spectral density (PSD) to recognize activities such as walking, cycling, running and driving. Critical frequency corresponding to the highest computed PSD values have been used in several studies for activity recognition [21,22,23]. Bersch et al. used frequency information of the accelerometer signal to distinguish falls from low-rigor activities such as walking and sitting; however, the accuracy of their algorithm was not reported [24]. Shin et al. developed a fall detection algorithm using Short Time Fourier Transform (STFT) [25]. High accuracy was achieved with 96.9% sensitivity and 97.1% specificity for classifying fall events from low-rigor activities with low impact forces such as walking, sit-to-stand, stand-to-sit, sit-to-lie activities. A key limitation is the algorithm was not evaluated in comparison to activities with high impact forces such as running or jumping.
Unlike our previous study, the purpose of this study to analyze daily activities and fall events using both time and frequency domains, especially from more rigorous activities. Further, this study proposes a fall detection algorithm using only the acceleration signal, eliminating the need for a gyroscope to confirm fall events. This method reduces the overall cost of a sensor unit, amount data collected, data storage requirements, but, perhaps most importantly, battery consumption and size requirements, all critical for a commercial system.
2. Materials and Methods
In our prior study [2], a wireless sensor system (WSS) was developed to collect real-time, three-axis acceleration data of daily activities and fall events. The WSS consists of a three-axis digital accelerometer sensor (ADXL345), a 32-bit ARM M3 microprocessor (MCU LPC17680 M3), and Wi-Fi module (RN131). The WSS is used to sense body biomechanics, control the flow of data, and transmit/receive data to a remote server for analysis. The WSS is placed at the center of chest during data collection for optimal activity detection [16]. As shown in Figure 1, the orientation of data collected include superior-inferior (x-axis), lateral (y-axis), and anterior-posterior (z-axis) directions. The data was collected with a sampling rate of 100 Hz.
Once received, daily collected activity data is analyzed using Matlab (Mathworks, Inc., Natick, MA, USA). The program receives and displays real-time data from the WSS. It continuously plots the acceleration and angular velocity values of each activity.
2.1. Experimental Protocol
Due to potential safety and injury concerns resulting from fall experiments conducted on elderly subjects, 36 healthy subjects (age from 19–28 years, weight from 50–90 kg, and height from 154.5–180.0 cm) were enrolled in this study. Each subject performed various daily activities following a script in a laboratory setting while wearing the WSS. Subjects repeated performance of activities three times to assess reproducibility of sensor signals. Activities performed included standing, walking, sitting down/standing up, walking up and down stairs, running, lying down/sitting up and four different types of fall tests: forward fall, backward fall, right sideways fall, and left sideways fall. Activities that generated multiple occurrences in a single data collection (i.e., walking up/down stairs, running, walking) were not collected in all subjects as there was ample data generated from testing for algorithm development and validation. To ensure safety and reduce risk of injury, falls were performed onto a 24-inch high-jump cushioned surface. Experiment protocols were approved by the IRB (protocol #16-038) at The Catholic University of America (Washington, DC). All subjects participating in the study provided informed consent.
2.2. Data Analysis
The most common and simple method for fall detection uses a triaxial accelerometer to detect a fall event [4,26]. In these algorithms, the magnitude of acceleration is computed following Equation (1):
where , are the acceleration (g) in the x, y, z axes, respectively. If Acc surpasses a predetermined critical threshold, the activity is designated as a fall event. While simple, sensitivity and specificity of these fall algorithms range between 80–95%. To achieve high detection rates, the critical threshold is lowered. However, this results in increased false positives. Clearly, there is a trade-off between high sensitivity (i.e., correctly detecting a fall event) and high specificity (i.e., false positives). We analyze collected data to characterize the range of peak accelerations for each activity using Equation (1).
In addition to examining the time-domain signal, acceleration data is also analyzed in the frequency domain to characterize spectral information of various daily activities including falls. For this, the power spectral density (PSD) of the acceleration signal is computed for each activity using:
2.3. Fall Detection Strategy
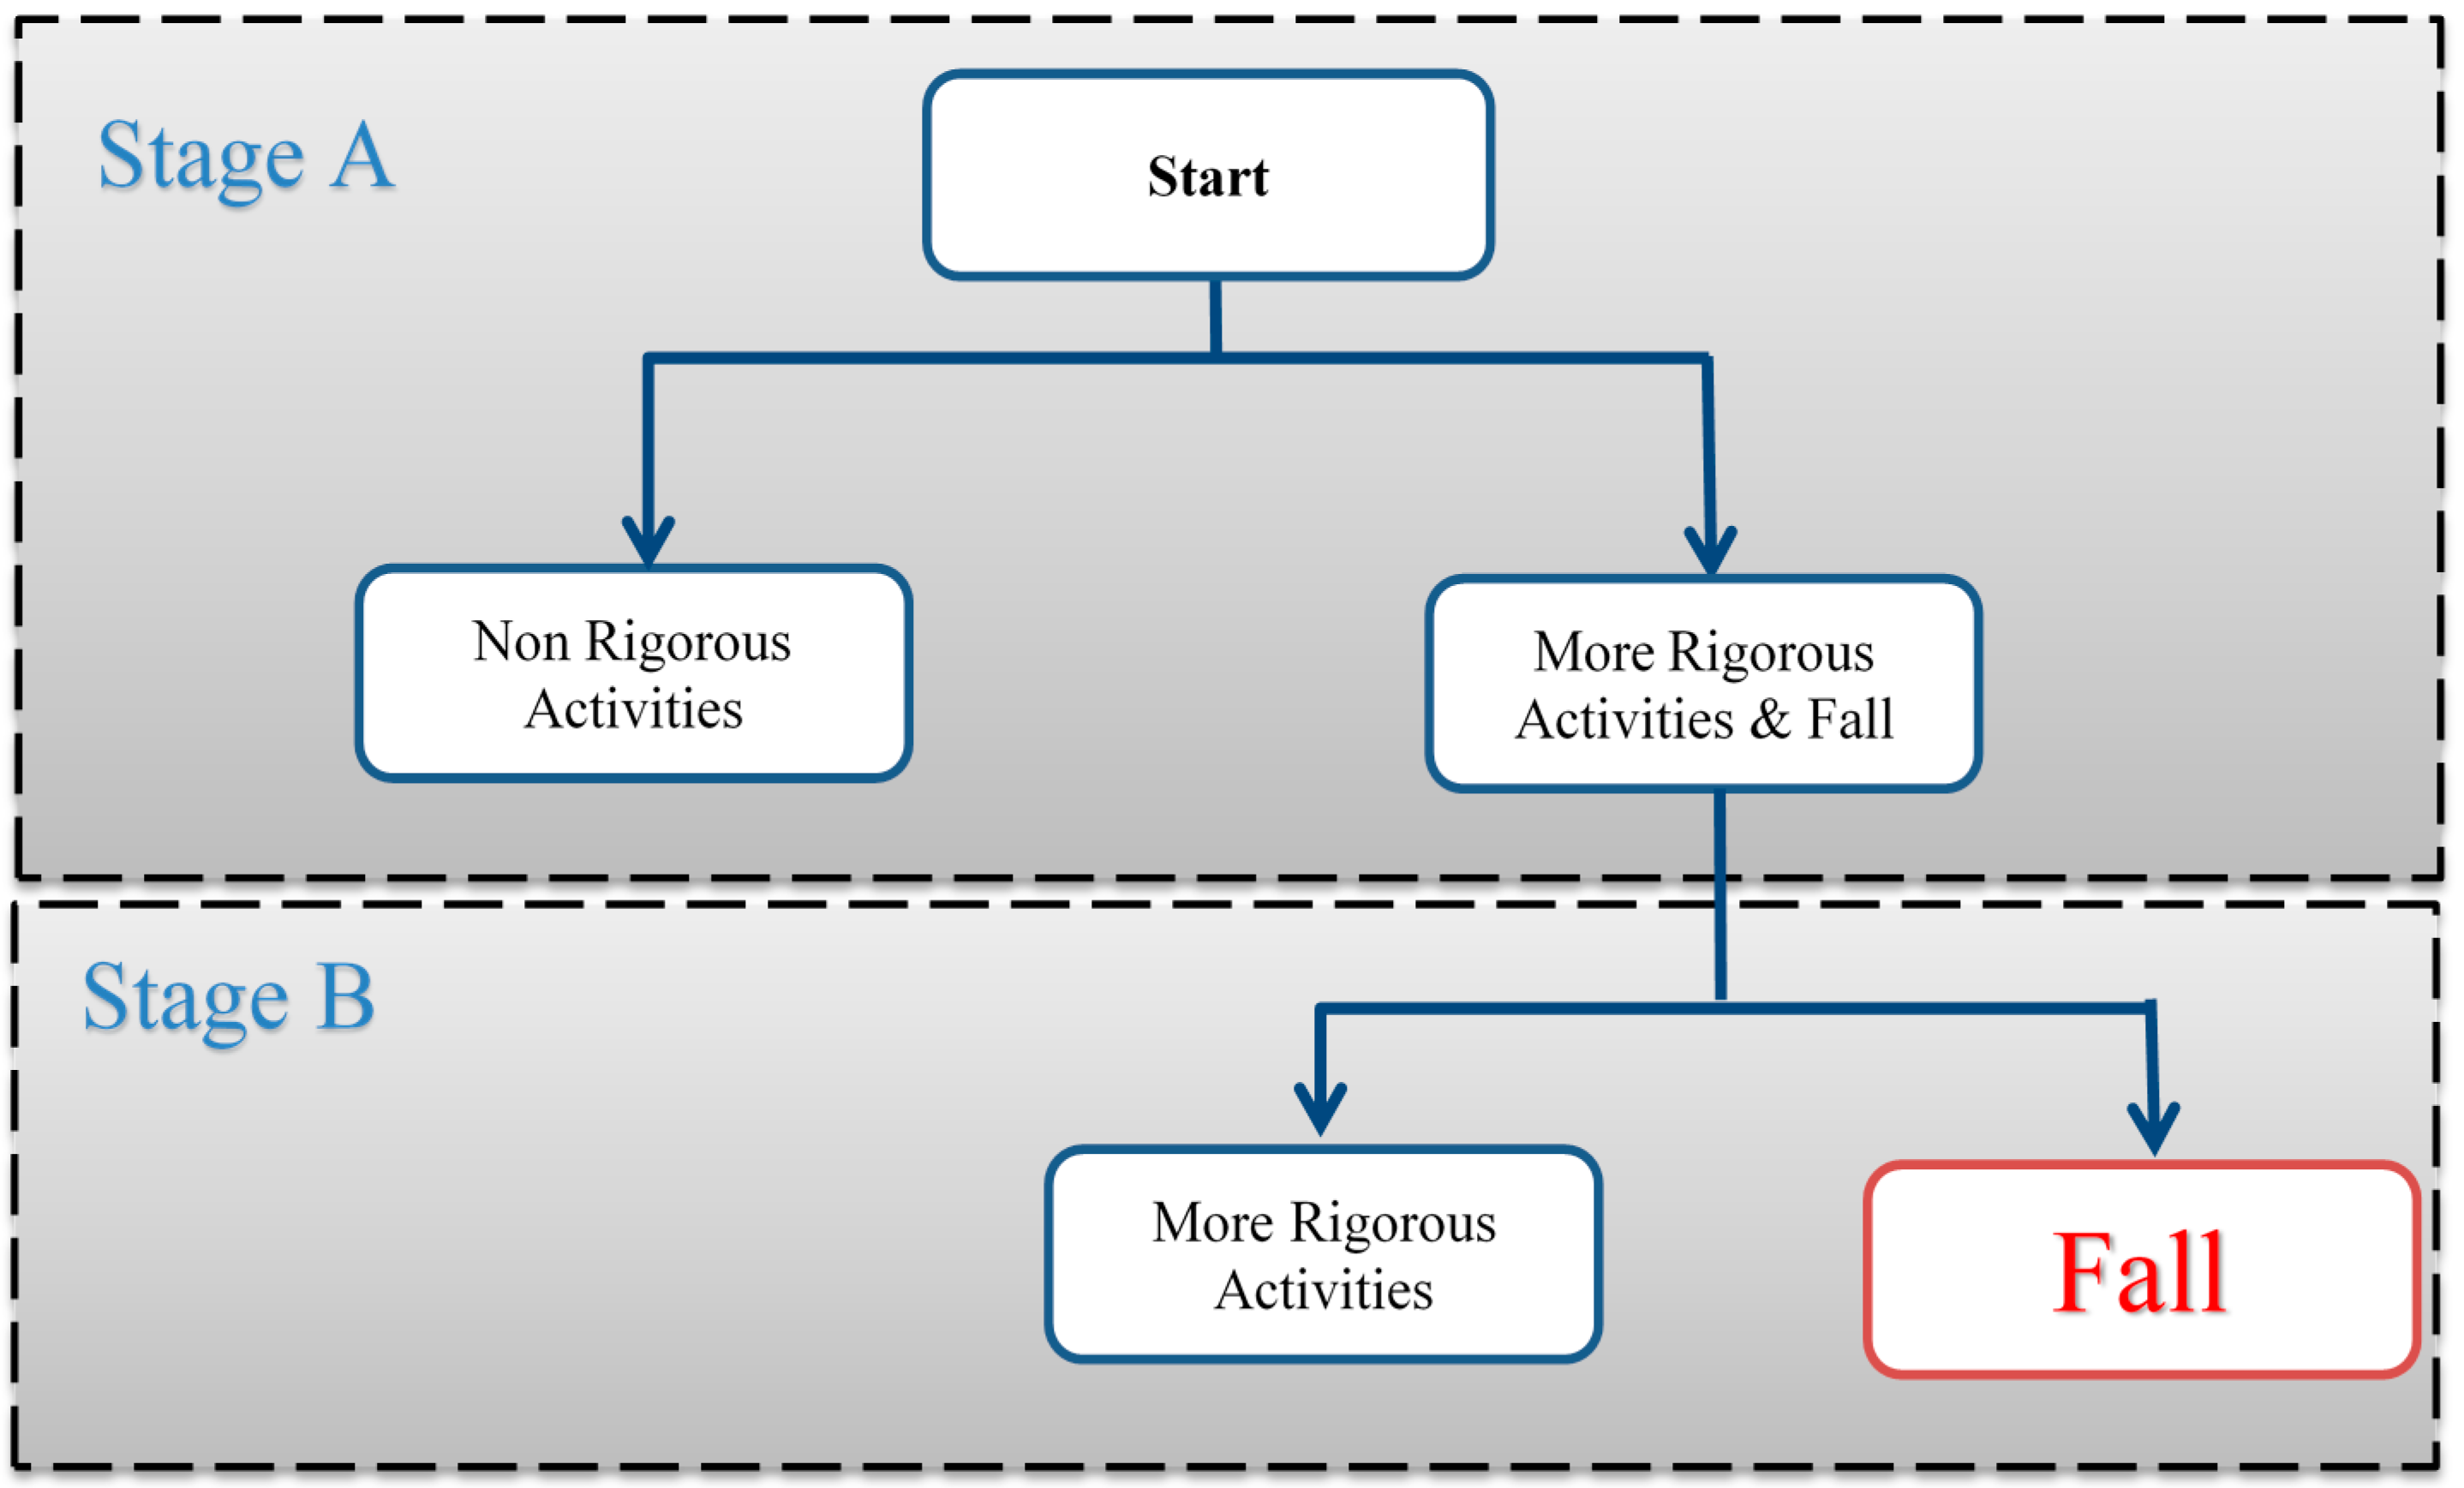
Using the time and frequency information obtained from the accelerometer signal, a fall detection algorithm is proposed. This proposed algorithm utilizes a hierarchical classification strategy following two stages. Figure 2 illustrates the fall detection schema.
In the first stage (Stage A), acceleration data from daily activities are analyzed in the time-domain to distinguish between low-impact, non-rigorous (i.e., standing, sitting, walking, stepping) and more rigorous activities exhibiting high impacts (i.e., running, jumping, falls). Non-rigorous activities are easily distinguished from activities that are more rigorous by setting a critical acceleration threshold (TH1). In the literature, TH1 ranges from 2–3 g and has tremendous effect on sensitivity and specificity of fall detection algorithms. Additionally, because more rigorous activities such as running, jumping, and falls exhibit overlapping peak acceleration magnitudes in the time domain, the specificity of time domain analysis is reduced.
To improve fall detection accuracy, improved classifiers to differentiate fall events from other rigorous activities are needed. Analyzing data in the frequency domain may provide additional unique information to improve detection. Thus, rigorous activities identified in Stage A exhibiting high impacts and exceeding TH1 are further analyzed in the frequency domain using PSD calculations in Stage B. Once a potential fall event is identified in Stage B, the algorithm performs a posture validation procedure to confirm the fall event. As falls occur in either the anterior-posterior (z-axis) or lateral (y-axis) directions, this results in a change in sensor orientation and hence, which sensor axis is aligned with the direction of gravity. Following a forward/backward fall, the z-axis will be oriented in the direction of gravity; in a lateral fall, the y-axis will be reoriented in the direction of gravity. Thus, to confirm a fall event, the detection algorithm checks if the acceleration magnitude of the y–z plane, Accyz, exceeds a critical threshold (TH2), where:
Finally, the proposed fall detection algorithm is tested for sensitivity and specificity using the half of the dataset not utilized for algorithm development and optimization. Sensitivity and specificity are calculated as follows:
where:
- # TP: true positive. fall event is correctly detected
- # FP: false positive, non-fall event incorrectly identified as fall
- # TN: true negative, non-fall event correctly not identified as fall
- # FN: false negative, fall event incorrectly identified as non-fall
3. Results
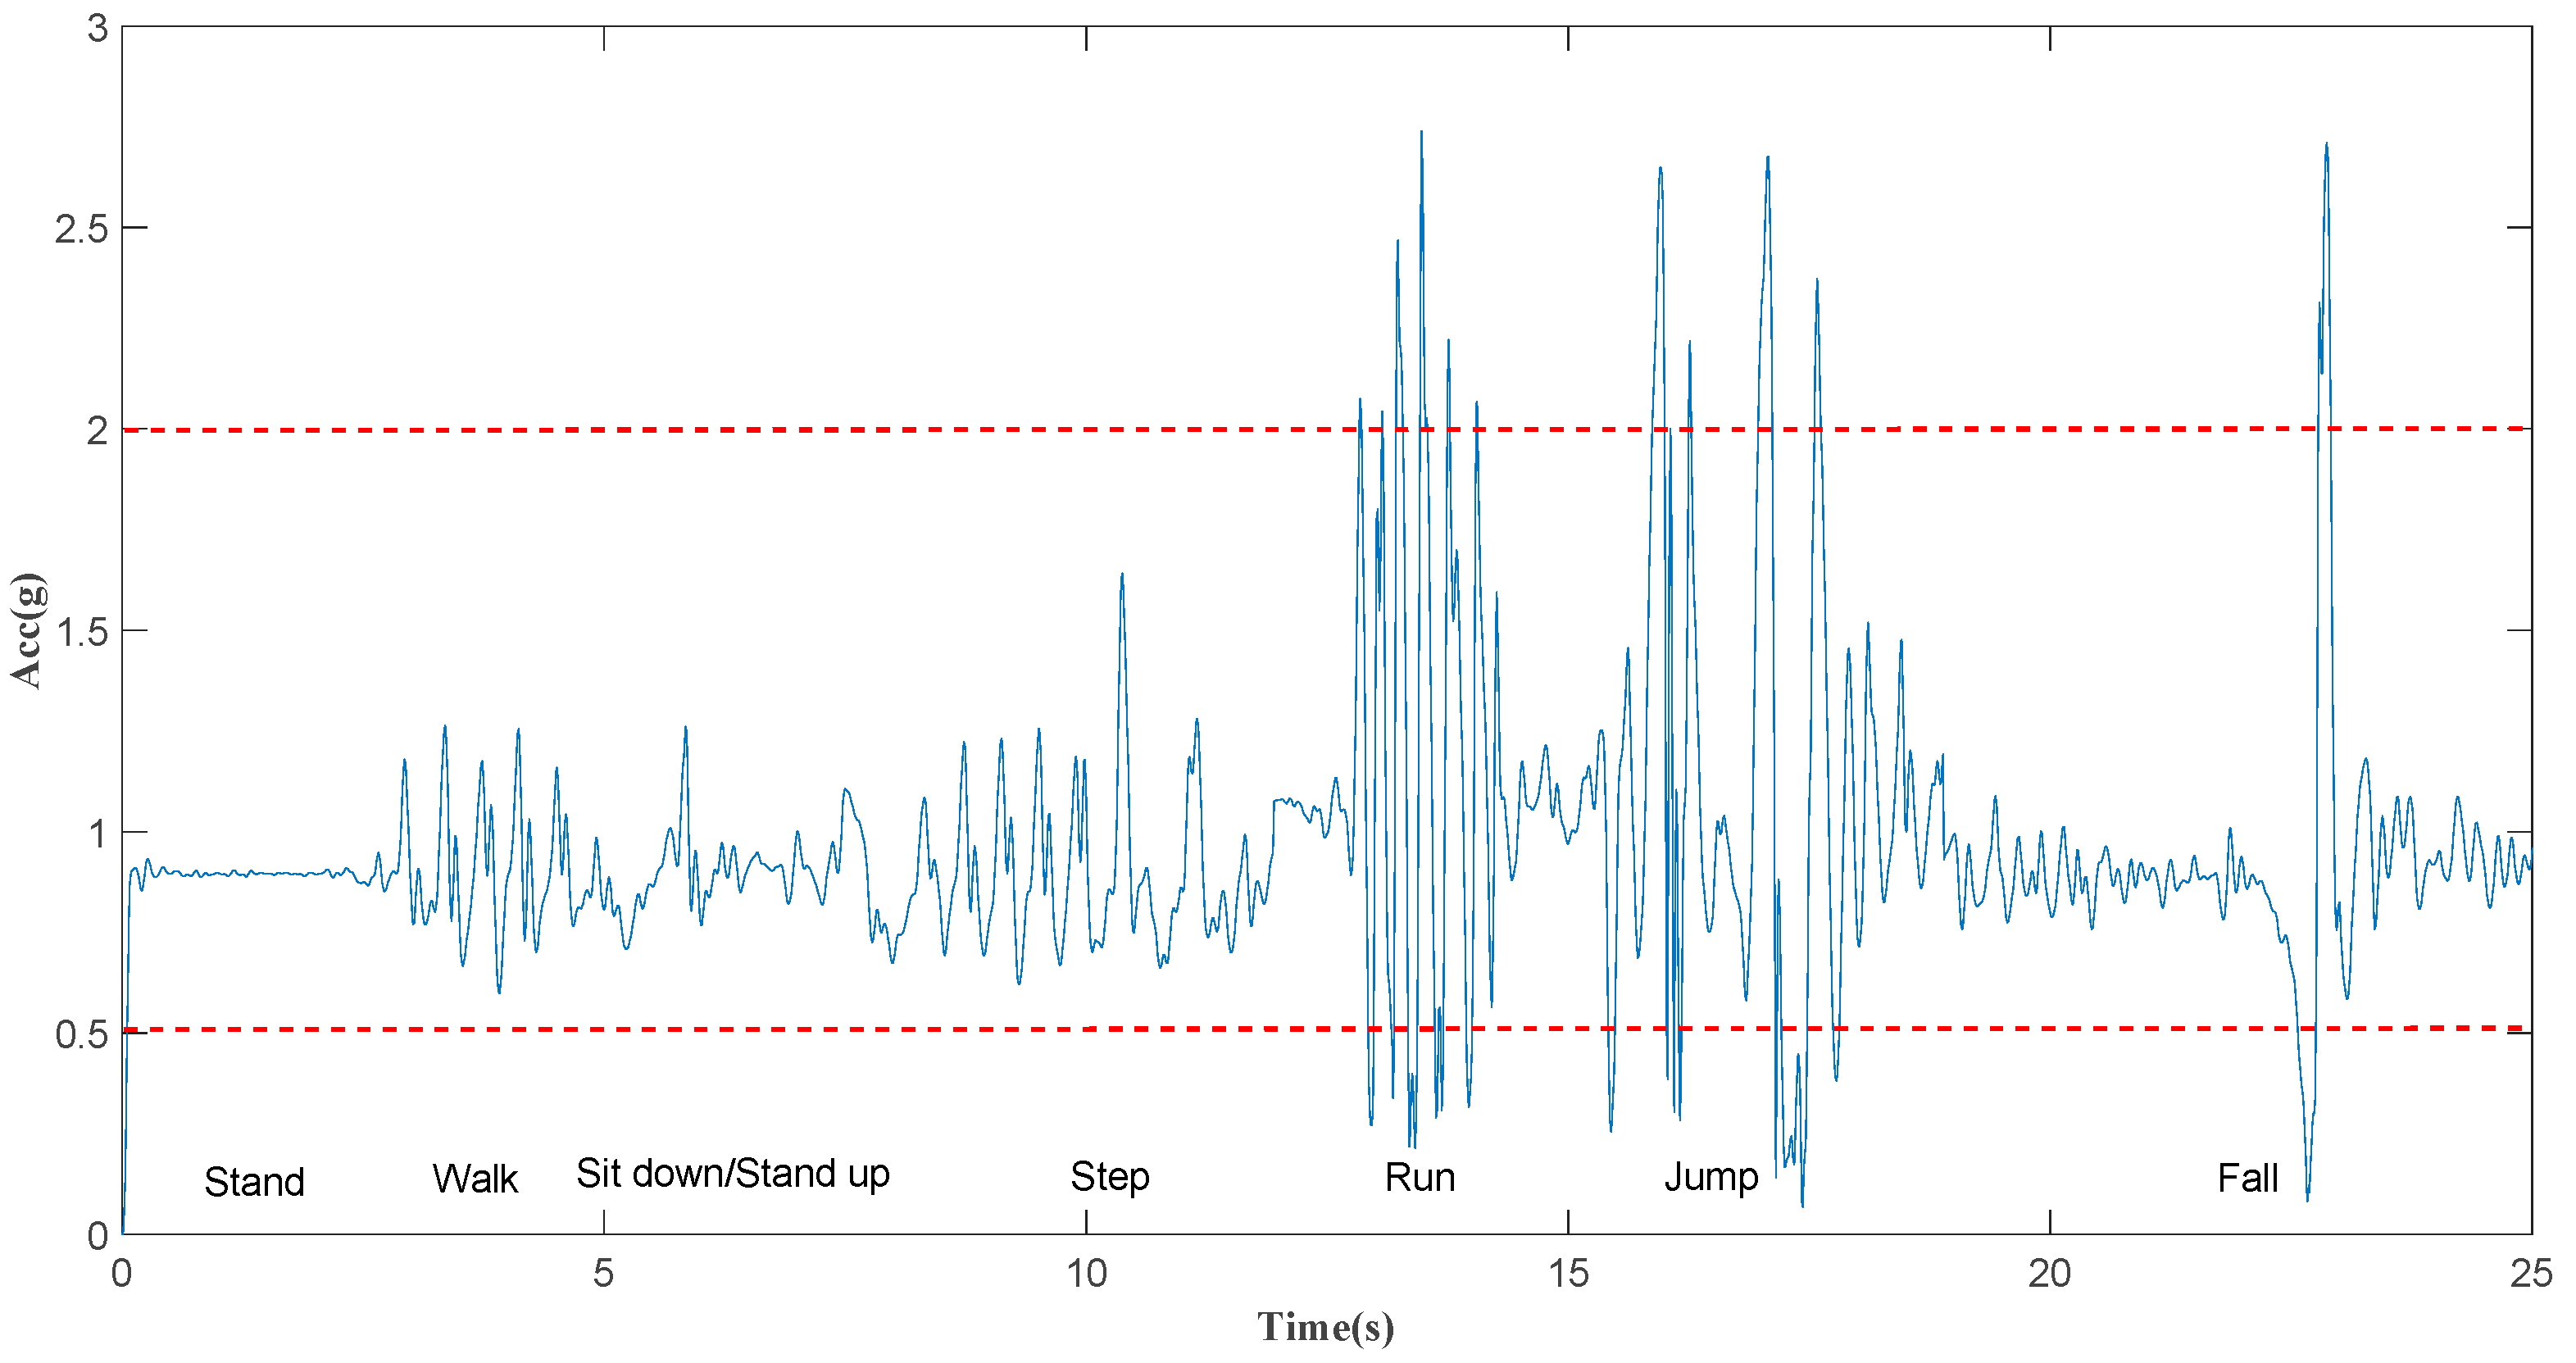
From the activities tested, a sample time-domain waveform for various activities is provided in Figure 3. These can be coarsely grouped into two categories, low-rigor (i.e., stand, walk, sit, step) and high-rigor (i.e., run, jump, falls) activities, as observed by their peak (maximum) acceleration levels in the time-domain. Further, certain activities (i.e., walking, running) exhibit periodicity which can be characterized in the frequency domain. Table 1 summarizes the time and frequency analysis results of acceleration data for all subjects. This table provides a range of peak accelerations (time domain) and peak PSD (frequency domain) for each activity across all subjects tested.
3.1. Characteristics of Low-Rigor Activities
Low-rigor activities, such as standing, walking, sitting down, standing up, lying down, sitting up, and walking up steps, had peak acceleration magnitudes between 1 to 2.1 g, whereas high-rigor activities such as jumping, running, and falls exhibited peak acceleration magnitudes from 2–5.4 g. As expected, standing resulted in 1 g (downward direction) due to gravity. Walking resulted in peak acceleration between 1.5–1.8 g and peak frequency between 2.5–3.5 Hz. Interestingly, walking up/down stairs resulted in higher peak acceleration (1.8–2.1 g) and lower peak frequencies (1.5–2.5 Hz), likely due to more careful deliberate motions compared to walking.
Biomechanically, sitting-from-stand and stand-from-sit are seemingly opposing activities, but are a result of different body motions. When sitting down, the body initially moves downward with the gravitational acceleration vector resulting in the acceleration signal decreasing below 1 g. In the second phase, the acceleration vector acts in the opposite direction to the gravitational acceleration vector and the acceleration signal returns to 1 g when the subject is seated. A stand-from-sit motion produces the reverse observation with an initial increase in acceleration followed by a decrease to 1 g. In the frequency domain, peak PSD was observed between 1–2 Hz.
Similarly, lying down and sitting-up from a lie produces low peak accelerations (1.4–1.8 g) and a wider range of peak frequencies (0.5–3 Hz) across subjects.
3.2. Characteristics of Rigorous Activities and Falls
As previously shown in Figure 3, rigorous activities such as running, jumping and falling exhibit peak acceleration ranges that overlap with one another in the time domain. Therefore, traditional thresholding-only methods for fall detection in the time-domain experience low specificity unless when thresholds are set too low. However, when these critical thresholds are raised to eliminate false positive detection, sensitivity (i.e., detection of true positives) decrease as some falls may be missed.
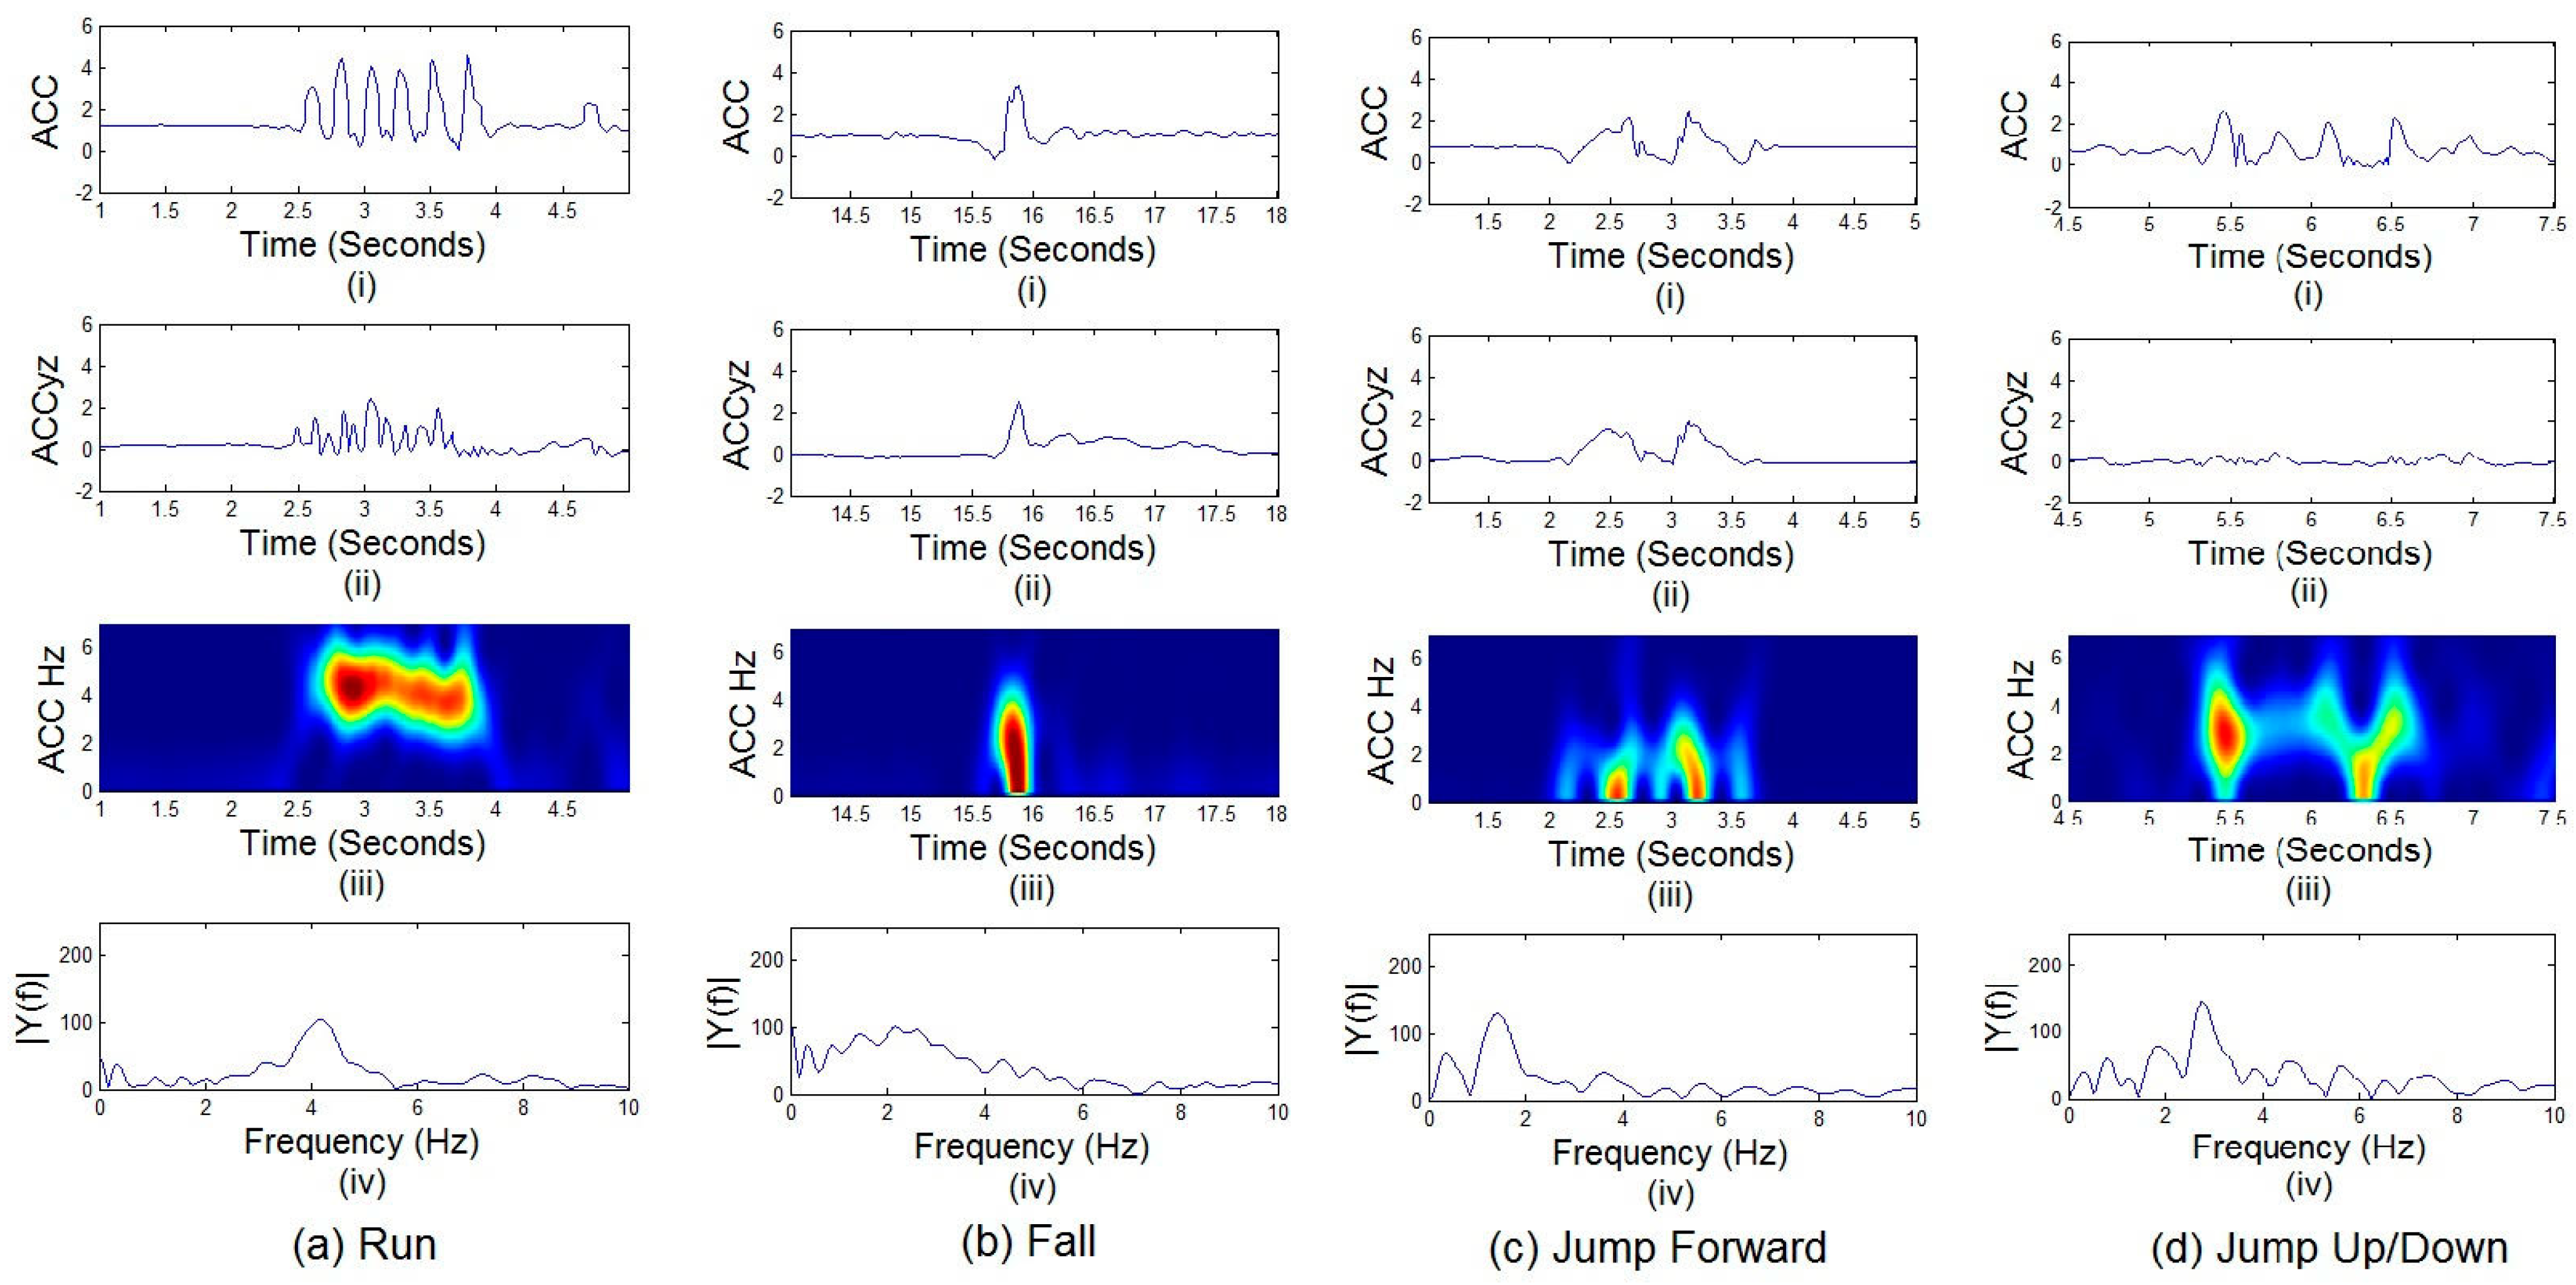
To resolve this, we perform additional analysis of the acceleration data in the frequency domain. Sample time, time-frequency, and PSD plots of the acceleration signal are shown in Figure 4 for rigorous activities. For each activity, time-domain waveforms for Acc and (Acc)yz are provided in the first and second rows, respectively. Time-frequency and PSD information are given in the third and fourth rows for each activity. These results are also summarized in Table 1.
For running, peak acceleration ranged between 2.2–2.8 g, with peak PSD ranging between 3.5–5.5 Hz. Energy spectra below 3.5 Hz were appreciably lower. For jumps occurring in the forward and vertical direction, peak acceleration was observed between 2–4 g with distinctly different peak energy ranges, 1–2 Hz for forward jump; 2.5–3.5 Hz for vertical jump). Finally, for fall events, we observed peak acceleration between 2.5–5.4 g while peak energy occurred between 2–3.5 Hz.
3.3. Fall Detection Algorithm Development
From the results of the daily activity analysis in both the time and frequency domain, we propose a hierarchical strategy to identify fall events. Following the protocol described in Section 2.1, a total of 1227 activities were collected across 36 subjects. Half the experimental dataset was used to develop and optimize the algorithm, while the other half was used for validation and accuracy testing.
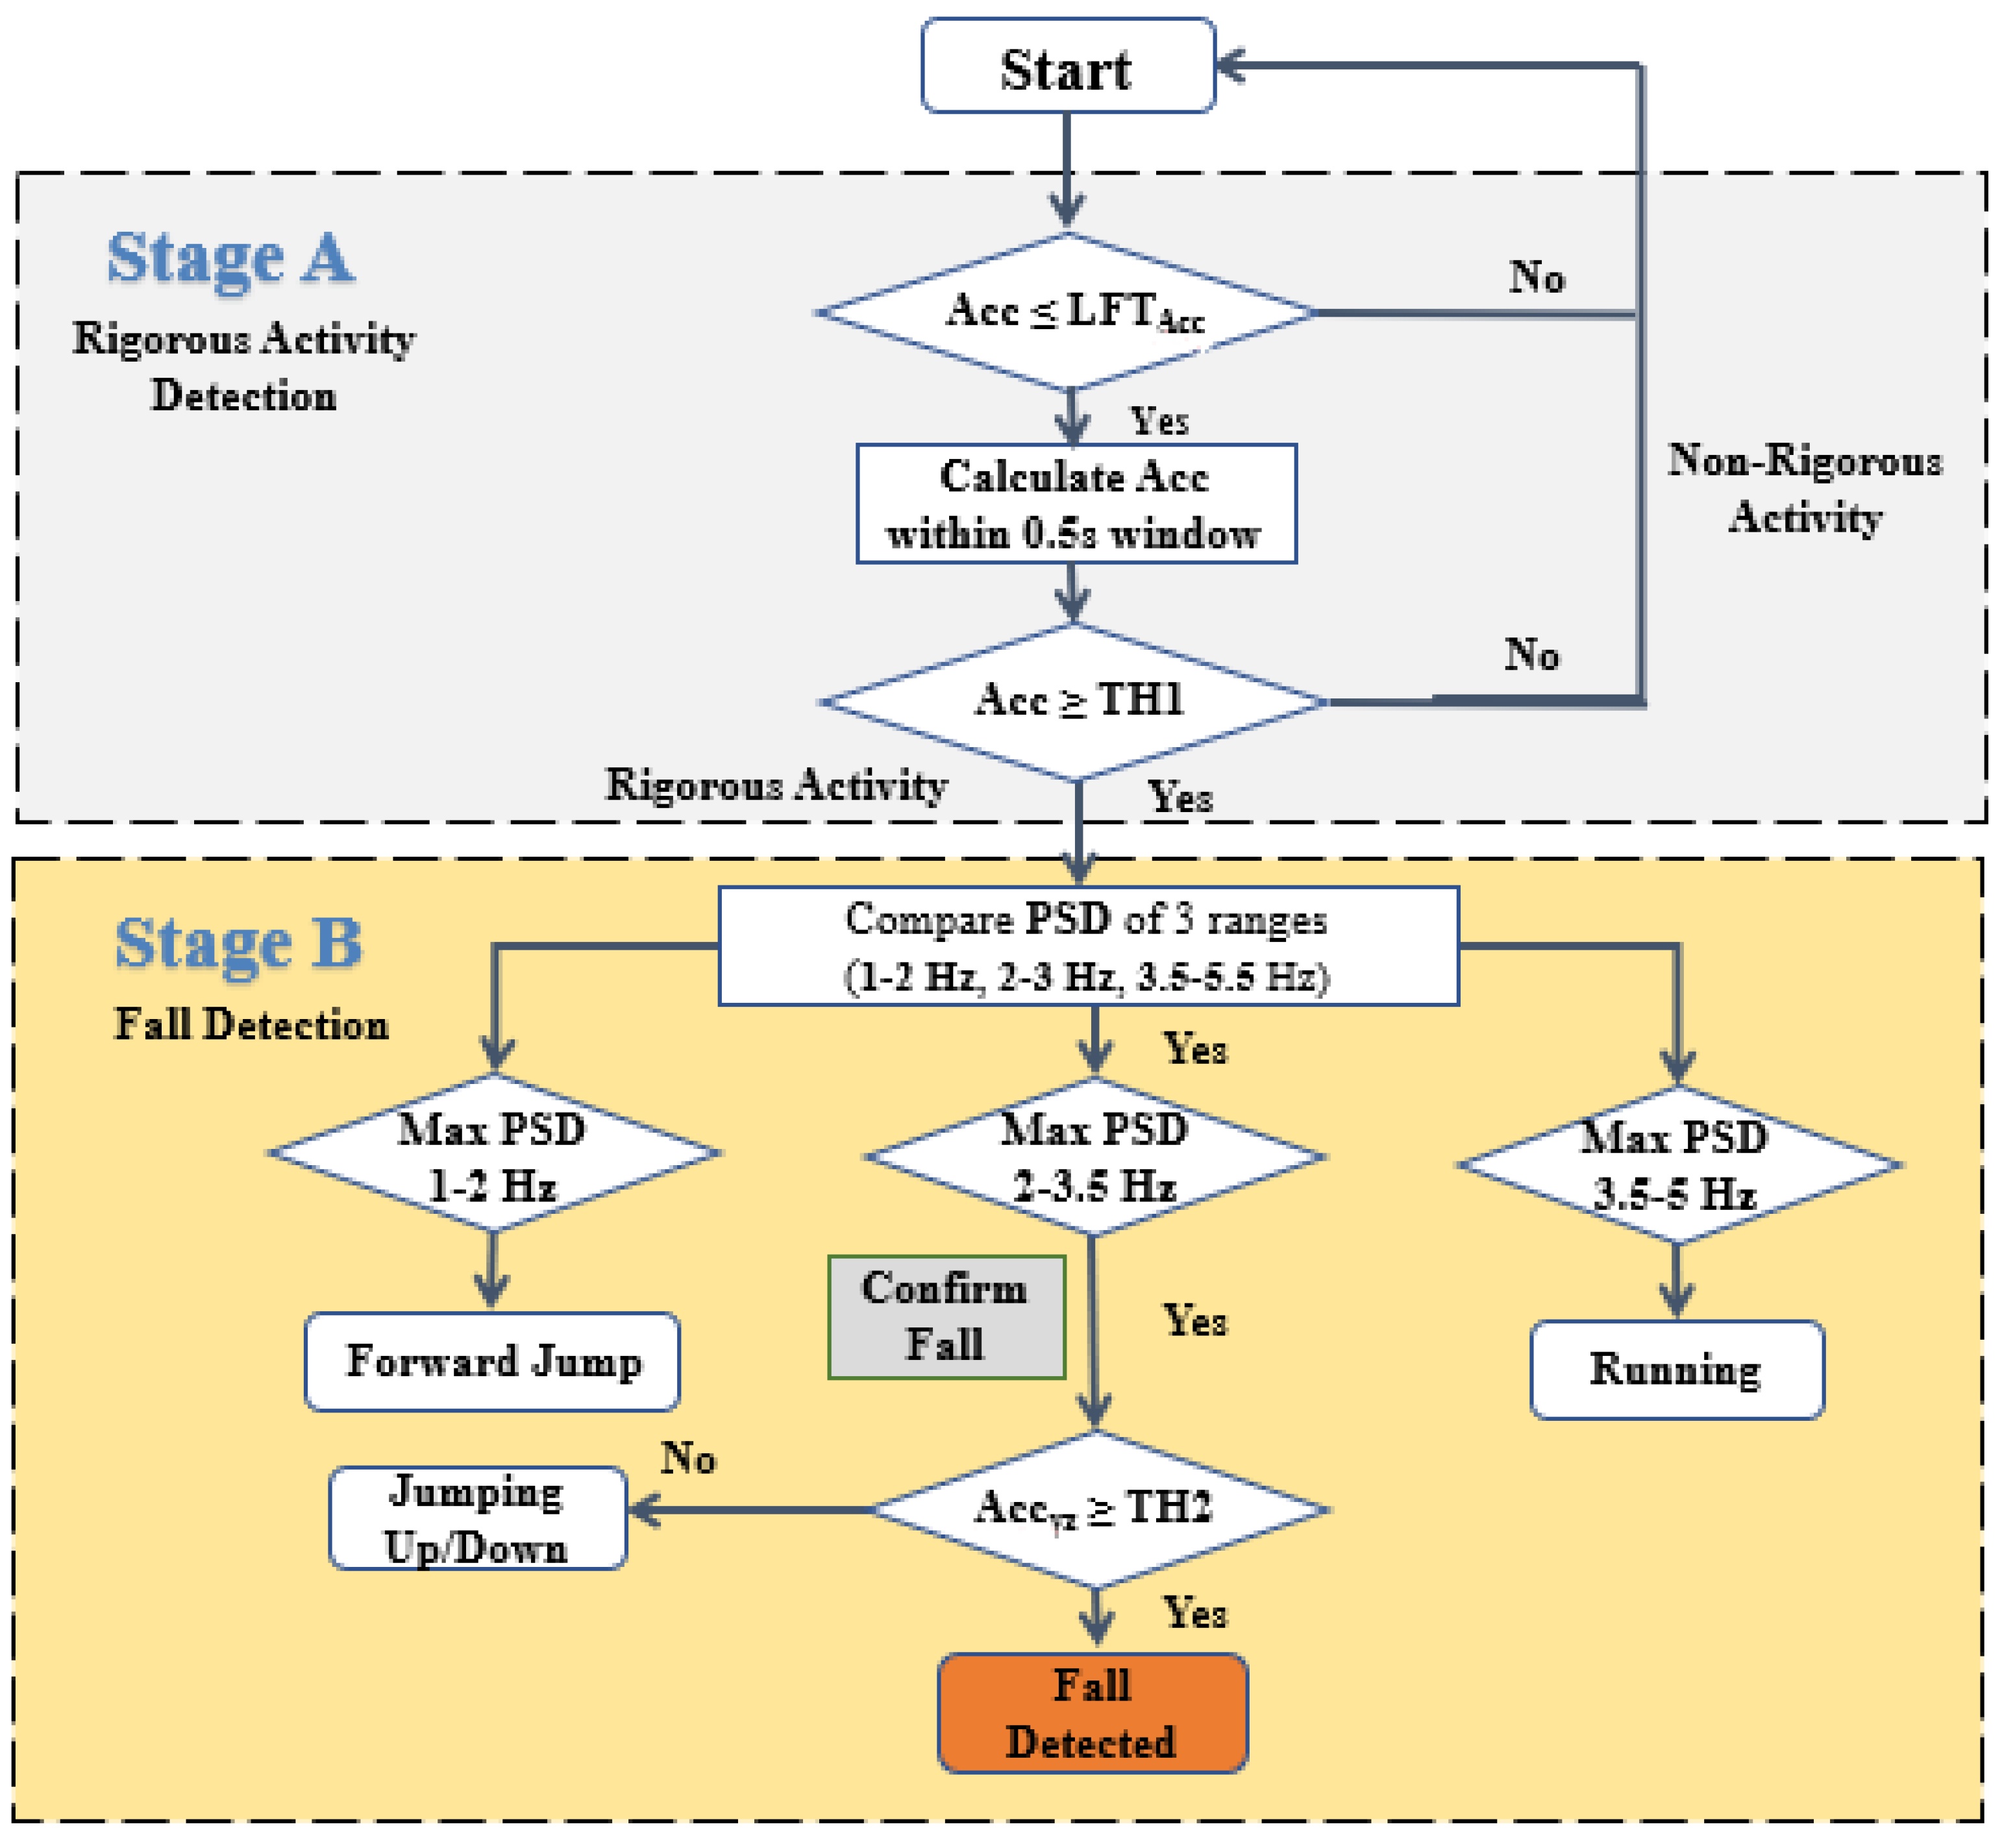
Figure 5 summarizes the proposed fall detection algorithm. Using the two-stage schema proposed in Figure 2, we differentiate between low- and high-rigor activities in the time domain (Stage A). The acceleration signal is collected and analyzed in real-time in 500 ms intervals, a period referred to as fall window [27,28]. In this window, we look to see if Acc surpasses a critical threshold, upper fall threshold (UFT), representing the fall impact. From our previous work in time-domain analyses of acceleration data, the UFT is used for TH1 in our algorithm (e.g., 2.5 g) [29].
Using only TH1 results in high fall detection, but also identification of many false positives from rigorous activities such as running and jumping (sensitivity = 97.9%; specificity = 58.6%).
As evidenced by the data in Table 1, fall events have distinct peak energy levels between 2–3.5 Hz that are distinct from other rigorous activities. To improve accuracy, we further analyze the acceleration signal in frequency domain. In Stage B, we calculate and identify the peak PSD for each activity. If the peak PSD value is not between 2–3.5 Hz, we rule out a fall occurrence. Otherwise, a potential fall may have occurred. Using this algorithm, we achieved sensitivity and specificity of 97.8% and 85.8%, respectively. Clearly, Stage B had the added benefit of improving specificity by decreasing false positive detection resulting from rigorous activities.
Further analysis of the remaining false positives show jumping (up/down) results in the same peak energy spectra as fall events. To further improve specificity, a check for sensor axes reorientation is conducted using Accyz with threshold TH2 set at 1.7 g. After fall confirmation using Accyz, sensitivity and specificity were 97.3% and 98.3%, respectively. Specificity is further improved with this additional step.
3.4. Fall Algorithm Testing & Validation
To evaluate the algorithm’s performance, a confusion matrix is used to summarize the results. Table 2 provides a confusion matrix for half the dataset use for optimizing the algorithm (i.e., determining key thresholds, etc.). Falls were accurately detected with only seven falls incorrectly classified out of 261 fall events (sensitivity = 97.3%). Similarly, daily activities (i.e., standing, sitting, stepping, running, jumping or lying) were accurately recognized with only six misclassified as fall out of 357 daily activities (specificity = 98.3%).
Once critical thresholds for the algorithm were optimized, the remaining half of the dataset was used to validate the developed algorithm. Table 3 provides a summary of this validation analysis. Only four out of 254 falls were not detected (sensitivity = 98.4%) and only five out of 355 daily activities were identified as falls (specificity = 98.6%).
4. Discussion
Tolkiehn et al. [30] reported results of accelerometer-based algorithm to detect falls of 83.3% sensitivity and 79.1% specificity in experimental studies. Chen et al. [31] developed similar studies achieving 94% specificity, but with low sensitivity (76%). Bourke and colleagues [32] recently proposed an algorithm that provides a good trade-off both in terms of sensitivity (83%) and specificity (97%). Other studies using accelerometer-only thresholding algorithms in the time-domain report similar sensitivity (>85%) and specificities (88–94%) [3,4,5]. Accuracy of these algorithms is affected by peak accelerations of many rigorous activities overlapping with those achieved during a fall event. To achieve higher sensitivity (i.e., reduction of false positives), one must increase the threshold levels (UFT) for fall detection. However, when this occurs, specificity, the detection of false positive fall events increases. In fall detection applications, these false positives may lead to increase alerts to first responders and caregivers creating increase burden on health care systems. Clearly, peak acceleration in the time-domain is an insufficient feature to classify a fall event accurately.
Other investigators have attempted to increase fall detection accuracy using additional sensors (i.e., gyroscope, pressure sensor, tilt sensors) to detect biomechanical movement and posture during falls. Our previous work utilized a combined accelerometer and gyroscope strategy to increase sensitivity and specificity by additionally measuring peak body rotation during fall events. With the addition of a gyroscope, we achieved high sensitivity (96.5%) and specificity (97.4%). However, the additional sensors proposed by us and others come with additional drawbacks including sensor costs, power consumption, storage requirements, and size. For wearable devices, many of these drawbacks may be sufficient to affect usability and practicality of these systems in real-world applications.
In several recent studies, frequency features are used as input for machine learning strategies to improve fall detection accuracy. Eyobu et al. [10] developed Deep Long Term Short Term Memory (LSTM) neural network architecture to classify falls with 88.7% accuracy. Mauldin et al. [11] used time and frequency domain features to train a deep learning network achieving 86% overall accuracy. With three deep learning models, Convolutional Neural Network (CNN), LSTM, and combination of these two models, Aicha et al. [6] was able to improve fall detection accuracy to approximately 94%. Use of Recurrent Neural Network is presented in [10,33] with accuracy of 98.57%. Despite machine learning algorithms outperforming alternative techniques, they still have several limitations that are not conducive to deployment in wearable systems. They require a large amount of computing resources, cannot respond in real time, and are difficult to deploy in wearable devices that require small form factors, high data storage and low power consumption in order to improve user acceptance and usability.
Compared to prior algorithms, the uniqueness of the time-frequency approach proposed is that it utilizes only one sensor (i.e., accelerometer) and can be easily implemented in wearable sensor systems without suffering in system accuracy. Sensitivity (98.4%) and specificity (98.6%) are improved compared to even our prior multisensor (i.e., accelerometer plus gyroscope) approach. Analysis of the accelerometer signal in the frequency domain provides additional key features differentiating falls from other rigorous events.
Validation performed using a blinded dataset demonstrates the effectiveness of the proposed hierarchical time-frequency approach in accurately detecting falls from other daily activities. False alarm rate of the system was low (4/250 for false negative and 5/350 for false positive). In addition, this strategy can be extended to develop algorithms for classification of different daily activities.
One key limitation of this study is that for practical and safety reasons, testing was conducted only on young, healthy subjects who performed scripted activities in a laboratory setting. These subjects may not reflect actual data in elderly individuals. Further, actual activities in real-world settings may be quite different from simulated, laboratory tests. Therefore, the threshold values of the real condition may be different.
5. Conclusions
Many existing fall detection systems and algorithms are based upon accelerometry measures and have been investigated in previous studies. However, many of these strategies are unable to accurately differentiate between rigorous activities and falls as critical peak acceleration threshold values overlap. This work expands upon prior efforts by us and others to increase sensitivity and specificity of fall detection algorithms by proposing a hierarchical approach utilizing both time and frequency analyses of accelerometer data.
This research effort demonstrates that the frequency domain may provide additional key features useful for improving reliability and accuracy of fall detection strategies. This work characterizes critical time-domain and frequency-domain parameters and uses these parameters to develop a reliable fall detection algorithm. Validation of this algorithm demonstrates the improved sensitivity and specificity of fall detection over prior work by others using time-domain accelerometer-only strategies as well as multisensor approaches to fall detection. The inclusion of frequency-based information can reduce false positives from more rigorous activities.
Future development will evaluate the proposed time-frequency fall detection algorithm on existing fall databases such as those identified by Calisari and colleagues [34,35]. Additional efforts will investigate a system to include GPS and Internet of Things (IoT) strategies for alerting and communicating with external caregivers, both formal and informal. Additionally, effective fall detection may serve as a precursor to implementation of a fall injury mitigation system that can activate safety devices that may minimize injury to fallers.
Author Contributions
Q.T.H. and B.Q.T. contributed to project conceptualization, data collection, algorithms development, data analysis and writing of this manuscript. All authors have read and agreed to the published version of the manuscript.
Funding
This research received no external funding.
Institutional Review Board Statement
The study was conducted according to the guidelines of the Declaration of Helsinki and approved by the Institutional Review Board (or Ethics Committee) of The Catholic University of America (protocol #160938; approved 03/27/17).
Informed Consent Statement
Informed consent was obtained from all subjects involved in the study.
Data Availability Statement
The data presented in this study are available on request from the corresponding author. The data are not publicly available due to author’s continuing analysis of the collected data.
Conflicts of Interest
The authors declare no conflict of interest.
References
- Hwang, J.Y.; Kang, J.M.; Kim, H.C. Development of novel algorithm and real-time monitoring ambulatory system using Bluetooth module for fall detection in the elderly. In Proceedings of the Engineering in Medicine and Biology Society, 26th Annual International Conference of the IEEE, San Francisco, CA, USA, 1–5 September 2004. [Google Scholar]
- Huynh, Q.T.; Nguyen, U.D.; Tran, S.V.; Nabili, A.; Tran, B.Q. Fall detection using combination accelerometer and gyroscope. In Proceedings of the International Conference on Advances in Electronics Devices and Circuits-EDC 2013, Kuala Lumpur, Malaysia, 4–5 May 2013. [Google Scholar]
- Lindeann, U.; Hock, A.; Stuber, M.; Keck, W.; Becker, C. Evaluation of a fall detector based on accelerometers: A pilot study. Med. Biol. Eng. Comput. 2005, 43, 548–551. [Google Scholar] [CrossRef]
- Kangas, M.; Konttila, A.; Lindgren, P.; Winblad, I.; Jämsä, T. Comparison of low-complexity fall detection algorithms for body attached accelerometers. Gait Posture 2008, 35, 500–505. [Google Scholar] [CrossRef]
- Kim, I.-J.; Im, S.; Hong, E.; Ahn, S.C.; Kim, H.-G. ADL classification using triaxial accelerometers and RFID. In Proceedings of the International Conference on Ubiquitous Computing Convergence Technology, Seoul, Korea, 26–28 April 2007. [Google Scholar]
- Aicha, A.N.; Englebienne, G.; Schooten, K.S.; Pijnappels, M.; Kröse, B. Deep learning to predict falls in older adults based on daily-life trunk accelerometry. Sensors 2018, 18, 1654. [Google Scholar] [CrossRef] [PubMed] [Green Version]
- Chernbumroong, S.; Atkins, A.S.; Yu, H. Activity classification using a single wrist-worn acceleration. In Proceedings of the IEEE International Conference on Software, Knowledge, Information Management and Application, Benevento, Italy, 6–7 August 2011. [Google Scholar]
- Janidarmian, M.; Radecka, K.; Zilic, Z. Analysis of Motion Patterns for Recognition of Human Activities. In Proceedings of the 2015 ACM 5th International Conference on Wireless Mobile Communication and Healthcare, London, UK, 14–16 October 2015; pp. 68–72. [Google Scholar]
- Shoaib, M.; Scholten, J.; Havinga, P.J.M. Towards physical activity recognition using smartphone sensors. In Proceedings of the 10th IEEE International Conference on Ubiquitous Intelligence and Computing, Vietri sul Mere, Italy, 18–21 December 2013; pp. 80–87. [Google Scholar]
- Eyobu, O.S.; Han, D.S. Feature Representation and Data Augmentation for Human Activity Classification Based on Wearable IMU Sensor Data Using a Deep LSTM Neural Network. Sensors 2018, 18, 2892. [Google Scholar] [CrossRef] [Green Version]
- Mauldin, T.R.; Canby, M.E.; Metsis, V.; Ngu, A.H.H.; Rivera, C.C. SmartFall: A Smartwatch-Based Fall Detection System Using Deep Learning. Sensors 2018, 18, 3363. [Google Scholar] [CrossRef] [PubMed] [Green Version]
- Zhang, T.; Wang, J.; Xu, L.; Liu, P. Fall Detection by Wearable Sensor and One-Class SVM. In Intelligent Computing in Signal Processing and Pattern Recognition; Huang, D.S., Li, K., Irwin, G.W., Eds.; Lecture Notes in Control and Information Sciences; Springer: Berlin/Heidelberg, Germany, 2006; Volume 345. [Google Scholar]
- Santoyo-Ramón, J.; Casilari, E.; Cano-García, J. Analysis of a smartphone-based architecture with multiple mobility sensors for fall detection with supervised learning. Sensors 2018, 18, 1155. [Google Scholar] [CrossRef] [PubMed] [Green Version]
- Ganti, R.K.; Jayachandran, P.; Abdelzaher, T.; Stankovic, J. SATIRE: A software architecture for smart AtTIRE. Proc. Mobisys 2006, 6. [Google Scholar] [CrossRef]
- Arif, M.; Kattan, A. Physical activities monitoring using wearable acceleration sensors attached to the body. PLoS ONE 2015, 10, e0130851. [Google Scholar] [CrossRef] [PubMed] [Green Version]
- Tan, T.D.; Tinh, N.V. Reliable fall detection system using an 3-DOF accelerometer and cascade posture recognitions. In Proceedings of the APSIPA Annual Summit and Conference, Angor Wat, Cambodia, Krong Siem Reap, Cambodia, 9–12 December 2014. [Google Scholar]
- Durrant-Whyte, H.; Roy, N.; Abbeel, P. Lying pose recognition for elderly fall detection. In Robotics: Science and Systems VII; MIT Press: Cambridge, MA, USA, 2012; pp. 345–353. [Google Scholar]
- Huynh, Q.T.; Nguyen, U.D.; Tran, S.V.; Tran, B.Q. Optimum location for sensors in fall detection. In Proceedings of the International Conference on Green and Human Information Technology, Hanoi, Vietnam, 12–14 February 2013. [Google Scholar]
- Liu, Q.; Williamson, J.; Li, K.; Mohrman, W.; Lv, Q.; Dick, R.P.; Shang, L. Gazelle: Energy-efficient wearable analysis for funning. IEEE Trans Mob. Comput. 2017, 16, 2531–2544. [Google Scholar] [CrossRef]
- Attal, F.; Mohammed, S.; Dedabrishvili, M.; Chamroukhi, F.; Oukhellou, L.; Amirat, Y. Physical human activity recognition using wearable sensors. Sensors 2015, 15, 31314–34338. [Google Scholar] [CrossRef] [PubMed] [Green Version]
- Figo, D.; Diniz, P.C.; Ferreira, D.R.; Cardoso, J.M.P. Preprocessing techniques for context recognition from accelerometer data. Pers. Ubiquitous Comput. 2010, 14, 645–662. [Google Scholar] [CrossRef]
- Nham, B.; Siangliulue, K.; Yeung, S. Predicting Mode of Transport from iPhone Accelerometer Data. In Technical Report; Stanford University: Stanford, CA, USA, 2008. [Google Scholar]
- Sharma, A.; Purwar, A.; Lee, Y.D.; Lee, Y.S.; Chung, W.Y. Frequency based classification of activities using accelerometer data. In Proceedings of the IEEE International Conference on Multisensor Fusion and Integration for Intelligent Systems, Seoul, Korea, 20–22 August 2008. [Google Scholar]
- Bersch, S.D.; Chislett, C.M.J.; Azzi, D.; Khusainov, R.; Briggs, J.S. Activity detection using frequency analysis and off-the-shelf devices: Fall detection from accelerometer data. In Proceedings of the 5th International Conference on Pervasive Computing Technologies for Healthcare (PervasiveHealth) and Workshops, Dublin, Ireland, 23–26 May 2011; pp. 362–365. [Google Scholar]
- Shin, I.; Son, J.; Ahn, S.; Ryu, J.; Park, S.; Kim, J.; Cha, B.; Choi, E.; Kim, Y. A novel short-time Fourier Transform-based fall detection algorithm using 3-axis accelerations. Math. Probl. Eng. 2015, 2015, 394340. [Google Scholar] [CrossRef] [Green Version]
- Klenk, J.; Becker, C.; Lieken, F.; Nicolai, S.; Maetzler, W.; Alt, W.; Zijlstra, W.; Hausdorff, J.M.; van Lummel, R.C.; Chiari, L.; et al. Comparison of acceleration signals of simulated and real-world backward falls. Med Eng. Phys. 2010, 33, 368–373. [Google Scholar] [CrossRef] [PubMed]
- Ibrahim, A.; Younis, M.I. Simple fall criteria for MEMS sensors: Data analysis and sensor concept. Sensors 2014, 14, 12149–12173. [Google Scholar] [CrossRef] [PubMed] [Green Version]
- Popescu, M.; Hotrabhavananda, B.; Moore, M.; Skubic, M. VAMPIR—An automatic fall detection system using a vertical PIR sensor array. In Proceedings of the 6th International Conference on Pervasive Computing Technologies for Healthcare (PervasiveHealth ‘12), San Diego, CA, USA, 21–24 May 2012; pp. 163–166. [Google Scholar]
- Huynh, Q.T.; Nguyen, U.D.; Irazabal, L.B.; Ghassemian, N.; Tran, B.Q. Optimization of an accelerometer and gyroscope-based fall detection algorithm. J. Sens. 2015, 2015, 452078. [Google Scholar] [CrossRef] [Green Version]
- Tolkiehn, M.; Atallah, L.; Lo, B.; Yang, G.-Z. Direction sensitive fall detection using a triaxial accelerometer and a barometric pressure sensor. In Proceedings of the Annual International Conference of the IEEE Engineering in Medicine and Biology Society, Boston, MA, USA, 30 August–3 September 2011; Volume 211, pp. 369–372. [Google Scholar]
- Chen, J.; Kwong, K.; Chang, D.; Luk, J.; Bajcsy, R. Wearable sensors for reliable fall detection. In Proceedings of the Annual International Conference Proceedings IEEE Engineering in Medicine and Biology Society, Shanghai, China, 17–18 January 2006; pp. 3551–3554. [Google Scholar]
- Bourke, A.K.; van de Ven, P.; Gamble, M.; O’Connor, R.; Murphy, K.; Bogan, E.; McQuade, E.; Finucane, P.; Laigin, G.O.; Nelson, J. Evaluation of waist-mounted tri-axial accelerometer based fall-detection algorithms during scripted and continuous unscripted activities. J. Biomech. 2010, 43, 3051–3057. [Google Scholar] [CrossRef] [PubMed]
- Theodoridis, T.; Solachidis, V.; Vretos, N.; Daras, P. Human fall detection from acceleration measurements using a recurrent neural network. Precis. Med. Powered pHealth Connect. Health 2018, 145–149. [Google Scholar] [CrossRef] [Green Version]
- Casilari, E.; Santoyo-Ramón, J.-A.; Cano-García, J.-M. Analysis of public datasets for wearable fall detection systems. Sensors 2017, 17, 1513. [Google Scholar] [CrossRef] [PubMed] [Green Version]
- Casilari, E.; Lora-Rivera, R.; García-Lagos, F. A study on the application of convolutional neural networks to fall detection evaluated with multiple public datasets. Sensors 2020, 20, 1466. [Google Scholar] [CrossRef] [PubMed] [Green Version]
Figure 1.
Body and sensor orientation.

Figure 2.
Fall detection schema. Stage A analyzes acceleration data in the time domain. Stage B uses frequency domain analysis to differentiate fall events from other high impact activities.
Figure 2.
Fall detection schema. Stage A analyzes acceleration data in the time domain. Stage B uses frequency domain analysis to differentiate fall events from other high impact activities.

Figure 3.
Sample acceleration waveform for various daily activities. Peak accelerations for rigorous activities (i.e., run, jump, falls) overlap. Red lines indicate critical upper fall (UFT) and lower fall thresholds (LFT) typically used for fall detection. Peak accelerations for low-rigor activities such as standing, walking, sitting down/standing up from a chair are well below UFT and LFT thresholds.

Figure 4.
Display of Acc (row 1), Accyz (row 2), spectrogram of Acc (row 3), and power spectral density (PSD) of Acc (row 4). Each column represents different rigorous activities such as (a) running, (b) falling, (c) jumping forward, and (d) jumping up/down.
Figure 4.
Display of Acc (row 1), Accyz (row 2), spectrogram of Acc (row 3), and power spectral density (PSD) of Acc (row 4). Each column represents different rigorous activities such as (a) running, (b) falling, (c) jumping forward, and (d) jumping up/down.

Figure 5.
Fall detection algorithm. Stage A is performed in the time domain with Stage B in the frequency domain.
Figure 5.
Fall detection algorithm. Stage A is performed in the time domain with Stage B in the frequency domain.


Table 1.
Summary of acceleration data for various activities in the time and frequency domains.
| Activities | Peak Acceleration (g) | Frequency Range (Hz) | |
|---|---|---|---|
| Low-rigor Activities | Standing | 1 | - |
| Walking | 1.5–1.8 | 2.5–3.5 | |
| Sitting down/Standing up | 1.6–2.0 | 1–2 | |
| Lying down/sitting up | 1.4–1.8 | 0.5–3 | |
| Stepping | 1.8–2.1 | 1.5–2.5 | |
| High-rigor Activities | Running | 2.2–2.8 | 3.5–5.5 |
| Jumping forward | 2.0–4.0 | 1–2 | |
| Jumping up/down | 2.0–4.0 | 2.5–3.5 | |
| Falling | 2.5–5.4 | 2–3.5 |
Table 2.
Confusion matrix for algorithm development and optimization dataset.
| Detected | |||
|---|---|---|---|
| Fall | Daily Activities | ||
| Actual | Fall (n = 261) | 254 | 7 |
| Daily activities (n = 357) | 6 | 351 | |
Table 3.
Confusion matrix for validation dataset.
| Detected | |||
|---|---|---|---|
| Fall | Daily Activities | ||
| Actual | Fall (n = 254) | 250 | 4 |
| Daily activities (n = 355) | 5 | 350 | |
Publisher’s Note: MDPI stays neutral with regard to jurisdictional claims in published maps and institutional affiliations. |
© 2021 by the authors. Licensee MDPI, Basel, Switzerland. This article is an open access article distributed under the terms and conditions of the Creative Commons Attribution (CC BY) license (http://creativecommons.org/licenses/by/4.0/).
Share and Cite
MDPI and ACS Style
Huynh, Q.T.; Tran, B.Q. Time-Frequency Analysis of Daily Activities for Fall Detection. Signals 2021, 2, 1-12. https://0-doi-org.brum.beds.ac.uk/10.3390/signals2010001
AMA Style
Huynh QT, Tran BQ. Time-Frequency Analysis of Daily Activities for Fall Detection. Signals. 2021; 2(1):1-12. https://0-doi-org.brum.beds.ac.uk/10.3390/signals2010001
Chicago/Turabian StyleHuynh, Quoc T., and Binh Q. Tran. 2021. "Time-Frequency Analysis of Daily Activities for Fall Detection" Signals 2, no. 1: 1-12. https://0-doi-org.brum.beds.ac.uk/10.3390/signals2010001