Ultrasonic Guided Wave Signal Based Nondestructive Testing of a Bonded Composite Structure Using Piezoelectric Transducers


Abstract
:1. Introduction
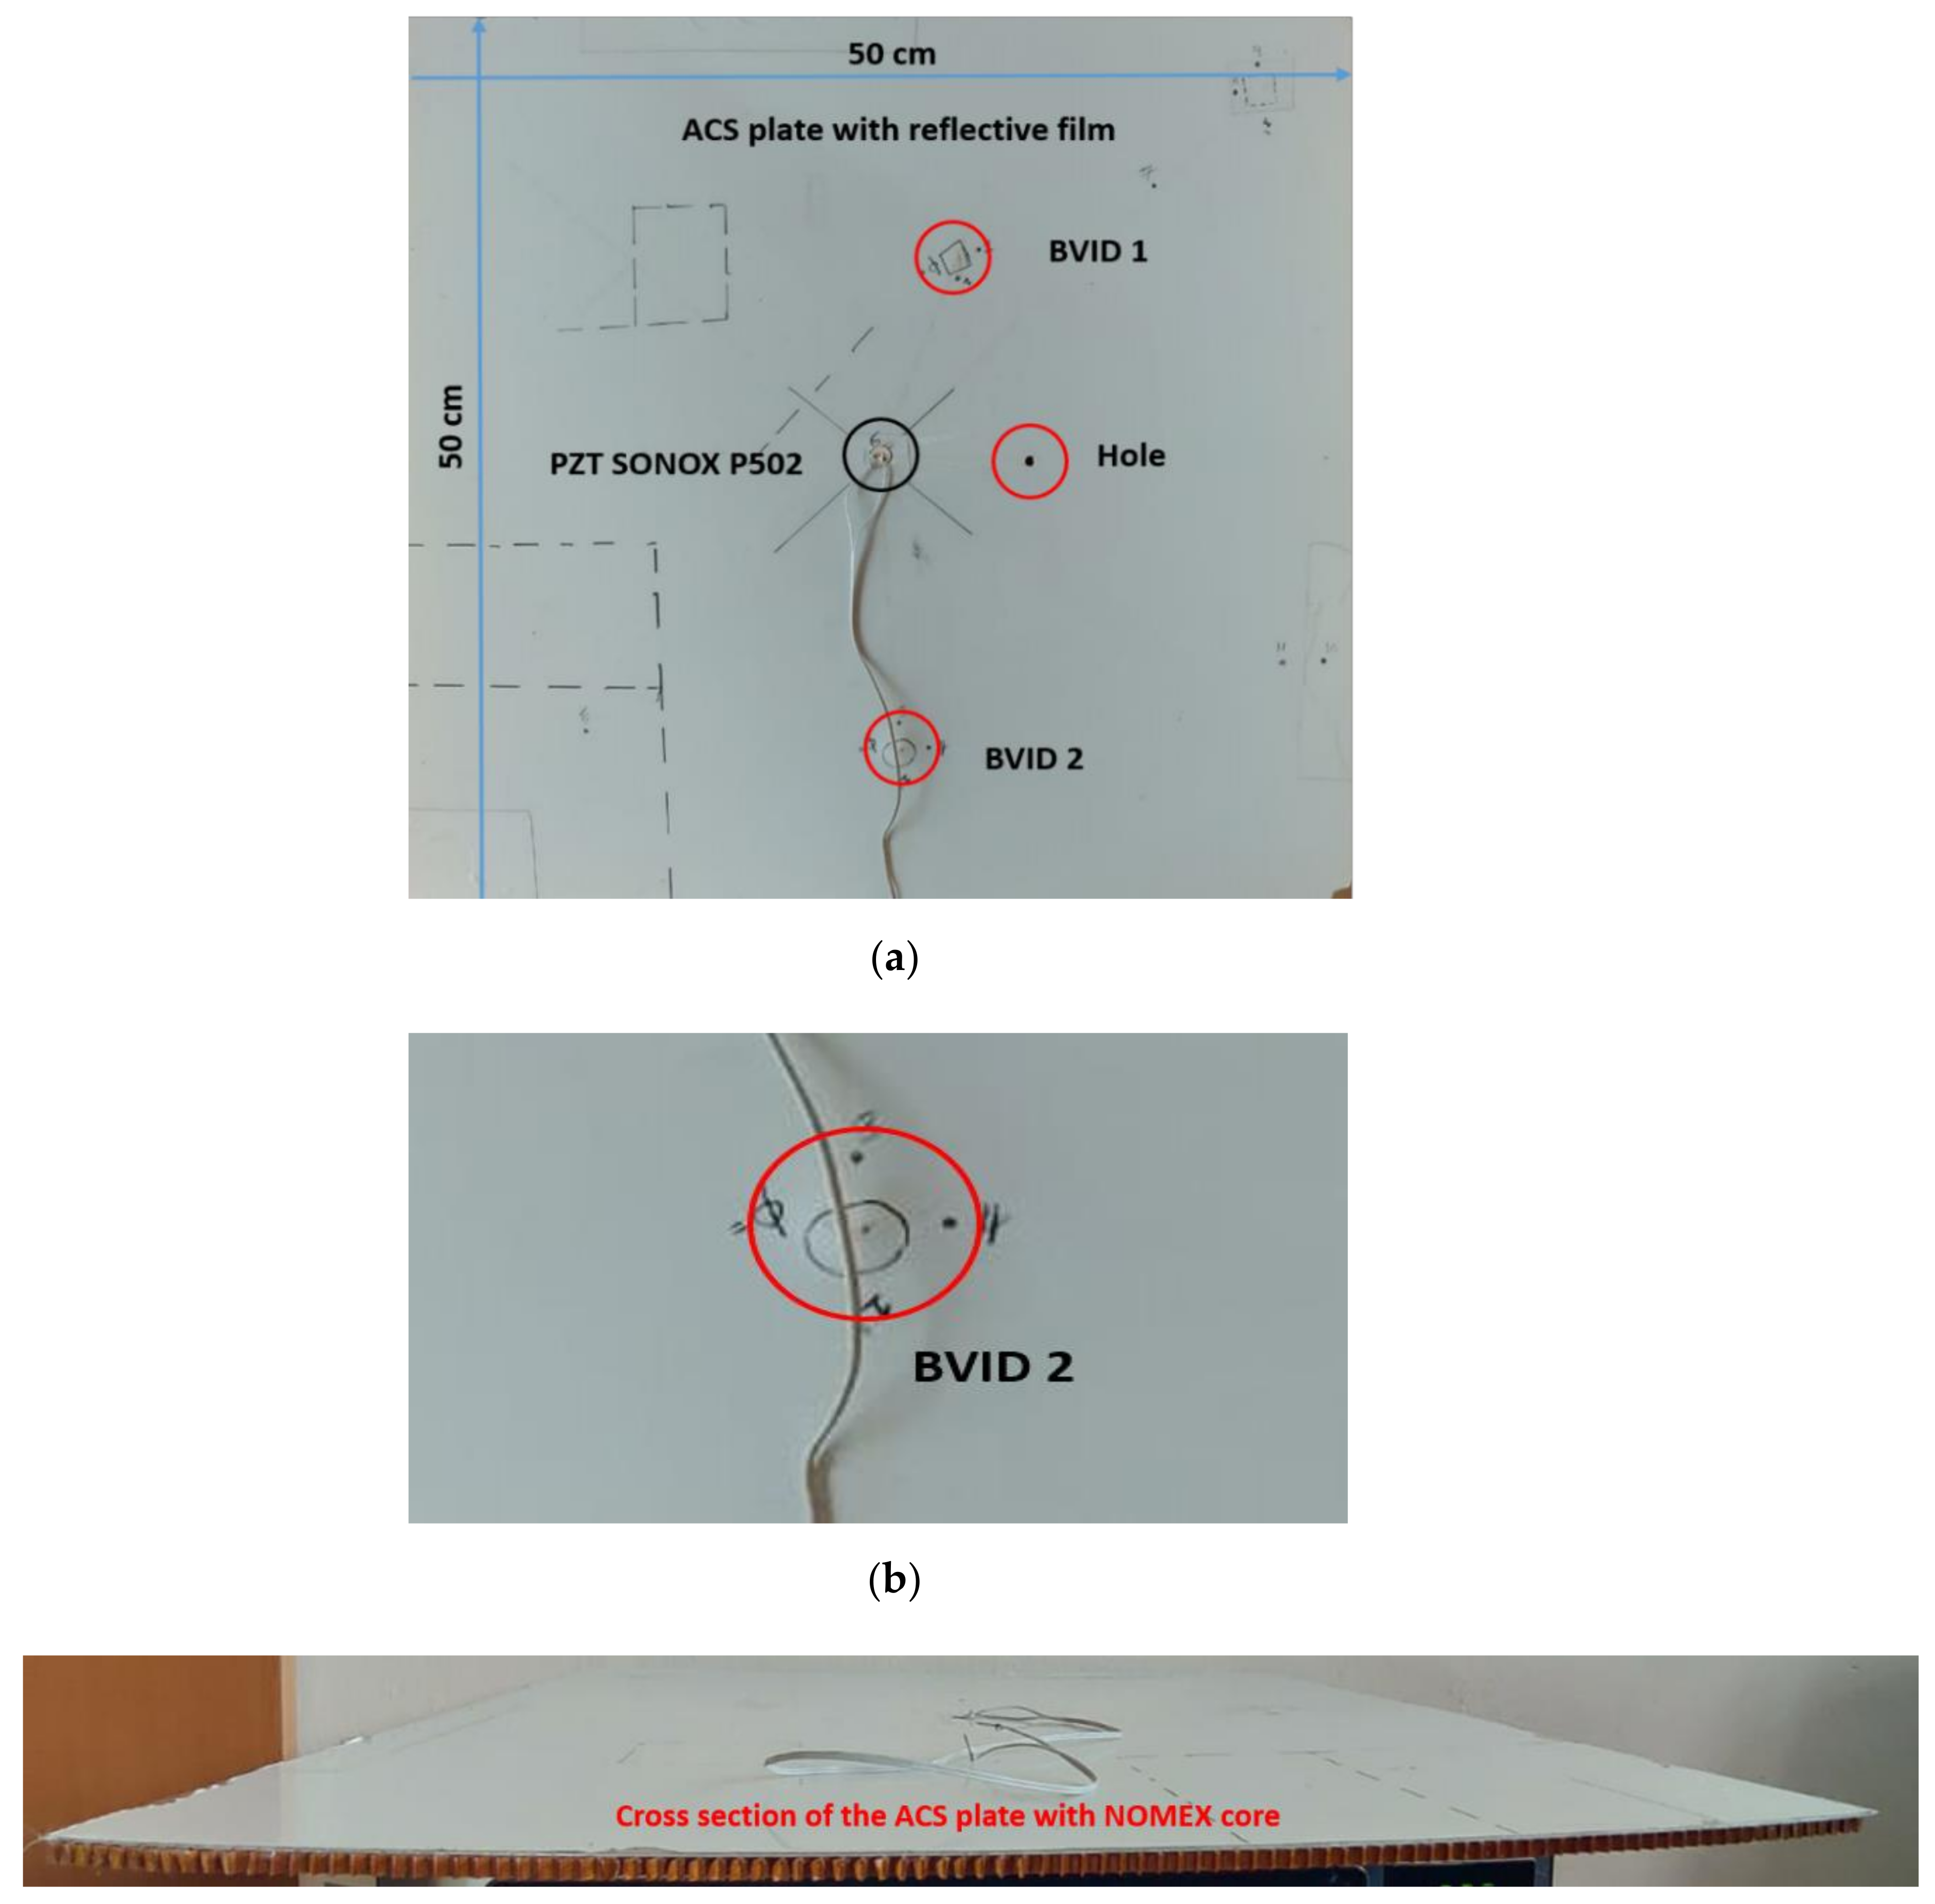
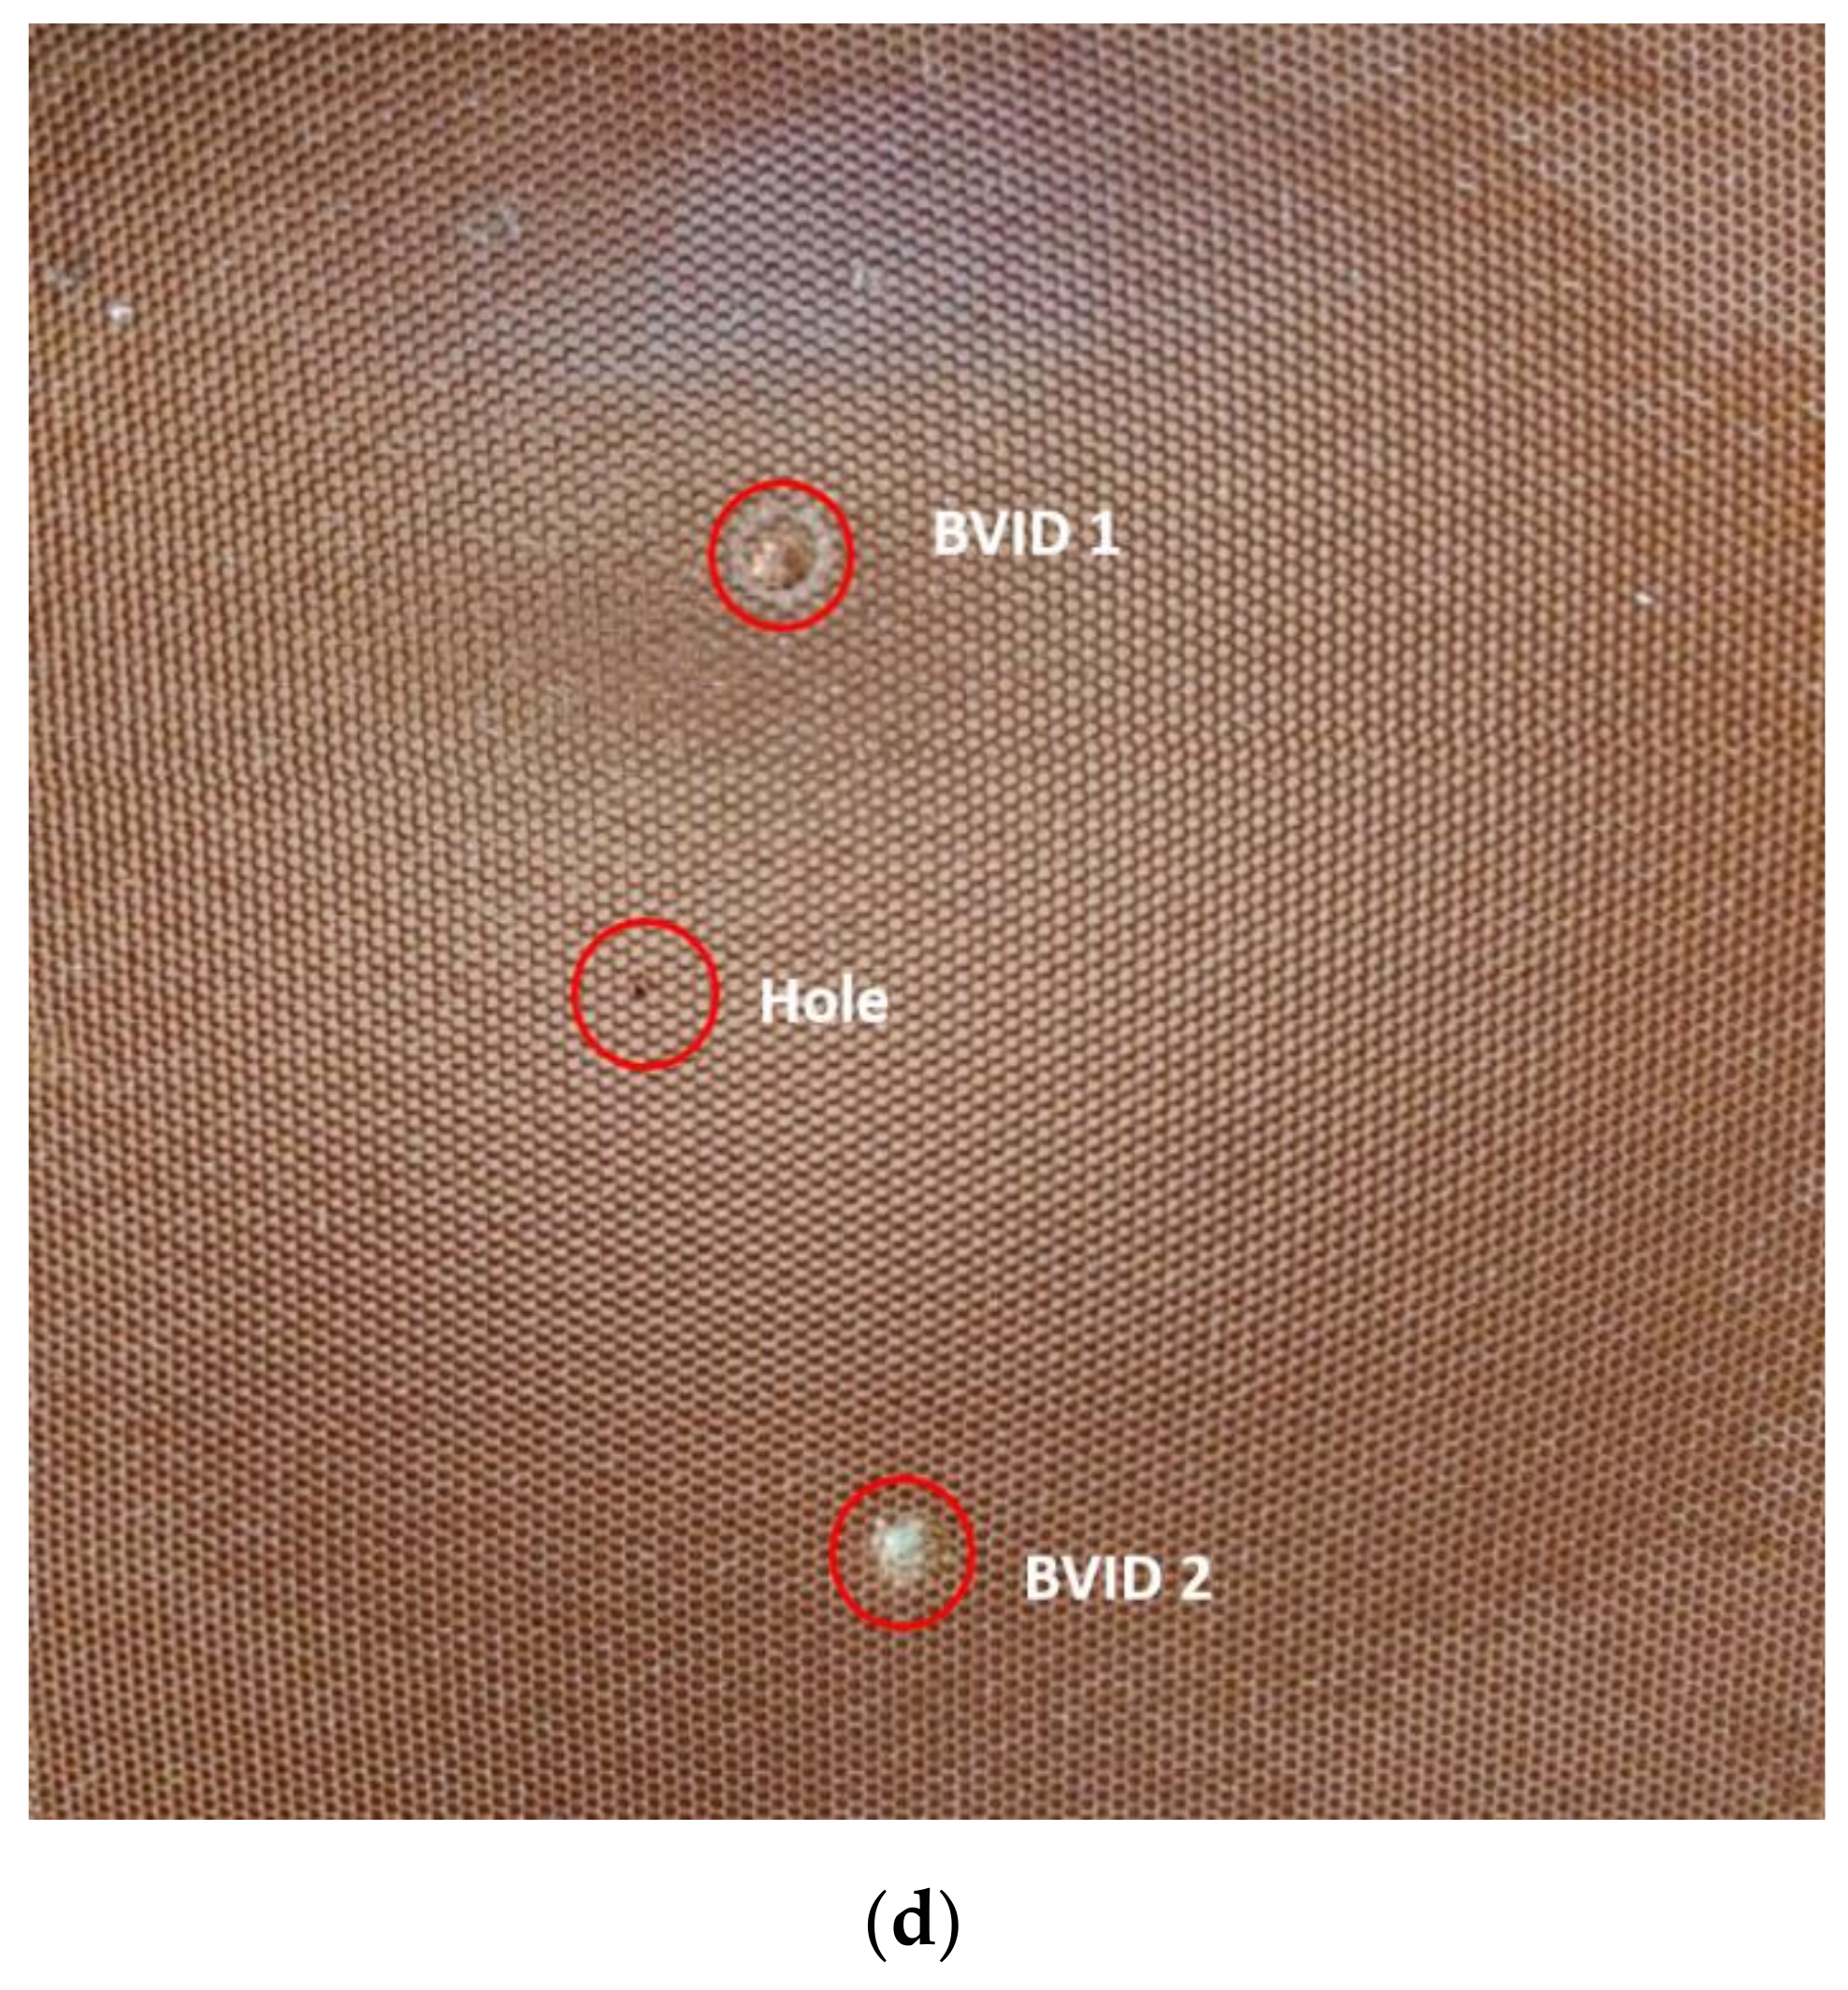
- A sandwich plate with Nomex core and single-sided adhesively bonded aluminum facet is studied experimentally, numerically, and analytically.
- SEM study with PZT SONOX P502 parameters is studied with a single-sided adhesively bonded composite structure (ACS).
- The SLDV full wavefield result is compared with the SEM result.
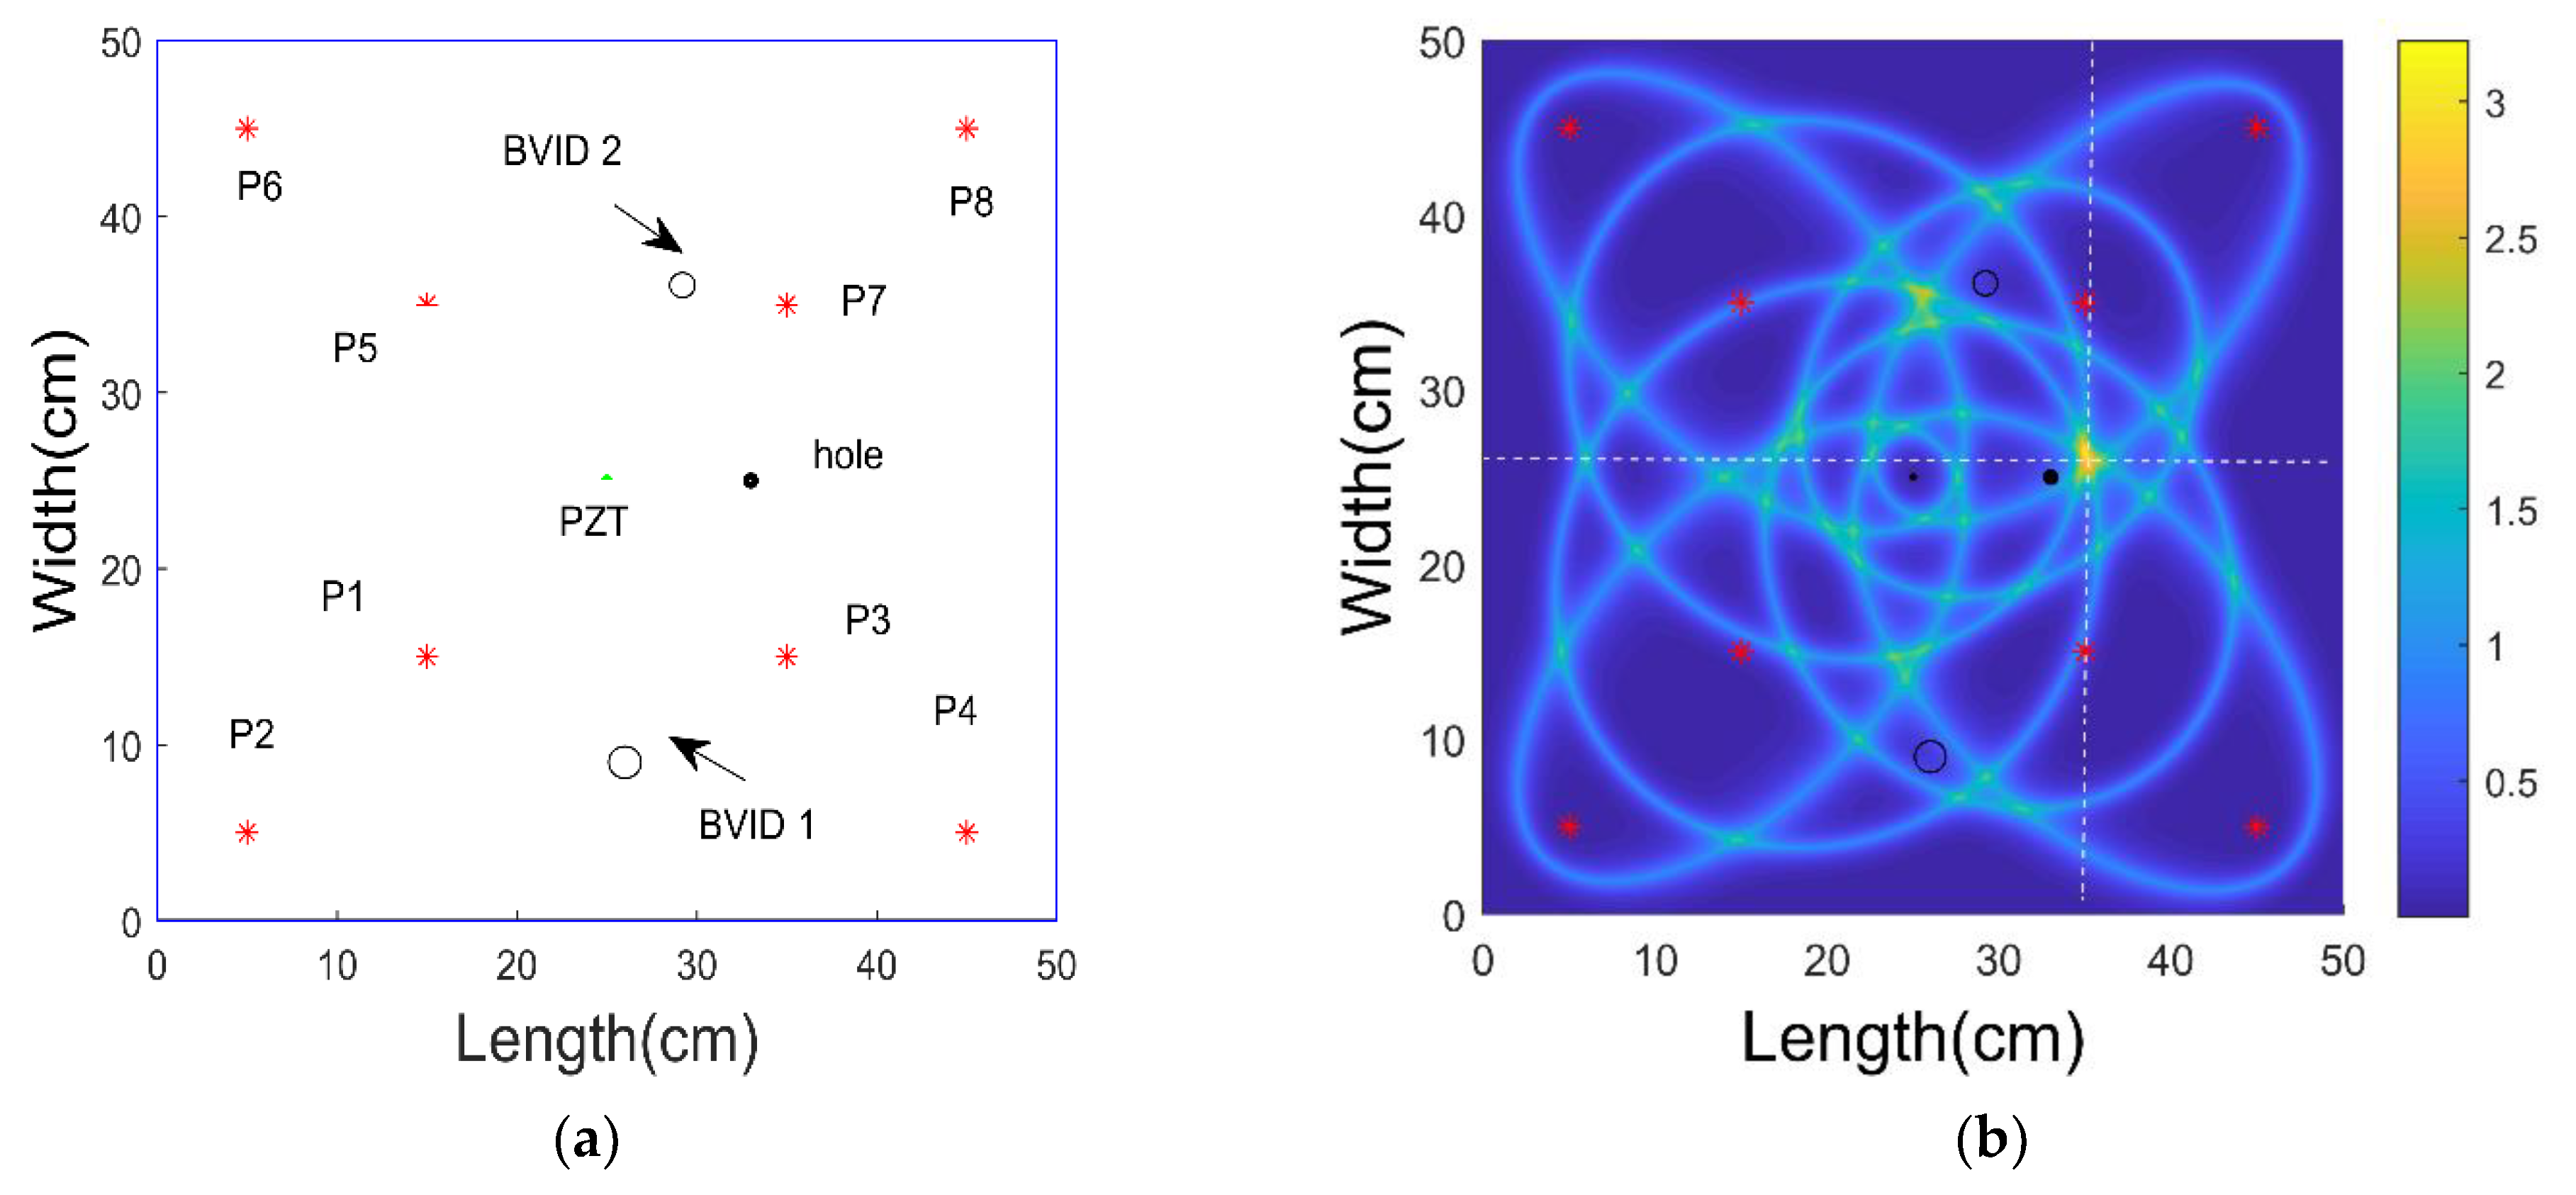
- The elliptical method is applied to the data obtained from SLDV and SEM.
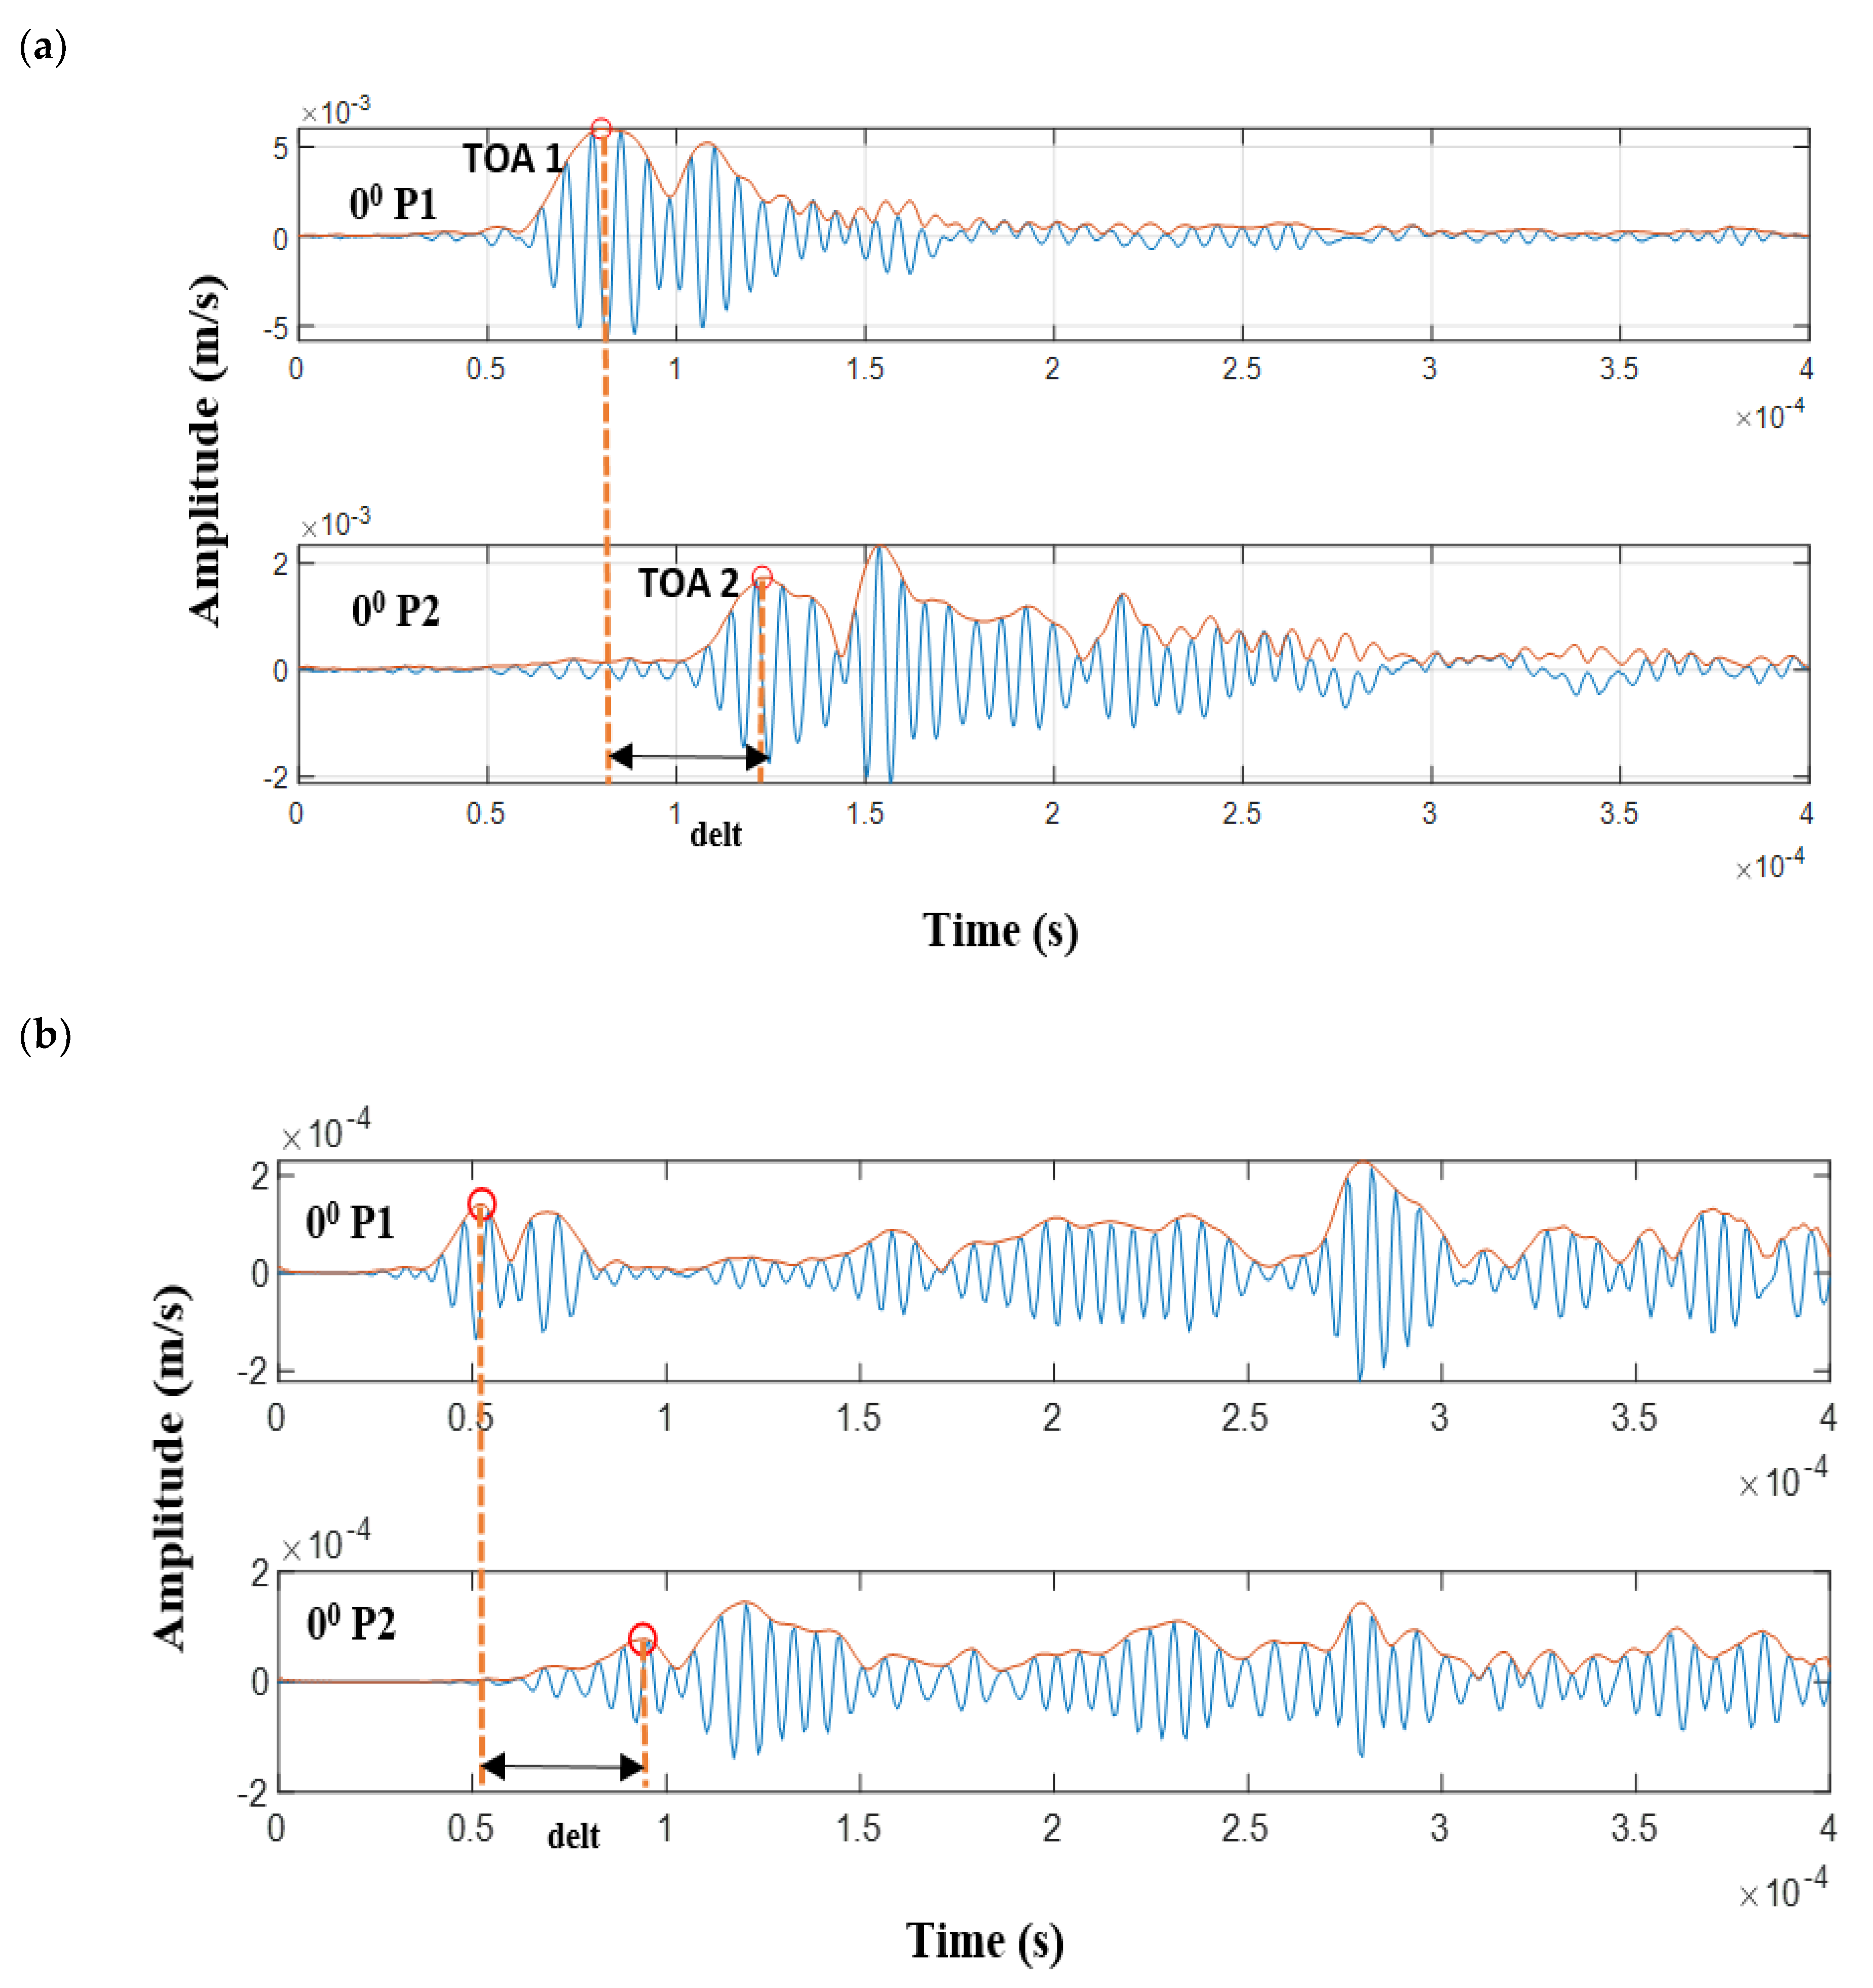
- The elliptical signal method is not limited to the first time of arrival and does not use the differential signals.
2. Numerical and Experimental Process
3. Results and Discussion
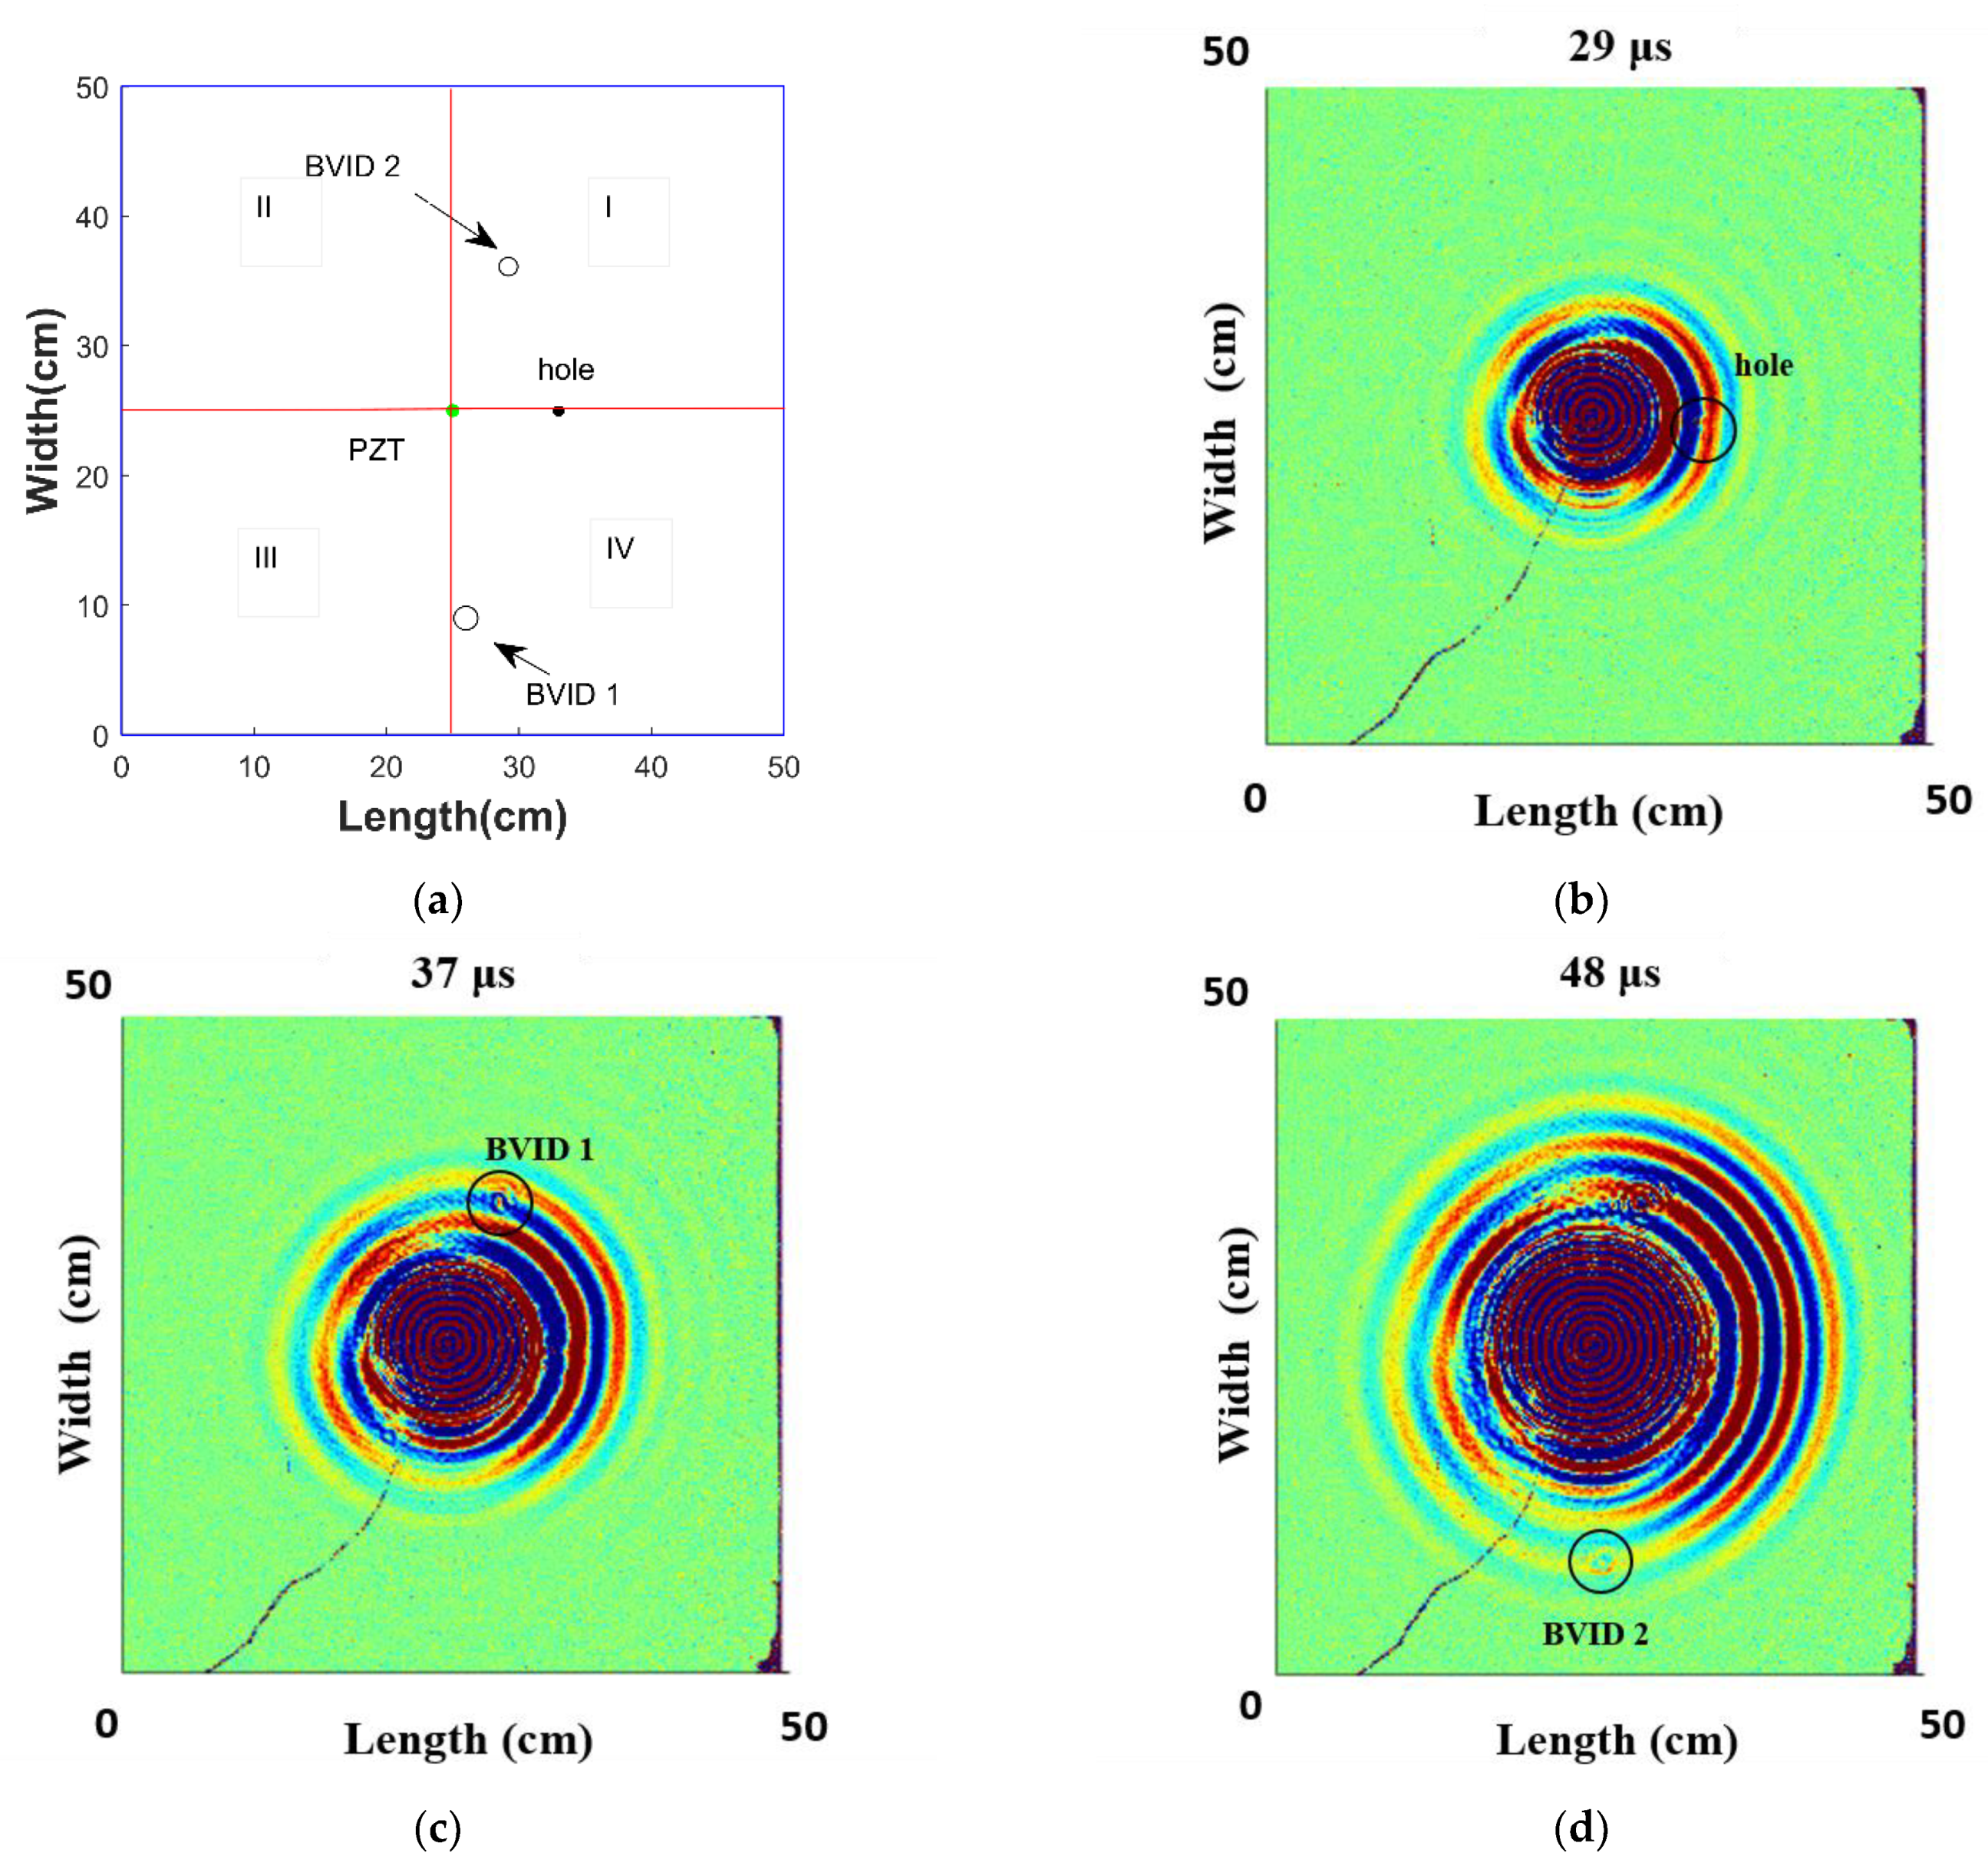
3.1. Analysis of the Results from the SLDV
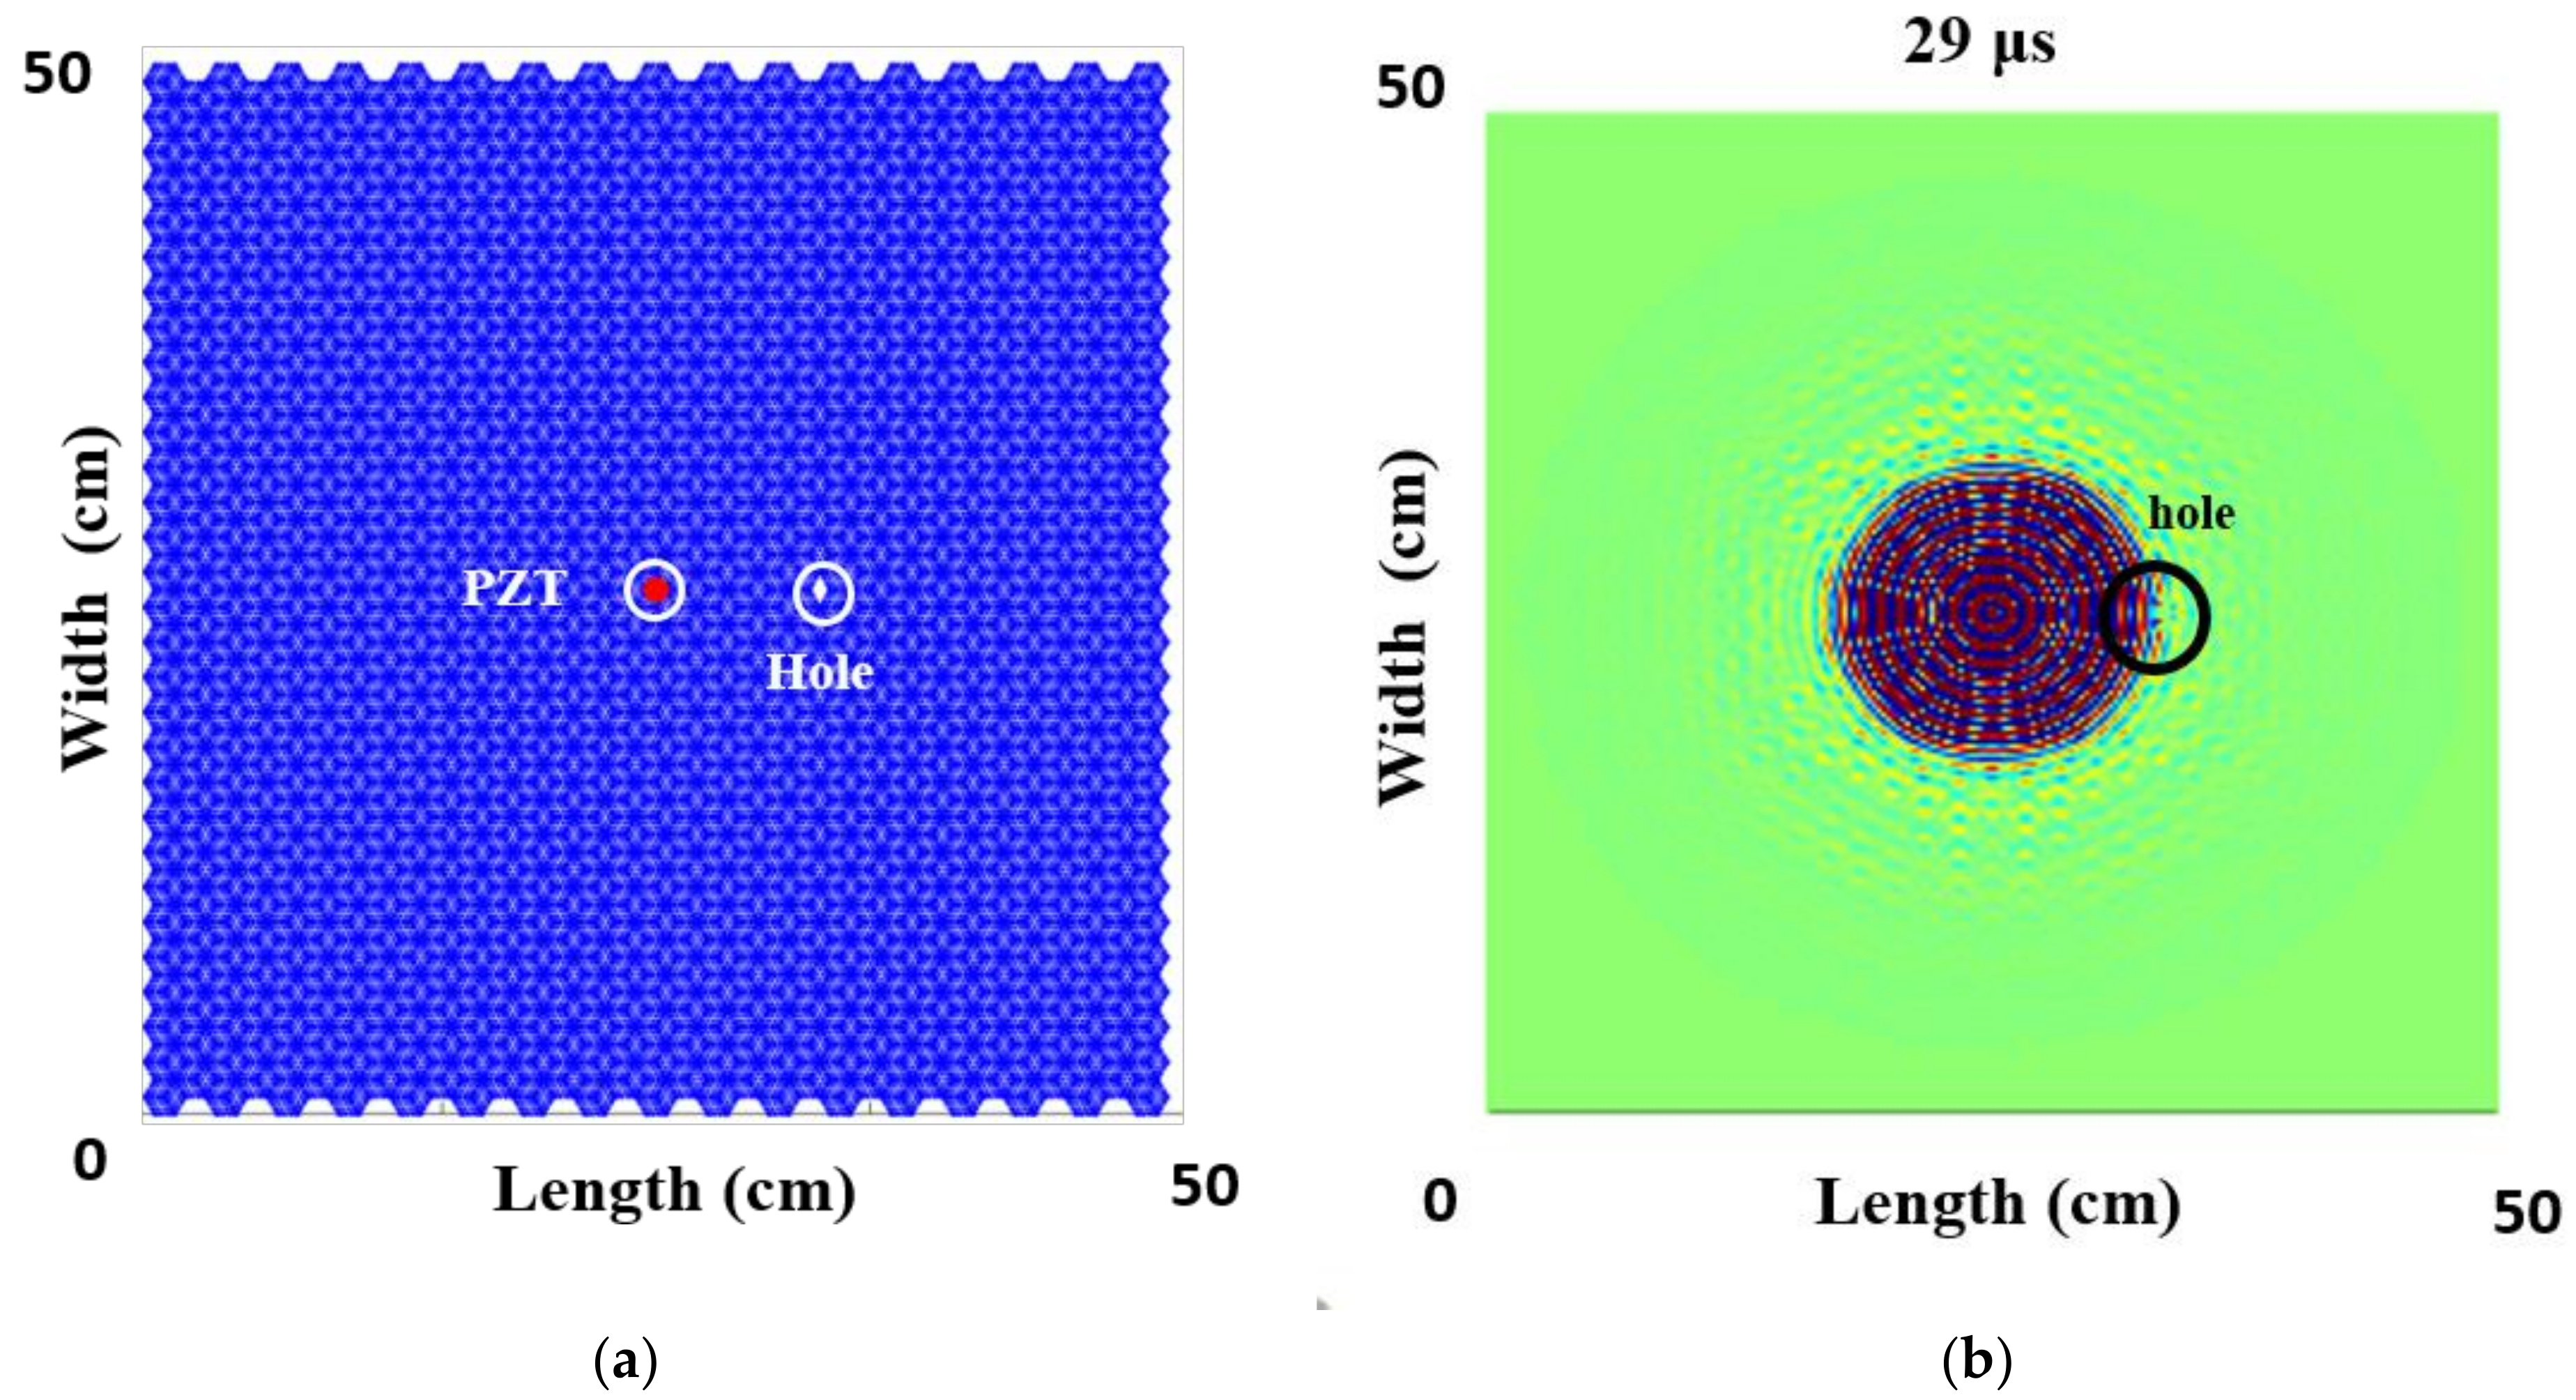
3.2. Analysis of the Results Using Numerically Based Spectral Element Code
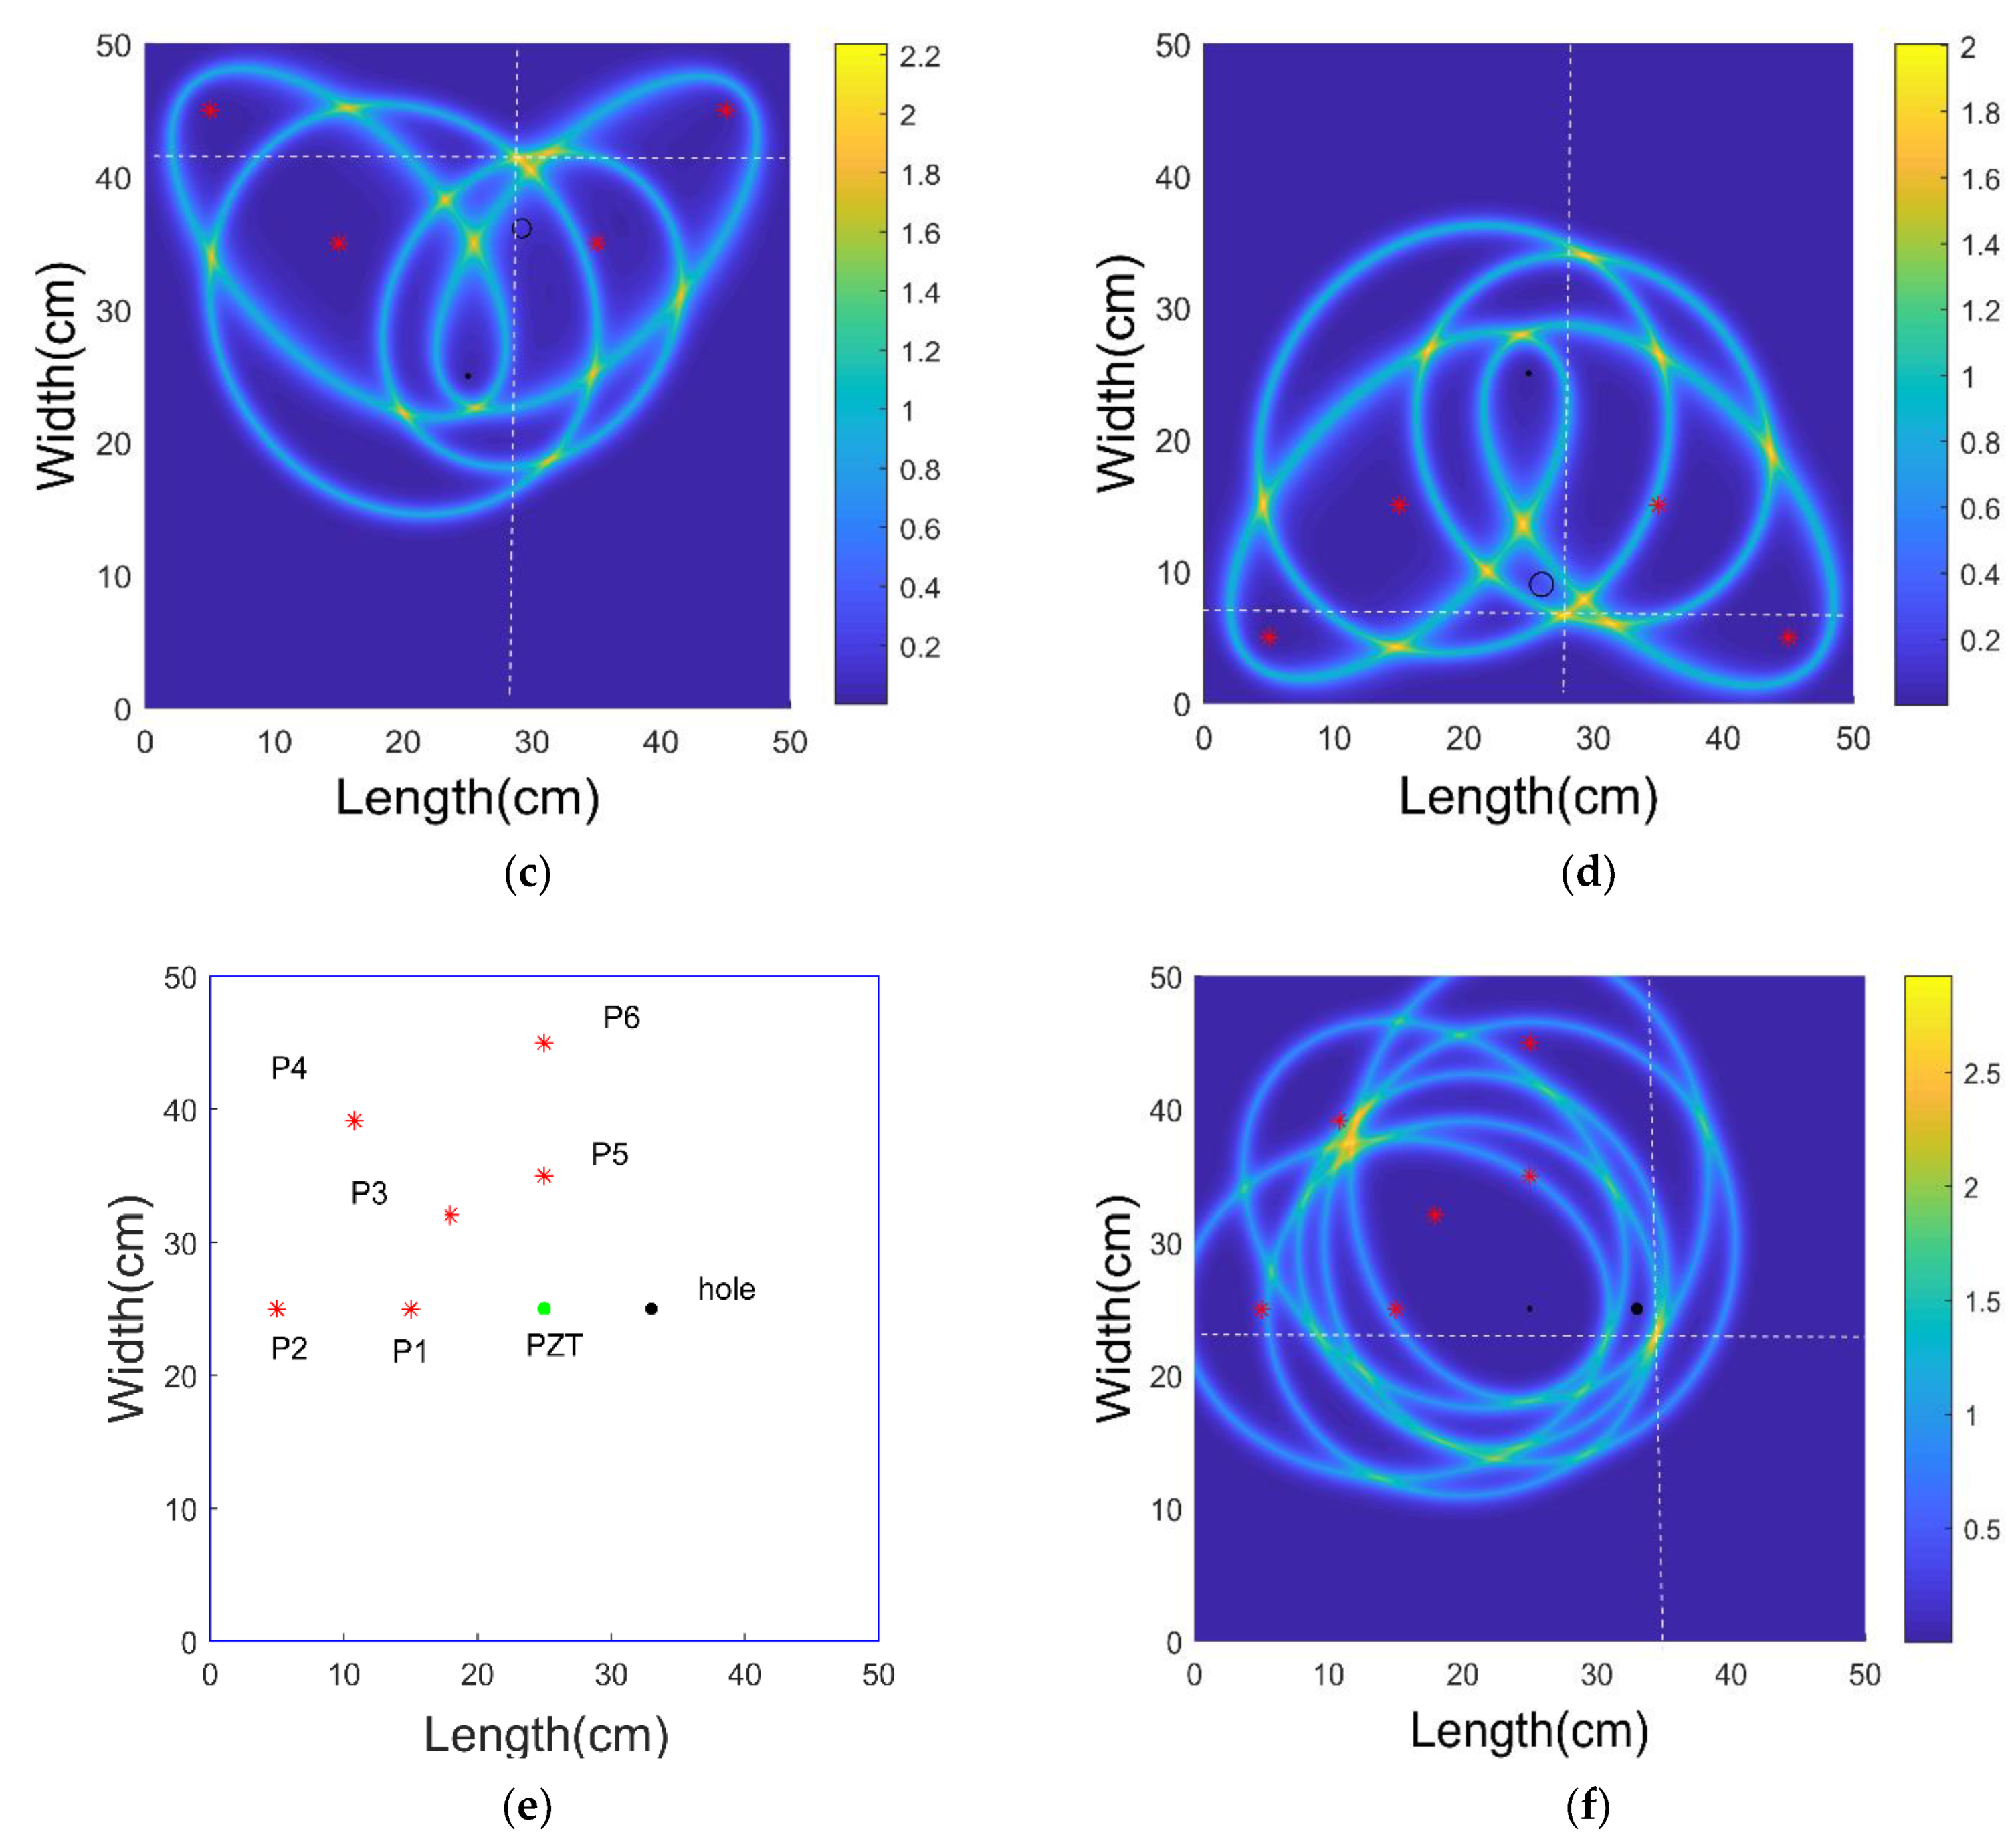
3.3. Analysis of the Results Using an Elliptical Based Signal Processing Method
4. Conclusions
Author Contributions
Funding
Institutional Review Board Statement
Informed Consent Statement
Data Availability Statement
Acknowledgments
Conflicts of Interest
References
- Sikdar, S.; Banerjee, S. Structural Health Monitoring of Advanced Composites Using Guided Waves: Online Monitoring of Defects/Discontinuities in Advanced Composite Structures Using Ultrasonic Guided Waves and PZTs; LAP LAMBERT Academic Publishing: Saarbrücken, Germany, 2017. [Google Scholar]
- Sikdar, S.; Van Paepegem, W.; Ostachowicz, W.; Kersemans, M. Nonlinear debond response analysis in a smart composite structure using elastic wave propagation. Compos. Part B Eng. 2020, 200, 108304. [Google Scholar] [CrossRef]
- Toyama, N.; Yamamoto, T.; Urabe, K.; Tsuda, H. Ultrasonic inspection of adhesively bonded CFRP/aluminum joints using pulsed laser scanning. Jpn. Soc. Compos. Struct. 2017, 43, 201–295. [Google Scholar] [CrossRef]
- Diamanti, K.; Hodgkinson, J.M.; Soutis, C. Detection of low-velocity impact damage in composite plates using Lamb waves. Struct. Health Monit. 2004, 3, 33–41. [Google Scholar] [CrossRef]
- Hayashi, T.; Kawashima, K. Multiple reflections of Lamb waves at a delamination. Ultrasonic 2002, 40, 193–197. [Google Scholar]
- Park, B.; An, Y.K.; Sohn, H. Visualization of hidden delamination and debonding in composites through noncontact laser ultrasonic scanning. Compos. Sci. Technol. 2014, 100, 10–18. [Google Scholar] [CrossRef]
- Song, F.; Huang, G.L.; Hu, G.K. Online Guided Wave-Based Debonding Detection in Honeycomb Sandwich Structures. AIAA J. 2012, 50, 284–293. [Google Scholar] [CrossRef] [Green Version]
- Zhao, J.; Li, F.; Cao, X.; Li, H. Wave Propagation in Aluminum Honeycomb Plate and Debonding Detection Using Scanning Laser Vibrometer. Sensors 2018, 18, 1669. [Google Scholar] [CrossRef] [PubMed] [Green Version]
- Sikdar, S.; Kudela, P.; Radzienski, M.; Kundu, A. Online detection of barely visible low-speed impact damage in 3D core sandwich composite structure. J. Compos. Struct. 2018, 185, 646–655. [Google Scholar] [CrossRef] [Green Version]
- Mustapha, S.; Ye, L. Leaky and non-leaky behaviours of guided waves in CF/EP sandwich structures. Wave Motion 2014, 51, 905–918. [Google Scholar] [CrossRef]
- Mustapha, S.; Ye, L.; Dong, X.; Alamdari, M. Evaluation of barely visible indentation damage (BVID) in CF/EP sandwich composites using guided wave signals. Mech. Syst. Signal Process. 2016, 76, 497–517. [Google Scholar] [CrossRef]
- Sikdar, S.; Kundu, A.; Jurek, M.; Ostachowicz, W. Nondestructive Analysis of Debonds in a Composite Structure under Variable Temperature Conditions. Sensors 2019, 19, 3454. [Google Scholar] [CrossRef] [PubMed] [Green Version]
- Sikdar, S. Multi-level nondestructive analysis of joint-debond effects in sandwich composite structure. Polym. Test. 2019, 80, 106149. [Google Scholar] [CrossRef]
- Patera, A.T. A spectral element method for fluid dynamics: Laminar flow in a channel expansion. J. Comput. Phys. 1984, 54, 468–488. [Google Scholar] [CrossRef]
- Kudela, P.; Zak, A.; Krawczuk, M.; Ostachowicz, W. Modelling of wave propagation in composite plates using the time domains spectral element method. J. Sound Vib. 2007, 302, 728–745. [Google Scholar] [CrossRef]
- Kudela, P.; Ostachowicz, W. 3D time-domain spectral elements for stress waves modelling. J. Phys. Conf. 2009, 181, 1–9. [Google Scholar] [CrossRef]
- Ha, S.; Chang, F.K. Optimizing a spectral element for modeling PZT-induced lamb wave propagation in thin plates. Smart Mater. Struct. 2009, 19, 1–12. [Google Scholar] [CrossRef]
- Ge, L.; Wang, X.; Wang, F. Accurate modeling of PZT induced lamb wave propagation in structures by using a novel spectral finite element method. Smart Mater. Struct. 2014, 23, 1–15. [Google Scholar] [CrossRef]
- Song, F.; G. L. Huang.; K. Hudson. Guided wave propagation in honeycomb sandwich structures using a piezoelectric actuator/sensor system. Smart Mater. Struct. 2009, 18, 1–8. [Google Scholar] [CrossRef]
- Ceramtec. Available online: https://www.ceramtec.com/files/ms_piezoceramic-soft-materials_en_de.pdf (accessed on 1 June 2020).
- Fendzi, C.; Mechbal, N.; Rebillat, M.; Guskov, M.; Coffignal, G. A General Bayesian Framework for Ellipse-based and Hyperbola-based Damage Localisation in Anisotropic Composite Plates. J. Intell. Mater. Syst. Struct. 2015, 27, 350–374. [Google Scholar] [CrossRef] [Green Version]
- Soman, R.; Malinowski, P. A real-valued genetic algorithm for optimization of sensor placement for guided waves based structural health monitoring. J. Sens. 2019, 2019, 1–10. [Google Scholar] [CrossRef]


| No. of Cycles | Frequency (kHz) | Excitation Voltage (Vpp) | Grid Points | Sampling Period (μs) |
|---|---|---|---|---|
| 10 | 150 | 16 × 20 | 411 × 415 | 0.78125 |
| Material | Young’s Modulus (GPa) | Poisson Ratio | Density (kg/m3) |
|---|---|---|---|
| Nomex | 9 | 0.30 | 1384 |
| Aluminum | 68 | 0.33 | 2600 |
| d33 (C/N) | d31 (C/N) | d15 (C/N) | ||
|---|---|---|---|---|
| 440 × 10−12 | −185 × 10−12 | 560 × 10−12 | 1850 | 1950 |
| S11E (m2/N) | S33E (m2/N) | ρ (kg/m3) | |
|---|---|---|---|
| 18.5 × 10⁻¹² | 20.7 × 10⁻¹² | 0.44 | 7740 |
| No. of Cycles | Frequency (kHz) | Grid Points | Sampling Period (μs) |
|---|---|---|---|
| 10 | 150 | 251 × 251 | 6.1 × 10⁻³ |
| Frequency (kHz) | Hole (µs) | BVID 1 (µs) | BVID 2 (µs) |
|---|---|---|---|
| 150 | 29 | 37 | 48 |
| Case | Test | Sensor Placement | No. of Sensing Points |
|---|---|---|---|
| 1 | Experimental | Quadrant I, II, III, IV | 8 |
| 2 | Experimental | Quadrant I, II | 4 |
| 3 | Experimental | Quadrant III, IV | 4 |
| 4 | Experimental | Quadrant II | 6 |
| 5 | Numerical | Quadrant I, II, III, IV | 8 |
| 6 | Numerical | Quadrant II | 6 |
| Cases Studied | Group Velocity [m/s] at 0° | Group Velocity [m/s] at 90° |
|---|---|---|
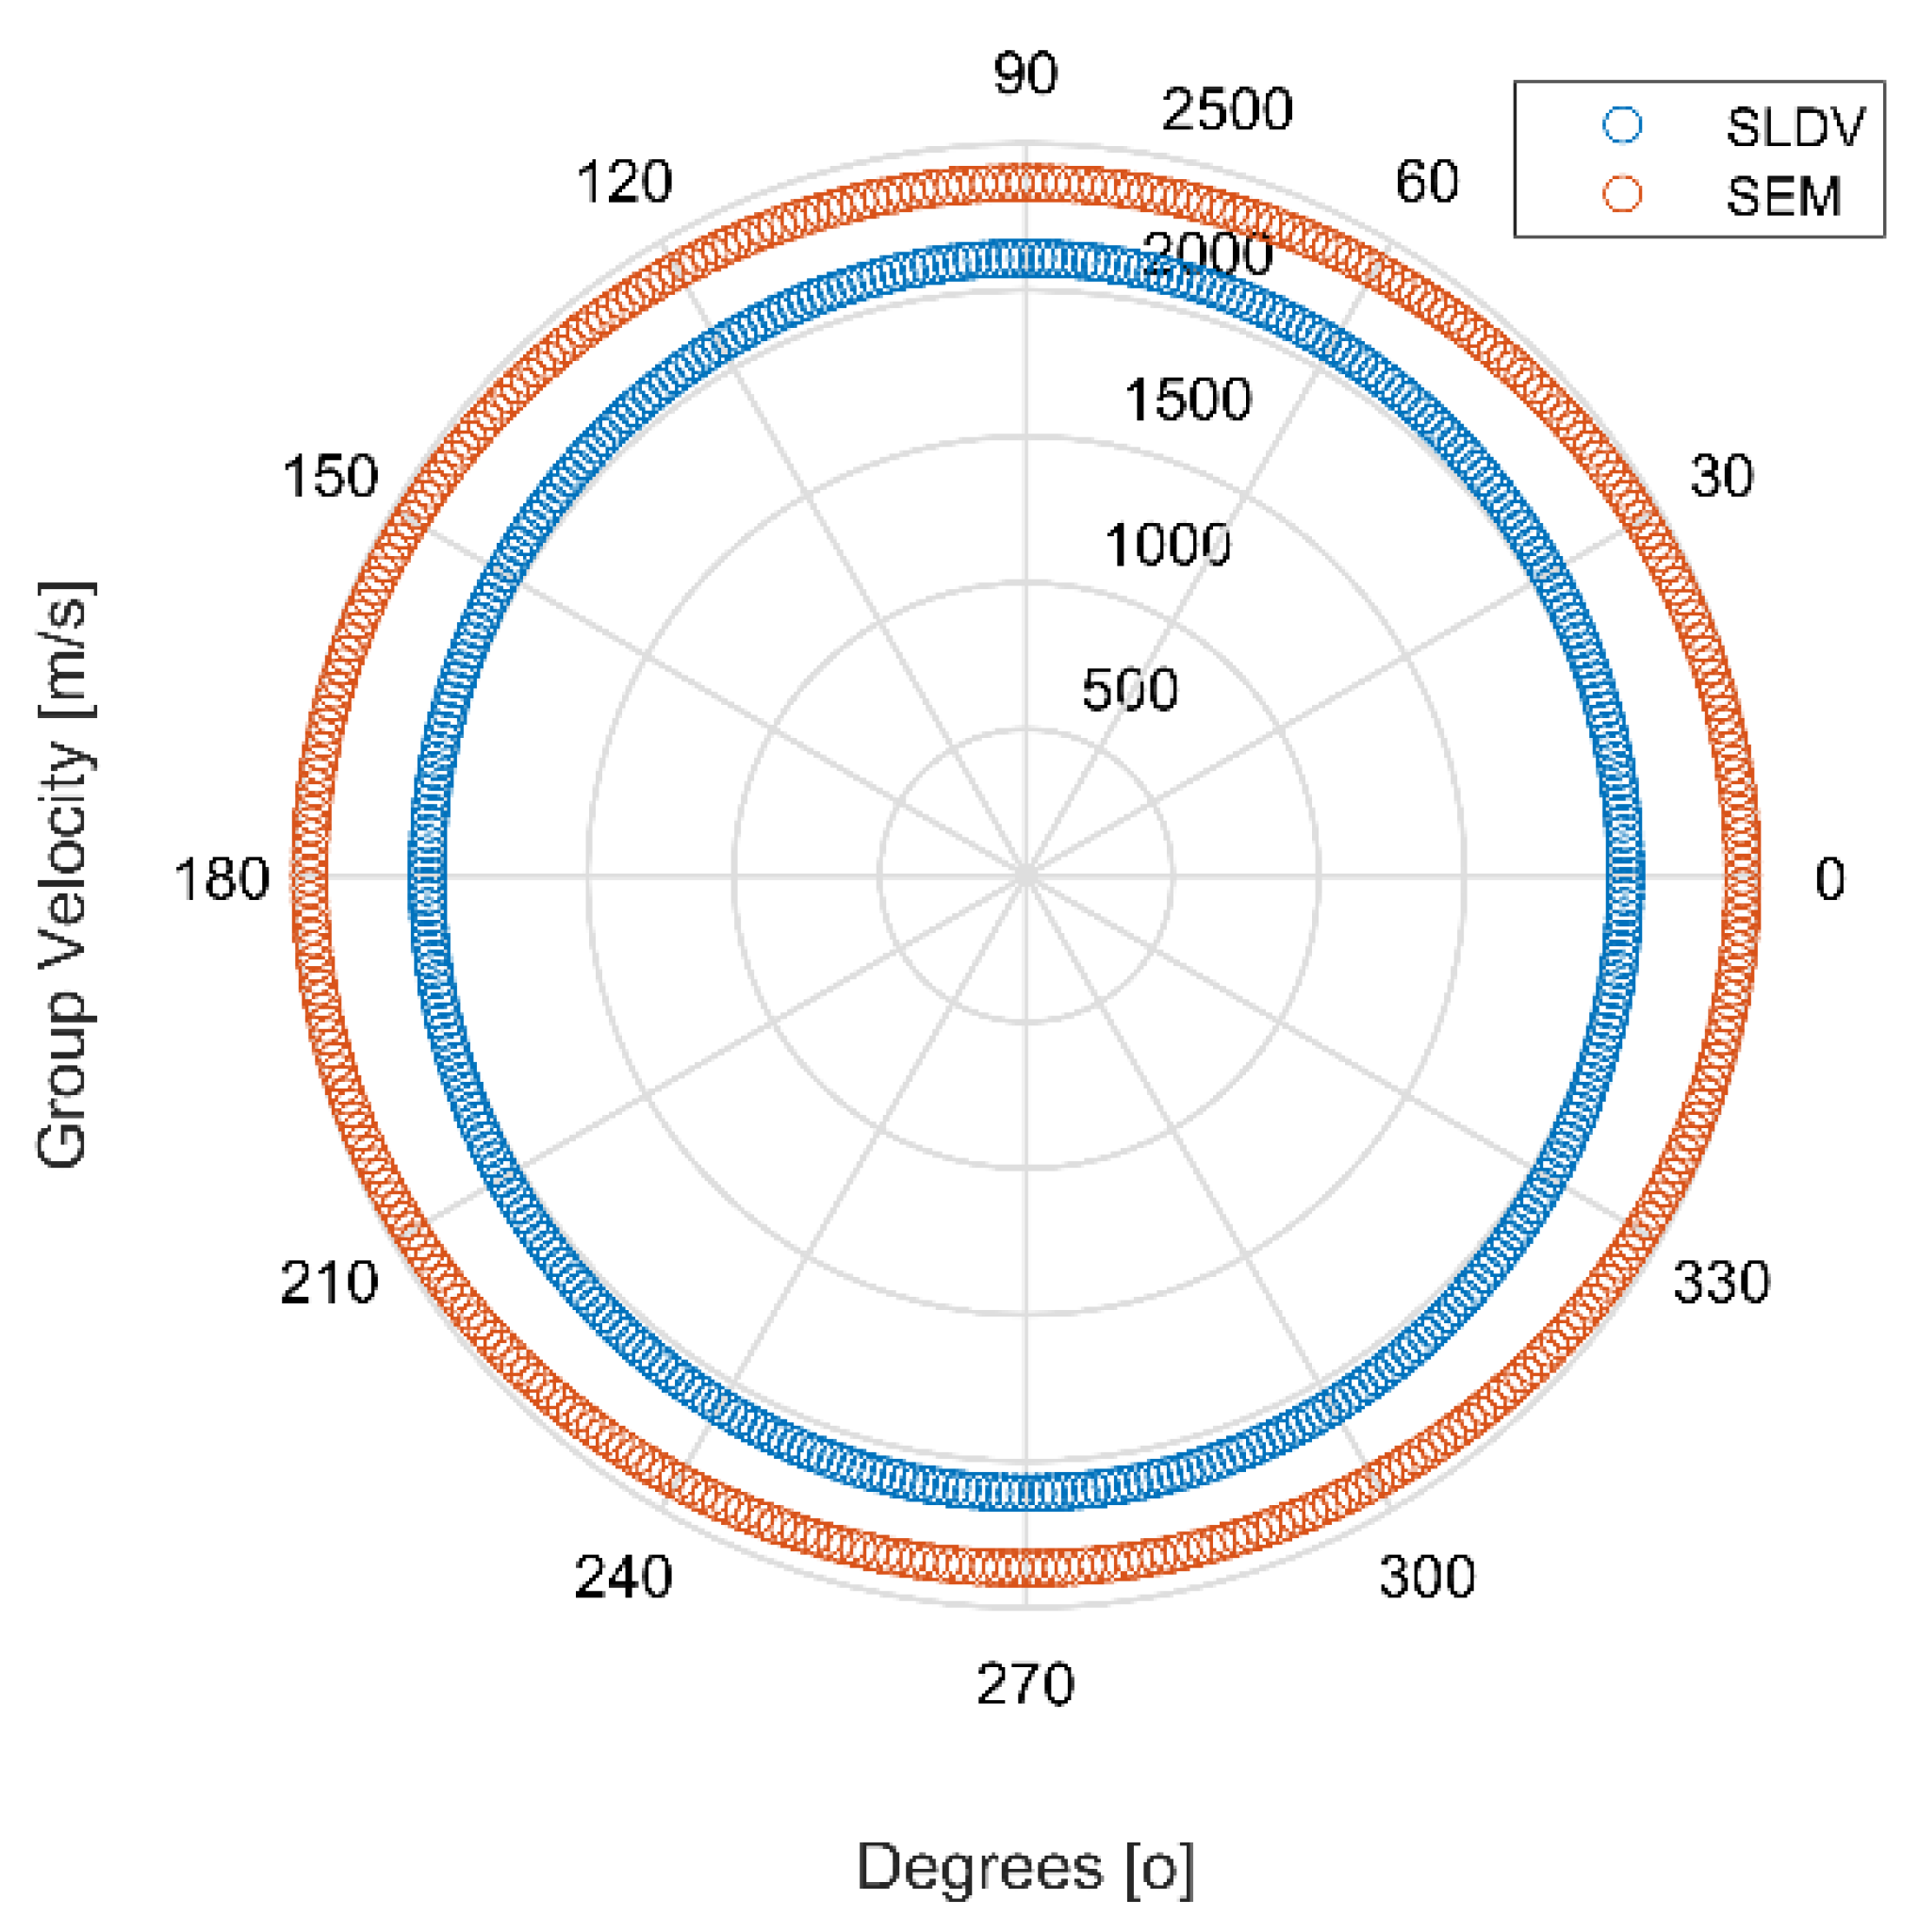
| Case 4 | 2048 | 2108 |
| Case 6 | 2410 | 2365 |
| Experimental | Damage Map Maximum Location (cm, cm) | Coordinates of Damage Center (cm, cm) | Error in Estimation (cm) |
|---|---|---|---|
| Case 1 | (35, 26.5) | (33.0, 25.0) | 2.50 |
| Case 2 | (28.9, 41.4) | (29.1, 36.2) | 5.20 |
| Case 3 | (27.7, 6.7) | (26.0, 9.0) | 2.80 |
| Case 4 | (34.4, 23.0) | (33.0, 25.0) | 2.44 |
| Numerical | Damage Map Maximum Location (cm, cm) | Coordinates of Damage Center (cm, cm) | Error in Estimation (cm) |
|---|---|---|---|
| Case 5 | (29.8, 27.7) | (33.0, 25.0) | 4.10 |
| Case 6 | (31.9, 26.0) | (33.0, 25.0) | 1.49 |
Publisher’s Note: MDPI stays neutral with regard to jurisdictional claims in published maps and institutional affiliations. |
© 2021 by the authors. Licensee MDPI, Basel, Switzerland. This article is an open access article distributed under the terms and conditions of the Creative Commons Attribution (CC BY) license (http://creativecommons.org/licenses/by/4.0/).
Share and Cite
Balasubramaniam, K.; Sikdar, S.; Fiborek, P.; Malinowski, P.H. Ultrasonic Guided Wave Signal Based Nondestructive Testing of a Bonded Composite Structure Using Piezoelectric Transducers. Signals 2021, 2, 13-24. https://0-doi-org.brum.beds.ac.uk/10.3390/signals2010002
Balasubramaniam K, Sikdar S, Fiborek P, Malinowski PH. Ultrasonic Guided Wave Signal Based Nondestructive Testing of a Bonded Composite Structure Using Piezoelectric Transducers. Signals. 2021; 2(1):13-24. https://0-doi-org.brum.beds.ac.uk/10.3390/signals2010002
Chicago/Turabian StyleBalasubramaniam, Kaleeswaran, Shirsendu Sikdar, Piotr Fiborek, and Pawel H. Malinowski. 2021. "Ultrasonic Guided Wave Signal Based Nondestructive Testing of a Bonded Composite Structure Using Piezoelectric Transducers" Signals 2, no. 1: 13-24. https://0-doi-org.brum.beds.ac.uk/10.3390/signals2010002