Article

Fluorescent Imaging and Multifusion Segmentation for Enhanced Visualization and Delineation of Glioblastomas Margins

by
Aditi Deshpande
1,
Thomas Cambria
2,
Charles Barnes
2,
Alexandros Kerwick
2,
George Livanos
3,
Michalis Zervakis
3,
Anthony Beninati
2,
Nicolas Douard
2,
Martin Nowak
2,
James Basilion
4,
Jennifer L. Cutter
5,
Gloria Bauman
2,
Suman Shrestha
2,
Zoe Giakos
2,
Wafa Elmannai
2,
Yi Wang
2,
Paniz Foroutan
6,
Tannaz Farrahi
7 and
George C. Giakos
2,*
1
Department of Biomedical Engineering, The University of Arizona, Tucson, AZ 85721, USA
2
Department of Electrical and Computer Engineering, Manhattan College, Riverdale, NY 10463, USA
3
Department of Electrical and Computer Engineering, Technical University of Crete Campus, 73100 Chania, Greece
4
Departments of Radiology and Biomedical Engineering, Case Center for Imaging Research, Case School of Engineering, Cleveland, OH 44106, USA
5
Medpace, Cincinnati, OH 45227, USA
6
Department of Computer Engineering Science and Research Branch, Islamic Azad University, Tehran 1477893855, Iran
7
Department of Electrical and Computer Engineering, University of Virginia, Charlottesville, VA 22904, USA
*
Author to whom correspondence should be addressed.
Submission received: 26 October 2020 / Revised: 21 April 2021 / Accepted: 8 May 2021 / Published: 13 May 2021
(This article belongs to the Special Issue Biosignals Processing and Analysis in Biomedicine)

Abstract

:
This study investigates the potential of fluorescence imaging in conjunction with an original, fused segmentation framework for enhanced detection and delineation of brain tumor margins. By means of a test bed optical microscopy system, autofluorescence is utilized to capture gray level images of brain tumor specimens through slices, obtained at various depths from the surface, each of 10 µm thickness. The samples used in this study originate from tumor cell lines characterized as Gli36ϑEGRF cells expressing a green fluorescent protein. An innovative three-step biomedical image analysis framework is presented aimed at enhancing the contrast and dissimilarity between the malignant and the remaining tissue regions to allow for enhanced visualization and accurate extraction of tumor boundaries. The fluorescence image acquisition system implemented with an appropriate unsupervised pipeline of image processing and fusion algorithms indicates clear differentiation of tumor margins and increased image contrast. Establishing protocols for the safe administration of fluorescent protein molecules, these would be introduced into glioma tissues or cells either at a pre-surgery stage or applied to the malignant tissue intraoperatively; typical applications encompass areas of fluorescence-guided surgery (FGS) and confocal laser endomicroscopy (CLE). As a result, this image acquisition scheme could significantly improve decision-making during brain tumor resection procedures and significantly facilitate brain surgery neuropathology during operation.

1. Introduction

Cancer is one of the most common causes of death worldwide with millions of cases being diagnosed every year. Therapy and identification of cancer constitute one of the most prominent research fields in the international community, with numerous innovative approaches being developed for early diagnosis and efficient management of the disease. Surgical removal of the primary cancer with or without adjuvant therapy constitutes the standard of care for the disease. Upon tumor resection, the medical expert who is performing the operation can form an abstract visual picture of the major area of malignant tissue but not the “edges” (points formulating its boundary) at a microscopic level, which might be penetrating into the surrounding region of non-malignant tissue area [1]. To ensure the adequate removal of the cancerous tissue, the protocol requires removing enough normal tissue to achieve a “clean margin” while maintaining the functionality and formation of the organ. In addition, tumor margins are routinely assessed post-operatively for pathological conditions to ensure that the tumor was effectively eliminated. A major reason is that incompletely resected margins require re-excision, causing additional corporal and psychological encumbrance to the patient. Moreover, the medical expert also takes into consideration the small, yet aggravating possibility of local recurrence in treated patients triggered by miss-detected marginal regions of the tumor during pathological sampling [2]. Therefore, except for tumor detection, it is of paramount importance to trace and further examine the accurate position and structural composition of the cancerous tissue segments so as to facilitate efficient excision, while, in parallel, making certain that, firstly, healthy tissue is not damaged and, secondly, the possibility of cancer recurrence is sufficiently decreased (at least in terms of unsuccessful surgery or surgical failures). Existing imaging modalities, such as positron emission tomography (PET) and magnetic resonance imaging (MRI), experience difficulties in precisely discriminating cancer from normal tissue at the tumor margins. However, it is essential that this specific limitation is resolved promptly, as guided surgery requires the proper detection of tumor margins and identification of its morphological characteristics intraoperatively. Hence, for resection of malignant tissue, developing a competent framework for demarcating tumor margins non-invasively could prove extremely beneficial in clinical practice. It may both facilitate efficient removal of cancer via surgical procedures and prevent the disease from occurring again [2,3].
Brain tumors are considered rather rare yet fatal cancers with intrinsic difficulties in identifying health risks and determinant conditions in the overall community. Several of these kinds of malignancy are by nature refractive to treat due to their position in the brain. Surgery solutions can be adopted for low-grade tumors, while chemotherapy and radiotherapy could serve as possible choices upon visible malignant tissue remaining after surgical procedures. For higher-grade disease, a combination of these approaches could be utilized in therapy plans. Yet, all three treatment options sustain increased risk for long-term morbidity of patients and insufficient cure of the disease. Methodologies for early identification and diagnosis of brain tumors are fundamental to prevent destruction or deterioration of brain cells due to disease evolution or therapy side effects. The key step for developing such methods lies in studying and deeply understanding the mechanisms beyond brain tumor angiogenesis and growth. Nervous system tumors (including brain and other types) are the 10th leading cause of death for both genders. Based on epidemiological predictions, it is estimated that 18,020 adults, namely, 10,190 male and 7830 female, lost their lives from malignant brain and central nervous system (CNS) tumors in 2020. Another important statistical finding is that the 5-year survival rate for patients who suffer from these types of cancer is nearly 36%, while the 10-year survival rate is almost 31%, which decreases with increasing age. At younger ages, i.e., for populations between fifteen to thirty-nine years old, the 5-year survival rate is almost 71%. The 5-year survival rate for people over forty years old drops to 21%. However, survival rates are dependent on several factors, such as genetic, environmental, immunological, biochemical, and biological factors, including the location and kind of spinal cord or brain tumor. For instance, environmental conditions are considered as potential risk factors for carcinogenesis of brain tumors by means of radiation exposure, poisonous agents (N-nitroso composites, plant protection products), atmospheric pollution, and electromagnetic radiation through radio waves. However, for certain contributing factors, there is no definite scientific evidence to advocate their correlation. On the other hand, 5% of cerebral tumors are linked to various hereditary cancer predisposition syndromes. People with these disorders inherit a germline mutation in a tumor suppressor gene. Although the relationship between hereditary genetic factors and brain tumors has been established, greater efforts should be focused on identifying the underlying genes. Finally, immunological, biological, and biochemical factors such as exposure to infections, viruses, and allergens, may be among the risk factors for developing brain tumors, although more studies validating such hypotheses are imperative [3]. Glioblastoma multiforme (GBM) is the most frequent and aggressive malignant primary brain tumor in people over 18 years old and is classified, together with other types of tumors, in the general class of gliomas. Several studies demonstrate that more complete resection of these tumors leads to improved outcomes for patients [4,5,6,7], and, thus, many approaches are being implemented to improve the extent of tumor resection. In clinical trials, Stummer and coworkers [8] have demonstrated that image-guided resection of GBM results in more accurate removal of tumorous tissue, as well as higher survival rates and improved living standards for patients. The first in vivo trials for image-guided surgery in GBM using an administered probe were performed by the group of V. Ntzichristos [9,10], indicating that multispectral optical methodologies achieve high-resolution quantitative imaging of tissue and cancer biomarkers. Similarly, the work of van Dam [11] supports the potential benefits of intra-operative optical imaging, showing that the use of fluorescence imaging achieves certain and case-sensitive detection of tumor tissue in real-time mode during surgery, enabling the detection of remarkably increased malignant lesions compared to those that could have been detected by visual observation. Cutter et al. [12] used animal models of GBM, which demonstrated that imaging probes can be added topically to the resection cavity and elaborate the tumor margin. The majority of the non-invasive near-infrared fluorescent (NIRF) imaging probes constructed so far are based on a consensus sequence of peptides to operate/behave as an enzyme substrate that enables probe activation. Cutter and her team [12] utilized fluorescently quenched activity-based probes (ABP), built on tiny molecule suicide inhibitors of tumor-associated proteases. Several studies emphasized the efficiency and utilization of NIRF probes. They proposed this particular topology for the detection of overexpressed tumor-associated markers [13] and the imaging of tumor-expressed proteases in tissue culture, as well as in tumors that were hypodermically implanted in mice [14].
The main contribution of this study is the application of tumor-margin identification for enhanced and user-friendly visual inspection of brain tissue along with efficient guidance of tumor removal. Thus, we do not aim to adopt or develop complex and advanced image processing concepts but mainly focus on the potential of the proposed system (hardware and software) through preliminary laboratory assessments in this area, due to its low cost, simplicity, and time-effective extraction of results. Specifically, this paper addresses the potential of a digital fluorescence imaging system (custom-made design, not a commercially utilized product) supported by an adaptive segmentation pipeline, with the aim of enhancing the imaging and contrast of tumor brain regions. Brain cancer cells were irradiated by an Argon laser operating at 488 nm and connected to the microscope. Output optical data (auto-fluorescence images) were acquired and treated utilizing unsupervised clustering in conjunction with adaptive thresholding algorithms, without any prior knowledge of the sample data. By utilizing the image intensity distribution in three complementary ways and fusing the processing results, the designed system can be viewed as an efficient, user-independent tool for assisting image-guided surgery, providing increased penetration depth and efficiency in locating the tumor margins and area. In this mode, enabling the surgical resection of invasive tumor tissues without causing significant damage to healthy tissue (proposed system follows a non-invasive approach since no straightforward contact between the illumination source and the tissue sample/patient is required), via the accurate specification and extraction of the tumor margins, would yield more effective supplementary therapy and extend patient survival. Focusing on the efficacy of brain tumor resection, the implemented technical and algorithmic framework could be a compact screening and guidance tool, enabling fast, clear identification and the removal of margin-penetrating cells, which could play a key role in future operational and treatment assessments, especially in combination with molecular imaging probes targeting brain tumor markers. The processing unit of the system addresses the joint incorporation of different forms of structural information hidden within image samples via a direct procedure that can be easily understood and adopted by the medical expert. Indeed, the proposed imaging modality enables the facile and non-detrimental application to tissues, in conjunction with accurate and near-instant activation of fluorescence probe, constituting a cost-effective and powerful tool for near real-time visualization and identification of tumor-associated markers during surgery.
After the introduction of the aims, novelty, and contribution of the current study, a detailed review of the relevant scientific research is presented in Section 2 in support of the adoption of the proposed optical system design. Section 3 describes the basic concepts of the experimental setup, while Section 4 presents the brain tumor image processing steps. Section 5 illustrates the results of the proposed tumor identification procedure, emphasizing the basic conclusions and prospects. The last section (Conclusions) summarizes the description of the proposed unsupervised learning fluorescence imaging system along with the outcome and potential of the presented work.

2. Literature Review

Optical coherence tomography (OCT) is one the most extensively studied technologies for the identification of tumor margins. This approach facilitates the extraction of information about tumor margins during surgery in real-time mode, enabling inspection/scanning of foci of the cancerous area or tumor cells that have spread to a different region than their origin (metastasized cancer). One of the most notable works in this research field addresses image-guided surgery (IGS) of breast cancer using OCT [15]. The specific methodology utilizes optical “ranging” of near InfraRed (IR) wavelengths to extract structural information in the spatial domain and increased imaging resolution at the microscopic/cellular level (at the order of microns). This is achieved via constructing cross-sectional maps in the two-dimensional image space based on the physical phenomenon of the interaction of light with an illuminated surface (optical backscattering). Many other studies demonstrate OCT as an efficient framework for the delineation of boundaries between normal and diseased breast tissue, utilizing techniques for the evaluation of human breast tissue through processing and analysis in frequency (Fourier transform) and spatial domain [16]. Another direction for assessments lies in the 3D volumetric data acquisition of human breast cancer tumor margins and axillary lymph nodes by rotating and retracting an OCT needle-probe below the tissue surface during imaging [17]. Despite the high resolution and efficiency in discriminating normal from cancerous tissue, the limited image penetration depth achieved (2–3 mm) has restricted the utilization of OCT as a real-time imaging modality. In addition, quantitative and objective assessments are based on the subjective interpretation of the acquired image by a specialized and well-trained medical expert. Similarly, optical radiomic signatures, extracted from corresponding optical data (optical coherence tomography images), led to enhanced identification of melanoma, with unique contrast and specificity [18].
The concept of elastic scattering spectroscopy (ESS) was used in the ultra-violet (UV)-visible spectral bands [19] and constitutes one of the earliest studies attempting to evaluate and characterize the boundaries of cancerous breast tissue samples through the application of optical spectroscopy. An analogous attempt was performed in [20] to examine the extent of cancer removal through surgical operations applying the technology of inelastic scattering of monochromatic light (Raman spectroscopy). Although these techniques are quite prone to morphological alterations at both sub-cellular and cellular plane (microscopic level) and enable efficient discrimination of different tissues states via their light fingerprints, their small effective illumination-source-to-detector separation limits the ability to sense the presence of malignant tissue up to 1–2 mm from the surface. A group of researchers from MIT, in particular, a team from the GRH Spectroscopy Laboratory, have developed a mobile scanning system (spectroscopic device incorporating a fiber-optic probe) and properly formulated to evaluate tumor margins intraoperatively; the portable scanner is based on two principles, namely intrinsic fluorescence spectroscopy (IFS) and diffuse reflectance spectroscopy (DRS) [21].
Fluorescence-based image acquisition and analysis methods have facilitated both the accurate demarcation of the infiltrating contour of tumors in real-time and in vivo mode and the evaluation of their histological characteristics. For instance, confocal laser endomicroscopy (CLE) enables the in vivo extraction of brain tissue optical data (fluorescent-based images) with highly increased resolution (at the cellular level), as accomplished in optical biopsies. On the other hand, the principle of fluorescence-guided surgery (FGS) is adopted in applications where improved visualization quality of tumor margins is required so that the extent of cancerous tissue removal in surgical operation increases. A systematic study of several means for fluorescence image-guided glioma surgery, based on preclinical and clinical assessments, is reported in [22].
In other works, photo-acoustic imaging was also used for potential intraoperative tumor margin detection [23]. Photo-acoustic tomography (PAT) has been utilized for breast cancer imaging, brain imaging, and other applications. Even though the limited penetration depth of the technique can be overcome by utilizing microwaves or radiowaves, ultrasounds sustain intense artifact effects upon the reflection of signals from gas to liquid structures and gas to solid ones due to differentiations in acoustic impedances. In addition, ultrasounds suffer from considerable signal attenuation and corruption (phase distortion) in dense/compact structures (thick bones properties), such as the human skull. As a further observation, such acoustic signals are characterized by a decreased ability to efficiently penetrate through gas hollows (such as lung tissues and/or brain tumors). Finally, in order to efficiently detect ultrasonic waves, direct communication/connection of the sensor module (transducer) and the biological structure (tissue sample) is required.
In [24], the authors investigated the feasibility of the multispectral dye-enhanced polarized light imaging method to delineate non-melanoma tumor margins, a tissue type where regions of increased hemoglobin concentration and dye absorption need to be isolated. This work successfully distinguished and identified the tumor margins using the specific imaging modality.
Apart from the imaging modalities mentioned above, nanoscale structures are also used to enhance margin detection. For example, nanotechnology-based contrast agents enhance optical imaging methods and aid in margin detection. Gold nanoparticles (GNPs) are particularly suited for this purpose as they absorb and scatter light strongly and the presence of gold metal intensifies the signal greatly. These gold nanoparticles are coupled with a dye and used in Raman spectroscopy and other optical spectroscopic techniques to produce the surface-enhanced Raman spectroscopic (SERS) effect. Near IR lasers and fluorescence detectors are also combined to record the Raman signals and measure fluorescence in the presence of gold nanoparticles, which concentrate in tumor regions. Due to their nano size, they can easily penetrate blood vessels that are leaky due to the tumor and get trapped in the edge of these tumors as such blood vessels are dominant in tumor edges. This effect enhances margin detection enormously. Similar studies introduced the use of gold nanoparticles in NIR narrow-band imaging (NIR NBI) [25], utilizing two lighting emitting diodes (LEDs) with wavelengths at the green and NIR range to illuminate the GNP infiltrated blood vessels. A charge-coupled device (CCD) captures the reflected illumination signal from the sample. In the corresponding results, the gold nanoparticles clearly demarcated the tumor margins, demonstrating the potential of this technology in intraoperative detection. Targeted gold nanoparticles that deliver a fluorescent payload to tumors have also been used to demarcate the tumor from normal tissues [26].
During the last decade, Giakos et al. [27,28,29,30] have extensively worked on a number of approaches for the differentiation of healthy and cancerous cells, introducing label-free NIR–IR polarimetric diffuse reflectance-based cancer detection methodologies in conjunction with a wavelet and fractal analysis. Visualizing the interaction of IR with healthy and malignant (cancerous) lung cells through polarimetry under diffuse reflectance geometry, in connection with polarimetric exploratory data analysis (pEDA) [29] enables the development of robust and competent diagnostic tools. Image and signal generation through the determination of the polarization states of light proves quite effective and sustains specific benefits for a wide variety of identification and classification tasks and applications, mostly based on the intrinsic nature of optical backscattering to provide increased contrast in varying polarization conditions. As a result, under backscattered geometry, multiple kinds of early-stage malignancies (cancer) could be discriminated, considering and quantifying their unique diffuse reflectance polarimetric signatures. Another related method uses polarimetric discrimination of the wavelet-fractal domain for histological analysis of monolayer lung cancer cells [31,32]. Wavelet polarimetric evaluation of healthy, squamous carcinoma, and adenocarcinoma lung tissue cell lines proves quite promising and reliable in accurately and robustly classifying cells as healthy or cancerous ones, in conjunction with proper discrimination between malignant cells originating from different types of lung cancer [32].
In order to provide efficient interfaces to medical doctors and guide them to easily focus on affected regions, imaging modalities must be supported by digital image processing and segmentation schemes, especially in the case of biomedical applications, as medical images suffer from low contrast and noise. Thus it is of paramount importance to select appropriate and application adaptive approaches in order to increase contrast, decrease information loss and artifacts from captured image data. Histogram-based techniques constitute a common yet quite effective tool for medical image enhancement, finding numerous applications and algorithmic modifications in international literature for many years [33,34]. The latest advances in magnetic resonance (MR) image enhancement include metaheuristics and particle swarm optimization (PSO). Rundo et al. [35,36] proposed an automatic global thresholding and segmentation framework based on genetic algorithms (GAs), confirming through MRI data that there is an underlying bimodal distribution of pixel intensities. The principal idea lies in calculating the optimal threshold (best solution) under an evolutionary computational approach that better discriminates the two Gaussian distributions, formulating a bimodal pixel intensity representation function (histogram) in a medical image sub-region. Acharya and Kumar introduced an efficient particle swarm optimized histogram equalization scheme to automatically extract optimal threshold for texture identification of regions through an iterative approach under a fitness function that combines different performance metrics [37]. The main limitation of such approaches is the increased computational and algorithmic design complexity along with increased overall processing time. Machine learning and computational intelligence approaches are outside the scope of the present study, as we focus on developing a framework that is easy for medical experts to use and set up and can be adopted in real- or near real-time image analysis applications.
Clustering constitutes a widely-established methodology for statistical image analysis, based on assigning groups of pixels into classes (clusters) based on a distance index/metric (intensity similarity and topological proximity), so that the topological inter-cluster similarity and the extra-cluster separability are increased. The selection of the optimal clustering scheme and algorithmic setup (namely, the feature definition, the initial cluster centers or seed points, the distance function to be adopted, or the number of dominant classes) depends on the input dataset origin and type along with the application requirements. The classic k-means and the mean shift algorithms constitute two fundamental frameworks for image classification and decomposition. The first one (known as “k-means clustering”) [38] is an iterative approach that aims to divide a set of data samples (pixel intensities in the case of images) into K groups (clusters) by exploiting the data-driven probability density function in the topology of the feature space. The algorithm converges to a preset number K of clusters in the data distribution, but the quality of the extracted outcome and classification performance are strongly affected and controlled by the initialization condition and the number of clusters a priori defined. The mean shift (MSH) technique (known as “mean shift clustering”) [39,40] is considered an identical solution to overcome the previously mentioned key drawback of k-means clustering. MSH is a robust, statistical, nonparametric detection methodology that works in the density distribution space. Its basic ideas lie in determining and controlling the mode (the highest density of data points) adaptation in terms of a kernel-weighted mean value (average) estimate of data points (observations) within a region of movement (sliding smoothing window). The computational procedure is performed iteratively until convergence to a global or local solution (local density mode) according to a well-defined and carefully selected stopping criterion.
Another type of segmentation technique that directly utilizes the intensity distribution of data (histogram) defines thresholds for classes based on certain discrimination criteria. Otsu thresholding has been one of the standard thresholding techniques used for segmenting an image into two key principal regions (object and background classes) [41]. It is based on the Gaussian modeling of each histogram mode as a natural model of the probability distribution function of a physical object. The margin of the Bayesian detection error of a bi-modal joint distribution defines the appropriate threshold, as a balance point between the misdetection probabilities of the two classes. Notice that the approach can be easily extended to the multiclass case by modeling a multi-modal data distribution and defining the appropriate threshold between consecutive pairs of Gaussian models. On similar grounds, entropy-based thresholding exploits the Shannon entropy [42] of distribution in each histogram mode and interprets the maximization of the thresholded image entropy as indicative of maximum information transfer [43].
These techniques were used in this study to threshold the fluorescence images and discriminate the cancerous regions from the healthy area of the brain tissue; Otsu’s approach is selected because it calculates histograms in a probabilistic manner and produces instant segmentation results under the assumption of the normality of illumination without any prior knowledge of the image properties. In addition, we employ the mean shift procedure in order to refine the specification of image modes within the data distribution and regulate the derivation of empirical probability density functions. As a complementary function, entropy thresholding is also selected to address the information content and interaction of classes. The latter scheme has proven effective in locating sharp discontinuities (edges) within an image in a robust and flexible way, overcoming the sensitivity to noise and time complexity of gradient-based edge detectors utilizing first and second-order derivatives [44]. We expect that this efficiency will be beneficial for the accurate separation of healthy and tumor tissue regions, with well-defined borders, for real-time image-guided surgery. For the efficient segmentation of fluorescence tissue images addressing the sensitivity close to the class borders, we implement the fusion of the previous approaches by means of the union of their results. In particular, the entropy-based result is more closely examined for the discrimination of small cancerous formations in the healthy tissue, whereas the combination of individual results is enhanced by mathematical morphology into closed sections for deriving the gross total area of cancer. These established segmentation approaches were adopted for the proposed fused algorithmic scheme, considering the following conditions:
(a)
We propose a technique to be directly utilized in laboratory assessments, so that the algorithmic procedures become familiar and easily manipulated by medical experts, simulating their own form of processing of microscopy samples.
(b)
The nature of the input fluorescent images is not appropriate for region-based segmentation, because they do not express tumors as compact regions; as a result, edge-based techniques cannot be favored for the identification of tumor borders, as no clear connected contours can be determined along the tumorous segments of the tissue sample under examination.
(c)
The proposed approach aims at a time-efficient tumor visual inspection methodology, not a complete, advanced, and “from scratch” image processing framework. In this context, supervised segmentation and machine learning-based schemes are beyond the scope of the present study.

3. Proposed Tumor Visualization and Identification Framework

This study operates on tissue autofluorescence imaging principles, an optical data acquisition framework that has recently shown promise as a diagnostic modality. Optical fluorescence microscopy is a promising technique for high-quality histological imaging, as it does not harm the tissue samples and saves time and labor [29]. In this experiment, the most common fluorophores within the tissue absorb blue light and re-emit a portion of this radiation at higher wavelengths (green) as a fluorescence signal. Typically, autofluorescence arises from different kinds of fluorophores in the tissue, such as proteins and enzymes; it is sensitive to both morphological, biochemical, and metabolic changes associated with tissue pathologies. Segmentation and enhancement of the obtained images are necessary for the accurate and unsupervised distinction of the tumor margins, even more so, if the background and the object in the image are not very well demarcated due to intensity and texture differences. An unsupervised method aims to minimize errors subjectivity introduced by human intervention/supervision.
Optical fluorescence optical data (microscopy images) depicting brain tumor slice samples were acquired via an imaging system designed with a Zeiss laser scanning microscope (LSM), setting up magnification at 5×. The overall experimental arrangement is shown in Figure 1.
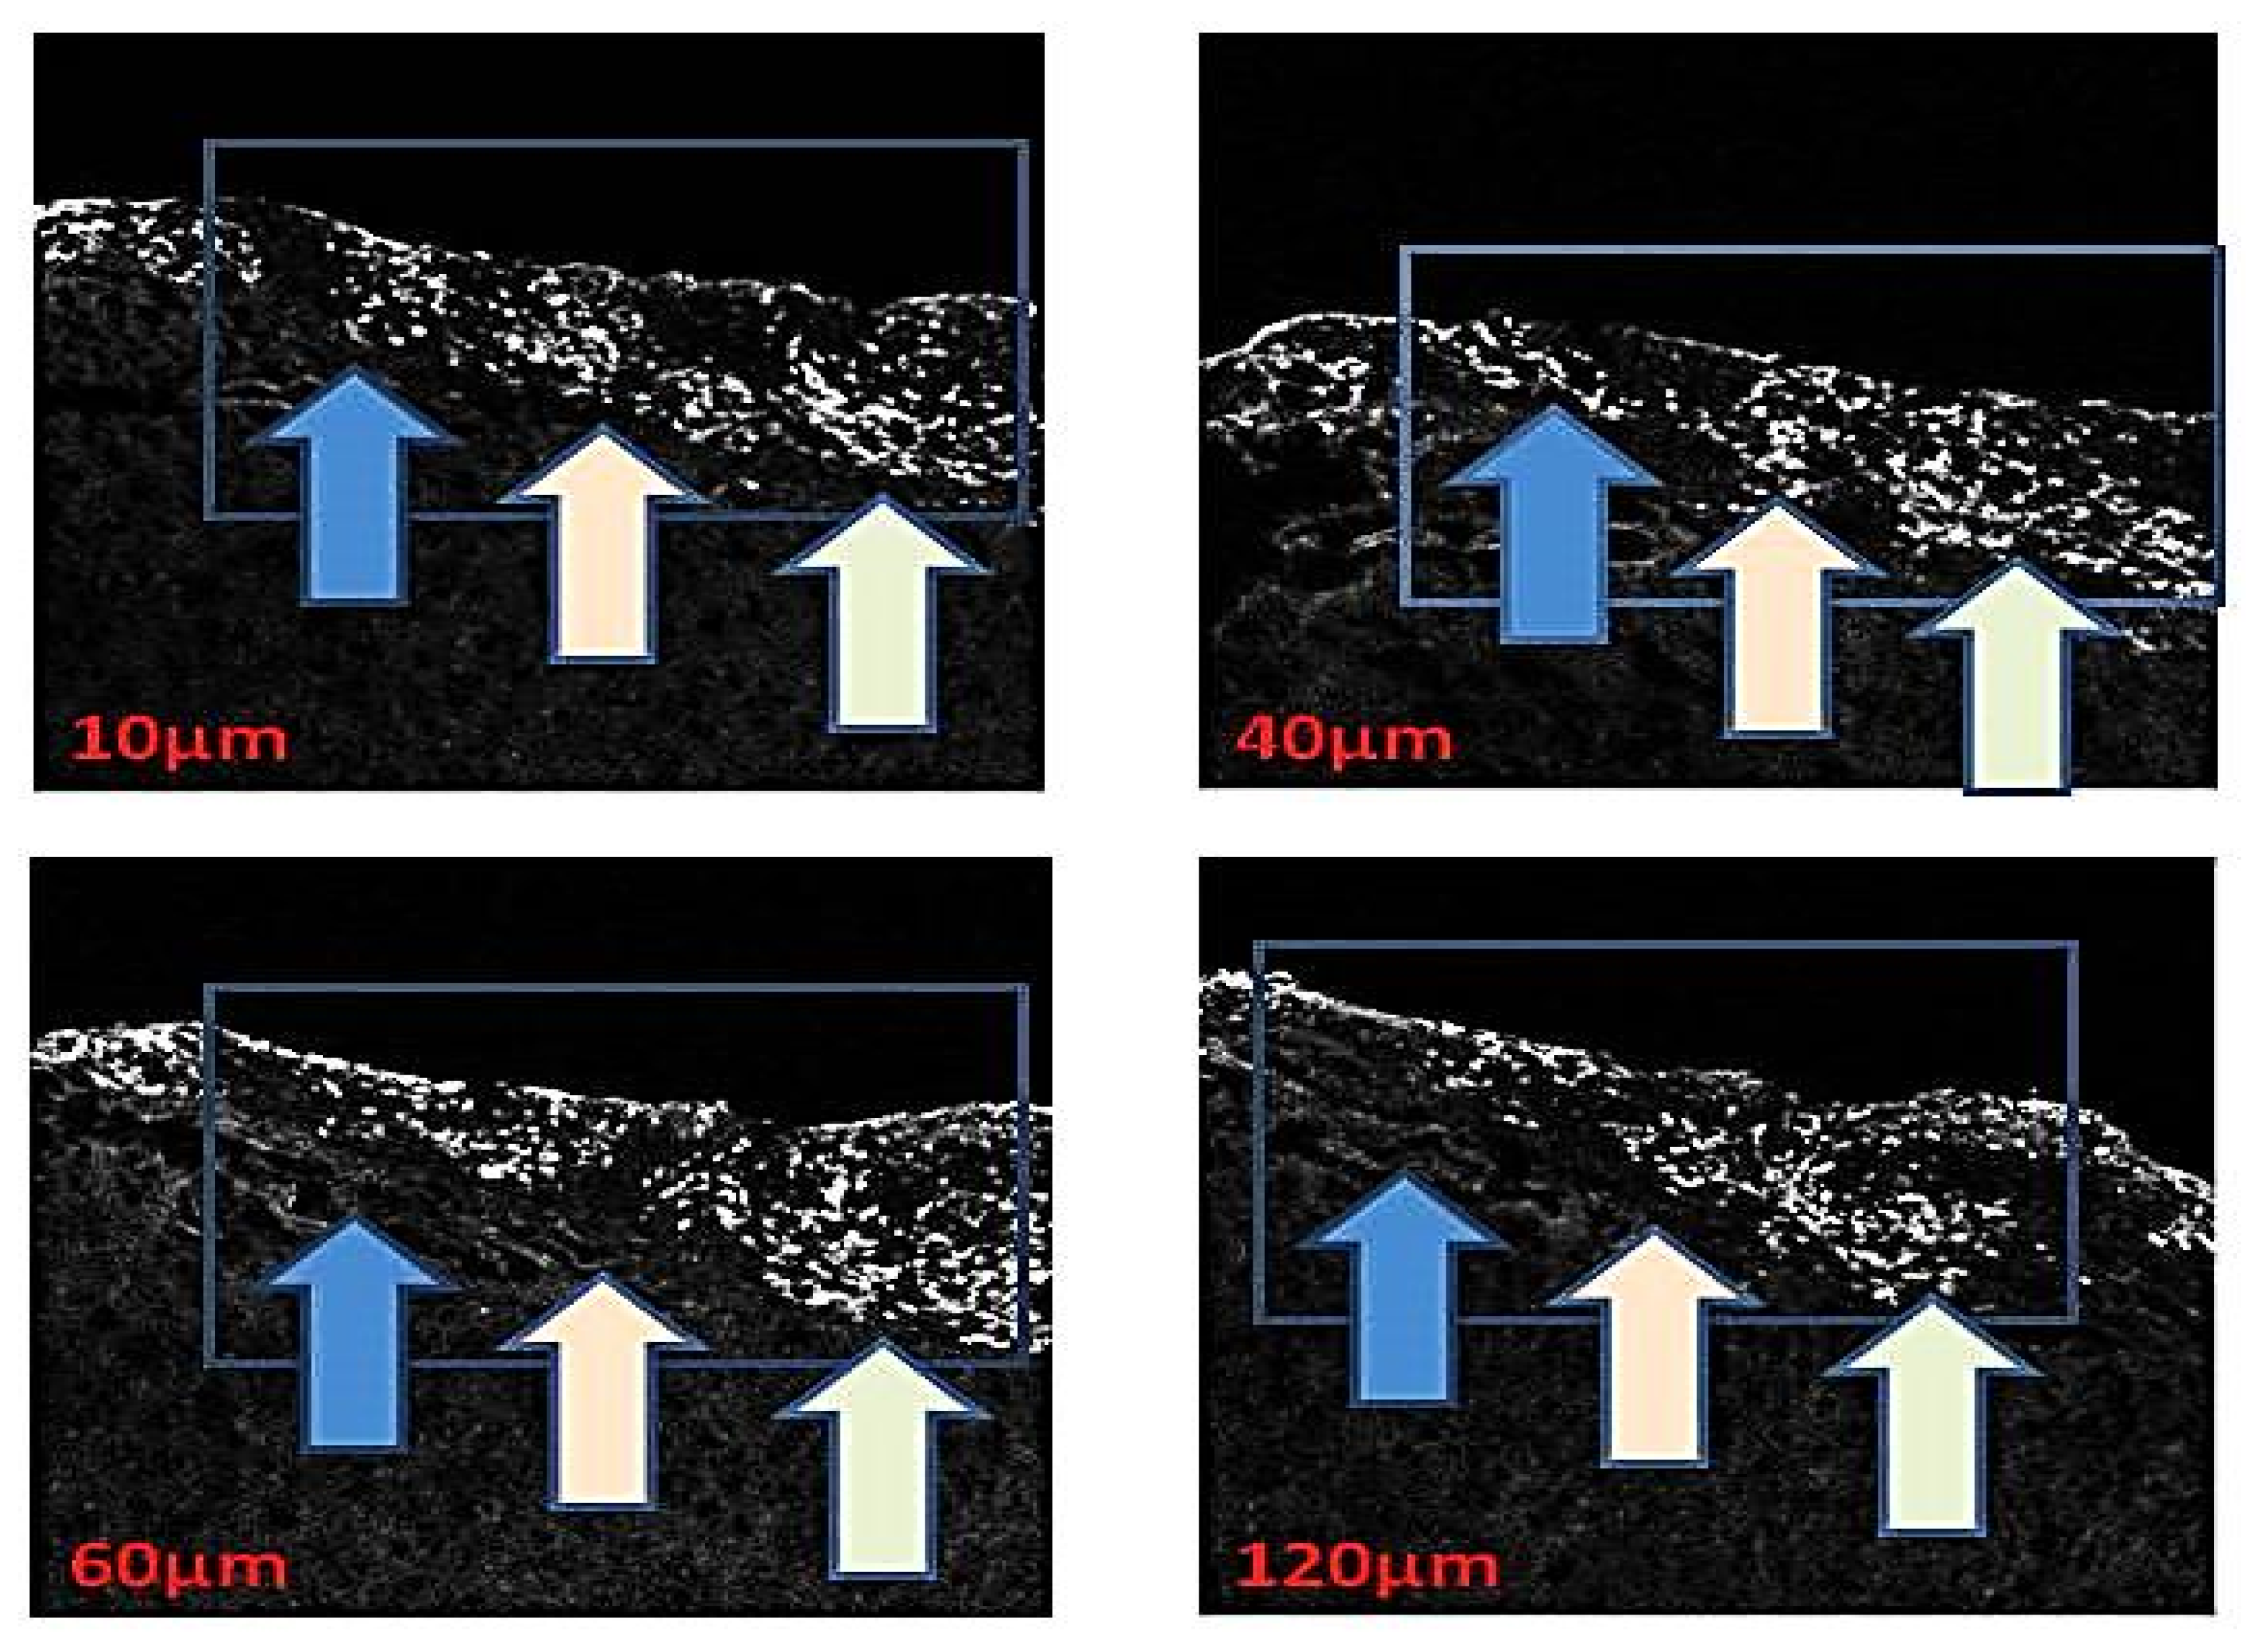
Samples of human Gli36ϑEGRF glioblastoma cell lines expressing green fluorescent protein are used throughout this study. Biological material (tumor cells) comes in the form of 10 µm tissue slices, which were cut beginning from the initial 2 mm of the former brain section. The dataset includes five slides (each one with three sections), which correspond to the distance (depth) of the slice with respect to the starting point of the anterior brain section (beginning from 10 µm and ending to 150 µm, in slices of 10 µm size). The tumor is positioned on the top boundary of these slices, containing cells that express a green fluorescent protein (GFP). Fluorescence imaging modality is utilized for cancer identification, based on the fact that specific biomarker fluorophores are expressed at a substantially more intensive level in tumor cells with respect to healthy ones, enhancing imaging quality for discrimination purposes. Specifically, brain tumor samples were examined using 488 nm Argon laser attached to the microscope; blue light, after passing through a dichroic lens, is incident on the sample inducing green-light auto fluorescence. Diffuse reflectance-auto-fluorescent images are acquired in the “green” spectral range (specific wavelength band selected at 530 nm); while the reflected illumination blue light is blocked with a green-pass filter, set in front of the receiver photomultiplier. Captured images were then processed using unsupervised clustering in conjunction with adaptive thresholding algorithms.
The samples were a gift from Dr. EA Chiocca [45] and prepared from cloning of human Gli36 cells. The cell lines were cultured in Dulbecco’s Modified Eagle Medium (DMEM) (solution contains 4.5 g/L glucose, L-glutamine) supplemented qq2 with 10% concentration in fetal bovine serum (FBS), penicillin levels at 180 U/mL, streptomycin values at 180 mg/mL, and a level of 0.45 mg/mL for amphotericin B (all reagents were developed from Gibco, Invitrogen Corporation). By nature, specific cells overexpress the vIII mutant forms of the estimated glomerular filtration rate (EGFR) gene and have been extensively used for in vivo studies, because they grow rapidly in rat brains. For this purpose, the cell lines were injected into the brain of athymic female nude (nu/nu) mice (6–8 weeks old at the time of surgery), which were grown and preserved at the Animal Resource Center (installations at Case Western Reserve University) in agreement with corresponding institutional policies (CWRU IACUC Animal Experimental Protocol: 2009-0019). Regarding the procedure for brain tumor implants, the animal population was anesthetized and glioblastoma cells were deposited in the right striatum at a slow rate of 1 mL/min and at a depth of 23 mm from the dura. Post imaging brain slices were fixed in a solution medium of 4% paraformaldehyde, 30% sucrose protected, and physically firmed in optimum cutting temperature compound (OCT) for cryostat sectioning (instrument model Leica CM3050S). Tissue sections were acquired sequentially at 10 or 25 mm cut directly onto slides and preserved at −80 °C until manipulation. In order to be visualized via probes, biological material was heated to room temperature for a time interval of 10 min, washed in phosphate buffer solution (PBS) and cover slipped with fluorescent mounting media. As a final step, fluorescent microscopy images were acquired and analyzed performing an unsupervised clustering framework combined with adaptive thresholding techniques.
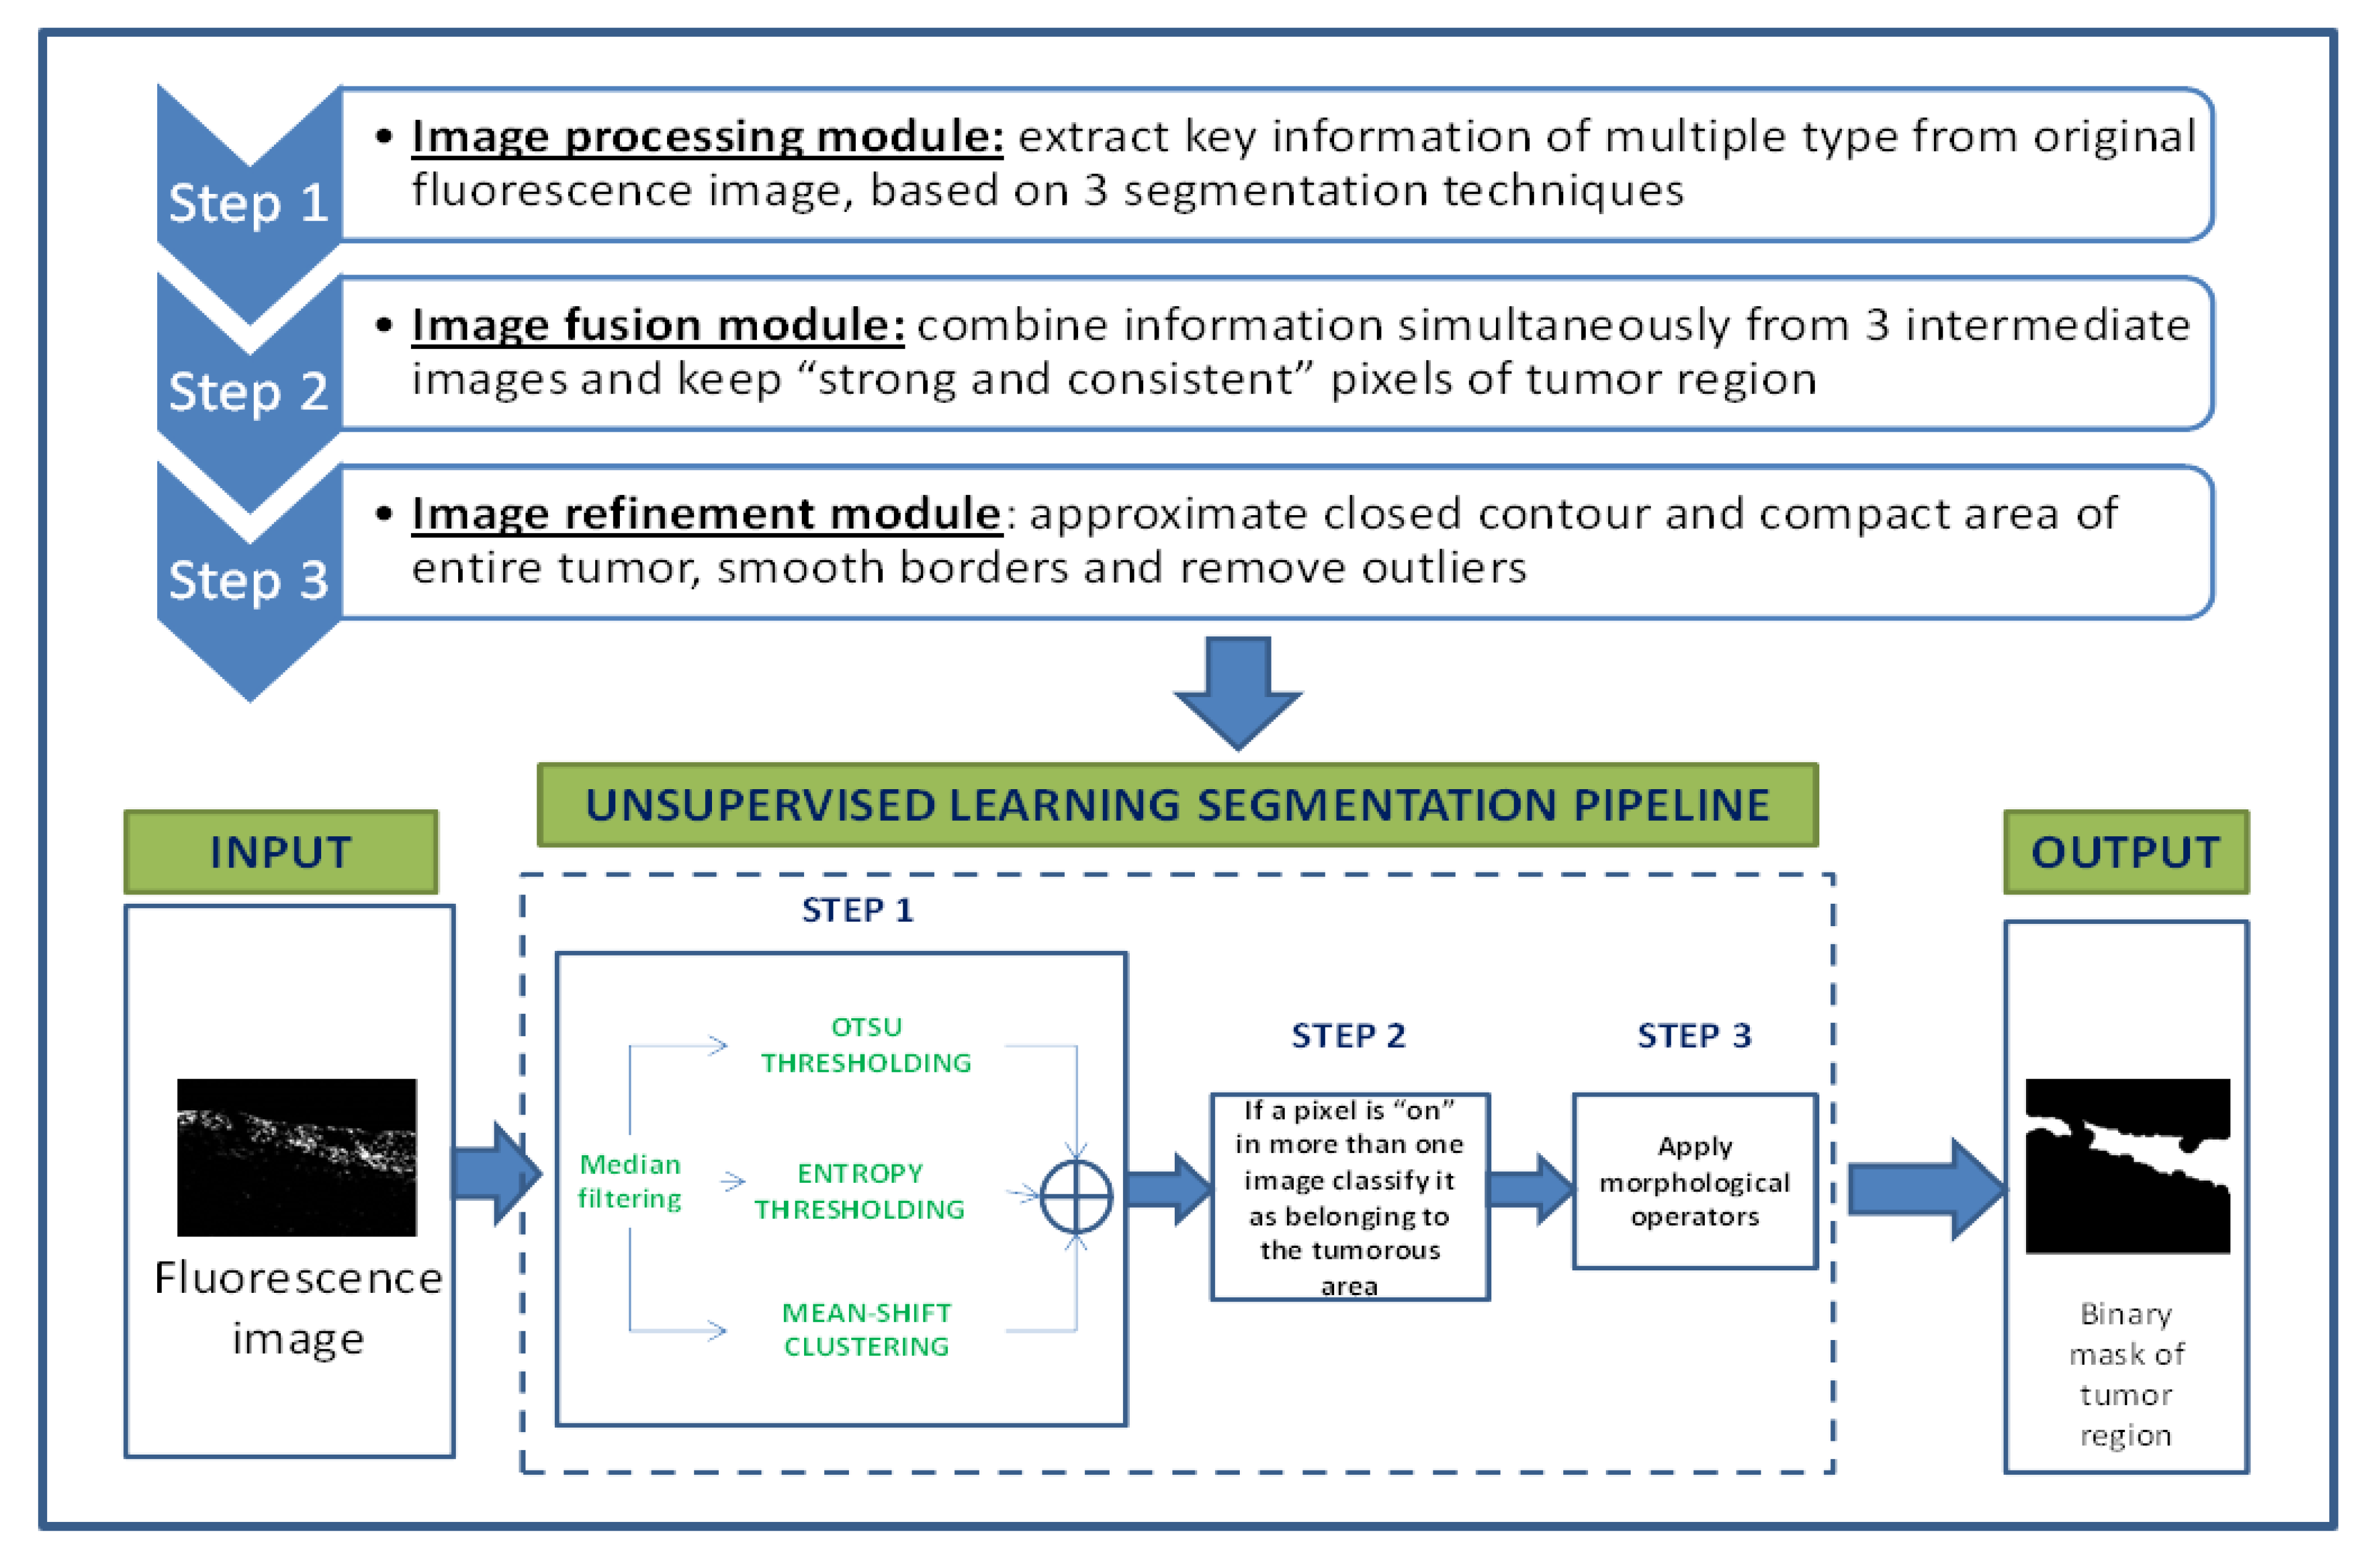
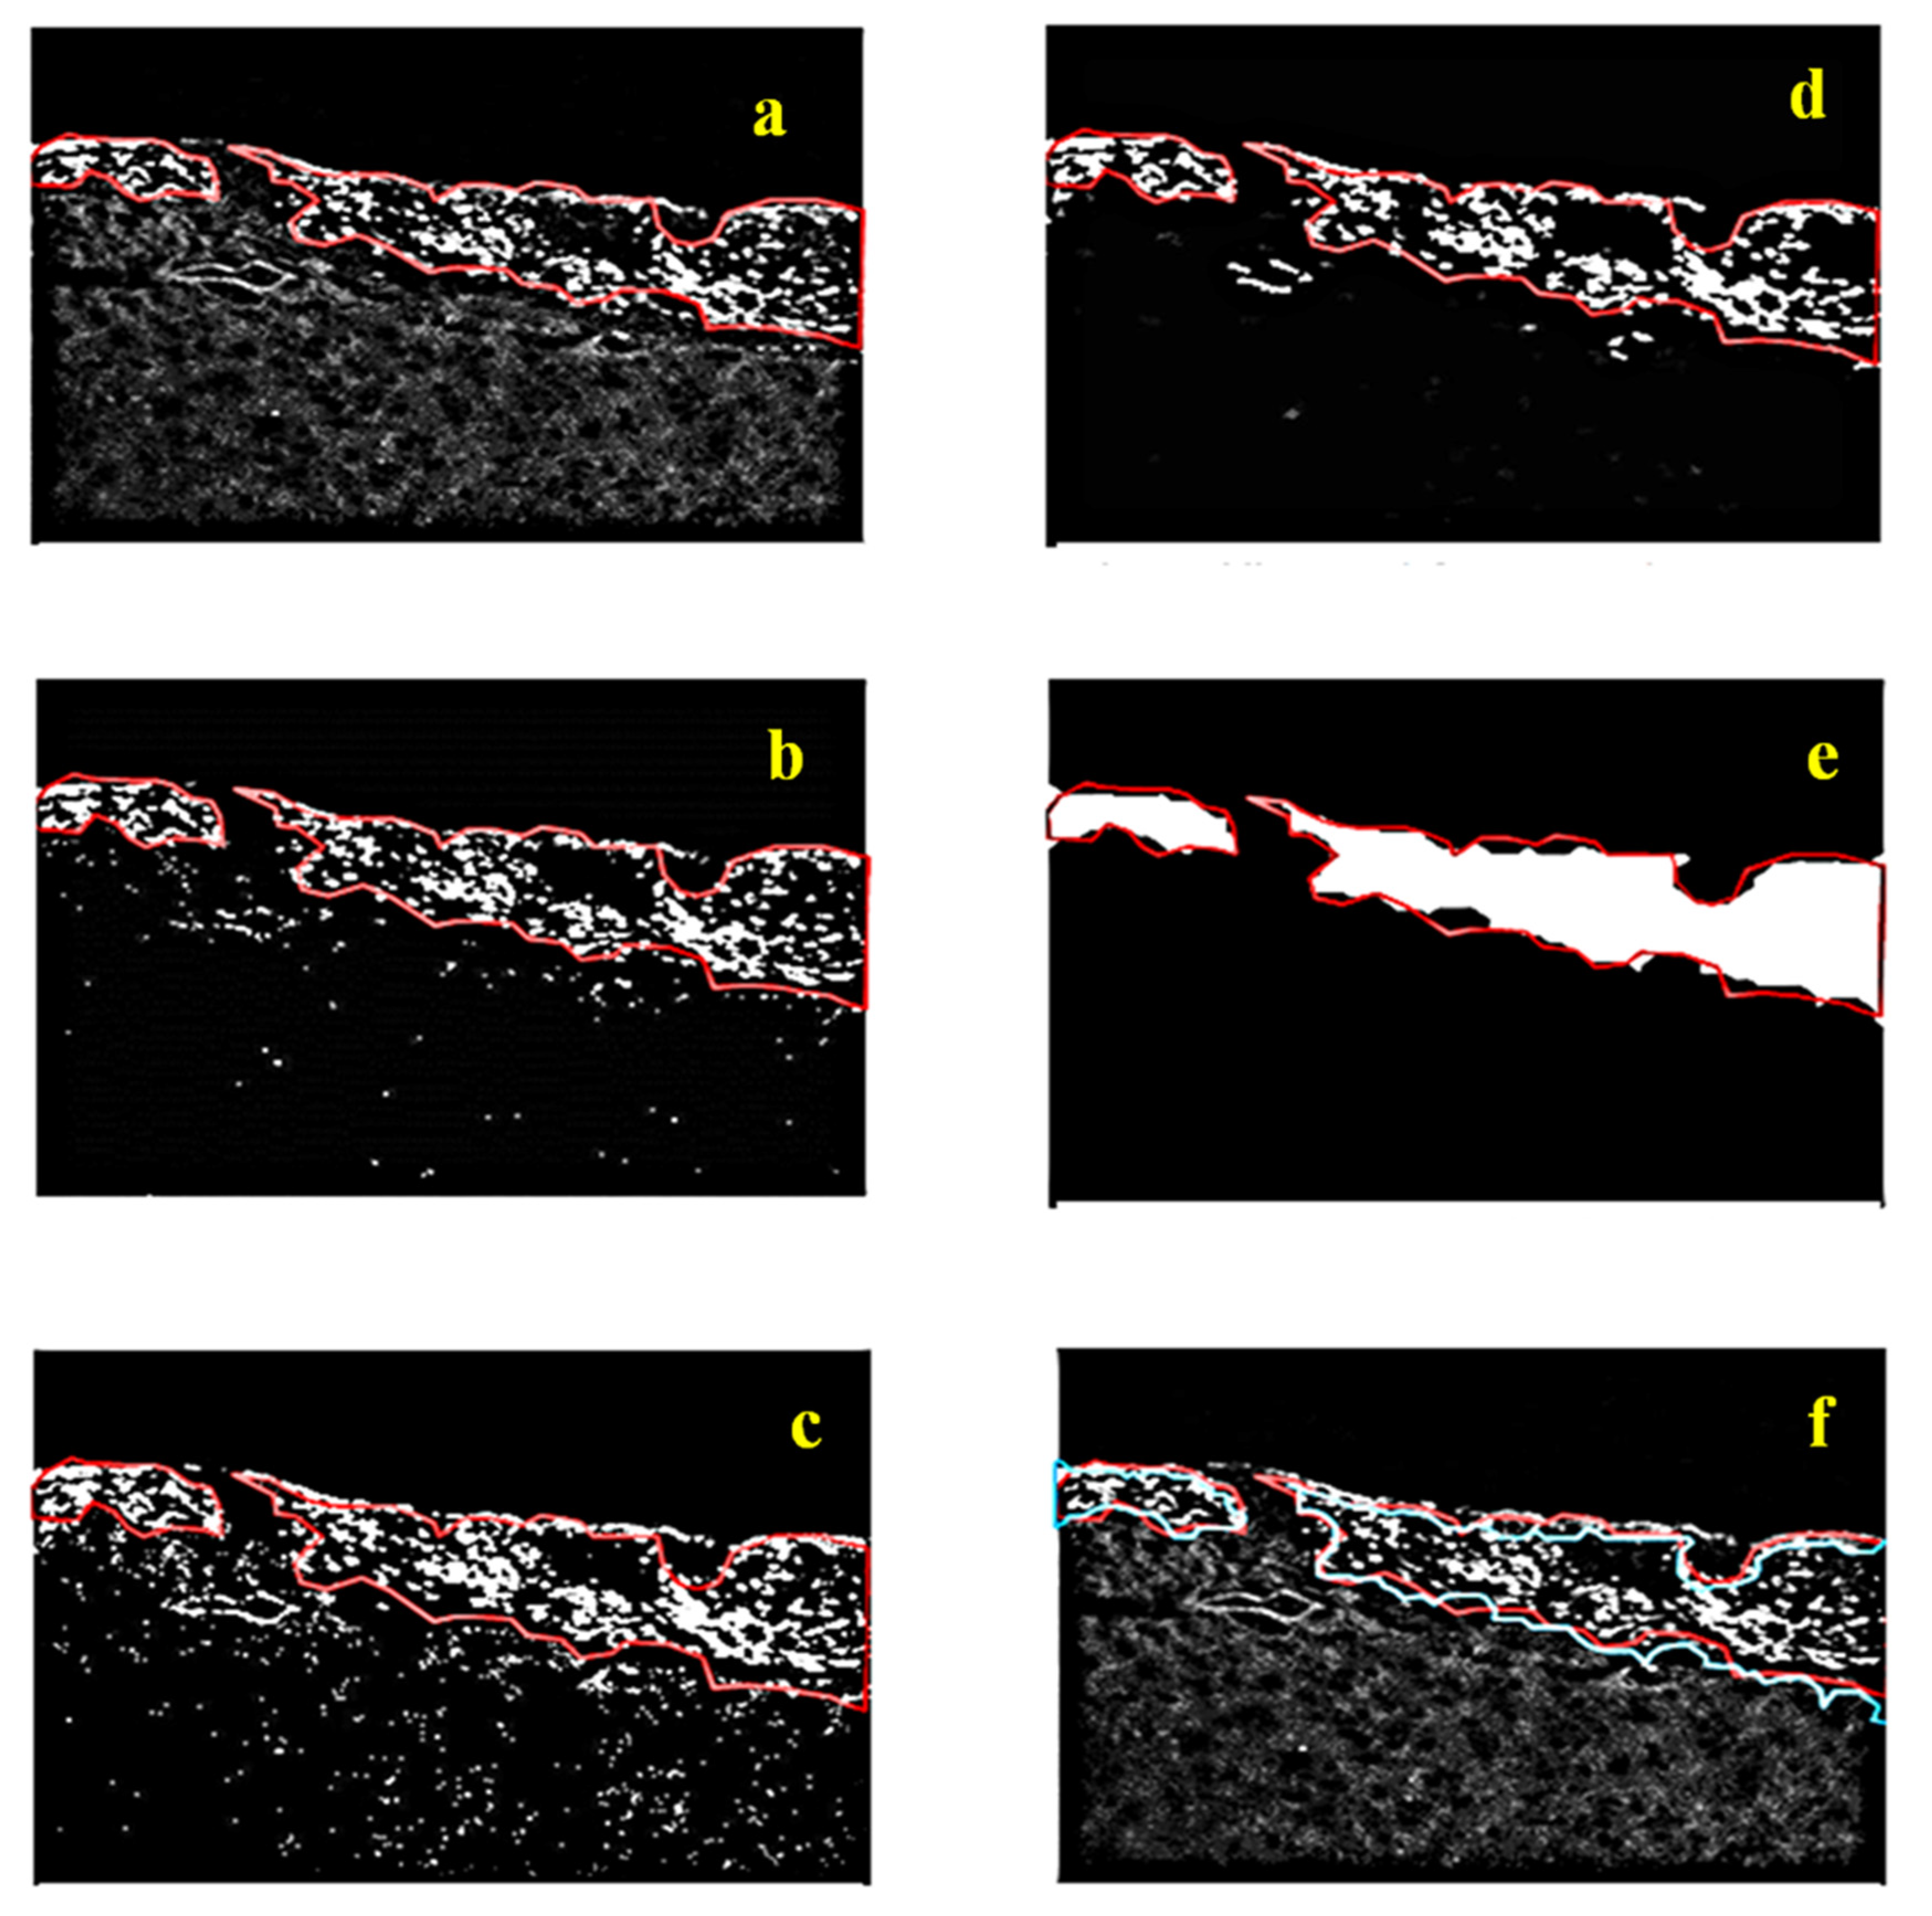
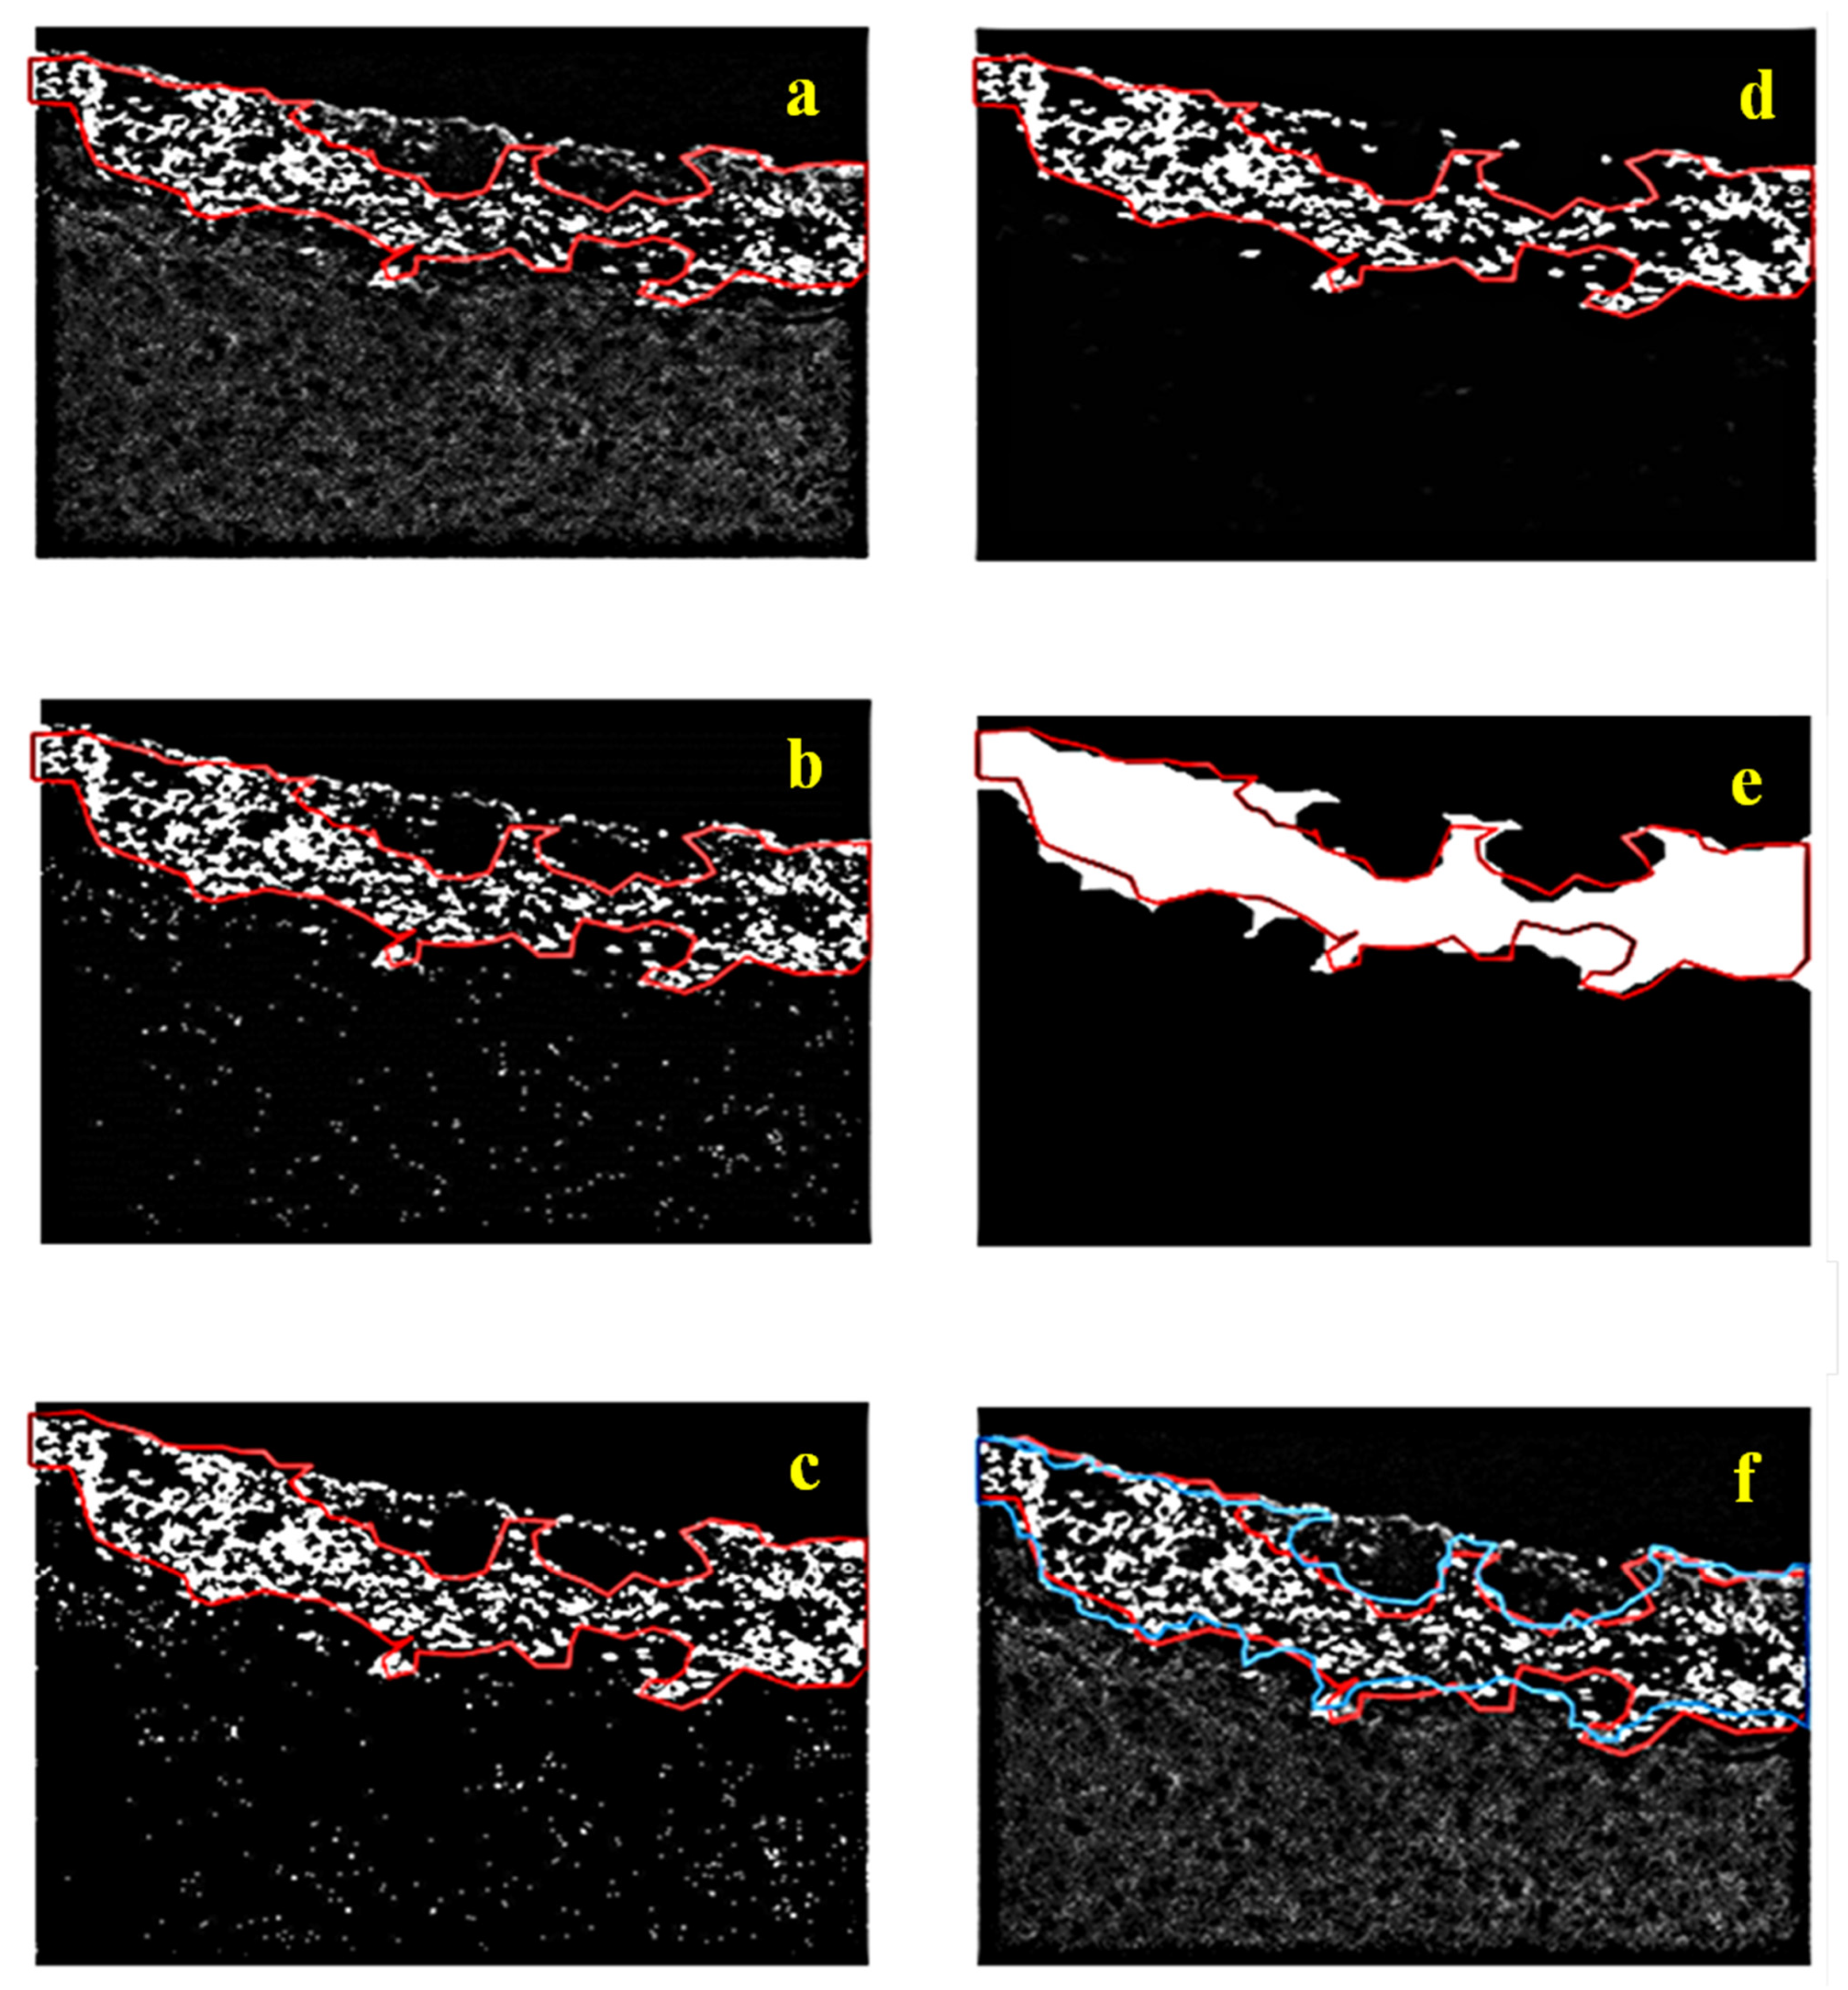
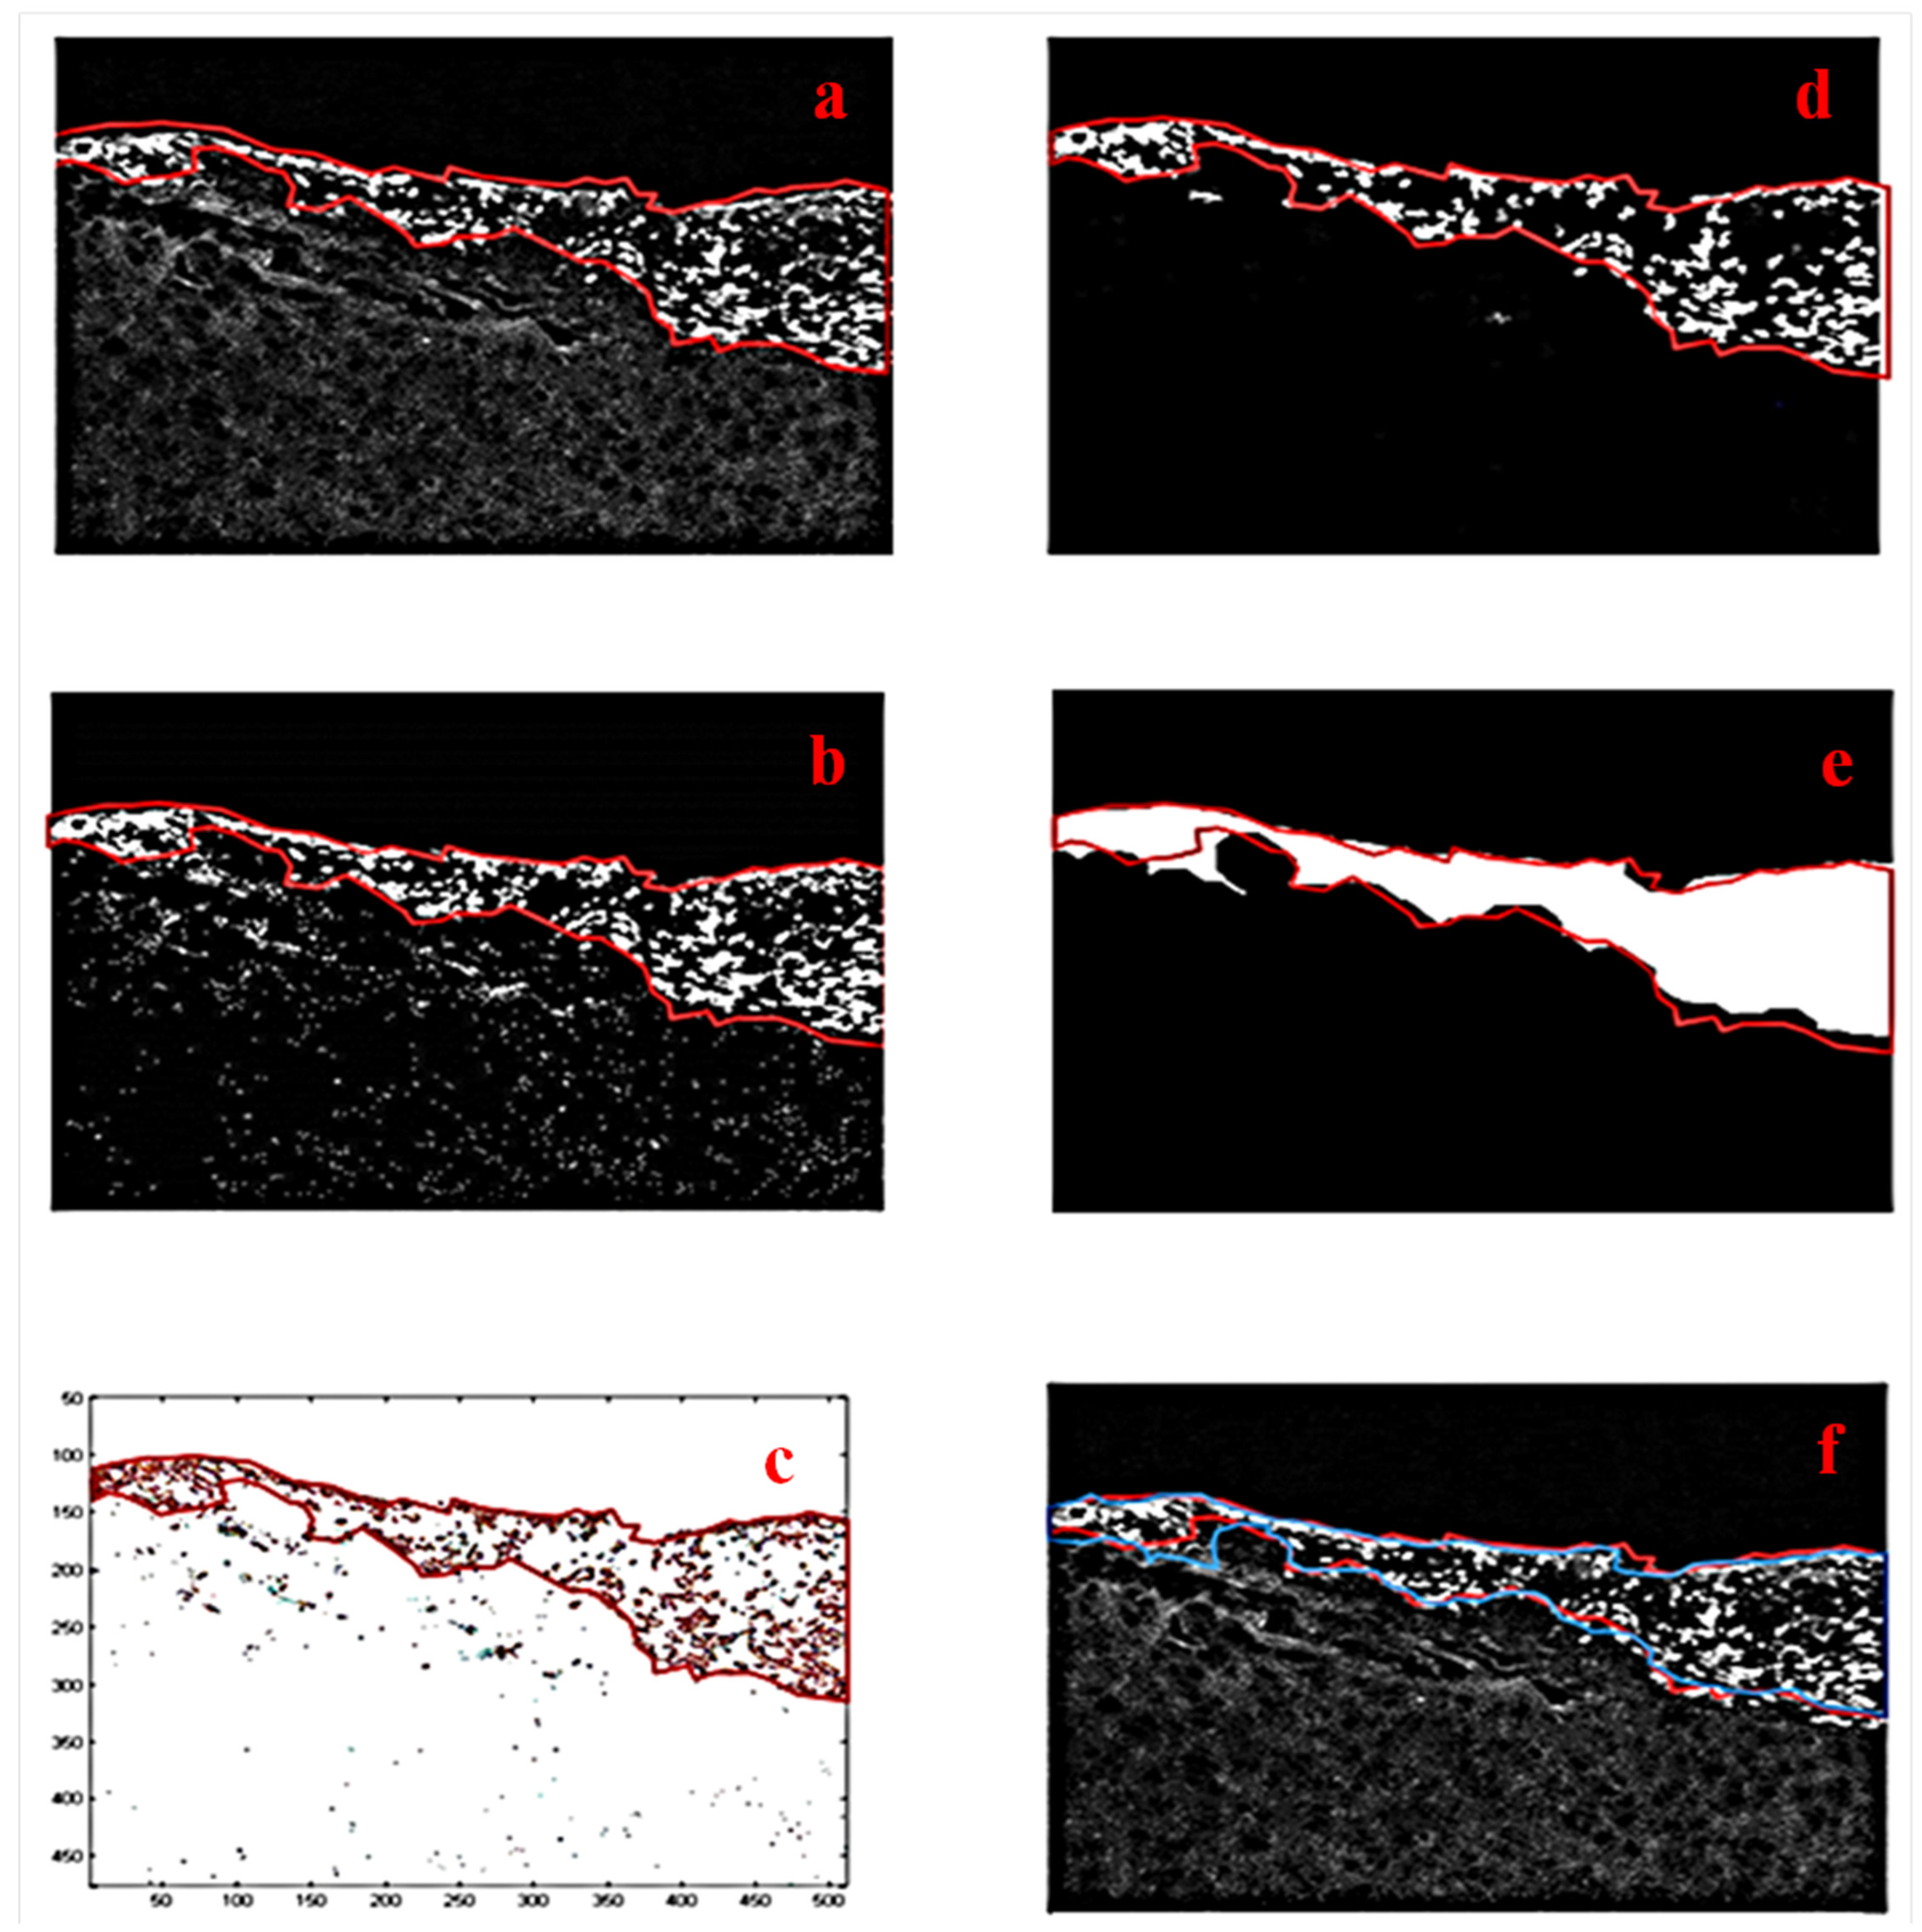
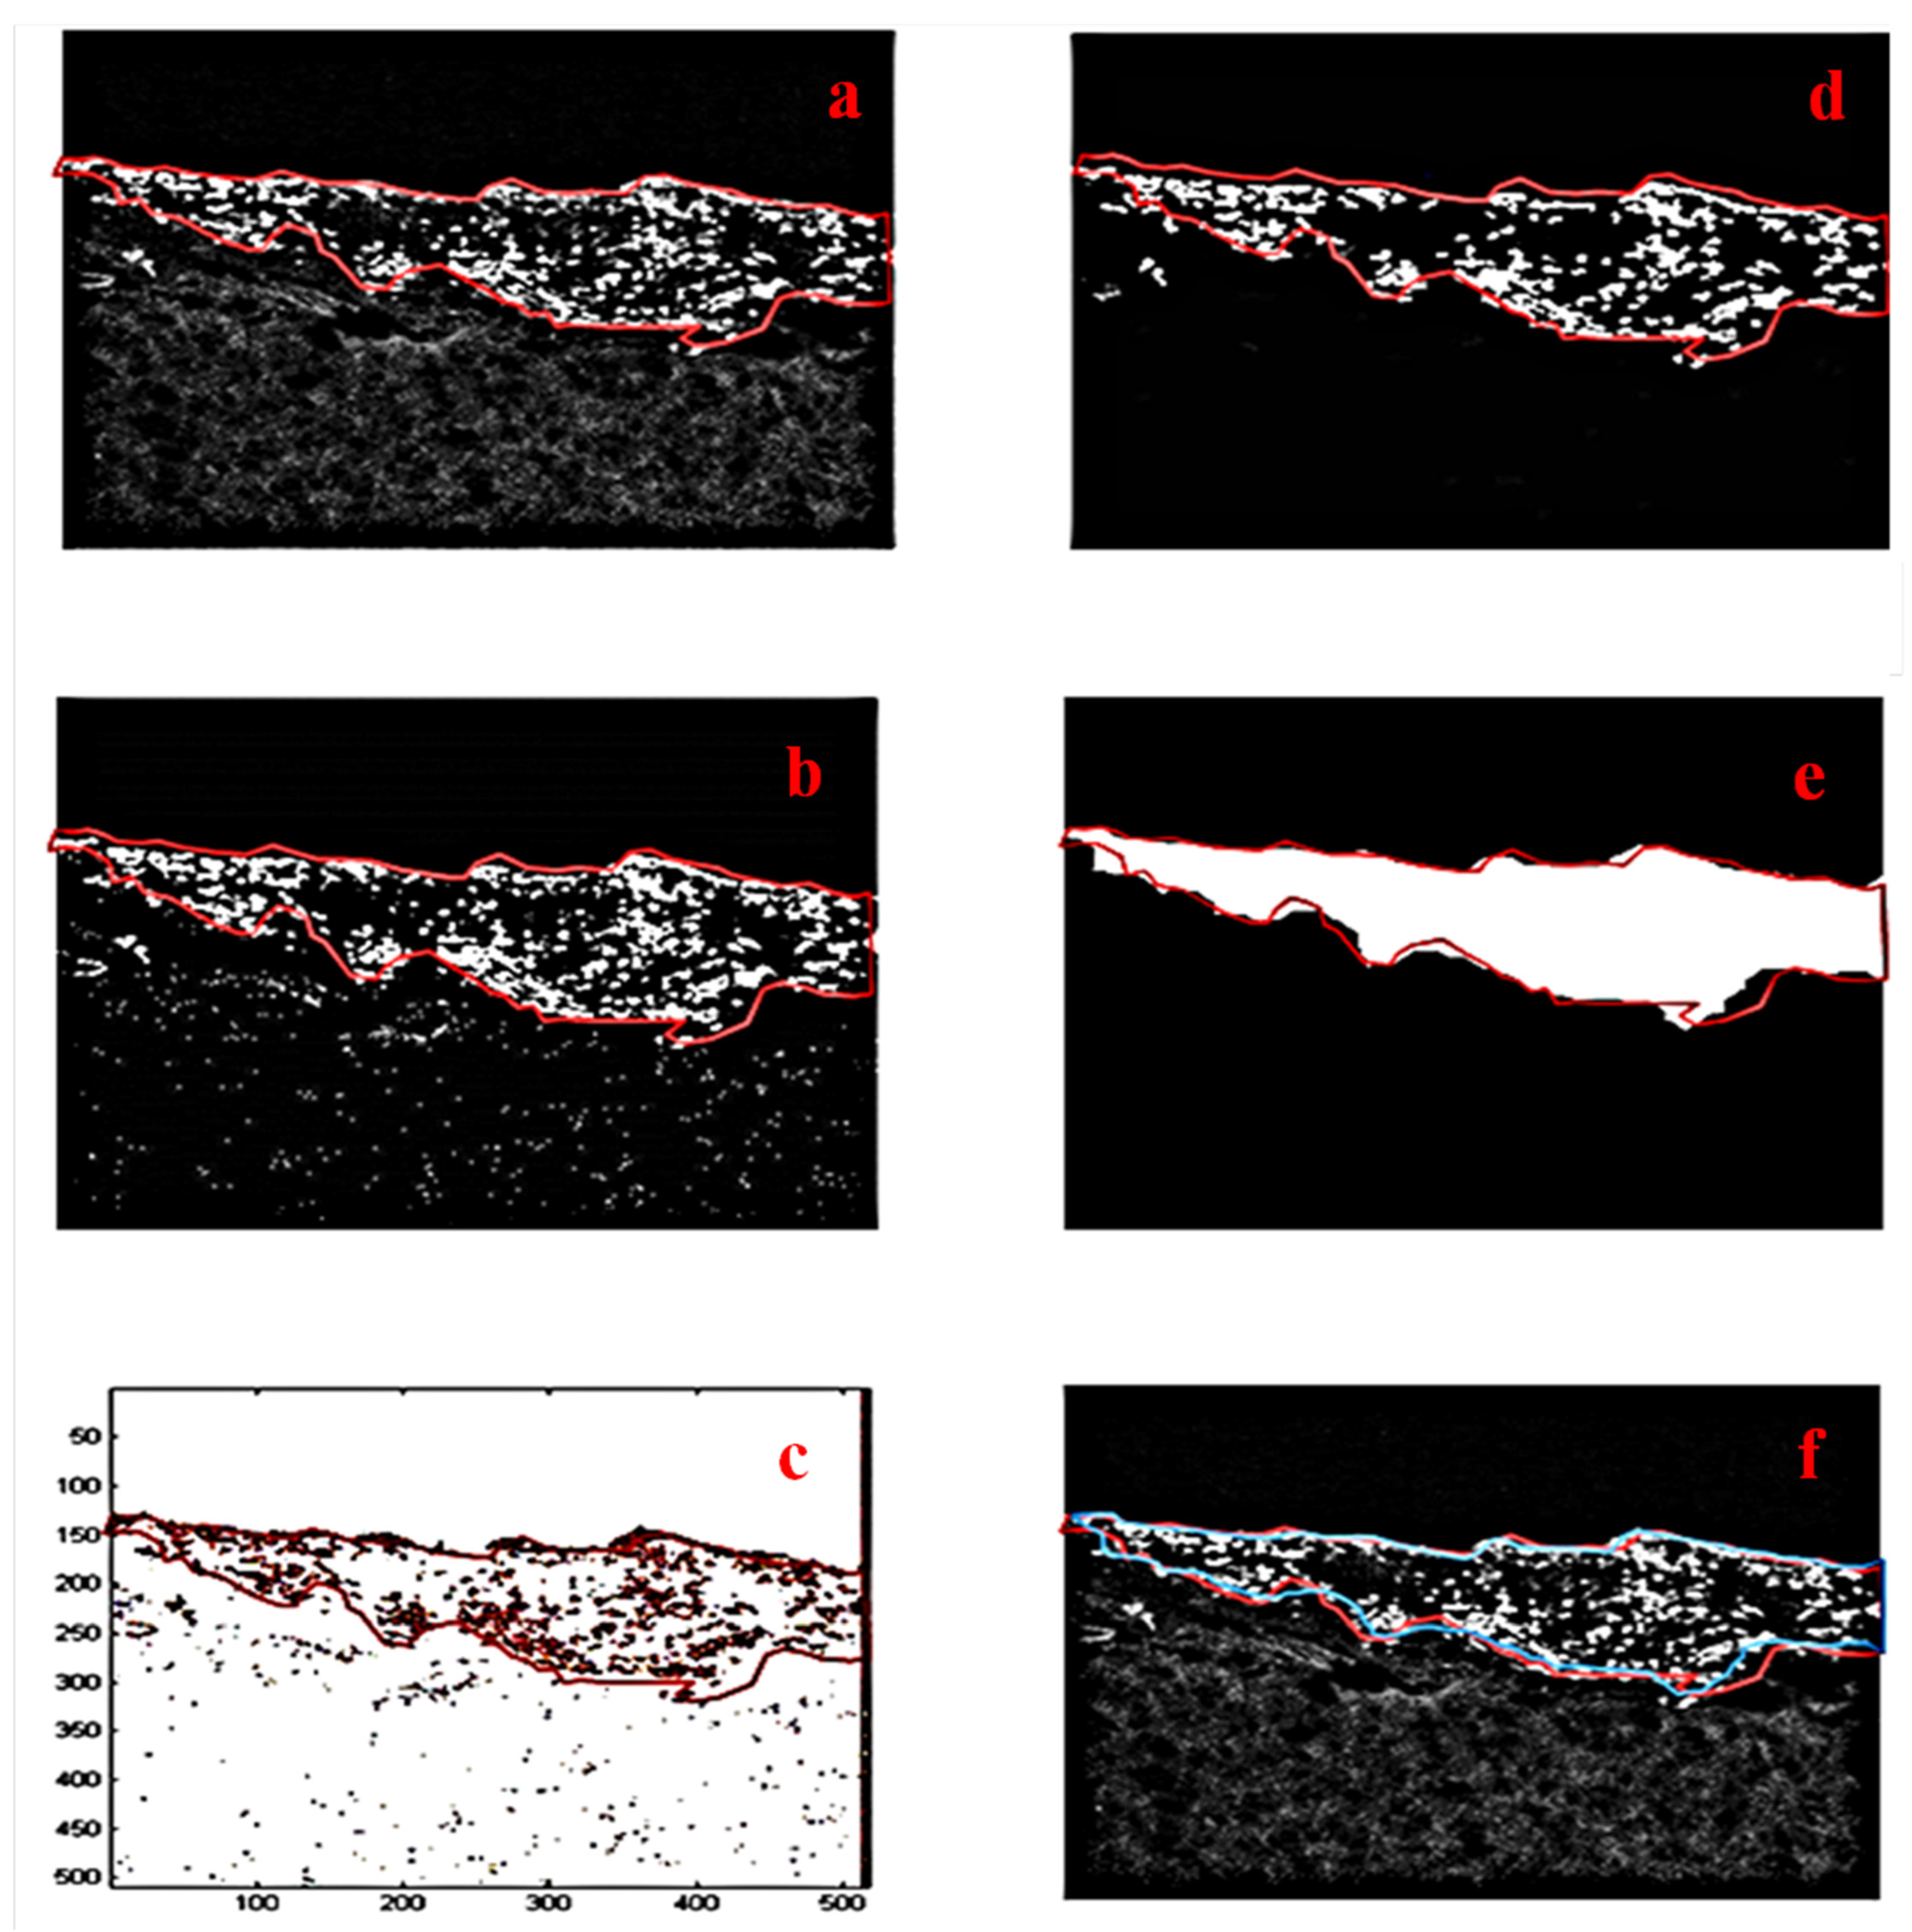
The proposed tumor identification and visualization pipeline of algorithms are shown in 
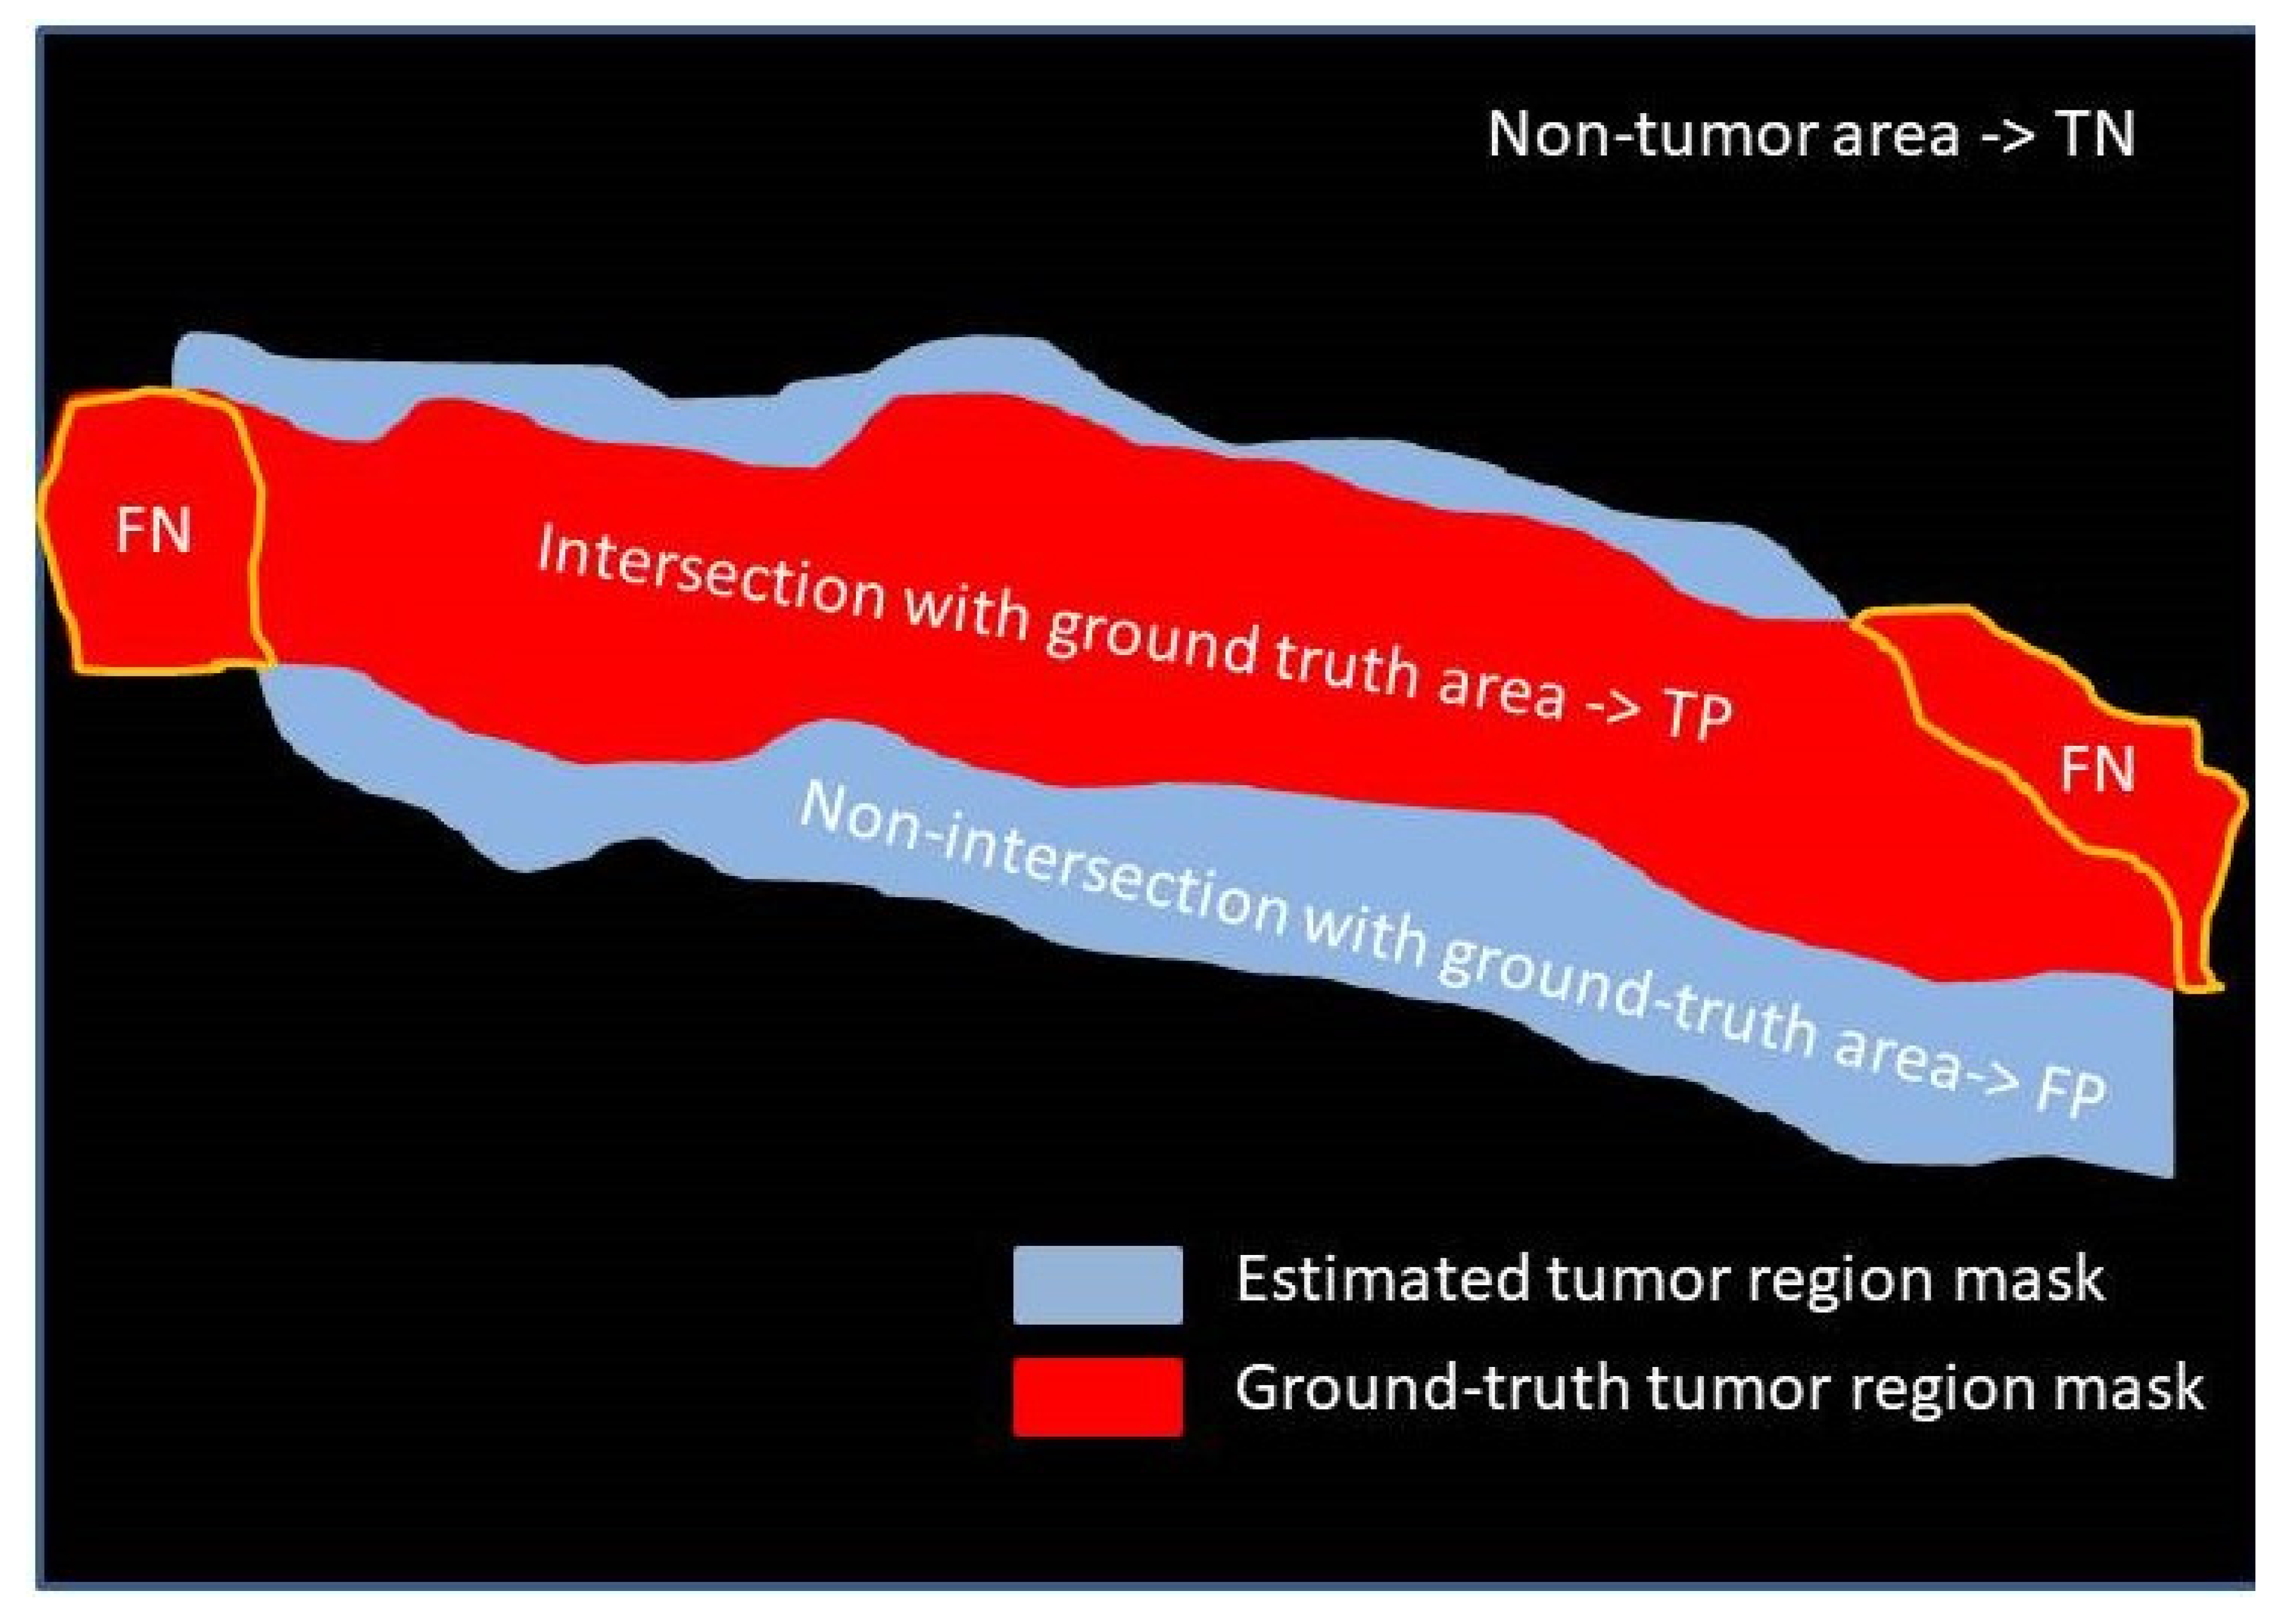
Figure 2. It is based on a three-step framework run in sequential mode, i.e., image processing/segmentation, image fusion, and image refinement modules, each one with a unique contribution to information mining. To quantitatively evaluate the detection accuracy of our fluorescence tumor imaging and identification system, a ground truth image was generated, superimposing the assigned tumor margins marked by a medical expert on the raw fluorescence sample image. Since the accurate detection of tumor margins is impossible, even with dense sampling and biopsy, the validation of the extracted results is performed based on a closed and compact region approximation of the overall tumor surrounding contour produced by the pathologist. Thus, we should note here that the following study is semi-quantitative, as it is affected by the qualitative judgment of the expert. Thus, our evaluation at this stage considers the agreement between the algorithmic and the medical perspectives on the significant tumor area, its extent, and structure. As already mentioned, assurance about the local condition can only be provided by selective biopsy. In our study, the biopsy was performed at three specific small areas in the region of strongest fluorescent response (this biopsy was guided by the proposed imaging modality), which verified the tumorous nature of all tested sites.
The algorithmic identification (segmentation) procedure, the first step of the proposed tumor visualization pipeline, is initiated by performing median filtering (3 × 3 window size) on the original fluorescence image in order to eliminate speckle noise, possibly introduced during the image acquisition procedure. The image processing module is gradually performed in three discrete stages run in parallel: an initial estimation of tumor region is performed by applying the Otsu thresholding technique; meanwhile, an enrichment step takes place via the entropy thresholding approach, which introduces information regarding the background area and refined borders of the cancerous region. At the third branch of the image processing module, the smoothed key segments (those that differentiate most from the background) of the tumor margins are estimated performing the mean shift clustering methodology to the fluorescence sample image. The second step (image fusion module) of the proposed overall scheme proceeds with fusing the results of the three individual image processing techniques applied in the first step and enables us to form the binary mask containing pixels that are active (non-zero intensity value) in more than one segmented images, resulting to a robust estimation of the “strong and consistent components” of tumor margins, i.e., the pixels that are detected as tumor belonging ones by at least two of the three adopted segmentation techniques. The final step of the overall pipeline of algorithms proceeds by applying mathematical morphology (image closing and region filling) to the fused quantized image, acting as a noise/outliers filter, filling out holes and refining borders, and derives the reconstructed geometry of the overall cancerous area as a closed and compact region, illustrating the potential for numerical computations regarding the tumor size, area, shape, and depth.
The notion of “Otsu thresholding” was initially introduced as a non-parametric and unsupervised approach based on the assumption that an image is formulated by pixels from two principal classes (background region and foreground one containing the object/scene of interest), indicating that the image can be represented via a bimodal histogram [46]. Having established this image model, the method defines an optimal threshold value, under an iterative calculation procedure, in order to binarize the image. The threshold value is adaptively determined so that the intra-class divergence (variability between data points belonging to one class) is minimized and, at the same time, the inter-class deviation (differentiation between individuals of the two distinct classes) is maximized. This condition imposes efficient segmentation of the image, because the variance is considered a reliable index for determining the homogeneity of a region. The intra-class divergence is determined as the weighted sum of the variances within any of the two dominant classes, with “weight” representing the a priori likelihood of that particular class. On the contrary, the inter-class variance reaches its maximum by initializing a “starting point” value (threshold) and repeatedly updating it to attain the maximum differentiation between the two pixel distributions.
Another thresholding technique exploited in this study is based on information theory and Shannon entropy maximization. Entropy can be considered as an index that represents the uncertainty of a random variable, thus it quantifies the information present in a dataset or a message [47]. The principal objective of this approach is to partition the image histogram (pixel intensity values considered as the probability distribution) into two different (independent) distributions via the determination of an optimal threshold value that maximizes the randomness of both image region classes, and, thus, enriched information content can be extracted [48,49]. Let P1, P2, ..., Pn be the probability distributions of different pixel intensity values (levels of grey) represented within the image. Let “s” be the threshold value determined for binarizing the image (binary image segmentation). Thus, two independent classes (probability distributions) are outlined; the first one corresponds to pixel intensities varying from 0 to “s” and the second one representing grey levels from “s+1” to “n”. Let these sets be defined as A and B, respectively, according to the following representation:
A : {   P 1 P s , P 2 P s , ,   P s P s } ,   B :   { P s + 1 1 P s ,   P s + 2 1 P s ,   ,   P n 1 P s } ,   P s 0   a n d   P s 1
The entropy values are defined as follows [50]:
H ( A ) = i = 1 s P i P s ln P i P s = 1 P s [ i = 1 s ( P i ln P i P i ln P s ) ] = 1 P s ( i = 1 s P i ln P i ) + ln P s  
Note that the term in the parenthesis in equation 2 encodes the entropy of one part {P1, P2, P3, ..., Ps} of the original distribution {P1, P2, P3, ..., Ps} and should be represented by Hs, for simplicity, and, thus, the quantity H(A) takes the following form:
H ( A ) = ln P s + H s P s  
In a similar way,
H ( B ) = s + 1 n p i 1 P s ln p i 1 P s = ln ( 1 P s ) + H n H s 1 P s  
where Hn refers to the entropy of the original distribution.
The total entropy of the two individual distributions is defined by ψ(s) and is given as:
ψ ( s ) = H ( A ) + H ( B ) = ln P s ( 1 P s ) + H s P s + H n H s 1 P s
The value of “s” that maximizes entropy value (maximum information retrieved) then accounts for the optimal threshold.
The third segmentation technique employed in our proposed algorithmic scheme, the mean shift clustering, attempts to extract complementary information at a different level of data organization by closely analyzing the probability distribution of the sample fluorescence image. This method has been developed on the grounds of statistical clustering as applied in a feature space of the image itself. These features may reflect the intensity distribution (1D histogram space) alone or in combination with the spatial pixel distribution (defining a 3D space), or even the color distribution (in a 3D space). The principal motivation beyond mean shift clustering is the modeling and approximation of input data points as an empirical probability density function, according to which a large number of neighboring samples in feature space (dense regions) are translated into local maxima or modes (most frequent value met in a set of data points) of the corresponding statistical representation (distribution). For every individual (data point) in the processed population, a gradient ascent process is iteratively applied to the locally estimated density until the algorithm converges to an optimal solution. The data points associated with the same stationary point (mode) formulate dominant regions within the image (clusters that contain pixels close to each other and with similar intensity values).
In our application, the mean shift approach operates in the 1D space of intensities. It initially defines a window around each point in the space of intensities and calculates its mean as the “center of gravity” based on the included intensities. In the second step, it translates (“shifts”) this midpoint (center of the current window) to the mean value and repeats the procedure until the stopping criterion is met (convergence is achieved). Conceptually, in each step of the iterative calculations, the window shifts to a denser region of grayscale intensities, until it approximates a local maximum of the total distribution function. This iterative scheme repeatedly assigns every pixel (intensity point) to a class center (mean point) and intuitively calculates the number of dominant regions (segments) within the input signal/image via the final number of the cluster-centroids determined.
The principal concepts of the mathematical background of the mean shift algorithm are briefly presented below. Kernel density estimation can estimate the density function of a random variable in a non-parametric mode. A kernel φ(x) is a non-negative function of a multidimensional feature vector, with which the vector is integrated over the domain of its definition.
This is usually implemented as a Parzen window with its kernel K() representing a rectangular window operating in the space of the n data points {x1, x2, …, xn} and a bandwidth parameter h notation that sustains the physical meaning of the window size indicator. The corresponding kernel density estimator for a given set of d-dimensional points (features) is given as:
f ^ ( x ) = 1 n h d i = 1 n K ( x x i h )  
where h (bandwidth parameter) defines the radius of the kernel. The sample mean (distribution density) around a point x using K is computed as:
m ( x ) = i x i K ( x i x ) i K ( x i x )  
According to the mean shift approach, the vector x is moved to m(x) and the process is repeated until convergence. This iterative movement of x can be interpreted as a gradient ascent on the density contour:
f ^ ( x ) = 1 n h d i = 1 n K ( x x i h )  
where K′() denotes the derivative of K(). Using the specific kernel form
K ( x x i h ) = C · k ( x x i h 2 )
where C is a constant and setting g(x) = −k′(x) as the derivative of the selected kernel profile, we finally obtain the summarized formulas-definitions:
G r a d i e n t   o f   t h e   d e n s i t y :   f ^ ( x ) = 2 C n h d + 2 [ i = 1 n ( x x i ) g ( x x i h 2 ) ] = C n e w n h d i = 1 n [ x i g ( x x i h 2 ) x g ( x x i h 2 ) ] =   =   C n e w n h d [ i = 1 n g ( x x i h 2 ) ] [ i = 1 n g ( x x i h 2 ) i = 1 n g ( x x i h 2 ) ] p r o p o r t i o n a l   t o   t h e   d e n s i t y   e s t i m a t e   a t   x [ i = 1 n x i g ( x x i h 2 ) i = 1 n g ( x x i h 2 ) x M e a n   S h i f t   V e c t o r ] o r   G r a d i e n t   a t   x :   C n e w f G ^ ( x ) ( M e a n   S h i f t   V e c t o r )
where, the first quantity is proportional to the density estimate at x computed with a new kernel (G(x) = Cg g(||x||2). Equation (10) indicates that the mean shift is proportional to the local gradient estimate at point x obtained with kernel K, so that it can represent a path that directs the solution to a stationary point of the estimated density, i.e., a mode of the distribution (or a cluster centroid). It can be observed that the mean shift movement is quick/long for low-density regions (valleys of the corresponding density distribution) but slow/short as term x draws near a mode (until it finally approximates zero value upon coincidence of the point with the mode). The unique quantity of the MSH algorithm to be initially adjusted by the user is bandwidth parameter h, representing the fixed window size to be examined around each data point. This algorithmic parameter is intuitive and application-dependent [51]. Another drawback of MSH is the low speed of convergence (especially in cases of high-resolution color images), but substantial research effort has been devoted to speed-ups and improvements.
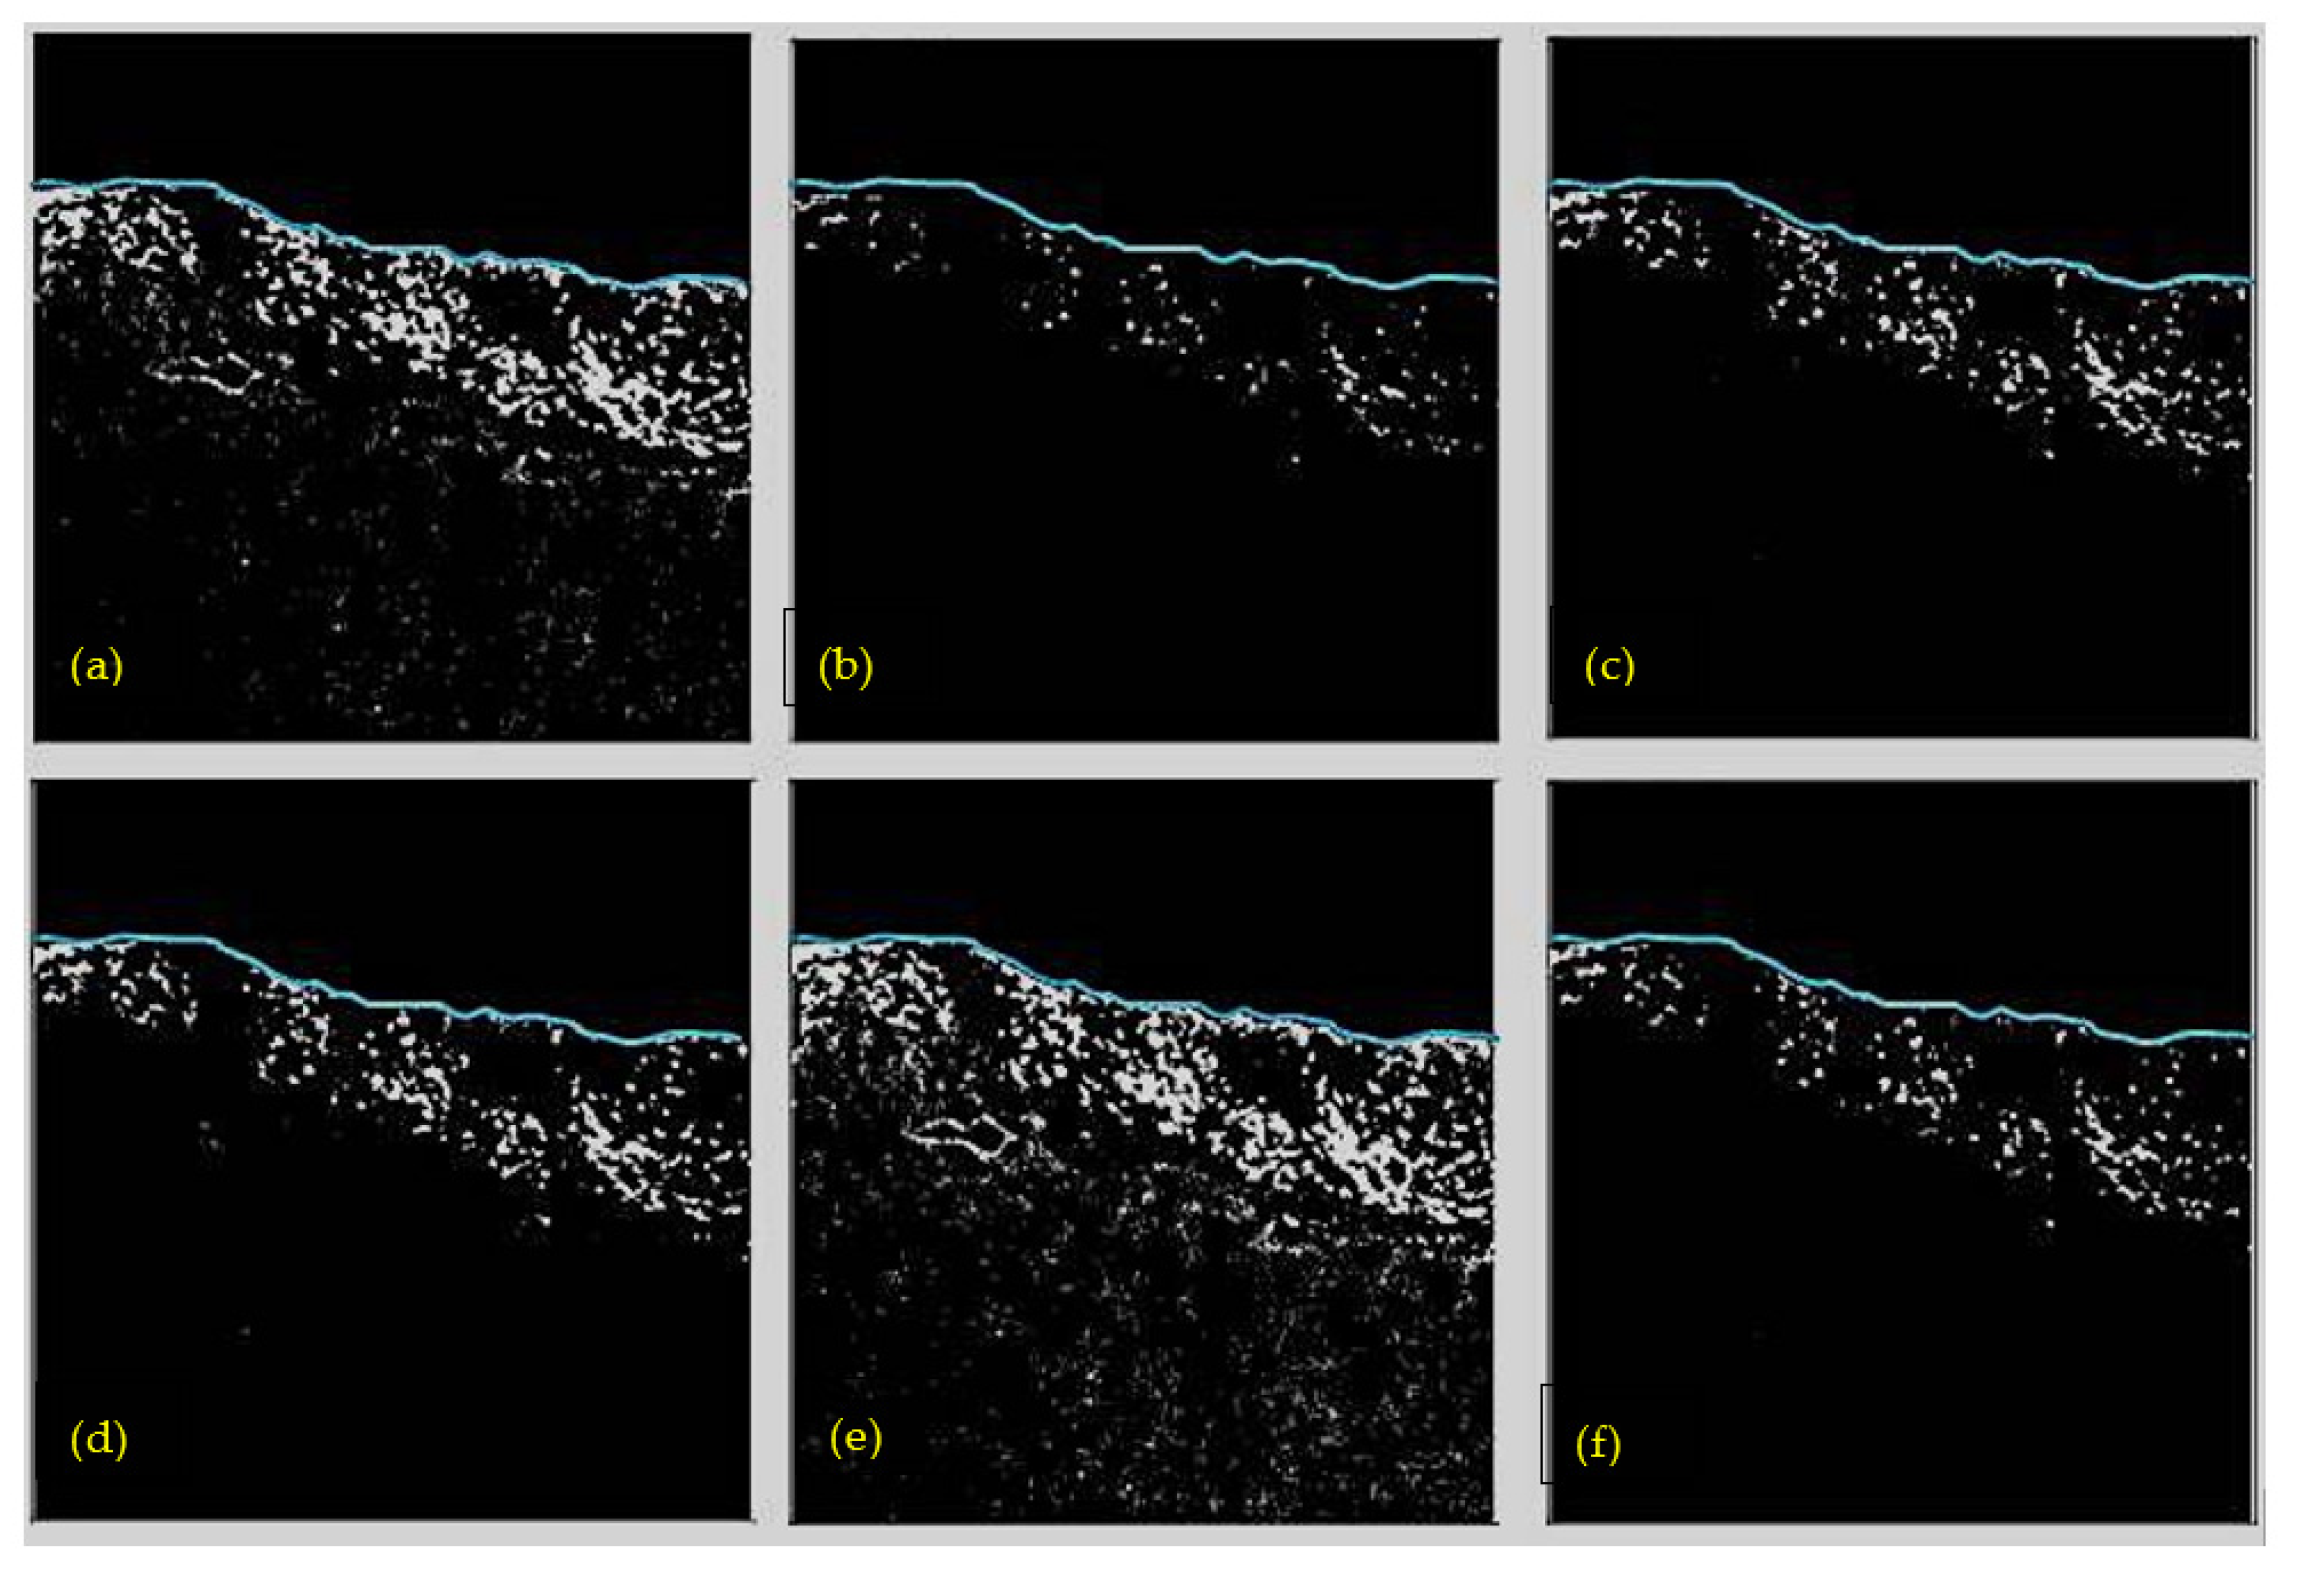
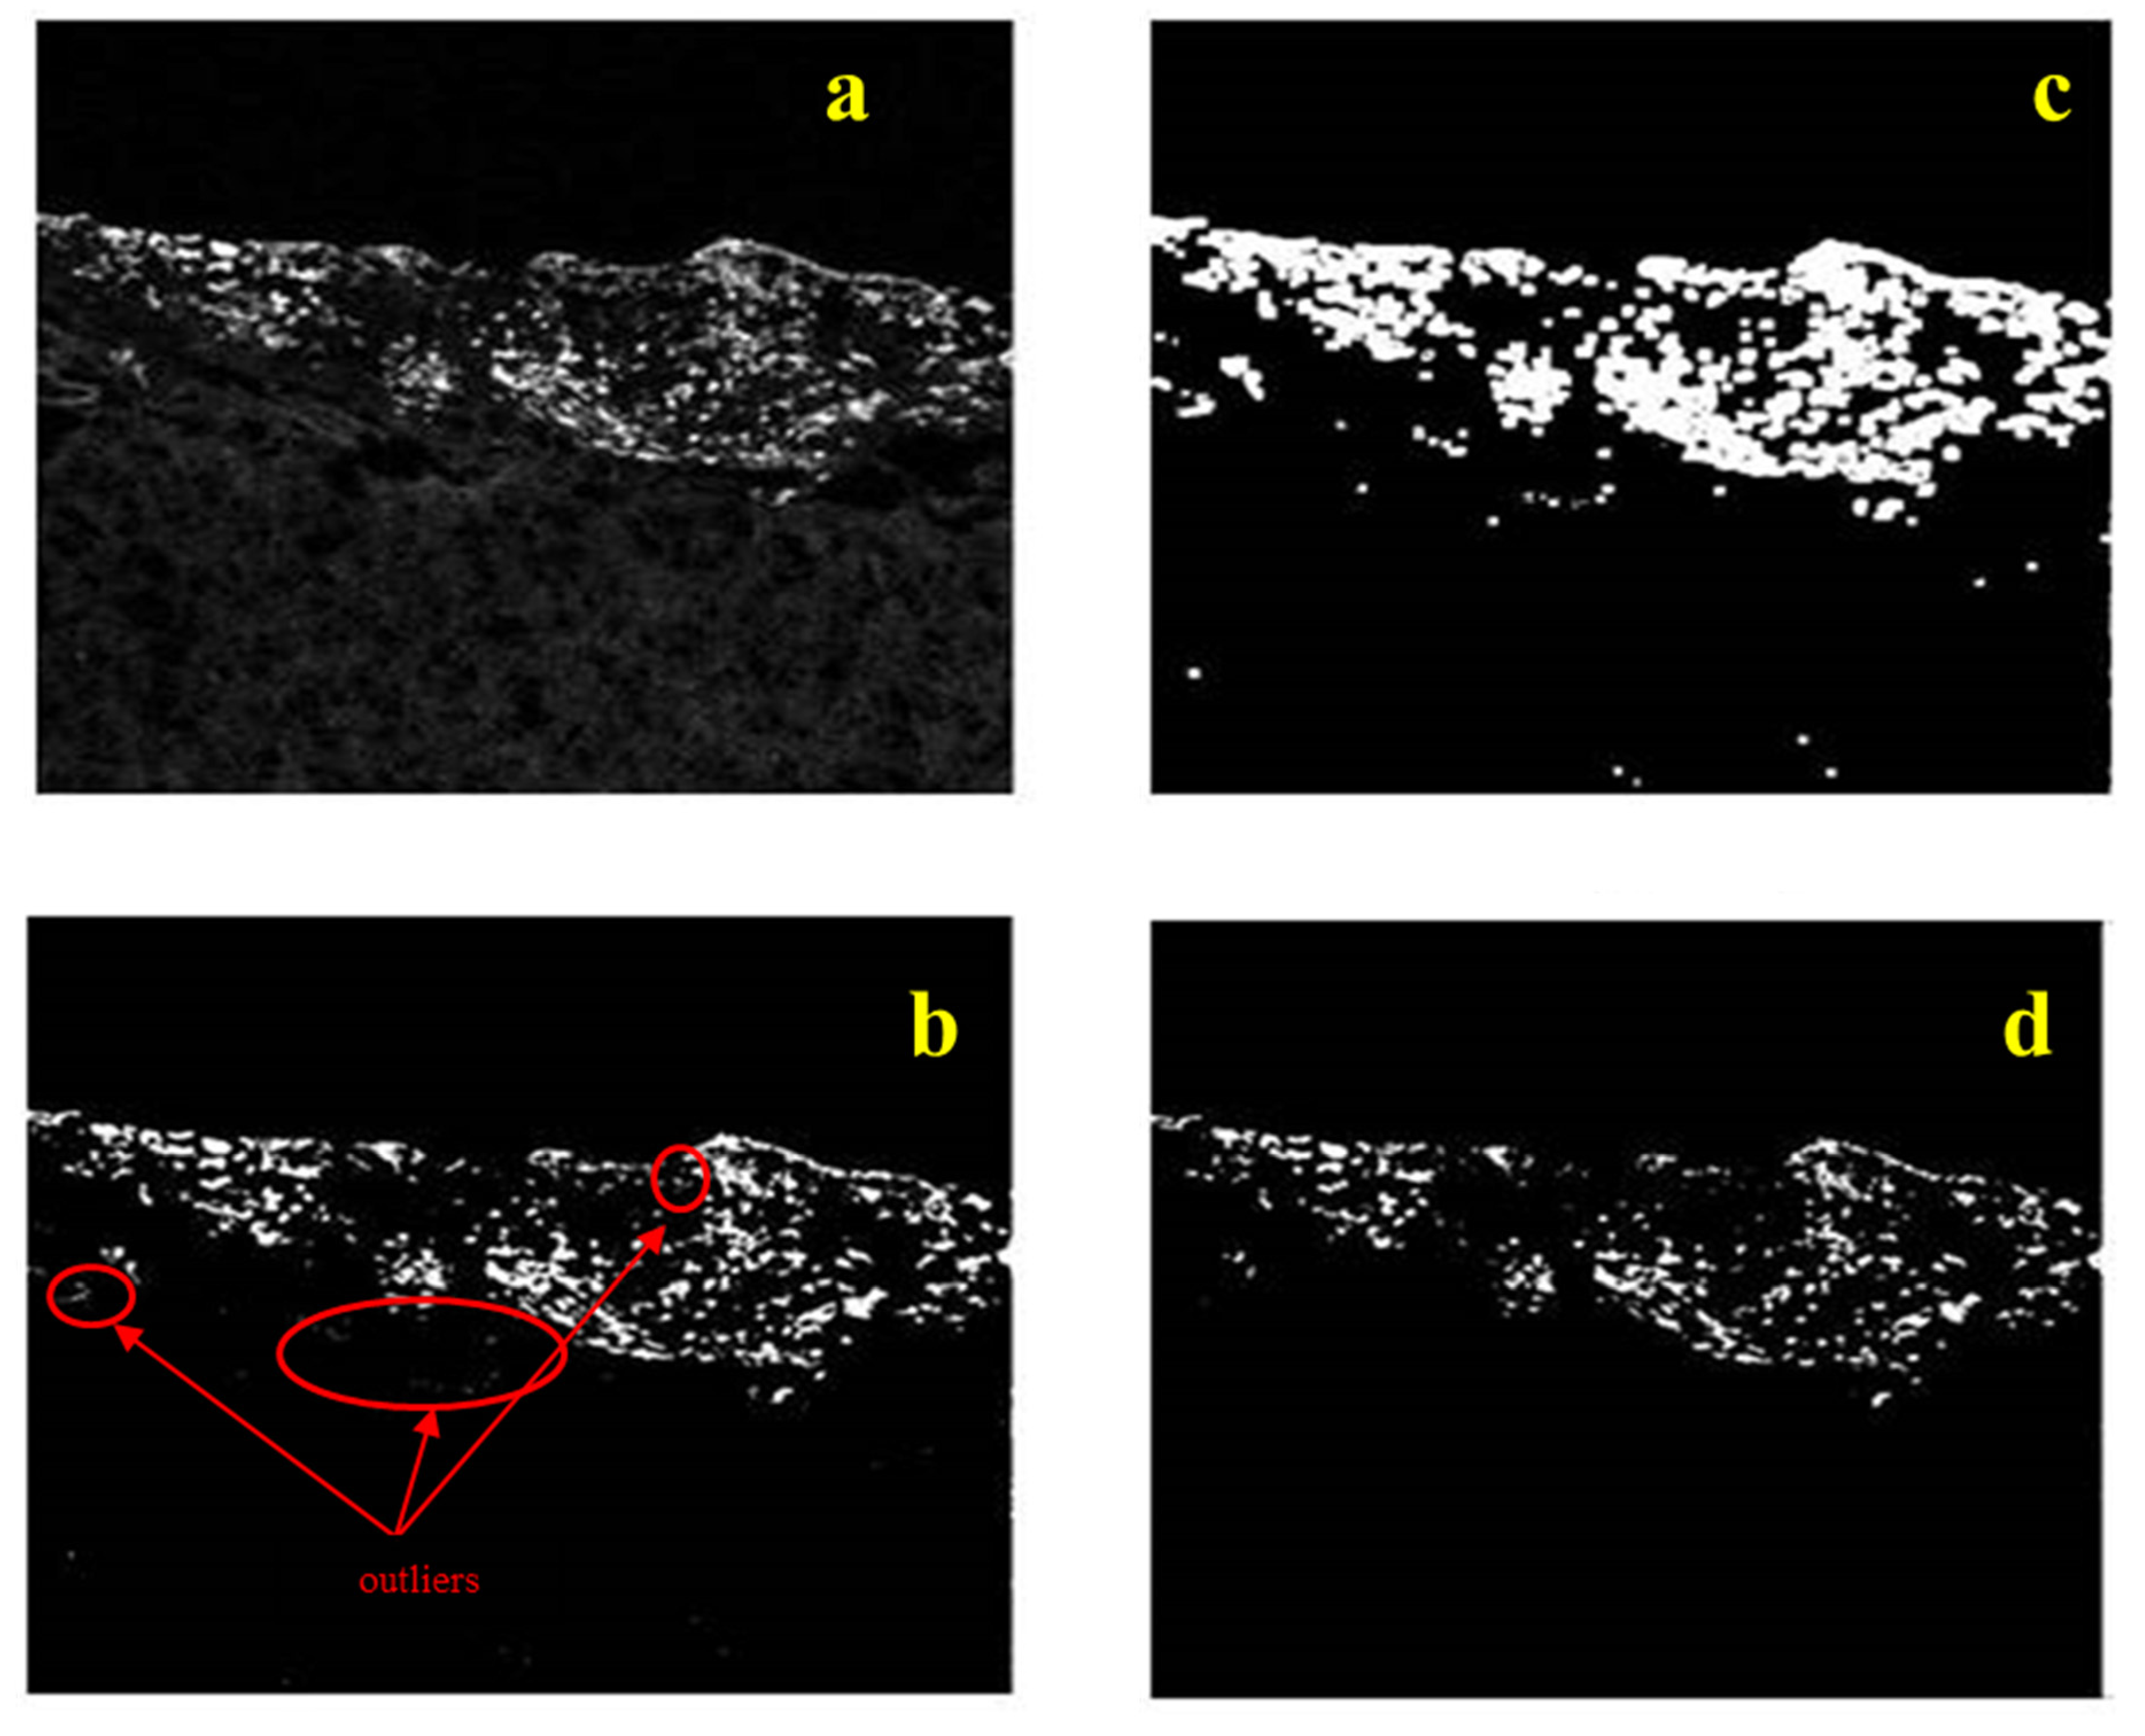
At this point we can define a contour plot for each algorithmically defined image, denoting the borders of cancer areas detected. These areas essentially form small clusters of tumors affecting the healthy tissue and, as such, they can be used as topological markers for obtaining samples for biopsy. The result of entropy thresholding appears to be most appropriate for such purposes, as explained in the results section. However, to increase our confidence in the definition of cancer areas, we fuse the results of individual segmentation schemes. Our assumption for fusion is that if a pixel is “active” (value 1 in the binary output image, yet the background is set to zero value) in two or more segmentation techniques, then this point is assigned with an increased probability of belonging to the tumor section since corresponding pixel information is examined and validated in more than one segmented image of the fused pipeline. Thus, the proposed segmentation mask is derived from the cancer pixels detected in at least two of the three segmentation masks. At the final stage of processing, morphology operators are applied to the output binary mask to derive a compact region representing our gross estimate of the tumor spread with filled gaps and connected components. For the requirements of this study, we utilize the morphological operators of “image closing” with a disk structuring element of radius 19 and “flood-filling” of 8-neighbor connectivity, in order to refine the overall tumor region and fill in the holes within the extracted region of interest. A detailed analysis of the mathematical morphology and the corresponding operators can be found in [52]. This solid estimate of the tumor can be further analyzed for shape and size calculations, providing additional topographic information to the medical expert.

4. Results and Discussion

In order to perform qualitative and quantitative assessments of the efficiency of the proposed framework, ground truth information was determined by a medical expert, who manually marked the tumor region external boundaries on each fluorescent image sample of the dataset. The overall region included in the ground-truth-determined margins is considered as the ground truth binary mask, which was used to calculate the segmentation performance metrics to be depicted in the following subsections. As true positive (TP) pixels we consider the pixels of the binary mask extracted via the proposed segmentation pipeline that are active in the ground truth tumor margin region (intersection of estimated tumor mask with ground-truth one), as true negatives (TN) the pixels of the calculated binary mask that have been successfully classified as non-belonging to the tumorous area (background area that does not intersect with either of the two masks), as false positives (FP) the image positions that are active in the estimated tumor margin but are not present in the medical expert’s evaluation mask (non-intersection of estimated tumor mask with ground-truth mask), and as false negatives (FN) we consider the pixels of the ground truth tumor mask that have not been included in the estimated tumor region. The overall consideration is more clearly illustrated in Figure 3.
The results of Section 4 are articulated into four subsections: (a) Methodological Efficiency at Various Depths of Observation; (b) Efficiency of Image Processing Tools; (c) Evaluation of Detection Results; and, (d) Qualitative and Quantitative Comparisons with Other Segmentation Techniques.

4.1. Methodological Efficiency at Various Depths of Observation

In order to assess the effectiveness of fluorescence imaging at different depths of penetration, we designed an experiment to view the same tissue slice at depths of 10 μm, 40 μm, 60 μm, and 120 μm preserving comparable spatial resolution (zoom level). This was done by adjusting a square window (blue borders) at the same horizontal and vertical coordinates in each image. The images presented in Figure 4 were examined by a medical expert to assess the similarity of regions and also assign distinct tumor regions of interest. Three areas of tumor concentration are depicted at depth 10 μm, which are indicated by the colored arrows in Figure 4. The same regions are tracked over different depths allowing the evaluation of their growth/penetration patterns. The first area (blue arrow) shows significant penetration up to 40 μm, whereas the second region (pink arrow) penetrates deeper up to 60 μm. The third region (green arrow) appears to be the most aggressive tumor formation; it spreads to the right and penetrates all the way to 120 μm. Based on the assessment of the clinician, the fluorescence imaging technique has a good capacity to encode the structure of the tumor and its borders at various depths of penetration. The subsequent enhancement by image processing approaches is expected to clearly reveal the topological characteristics of the tumor and enable quantitative measurements of its structure.

4.2. Efficiency of Image Processing Tools

For a qualitative comparison of the proposed thresholding-based segmentation technique with other standard methods in order to estimate the amount and kind of information to be retrieved and could be indicative for the pathology expert; a set of results from various thresholding methods is illustrated in Figure 5. The original test image is at 10 μm slice depth. The following are brief descriptions of the methods used for comparison:
  • Minimum thresholding—assumes a bimodal histogram like the Otsu method and uses a running average method (of window size 3 × 3) until 2 maxima are met.
  • Intermodes thresholding—also assumes a bimodal histogram and uses a running average to calculate two maxima. The threshold is selected as the average of these two maxima.
  • IsoData thresholding—divides the image into object and background classes using an initial threshold. The next step is to calculate the average of the pixels below and above the threshold value. The mean of these values is calculated in order to update the threshold. The process is repeated until the threshold value is higher than the composite average [53].
  • Li thresholding—uses Li’s “minimum cross entropy” [54,55], forming a reconstruction of the image distribution.
  • Shanbhag thresholding—assumes the image consisting of two fuzzy sets with each pixel assigned a membership function of belonging to one of the two classes (object and background). The segmentation is determined by the frequency of occurrence in each set [56].
The tissue border origin is indicated with a blue color, implying that the area under the marked curve reflects brain tissue. The tumorous cell locations are represented by high-intensity (white) segments, while the remaining (grey) area constitutes healthy tissue, discriminated from the cancerous area in terms of its decreased intensity. We notice that the minimum, intermodes, and Shanbhag thresholding approaches have missed a remarkable amount of information related to the tumor region (upper bright section of the image) because they have completely eliminated the background regions representing the healthy brain and intermediate tissue. In the IsoData result, the estimated cancerous section has been significantly increased with true positive pixels, yet the content of information is inferior to that of the entropy thresholding technique. In addition, the second class of pixels (corresponding to tissue background) has been eliminated as it is of limited importance. Finally, the method of entropy thresholding sustains a better signal to background ratio and improved contrast with respect to Li thresholding. Among the algorithmic schemes, entropy thresholding has proven efficient for the identification of brain tumors in several images tested and is the method selected for further consideration.

4.3. Evaluation of Detection Results

Figure 6, Figure 7, Figure 8, Figure 9 and Figure 10 illustrate the raw fluorescence images containing the brain tissue in various slice depths (10 μm, 30 μm, 60 μm, 100 μm, 120 μm, and 150 μm) along with the estimated tumor margins after the application of the proposed unsupervised learning segmentation scheme, using the three-step imaging algorithm. The ground truth marked tumor borders designed by the medical expert are superimposed in each image and highlighted with a red-colored curve, constituting the expert approximation to be attained and reflecting a base of quantitative measurements of the accuracy of our proposed scheme. The algorithmically derived area in each figure is indicated by the compact white regions, discriminating the cancerous cell segments from the remaining tissue and the background. The estimated tumor borders and tumor segments are presented at several stages of processing. The results from the individual segmentation approaches are first presented, revealing the different aspects of information that can be extracted. The extracted binary mask representing the overall brain tumor region is depicted as a compact white area corresponding to the geometrical topology of the cancerous tissue. Finally, the algorithmically derived tumor borders are depicted with a blue color, so they can be compared with the expert borders and used as quantitative metrics of the identification efficiency. Notice that both the geometry and the dimensions of the tumorous area have been reliably reconstructed, emphasizing the potential of the proposed fluorescent imaging system. We note the efficiency of the mean shift clustering sub-procedure to filter out the non-tumorous segments, enhancing the segmentation and margin identification accuracy. The geometry of the cancerous brain tissue has also been correctly reconstructed. At this stage, we can also emphasize the efficiency of the entropy thresholding procedure to derive contrast-enhanced cancerous particles. The contour map of the fluorescence image after this processing step is depicted in Figure 8c. The cancerous cells (bright red color segments) have been accurately assigned and depicted within the ground truth tumor borders. In addition, outside the marked tumor area, the method has also assigned tumorous kernels, which are not significant in the present tumor formation but may be considered suspicious for subsequent examination.
Figure 9 depicts our results at a rather large depth of 100 μm. Along with this experiment, Figure 9b demonstrates the efficiency of Otsu thresholding to provide an initial estimation of the region of interest. This process reveals the cancerous cells within the marked area of interest, but also introduces many other small structures throughout the image, which are due to small intensity deviations and do not reflect information of interest. These structures are eliminated by the subsequent procedure mean shift segmentation. Furthermore, the entropy thresholding in Figure 9c again captures cancerous cells of interest (bright red color segments) with good correspondence to the expert margins. Figure 10 depicts the expert and approximated tumor borders superimposed on two fluorescence images at depths 120 μm and 150 μm, respectively. It is important to note how the appearance of irregularly shaped cancerous regions appear in different slice depths, exemplifying how difficult it is for a pathologist or a surgeon to form an accurate estimation of tissue status and tumor spread. The proposed segmentation methodology proves robust and accurate in identifying geometry and dimensions of brain tumors and margins in different tissue slice depths from the captured fluorescence images, emphasizing the potential of the proposed fluorescent tumor visualization and identification framework.
Looking at Figure 6, Figure 7, Figure 8, Figure 9 and Figure 10 it could be pointed out that the proposed approach tends to over- or under-estimate the region of interest (ROI). The overall conclusion extracted through the testing procedure is that the effect of mis-segmentation of ROI mainly depends on the structure of tissue and the spread/geometry of the tumor over it. Under-segmentation occurs for the complex shape of the overall tumor region border, characterized by irregular contour curves that morphological operators cannot follow. On the contrary, over-segmentation is observed when the borders between the tumor region (upper segment of the image) and normal tissue (lower part of the image) are unclear, meaning that increased intensity values are contributed by the upper limit of the normal tissue region. Due to the fact that no prior knowledge of image content is requested, the structuring element utilized for the application of mathematical morphology remains fixed in the proposed framework (we focus on the totally unsupervised pipeline) and does not totally adjust to the tumor margins of each image sample. Future improvements to the proposed segmentation pipeline could investigate an adaptive calculation procedure for determining optimal setup (size and shape of structuring element) of morphological operators to be utilized at the image refinement stage.
At this stage, we can also emphasize the efficiency of the entropy thresholding procedure to derive contrast-enhanced cancerous particles. The contour map of the fluorescence image after this processing step is depicted in Figure 8c. The cancerous cells (bright red color segments) have been accurately assigned and depicted within the ground truth tumor borders. In addition, outside the marked tumor area, the method has also assigned tumorous kernels, which are not significant in the present tumor formation but may be considered suspicious for subsequent examination.
From the qualitative results presented, a key observation is that images processed utilizing clustering-based segmentation demonstrate increased contrast compared to raw ones. Otsu thresholding enhanced the differences between the foreground (tumor margins) and the background (healthy and remaining tissue), facilitating the segmentation procedure. Entropy thresholding also provided promising results, enabling the accurate definition of tumor borders via edge enhancement and efficiently identifying the object pixels, depicted in the high density of the 3D intensity maps shown. Finally, mean shift clustering smoothens image data, providing additional information from the probabilistic distribution of the fluorescence samples, complementing the final result, and removing possible outliers introduced through the thresholding procedure. The contour maps were also plotted for the images obtained using entropy thresholding, for an enhanced visual comparison. The binary mask obtained by fusing all three techniques and filling any gaps via mathematical morphology is also shown for visualizing the entire tumor boundary. It is also interesting to note that the tumor can be considered as the bright region positioned at the top of the image and the high intensity (intensity = 1) points depicted in the 3D intensity map of the image histogram.
The proposed test bed fluorescence imaging system proves quite robust, being capable of recognizing extremely irregular-shaped tumors, in an unsupervised and almost real-time manner and without any prior knowledge of the tissue properties, serving as a very helpful assisting tool for the pathologist. In addition, the improved contrast produced by the entropy thresholding process enables more accurate differentiation of the tumor area from the remaining tissue and, in conjunction with the result of Otsu thresholding, filters out the ambiguous pixels present in the union area between the ROI (Region of Interest) and the background. Subsequently, the mean shift clustering sub-procedure enables the derivation of quite clear and smooth tumor margins. Finally, it should be emphasized that the binary mask constructed via segmentation fusion and morphology refinement does not underestimate the cancerous region but rather enriches it with additional depth penetration, providing adequate information regarding its geometrical formulation and setting the prerequisites for complete tumor resection.
In order to further support the information and outcomes of the previous figures and analysis, statistical texture results were calculated, pertaining to the raw brain tumor images obtained by fluorescence microscopy in lower tumor slice depths (10 μm, 40 μm, and 40 μm) and the corresponding processed images via the proposed three-step segmentation approaches. Table 1 summarizes statistical texture parameters, namely contrast, correlation, energy, homogeneity, skewness, kurtosis, entropy, and standard deviation, calculated for the images to quantify their texture properties.
The texture is the pattern or spatial arrangement of different pixels possessing different intensity levels, describing the structure of the object in the image. The texture of an image is generally not uniform due to the variations in intensity levels and the spatial relationship of pixels, which are characterized by the smoothness/roughness or uniformity of the object in the image. Texture can also vary due to the differences in the reflectance of the surface being imaged. The texture of an image region can vary if it has different local statistics with respect to its intensity levels. Different texture metrics indicate different image properties/characteristics quantifying the textural information of the surface via the distribution of the pixel intensities and the involving statistics. A detailed description of the texture analysis and the theoretical and mathematical background can be found in [57,58]. Regarding the calculation of the standard deviation metric, this is performed on the intensity values of the original images within the regions (logical AND operation, i.e., only pixels of the original image that are “active” within the segmentation result) extracted by the corresponding segmentation techniques examined. If zi is a random variable indicating an intensity level contained in an image with L being the total number of intensity levels and p(zi) is the probability of occurrence of that intensity level, then p(z), where z ranges from z1 to zL, is the intensity histogram of the image, viewed as the probability density function. The expression for the mean or average intensity (mz) is given as follows:
m z = i = 1 L 1 z i p ( z i )
The general expression for the nth statistical moment of the mean (µn) is formulated as:
μ n = i = 1 L 1 ( z i m z ) n p ( z i )
The standard deviation (σ) corresponding to the pixel intensity distribution correlates to the average contrast and can be calculated using the second-order statistical moment (µ2), as the variance (σ2) of a distribution is given by the second moment.
σ = μ 2 ( z ) = σ 2
Looking at Table 1, we can see that entropy thresholding produces the highest contrast in examined cases but mean shift segmentation and Otsu thresholding also provide good contrast. This trend can also be seen in the first to fourth-order statistics. Entropy thresholding results possess increased entropy (lower value), indicating a larger amount of information that can be interpreted as a higher number of object pixels detected. The standard deviation between the resulting pixels is also higher for entropy thresholding compared to Otsu and mean shift segmentation. Nevertheless, all three techniques segment the image efficiently. The mean shift segmentation algorithm eliminates noise entirely and only the cancer region can be seen. This can also mean that it might have missed certain pixels pertaining to the tumor/object, even though it has the least amount of noise.
As the final step of evaluating the potential of the proposed tumor visualization and delineation system, a comparison has also been made between the texture features of the background (normal tissue) and those of the tumor, as defined by a pathology expert on the one tissue sample available in our study. This shows that texture features can be used to characterize cancerous tumors to differentiate them from normal healthy tissue.
Comparing the statistical texture parameters of the area selected from the tumor region and from the normal tissue region (Table 2), we can clearly see the trend in the difference between the two. The texture features of cancer differ markedly from those of normal tissue in terms of examined texture information metrics. The tumor region is brighter and possesses higher contrast than normal tissue. The entropy of the cancer part is also much higher in all cases than the normal tissue, as is the case with the standard deviation and kurtosis. This indicates that the intensity of the tumor region is more concentrated towards a certain value (demonstrated by the small amount of skewness or higher kurtosis). The normal tissue region is also more homogenous and “even” compared to the tumor region. The statistical quantification of texture shown above demonstrates that it can be used as a metric to characterize cancer and differentiate it from healthy tissue.

4.4. Qualitative and Quantitative Comparisons with Other Segmentation Techniques

To further validate the efficiency of the proposed unsupervised tumor-margin identification scheme, we compared our methodology in both qualitative and quantitative means with two other state-of-the-art segmentation approaches; the first method attempts to extract the tumor segments based on texture estimation and analysis utilizing the range filter [59], while the second reference method is based on the supervised k-means clustering scheme. The parameter k (number of clusters) of the algorithm was selected equal to 3, under the assumption that the fluorescence image is divided into three main areas, including the tumor region, healthy tissue region, and background. It is worth mentioning that our approach does not require specification of the number of regions of interest, which is automatically estimated via the mean shift clustering procedure.
Figure 11 illustrates qualitative results by comparing the extracted images from the two reference schemes and the proposed approach on the same fluorescent image sample. Our method outperforms the other two in preserving the key information of the tumor region, while filtering out possible outliers originating from the ambiguity of intensity on the borders of healthy and tumorous tissue regions. In particular, texture analysis (Figure 11c) results in over-segmentation of cancerous tissue, whereas k-means clustering (Figure 11b) produces outliers at the margins of healthy tissue, which causes over-segmentation of the final tumor mask.
The quantitative results of the comparison between the proposed methodology and the reference methodologies are summarized in Table 3. The estimated tumor margins, as a binary mask derived from each technique, are compared with respect to the ground truth borders overlaid by the medical expert who evaluated the fluorescence tissue samples. Classification metrics of success, including accuracy, precision, recall, specificity, dice coefficient (DC), and intersection over union (IoU) [60], are calculated (on the image dataset derived from the one tissue sample at difference slice depths) in order to evaluate the efficiency of our approach and justify its potential over other techniques in effectively classifying tumor areas and identifying their borders.
Focusing on the performance estimation depicted in Table 3, we can easily conclude that our unsupervised segmentation scheme based on the fusion of principal techniques remains robust for the entire range of the image dataset, outperforming the reference methodologies in the rate of detection of tumor margins and rate of filtering out healthy tissue segments. Even though more extensive experimentation is needed, this result indicates that the proposed approach can achieve effective demarcation of tissue abnormalities, which is essential for disease diagnosis, prognosis, surgery, and treatment.

5. Discussion

An unsupervised and time-efficient tumor visualization and delineation framework was presented for effective guidance during the tumor removal step. The key findings of this study indicate that fluorescent imaging has a clear discrimination capability for tumor margins based on the particularly different optical properties of cancerous tissue. In the current study, a green fluorescent protein was added exogenously allowing for high detection and discrimination of cancer from normal tissue. Fluorescence optical imaging enables high-resolution illustration of tissue surfaces and it is easily applied for laboratory assessments without requiring the tissue to be stained or sliced. Image contrast was enhanced substantially by the effective unsupervised learning segmentation scheme performed by the authors, producing results in a short time (extracting the output fused image and tumor area binary mask in an average time of 3.4 secs under a Windows 10 workstation with Intel (R) 8-Core (TM) i5-8300H CPU@2, 30 GHz and 8 GB RAM specifications) and incorporating information from different levels of analysis, both in image intensity and probability distribution, without any user intervention. The adopted mean shift clustering, Otsu, and entropy-based thresholding approaches were followed by a fusion of the resulting images from these three techniques. This was used to create a binary mask indicating the tumor region and morphology, which can be further used to extract the tumor region from the original fluorescence image using overlapping. The presented fluorescent imaging and fused segmentation system prove extremely capable of discriminating cancerous regions from the remaining tissue and accurately approximating the tumor margins in an almost real-time mode, revealing the potential to be utilized as an efficient, unsupervised, and user-friendly assisting tool for image-guided surgery. The implemented equipment and software enabled the clear identification of the brain tumor margin-penetrating cells and reconstructed the geometrical topology of the tumor extent, offering the capability for numerical measurements regarding the shape, size, area, and depth of cancerous tissue segments and assisting the medical expert in a more detailed diagnosis and targeted treatment. Combining fluorescence imaging with molecular probes targeting tumor-specific markers and advanced image segmentation procedures, the outcome of the presented method could be significantly enhanced and more extensively validated on a larger dataset, further justifying the application of the proposed technique in laboratory assessments. Establishing protocols for safe administration of fluorescent molecules, these would be introduced into glioma tissues or cells either before surgery or applied to the tumor intraoperatively; typical applications encompass the areas of fluorescence-guided surgery (FGS) and confocal laser endomicroscopy (CLE). As a result, the specific imaging modality could remarkably improve decision-making protocols in the course of operations for brain tumor resection and significantly facilitate brain surgery neuropathology during an operation. Today, surgical operations are still primarily conducted under white light endoscopy; therefore, in addition to white-light imaging, fluorescence cameras or surgical microscopes can be used including both wavelength-specific excitation sources, such as lasers, LEDs, or filtering of a polychromatic light source or combinations of these approaches together with wavelength-specific imaging detectors [61]. Several challenges remain that can be addressed holistically in terms of the imaging hardware, photophysics of dyes, and tissue composition. Any digital imaging system (optical, X-ray, gamma-ray) must be quantum noise limited (Poisson limited); equivalently, quantum noise must prevail over the electronic noise of the system to avoid non-linearities. In the case of molecular imaging, the intensity and quality of the acquired signals are critical factors for the efficient utilization of fluorescence throughout image-guided surgery procedures. It is imperative that the fluorescence intensities in surgically challenging tissue structures are increased enough so that they can be systematically separated from neighboring tissue components and large signal-to-background ratio levels are achieved. In addition, light absorption and scattering from endogenous molecules are key characteristics that prevent fluorescent emissions from penetrating through tissue. Therefore, dye excitation at the maximum level and increased emission detection performance are of extreme significance. The extent of fluorescent emissions is also significantly affected by photophysical properties, namely, the absorption coefficient, i.e., the measure of the distributed light absorption in a dye, and the quantum yield, i.e., an index that represents the capability of a dye to transform absorbed light into a fluorescent emission. As a result, different tissues exhibit different background signals, due to the presence of different endogenous dyes, such as flavins, flavoproteins, collagen, and elastin, nicotinamide adenine dinucleotide (NAD)+hydrogen (H) (NADH), and other redox controllers. Again, high fluorescence intensities in surgically challenging anatomies would minimize the detrimental background signals, by maintaining high-signal-to-background ratios. In the end, fluorescence-guided surgery is predominantly applied as a methodology to delineate tissue pathologies or anatomies at or quite close to the tissue surface, a factor that mitigates some of the above complexities.

6. Conclusions

The test bed fluorescence imaging system of this study implemented with an appropriate unsupervised pipeline of image processing and fusion algorithms indicates clear demarcation of the tumor boundary and substantial image contrast. Establishing protocols for safe administration of fluorescent protein molecules, these would be introduced into glioma tissues or cells either before surgery or applied to the tumor intraoperatively; typical applications relate to the areas of fluorescence-guided surgery (FGS) and confocal laser endomicroscopy (CLE). As a result, this imaging technology could critically improve intraoperative decision-making procedures during brain tumor resection and significantly facilitate brain surgery neuropathology throughout an operation.

Author Contributions

A.D.: Experiment, image processing techniques, manuscript writing, literature search; T.C.: Manuscript review; G.C.G.: Experiment, data analysis, processing, manuscript writing, future applications; J.B. and J.L.C.: Clinical methodology, tissue preparation, experimental design; Z.G.: Literature search on epidemiology of brain tumors; S.S. and T.F.: Data analysis, manuscript review; G.L. and M.Z.: Data analysis, image processing, paper writing, material organization, literature search; P.F.: Paper review, literature search; M.N., N.D., C.B., G.B., A.B.: Phenomenology, manuscript review, literature search; A.K.: Manuscript preparation and literature search; W.E. and Y.W.: Data analysis, processing and manuscript review. All authors have read and agreed to the published version of the manuscript.

Funding

This research received no external funding.

Institutional Review Board Statement

Investigations were carried out following the rules of the Declaration of Helsinki of 1975 (https://www.wma.net/what-we-do/medical-ethics/declaration-of-helsinki/), revised in 2013. Tumor samples provided by Case Western Reserve University, Cleveland, OH, USA.

Informed Consent Statement

Brain tumor samples provided by Case Western Reserve University, Cleveland, Ohio. Again, we used microscopy glass slides with tissue deposited on them. No humans or animal involved.

Data Availability Statement

Data files are available by Aditi Deshpande, and George Giakos.

Acknowledgments

Our research team would like to express their appreciation and especially thank Richard Agnes, from Case Western Reserve University, Cleveland, Ohio for providing the brain tumor samples.

Conflicts of Interest

The authors declare no conflict of interest.

References

  1. Pradipta, A.R.; Tanei, T.; Morimoto, K.; Shimazu, K.; Noguchi, S.; Tanaka, K. Emerging Technologies for Real-Time Intraoperative Margin Assessment in Future Breast-Conserving Surgery. Adv. Sci. 2020, 7, 1–17. [Google Scholar] [CrossRef]
  2. Shen, G.; Wu, L.; Zhao, J.; Wei, B.; Zhou, X.; Wang, F.; Liu, J.; Dong, Q. Clinical and Pathological Study of Tumor Border Invasion—Is Narrow Resection Margin Acceptable in Hepatoblastoma Surgery? Front. Med. 2020, 7, 59. [Google Scholar] [CrossRef] [PubMed] [Green Version]
  3. Cote, D.J.; Ostrom, Q.T.; Gittleman, H.; Duncan, K.R.; CreveCoeur, T.S.; Kruchko, C.; Smith, T.R.; Stampfer, M.J.; Barnholtz-Sloan, J.S. Glioma incidence and survival variation by county-level socioeconomic measures. Cancer 2019, 125, 3390–3400. [Google Scholar] [CrossRef]
  4. Liang, J.; Lv, X.; Lu, C.; Ye, X.; Chen, X.; Fu, J.; Luo, C.; Zhao, Y. Prognostic factors of patients with Gliomas–an analysis on 335 patients with Glioblastoma and other forms of Gliomas. BMC Cancer 2020, 20, 1–7. [Google Scholar] [CrossRef] [Green Version]
  5. Stummer, W.; Reulen, H.J.; Meinel, T.; Pichlmeier, U.; Schumacher, W.; Zanella, F.; Reulen, H.-J.; for the ALA-Glioma Study Group. Extent of resection and survival in glioblastoma mul-tiforme: Identification of and adjustment for bias. Neurosurgery 2008, 62, 564–576. [Google Scholar]
  6. McPherson, C.M.; Sawaya, R. Technologic Advances in Surgery for Brain Tumors: Tools of the Trade in the Modern Neurosurgical Operating Room. J. Natl. Compr. Cancer Netw. 2005, 3, 705–710. [Google Scholar] [CrossRef] [PubMed]
  7. Brown, T.J.; Brennan, M.C.; Li, M.; Church, E.W.; Brandmeir, N.J.; Rakszawski, K.L.; Patel, A.S.; Rizk, E.B.; Suki, D.; Sawaya, R.; et al. Association of the extent of resection with survival in glioblastoma: A systematic review and meta-analysis. JAMA Oncol. 2016, 11, 1460–1469. [Google Scholar] [CrossRef] [Green Version]
  8. Stummer, W.; Pichlmeier, U.; Meinel, T.; Wiestler, O.D.; Zanella, F.; Reulen, H.-J. Fluorescence-guided surgery with 5-aminolevulinic acid for resection of malignant glioma: A randomised controlled multicentre phase III trial. Lancet Oncol. 2006, 7, 392–401. [Google Scholar] [CrossRef]
  9. Ntziachristos, V. Going deeper than microscopy: The optical imaging frontier in biology. Nat. Methods 2010, 7, 603–614. [Google Scholar] [CrossRef]
  10. Ntziachristos, V. Clinical translation of optical and optoacoustic imaging. Philos. Trans. R. Soc. A Math. Phys. Eng. Sci. 2011, 369, 4666–4678. [Google Scholar] [CrossRef] [PubMed]
  11. van Dam, G.M.; Themelis, G.; Crane, L.M.A.; Harlaar, N.J.; Pleijhuis, R.G.; Kelder, W.; Sarantopoulos, A.; de Jong, J.S.; Arts, H.J.G.; van der Zee, A.G.J.; et al. Intraoperative tumor-specific fluorescence imaging in ovarian cancer by folate receptor-α targeting: First in-human results. Nat. Med. 2011, 17, 1315–1319. [Google Scholar] [CrossRef] [PubMed]
  12. Cutter, J.L.; Cohen, N.T.; Wang, J.; Sloan, A.E.; Cohen, A.R.; Panneerselvam, A.; Schluchter, M.; Blum, G.; Bogyo, M.; Basilion, J.P. Topical Application of Activity-based Probes for Visualization of Brain Tumor Tissue. PLoS ONE 2012, 7, e33060. [Google Scholar] [CrossRef] [Green Version]
  13. Mahmood, U.; Weissleder, R. Near-infrared optical imaging of proteases in cancer. Mol. Cancer Ther. 2003, 2, 489. [Google Scholar] [PubMed]
  14. Yuan, F.; Verhelst, S.H.L.; Blum, G.; Coussens, L.M.; Bogyo, M. A Selective Activity-Based Probe for the Papain Family Cysteine Protease Dipeptidyl Peptidase I/Cathepsin C. J. Am. Chem. Soc. 2006, 128, 5616–5617. [Google Scholar] [CrossRef] [PubMed]
  15. Boppart, S.A.; Luo, W.; Marks, D.L.; Keith, W. Singletary, Optical coherence tomography: Feasibility for basic re-search and image-guided surgery of breast cancer. Breast Cancer Res. Treat. 2004, 84, 85–97. [Google Scholar] [CrossRef] [Green Version]
  16. Zysk, A.M.; Boppart, S.A. Computational methods for analysis of human breast tumor tissue in optical coherence to-mography images. J. Biomed. Opt. 2006, 11, 054015. [Google Scholar] [CrossRef]
  17. McLaughlin, R.A.; Quirk, B.C.; Curatolo, A.; Kirk, R.W.; Scolaro, L.; Lorenser, D.; Robbins, P.D.; Wood, B.A.; Saunders, C.M.; Sampson, D.D. Imaging of Breast Cancer with Optical Coherence Tomography Needle Probes: Feasibility and Initial Re-sults, Selected Topics in Quantum Electronics. IEEE J. 2012, 18, 1184–1191. [Google Scholar]
  18. Zahra, T.; Fatemizadeh, E.; Blumetti, T.; Daveluy, S.; Moraes, A.F.; Chen, W.; Mehregan, D.; Andersen, P.e.E.; Nasiriavanaki, M. Optical radiomic signatures derived from optical coherence tomogra-phy images improve identification of melanoma. Cancer Res. 2019, 79, 2021–2030. [Google Scholar]
  19. Bigio, I.J.; Bown, S.G.; Briggs, G.; Kelley, C.; Lakhani, S.; Pickard, D.; Ripley, P.M.; Rose, I.G.; Saunders, C. Diagnosis of breast cancer using elastic-scattering spectroscopy: Preliminary clinical results. J. Biomed. Opt. 2000, 5, 221–228. [Google Scholar] [CrossRef] [Green Version]
  20. Haka, A.S.; Volynskaya, Z.; Gardecki, J.A.; Nazemi, J.; Lyons, J.; Hicks, D.; Fitzmaurice, M.; Dasari, R.R.; Crowe, J.P.; Feld, M.S. In vivo Margin Assessment during Partial Mastectomy Breast Surgery Using Raman Spectroscopy. Cancer Res. 2006, 66, 3317–3322. [Google Scholar] [CrossRef] [PubMed] [Green Version]
  21. Lue, N.; Kang, J.W.; Yu, C.-C.; Barman, I.; Dingari, N.C.; Feld, M.S.; Dasari, R.R.; Fitzmaurice, M. Portable Optical Fiber Probe-Based Spectroscopic Scanner for Rapid Cancer Diagnosis: A New Tool for Intraoperative Margin Assessment. PLoS ONE 2012, 7, e30887. [Google Scholar] [CrossRef] [PubMed] [Green Version]
  22. Senders, J.T.; Muskens, I.S.; Schnoor, R.; Karhade, A.V.; Cote, D.J.; Smith, T.R.; Broekman, M.L.D. Agents for fluorescence-guided glioma surgery: A systematic review of preclinical and clinical results. Acta Neurochir. 2017, 159, 151–167. [Google Scholar] [CrossRef] [PubMed] [Green Version]
  23. Xi, L.; Grobmyer, S.R.; Wu, L.; Chen, R.; Zhou, G.; Gutwein, L.G.; Sun, J.; Liao, W.; Zhou, Q.; Xie, H.; et al. Evaluation of breast tumor margins in vivo with intraoperative photoacoustic imaging. Opt. Express 2012, 20, 8726–8731. [Google Scholar] [CrossRef] [PubMed]
  24. Yaroslavsky, A.N.; Neel, V.; Anderson, R.R. Demarcation of Nonmelanoma Skin Cancer Margins in Thick Ex-cisions Using Multispectral Polarized Light Imaging. J. Investig. Dermatol. 2003, 121, 259–266. [Google Scholar] [CrossRef] [Green Version]
  25. Lien, Z.-Y.; Hsu, T.-C.; Liu, K.-K.; Liao, W.-S.; Hwang, K.-C.; Chao, J.-I. Cancer cell labeling and tracking using fluorescent and magnetic nanodiamond. Biomaterials 2012, 33, 6172–6185. [Google Scholar] [CrossRef] [PubMed]
  26. Cheng, Y.; Meyers, J.D.; Broome, A.-M.; Kenney, M.E.; Basilion, J.P.; Burda, C. Deep Penetration of a PDT Drug into Tumors by Noncovalent Drug-Gold Nanoparticle Conjugates. J. Am. Chem. Soc. 2011, 133, 2583–2591. [Google Scholar] [CrossRef] [PubMed] [Green Version]
  27. Giakos, G.C.; Marotta, S.; Narayan, C.; Petermann, J.; Shrestha, S.; Baluch, J.; Pingili, D.; Sheffer, D.B.; Zhang, L.; Zervakis, M.; et al. Polarimetric phenomenology of photons with lung cancer tissue. Meas. Sci. Technol. 2011, 22, 114018. [Google Scholar] [CrossRef]
  28. Giakos, G.; Deshpande, A.; Quang, T.; Farrahi, T.; Narayan, C.; Shrestha, S.; Zervakis, M.; Livanos, G.; Bei, E. An Automated Digital Fluorescence Imaging System of Tumor Margins Using Clustering-Based Image Thresholding. In Proceedings of the IEEE International Conference on Imaging Systems and Techniques (IST), Beijing, China, 22–23 October 2013; pp. 116–120. [Google Scholar]
  29. Shrestha, S.; Deshpande, A.; Farrahi, T.; Cambria, T.; Quang, T.; Majeski, J.; Na, Y.; Zervakis, M.; Livanos, G.; Giakos, G.C. Label-free discrimination of lung cancer cells through mueller matrix decomposition of diffuse reflectance imaging. Biomed. Signal Process. Control. 2018, 40, 505–518. [Google Scholar] [CrossRef]
  30. Shrestha, S.; Giakos, G.C.; Petermann, J.; Farrahi, T.; Deshpande, A. Design, Calibration, and Testing of Automated Liquid Crystal Polarimetric Imaging System for Lung Cancer Cells. IEEE Trans. Instrum. Meas. 2015, 64, 2453–2467. [Google Scholar] [CrossRef]
  31. Bauman, G.; Shrestha, S.; Mallinson, K.; Giakos, Z.; Surovich, M.; Wang, Y.; Livanos, G.; Zervakis, M.; Ying, N.; Giakos, G.C. Multiresolution Bioinspired Cross-Polarized Imaging and Biostatistics of Lung Cancer Tissue Samples. In Proceedings of the 2017 IEEE International Conference on Imaging Systems and Techniques (IST), Beijing, China, 18–20 October 2017; pp. 1–6. [Google Scholar]
  32. Shrestha, S.; Zhang, L.; Quang, T.; Farrahi, T.; Narayan, C.; Deshpande, A.; Na, Y.; Blinzer, A.; Ma, J.; Liu, B.; et al. Integrated Quantitative Fractal Polarimetric Analysis of Monolayer Lung Cancer Tissue Cells. In Polarization: Measurement, Analysis, and Remote Sensing XI; International Society for Optics and Photonics: Bellingham, WA, USA, 2014; Volume 9099. [Google Scholar]
  33. Salem, N.; Malik, H.; Shams, A. Medical image enhancement based on histogram algorithms. Procedia Comput. Sci. 2019, 163, 300–311. [Google Scholar] [CrossRef]
  34. Singh, K.; Vishwakarma, D.K.; Walia, G.S.; Kapoor, R. Contrast enhancement via texture region based histogram equalization. J. Mod. Opt. 2016, 63, 1444–1450. [Google Scholar] [CrossRef]
  35. Rundo, L.; Tangherloni, A.; Cazzaniga, P.; Nobile, M.S.; Russo, G.; Gilardi, M.C.; Vitabile, S.; Mauri, G.; Besozzi, D.; Militello, C. A novel framework for MR image segmentation and quantification by using MedGA. Comput. Methods Programs Biomed. 2019, 176, 159–172. [Google Scholar] [CrossRef]
  36. Rundo, L.; Tangherloni, A.; Nobile, M.S.; Militello, C.; Besozzi, D.; Mauri, G.; Cazzaniga, P. MedGA: A novel evolutionary method for image enhancement in medical imaging systems. Expert Syst. Appl. 2019, 119, 387–399. [Google Scholar] [CrossRef]
  37. Acharya, U.K.; Kumar, S. Particle swarm optimized texture based histogram equalization (PSOTHE) for MRI brain image enhancement. Optik 2020, 224, 165760. [Google Scholar] [CrossRef]
  38. MacQueen, J. Some Methods for Classification and Analysis of Multivariate Observations. In Proceedings of the Fifth Berkeley Symposium on Mathematical Statistics and Probability, Berkeley, CA, USA, 21 June–18 July 1965; Volume 1, pp. 281–297. [Google Scholar]
  39. Cheng, Y. Mean shift, mode seeking, and clustering. IEEE Trans. Pattern Anal. Mach. Intell. 1995, 17, 790–799. [Google Scholar] [CrossRef] [Green Version]
  40. Comaniciu, D.; Meer, P. Mean shift: A robust approach toward feature space analysis. IEEE Trans. Pattern Anal. Mach. Intell. 2002, 24, 603–619. [Google Scholar] [CrossRef] [Green Version]
  41. Bindu, C.H.; Prasad, K.S. An Efficient Medical Image Segmentation Using Conventional OTSU Method. Int. J. Adv. Sci. Technol. 2012, 38, 67–74. [Google Scholar]
  42. Chang, C.-I.; Du, Y.; Wang, J.; Guo, S.-M.; Thouin, P. Survey and comparative analysis of entropy and relative entropy thresholding techniques. IEEE Proc. Vis. Image Signal Process. 2006, 153, 837–850. [Google Scholar] [CrossRef] [Green Version]
  43. Sezgin, M.; Sankur, B. Survey over image thresholding techniques and quantitative performance evaluation. J. Electron. Imaging 2004, 13, 146–165. [Google Scholar]
  44. Wang, M.; Shuyuan, Y. A Hybrid Genetic Algorithm Based Edge Detection Method for SAR Image. In Proceedings of the IEEE international Radar Conference, Arlington, VA, USA, 9–12 May 2005; pp. 1503–1506. [Google Scholar]
  45. Abe, T.; Wakimoto, H.; Bookstein, R.; Maneval, D.C.; Chiocca, E.A.; Basilion, J.P. Intra-arterial delivery of p53-containing adenoviral vec-tor into experimental brain tumors. Cancer Gene Ther. 2002, 9, 228–235. [Google Scholar] [CrossRef] [Green Version]
  46. Bazi, Y.; Bruzzone, L.; Melgani, F. Image thresholding based on the EM algorithm and the generalized Gauss-ian distribution. Pattern Recognit. 2007, 40, 619–634. [Google Scholar] [CrossRef]
  47. Pal, N.R.; Pal, S.K. Entropic thresholding. Signal Process. 1989, 16, 97–108. [Google Scholar] [CrossRef]
  48. Brink, A. Using spatial information as an aid to maximum entropy image threshold selection. Pattern Recognit. Lett. 1996, 17, 29–36. [Google Scholar] [CrossRef]
  49. Sarkar, S.; Das, S. Multilevel image thresholding based on 2D histogram and maximum Tsallis entropy—A differ-ential evolution approach. IEEE Trans. Image Process. 2013, 22, 4788–4797. [Google Scholar] [CrossRef] [PubMed]
  50. Tsai, D.-Y.; Lee, Y.; Matsuyama, E. Information Entropy Measure for Evaluation of Image Quality. J. Digit. Imaging 2007, 21, 338–347. [Google Scholar] [CrossRef] [PubMed] [Green Version]
  51. Wang, J.; Thiesson, B.; Xu, Y.; Cohen, M. Image and Video Segmentation by Anisotropic Kernel Mean Shift. In Proceedings of the European Conference on Computer Vision, Prague, Czech Republic, 11–14 May 2004; Volume 2, pp. 238–249. [Google Scholar]
  52. Meyer, F.; Lerallut, R. Morphological Operators for Flooding, Leveling and filtering Images Using Gaphs. In Proceedings of the 6th IAPR-TC-15 International Workshop, Alivante, Spain, 11–13 June 2007; pp. 158–167, LNCS 4538. [Google Scholar]
  53. Ridler, T.W.; Calvard, S. Picture thresholding using an iterative selection method. IEEE Trans. Syst. Man Cybern. 1978, 8, 630–632. [Google Scholar]
  54. Li, C.; Lee, C. Minimum cross entropy thresholding. Pattern Recognit. 1993, 26, 617–625. [Google Scholar] [CrossRef]
  55. Li, C.; Tam, P. An iterative algorithm for minimum cross entropy thresholding. Pattern Recognit. Lett. 1998, 19, 771–776. [Google Scholar] [CrossRef]
  56. Huang, L.-K.; Wang, M.-J.J. Image thresholding by minimizing the measures of fuzziness. Pattern Recognit. 1995, 28, 41–51. [Google Scholar] [CrossRef]
  57. Tomita, F.; Tsuji, S. Statistical Texture Analysis. In Computer Analysis of Visual Textures; The Springer International Series in Engineering and Computer Science (Robotics: Vision, Manipulation and Sensors); Springer: Boston, MA, USA, 1990. [Google Scholar] [CrossRef]
  58. Ramola, A.; Shakya, A.K.; van Pham, D. Study of statistical methods for texture analysis and their modern evolutions. Eng. Rep. 2020, 2, e12149. [Google Scholar] [CrossRef]
  59. Malik, J.; Belongie, S.; Leung, T.; Shi, J. Contour and Texture Analysis for Image Segmentation. Int. J. Comput. Vis. 2001, 43, 7–27. [Google Scholar] [CrossRef]
  60. Powers, D.M.W. Evaluation: From Precision, Recall and F-Measure to ROC, Informedness, Markedness & Correlation. J. Mach. Learn. Technol. 2011, 2, 37–63. [Google Scholar]
  61. Schulz, R.B.; Semmler, W. Fundamentals of Optical Imaging. Handb. Exp. Pharmacol. 2008, 185, 3–22. [Google Scholar] [CrossRef] [Green Version]
Figure 1. The optical fluorescence microscopy arrangement.
Signals 02 00020 g001
Figure 2. Schematic representation of the discrete steps in the tumor identification and visualization pipeline.
Signals 02 00020 g002
Figure 3. Schematic representation of notations for performing qualitative and quantitative assessments on image segmentation performance.
Signals 02 00020 g003
Figure 4. Illustration of tumor concentration at different slice depths (10 μm, 40 μm, 60 μm, and 120 μm), confirming the capacity of the utilized fluorescence imaging system to clearly depict and preserve the substantial tumor region information.
Signals 02 00020 g004
Figure 5. A comparison of various thresholding-based image segmentation techniques for the image of slice depth 10 μm: (a) entropy thresholding (selected method), (b) minimum thresholding, (c) intermodes thresholding, (d) IsoData thresholding, (e) Li thresholding, (f) Shanbhag thresholding. The blue curve indicates the borders of brain tissue depicted in the image.
Signals 02 00020 g005
Figure 6. Fluorescence images containing the brain tissue at 10 μm slice depth along with the ground truth tumor margins (red-colored boundary): (a) Original image, (b) processed image after applying Otsu thresholding to original image, (c) processed image after applying entropy-based thresholding to the original image, (d) processed image after performing mean shift clustering on the original image, (e) binary mask after fusion of the three segmentation results, and (f) ground truth (red) and estimated (blue) tumor margins superimposed on the original fluorescence image after the application of the proposed unsupervised learning segmentation scheme.
Signals 02 00020 g006
Figure 7. Fluorescence images containing the brain tissue at 30 μm slice depth along with the ground truth tumor margins (red-colored boundary): (a) Original image, (b) processed image after applying Otsu thresholding to the original image, (c) Processed image after applying entropy-based thresholding to the original image, (d) processed image after performing mean shift clustering on the original image, (e) binary mask after fusion of the 3 segmentation results and, (f) ground truth (red) and estimated (blue) tumor margins superimposed on the original fluorescence image after the application of the proposed unsupervised learning segmentation scheme.
Signals 02 00020 g007
Figure 8. Fluorescence images containing the brain tissue in 60 μm slice depth along with the ground truth tumor margins (red-colored boundary): (a) Original image, (b) processed image after applying Otsu thresholding to original image, (c) Contour map of the processed image after performing entropy-based thresholding on the original image, (d) processed image after performing mean shift clustering on the original image, (e) binary mask after fusion of the 3 segmentation results, and (f) ground truth (red) and estimated (blue) tumor margins superimposed on the original fluorescence image after the application of the proposed unsupervised learning segmentation scheme.
Signals 02 00020 g008
Figure 9. Fluorescence images containing the brain tissue in 100 μm slice depth along with the ground truth tumor margins (red-colored boundary): (a) Original image, (b) Processed image after applying Otsu thresholding to original image, (c) contour map of the processed image after performing entropy-based thresholding on the original image, (d) processed image after performing mean shift clustering on the original image, (e) binary mask after fusion of the 3 segmentation results, and (f) ground truth (red) and estimated (blue) tumor margins superimposed on the original fluorescence image after the application of the proposed unsupervised learning segmentation scheme.
Signals 02 00020 g009
Figure 10. Fluorescence images containing the brain tissue at 120 μm and 150 μm slice depth along with the ground truth tumor margins (red-colored boundary): (a) Original image at 120 μm slice depth, (b) original image at 150 μm slice depth, (c) ground truth (red) and estimated (blue) tumor margins superimposed on the original fluorescence image margins after the application of the proposed unsupervised learning segmentation scheme on the image of Figure 10a, and (d) ground truth (red) and estimated (blue) tumor margins superimposed on the original fluorescence image after the application of the proposed unsupervised learning segmentation scheme on the image of Figure 10b.
Signals 02 00020 g010
Figure 11. Qualitative comparison results for the segmentation procedure between the proposed methodology and two reference approaches (texture analysis and k-means clustering): (a) Original fluorescence image sample at slice depth 100 μm, (b) segmentation result of k-means clustering on the original image sample, (c) segmentation result of range filtering on the original image sample and (d) segmentation result of the proposed technique on the original image sample.
Signals 02 00020 g011
Table 1. Statistical quantification of image texture for different segmentation results.
ImageContrastCorrelationEnergyHomogeneitySkewnessKurtosisEntropyStd. Deviation
10 μm Original0.6210.85960.35720.86160.028620.99835.029434.9634
10 μm—Otsu thresholded0.9940.78650.81670.95520.022927.03352.475143.7297
10 μm—Entropy thresholded1.82170.69920.82740.96230.017729.21981.507756.5694
10 μm—Mean shift Segmented1.04300.78240.87390.97460.019227.93631.658152.2174
30 μm Original0.61520.83810.22440.80080.020311.6205.258249.252
30 μm—Otsu thresholded0.82700.72570.71250.92520.019417.07522.914754.4028
30 μm—Entropy thresholded1.74560.66500.79330.96150.015119.2361.595866.1713
30 μm—Mean shift Segmented1.10120.78220.82750.96500.017918.39141.919462.8654
40 μm Original0.34570.80730.42000.87120.027718.9944.798536.1215
40 μm—Otsu thresholded0.95100.74520.74120.91420.019620.14113.297455.1103
40 μm—Entropy thresholded1.5750.63520.90230.98030.012328.6661.965158.412
40 μm—Mean shift Segmented1.11390.80220.91590.98450.015922.74911.941851.9204
Table 2. Comparison of statistical texture features of tumor and normal regions.
ImageContrastCorrelationEnergyHomogeneitySkewnessKurtosisEntropyStd. Deviation
10 μm tumor0.86050.91100.07820.73960.00872.99457.5119114.7772
10 μm normal0.23450.48600.36640.88270.05322.28485.197218.7808
30 μm tumor1.04220.88500.05460.70370.00832.55267.7284120.6932
30 μm normal0.27860.45380.30520.86110.03961.94035.488425.2802
40 μm tumor1.09650.84060.07550.70650.01043.45507.437096.1131
40 μm normal0.35420.32400.27050.82350.04262.32615.443523.4819
60 μm tumor1.21610.83730.06620.68380.00922.95787.6068108.2671
60 μm normal0.41290.25220.28000.80420.03262.00385.729230.7130
100 μm tumor1.00200.87040.07740.71950.00983.43707.4428101.7404
100 μm normal0.29290.42490.30840.85560.04422.39365.247122.6216
120 μm tumor0.74670.86940.13850.76530.01275.05707.983978.7948
120 μm normal0.30600.41220.28480.84730.04122.18965.452124.2514
150 μm tumor1.12910.84960.06160.68410.00902.81767.6219111.5111
150 μm normal0.39160.22360.31570.81330.03211.80785.646931.1538
Table 3. Quantitative comparison results for the segmentation procedure between the proposed methodology and two reference approaches (texture analysis and k-means clustering).
PROPOSED METHODOLOGYSAMPLE DESCRIPTIONAccuracyPrecisionRecallSpecificityDice CoefficientIntersection over Union
10 μm0.9780.9670.9260.9920.9150.843
30 μm0.9470.9730.8420.9900.8950.810
40 μm0.9250.8410.8500.9480.8860.795
60 μm0.9700.9160.9410.9780.9400.887
100 μm0.9750.9510.9530.9820.9550.914
120 μm0.9560.8520.8750.9710.8900.802
150 μm0.9490.8420.9340.9520.9210.854
TEXTURE SEGMENTATIONSAMPLE DESCRIPTIONAccuracyPrecisionRecallSpecificityDice CoefficientIntersection over Union
10 μm0.9370.8590.8690.9570.9110.836
30 μm0.9430.9830.8430.9930.9120.838
40 μm0.9210.8390.8380.9480.8890.800
60 μm0.9640.9140.9100.9780.9420.890
100 μm0.9500.9110.8980.9680.9310.871
120 μm0.9290.7650.8460.9460.8930.807
150 μm0.8920.7810.7890.9260.8520.742
K-MEANS CLUSTERINGSAMPLE DESCRIPTIONAccuracyPrecisionRecallSpecificityDice CoefficientIntersection over Union
10 μm0.9540.9370.8560.9830.9150.843
30 μm0.9350.9510.8230.9820.8950.809
40 μm0.9120.7930.8450.9320.8860.795
60 μm0.9320.7260.9530.9270.9400.886
100 μm0.9590.9020.9460.9640.9550.913
120 μm0.9400.8030.8290.9610.8900.801
150 μm0.9280.7790.9100.9320.9210.853
Publisher’s Note: MDPI stays neutral with regard to jurisdictional claims in published maps and institutional affiliations.

