
Spatiotemporal Prediction of Theft Risk with Deep Inception-Residual Networks


1
Department of Landscape Architecture & Urban Planning, Texas A&M University, College Station, TX 77840, USA
2
School of Geographical Sciences and Planning, Guangxi Teachers Education University, Nanning 530100, China
3
Department of Urban Studies and Planning and National Center for Smart Growth, University of Maryland, College Park, MD 20742, USA
*
Author to whom correspondence should be addressed.
Smart Cities 2021, 4(1), 204-216; https://0-doi-org.brum.beds.ac.uk/10.3390/smartcities4010013
Submission received: 24 December 2020
/
Accepted: 26 January 2021
/
Published: 29 January 2021
Abstract
:Spatiotemporal prediction of crime is crucial for public safety and smart cities operation. As crime incidents are distributed sparsely across space and time, existing deep-learning methods constrained by coarse spatial scale offer only limited values in prediction of crime density. This paper proposes the use of deep inception-residual networks (DIRNet) to conduct fine-grained, theft-related crime prediction based on non-emergency service request data (311 events). Specifically, it outlines the employment of inception units comprising asymmetrical convolution layers to draw low-level spatiotemporal dependencies hidden in crime events and complaint records in the 311 dataset. Afterward, this paper details how residual units can be applied to capture high-level spatiotemporal features from low-level spatiotemporal dependencies for the final prediction. The effectiveness of the proposed DIRNet is evaluated based on theft-related crime data and 311 data in New York City from 2010 to 2015. The results confirm that the DIRNet obtains an average F1 of 71%, which is better than other prediction models.
1. Introduction
Safety is an important goal that smart cities should pursue. As Neirotti et al. stated, the initiatives of smart cities are characterized by modern technology and aiming at improving the lives of the urban residents in various domains, such as development, safety, energy, etc. [1]. Furthermore, an ever-increasing volume of data provides a precious opportunity for researchers and practitioners to predict crime events and enable police departments to develop more effective strategies for crime prevention. Therefore, the integration of heterogeneous big datasets and spatiotemporal prediction of crime [2,3] becomes critical.
Spatiotemporal prediction of crimes helps law enforcement agencies identify the patterns relating to the proliferation of crime [4] to efficiently deploy limited police resources [5,6]. However, crimes exhibit complex spatial and temporal dependencies embedded in dynamic spatial-social environments [7,8,9]. A growing list of methods has been developed to address this challenge, which includes spatiotemporal point processes [10], random space-time distribution hypotheses [11], risk-terrain analysis [12], spatial regressive models, and Bayesian models [13]. A variety of engineering techniques have recently been developed to characterize crime-related features in order to enhance the prediction power using Foursquare data [14], Twitter data [15], 911 events [16], and taxi trajectories [17]. However, the challenge is that the aforementioned methods require either extensive coverage of the relevant indicators—which often suffers from insufficient data availability—or heavy reliance on feature-engineering processes that tend to be cumbersome.
This paper proposes a novel deep learning model—a deformable image registration deep learning network derived from deep inception-residual networks (DIRNet)—that can extract the information of spatial and temporal crime dependence before fusing multiple datasets for prediction. In addition, the proposed DIRNet has deep layers in its architecture to account for complex and nonlinear relationships between inputs and a predictor. To test the proposed DIRNet, we examined New York City as a case study and predicted theft-related crime compared with four baseline machine-learning models. The evaluation results of those models illustrate that the proposed model outperforms other baseline models in crime prediction.
The remainder of this paper is structured as below: Section 2 reviews the studies that predict crime using both conventional methods and machine-learning approaches. Section 3 describes the New York City case study and the datasets used. Section 4 illustrates the procedure of the proposed DIRNet model. Section 5 examines whether the proposed DIRNet performs better in crime prediction than other baseline machine-learning models. The data includes theft-related crime data and 311 data in New York City. We highlight key findings, present implications of this study, and propose a research agenda in the last section.
2. Literature Review
Our research speaks to an important portion of the existing academic literature in the urban context: the use of big data approaches to predict events that are spatially and temporally dependent, including, specifically, crimes. Conventionally, scholars have used various statistical models to investigate the causality mechanism of crimes and predict the occurrence of criminal incidents. For example, Igbal et al. employed Naïve Bayes and decision trees to predict a multiclass classification using three labels (low, medium, and high) at an accuracy level of 83.95% [18]. Based on the linguistic analysis of tweets, Wang and Brown applied topic modeling methods to discover hidden semantic structures and discussion themes in a city, and enhance the crime prediction accuracy through a kernel density estimation [19]. Law et al. explored Bayesian spatiotemporal methods to analyze the changing local patterns of crime over time [13]. Chohlas-Wood et al. focused on random forest regression and Poisson regression with features built from 911 data, 311 data, weather, and building data to forecast the criminal activity [16]. Wang et al. crafted crime data, demographic information, points of interest (POIs) data, and taxi data to explain the crime rate of a neighborhood [17]. Chandrasekar et al. applied gradient boosted trees, support vector machines, and random forest models to deal with the blue-collar/white-collar crime classification issue [20]. However, these studies had an intrinsic limitation that the large amounts of data types made these research procedures difficult to be replicated for crime prediction in other cities that do not have such rich data types.
At the same time, Kang and Kang developed a deep learning model to predict crime hotspots, involving the images associated with crime locations retrieved from Google Maps’ street view as well as weather, demographics, and other crime incident information [4]. In addition, Chun et al. applied a machine-learning method—deep neural networks (DNNs)—using individual criminal charge history data to estimate the likelihood of crime and the likely type of crime at the individual level [21]. Wang et al. employed deep convolutional neural networks (DCNNs) to predict urban crime distribution while the study area was divided into 16 × 16 grids—a coarse spatial scale to target policing patrol strategies [22]. To address these issues, Duan et al. developed a DCNNs-based model to predict crime risk at the finer spatiotemporal scale [23]. However, such efforts require time-consuming manual processing to tune the specific dropout paths for convolutional layers, with the unstable and lower prediction performances compared with the proposed model in this paper (detailed in Section 5).
This study aims to fill the aforementioned gaps through a novel deep network for end-to-end prediction, through which we can estimate theft-related crime risks using fine-grained spatial grids. Importantly, only theft-related 311 events will be employed as the auxiliary geo-data for crime prediction, which can make this study highly transferable to other urban areas that lack various types of auxiliary data for modeling.
3. Research Context and the Datasets
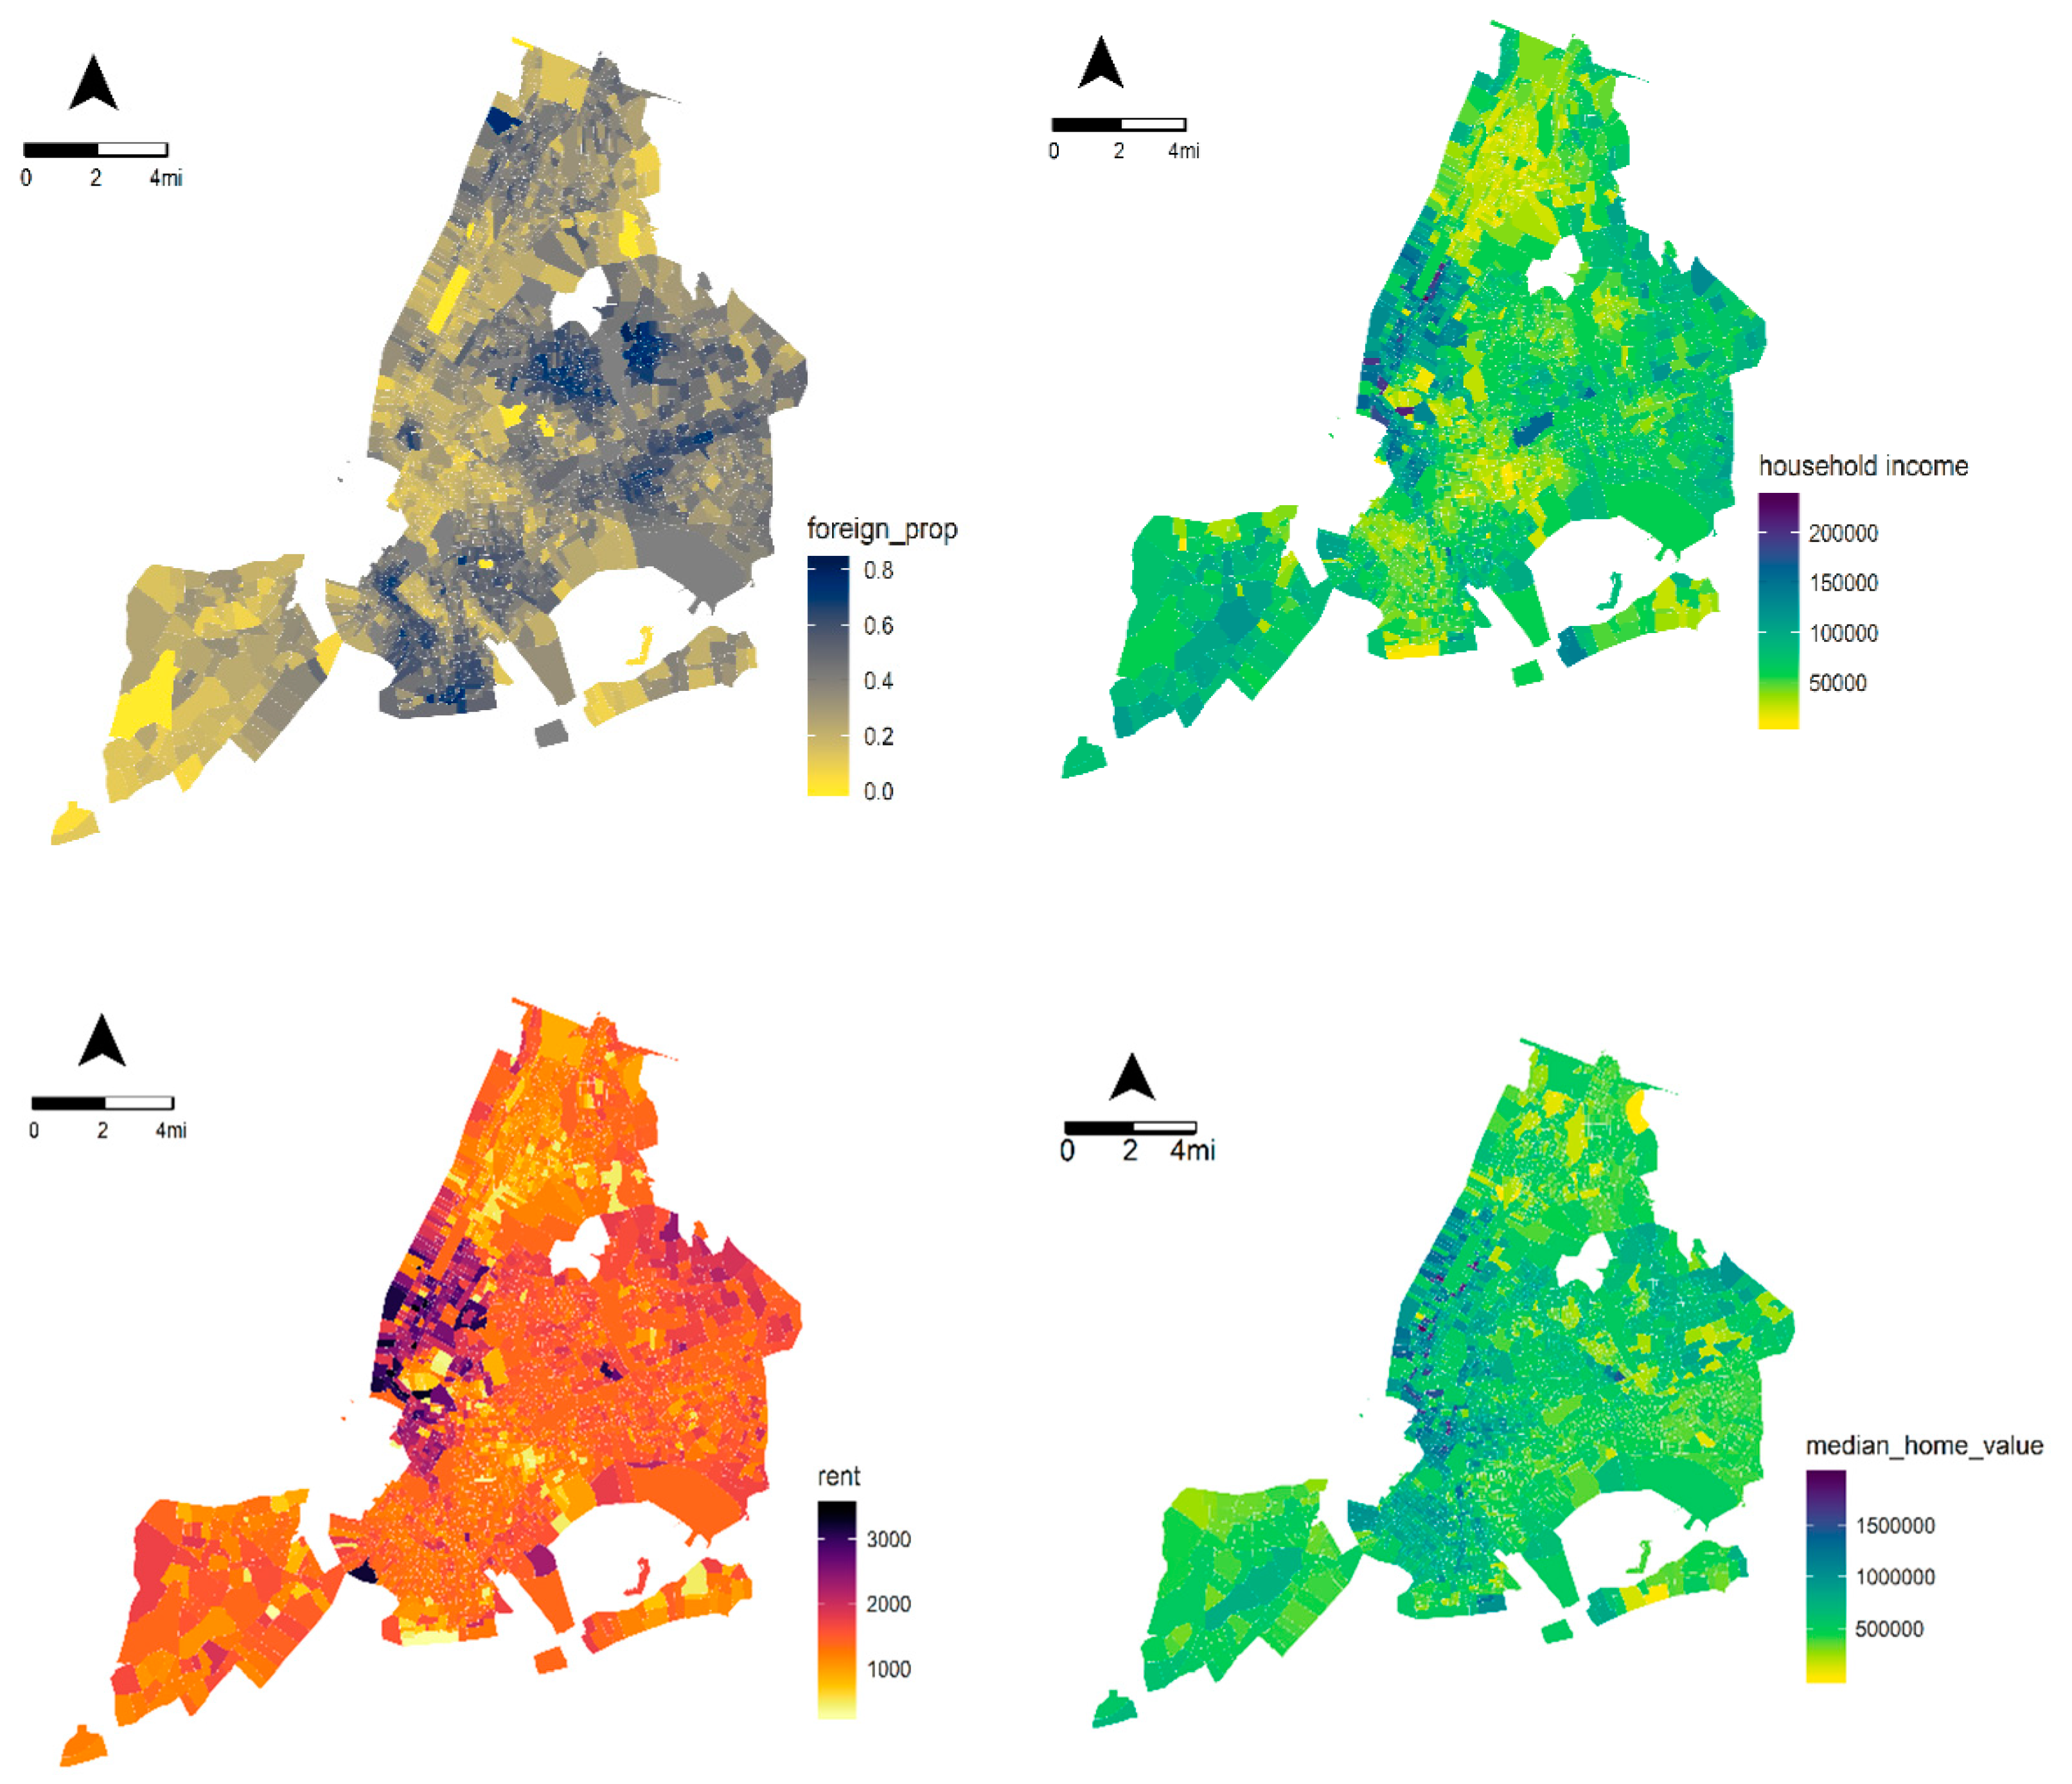
New York City is among the largest cities in the world. It is famous for its numerous tourist attractions and its cultural diversity. New York City boasts a global population, with nearly 40% of residents born overseas. A record-high 3.3 million foreign-born immigrants reside in New York City, topping all other cities worldwide (U.S. Census Bureau, 2015). As identified from Figure 1, Queens and Brooklyn have a higher proportion of foreign-born residents than other boroughs. Socioeconomic diversity is pronounced in New York City as well. Neighborhoods in Manhattan, specifically Midtown, Lower Manhattan, and Upper East Side, have the highest median household income in New York City. It is unsurprising that the aforementioned neighborhoods also have the highest median rents and median home values, as evidenced by the two subfigures of Figure 1 featured below. The distribution of socioeconomic inequality by race and household income might affect the geography of crime rates [24]. We are interested in theft-related crime research because (1) New York City is heavily featured in crime-related research; numerous studies in the criminology literature evaluate New York City; and (2) New York City’s theft-related crime data and 311 data are publicly accessible.
The datasets used in this paper were downloaded from the New York City Open Data website over the span of 1 January 2010 to 31 December 2015, to include crime data and 311 data. The datasets are illustrated in Figure 2.
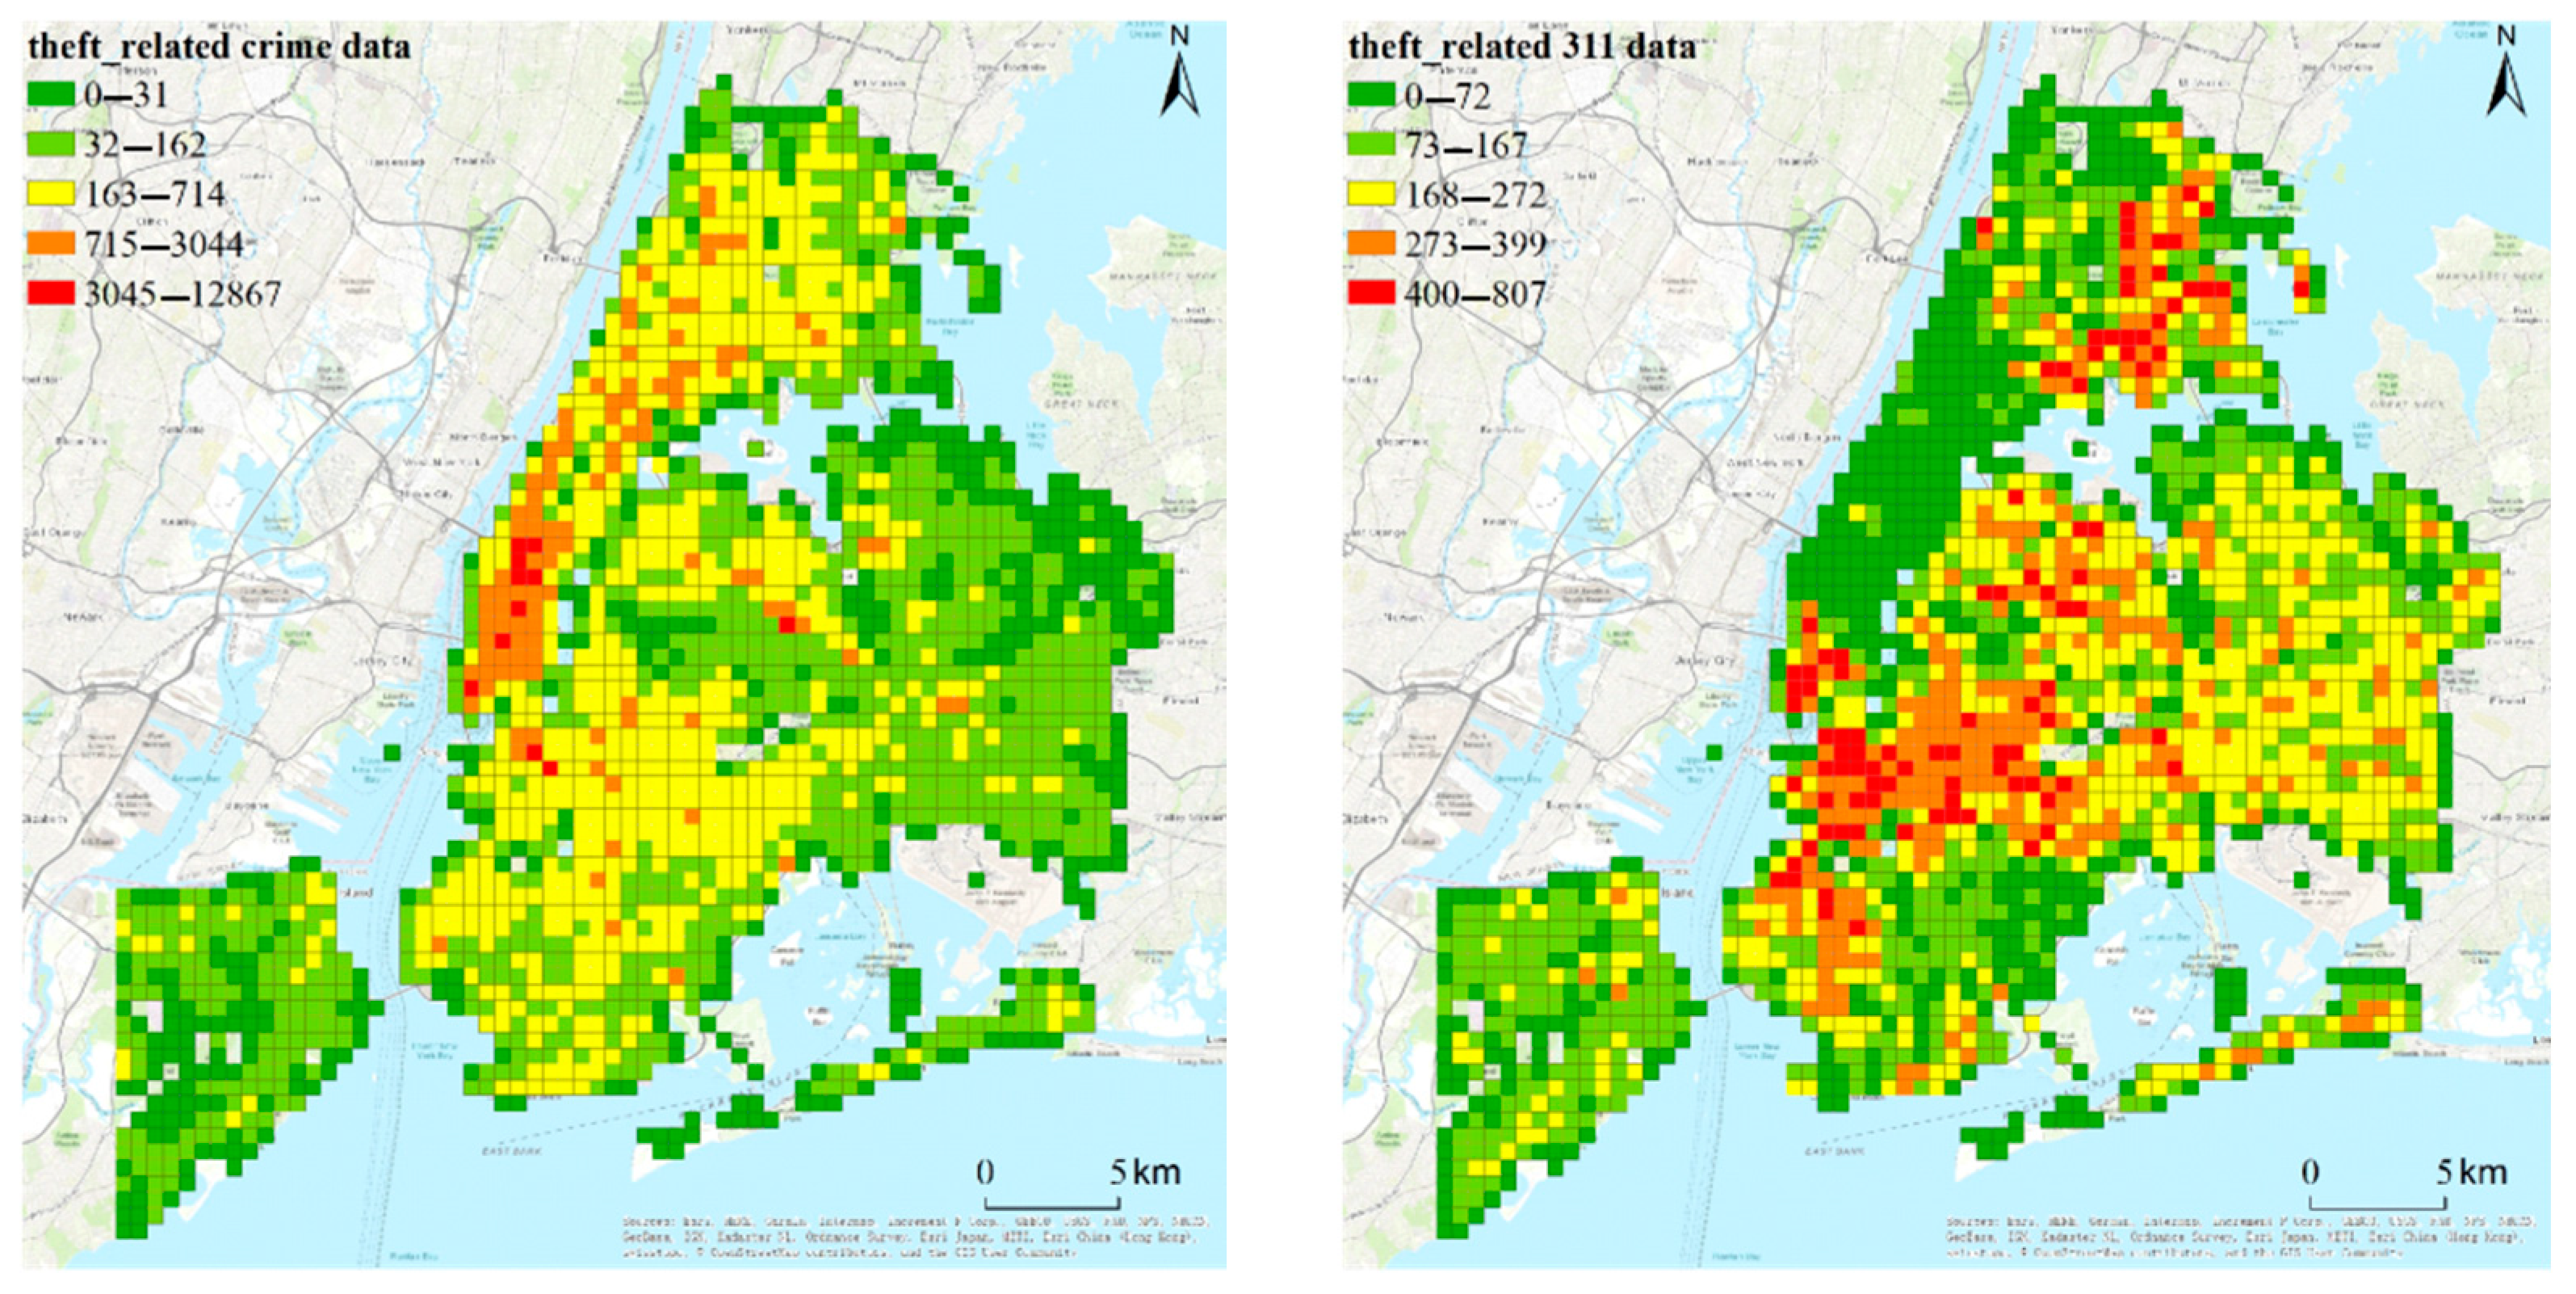
Crime data: There were 825,064 incidents for three theft-related types: burglary, grand larceny, and petit larceny. Each incident had the properties of offense type, geographic coordinates, and time. The density of theft-related incidents is shown in the left subfigure of Figure 2. From the subfigure, we can see that downtown Manhattan had the highest theft-related incident density in the city.
311 data: The reason why we include 311 data is that civil disorder and conducts hostile to society could be associated with wrongdoing activities [25]. Hence, complaint records from the 311 dataset can be an explainer and predictor for crime events. This dataset includes 1,069,786 complaint records (311 events) about three theft-related types: street condition, street light condition, and dirty conditions. Each complaint record incorporated coordinates, complaint type, and the time at which the complaint was documented. For the density of the complaint records, see the right subfigure of Figure 2. This subfigure shows that Brooklyn and the Bronx have the highest density of theft-related complaints.
4. Methods
Before illustrating the method we developed, some basic concepts need to be specified as follows:
Definition 1.
(Region): The study area is partitioned into disjointed 80 × 80 grids, G = {g1, g2, …, g80×80}. Each grid in G is considered a separate region. The area of each region is about 0.28 km2 (0.70 km × 0.46 km).
Definition 2.
(Spatial neighbor set): The target region is the focus region where the researchers aim to predict whether a crime is most possible to take place. The s × s regions that geographically surround the target region r, which is centered in the s × s regions, are called the spatial neighbor set of g.
Definition 3.
(Time window): the duration of M days is thought of as a time window.
Problem formulation: Given history observation X= {, our goal is to estimate the probability distribution P (|) to ascertain whether there will be crime(s) in day t+k for the target region g. If P (|) >=0.5, then it may be considered a high crime risk, else it may be regarded as a low crime risk.
We observe that the crime study suffers from a data imbalance problem. Ninety-three percent of samples were labeled as 0, indicating a class imbalance problem in our dataset. This study addressed this issue in a two-fold manner. First, the crime-label is a dummy variable, . Value of 0 indicates no crime took place in the region on day t, while the value of 1 indicates some crimes took place in the region g on day t. There is a severe class imbalance. Grids in which crime has occurred are much less than grids in which no crime has occurred. To account for this imbalance, we, secondly, under-sampled 0-label data, as Chohlas-Wood et al. did in their study [16], and augmented the sample size of the 1-label sample based on the synthetic minority oversampling technique (SMOTE) [26].
4.1. DIRNet
A deformable image registration deep learning network (DIRNet) is composed of a convolutional neural network repressor, a spatial transformer, and a resampler. The convolutional neural network investigates a pair of fixed and moving images and outputs parameters for the spatial transformer, which produces the displacement vector that enables the resampler to adjust the moving image to the fixed image. In this case, we propose a DIRNet. This section first presents the DIRNet architecture and then explains how its key components take spatiotemporal dependencies into account.
Architecture
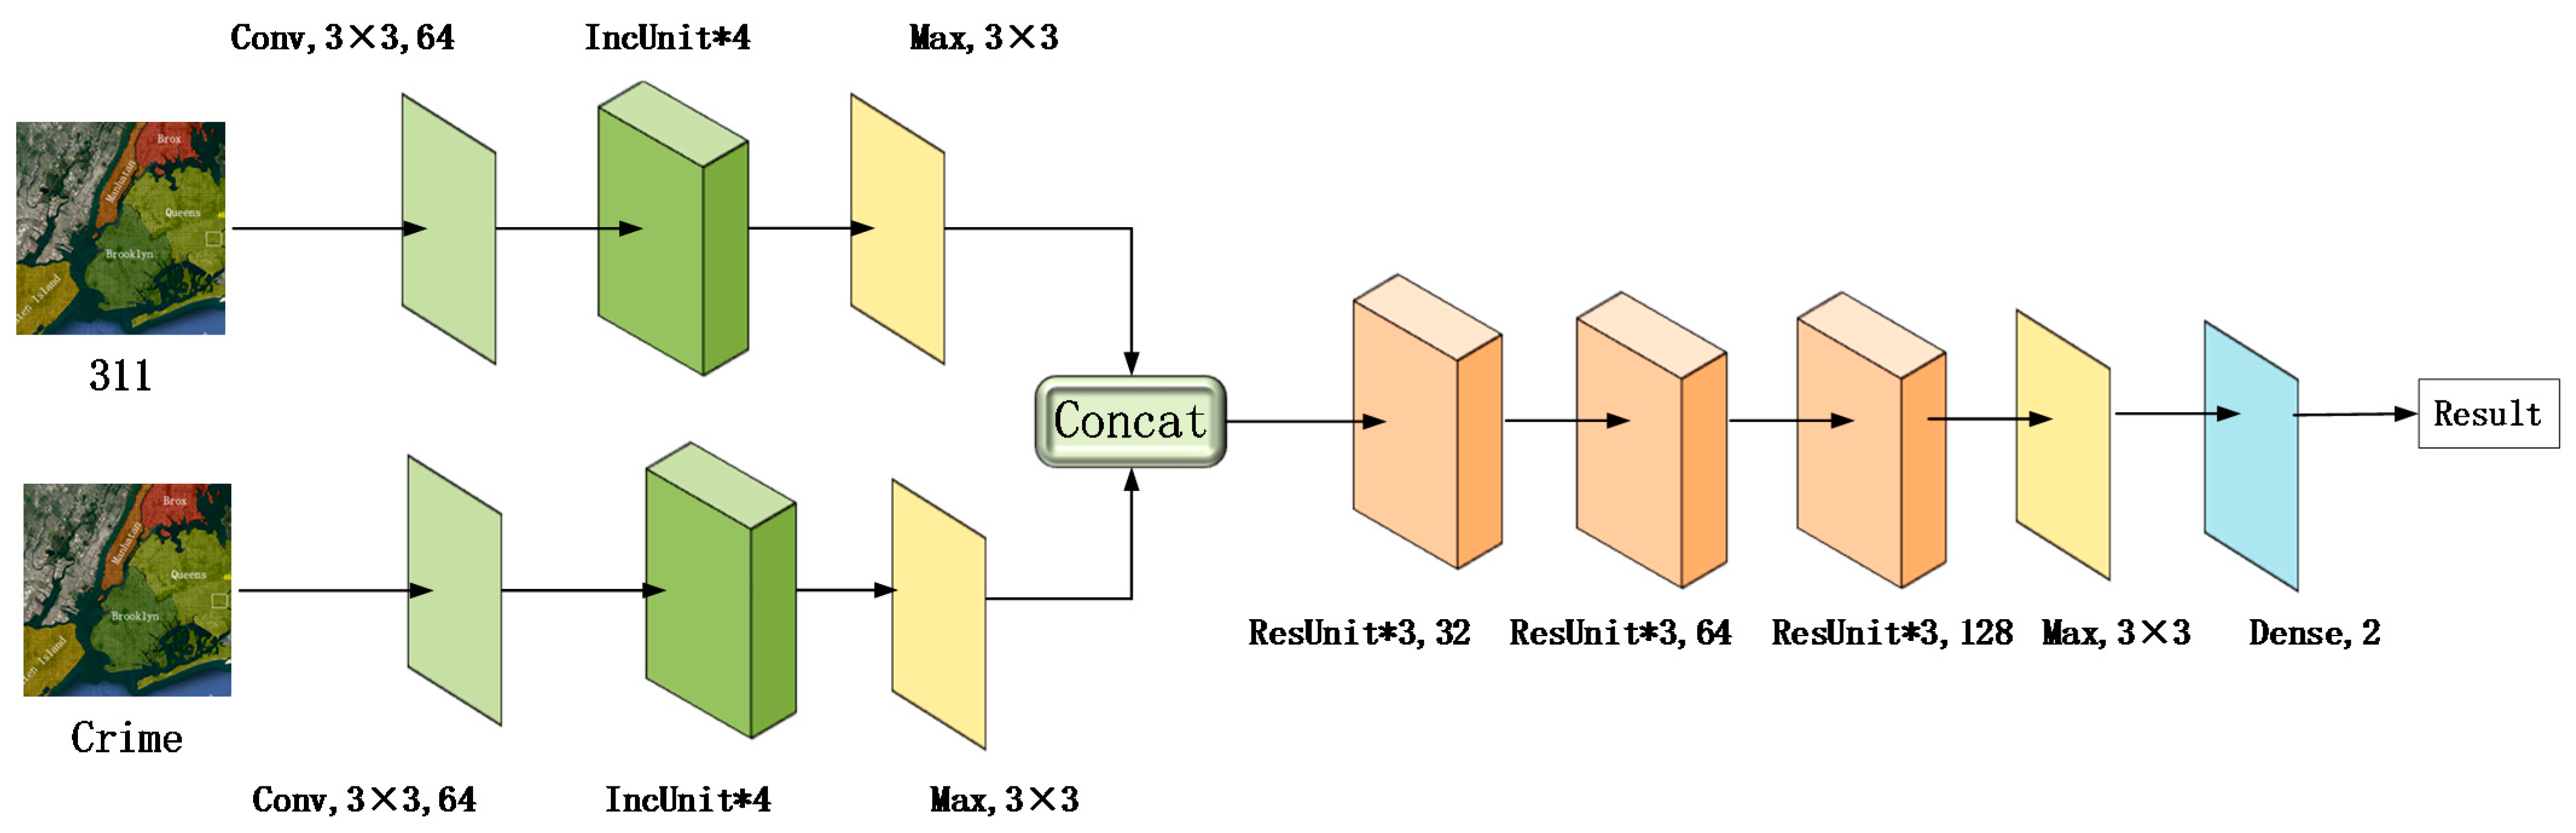
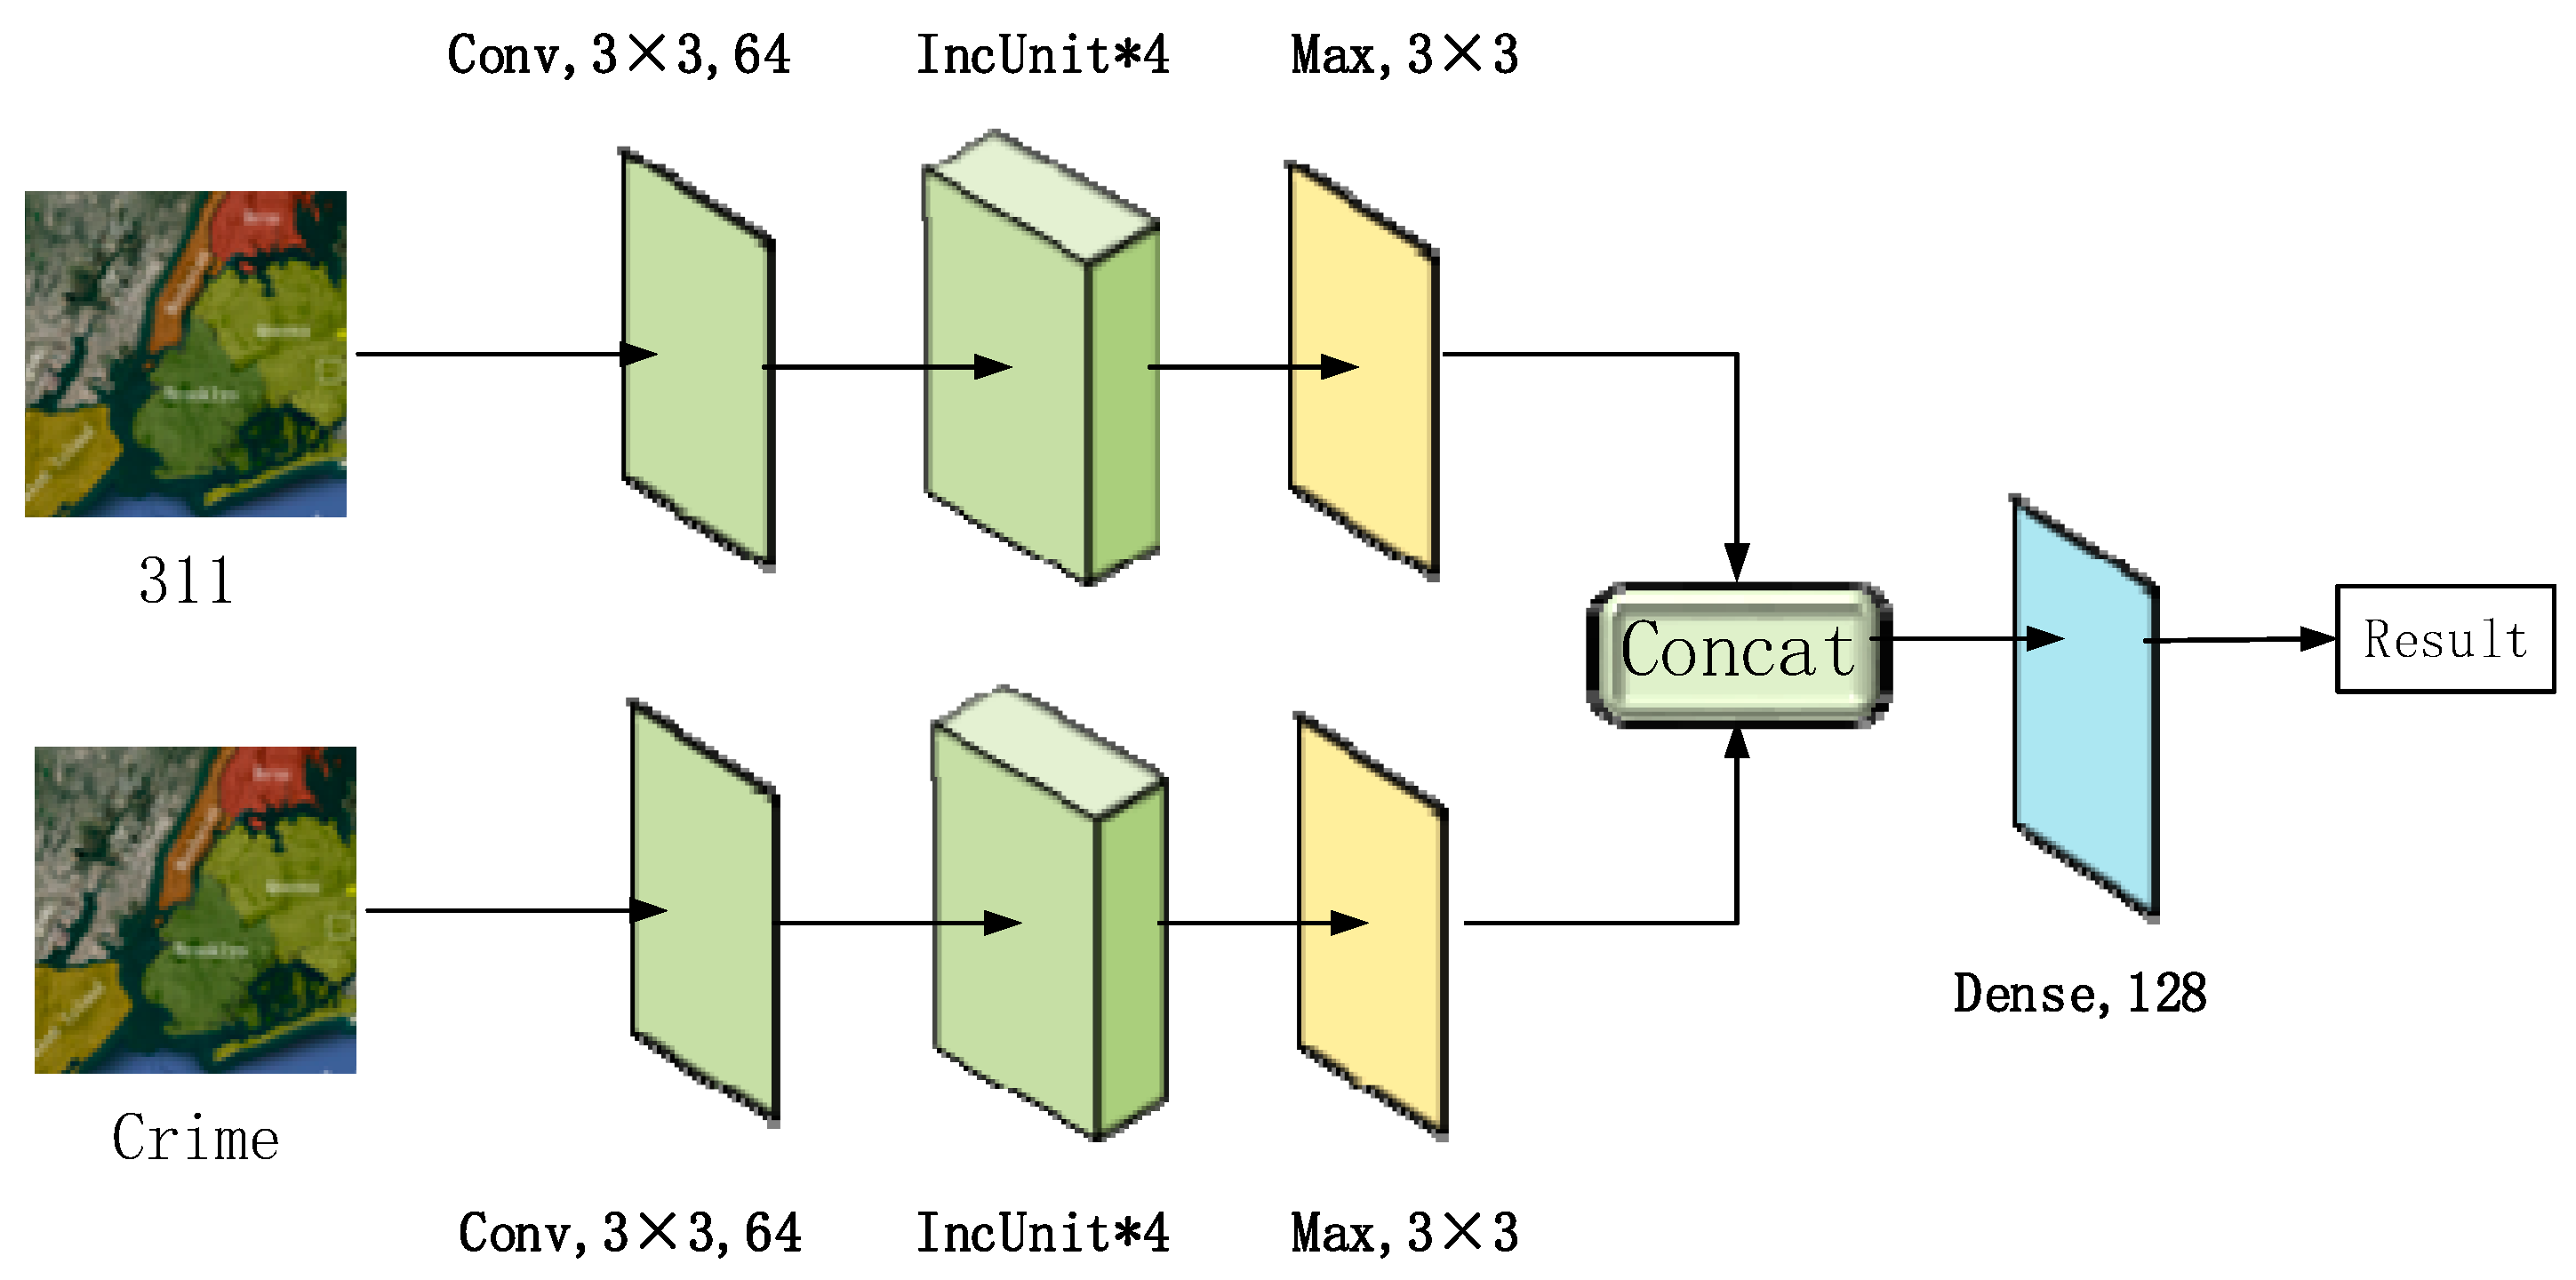
Figure 3 presents an overview of the proposed DIRNet architecture, which is composed of three functional modules handling the crime dataset and the 311 dataset as well as the fusion of these two datasets. The top left branch of DIRNet is responsible for building latent representations using inception units (IncUnits) for crime data. Similarly, the lower-left branch is used to extract 311 spatiotemporal dependencies. Both outputs are fed into the sub-module, which mainly consists of nine residual units (ResUnits) to capture the high-level interactions of crime and 311 events. Finally, the networks end with a global average pooling layer and a two-way dense layer with a Softmax function to realize crime prediction.
4.2. Spatiotemporal Dependencies Represented in Convolutions
This section outlines the utilities of various convolution layers in their distributed representation of the spatiotemporal dependencies for the crime.
4.2.1. Convolution Layer
In the convolution layer, the convolution operation acts as the inner product of the linear kernel followed by rectified linear units (ReLU) [27], as a nonlinear activation function f,
where l indicates the lth layer, indicates the size of the kernel, indicates the entry covered by the linear kernel in the input feature map, is the learnable weight in the linear kernel, and is the linear bias. A particular convolutional operation (1) decides whether a neuron in a current layer can be activated, depending on the local neurons in the input feature map, which can then be used to capture a particular spatiotemporal relationship among crime-related events.
4.2.2. Pooling Layer
There is a need to summarize the local spatiotemporal features to reduce the sensitivity or tune out noise related to crime incidents [28]. On the other hand, pooling layers usually serve to control overfitting by reducing the number of nonsignificant neurons.
4.2.3. Concat Layer
4.2.4. Dense Layer
In a dense layer, each entry of the input feature map is connected to each of its neurons. The dense layer can model global patterns in the whole input feature map, thus representing interactions of crime-related incidents globally.
4.2.5. Inception Unit and Residual Unit
Mutual influences of geo-events between distant locations and long periods can be represented by overlapping convolution layers [31]. However, direct stacking of convolution layers only makes the enlarged network more prone to overfitting [32]. To overcome this weakness, this study developed the IncUnit and ResUnit to improve crime prediction performance.
We construct an inception unit obeying the principle [32] as shown in Figure 4, by stacking asymmetric convolution layers in three branches to capture the information described below:
Such asymmetric neural structures can express the various trends in different local spatiotemporal scopes while producing cheaper computations with fewer parameters.
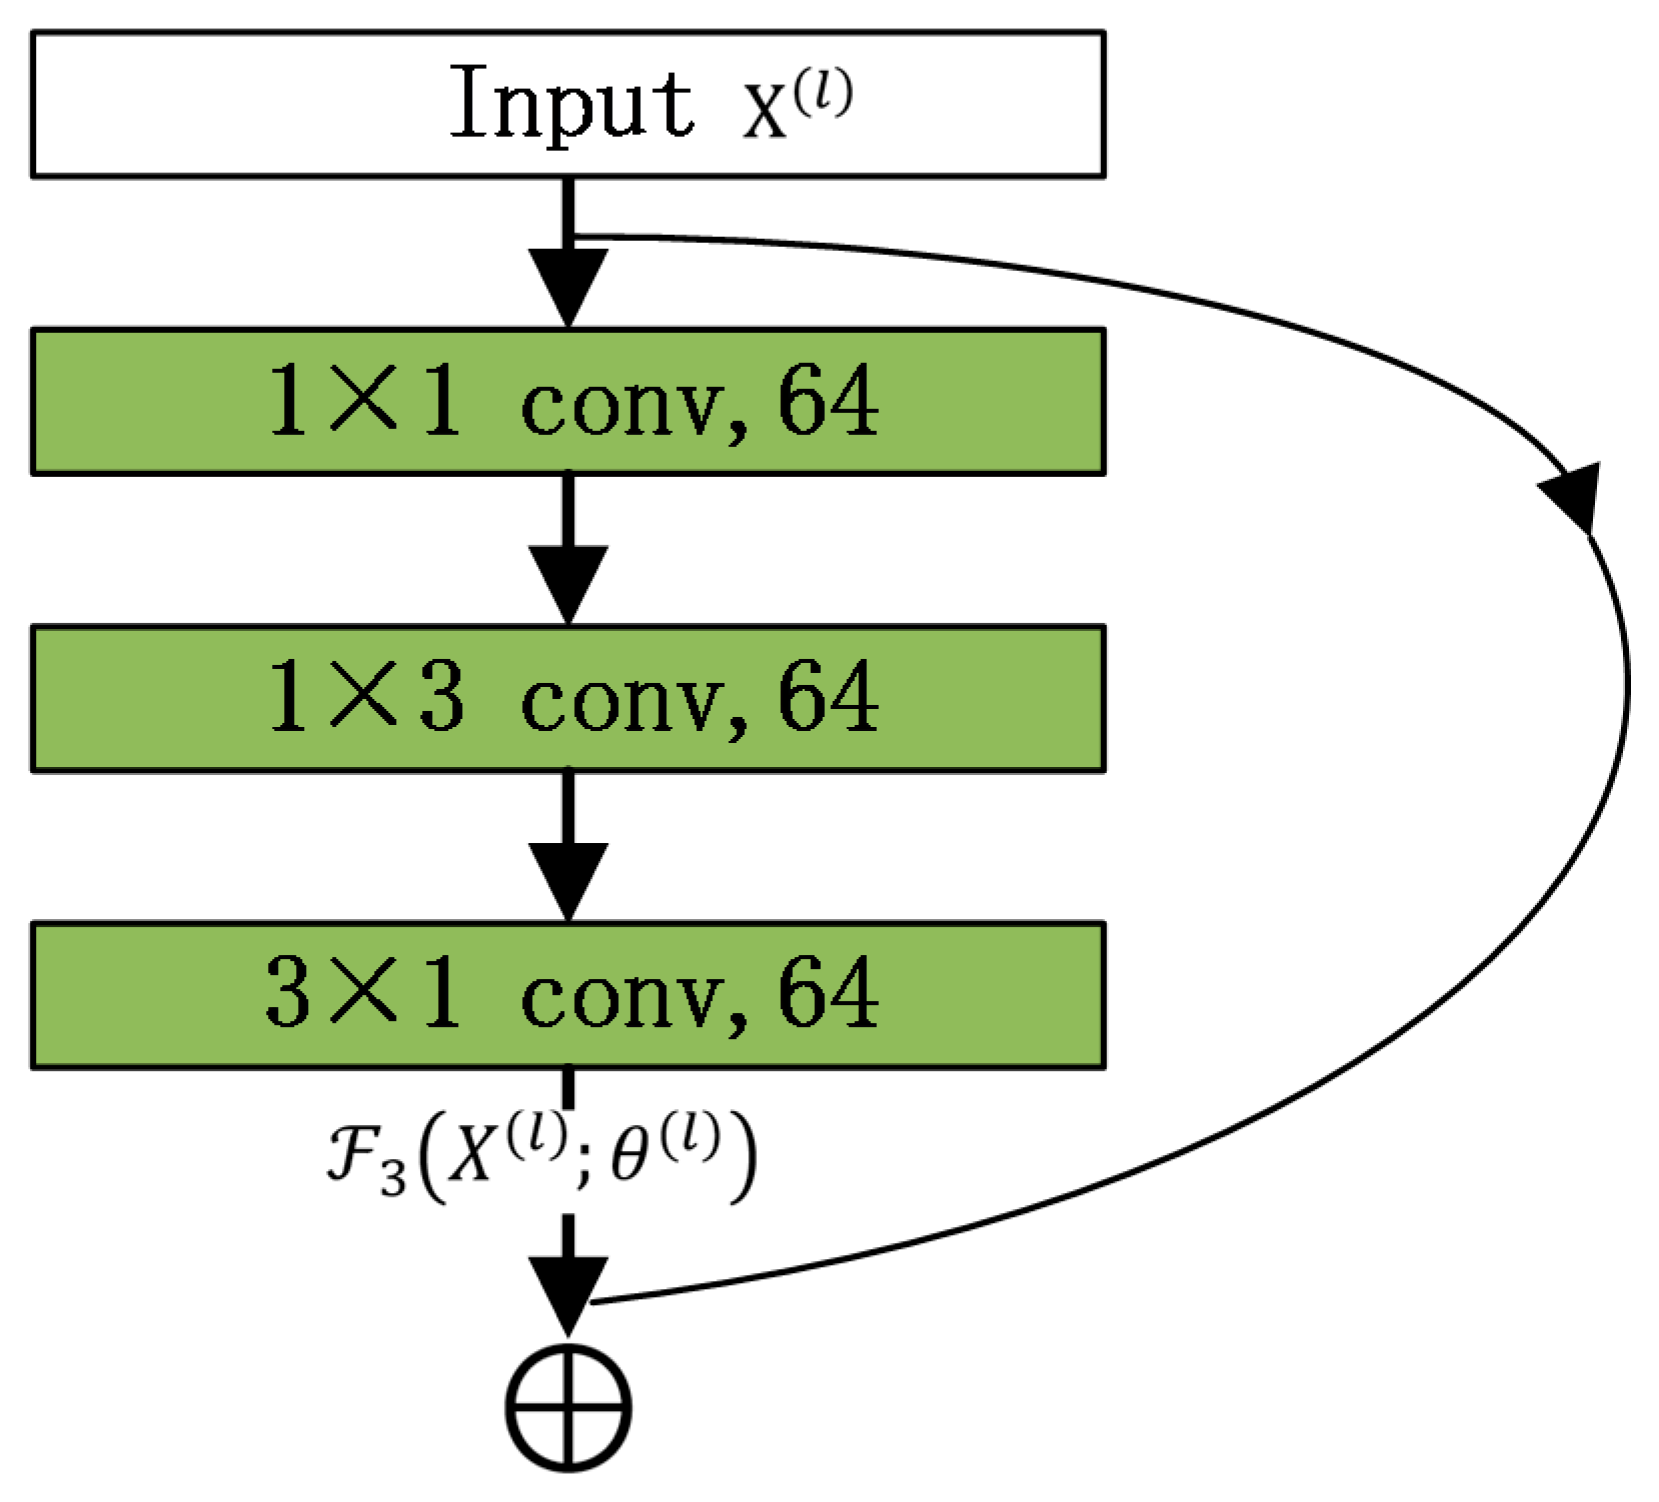
According to residual networks [33], this study builds a residual unit from every three stacked convolution layers with asymmetric kernels (e.g., 1 × 3 and 3 × 1 kernels), to use fewer parameters while still increasing expression ability, as shown in Figure 5.
This residual network structure can capture very subtle spatiotemporal relationships between geo-events with more overlapping convolution layers. Otherwise, deep structures usually lead to “gradient vanishing,” while shallow structures do not point to sufficiently effective relationships among geo-events. Both cases will result in prediction performance degradations.
5. Experiments and Results
This section validates the proposed DIRNet on the crime and 311 datasets of New York City and compares the performances against four baseline models.
5.1. Experimental Setup
Python 3.5, TensorFlow 1.01, Keras 1.0, and CUDA 8.0 were used to build CNNs models on a desktop computer with an Intel i7 3.4GHz CPU, 32GB memory, and NVIDIA GT1080 TI GPU. For DIRNet, samples were fed into the model with a mini-batch size of 64. All the convolution layers used ReLU activation functions with batch normalization technology. We use the He initialization method to initialize all of the weights in the deep learning model, which rely on the binary cross entropy and the adaptive moment estimation (Adm) methods as its loss function and optimizer, respectively.
5.2. Evaluation Metrics for Machine Learning
To assess the performance of a machine-learning model, researchers can draw a confusion matrix and use an accuracy indicator to determine how often the model is correct. The problem of using the accuracy indicator is that the result is not meaningful when a severe class imbalance exists. This study falls into this scenario. For example, if the positives are grids in which crime has occurred and the negatives are grids in which no crime has occurred, an accuracy rate of 99% means that the outcome is correct 99% of the time across all classes. However, the number of grids representing crime is much lower than the number of grids without crime. For the positive class, this data may be current as little as 30% of the time even though the accuracy rate is considered to be 99%. Therefore, we prefer to use another indicator integrating the precision and recall—the F1 score (Precision = True positives/ (True positives + False positives), while recall = True positives/ (True positives + False negatives). F1 score combines precision and recall).
A good F1 score shows that both low false positives and low false negatives exist, which allows the classes to be correctly identified. The higher the F1 score is, the more robust the model’s performance. (There are multiple dimensions in model comparison in addition to the F1 score, such as the execution time. We did not compare execution time among models, simply because the training time that either the proposed model or compared models cost is less than 3 hours on a standard PC. Therefore, the execution time is not a major concern in this analysis).
5.3. Baseline Machine-Learning Models
We select four machine-learning models that are recently and frequently implemented in predicting crime as the baseline machine models. The baseline machine-learning models are in comparison with our proposed approach with regards to the F1 score:
- Support vector machines (SVMs) [20]: Following the literature, we ran SVMs using the Gaussian radial basis function(RBF) kernel to map the original features to a high-dimensional feature space.
- STCN: Spatiotemporal crime network (STCN) applies inception networks and fractal networks simultaneously to forecast crime risks. The parameters of STCN implemented in this case are the same as the best model described in Duan et al. [23].
5.4. Performance Comparison
This section presents experimental results and gives insights on the effectiveness of these approaches.
5.4.1. Comparative Performance Studies on Time Window N
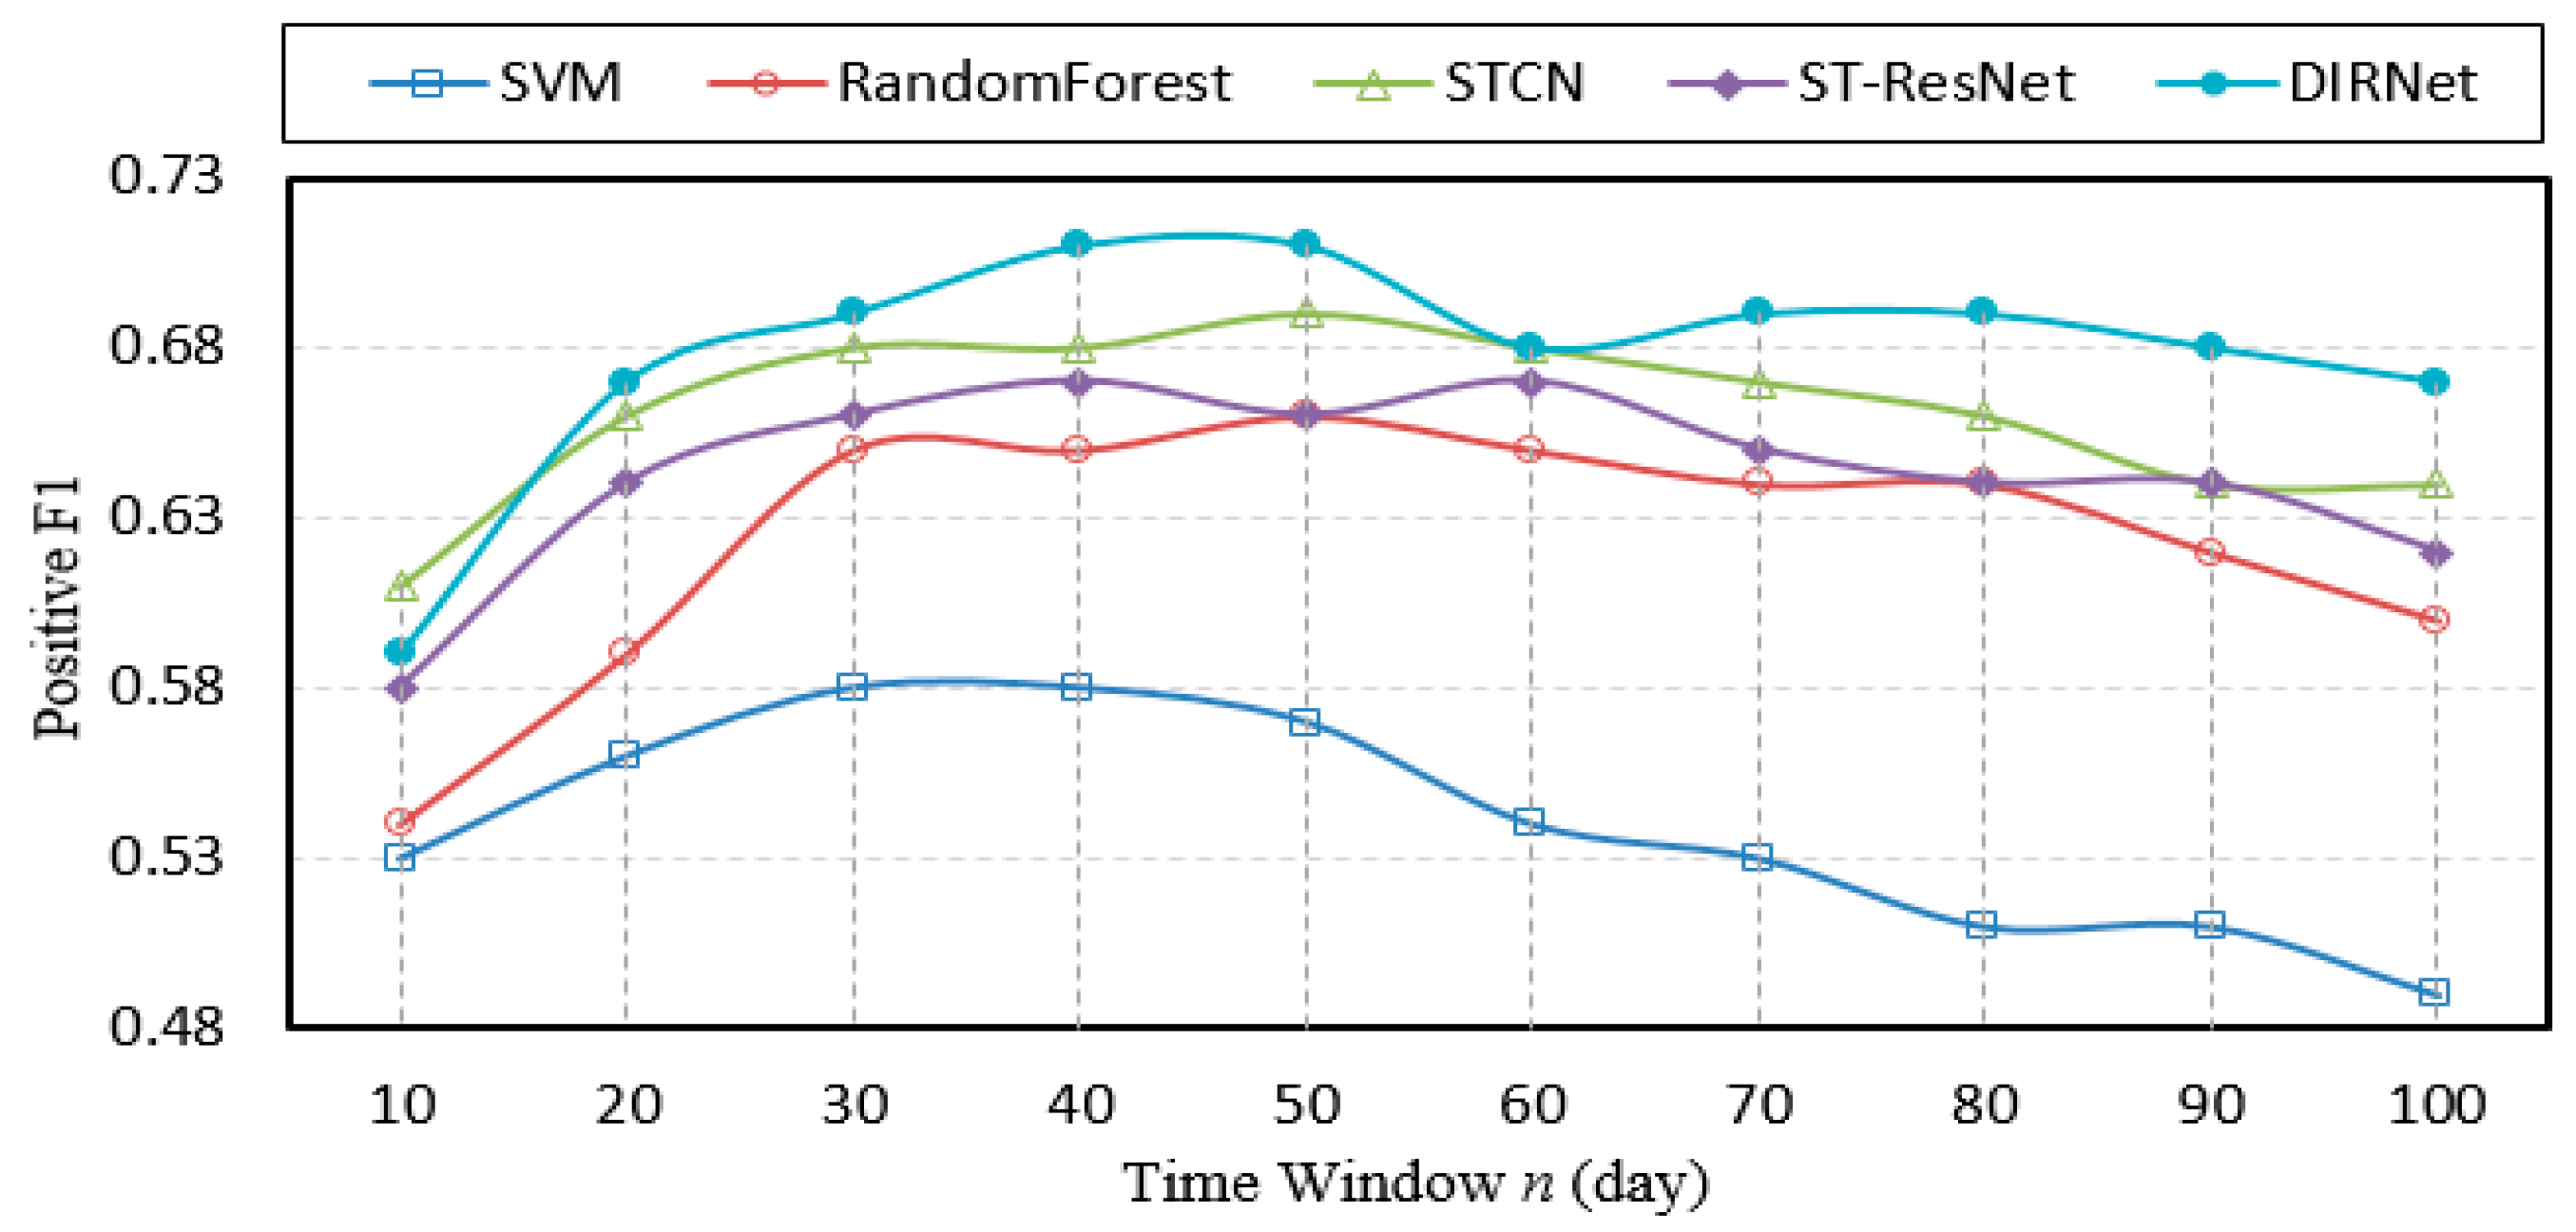
In this experiment, the size of the spatial neighbor set was fixed at 3 × 3. The predictive results of models with a positive F1 and an increasing time window n have been depicted in Figure 7. The horizontal axis of Figure 7 indicates the amounts of days that we take into considerations when we train the model. For example, if n = 10, it means we use the last 10 days’ crime data and 311 data to train the model. Every time the time window is changed, the model has to be retrained. In this test, we have 10 time windows. Hence, we trained the model 10 times. The vertical axis of Figure 7 indicates the F1 score. As the time window increases, more and more crime samples that occurred during the increased window are included in training the models. Figure 7 shows that the proposed DIRNet approach outperforms other baseline models across various time windows. This suggests that the DIRNet model is capable of retrieving the spatial pattern that underlies both short-time span geographical data and long-time span geographical data. More specifically, there is more than a 2% improvement in F1 in comparison with STCN, which is the best classifier among the baseline models. Since the SPPT method always analyzes crime events over an entire area to yield a prediction, its F1 value is constant and the prediction data are the least reliable. For most algorithms, prediction performance improves as the time window increases to a certain threshold, due to more temporal patterns or trends being discovered as more historical crimes and 311 data continue to be fed into models. It is worth noting that the F1 of DIRNet is still higher than all baselines when the length of the time window reaches 100 days, proving that the proposed model has the best ability to reveal distant temporal dependencies from sparse data.
5.4.2. Comparative Performance Studies on Spatial Ranges
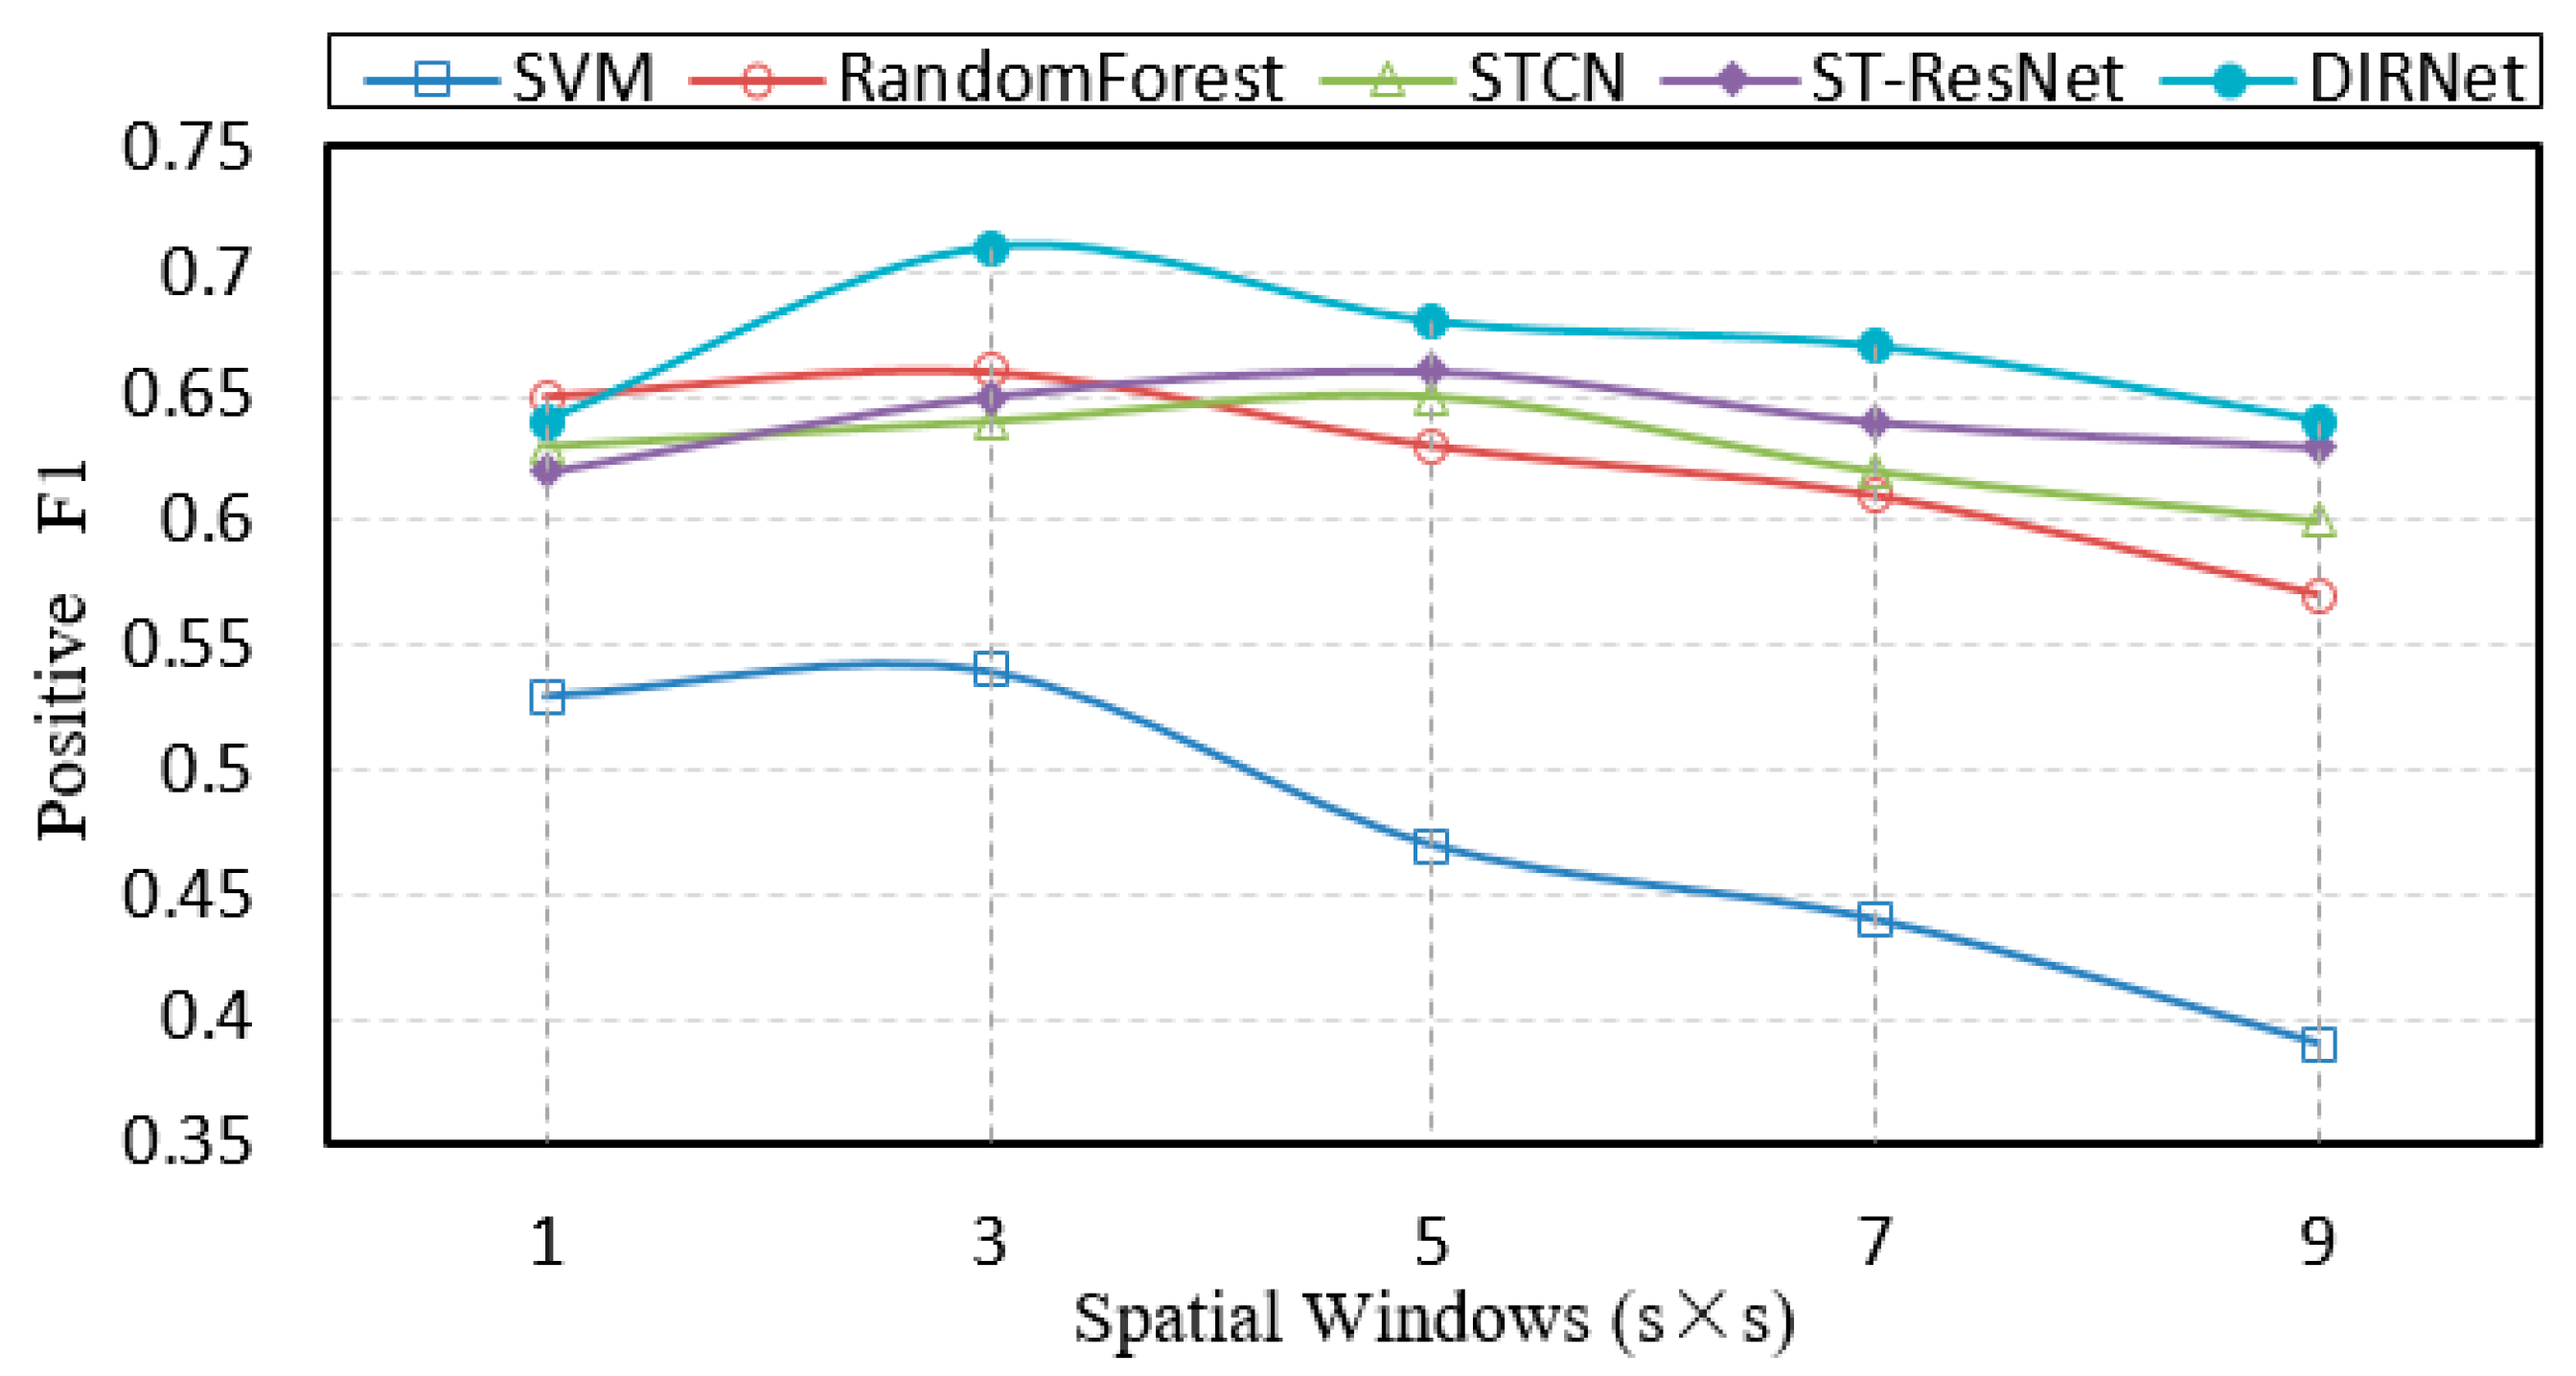
The influence of varying spatial ranges (size of the neighbor set) on the positive F1 is shown in Figure 8. Here, the length of the time window is fixed at 60 days for all models. The horizontal axis of the figure indicates spatial windows while the vertical axis demonstrates F1 scores. As shown in Figure 8, the proposed DIRNet approach achieves the highest F1 score among all the other models, most of which obtain the lower F1 by 6% compared to the DIRNet. This suggests the DIRNet model is more able to capture information of spatial dependency than other models across various spatial windows. The SPPT method offers the worst performance. When the spatial size ranges from 1 to 3, most models experience a performance promotion in F1, demonstrating that the composition of adjacent regions is important for capturing complicated spatial patterns. However, as the spatial range continues to increase, the performance of each of the overall models degrades. The reasons for this may be that crime and 311 intensities in a broader spatial range tend to fluctuate more and have a less significant spatial dependency on a daily temporal scale.
5.5. Discussion
The aforementioned results show that the proposed deep learning network, DIRNet, outperforms other models in terms of F1. The reason is that the DIRNet model extracts the information of spatial-temporal dependence before merging crime data and 311 data. As such, the spatial-temporal information can be used in other layers to increase the prediction accuracy of crime. In contrast, the STCN model combines crime data and 311 data at the first layer, and fails to extract information on spatial-temporal dependence of crime from the data; thus, the STCN model has a lower prediction accuracy rate than the DIRNet model. Another baseline model, ST-ResNet, effectively extracts information on spatial-temporal dependence of crime before merging the crime data and 311 data. However, this model offers fewer layers in its neural network than our proposed DIRNet, which thus results in a lower prediction accuracy rate.
This paper shows that non-urgent social events, like those conveyed by 311 data, often correlate with worse events, such as crimes, but the complex space-time relationships between them are often difficult to obtain. There are many categories into which 311 data can be classified (e.g., noise, quarrel, and water leakages). Determining which of the 311 data categories can be used to efficiently indicate crimes—as well as corresponding research—is further needed in future studies.
As the momentary retrospective features from crimes and 311 calls are scant and unlikely to provide enough resolution for prompt forecasting [16], advanced models are usually preferred for long-run features following the ordinary natures of periods or seasons. The properties of the crime series distributions in the forms of mean, median, standard deviation, and Shannon entropy are important in the characterization of crime intensity fluctuations. Such tailor-made features can decrease computational complexity and feature space, while still preserving useful data interpretability. Even more, existing research also shows that the usage of human behavioral data [14], rich statistical demographical data, and weather data [31] all provide finer temporal and spatial resolution for comprehensively understanding local crime. As a consequence, future work will involve multiple data sources and leverage the statistical index from time series to produce deeper retrospective features.
Unequal class distribution representation in data often emerges in urban investigations, as happened in this study. It tends to make a statistical model or classifier heavily biased towards the majority class [34]. To address this challenge, previous studies in the crime analysis domain applied several policies to reach the minority class. For example, Kadar et al. split crime categories into “violent” and ”non-violent crimes” classes [14]. Gerber only included the locations with at least one crime during a long-term period as samples [15]. However, these methods only adopted samples with at least one crime incident and thus could not be used to predict when and where there would be no crime. For this study, the researchers augmented the sample size of the minority class through the over-sampling method of SMOT [26] while reducing the majority class through an under-sampling method. Therefore, this approach of generating synthetic samples to alleviate the imbalance problem saw improved results and appears to offer a more robust solution that is applicable to the real world. However, in the experiment, lowering the under-sampling ratio to a value such as 0.2 (indicating that the number of 0 class is large), would lead to an increase in accuracy of the 0 class but the decline in accuracy of the 1 class as well, especially when using the DIRNet model. On the contrary, when the under-sampling ratio is large, such as at a value of 0.8 (indicating that the number of 0 class is small), the accuracies of both the 0 and 1 classes decrease slightly. This may happen as the decrease in samples of both the 0 and 1 classes undermines the capacity of the model to be used to explore more valid spatiotemporal patterns. If the under-sampling ratio was set in the range of 0.2–0.8, there would be no obvious variation pattern in the predictive performance in accuracy or the F1. In practice, we set the under-sampling ratio to 0.5.
6. Conclusions
This paper proposes a novel deep-learning model that can offer end-to-end learn abstract latent features for fine-grain crime prediction. The proposed model can extract information on spatial and temporal dependence before fusing the crime data and 311 data, has deep layers, and hence may have a good performance in crime prediction. Experiments using real datasets validated the effectiveness of the proposed DIRNet by comparing the model with four other baseline machine-learning models.
Machine-learning plays a vital role in the built environment and planning fields (e.g., [35]). This study, centering on a novel deep learning approach has critical implications in academia and practice. (1) It shows that researchers should extract information on spatial and temporal dependence before merging multiple datasets in order to apply the proposed neural network to predict events that are spatially and temporally dependent. This study also indicates that a neural network with deeper layers could be applied to achieve accurate predictions as long a large sample size is used. (2) The proposed DIRNet can accurately predict crime in such a way that could benefit policing strategies and crime reduction. One such example application for this technique might be hotspot policing (directed patrol). To reduce hotspots and peak times for criminal activity, a more precise policy patrol presence should concentrate on those hotspots at time windows. With the potential accuracy of crime hotspot forecasting, other strategies, such as broken windows policing, zero tolerance policing, rapid response, and increase police numbers can also be applied to reduce criminal activity. (3) The proposed DIRNet can not only be used to predict crime but it can also be implemented to predict other events in urban areas, such as traffic accidents, etc. that are spatially and temporally dependent. Even more, the proposed DIRNet could capture those dependencies and thus serve a unique role in traffic accident prediction.
However, some limitations should be noted. First, we did not take other factors into account and these factors may influence the crime rate, such as weather conditions. Second, we did not subcategorize the 311 compliant records. Some subcategories of 311 complaints may have better explanatory power of crime incidents than the other subcategories. Here we would like to see if the proposed neural network can automatically capture the spatial patterns of crime incidents that underlies noisy large-scale data (unrefined crime data and unrefined 311 data), and has a high F1 score, and it does. The acknowledgment of the research limitations also inspires the directions of future research. (1) Researchers could apply and test the proposed neural network for crime prediction in other cities; (2) more factors that may influence crime rate could be included in crime prediction; and (3) the proposed neural network could be developed further to take advantages of prior knowledge of crime, which will promote the prediction accuracy.
Big data applications hold promise for addressing both shortfalls of existing predictive methods and potential dangers. The successful advancement of the criminology of place requires elevating the “why” question to equal status with those of “where” and “what” in the analysis of crime [3]. As such, our future research efforts will further investigate the “why” factors, along with the advances of deep-learning approaches.
Author Contributions
Conceptualization, X.Y. and L.D.; methodology, X.Y. and L.D.; software, L.D.; validation, L.D.; formal analysis, X.Y., L.D., and Q.P.; original draft preparation, X.Y., L.D., and Q.P.; Writing—Review and editing, X.Y., Q.P., and L.D. All authors have read and agreed to the published version of the manuscript.
Funding
This research was funded by the National Natural Science Foundation of China (grant number 41961062) and Guangxi Natural Science Foundation (grant number 2018JJA150089).
Data Availability Statement
Publicly available datasets were analyzed in this study. The data can be found here: https://opendata.cityofnewyork.us/.
Conflicts of Interest
The authors declare no conflict of interest.
References
- Neirotti, P.; De Marco, A.; Cagliano, A.C.; Mangano, G.; Scorrano, F. Current trends in Smart City initiatives: Some stylised facts. Cities 2014, 38, 25–36. [Google Scholar] [CrossRef] [Green Version]
- Butt, U.M.; Letchmunan, S.; Hassan, F.H.; Ali, M.; Baqir, A.; Sherazi, H.H.R. Spatio-Temporal Crime HotSpot Detection and Prediction: A Systematic Literature Review. IEEE Access 2020, 8, 166553–166574. [Google Scholar] [CrossRef]
- Hossain, S.; Abtahee, A.; Kashem, I.; Hoque, M.M.; Sarker, I.H. Crime Prediction Using Spatio-Temporal Data. arXiv 2020, arXiv:2003.09322. preprint. [Google Scholar]
- Kang, W.H.; Kang, H.-B. Prediction of crime occurrence from multi-modal data using deep learning. PLoS ONE 2017, 12, e0176244. [Google Scholar] [CrossRef]
- Chainey, S. The Crime Prediction Framework—A Spatial Temporal Framework for Targeting Patrols, Crime Prevention and Strategic Policy. In Proceedings of the National Security Summit, San Diego, CA, USA, 18 July 2015. [Google Scholar]
- Bannister, J.; O’Sullivan, A.; Bates, E. Place and time in the Criminology of Place. Theor. Criminol. 2017, 23, 315–332. [Google Scholar] [CrossRef]
- Kalantari, M.; Yaghmaei, B.; Ghezelbash, S. Spatio-temporal analysis of crime by developing a method to detect critical distances for the Knox test. Int. J. Geogr. Inf. Sci. 2016, 30, 2302–2320. [Google Scholar] [CrossRef]
- Duan, L.; Ye, X.; Hu, T.; Zhu, X. Prediction of Suspect Location Based on Spatiotemporal Semantics. ISPRS Int. J. Geo-Inf. 2017, 6, 185. [Google Scholar] [CrossRef] [Green Version]
- Rosser, G.; Davies, T.; Bowers, K.J.; Johnson, S.D.; Cheng, T. Predictive Crime Mapping: Arbitrary Grids or Street Networks? J. Quant. Criminol. 2017, 33, 569–594. [Google Scholar] [CrossRef] [Green Version]
- Adepeju, M.; Rosser, G.; Cheng, T. Novel evaluation metrics for sparse spatio-temporal point process hotspot predictions - a crime case study. Int. J. Geogr. Inf. Sci. 2016, 30, 2133–2154. [Google Scholar] [CrossRef]
- Wells, W.; Wu, L.; Ye, X. Patterns of Near-Repeat Gun Assaults in Houston. J. Res. Crime Delinq. 2011, 49, 186–212. [Google Scholar] [CrossRef]
- Caplan, J.M.; Kennedy, L.W.; Miller, J. Risk Terrain Modeling: Brokering Criminological Theory and GIS Methods for Crime Forecasting. Justice Q. 2011, 28, 360–381. [Google Scholar] [CrossRef]
- Law, J.; Quick, M.; Chan, P. Bayesian Spatio-Temporal Modeling for Analysing Local Patterns of Crime Over Time at the Small-Area Level. J. Quant. Criminol. 2013, 30, 57–78. [Google Scholar] [CrossRef]
- Kadar, C.; Iria, J.; Cvijikj, I.P. Exploring Foursquare-derived Features for Crime Prediction in New York City. In Proceedings of the 5th International Workshop on Urban Computing (UrbComp 2016), San Francisco, CA, USA, 14 August 2016. [Google Scholar]
- Gerber, M.S. Predicting crime using Twitter and kernel density estimation. Decis. Support Syst. 2014, 61, 115–125. [Google Scholar] [CrossRef]
- Chohlas-Wood, A.; Merali, A.; Reed, W.; Damoulas, T. Mining 911 Calls in New York City: Temporal Patterns, Detection, and Forecasting. In Proceedings of the Twenty-Ninth AAAI Conference on Artificial Intelligence, Austin, TX, USA, 25–30 January 2015. [Google Scholar]
- Wang, H.; Kifer, D.; Graif, C.; Li, Z. Crime Rate Inference with Big Data. In Proceedings of the 22nd ACM SIGKDD International Conference on Knowledge Discovery and Data Mining, San Francisco, CA, USA, 13–17 August 2016; pp. 635–644. [Google Scholar]
- Iqbal, R. An Experimental Study of Classification Algorithms for Crime Prediction. Indian J. Sci. Technol. 2013, 6, 1–7. [Google Scholar] [CrossRef]
- Wang, X.; Brown, D.E. The spatio-temporal modeling for criminal incidents. Secur. Inf. 2012, 1, 2. [Google Scholar] [CrossRef] [Green Version]
- Chandrasekar, A.; Raj, A.S.; Kumar, P. Crime Prediction and Classification in San Francisco City. Available online: http://cs229.stanford.edu/proj2015/228{\_}report.pdf (accessed on 24 December 2020).
- Chun, S.A.; Paturu, V.A.; Yuan, S.; Pathak, R.; Atluri, V.; Adam, N.R. Crime Prediction Model using Deep Neural Networks. In Proceedings of the 20th Annual International Conference on Digital Government Research, Dubai, UAE, 18–20 June 2019; pp. 512–514. [Google Scholar]
- Wang, B.; Zhang, D.; Zhang, D.; Brantingham, J.P.; Bertozzi, L.A. Deep learning for real time crime forecasting. arXiv 2017, arXiv:1707.03340. preprint. [Google Scholar]
- Duan, L.; Hu, T.; Cheng, E.; Zhu, J.; Gao, C. Deep Convolutional Neural Networks for Spatiotemporal Crime Prediction. In Proceedings of the International Conference on Information and Knowledge Engineering (IKE); CSREA Press: Las Vegas, NV, USA, 2017; The Steering Committee of the World Congress in Computer Science, Computer. [Google Scholar]
- Hipp, J.R. Income inequality, race and place: Does the distribution of race and class within neighborhoods affect crime rates? Criminology 2007, 45, 665–697. [Google Scholar] [CrossRef] [Green Version]
- Wilson, Q.J.; Kelling, G.L. Broken windows. Atl. Mon. 1982, 249, 29–38. [Google Scholar]
- Chawla, N.V.; Bowyer, K.W.; Hall, L.O.; Kegelmeyer, W.P. SMOTE: Synthetic minority over-sampling technique. J. Artif. Intell. Res. 2002, 16, 321–357. [Google Scholar] [CrossRef]
- LeCun, Y.; Bengio, Y.; Hinton, G. Deep learning. Nature 2015, 521, 436–444. [Google Scholar] [CrossRef]
- Pinheiro, P.; Collobert, R. Recurrent Convolutional Neural Networks for Scene Labeling. In Proceedings of the International Conference on Machine Learning, Beijing, China, 21–26 June 2014. [Google Scholar]
- Zheng, Y. Methodologies for Cross-Domain Data Fusion: An Overview. IEEE Trans. Big Data 2015, 1, 16–34. [Google Scholar] [CrossRef]
- Karpathy, A.; Toderici, G.; Shetty, S.; Leung, T.; Sukthankar, R.; Fei-Fei, L. Large-Scale Video Classification with Convolutional Neural Networks. In Proceedings of the IEEE conference on Computer Vision and Pattern Recognition, Columbus, OH, USA, 23–28 June 2014. [Google Scholar]
- Zhang, J.; Zheng, Y.; Qi, D. Deep spatio-temporal residual networks for citywide crowd flows prediction. arXiv 2016, arXiv:1610.00081. preprint. [Google Scholar]
- Szegedy, C.; Vanhoucke, V.; Ioffe, S.; Shlens, J.; Wojna, Z. Rethinking the Inception Architecture for Computer Vision. In Proceedings of the IEEE Conference on Computer Vision and Pattern Recognition, Las Vegas, NV, USA, 27–30 June 2016. [Google Scholar]
- He, K.; Zhang, X.; Ren, S.; Sun, J. Deep residual learning for image recognition. arXiv 2015, arXiv:1512.03385. [Google Scholar]
- Ganganwar, V. An overview of classification algorithms for imbalanced datasets. Int. J. Emerg. Technol. Adv. Eng. 2012, 2, 42–47. [Google Scholar]
- Pagani, A.; Mehrotra, A.; Musolesi, M. Graph input representations for machine learning applications in urban network analysis. Environ. Plan. B: Urban Anal. City Sci. 2019. [Google Scholar] [CrossRef] [Green Version]
Figure 1.
Maps that convey characteristics of demographics and housing in New York City (left top: the proportion of foreign-born residents; right top: median household income; left bottom: median rent; right bottom: median home value).
Figure 1.
Maps that convey characteristics of demographics and housing in New York City (left top: the proportion of foreign-born residents; right top: median household income; left bottom: median rent; right bottom: median home value).

Figure 2.
Theft related crime (left) and theft-related 311 (right) incidents intensities of New York City from 2012 through 2015. A unit is the total number of incidents per grid.
Figure 2.
Theft related crime (left) and theft-related 311 (right) incidents intensities of New York City from 2012 through 2015. A unit is the total number of incidents per grid.

Figure 3.
Criminal (left) and 311 (right) incidents intensities in New York City from 2012 through 2015.
Figure 3.
Criminal (left) and 311 (right) incidents intensities in New York City from 2012 through 2015.

Figure 4.
Inception unit.

Figure 5.
Residual unit.

Figure 6.
Deep inception-residual networks.

Figure 7.
Comparison of F1 scores of models across time windows.

Figure 8.
Comparison of F1 scores of models across various spatial windows.

Publisher’s Note: MDPI stays neutral with regard to jurisdictional claims in published maps and institutional affiliations. |
© 2021 by the authors. Licensee MDPI, Basel, Switzerland. This article is an open access article distributed under the terms and conditions of the Creative Commons Attribution (CC BY) license (http://creativecommons.org/licenses/by/4.0/).
Share and Cite
MDPI and ACS Style
Ye, X.; Duan, L.; Peng, Q. Spatiotemporal Prediction of Theft Risk with Deep Inception-Residual Networks. Smart Cities 2021, 4, 204-216. https://0-doi-org.brum.beds.ac.uk/10.3390/smartcities4010013
AMA Style
Ye X, Duan L, Peng Q. Spatiotemporal Prediction of Theft Risk with Deep Inception-Residual Networks. Smart Cities. 2021; 4(1):204-216. https://0-doi-org.brum.beds.ac.uk/10.3390/smartcities4010013
Chicago/Turabian StyleYe, Xinyue, Lian Duan, and Qiong Peng. 2021. "Spatiotemporal Prediction of Theft Risk with Deep Inception-Residual Networks" Smart Cities 4, no. 1: 204-216. https://0-doi-org.brum.beds.ac.uk/10.3390/smartcities4010013