
Rider Perceptions of an On-Demand Microtransit Service in Salt Lake County, Utah


Department of Civil and Environmental Engineering, Brigham Young University, Provo, UT 84602, USA
*
Author to whom correspondence should be addressed.
†
Current address: Graduate Student, Department of Civil, Environmental, and Architectural Engineering, University of Texas, Austin, TX 78712, USA.
‡
Current address: Graduate Student, Department of Civil and Environmental Engineering, Imperial College London, London SW7 2AZ, UK.
Smart Cities 2021, 4(2), 717-727; https://0-doi-org.brum.beds.ac.uk/10.3390/smartcities4020036
Submission received: 1 March 2021
/
Revised: 7 May 2021
/
Accepted: 11 May 2021
/
Published: 14 May 2021
(This article belongs to the Special Issue Connected and Cooperative Transportation Systems for the Future Society)
Abstract
:On-demand microtransit services are frequently seen as an important tool in supporting first and last mile operations surrounding fixed route high frequency transit facilities, but questions remain surrounding who will use these novel services and for what purposes. In November 2019, the Utah Transit Authority launched an on-demand microtransit service in south Salt Lake County in partnership with a private mobility operator. This paper reports the results of an expressed preferences survey of 130 transit riders in the microtransit service area that was collected before and immediately after the service launched. There is not a clear relationship between current transit access mode and expressed willingness to use microtransit, although some responses from new riders indicate the novel service competes most directly with commercial transportation network company operations. The survey responses also reveal younger passengers express a more than expected willingness to use microtransit, middle-aged passengers a less than expected willingness, and older passengers neutral or no expressed opinion. The results suggest additional relationships between household size and transit use frequency, but further research is necessary. The effect of other user characteristics, including income and automobile availability, is less statistically clear and requires further research.
1. Introduction
Transit ridership in the United States has been in decline over the last several years, with underlying causes ranging from service cuts to the advent of new mobility options [1,2]. These new mobility options—including bikeshare, e-scooters, and ridehailing through Transportation Network Companies (TNCs)—might also play an important role in supporting transit operations if the relative strengths of transit and modern mobility systems can be successfully partnered [3,4,5]. This may lead to reduced dependence on automobiles and associated environmental benefits [6].
One particular area where a partnership between high-capacity, fixed-route transit, xs and TNC operations has been desired is in supporting first mile/last mile operations in low-density suburban regions [3,7,8]. TNC operators are incentivized to operate in dense areas where many potential passengers are located [9], which means that they compete with transit where transit can be most successful. However, regulations or partnerships that changed this incentive pattern could be highly beneficial to many transit riders [10,11]. For example, a transit agency might partner with a TNC to offer shared rides at a subsidized fare in low-density areas where fixed route transit services are ineffective or expensive. As these partnerships to offer microtransit services materialize through demonstration projects or permanent offerings, there is an important opportunity to observe and evaluate who is using the service and for what reasons. It is also valuable to understand how users perceive the effectiveness and convenience of these systems.
This paper presents an analysis of a preferences survey that was conducted immediately before and several weeks after the November 2019 launch of a microtransit service in south Salt Lake County, Utah by the Utah Transit Authority (UTA). The respondents to the survey indicated their awareness of and willingness to use the microtransit service. This paper investigates the relationship between this expressed willigness and the demographic characteristics of these individuals—particularly age, transit use frequency, and household size.
The remainder of this section contains a brief review of previous and ongoing studies that are relevant to the question of demand for and use of microtransit services. We then describe the survey methodology for this study, including both the context of the UTA microtransit service as well as the survey instrument and collection strategy. The survey results in several dimensions are followed by a discussion of the limitations of the findings and the associated opportunities for future research.
Findings from Other Systems
In the last few years, a number of on-demand microtransit services have begun operations in many cities around the world. Given the dynamic nature of this space, the literature is not mature and numerous projects are under evaluation at the moment. However, some findings from early systems are available and they are worthy of discussion. These articles were identified during July 2020 through a search of academic databases—particularly TRID (https://trid.trb.org), Scopus (https://www.scopus.com), and Google Scholar (https://scholar.google.com) —using keywords, including “microtransit” and “on-demand transit.” Citations within the returned articles were also investigated.
A microtransit service in Helsinki, Finland, known as “Kutsuplus” operated from 2012 to 2015, and it has been the subject of a number of studies. Weckström et al. [12] and Haglund et al. [13] each conduct a comprehensive analysis of the system using rider questionnaires supplemented with GPS data points. The studies found that the system was used by a wide variety of individuals for a wide variety of trip purposes, and the typical trip length suggested that it was being used less like a taxi service and more to supplement last-mile transit access. In many cases, it appeared as though Kutsuplus replaced walking and bicycle trips. The Weckström et al. [12] research also asked respondents why they continued or discontinued using the service, revealing strong differences in the response among different income groups. High-income individuals were more likely to cite long response times, while lower income groups were more likely to cite the fare or difficulties understanding the service, or even not being aware of its existence.
Alonso-González et al. [7] examined a microtransit system in the Arnhem–Nijmegen region in the Netherlands. They develop a methodology to calculate the accessibility contributed by the microtransit system above and beyond that provided by the fixed route transit system, and their findings suggest the microtransit service substantively enhances the mobility of people in the region. In this study, the authors use GPS trip data from the service and do not have access to the actual riders to understand their preferences or characteristics.
In 2016 Austin, Texas, introduced a TNC operated as a non-profit and called “RideAustin”. The unique corporate structure of this TNC encourages it to share data from the system with researchers, leading to a number of studies examining the trip patterns of its users. Komanduri et al. [14] show that a high proportion of trips (60%) taken on RideAustin could have been completed with a single-seat transit ride. Wenzel et al. [15] additionally used the same dataset to estimate the level of deadheading and concomitant energy expenditure on the system. Although these findings are important in terms of understanding the risks of microtransit services, it should be stressed that the RideAustin was not explicitly designed to support transit operations. Additionally, although the RideAustin dataset does identify unique individual riders through a persistent mobile device ID, it does not disclose any demographic information on the riders and, therefore, cannot support an analysis of their characteristics or preferences.
König and Grippenkoven [16] present a survey focused on determining preferences and attitudes towards demand-responsive transit use in two rural regions in Germany. A structural equations model of expressed preferences suggests that users’ attitudes are most powerfully driven by the expected performance of the system in terms of wait and travel time, and less materially by attitudes towards other public transit systems or social perspectives. This is valuable insight, but attitudes, such as these, are difficult to forecast for a population and, therefore, difficult to incorporate into service planning exercises. The authors collected demographic characteristics of the survey respondents, but did not consider these characteristics in the statistical models.
The literature to this point has been greatly aided by the use of so-called Big Data: GPS records, rider transaction data, and the like. These data are well-suited to important research questions, such as where and when the services pick up and drop off riders, the wait times experienced by the riders, and, in some cases, even the ability to construct multiple trip tours. However, the literature is somewhat limited in its exploration of the actual users of these systems: who they are, why they are traveling, and why they chose to use this service. This information is critical when planning and forecasting the potential success or failure of these systems, in contrast to reporting observed service characteristics for a service already in operation. In this paper, we present the results of a rider survey that was designed to answer these questions in the periods immediately before and after the launch of a microtransit service.
2. Study Methodology
2.1. System Description
In November 2019, the Utah Transit Authority (UTA) launched an on-demand microtransit service in the southern part of Salt Lake County. This region—as illustrated in Figure 1—has primarily low-density suburban development, but also hosts stations for UTA’s extensive rail transit network: the FrontRunner commuter rail operates between Provo and Ogden via downtown Salt Lake City on 30 min peak headways; and, the Blue and Red TRAX light rail lines connect to downtown Salt Lake City, the University of Utah, and Salt Lake International Airport (via transfer) on 15 min peak headways. There are existing fixed route and route deviation services in the region, as well as park and ride facilities at most rail stations. UTA launched the microtransit service in an effort to improve the quality of service for passengers in the region, expand the effective accessibility of the rail transit stations, and reduce transit operating costs by potentially eliminating or reallocating fixed-route bus lines.
In establishing the on-demand microtransit service UTA partnered with Via, a commercial mobility provider with new and ongoing operations in several US cities. Passengers request rides using the VIA mobile application or by calling a designated service line and await the vehicle at a pickup point near their origin. Passengers share rides based on the availability of vehicles and the compatibility of paths, as determined by algorithms embedded in the VIA service. The vehicle will drop the passenger off near their destination or at TRAX or FrontRunner stations; both the pickup and drop-off points must lie within the service area that is shown in Figure 1. The regular adult one-way fare is $2.50 (the same as a regular base transit fare) and ir includes a limited transfer to the UTA fixed route transit system. By the end of February 2020, the microtransit system was carrying about 316 passenger trips per weekday with an average wait time of 11 min per trip [17].
2.2. Survey Design
UTA’s primary goal in collecting a microtransit rider survey was to understand the effectiveness of its marketing campaign to raise awareness and information of the new service. This survey also provided an opportunity to inform additional riders and evaluate rider perceptions and characteristics both before and immediately after the service launch. As such, the survey was administered in two tranches. The first tranche was conducted on 6, 13, and 14 November of 2019 through on-platform intercept interviews at the Draper and South Jordan FrontRunner stations as well as the Draper Town Center TRAX station. The second tranche was collected on several weekdays between 10 January and 4 March 2020, and it was collected through on-platform intercept interviews at the same stations in addition to the Daybreak Parkway TRAX station and at designated microtransit pick-up points near the aforementioned rail stations. A limited number of interviews were also conducted on board the microtransit vehicles. Interviews were conducted throughout the day, but with a focus on the PM peak commute period; approximately 60% of the surveys in both of the tranches were collected between 4 and 7 PM.
The surveys were administered via electronic tablet using a questionnaire that was developed in a web-based survey software. The survey questions were developed with the help of UTA staff and an external consulting team. Table 1 shows the relevant variables and source questions for this study, in the order in which the questions were asked. The interviewers approached subjects on the platform, identified themselves as conducting an informational survey on behalf of UTA, and informed the subjects that participation in the survey was anonymous and voluntary. After asking the respondent about their awareness of the system, the interviewer would give a brief explanation of the service before asking about the respondent’s likeliness to use the system. The questionnaire for the second tranche included additional questions that were identified as being important after the first tranche was collected; for example, the questions about income and household size were added between the tranches. Further, questions in the second tranche for respondents on train platforms and either at or on board the microtransit service had slightly different wording to reflect the separate contexts. There was also a set of questions requesting general feedback on the UTA service that is not included in this study.
We employ the Fisher “exact” test of independence in contingency tables to determine the significance of the relationship between the demographic characteristics presented in Table 1 and expressed willingness to use the on-demand microtransit service [18]. In this test, the null hypothesis is that the two distributions are independent, with the alternative being that there is some dependence between the characteristic and response. A p-value that is less than a given critical threshold indicates that the null hypothesis has a low probability and may be rejected. A conventional value of the critical value is , though given the small sample sizes in this survey other critical values may be suggestive of the need for future evaluation. An attempt to use multiply-imputed datasets following the methodology of van Buuren and Groothuis-Oudshoorn [19] and Licht [20] was abandoned due to the missingness in the data, and the likelihood that the data were not missing at random [21].
3. Results
The surveyors conducted 55 interviews in the first tranche and 75 in the second tranche; the second tranche consisted of 58 interviews on rail transit platforms and 17 interviews on the mictrotransit vehicles or at the microtransit pick-up point adjacent to the rail stations. Table 2 provides a summary of the survey respondents in each tranche; as outlined in the Methodology section, the decision to include income level in the survey was made between the tranches and therefore the “Before” tranche contains no income information. The number of respondents who declined to answer the other demographic questions is also high.
A primary motivation for the survey was to understand an awareness of the microtransit service among UTA transit riders. In the “Before” tranche, only six of the 55 respondents (11%) stated they had previously heard of the system. Of the 58 interviews in the “After” tranche not conducted on the microtransit service, 34 (59%) had previously heard of the service. This increase in the general awareness of the system indicates both that the UTA marketing efforts were effective, and that the responses to the subsequent question of likeliness to use the service are based in some level of understanding.
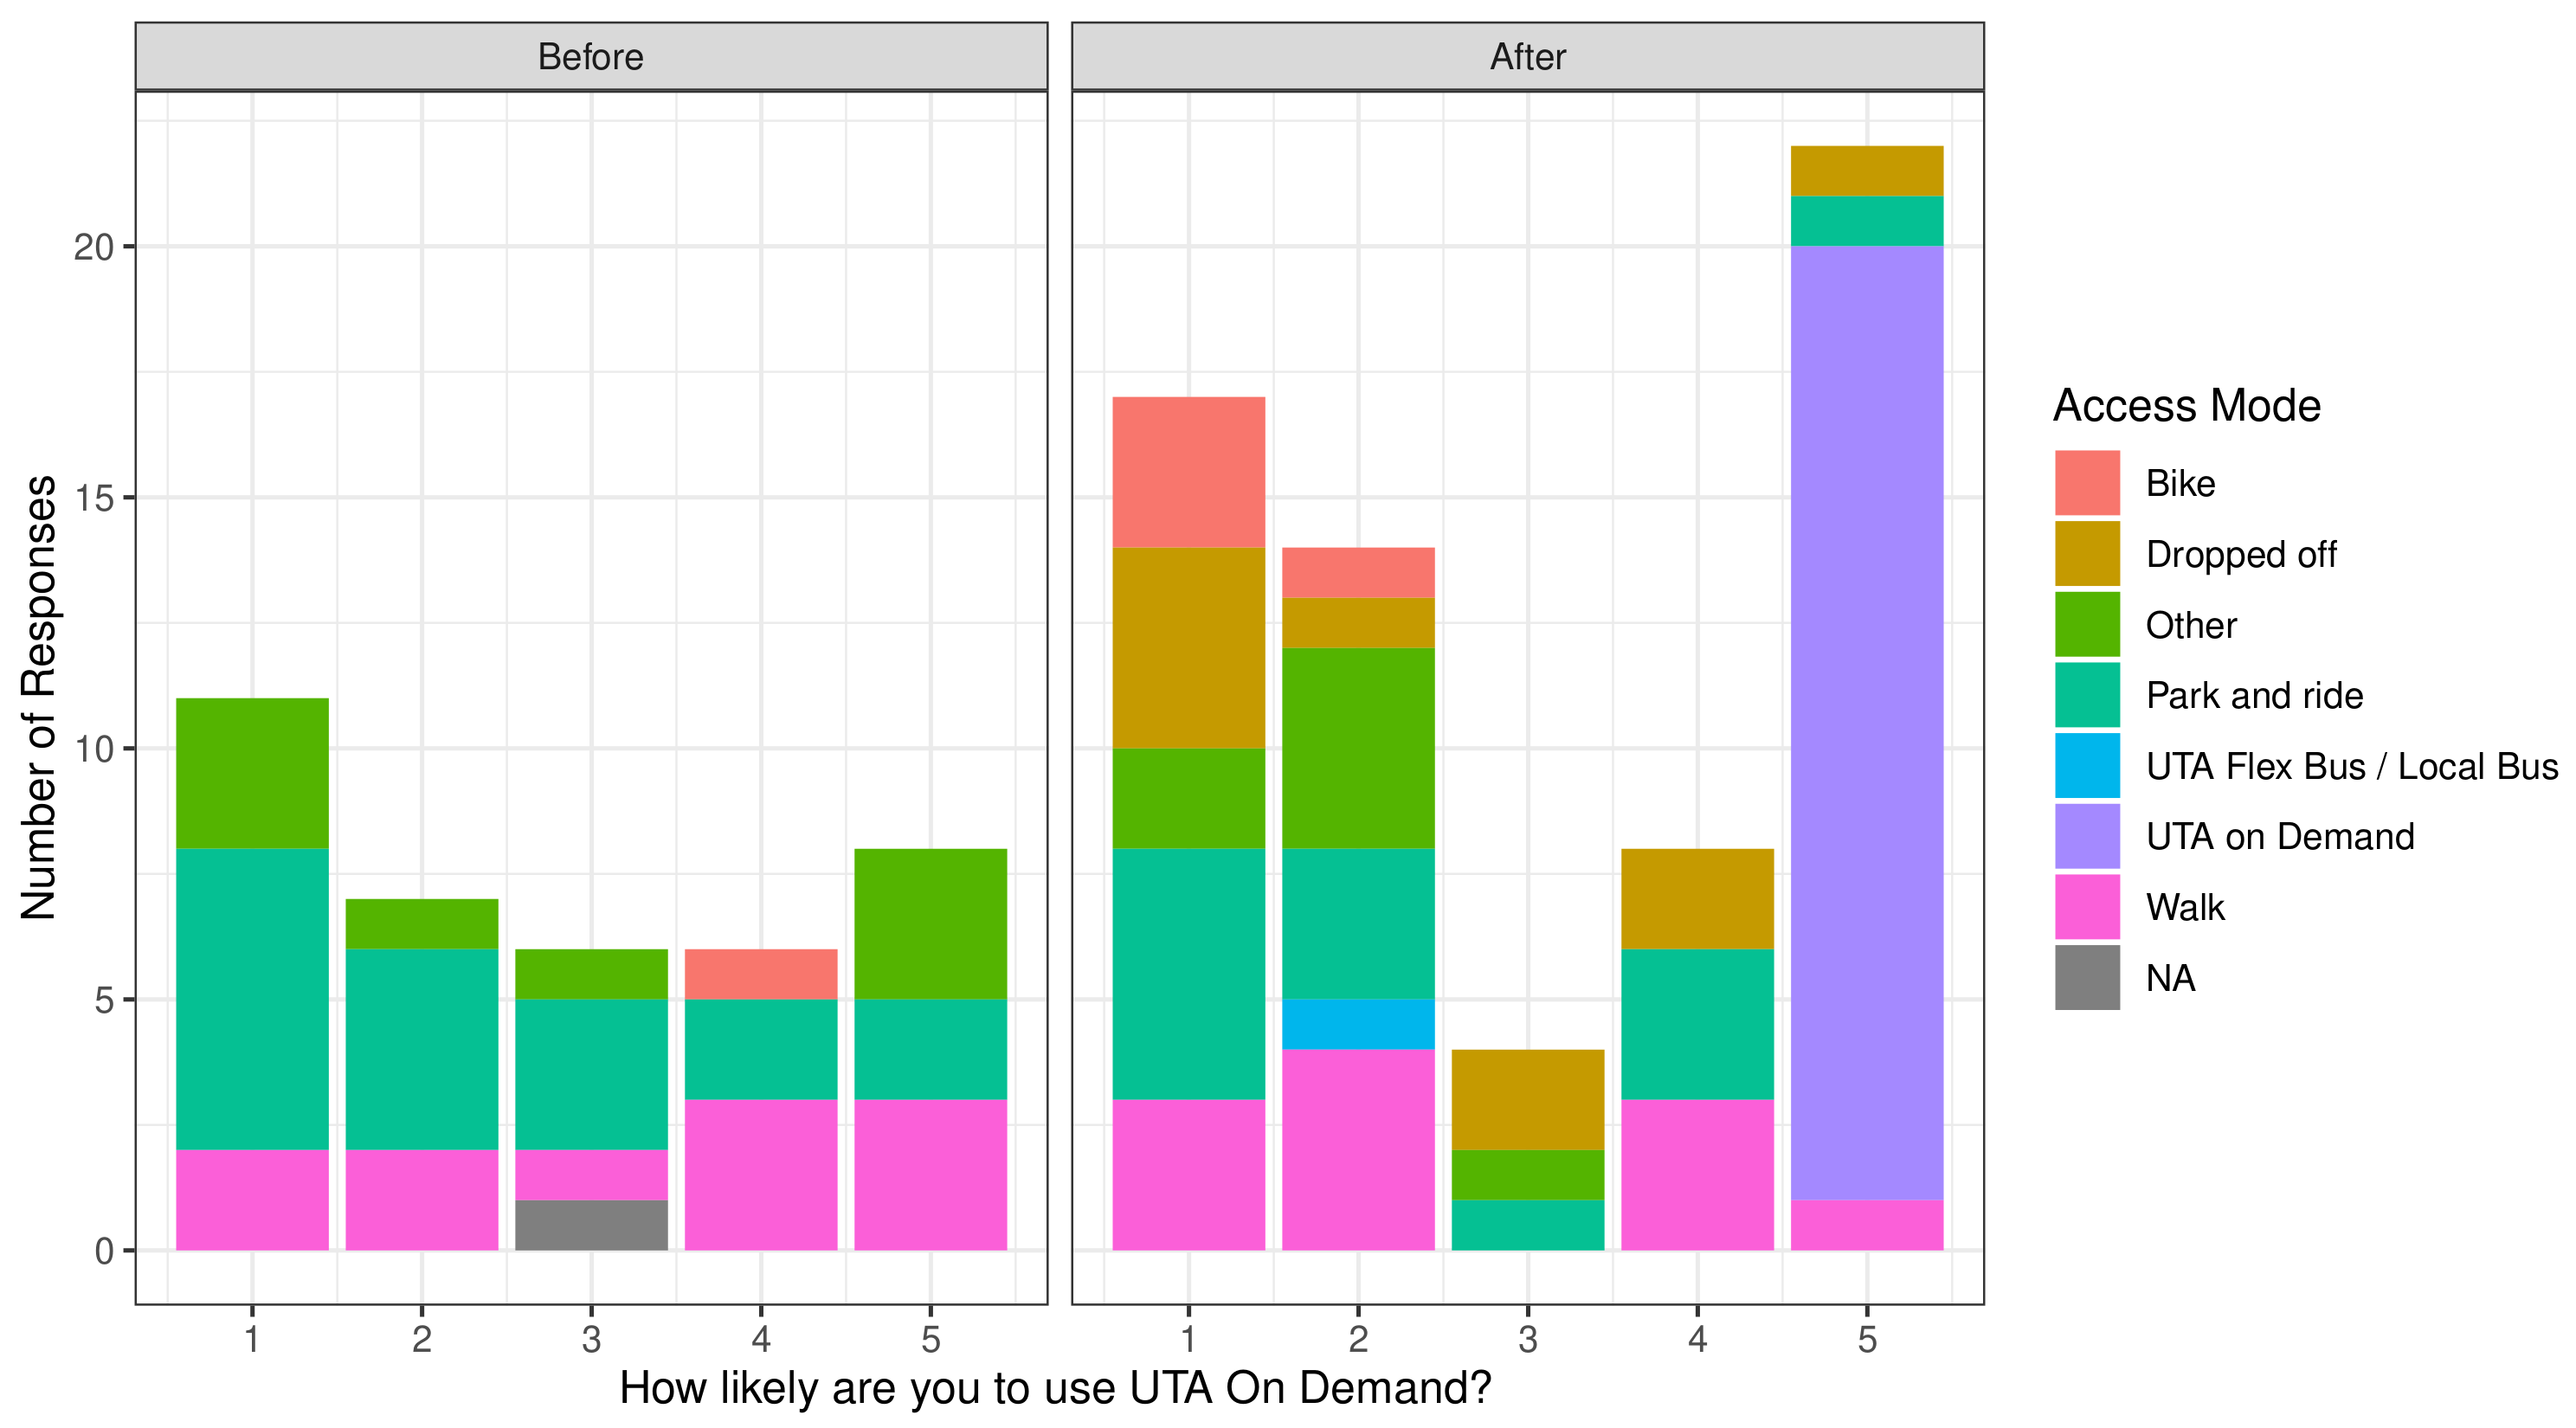
Figure 2 shows the reported likelihood of survey respondents to download the necessary application and use the microtransit service, separated by access mode. the respondents who were already using the service selected “5: Extremely Likely.” The first result of this analysis is that there appears to be a polarization in opinions after the service commenced operations. Although there are some strong feelings against and for the service in the “Before” tranche, the neutral opinions have comparatively disappeared in the “After” tranche. This likely reflects the increasing awareness of the service discussed above and a hardening of ingrained or newly learned habits. It is important also to that is stress that the question will not necessarily elicit an opinion as to whether the service should exist, merely whether the particular respondent is willing to use it.
The sample is too small to conduct meaningful statistical inference on the role that access mode plays in these opinions, but some discussion of these observations is still worthwhile. The apparent reluctance of bicyclists to use the service is likely statistical noise, although it should also be noted that the “After” tranche was collected in January and February, when Utah is typically cold with snow on the ground. Perhaps individuals who are still cycling at those times will persist in doing so. Additionally, the microtransit vehicles are not equipped with bicycle racks. It is also interesting to note that there appears to be little overall correlation between access mode and expressed willingness to use the service, unless the UTA On Demand service attracts people who would not have used the service otherwise. Of these individuals who responded to a question about their hypothetical alternative mode, four reported that they would have used a Transportation Network Company (TNC; e.g., Uber, Lyft, etc.), two would have used regular UTA services, two would have driven to the transit station, one would have walked, and one would not have used transit at all. Additionally, the text responses to the access mode question in the “before” tranche revealed a number of individuals who used a TNC to access the system. This supplies anecdotal evidence that microtransit is competing more against commercial TNC offerings than against conventional transit services.
The next consideration is whether the expressed or observed likeliness to use the microtransit service is related to the demographic characteristics of the respondents. Noting the low response rate to many of the demographic questions (see Table 2), it is not possible to construct a model that would predict the likeliness score as a function of these characteristics in combination. However, it is still valuable to consider how the observed distribution of these characteristics differs between individuals who are or are not likely to use the service. Table 3 shows these distributions, along with the result of a two-sided Fisher exact test of independence between the indicated characteristic distribution and the three-category likeliness response.
Smartphone use appears to not be a contributing factor in the likeliness of using microtransit, as almost all of the respondents use a smartphone, regardless of their reported likeliness. We also fail to reject the null hypothesis of independence between the likeliness to use microtransit and both auto availability and household income. The joint distribution of reported likeliness and household size suggests that there could be some dependence, with members of smaller households more frequently expressing reluctance to use microtransit. This finding, if it could be verified, would be somewhat counter to the a priori expectations of UTA. A Fisher test of independence between the household size and expressed likeliness still fails to conclusively reject the null hypothesis, but, given the small sample size and counter-intuitive results, future investigation is warranted. This is particularly true given that automobile availability and household size go hand-in-hand: a household with more individuals, particularly driving-age individuals, will be more constrained in their driving behavior, even with multiple household automobiles. Considering these two variables together will be important for future research, but it cannot be attempted here. There is also a suggestive relationship between transit use frequency and the responded willingness, with more frequent users having somewhat more willingness to use microtransit.
However, a clear statistical result is shown between the reported willingness to use microtransit and the age of the respondent. This significant result persists when we recombine the age categories as well as discard neutral responses. Table 4 shows the differences between the observed values in the joint distribution of these two variables and the expected values based on the marginal distributions were the two variables to be completely independent. The largest differences occur in three noticeable places. First, individuals in the 18–24 years old category are more likely to express willingness to use microtransit. Second, individuals between 45 and 64 are more likely to express a neutral opinion than a positive or strictly unlikely one. Finally, individuals between 25 and 44 are—perhaps surprisingly—substantially more likely to express a negative opinion than a neutral one; these individuals are also modestly more likely than expected to express positive willingness to use transit.
4. Discussion
We readily acknowledge several limitations of this study, particularly in the survey design and methodology. The interviews were conducted as a convenience sample, rather than with a rigorous sampling strategy, with the statistical caveats resulting from that design decision. The sample is also too small to have substantial statistical power, particularly in statistics calculated on multiple grouping dimensions. Finally, the survey collected self-reported responses with no verification or validation of any kind.
Most of the survey responses were collected on fixed rail transit station platforms. Passengers of UTA rail services were assumed to be the primary audience for the microtransit service, and these riders were presumably more likely to be available to complete a survey while waiting for a train. Additionally, UTA is interested in supporting its fixed rail transit investments in the service area. However, there is no requirement that microtransit passengers use other UTA services; data supplied by the microtransit provider, but not included in this study, suggest that only 58% percent of microtransit trips began or ended within 500 feet of a UTA rail transit station. This population might have preferences or patterns that either match or contradict the initial findings of this research.
A final limitation of these findings is the onset of the COVID-19 pandemic. Government-imposed shutdowns and voluntary work stoppages that are related to the pandemic did not begin in Utah until the week of 15 March, after data collection for this project had completed. As such, the survey responses are likely unaffected by changes in behavior that is related to the pandemic. However, the pandemic has drastically affected the subsequent operations of both UTA and Via, and it is likely to change many of the stated behaviors and attitudes reported in this study. Many findings of this study will need to be reconsidered should “normal” operations resume.
In discussing the responses to the question of what mode microtransit passengers would have used were the service not available, we suggested that there is anecdotal evidence that commercial TNC rides are the primary competition. However, there are still questions of how use of this microtransit service might affect conventional transit services. Table 5 shows the average weekday ridership during November, December, and January for the period that the microtransit service was operating as well as the same three months in the two prior years [22]. The total system ridership was remarkably stable during these three periods. The microtransit service area—in this case defined by ridership on routes F514, 218, 526, F504, F518, F534, F546, and F547—was declining before the microtransit service began, though the decline accelerated during the first three months of the service’s operation. By comparison, the microtransit service carried approximately 316 passengers per day during its first three months, more than compensating for the recently observed decline in transit ridership identified as a major contributing factor.
In spite of these limitations, the findings of this research suggest the potential paths for transit agencies when considering the deployment of a transportation mode of this kind. First, the negative result with respect to income is somewhat promising: an inability to reach out to low-income individuals was a factor in the failure of Kutsusplus [12]. The significant findings—a relationship with age in the original data and suggestive relationships with also with household size and transit frequency—also hold meaning for transit providers. Of particular note is the absence of a middle ground or neutral opinion on the service for the largest age group in the survey, those individuals between 25 and 44 years old. In the next older group (45 to 64 years old), a neutral opinion is considerably overrepresented. Does this mean that members of this older group could be a target of successful marketing efforts? How much of these attitudes are actually tied up in covarying household conditions, such as vehicle availability and household size? More research is necessary.
5. Conclusions
Microtransit services are regularly put forward as a means to support last-mile/first-mile trips on fixed route transit systems, and several such systems have been deployed in the recent past. This paper presented initial findings from a quick response survey aimed at learning who was most willing to use a new service within weeks of the system launch. These initial findings suggest first that younger adults are most willing to consider using microtransit services, especially in larger households. Additionally, these services compete most directly with commercial TNC ridehail offerings in addition to fixed-route transit services.
Although preliminary, it is worth considering how these findings might transfer to projects in other cities. The spatial and infrastructure context of the region has played an important role in the UTA On-Demand’s overall success. A low-density, but rapidly developing, suburban region bracketed by multiple high-frequency and high-capacity rail lines provides an ideal environment to test the potential of microtransit as a first-/last-mile access technology. The results of this study specifically suggest that younger adults and those with larger households express a higher willingness to use microtransit services. Salt Lake County, and Utah more generally, has a large population that matches this description, with a high share of young adults and a high birth rate relative to the United States average [23]. Planners considering implementing microtransit services to support station access might consider the demographic characteristics of the population in their target areas to maximize the project’s success.
Transit passenger intercept surveys are an important method to determine who is and who is not using a microtransit service, paired with demographic characteristics and trip purpose information. To understand the rider characteristics and trip purposes specifically of microtransit users, by contrast, better survey methods are needed. In particular, a survey pushed through the smartphone application that is used by the passengers would help in reaching a considerably larger sample. It would also be theoretically possible in that case for the researchers to pair the survey responses with actual observed trip patterns for distinct users including origin, destination, and route GPS points, regularity of use and variance in use patterns, and many other data variables. Obtaining these data and conducting responsible research with them should be a priority for the service operators and their agency partners.
Author Contributions
Data curation, C.H., A.M. and E.S.; Investigation, C.H., A.M. and E.S.; Methodology, C.H., A.M. and E.S.; Project administration, G.S.M.; Supervision, G.S.M.; Writing—original draft, G.S.M.; Writing—review & editing, G.S.M., C.H. and E.S. All authors have read and agreed to the published version of the manuscript.
Funding
This research received no external funding.
Institutional Review Board Statement
Ethical review and approval were waived for this study, as the survey was originally developed as instructional activity completed within an academic year.
Informed Consent Statement
Informed consent was obtained from all subjects involved in the study.
Data Availability Statement
Data collected in this survey and analysis code are available at https://github.com/byu-transpolab/via_riders.
Acknowledgments
This project was sponsored by UTA through the BYU Civil Engineering Capstone Program. The authors would like to thank Jaron Robertson and Shaina Quinn of UTA and Sahar Shirazi and Kenny Ferrel of WSP for oversight and input throughout the project.
Conflicts of Interest
The authors declare no conflict of interest.
Abbreviations
The following abbreviations are used in this manuscript:
| TNC | Transportation Network Company, e.g., Uber, Lyft |
| UTA | Utah Transit Authority |
References
- Graehler, M.; Mucci, R.A.; Erhardt, G.D. Understanding the Recent Transit Ridership Decline in Major US Cities: Service Cuts or Emerging Modes? In Proceedings of the Transportation Research Board 98th Annual Meeting, Washington, DC, USA, 13–17 January 2019. [Google Scholar]
- Mallet, W.J. Trends in Public Transportation RIDERSHIP: Implications for Federal Policy; Technical Report; Congressional Research Service: Washington, DC, USA, 2018.
- Shaheen, S.; Chan, N. Mobility and the sharing economy: Potential to facilitate the first-and last-mile public transit connections. Built Environ. 2016, 42, 573–588. [Google Scholar] [CrossRef]
- Oostendorp, R.; Gebhardt, L. Combining means of transport as a users’ strategy to optimize traveling in an urban context: Empirical results on intermodal travel behavior from a survey in Berlin. J. Transp. Geogr. 2018, 71, 72–83. [Google Scholar] [CrossRef]
- Shiv, A. Analysis of Last Mile Transport Pilot: Implementation of the Model and Its Adaptation among Local Citizens. Master’s Thesis, Aalto University, Espoo, Finland, 2018. [Google Scholar]
- Hoehne, C.G.; Chester, M.V. Greenhouse gas and air quality effects of auto first-last mile use with transit. Transp. Res. Part Transp. Environ. 2017, 53, 306–320. [Google Scholar] [CrossRef]
- Alonso-González, M.J.; Liu, T.; Cats, O.; Oort, N.V.; Hoogendoorn, S. The Potential of Demand-Responsive Transport as a Complement to Public Transport: An Assessment Framework and an Empirical Evaluation. Transp. Res. Rec. 2018, 2672, 879–889. [Google Scholar] [CrossRef]
- Kang, S.; Hamidi, S. On-Demand Microtransit for Better Transit Station and Job Accessibility; Technical Report; Center for Transportation Equity, Decisions and Dollars (CTEDD): Dallas, TX, USA, 2020. [Google Scholar]
- Wong, Y.Z.; Hensher, D.A.; Mulley, C. Mobility as a service (MaaS): Charting a future context. Transp. Res. Part Policy Pract. 2020, 131, 5–19. [Google Scholar] [CrossRef]
- Ronald, N.; Thompson, R.; Winter, S. Simulating ad-hoc demand-responsive transportation: A comparison of three approaches. Transp. Plan. Technol. 2017, 40, 340–358. [Google Scholar] [CrossRef]
- Deakin, E.; Frick, K.T.; Shively, K.M. Markets for dynamic ridesharing? Transp. Res. Rec. 2010, 131–137. [Google Scholar] [CrossRef]
- Weckström, C.; Mladenović, M.N.; Ullah, W.; Nelson, J.D.; Givoni, M.; Bussman, S. User perspectives on emerging mobility services: Ex post analysis of Kutsuplus pilot. Res. Transp. Bus. Manag. 2018, 27, 84–97. [Google Scholar] [CrossRef] [Green Version]
- Haglund, N.; Mladenović, M.N.; Kujala, R.; Weckström, C.; Saramäki, J. Where did Kutsuplus drive us? Ex post evaluation of on-demand micro-transit pilot in the Helsinki capital region. Res. Transp. Bus. Manag. 2019, 32, 100390. [Google Scholar] [CrossRef]
- Komanduri, A.; Wafa, Z.; Proussaloglou, K.; Jacobs, S. Assessing the Impact of App-Based Ride Share Systems in an Urban Context: Findings from Austin. Transp. Res. Rec. 2018, 2672, 34–46. [Google Scholar] [CrossRef]
- Wenzel, T.; Rames, C.; Kontou, E.; Henao, A. Travel and energy implications of ridesourcing service in Austin, Texas. Transp. Res. Part Transp. Environ. 2019, 70, 18–34. [Google Scholar] [CrossRef]
- König, A.; Grippenkoven, J. The actual demand behind demand-responsive transport: Assessing behavioral intention to use DRT systems in two rural areas in Germany. Case Stud. Transp. Policy 2020, 8, 954–962. [Google Scholar] [CrossRef]
- Utah Transit Authority. Quarterly Microtransit Pilot Project Evaluation; Technical Report; Utah Transit Authority: Salt Lake City, UT, USA, 2020. [Google Scholar]
- Fisher, R.A. On the Interpretation of χ2 from Contingency Tables, and the Calculation of P. J. R. Stat. Soc. 1922, 85, 87–94. [Google Scholar] [CrossRef]
- Van Buuren, S.; Groothuis-Oudshoorn, K. mice: Multivariate Imputation by Chained Equations in R. J. Stat. Softw. 2011, 45, 1–67. [Google Scholar] [CrossRef] [Green Version]
- Licht, C. New Methods for Generating Significance Levels from Multiply-Imputed Data. Ph.D. Thesis, University of Bamberg, Bamberg, Germany, 2010. [Google Scholar]
- Jakobsen, J.C.; Gluud, C.; Wetterslev, J.; Winkel, P. When and how should multiple imputation be used for handling missing data in randomised clinical trials—A practical guide with flowcharts. BMC Med. Res. Methodol. 2017, 17, 162. [Google Scholar] [CrossRef] [PubMed] [Green Version]
- UTA Route-Level Boardings, Monthly Counts. Available online: https://data-rideuta.opendata.arcgis.com/datasets/rideuta::uta-route-level-boardings-monthly-counts/ (accessed on 25 July 2020).
- Utah Department of Health. Complete Health Indicator Report of Utah Population Characteristics: Age Distribution of the Population; Utah Department of Health: Salt Lake City, UT, USA, 2020.
Figure 1.
Utah Transit Authority (UTA) on-demand microtransit service area. Image courtesy UTA.

Figure 2.
Reported likelihood of using microtransit by transit access mode.


Table 1.
Survey Questionnaire Summary.
| Variable | Question Text | Response Type |
|---|---|---|
| Frequency | How often do you ride UTA? | Multiple choice with days per week |
| Purpose | Where are you headed today? | Multiple choice with purposes plus text “other” |
| Access Mode | How did you travel to your UTA stop/station today? | Multiple choice with modes plus text “other” |
| Awareness | Had you heard about UTA On Demand before today? | Yes/No |
| Likeliness | How likely are you to download the VIA app and use UTA On Demand? | Likert scale with five “likely” levels |
| Why Likely | Why did you choose that ranking? | Text response |
| Use Purpose | What types of trips do you think you could use it for? | Multiple choice with purposes plus text “other” |
| Auto Availability | How many vehicles (cars, trucks or motorcycles) are available in your household? | Multiple choice with 0 through 4+ |
| Household Size | Including you, how many people live in your household? | Multiple choice with 0 through 4+ |
| Race | What is your race/ethnicity? | Mutiple choice allowing multiple selection |
| Income | Which of the following BEST describes your TOTAL ANNUAL HOUSEHOLD INCOME in 2019 before taxes? | Multiple choice in ranges |
| Smartphone | Do you have a smartphone? | Yes/No |
| Age | What is your age? | Multiple choice in ranges |
Table 2.
Demographic Characteristics of Survey Respondents.
| Before (N = 55) | After (N = 75) | ||||
|---|---|---|---|---|---|
| N | % | N | % | ||
| Smartphone | No | 3 | 2.3 | 2 | 1.5 |
| Yes | 42 | 32.3 | 48 | 36.9 | |
| (Missing) | 10 | 7.7 | 25 | 19.2 | |
| Household size | 1 | 0 | 0.0 | 4 | 3.1 |
| 2 | 0 | 0.0 | 10 | 7.7 | |
| 3 | 0 | 0.0 | 7 | 5.4 | |
| 4+ | 0 | 0.0 | 29 | 22.3 | |
| (Missing) | 55 | 42.3 | 25 | 19.2 | |
| Age | Under 18 | 0 | 0.0 | 3 | 2.3 |
| 18–24 | 12 | 9.2 | 8 | 6.2 | |
| 25–44 | 24 | 18.5 | 28 | 21.5 | |
| 45–64 | 9 | 6.9 | 10 | 7.7 | |
| Over 65 | 0 | 0.0 | 1 | 0.8 | |
| (Missing) | 10 | 7.7 | 25 | 19.2 | |
| Auto availability | 0 | 0 | 0.0 | 4 | 3.1 |
| 1 | 18 | 13.8 | 19 | 14.6 | |
| 2 | 13 | 10.0 | 18 | 13.8 | |
| 3 | 8 | 6.2 | 8 | 6.2 | |
| 4+ | 3 | 2.3 | 5 | 3.8 | |
| (Missing) | 13 | 10.0 | 21 | 16.2 | |
| Income | Less than $44,999 | 0 | 0.0 | 8 | 6.2 |
| $45,000 to $100,000 | 0 | 0.0 | 17 | 13.1 | |
| Over $100,000 | 0 | 0.0 | 17 | 13.1 | |
| (Missing) | 55 | 42.3 | 33 | 25.4 | |
| Weekly transit use | One day or less frequently | 8 | 6.2 | 13 | 10.0 |
| Two to four days | 22 | 16.9 | 37 | 28.5 | |
| Five days or more | 25 | 19.2 | 25 | 19.2 | |
Table 3.
Distribution of Rider Characteristics by Reported Likeliness.
| Demographic | Not Likely | Neutral | Likely |
|---|---|---|---|
| Smartphone; Fisher p-value: 0.5633 | |||
| No | 2 | 1 | 1 |
| Yes | 41 | 8 | 30 |
| Household size; Fisher p-value: 0.2068 | |||
| 1 | 2 | 0 | 2 |
| 2 | 8 | 0 | 1 |
| 3 | 4 | 1 | 0 |
| 4+ | 14 | 3 | 11 |
| Auto availablity; Fisher p-value: 0.6593 | |||
| 0 | 1 | 0 | 3 |
| 1 | 22 | 3 | 10 |
| 2 | 12 | 3 | 9 |
| 3 | 7 | 1 | 5 |
| 4+ | 3 | 2 | 3 |
| Income; Fisher p-value: 0.6873 | |||
| Less than $44,999 | 4 | 1 | 3 |
| $45,000 to $100,000 | 10 | 2 | 5 |
| Over $100,000 | 9 | 0 | 6 |
| Age; Fisher p-value: 0.0036 | |||
| Under 18 | 1 | 2 | 0 |
| 18–24 | 7 | 2 | 9 |
| 25–44 | 28 | 1 | 17 |
| 45–64 | 7 | 5 | 3 |
| Over 65 | 1 | 0 | 0 |
| Weekly transit use; Fisher p-value: 0.2937 | |||
| One day or less frequently | 11 | 3 | 4 |
| Two to four days | 18 | 4 | 22 |
| Five days or more | 20 | 3 | 18 |
Table 4.
The difference of observed and expected frequencies for age and likeliness.
| Not Likely | Neutral | Likely | |
|---|---|---|---|
| Under 18 | −0.5904 | 1.6386 | −1.0482 |
| 18−24 | −2.5422 | −0.1687 | 2.7108 |
| 25−44 | 3.6145 | −4.5422 | 0.9277 |
| 45−64 | −0.9518 | 3.1928 | −2.2410 |
| Over 65 | 0.4699 | −0.1205 | −0.3494 |
Table 5.
Average Weekday Ridership, November through January.
| Microtransit Service Area | Other UTA Services | |||
|---|---|---|---|---|
| Year | Avg. Weekday Boardings | % Change | Avg. Weekday Boardings | % Change |
| 2017–2018 | 1179.33 | 147,410.0 | ||
| 2018–2019 | 1125.00 | −4.61 | 146,743.0 | −0.45 |
| 2019–2020 | 970.33 | −13.75 | 147,009.8 | 0.18 |
Publisher’s Note: MDPI stays neutral with regard to jurisdictional claims in published maps and institutional affiliations. |
© 2021 by the authors. Licensee MDPI, Basel, Switzerland. This article is an open access article distributed under the terms and conditions of the Creative Commons Attribution (CC BY) license (https://creativecommons.org/licenses/by/4.0/).
Share and Cite
MDPI and ACS Style
Macfarlane, G.S.; Hunter, C.; Martinez, A.; Smith, E. Rider Perceptions of an On-Demand Microtransit Service in Salt Lake County, Utah. Smart Cities 2021, 4, 717-727. https://0-doi-org.brum.beds.ac.uk/10.3390/smartcities4020036
AMA Style
Macfarlane GS, Hunter C, Martinez A, Smith E. Rider Perceptions of an On-Demand Microtransit Service in Salt Lake County, Utah. Smart Cities. 2021; 4(2):717-727. https://0-doi-org.brum.beds.ac.uk/10.3390/smartcities4020036
Chicago/Turabian StyleMacfarlane, Gregory S., Christian Hunter, Austin Martinez, and Elizabeth Smith. 2021. "Rider Perceptions of an On-Demand Microtransit Service in Salt Lake County, Utah" Smart Cities 4, no. 2: 717-727. https://0-doi-org.brum.beds.ac.uk/10.3390/smartcities4020036