
The Role of Local Citizen Energy Communities in the Road to Carbon-Neutral Power Systems: Outcomes from a Case Study in Portugal


LNEG—National Laboratory of Energy and Geology, 1649-038 Lisbon, Portugal
Smart Cities 2021, 4(2), 840-863; https://0-doi-org.brum.beds.ac.uk/10.3390/smartcities4020043
Submission received: 23 March 2021
/
Revised: 17 May 2021
/
Accepted: 18 May 2021
/
Published: 22 May 2021
(This article belongs to the Special Issue Innovative Energy Systems for Smart Cities)
Abstract
:Global warming contributes to the worldwide goal of a sustainable carbon-neutral society. Currently, hydroelectric, wind and solar power plants are the most competitive renewable technologies. They are limited to the primary resource availability, but while hydroelectric power plants (HPPs) can have storage capacity but have several geographical limitations, wind and solar power plants have variable renewable energy (VRE) with stochastic profiles, requiring a substantially higher investment when equipped with battery energy storage systems. One of the most affordable solutions to compensate the stochastic behaviour of VRE is the active participation of consumers with demand response capability. Therefore, the role of citizen energy communities (CECs) can be important towards a carbon-neutral society. This work presents the economic and environmental advantages of CECs, by aggregating consumers, prosumers and VRE at the distribution level, considering microgrid trades, but also establishing bilateral agreements with large-scale VRE and HPPs, and participating in electricity markets. Results from the case-study prove the advantages of CECs and self-consumption. Currently, CECs have potential to be carbon-neutral in relation to electricity consumption and reduce consumers’ costs with its variable term until 77%. In the future, electrification may allow CECs to be fully carbon-neutral, if they increase their flexibility portfolio.
1. Introduction
Traditionally, the organization of the electricity sector has been based on vertically integrated electric power companies, which produced, transported and distributed energy without any competition. Liberalization began in the earlier nineties and had basically separated the functions of electricity generation and retail from the natural monopoly functions of transmission and distribution. This process has led to the implementation of a wholesale market, where producers provide the energy to retailers and big consumers, and a retail market, where retailers guarantee its delivery to end-use consumers [1,2,3]. Globally, the day-ahead market of electricity is the most liquid physical wholesale market, but it closes several hours before real-time operation. It was designed to dispatchable technologies, as coal and hydroelectric power plants. Intraday and real-time markets have close to real-time gate closures, but they are used only to cover the short-run deviation of previous trades, so they have few liquidities. To guarantee the security of supply, fast responsive dispatchable power plants can also support the ancillary services, responsible for maintaining the balance between demand and supply using the balancing markets, guaranteeing the frequency and voltage stability along the electrical grid [4,5].
The challenges posed by global warming have led to the definition of key objectives for the integration of renewable energy in all sectors of activity. Currently, several countries defined a global objective of a carbon-neutral society towards 2050, such as the European Union (EU) countries, Japan and South Korea [6,7,8]. These objectives led to the establishment of incentives to variable renewable energy (VRE), increasing their penetration but also the retail prices. One of the main issues is that VREs have a variable production, so they increase the uncertainty of the net load, and have significantly capital costs, but near-zero production costs, decreasing the prices of wholesale markets, resulting in a tariff deficit, i.e., the difference between the incentive and the market value of the energy supplied by the technology, paid by consumers [4,9,10,11,12]. Retailers face the same uncertainty problem when forecasting the consumption of their clients [13,14]. As the current electricity markets (EMs) have been designed for dispatchable power plants, VRE producers and retailers have several deviations that need to be settled in balancing markets, increasing the prices of these markets and the penalties to pay [5,13,14]. The increase of the VRE penetration in power systems reduce the capacity factors of dispatchable generation, i.e., reduce the operation hours of traditional power plants, that are essential to guarantee the security of supply. Furthermore, traditional thermal power plants have high start-up costs and dioxide carbon (CO2) emissions, so a reduction in their capacity factors can increase the market prices, and in some cases the CO2 emission, because it increases the number of start-up occurrences [15,16]. So, to be economic viable, governments compensate these power plants lack of remuneration from EMs by giving them subsidies or using capacity mechanisms [15]. Accordingly, the International Energy Agency indicates that governments should allow aggregation and avoid the use of negative externalities, such as incentives and subsidies that avoid the free fluctuation of prices, reducing the social welfare of citizens [17]. The extra costs originated by these negative externalities are directed to retail tariffs of end-use consumers [13]. The increase in the VRE penetration is important to achieve carbon neutrality, but it should be reliable and affordable. To guarantee the security of power systems at reasonable prices, flexibility is the key to compensate the VRE uncertainty, being sector coupling an important solution.
Sector coupling and electrification are critical issues to achieve carbon neutrality and combat energy poverty and energy external dependency, by supporting the replacement of fossil fuels with renewable energy sources (RES) in all sectors of activity [18]. The accommodation of near 100% renewable energy can achieve those goals, but flexibility may exist at all levels from large-scale storage systems to small-scale demand response (DR) and smart charging of electric vehicles (EVs) [8,19]. Against this background, a future carbon-neutral society, but also reliable, and economically efficient will always depend on the capacity of consumers to follow and accept the sectoral electrification, providing the required flexibility that guarantees the security of supply of near 100% renewable penetration in power systems. Currently, the pricing mechanisms do not incentive the active participation of consumers through DR, but in the future, scarcity pricing can achieve significant values, incentivizing consumers to increase their flexibility, shifting their consumptions to periods with higher renewable penetration and/or lower prices [20,21].
A citizen energy community (CEC) is a new legal entity that may be composed of consumers, generators and system operators of a local area [22,23]. CECs can be very important to aggregate the local distributed generation and consumption, reducing forecast errors and being active wholesale market players. Retail prices of electricity are substantially higher than wholesale prices because of all extra costs with grid access and use, commercialization and costs of general economic interest, like renewable incentives and capacity mechanisms, which incentives consumers to be part of CECs [13]. Indeed, the levelized cost of energy (LCOE) of solar photovoltaic (PV) has being fallen, which makes self-consumption more attractive, especially when compared with retail tariffs [13,24,25,26]. Distributed generation, like solar PV, is expected to increase rapidly in the coming years, such as district heating, cooling and EVs penetration [8,27,28,29]. CECs will play an important role in triggering all these electrification solutions, providing the required flexibility that can guarantee local carbon neutrality and energy sustainability at low prices, when comparing to nowadays [18,21]. The distribution system operator has a major role to play in facilitating the active participation of CECs in the society decarbonisation, accommodating new distributed generation and transitioning to a more flexible system where smart grid services, self-consumption, smart meters, the expansion of the EVs charging network, microgrid trades and peer-to-peer (P2P) markets will be required. Considering the critical role of CECs to achieve carbon-neutral power systems the goal of this article is threefold:
- Discusses the required market designs of future electricity markets with near 100% renewable generation;
- Presents the current and future key role of CECs towards carbon neutrality;
- Presents a case-study that uses real-data to illustrate the current role of CECs, considering self-consumption, microgrid trades and local agreements.
The remainder of the paper is structured as follows: Section 2 presents the future of European electricity markets. Section 3 addresses the key role of local CECs. Section 4 presents measures of economic, environmental and sustainability impact of CECs in the power system. Section 5 presents a case-study to test the role of CECs in power systems. Finally, Section 6 states the final remarks and summaries avenues for future work.
2. The Future of European Electricity Markets
In 2009, the EU presented the “Third Energy Package” that has the goal of increasing competition and harmonizing market prices across Europe, by contributing to the liberalization of retail markets and the harmonization of the wholesale markets rules [4,30].
Considering wholesale markets, DAMs are the most used and liquid physical markets of global liberalized electricity markets. The main European markets of electricity are the north (Nordpool), central (EPEX) and Iberian (MIBEL) markets. These markets close at 12:00 p.m. (CET), 12–36 h before physical delivery in central Europe. The trading occurs through an implicit auction where price and quantity are computed for every hour of the next day, using EUPHEMIA, a hybrid algorithm that is used in the European Price Coupling Region [31]. EUPHEMIA considers the system marginal pricing theory. It considers simple and complex bids from supply and demand sides and takes into account the physical constraints of the cross-zonal capacity. By computing the price and quantity for each bidding zone, the algorithm also defines the day-ahead flows between bidding zones [31,32]. Intraday markets (IDMs) may involve auctions, like DAMs, but with several sessions, operate continuously, considering the pay-as-bid scheme, or even using bilateral contracts. Transmission system operators (TSOs) look on the market results of DAMs, IDMs and bilateral contracts for scheduling the real-time operation. Deviations from schedules have to be balanced using the balancing mechanisms of the ancillary services markets, and the players that deviate, the balance responsible parties, need to pay (or receive) the imbalance prices. DAM (spot) prices serve as the basis for (financial) futures and (physical) forward contracts that are traded bilaterally over-the-counter or on power exchanges and allow selling and buying electricity up to several years before delivery [1,2,3]. Futures are standardized contracts that can be subject to physical or financial settlement, reversible, used to buy and sell a given quantity of an asset in the future considering a price fixed in the present, receiving or paying the financial difference between the future and present prices. Forwards are contracts to purchase and sell a given quantity of an asset in a specific future date, considering a price set in the present. Besides those standard contracts we also have private bilateral contracts, like power purchase agreements (PPAs), commonly used in private agreements between VREs and buyers, where buyers are responsible to acquire all quantity produced by VREs [4,23].
In 2016, the EU presented the “Clean Energy for all Europeans”, comprising new legislation that supports the efficient participation of consumers as part of citizen energy communities (CECs), incentivizing self-consumption by reducing their payment with electrical energy. It also sets ambitious targets for the use of renewable energy, as the main source of energy, in the transport, buildings, heating and cooling sectors and in the production of electricity [22,23]. These targets led to the establishment of externalities, like significant subsidies or incentives used to assist the investment in renewable technologies that are not yet mature, resulting in a tariff deficit paid by consumers [4,9,10,11,12]. VRE can be generated at all system levels, from large-scale solar PV and wind farms to rooftop solar PV. The installed capacity of VRE has increased over the years and the potential to grow is enormous. In Europe, wind power is the second technology with the highest deployed capacity, around 150 GW, and solar PV the sixth, around 100 GW [33,34]. Increasing levels of VRE will decrease wholesale market prices considering the “merit-order-effect” of growing penetrations of technologies with near-zero marginal costs, decreasing the working hours and market remuneration of traditional power plants [12,15,35]. These power plants may be compensated trough capacity mechanisms, increasing the power system costs, and the extra costs paid by consumers. Furthermore, wholesale price reduction can be an issue for a future non-discriminatory integration of VRE in EMs, and in the absence of feed-in tariffs or other incentives, insufficient changes in market designs (spot, balancing, and derivatives markets are essentially designed to conventional generation) or increases in CO2 prices, may lead to situations where VRE is not attractive for profit-seeking investors [20,21].
Electricity markets are subject to various taxes, that can be fiscal (VAT) or related to externalities like CO2 emission taxes. They are also subject to several subsidies like economic incentives to non-mature renewable technologies. They have tax breaks to protect business interests, and other costs to guarantee the security of supply, like costs with the transportation and distribution grids and with their operation, and capacity mechanisms with traditional power plants. Those costs substantially increase the retail prices paid by consumers when comparing with the wholesale price of electricity. Indeed, in Europe retail prices of energy are more than the double of the wholesale prices because of all these extra costs. Furthermore, in the EU the wholesale price of electricity only has as a weight around 37% of the retail tariff, being the retail markup around 20%, i.e., the retailers profit over the wholesale price [4,13,36]. Indeed, the package of measures presented in the “Clean Energy for all Europeans” proposal includes new legislation that incentivizes CECs by giving them discounts to these extra-costs. However, it can also reduce VREs remuneration by giving them responsibility for their imbalances [4,22,23]. However, the global LCOE of VRE has been lower than retail tariffs, so in the absence of incentives, VRE may be considered attractive for self-consumption [24,25]. With the increasing levels in VRE generation, both supply and demand are becoming more weather driven. Flexibility is the key to cover peak demands in case of unavailability of renewable generation, avoiding unserved energy, and to deal with excessive renewable generation, avoiding curtailments [37,38,39,40,41]. Accordingly, new market design elements and other non-discriminatory actions need to be considered, such as the participation of VRE and demand in balancing mechanisms [5,20]. The uncertain need for stored energy and demand response substantially increase both short-term and long-term trades, a factor which will need to be considered in future market designs. Those designs should adequately remunerate flexibility and incentivize the investment in other sources of flexibility such as hydrogen, battery energy storage systems (BESS) and DR [18,33]. Future market designs should be:
- Reliable, supporting enough generation and flexibility to avoid shortages;
- Flexible, considering several options for temporal, spatial and sectoral flexibility on both supply and demand sides;
- Economically efficient, contributing to increase competition and ensuring low prices to consumers in a transparent approach;
- Carbon-neutral, leading to attractive investments in renewable generation without externalities, like subsidies or other incentives.
Against this background, close to real-time gate-closures, shorter market time units, hybrid technologies, CECs, sector coupling, allowing aggregated bids and new market products adapted to VRE and demand-side behaviours are future changes in the current market designs that can enable reliable, flexible, economically efficient and carbon-neutral power systems [4,18,20,21,22,23,37]. Allowing aggregation between the same and different supply technologies and also with demand-side players in the market bids is one key rule that can reduce forecast errors as indicated in the literature [38,39,40,41]. One metric used to evaluate forecast errors in relation to market trades is the normalized mean square error (NRMSE):
where is the observed quantity of energy at time , is the forecasted quantity of energy, is the nominal quantity of energy and is the time period. For producers the nominal quantity of energy considers the produced energy at nominal power while for consumers it considers the peak energy consumption. Table 1 presents the typical values for the NRMSE of each player considering average values from the literature [5,14,37,38,39,40,41,42,43,44,45,46,47,48]. The average deviation of energy, , consists in the average percentage of the real-time observed quantity of energy that balance responsibility parties deviate in relation to the forecast, and can be computed as follows:
Analysing the previous table is possible to conclude that the aggregation of different market players is beneficial to each player by reducing its forecast error and consequently the penalties paid due to deviations, but also to TSOs by reducing the balancing needs, reducing the system costs and increasing the social welfare of all players. Indeed. local CECs by enabling aggregation between multiple distributed load, generation and storage, have potential to reduce forecast errors, increasing the potential output of each player from the current and future market design.
3. The Role of Local Citizen Energy Communities
The EU legislation defined a CEC as a new legal local entity that can be controlled by its members or shareholders. It can have consumers, prosumers, producers, system operators, local authorities and small enterprises as members. Its functions comprise aggregation, consumption, distribution, generation, management, supply and storage of energy, but also the provision of energy efficiency services, demand response, smart charging of EVs and other energy services. It has the main goal of providing economic, environmental and social benefits to its members instead of profitable paybacks [23].
Traditionally, power systems follow a top-down approach where large-scale power plants connected to the very high voltage grid produce energy to satisfy far away consumers at the distribution level, contributing to high investments in the grid expansion and to power losses in the energy transportation [2]. Those values are reflected in the consumers’ tariffs. The liberalization of the retail market allows consumers to select their desired electrical energy provider and tariff, while before they were only subject to regulated tariffs provided by a monopolist company. In retail markets, retail competition is performed by retailers proposing multi-part tariffs to consumers. The tariffs are typically composed of a fixed term (contracted power) and a variable term (energy used), and normally are equal to all consumers inside their consumption segment. In relation to the variable term of the tariff, consumers can also choose between simple or multi-rate prices. Typically, in retail competition, retailers sign private bilateral contracts with end-use consumers, obtaining a private portfolio to manage [13]. To satisfy the consumption needs of the consumers that compose their portfolio, they enter into wholesale competition, submitting bids to spot markets and signing bilateral contracts with producers or other supply-side players. In the EU, consumers are free to choose their electricity supplier, however, in some countries regulated tariffs are still in place and the deadline to finish them has been extended numerous times.
The EU energy policy places a strong emphasis on achieving economy-wide decarbonisation through broad electrification joint with fast growth of renewable generation, while preserving reasonable electricity prices [4,22,23]. Sector coupling and electrification have potential to be valuable sources of flexibility for the efficient integration of VRE [18]. The consumers’ engagement in the energy sector has a key role to reduce all the extra costs they pay to satisfy their demand related to grid use and expansion, energy transportation, capacity mechanisms, CO2 prices, renewable incentives and ancillary services costs. The current market mechanisms and prices do not incentive the active participation of consumers in electricity markets through demand response programs [4,12,21]. Fixed multi-rate time-of-use tariffs are proposed to consumers, inviting them to consume in cheaper hours [13]. However, this kind of tariffs are based on long-term results, they do not reflect short-term shortage or excess of energy. Currently the best mechanism for consumers reduce their costs with electricity is through self-consumption [39,40,41]. Indeed, self-consumption can reduce the grid usage, reducing congestions and power losses in the energy transportation. However, single prosumers will have to make huge efforts to follow electricity prices and do not have enough weight to be active market players. Against this background, one of the key solutions to increase the flexibility of power systems is the alliance of consumers and prosumers in local citizen energy communities, benefiting from better prices and contributing to a reduction in the forecast errors and in the balance needs [39,40,41,49,50,51]. Indeed, local CECs can be managed by a representative or by the local distribution system operator (DSO) [52]. Furthermore, DSOs can benefit from managing CECs to plan the grid operation, avoiding congestions. Currently, the legislation strongly incentivizes CECs with discounts in the extra-costs paid by consumers [4,22,23].
While members are part of the CEC, partners are players with whom they can establish agreements. One of the key issues for an efficient participation of CECs in the energy sector compromises their active participation in energy markets or the establishment of real-time pricing contracts with them. Currently, exists a strong incentive for CECs with self-consumption, just by avoiding the payment of all the extra-costs related to energy supply [13,24]. Indeed, CECs can establish agreements with renewable power plants, contributing for a reduction in the forecast errors. Also, in case of possible agreements with HPPs with storage capacity, CECs cannot only achieve carbon neutrality but also energy sustainability [53,54]. Certainly, pollute industries can benefit with these agreements, because as members of CECs, they can have access to CO2 licenses and renewable origin certificates, avoiding the payment of CO2 emissions [55]. Table 2 presents the current role of all CEC’s (potential) members or partners, considering the current market designs.
If CECs proved to be very beneficial to consumers contributing to a substantial decrease in the price of electrical energy, it is possible that it can speed up electrification and consumers’ active participation in the energy sector. In the near future, the agreements with large-scale HPPs can be replaced with an increase in the flexibility of CECs, increasing their storage options and electrification. Electric vehicles considering vehicle-to-grid (V2G) and G2V solutions, BESS and district heating with heat pumps are future solutions than by increasing the storage options of CECs can allow them to perform a better management of their resources [8,18,33]. Other future sources of flexibility are DR, P2P trades between CECs, market trades with system operators (SOs), district cooling and sector coupling. Sector coupling can be very useful in cases when is not possible to store or trade the CECs’ excess of energy, being that excess used to produce hydrogen or desalinization, for example [56]. Considering these flexibility solutions, in the future the role of CECs can change the paradigm of power systems to a bottom-up approach, when CECs can be carbon-neutral and energy sustainable, providing enough energy and flexibility to the power system, guaranteeing the security of supply. Table 3 presents future flexibility options and their potential contribution to CECs.
Currently it is possible to prove the consumers’ economic benefit by being part of a CEC and investing in self-consumption (see Section 5). If electrical energy become more competitive than other sources of energy it can attract consumers to invest in EVs and CECs to invest in BESS, district heating and cooling, contributing to the electrification of the community. Furthermore, it is possible that some members of CECs be attracted with economic incentives, engaging in DR programs. Indeed, if the CECs operation proves to be favourable to power systems it can enable new market mechanisms and products, such as P2P markets and trades with SOs [53]. Naturally, depending on the available distributed generation and flexibility capacity of CECs, during some periods CECs could have excess of energy, which can be useful to local industries that can benefit from such excess at lower prices, avoiding curtailments of free of cost VRE. Next section presents the measures able to analyse the impact of CECs in power systems.
4. Measures of Environmental, Sustainability, Performance and Economic Impact
This section introduces the considered indexes to evaluate the impact of CECs and their impact to power systems and each individual participant of the CEC.
4.1. Carbon-Neutral and Energy Sustainable Indexes
Considering the worldwide goal of achieving a carbon-neutral society, one of the main goals of the new EU legislation that incentives the creation of CECs, consists in the engagement of consumers into the achievement of this goal [4,22,23]. Carbon neutrality in energy consumption indicates that the CO2 balance between consumption and production is zero or negative. The EU emissions trading (ETS) mechanism defines the costs with CO2 emissions, being a key tool to achieve the EU climate-neutrality objective, by covering around 40% of the greenhouse gases emissions [36]. The active participation of consumers in CECs may allow carbon neutrality in electrical energy consumption, being this index, , computed as follows:
where is the renewable energy generation of the CEC and, , is the consumption of the CEC. If during the studied period, this index is equal or higher than one it means that during that period the CEC is carbon-neutral in relation to electrical energy consumption.
Other potential goal of CECs is achieving electrical energy sustainability even if through local agreements or P2P trades. Electricity sustainability can be achieved when every real-time consumption of the CEC is produced locally or through local trades. The electricity sustainability index is computed as follows:
When the electricity sustainability index is equal or higher than one it means that the CEC is sustainable in relation to electrical energy consumption. The advantage of being energy sustainable come from all avoided costs with energy transportation and commercialization.
4.2. Performance Indicators: Renewable Resource Index and Capacity Factor
Naturally, when considering distributed and local generation the achievement of the previous carbon neutrality and electricity sustainability goals is dependent on the resource availability, that in case of VRE but also hydroelectricity is very dependent on the weather behaviour [28,34,38]. The renewable resource index, , can evaluate the performance of each renewable technology considering its reference energy production, :
When the renewable resource index is lower than one it means that the technology produces less considering its historical reference, otherwise its performance is equal or higher than the reference. Other important indicator to evaluate the performance of each renewable technology is its capacity factor. It indicates its average energy production in relation to the nominal energy. Indeed, the capacity factor is one of the critical indicators that influences the different geographical LCOE of each technology [14]:
4.3. Technology LCOE and Remuneration
The LCOE is the value that allows investors to recover all their investment in new power plants. The LCOE of each technology can be computed as follows [26]:
is the life cycle of the technology, and are the fixed and variable costs, respectively, and is the discount rate.
The energy remuneration of each technology, , from the trades can be computed using the following formulation:
is the quantity of energy transacted trough bilateral contract , being the price of such quantity. and are the technology transacted quantity and price in the day-ahead market, respectively. is the up deviation cost and is the down deviation cost. is the total quantity of energy transacted trough bilateral contracts at time , and can be computed as follows:
While dispatchable technologies use strategic bidding, VREs normally make quantity bids to day-ahead markets based on their point-forecast, [37]:
Therefore, the average remuneration of each technology per every unit of produced energy is equal to:
To compute the expected remuneration of each technology, can be used a forecast model to predict the future market prices of the day-ahead market, . The forecast method consists in a multivariate time series (MTS) that uses all DAM electricity consumption, , the DAM prices of electricity, and its share of renewables associated with electricity production, :
where , and are the number of considered previous periods (lags), . , and are the regressions variables and is the error of random events.
4.4. Consumers and CECs Costs with Electricity
The costs that consumers or CECs have with electrical energy can derivate from retail or regulated tariffs. Indeed, even demand-side players that have enough weight to negotiate in markets have to pay grid access, power system usage and investments of economic interest. Currently the minimum bid size to European wholesale markets is 1 MW but have been approved new legislation to reduce it to 0.1 MW [4,22,23]. The variable term of the tariff is divided in two parts, the energy part that derivate from wholesale market prices and the other part that derivate from the system costs. The other part of the variable term of the tariff can be divided as follows [36]:
- Grid access, including the general economic interest cost (GEIC);
- Global system use;
- Transportation grid use;
- Distribution grid use:
- ∘
- High voltage;
- ∘
- Medium voltage;
- ∘
- Low voltage.
- Commercialization.
The GEIC value includes all incentives in renewable generation and capacity mechanism of governmental initiatives. By using self-consumption, consumers can avoid the payment of these costs. In case of consumers or CECs with retail or regulated tariffs their variable costs with electrical energy, , can be computed as follows:
and are the quantity and price of a self-consumption unit , if applicable. is the measured net-load quantity charged by the retailer or regulated company considering the energy price, , and the other variable price, , defined in the tariff.
In case of active large consumers or CECs they can have self-consumption but also can participate in wholesale energy markets, establishing bilateral agreements with producers and making bids to the day-ahead market, being responsible for their deviations. Their variable costs with electrical energy are computed as follows:
In this case and can be the quantity and price of a bilateral contract but also of a self-consumption unit , if applicable. The other variable price, varies with the agreement, in case of self-consumption is zero, and in case of agreements with local distributed renewable power plants is lower than with large-scale renewable power plants connected to the transportation grid. In case of a bilateral agreement, like a power purchase agreements (PPA), where the demand player is responsible for the power plants production, the quantity offered to the DAM, considers the net load forecast of that player, and during real-time it is computed its net deviations.
Therefore, the average variable cost of this player per every unit of consumed energy is equal to:
The costs of consumers can be forecasted not only considering the market prices forecast indicated in Equation (11), but also a consumption forecast, , using a MTS forecast methodology similar to the previous one but using the country gross domestic product (GDP) instead of the renewables share, and the retail price of electricity instead of the DAM price:
where E, and are the considered lags, , and are the regressions variables and is the error of random events.
5. Case-Study on Local Citizen Energy Communities
This section presents the results from different types of local CEC configurations, with the goal of achieving carbon neutrality, but also economic efficiency and energy sustainability if possible.
The case-study uses real-data of 312 consumers, 38 solar PVs, 227 wind farms and 40 hydroelectric power plants with reservoir from Portugal during the period from 2011 to 2013 (see the Data Availability Statement for more information). These consumers are connected to the medium voltage (10 kV) of the distribution grid and represent around 5% of the Portuguese demand with a peak demand of 446 MW. The RES represents all Portuguese solar PV, wind farms and HPPs with reservoir during this period with an installed capacity of 207 MW, 4730 MW and 5225 MW, respectively. During this period the LCOE of VRE were not advantageous for investments without government incentives, so the data from this period is extrapolated to the period 2020–2022, considering the current LCOEs. Figure 1 represents the microgrid of the CEC under study.
5.1. Microgrid
Considering the available resources of different geographical locations, this study is going to verify the benefits of alliances between consumers and with different mature renewable technologies from the environmental, electricity sustainability, economical and reliable point of view during a period of two years. This case-study considers the following players: consumers, consumers with self-consumption (prosumers), solar PV, wind farms and hydroelectric power plants (HPPs) with reservoir. The reference scenario only considers single renewable power plants and consumers with equal retail tariffs for each consumer segment. From Figure 1 is possible to verify that single prosumers are restricted to distributed rooftop PV and/or small-scale PV on their own land. CECs can invest in large-scale PV connected to the high voltage grid (30 kV) of the distribution grid or stablish PPAs with them. Wind and hydroelectric power plants require higher investments and are connected to the transmission grid, so CECs do not have any advantage in investing on them, being more advantageous to stablish PPAs or Forwards with them.
5.2. CEC Tariffs, Technologies and Contracts
All consumers have to pay for grid access and usage independently of being an active market player. In Portugal, legislation strongly incentivizes self-consumption, individually or in a CEC. In case of single consumers with self-consumption the legislation provides them a 50% discount in the GEIC part of the variable cost of energy, while for CECs with self-consumption the discount is 100%. In Portugal, the 2021 prices of each part of the variable term of energy are equal to [57]:
- Energy: 59.60 €/MWh (only for regulated tariffs);
- Grid access: 78.60 €/MWh:
- ∘
- Single self-consumption: −21.80 €/MWh;
- ∘
- CEC self-consumption: −43.70 €/MWh;
- Global system use: 4.83 €/MWh;
- Transport grid use: 6.30 €/MWh;
- Distribution grid use:
- ∘
- High voltage: 1.70 €/MWh;
- ∘
- Medium voltage: 6.90 €/MWh;
- ∘
- Low voltage: 15.40 €/MWh;
- Commercialization: 5.40 €/MWh;
- Total for residential consumers: 178.73 €/MWh
- Weight of wholesale energy price: 33.35%
- VAT: 12%
- Total cost for residential consumers: 200.18 €/MWh. Excluding the energy part: 133.43 €/MWh (other-part);
- Potential cost of the other-part of the variable term for energy sustainable CECs with self-consumption and microgrid agreements: 71.38 €/MWh (47% less than single residential consumers).
In line with other European countries, in Portugal the weight of the wholesale price of energy in the retail price paid by residential consumers is only 33% (the EU average is 37%) [36]. CECs with self-consumption and local agreements have a high potential to reduce the consumers’ costs with electrical energy. Indeed, a residential consumer being part of a CEC with self-consumption can reduce the other part of its net load cost in 47%, and does not pay it when using self-consumption. Besides that, to achieve carbon neutrality it is only considered agreements with local renewable producers.
Table 4 presents the market value of each technology under study without penalties, their average market remuneration in 2011 and the expected values for 2012 and 2013, extrapolated to the period 2020–2022, and therefore represented as years 0, 1 and 2, respectively.
In year 0 the capacity factors of wind, solar PV and HPPs are 26%, 25% and 25%, respectively. These capacity factors are dependent of the resource availability, that has a significant geographical variation for all technologies and a substantial yearly variation in case of hydroelectricity. The market value is the indicator that evaluates the value of the injected energy independently of the penalties paid due to deviations or the energy acquired for pumping in case of HPPs. So, it is the potential value of the technology in case of a perfect market design or in case of stablishing PPAs. Naturally, the wind market value is lower because the wind speed is higher during the night when the demand and market prices are lower. Solar PV has a diurnal profile when market prices and demand are higher, but has higher deviations, so it can obtain higher benefits from PPAs. HPPs with reservoir have strategical bidding, producing when the market prices are higher and pumping when the market prices are lower [54]. So, because they use energy to pump, their remuneration is lower when comparing with solar PV, and in this case also their market values, because when their reservoirs are almost full they offer their energy at lower prices, reducing market prices.
Using a multivariate time series (MTS) to forecast the electricity price for the period under study it is expected a price reduction in years 1 and 2 of 0.50% and 8.74%, respectively. The Iberian market only starts operating in 2008, so the MTS considers the electricity price and consumption, and the market share of RES during the period 2008–2011 to compute the expected DAM price for years 1 and 2.
Currently, in Portugal the LCOEs of HPPs with reservoir and large-scale solar PV stand bellow 50 and 30 €/MWh, respectively, while for wind power plants are higher than 50 €/MWh [24,25,26,58]. Analysing Table 4 it is possible to conclude that only solar PV can be economically viable considering only its participation in energy markets. Indeed, their investors compete in solar PV auctions for predefined capacities and locations defined by the government, paying a yearly value for grid access and being responsible for their deviations, while feed-in-tariffs are still in place for wind farms that do not have responsibility for their deviations [57,58]. The economic sustainability of HPPs is guaranteed through capacity subsidies that are paid by end-use consumers [57].
When signing bilateral contracts, the risk asymmetry between sellers and buyers is high because sellers face almost all risk [59]. In case of signing Forward contracts for a fixed quantity, these technologies request an expected return rate considering the risks they face for signing a two years contract for fixed quantities and prices. While HPPs only face price risk, wind and PV face forecast errors (see Table 1), requesting an expected return of 7%, 10% and 15%, respectively. Naturally, solar PV is the technology with higher production risks, since it has higher deviations, so it requests a higher return. PPAs are more versatile, so, in case of signing PPAs with a CEC, solar PV and wind farms can accept the deal for the day-ahead price, passing the imbalance responsibility to CECs. HPPs with reservoir are dispatchable power plants, so, they only have imbalances in case of malfunctions or other extreme events. Contrary to VRE, HPPs only have a residual advantage when establishing PPAs with CECs. When CECs have up deviations, HPPs can use that energy to pump. So, in case of a PPA they can agree with discounts over the day-ahead price when using the excess energy of the CEC to pump (it was considered a 10% discount). Table 5 presents the main details of the previous contracts with the different technologies.
Analysing Table 5 is possible to verify that according with the selected option and technology will be negotiated different quantities. The contract quantities are dependent of the CEC composition but the objective considers the goal of a carbon-neutral CEC. In year 0 consumers’ average and peak demands were 212 MW and 446 MW, respectively. Using a MTS to forecast demand for the period under study, it is expected a reduction in the consumption around 1.84% [13]. The MTS considers the electricity consumption, the electricity price and the gross domestic product of the period 1997–2011 to compute the expected demand for years 1 and 2. So, to guarantee that the carbon-neutral goal is achieved, the CEC can consider an hourly quantity of 212 MWh to acquire through Forward contracts. In case of a PPA it is different, the quantity is guaranteed only for HPPs. The uncertainty related to VRE will make the CEC to establish PPAs for different powers. The CEC should establish a contract with HPPs until 446 MW, its peak demand, guaranteeing not only the carbon neutrality but also energy sustainability, since with this agreement CECs do not have to purchase from spot markets. Considering conservative capacity factors of 25% for wind and 20% for PV, for an average demand of 212 MWh, the CEC will have to establish a contract with 848 MW of wind farms or 1077 MW of solar PV to achieve carbon neutrality. To achieve these values, the wind farms dataset was downscaled and the solar PV dataset was upscaled.
Considering only forwards, the deal with wind farms is the most advantageous from an economic point of view. Considering all contracts, the PPA with the HPP is risk-free and can guarantee energy sustainability. These values are dependent of the geographical location of the CEC, different locations will change the capacity factors of each technology, such as market prices or even the resource availability. CECs can also invest in self-consumption trough acquiring their own solar PV power plants. They can acquire expensive small-scale units to directly feed their needs, which are limited to their rooftop and land area, or cheaper large-scale units connected to the high voltage grid of the distribution grid. The maturity of the solar PV technology and its mass production (scale economy) makes Portugal achieve the record of the lowest auction’s price of 11.40 €/MWh [58,60]. However, depending on local capacity factors the values of large-scale solar PV can go until 30 €/MWh [27,28,29,30,58,60]. In Portugal, the average LCOE of rooftop PV stands around 90 €/MWh [27,28,29,30]. The difference between the LCOEs is substantial because scale economy reduces the price of large-scale units and the retail markup increases the price of small-scale units. Furthermore, while rooftop solar PV has been installed in the whole country with diverse capacity factors, increasing the average LCOE, large-scale solar PV projects have only been considered in regions with the highest potential. Considering the W/m2 capacity of PV power plants, it will be hard for consumers achieving carbon neutrality only considering small-scale PV, that is also less favourable from an investment point of view [29,30].
5.3. CEC Composition and Results
Table 6 presents the main results of the Iberian market for the two years in study, considering the market value, the real production, capacitor factors and renewable resource indexes of each technology.
It presents the results from the point of view of each technology. Interestingly the market value of HPPs is lower than the solar PV value, even using strategic bidding. If we also consider the costs with pumping, the market value of HPPs is the lowest one, being equal to 39.52 €/MWh, its remuneration from markets. Analysing the table, it is possible to verify that these years are typical years for wind production in Portugal with a capacity factor around 26%. The hydroelectricity index is lower than 1, which means these are dry years when comparing to the historical reference. The capacity factor of hydroelectricity should be lower than the average, but in this case and contrary to the wind index it also considers the stored water in reservoirs, so, there is not a reference capacity factor for HPPs. In case of solar PV there is not enough historical data to compute its index, but a capacity factor higher than 20% is normal in Portugal [30]. The results obtained in Table 6 used real data from the Portuguese power system and reflect the capacity factors of each renewable technology, so, it can serve as reference for countries with close behaviours. Table 7 presents the main results from the point of view of the carbon neutrality goal of the CEC, such as the energy sustainability of the CEC considering the different options.
Analysing Table 7 it is possible to verify that through Forward contracts the CEC cannot achieve carbon neutrality only establishing contracts with wind, PV or both, because these technologies cannot satisfy such contracts with only their own energy, during some hours they have to buy that energy from the market. However, if they sign contracts with hydro or all technologies the CEC can achieve its goal. By using these contracts, the CEC can feed only 85% of its demand, which means that it needs to buy the extra energy above 212 MW from markets.
Considering PPAs, the CEC can achieve carbon neutrality with all technologies, which means all technologies produce the energy required by the CEC. However, this does not mean that all technologies can produce energy when required by the CEC, as can be seen by the sustainability index. Indeed, in case of wind and solar PV, their production profile is not aligned with the CEC demand. Wind and solar PV production only covers 65% and 53% of the real-time CEC demand, respectively, which means that the CEC will need to buy its net load from markets. The same is true when these technologies are producing more energy than required by the CEC, selling the extra energy in markets. Indeed, CECs with self-consumption based on solar PV without storage capacity can achieve carbon neutrality, but cannot be energy sustainable, since it is impossible to satisfy their nocturnal demand. The results show a maximum carbon-neutral index of 1.00, because the deals are enough to satisfy the CEC demand, but in case the CEC make bilateral agreements with more renewable power plants this index can be higher. Then it should sell the extra energy in markets, avoiding the payment of penalties because of deviations.
Table 8 presents the main results from the point of view of each player of the CEC. Results from this table reflect the strong benefit of self-consumption, mainly by reducing the variable costs with energy that do not consider the energy itself, like grid use, commercialization and extra costs that derivate from investments of economic interest (GEIC).
Naturally, the substantial difference between the investment cost in large-scale and small-scale solar PV makes CECs more attractive from an economic point of view than single consumers. Furthermore, the number of solar PV panels required for consumers achieve carbon neutrality makes it practically impossible for single consumers achieve it [28,29]. From this perspective, only CECs with large-scale solar PV plants can achieve this goal. Beyond that, CECs also have the advantage of negotiating in energy markets, obtaining more competitive prices for energy when comparing to retail tariffs proposed to single consumers, that have markups around 20% in Europe [36]. Retailers are profit-seeking players, so they reserve a substantial return/markup when proposing tariffs to consumers. CECs with large-scale PVs are the ones with lower costs per unit of energy, because they can highly reduce the variable costs with the grid use and commercialization and have an 100% discount over the GEIC. Furthermore, they potentially can also reduce the variable costs with energy, but that will depend on the LCOE of the Solar PV. For the reference case of Portugal, the 11.14 €/MWh record of the last solar PV auction can highly reduce the costs of energy. However, considering a substantially higher LCOE, like for example 90 €/MWh, from the perspective of the CEC it will increase its total cost with energy from 37.29 €/MWh to 124.27 €/MWh, that even so is more competitive than retail tariffs. This study only considers real consumers connected to the medium voltage grid of the distribution grid. The cost of use the low voltage grid is 15.40 €/MWh, so, small consumers can even obtain higher benefits from joining CECs with self-consumption.
A CEC where consumers establish contracts with renewable technologies is also advantageous for both parties. Forward contracts are used for risk hedging against spot price uncertainty, so it is more related to price than resource availability. Naturally, for future energy markets with near 100% renewable penetration, the inverse correlation between price and resource availability will be higher than nowadays. So, from the point of view of the consumer, forwards have the same physical and financial values independently of the renewable technology, so, the CEC will perform a deal for the lowest price, and in this case the deal with wind farms is the most advantageous of all. PPAs do not have any risk to renewable technologies, so, each technology should receive a lower (potential) remuneration from PPAs than from forwards. That is not the case of wind farms. Wind farms did not cover all their risks with this Forward contract, as can be seen by their significantly different remuneration between forwards and PPAs. Wind farms should increase their Forwards price, because they are not covering all their risks and acting strategically, because when stablishing this kind of long-term contract, they should take into consideration market and competition prices instead of resource availability. One of the goals of this work focus on showing the advantageous of these agreements, optimizing the return of each agent is out of the scope of this article. Therefore, in case of using optimization models to define forwards prices, by considering a profit seeking objective function it should increase the prices requested by wind farms to values close to the solar PV prices.
The required return used by solar PV to define their forwards prices seems appropriated since they get a higher return from forwards than from PPAs. PPAs with HPPs are practically risk-free, because only a very dry year will avoid the carbon neutrality goal of the CEC, but in this case it is not so advantageous from the point of view of HPPs. However, for CECs composed of wind and solar PV technologies, HPPs can benefit from their up deviations to pump for lower prices. So, in this case PPAs agreements can be beneficial for HPPs. Agreements between CECs and solar PV are the most favourable for both parties, since solar PV can satisfy almost all consumers demand during peak periods, when market prices are higher. Furthermore, for the particular case of Portugal and almost all countries between tropics, the LCOE of large-scale solar PV is the most competitive between all considered technologies [26,27,28]. Considering the resource availability and the CEC demand during the studied period, establishing a Forward contract with wind farms will not guarantee carbon neutrality since 2% of the CEC demand is satisfied with fossil fuel power plants. To achieve carbon neutrality through forwards the CEC has to establish an agreement with all players or just with HPPs, but the price increases by 2.48 €/MWh and 10.67 €/MWh, respectively, in relation to a deal only with wind farms.
Concluding, by allying into a CEC, consumers can acquire cheaper energy than considering the tariffs proposed by retailers or regulators. If they invest in self-consumption their benefit will be even higher, especially if they are small consumers as part of a CEC with large-scale solar PV plants. If CECs establish bilateral agreements with renewable sources beyond being economically beneficial to all parties, it also has potential to make the CECs carbon-neutral and energy sustainable in relation to electrical energy consumption. Currently, the main issue for the active participation of consumers in electricity markets is driven by the lower weight of the electricity cost in the consumers’ budget. Electrification is one key issue to increase this weight. The sector coupling between the electrical sector and the transport, cooling and heating sectors is already in place. Indeed, district heating and cooling, and V2G are potential solutions to CECs increase their flexibility and storage capacity. When the electrification of society increases the relevance of the electrical energy to consumers’ budget, they will be incentivized to use demand response programs, and exchange energy with other CECs and players through P2P markets. Real-time prices, market participation and scarcity pricing will be issues that will increase the consumers’ engagement in the electricity sector.
Considering the current market designs, the increase in the penetration of variable renewable energy in markets decreases wholesale market prices and increases the ancillary services costs because of the forecast errors that increase the amount of energy that needs to be balanced during real-time. The increasing penetrations of VREs also decreases the operating hours of dispatchable power plants, increasing their LCOE which is reflected in the retail tariffs. Contrary to wholesale prices, retail prices have been increasing, mainly because of all extra costs related to VRE investments and security of supply.
Future carbon-neutral societies will require flexible solutions to cover the short-run deviations of VREs and demand that have been balanced by polluting dispatchable power plants, guaranteeing the security of supply. In the top of the flexible solutions is storage capacity but also demand response. Countries have limited hydroelectric potential and BESS is expensive. Consumers have the choice of being passive, paying the high cost of a carbon-neutral society secured by BESS or active, through electrification, DR and participating in electricity markets.
6. Final Remarks and Future Work
The global goal of a carbon-neutral society triggered high governmental incentives to non-mature renewable technologies, as wind, biomass and solar PV, contributing for the tariff deficit, i.e., the difference between the market value of the technology and its remuneration, paid by consumers. Currently, mature variable renewable energy, as solar PV, significantly reduce its investment costs, being attractive without governmental incentives. However, the stochastic behaviour of VRE brings difficulties to the current electricity market designs, that were designed to dispatchable technologies. It contributes to an increase in the real-time energy unbalance between supply and demand that can be solved by fast-responsive dispatchable technologies in case of energy scarcity or by VRE curtailments in case of energy excess. In the last few years the costs with ancillary services have been increasing, being these services essential to guarantee the security of supply and the stability of the power system. Furthermore, the increase in the VRE penetration decreases the operation hours of traditional power plants that can guarantee the security of supply, increasing the costs with capacity mechanisms to assure the economic subsistence of these technologies. These extra-costs are passed to consumers’ retail energy price, that currently in Europe is more than the double of the wholesale energy price. One of the key issues for an economically efficient carbon-neutral society is flexibility, being storage capacity and DR very important to guarantee the energy balance at acceptable prices.
Citizen energy communities (CECs) may have a key role to play in achieving an economically efficient carbon-neutral society. Indeed, in relation to the electricity sector, European governments give relevant discounts to CECs with self-consumption, by reducing their prices with extra costs. These incentives may attract consumers to be part of CECs. On the short-term CECs may contribute to a reduction in the system unbalance by providing more accurate forecasts of their net load. They can also reduce the grid usage and energy transportation by incentivizing local self-consumption and trades. The main difficulty of CECs can be dealing with the renewable resources’ availability, considering its high short-run variability but also the long-run uncertain capacity factors of each technology, i.e., the number of hours operating at nominal power. This availability and capacity factors may change considering different geographical locations.
This article presented a case-study that tested different CECs’ configurations using real data from Portuguese consumers, producers and market prices. Portugal is characterized by having an above average solar PV capacity factor, around 22%, making it favourable for self-consumption. On the other hand, the wind capacity factor is below the average, around 26%, being the hydroelectric production very yearly volatile with capacity factors around 25%. Results from the case-study show that CECs composed with consumers with self-consumption (prosumers) with large-scale solar PV units are the most favourable from an economic point of view, reducing the consumers’ costs with energy between 54% and 76%, depending on the LCOE of the solar PV. Indeed, self-consumption may be more favourable than being part of a CEC with only consumers. Single prosumers with small-scale solar PV can save 16% while CECs with only consumer can save 9% in the energy costs. However, if these prosumers are part of a CEC, they can save 24%. CECs can achieve carbon neutrality in their electricity demand if they invest in enough solar PV capacity. In Portugal the solar PV capacity should be around five times the average CEC demand, but it varies with the geographical resource availability. Agreements between CECs and large-scale renewable power plants can make CECs achieve carbon neutrality, but economically are not so advantageous, with saves between 7% and 14% in the energy cost. However, these agreements can be useful in the case of CECs with pollute industries as members, guaranteeing CO2 licenses and origin certificates that save them costs with CO2 emissions.
The results obtained considering CECs with self-consumption are economically relevant to attract the engagement of consumers and prosumers. When electrical energy starts being more competitive than other sources of energy it can speed up the electrification process. With the electrification of all sectors of activity the weight of electrical energy in consumers’ budget will be more relevant, incentivizing their active participation in the energy balance. To achieve an economically efficient and carbon-neutral society, electrification and consumers’ engagement will be the key. With increasing levels of VRE, to guarantee the security of supply, the power system will have to require flexibility from consumers at competitive prices, to invest in expensive storage solutions or to keep traditional power plants as backup, paying high costs to guarantee their economic viability. In the future CECs can provide the required flexibility though DR, EVs, district heating and cooling, sector coupling and trades with other CECs and system operators. For future work is intended to study the benefits of CECs considering different spatial resource availability, using an optimization model to define the best CEC configuration.
Funding
This work has received funding from the EU Horizon 2020 research and innovation program under project TradeRES (grant agreement No 864276).
Institutional Review Board Statement
Not applicable.
Informed Consent Statement
Not applicable.
Data Availability Statement
The real consumption dataset of the consumers can be found in an online repository at https://archive.ics.uci.edu/ml/datasets/ElectricityLoadDiagrams20112014#. The characteristics of the renewable technologies can be found at http://e2p.inegi.up.pt/?Lang=EN. The market results of the Iberian market of electricity are available at https://www.mercado.ren.pt/EN/Electr/MarketInfo/MarketResults/Pages/default.aspx. The renewable and consumption forecasts can be found at https://www.mercado.ren.pt/EN/Electr/MarketInfo/Load/TotalLoad/Pages/default.aspx. The observed renewables production and their performance indexes, such as the demand consumption are available at https://www.centrodeinformacao.ren.pt/EN/InformacaoExploracao/Pages/EstatisticaMensal.aspx. All data accessed on 17 May 2020.
Conflicts of Interest
The author declares no conflict of interest.
Abbreviations
| ACER | Agency for the Cooperation of Energy Regulators |
| BESS | Battery energy storage system |
| CEC | Citizen energy community |
| CET | Central European Time |
| CO2 | Dioxide carbon |
| DAM | Day-ahead market |
| DR | Demand response |
| DSO | Distributed system operator |
| EM | Electricity market |
| ETS | Emissions trading system |
| EV | Electric vehicle |
| EU | European Union |
| G2V | Grid-to-vehicle |
| GDP | Gross Domestic Product |
| GEIC | General Economic Interest Cost |
| HPP | Hydroelectric power plants |
| IDM | Intraday market |
| LCOE | Levelized cost of the energy |
| MTS | Multivariate time series |
| RES | Renewable Energy Source |
| RMSE | Normalized mean square error |
| P2P | Peer-to-peer |
| PPA | Power purchase agreement |
| PV | Photovoltaic |
| SO | System operator |
| TSO | Transmission system operator |
| V2G | Vehicle-to-grid |
| VAT | Value Added Tax |
| VRE | Variable renewable energy |
| Indices | |
| Bilateral contract | |
| Lag | |
| Time | |
| Parameters | |
| , , , , , | Lags number |
| Variable costs | |
| Fixed costs | |
| I | Number of bilateral contracts and self-consumption units |
| Discount rate | |
| Time period | |
| Technology life-cycle | |
| Variables | |
| , , ,, , | Regressions variables |
| , | Errors of random events |
| Technology variable costs | |
| Technology fixed costs | |
| Variable cost of consumers or CECs with electricity | |
| Average variable cost of consumers or CECs with electricity | |
| Capacity factor | |
| Carbon-neutral index | |
| Electricity sustainability index | |
| Renewable resource index | |
| Gross Domestic Product | |
| Nominal power | |
| Bilateral contract or self-consumption electricity price | |
| DAM price | |
| Expected DAM price | |
| Down deviations price | |
| Retail energy price of the variable-term of the tariff | |
| Retail other prices of the variable-term of the tariff | |
| Up deviation price | |
| Nominal quantity of energy | |
| Observed quantity of energy | |
| Forecasted quantity of energy | |
| Quantity of all bilateral contracts and self-consumption units | |
| Bilateral contract or self-consumption quantity | |
| Average deviation of energy | |
| All energy transacted in the DAM | |
| Bidded DAM quantity of energy | |
| Consumer or CEC consumption of energy | |
| Consumer or CEC consumption forecast | |
| Observed net-load | |
| Reference renewable production of energy | |
| Renewable production of energy | |
| Forecast of the renewable production | |
| Remuneration of each technology | |
| Average remuneration of each technology | |
| DAM share of RES | |
References
- Kirschen, D.; Strbac, G. Fundamentals of Power System Economics, 2nd ed.; John Wiley & Sons: Chichester, UK, 2018. [Google Scholar]
- Lopes, F. Electricity markets and intelligent agents. Part I: Market architecture and structure. In Electricity Markets with Increasing Levels of Renewable Generation: Structure, Operation, Agent-Based Simulation and Emerging Designs; Springer: Cham, Switzerland, 2018; pp. 23–48. [Google Scholar]
- Shahidehpour, M.; Yamin, H.; Li, Z. Market Operations in Electric Power Systems: Forecasting, Scheduling, and Risk Management, 1st ed.; John Wiley & Sons: Chichester, UK, 2003. [Google Scholar]
- Algarvio, H.; Couto, A.; Lopes, F.; Santana, S.; Estanqueiro, A. Effects of regulating the European Internal Market on the integration of variable renewable energy. WIREs Energy Environ. 2019, 8, 346. [Google Scholar] [CrossRef]
- Algarvio, H.; Lopes, F.; Couto, A.; Estanqueiro, A. Participation of wind power producers in day-ahead and balancing markets: An overview and a simulation-based study. WIREs Energy Environ. 2019, 8, 343. [Google Scholar] [CrossRef]
- Voss, K.; Musall, E. Net Zero Energy Buildings: International Projects of Carbon Neutrality in Buildings; Walter de Gruyter: Berlin, Germany, 2012. [Google Scholar]
- Lehmann, P.; Creutzig, F.; Ehlers, M.H.; Friedrichsen, N.; Heuson, C.; Hirth, L.; Pietzcker, R. Carbon lock-out: Advancing renewable energy policy in Europe. Energies 2012, 5, 323–354. [Google Scholar] [CrossRef] [Green Version]
- Moro, A.; Lonza, L. Electricity carbon intensity in European Member States: Impacts on GHG emissions of electric vehicles. Transp. Res. Part D Transp. Environ. 2018, 64, 5–14. [Google Scholar] [CrossRef]
- Nicolini, M.; Tavoni, M. Are renewable energy subsidies effective? Evidence from Europe. Renew. Sustain. Energy Rev. 2018, 74, 412–423. [Google Scholar] [CrossRef]
- Algarvio, H.; Lopes, F.; Santana, J. Renewable energy support policy based on contracts for difference and bilateral negotiation. In Proceedings of the International Conference on Practical Applications of Agents and Multi-Agent Systems, PAAMS, L’Aquila, Italy, 7–9 October 2020; Springer: Cham, Switzerland, 2020. [Google Scholar]
- Gils, H.; Scholz, Y.; Pregger, T.; de Tena, D.; Heide, D. Integrated modelling of variable renewable energy-based power supply in Europe. Energy 2017, 123, 173–188. [Google Scholar] [CrossRef] [Green Version]
- Prol, J.; Steininger, K.; Zilberman, D. The cannibalization effect of wind and solar in the California wholesale electricity market. Energy Econ. 2020, 85, 104552. [Google Scholar] [CrossRef]
- Algarvio, H.; Lopes, F.; Sousa, J.; Lagarto, J. Multi-agent electricity markets: Retailer portfolio optimization using Markowitz theory. Electr. Power Syst. Res. 2017, 148, 282–294. [Google Scholar] [CrossRef]
- Wei, N.; Li, C.; Peng, X.; Zeng, F.; Lu, X. Conventional models and artificial intelligence-based models for energy consumption forecasting: A review. J. Pet. Sci. Eng. 2019, 181, 106187. [Google Scholar] [CrossRef]
- Algarvio, H.; Lopes, F.; Santana, J. A linear programming model to simulate the adaptation of multi-agent power systems to new sources of energy. In Highlights in Cyber-Physical Multi-Agent Systems; Springer: Cham, Switzerland, 2017; pp. 350–360. [Google Scholar]
- Morales-España, G.; Nycander, E.; Sijm, J. Reducing CO2 emissions by curtailing renewables: Examples from optimal power system operation. Energy Econ. 2021, 99, 105277. [Google Scholar] [CrossRef]
- International Energy Agency. The Power of Transformation: Wind, Sun and the Economics of Flexible Power Systems. Available online: https://www.oecd.org/publications/the-power-of-transformation-9789264208032-en.htm (accessed on 18 March 2021).
- Bernath, C.; Deac, G.; Sensfuß, F. Impact of sector coupling on the market value of renewable energies—A model-based scenario analysis. Appl. Energy 2021, 281, 115985. [Google Scholar] [CrossRef]
- Algarvio, H.; Viegas, J.; Lopes, F.; Amaro, D.; Pronto, A.; Vieira, S. Electricity usage efficiency in large buildings: DSM measures and preliminary simulations of DR programs in a public library. In Proceedings of the International Conference on Practical Applications of Agents and Multi-Agent Systems, Salamanca, Spain, 3–5 June 2015; Springer: Cham, Switzerland, 2015; pp. 249–259. [Google Scholar]
- Algarvio, H.; Lopes, F.; Couto, A.; Estanqueiro, A.; Santana, J. Variable renewable energy and market design: New market products and a real-world study. Energies 2019, 12, 4576. [Google Scholar] [CrossRef] [Green Version]
- Strbac, G.; Papadaskalopoulos, D.; Chrysanthopoulos, N.; Estanqueiro, A.; Algarvio, H.; Lopes, F.; de Vries, L.; Morales-España, G.; Sijm, J.; Hernandez-Serna, R.; et al. Decarbonization of electricity systems in Europe: Market design challenges. IEEE Power Energy Mag. 2021, 19, 53–63. [Google Scholar] [CrossRef]
- European Commission. Communication from the Commission to the European Parliament, the Council, the European Economic and Social Committee, the Committee of the Regions and the European Investment Bank. Clean Energy for All Europeans (COM/2016/0860 Final). Available online: https://eur-lex.europa.eu/legal-content/EN/TXT/?uri=CELEX%3A52016DC0860 (accessed on 18 March 2021).
- European Commission. Regulation (EU) 2019/943 of the European Parliament and of the Council on the Internal Market for Electricity. 5 June 2019. Available online: http://data.europa.eu/eli/reg/2019/943/oj (accessed on 10 May 2021).
- Jager-Waldau, A. JRC Science for Policy Report, PV Status Report 2019. Available online: https://ec.europa.eu/jrc/en/publication/eur-scientific-and-technical-research-reports/pv-status-report-2019 (accessed on 18 March 2021).
- US Energy Information Association. Levelized Costs of New Generation Resources in the Annual Energy Outlook 2021. US Department of Energy. Available online: https://www.eia.gov/outlooks/aeo/pdf/electricity_generation.pdf (accessed on 18 March 2021).
- IRENA. Renewable Power Generation Costs in 2017. 2018. Available online: https://www.irena.org/publications/2018/Jan/Renewable-power-generation-costs-in-2017 (accessed on 18 March 2021).
- Pinna, A.; Massidda, L. A procedure for complete census estimation of rooftop photovoltaic potential in urban areas. Smart Cities 2020, 3, 873–893. [Google Scholar] [CrossRef]
- Bódis, K.; Kougias, I.; Jäger-Waldau, A.; Taylor, N.; Szabó, S. A high-resolution geospatial assessment of the rooftop solar photovoltaic potential in the European Union. Renew. Sustain. Energy Rev. 2019, 114, 109309. [Google Scholar] [CrossRef]
- Pinto, G.; Abdollahi, E.; Capozzoli, A.; Savoldi, L.; Lahdelma, R. Optimization and multicriteria evaluation of carbon-neutral technologies for district heating. Energies 2019, 12, 1653. [Google Scholar] [CrossRef] [Green Version]
- Eikeland, P. The Third Internal Energy Market Package: New Power Relations among Member States, EU Institutions and Non-state Actors? JCMS J. Common Mark. Stud. 2011, 49, 243–263. [Google Scholar] [CrossRef]
- Sleisz, Á.; Sőrés, P.; Raisz, D. Algorithmic properties of the all-European day-ahead electricity market. In Proceedings of the 11th International Conference on the European Energy Market (EEM 14), Krakow, Poland, 28–30 May 2014; IEEE: Piscataway, NJ, USA, 2014. [Google Scholar]
- Algarvio, H.; Lopes, F.; Santana, J. Simple and linear bids in multi-agent daily electricity markets: A preliminary report. In Distributed Computing and Artificial Intelligence, In 15th International Conference; Springer International Publishing: Cham, Switzerland, 2018. [Google Scholar]
- Zsiborács, H.; Baranyai, N.; Vincze, A.; Zentkó, L.; Birkner, Z.; Máté, K.; Pintér, G. Intermittent renewable energy sources: The role of energy storage in the european power system of 2040. Electronics 2019, 8, 729. [Google Scholar] [CrossRef] [Green Version]
- Bistline, J.; Santen, N.; Young, D. The economic geography of variable renewable energy and impacts of trade formulations for renewable mandates. Renew. Sustain. Energy Rev. 2019, 106, 79–96. [Google Scholar] [CrossRef]
- Halttunen, K.; Staffell, I.; Slade, R.; Green, R.; Saint-Drenan, Y.; Jansen, M. Global Assessment of the Merit-Order Effect and Revenue Cannibalisation for Variable Renewable Energy. Available online: https://ssrn.com/abstract=3741232 (accessed on 18 March 2021).
- ACER. ACER Market Monitoring Report 2019—Energy Retail and Consumer Protection Volume. 2020. Available online: https://www.acer.europa.eu/Official_documents/Acts_of_the_Agency/Publication/ACER%20Market%20Monitoring%20Report%202019%20-%20Energy%20Retail%20and%20Consumer%20Protection%20Volume.pdf (accessed on 18 March 2021).
- Algarvio, H.; Couto, A.; Lopes, F.; Estanqueiro, A. Changing the day-ahead gate closure to wind power integration: A simulation-based study. Energies 2019, 12, 2765. [Google Scholar] [CrossRef] [Green Version]
- Couto, A.; Estanqueiro, A. Exploring wind and solar PV generation complementarity to meet electricity demand. Energies 2020, 13, 4132. [Google Scholar] [CrossRef]
- Kobylinski, P.; Wierzbowski, M.; Piotrowski, K. High-resolution net load forecasting for micro-neighbourhoods with high penetration of renewable energy sources. Int. J. Electr. Power Energy Syst. 2020, 117, 105635. [Google Scholar] [CrossRef]
- van der Meer, D.; Shepero, M.; Svensson, A.; Widén, J.; Munkhammar, J. Probabilistic forecasting of electricity consumption, photovoltaic power generation and net demand of an individual building using Gaussian Processes. Appl. Energy 2018, 213, 195–207. [Google Scholar] [CrossRef]
- Sossan, F.; Nespoli, L.; Medici, V.; Paolone, M. Unsupervised disaggregation of photovoltaic production from composite power flow measurements of heterogeneous prosumers. IEEE Trans. Ind. Inform. 2018, 14, 3904–3913. [Google Scholar] [CrossRef] [Green Version]
- Koponen, P.; Ikäheimo, J.; Koskela, J.; Brester, C.; Niska, H. Assessing and comparing short term load forecasting performance. Energies 2020, 13, 2054. [Google Scholar] [CrossRef]
- Chaaraoui, S.; Bebber, M.; Meilinger, S.; Rummeny, S.; Schneiders, T.; Sawadogo, W.; Kunstmann, H. Day-ahead electric load forecast for a ghanaian health facility using different algorithms. Energies 2021, 14, 409. [Google Scholar] [CrossRef]
- Mujeeb, S.; Alghamdi, T.; Ullah, S.; Fatima, A.; Javaid, N.; Saba, T. Exploiting deep learning for wind power forecasting based on big data analytics. Appl. Sci. 2019, 9, 4417. [Google Scholar] [CrossRef] [Green Version]
- Mayer, M.; Gróf, G. Extensive comparison of physical models for photovoltaic power forecasting. Appl. Energy 2021, 283, 116239. [Google Scholar] [CrossRef]
- Dimovski, A.; Moncecchi, M.; Falabretti, D.; Merlo, M. PV forecast for the optimal operation of the medium voltage distribution network: A real-life implementation on a large scale pilot. Energies 2020, 13, 5330. [Google Scholar] [CrossRef]
- Collino, E.; Ronzio, D. Exploitation of a new short-term multimodel photovoltaic power forecasting method in the very short-term horizon to derive a multi-time scale forecasting system. Energies 2021, 14, 789. [Google Scholar] [CrossRef]
- Raza, M.; Nadarajah, M.; Ekanayake, C. Demand forecast of PV integrated bioclimatic buildings using ensemble framework. Appl. Energy 2017, 208, 1626–1638. [Google Scholar] [CrossRef]
- Sougkakis, V.; Lymperopoulos, K.; Nikolopoulos, N.; Margaritis, N.; Giourka, P.; Angelakoglou, K. An investigation on the feasibility of near-zero and positive energy communities in the Greek Context. Smart Cities 2020, 3, 362–384. [Google Scholar] [CrossRef]
- Tcholtchev, N.; Schieferdecker, I. Sustainable and reliable information and communication technology for resilient smart cities. Smart Cities 2021, 4, 156–176. [Google Scholar] [CrossRef]
- Tobey, M.; Binder, R.; Yoshida, T.; Yamagata, Y. Urban systems design case study: Tokyo’s sumida ward. Smart Cities 2019, 2, 453–470. [Google Scholar] [CrossRef] [Green Version]
- Algarvio, H.; Lopes, F.; Santana, J. Multi-agent retail energy markets: Bilateral contracting and coalitions of end-use customers. In Proceedings of the 12th International Conference on the European Energy Market (EEM), Lisbon, Portugal, 19–22 May 2015; pp. 1–5. [Google Scholar]
- Monroe, J.; Hansen, P.; Sorell, M.; Berglund, E. Agent-based model of a blockchain enabled peer-to-peer energy market: Application for a neighborhood trial in Perth, Australia. Smart Cities 2020, 3, 1072–1099. [Google Scholar] [CrossRef]
- Algarvio, H.; Lopes, F.; Santana, J. Strategic Operation of Hydroelectric Power Plants in Energy Markets: A Model and a Study on the Hydro-Wind Balance. Fluids 2020, 5, 209. [Google Scholar] [CrossRef]
- Ramírez, F.; Honrubia-Escribano, A.; Gómez-Lázaro, E.; Pham, D. Combining feed-in tariffs and net-metering schemes to balance development in adoption of photovoltaic energy: Comparative economic assessment and policy implications for European countries. Energy Policy 2017, 102, 440–452. [Google Scholar] [CrossRef]
- Evangelopoulou, S.; De Vita, A.; Zazias, G.; Capros, P. Energy system modelling of carbon-neutral hydrogen as an enabler of sectoral integration within a decarbonization pathway. Energies 2019, 12, 2551. [Google Scholar] [CrossRef] [Green Version]
- ERSE. Tariffs and Prices—Electricity. Available online: https://www.erse.pt/en/activities/market-regulation/tariffs-and-prices-electricity/ (accessed on 18 March 2021).
- Portuguese Government. Renewable Capacity Auctions. Portuguese. Available online: https://leiloes-renovaveis.gov.pt/ (accessed on 18 March 2021).
- Algarvio, H.; Lopes, F.; Santana, J. Bilateral contracting in multi-agent energy markets: Forward contracts and risk management. In Proceedings of the International Conference on Practical Applications of Agents and Multi-Agent Systems, Salamanca, Spain, 3–5 June 2015; Springer International Publishing: Cham, Switzerland, 2015; pp. 260–269. [Google Scholar]
- Bhat, A.; Dhamaniya, B.; Chhillar, P.; Korukonda, T.; Rawat, G.; Pathak, S. Analysing the prospects of perovskite solar cells within the purview of recent scientific advancements. Crystals 2018, 8, 242. [Google Scholar] [CrossRef] [Green Version]
Figure 1.
Microgrid of the local Citizen Energy Community under study. Orange and red lines represent the distribution and transportation grid, respectivelly.
Figure 1.
Microgrid of the local Citizen Energy Community under study. Orange and red lines represent the distribution and transportation grid, respectivelly.


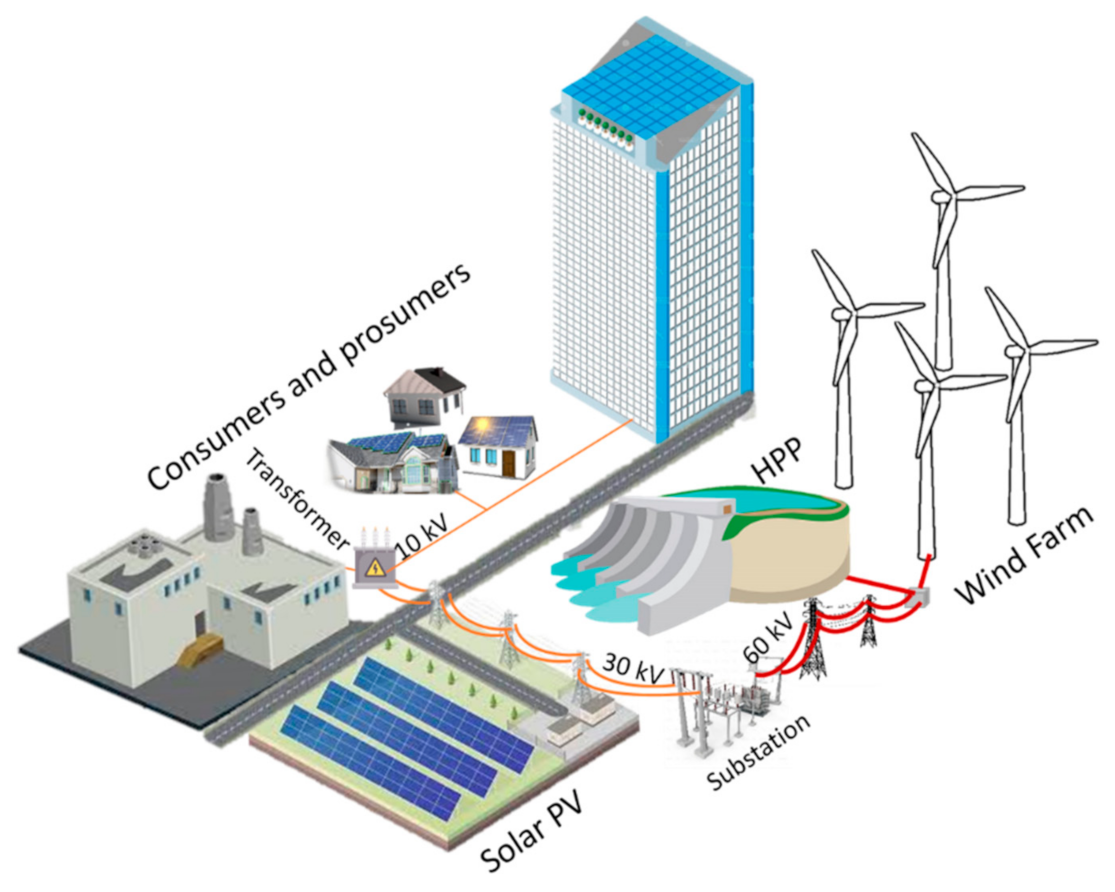
Table 1.
Forecast errors and average deviation of different single and aggregated (Agg.) players, all in %.
Table 1.
Forecast errors and average deviation of different single and aggregated (Agg.) players, all in %.
| Player | NRMSE | Average Deviation |
|---|---|---|
| Wind Farm | 13.49 | 43.33 |
| Agg. Wind Farms | 8.03 | 25.79 |
| Large-scale Solar PV | 15.00 | 60.00 |
| Agg. Solar PV | 6.00 | 24.00 |
| Small-scale Solar PV | 21.00 | 85.00 |
| Agg. Consumers | 8.00 | 19.00 |
| Agg. Consumers with self-consumption (PV) | 6.50 | 15.50 |
Table 2.
Role of each member (M) or partner (P) of CECs.
| Player | Engagement | Benefits from | Contributes to |
|---|---|---|---|
| Consumer (M) | Demand Market participation | Lower costs and forecast errors | Lower balancing needs and costs |
| Prosumer (M) | Demand and supply Market participation | Lower costs and forecast errors | Lower balancing needs, costs and grid usage |
| VRE (P) | Microgrid trades Supply | Lower forecast errors and less penalties paid | Lower balancing needs and costs, and less costs with CO2 emissions because of CO2 licenses |
| HPP (P) | Microgrid trades Scarcity supply and excess demand | Lower prices for pumping | Any balancing needs and costs, and potential any costs with CO2 emissions because of CO2 licenses |
| DSO (M or P) | Energy management | Less congestions | Lower distribution grid costs |
Table 3.
Future flexibility options of CECs.
| Option | Engagement | Contributes to | Potential Benefits the System with |
|---|---|---|---|
| EVs | Smart charging | Energy balance and lower costs | Lower balancing needs, costs and grid usage |
| BESS | Storage management | Energy balance and lower costs | Lower balancing needs, costs and grid usage |
| DR | Smart consumption | Energy balance, lower costs and economic incentives | Lower balancing needs, costs, grid usage and congestions incidences |
| District heating | Smart storage and centralized heating | Energy balance and storage at lower prices | Electrification and lower balancing needs and costs |
| District cooling | Smart centralized cooling | Energy balance and lower prices | Electrification and lower balancing needs and costs |
| P2P markets | Trading with neighbour balancing zones | Energy balance and avoid grid usage | Lower balancing needs, costs, grid usage and losses |
| Trades with SOs | Participation in ancillary services | Economic incentives | Security, stability and guarantee of supply |
| Sector coupling | Trades with other sectors | Avoid curtailments | Electrification and lower costs |
Table 4.
Real average remuneration from markets in year 0 and expected remuneration in years 1 and 2, all in €/MWh.
Table 4.
Real average remuneration from markets in year 0 and expected remuneration in years 1 and 2, all in €/MWh.
| Technology | Market Value of Year 0 | |||
|---|---|---|---|---|
| Wind | 47.15 | 36.05 | 35.87 | 32.90 |
| Solar PV | 53.41 | 40.49 | 40.29 | 36.95 |
| Hydro | 51.29 | 48.10 | 47.86 | 43.90 |
Table 5.
Price details of the different options for the CEC achieve carbon neutrality.
| Option | Details | Wind | Solar PV | Hydro |
|---|---|---|---|---|
| Forward | Price (€/MWh) | 37.82 | 44.41 | 49.17 |
| Quantity (MWh) | 212 | 212 | 212 | |
| PPA | Price | Day-ahead | Day-ahead | Day-ahead (−10%) |
| Power (MW) | 848 | 1077 | 446 | |
| Self-Consumption | Small-scale LCOE (€/MWh) | - | 90 | - |
| Large-scale LCOE (€/MWh) | - | 11.14–30 | - | |
| Power (MW) | - | 1077 | - |
Table 6.
Market value, production, capacity factor and resource index of each technology during years 1 and 2.
Table 6.
Market value, production, capacity factor and resource index of each technology during years 1 and 2.
| Technology | Market Value €/MWh | Production TWh | Capacity Factor % | Renewable Resource Index |
|---|---|---|---|---|
| Wind | 40.67 | 21.76 | 26.22 | 1.00 |
| Solar PV | 48.45 | 0.80 | 22.05 | - |
| Hydro | 44.21 | 16.63 | 18.73 | 0.70 |
Table 7.
Carbon-neutral and sustainability indexes considering all CEC options.
| Option | Technology | Carbon-Neutral Index | Energy Sustainability Index |
|---|---|---|---|
| Forwards | Wind Solar PV Hydro | 0.98 | 0.85 |
| 0.72 | 0.85 | ||
| 1.00 | 0.85 | ||
| Wind + PV | 0.99 | 0.85 | |
| All | 1.00 | 0.85 | |
| PPA | Wind Solar PV Hydro | 1.00 | 0.65 |
| 1.00 | 0.53 | ||
| 1.00 | 1.00 | ||
| Self-consumption | Solar PV | 1.00 | 0.53 |
Table 8.
Average consumers’ costs before taxes (VAT) with the variable tariff and each technology remuneration from an individual and community (CEC) perspective.
Table 8.
Average consumers’ costs before taxes (VAT) with the variable tariff and each technology remuneration from an individual and community (CEC) perspective.
| Player | Details | Energy- Part (€/MWh) | Other-Part (€/MWh) | Total Cost (€/MWh) | Technology Remuneration (€/MWh) |
|---|---|---|---|---|---|
| Consumer | Retail Tariff | 59.60 | 103.73 | 163.33 | - |
| Consumer with self-consumption (small-scale PV) | Retail Tariff and PV cost (90 €/MWh) | 101.81 | 35.70 | 137.51 | - |
| Consumers | Market-based | 50.98 | 98.33 | 149.31 | - |
| Consumers with self-consumption (small-scale PV) | Market-based and PV cost (90 €/MWh) | 98.38 | 25.89 | 124.27 | - |
| Consumers with self-consumption (large-scale PV) | Market-based and PV cost (11.14 €/MWh) | 7.43 | 29.86 | 37.29 | - |
| Consumers with self-consumption (large-scale PV) | Market-based and PV cost (30.00 €/MWh) | 29.18 | 29.86 | 59.04 | - |
| Wind | Market-based | - | - | - | 33.87 |
| PV | Market-based | - | - | - | 40.54 |
| Hydro | Market-based | - | - | - | 39.52 |
| Consumers and Wind | Forwards and Market-based | 42.69 | 98.33 | 141.02 | 37.09 |
| Consumers and Wind | PPA and Market-based | 52.59 | 98.33 | 150.92 | 40.67 |
| Consumers and PV | Forwards and Market-based | 49.48 | 97.53 | 147.01 | 50.31 |
| Consumers and PV | PPA and Market-based | 50.54 | 92.48 | 143.02 | 48.45 |
| Consumers and Hydro | Forwards and Market-based | 53.36 | 98.33 | 151.69 | 47.04 |
| Consumers and Hydro | PPA and Market-based | 52.78 | 98.33 | 151.11 | 39.99 |
| Consumers and all Technologies | Forwards and Market-based | 45.18 | 98.32 | 143.50 | - |
Publisher’s Note: MDPI stays neutral with regard to jurisdictional claims in published maps and institutional affiliations. |
© 2021 by the author. Licensee MDPI, Basel, Switzerland. This article is an open access article distributed under the terms and conditions of the Creative Commons Attribution (CC BY) license (https://creativecommons.org/licenses/by/4.0/).
Share and Cite
MDPI and ACS Style
Algarvio, H. The Role of Local Citizen Energy Communities in the Road to Carbon-Neutral Power Systems: Outcomes from a Case Study in Portugal. Smart Cities 2021, 4, 840-863. https://0-doi-org.brum.beds.ac.uk/10.3390/smartcities4020043
AMA Style
Algarvio H. The Role of Local Citizen Energy Communities in the Road to Carbon-Neutral Power Systems: Outcomes from a Case Study in Portugal. Smart Cities. 2021; 4(2):840-863. https://0-doi-org.brum.beds.ac.uk/10.3390/smartcities4020043
Chicago/Turabian StyleAlgarvio, Hugo. 2021. "The Role of Local Citizen Energy Communities in the Road to Carbon-Neutral Power Systems: Outcomes from a Case Study in Portugal" Smart Cities 4, no. 2: 840-863. https://0-doi-org.brum.beds.ac.uk/10.3390/smartcities4020043