1. Introduction
Among the most urgent challenges in this century, the development of sustainable and resilient cities has driven much attention lately [
1,
2]. Actually, while this century reported most people living in cities worldwide, for the first time in our history, this intense urbanization process has created continuous pressure on urban centers. In this complex environment, mobility has been a major issue, directly impacting the sustainability of modern cities [
3].
Conversely, most recent efforts toward mobility efficiency have been harnessed to improve traditional transportation based on motor vehicles, with massive investments dedicated for widening roads to allow more cars, indirectly incurring in the emission of additional tons of pollution gases yearly. In this sense, alternative transportation should be promoted instead, putting cleaner and more sustainable modals like bicycles at a prominent place. Hopefully, investments in smart cycling are rising, with many large cities experiencing innovative mobility solutions centered on public transportation connected to last-mile cycling [
4]. Furthermore, the COVID-19 Pandemic and the resulted social distance measures have played an important role in strengthening this sustainable mobility trend [
5].
Promoting cycling for transportation, nevertheless, has its challenges. Among them, cyclists riding in an urban area will be subject to some adverse conditions that may affect their health and safety [
6,
7]. In the first place, air and noise pollution, high UV radiation, inadequate luminosity, extreme (too low or too high) temperature, and humidity, among other factors, may be easily experienced in a today large city, at different levels, which may impact the health of cyclists in the long term. Besides these adverse environmental conditions, traffic accidents may also negatively impact cycling in a city, and it is reasonable to expect that some areas will report higher historical risks of accidents. Finally, urban violence will also have its role in the perceived quality of cycling in a city, with robberies and stealing occurrences also impacting cyclists. Putting all these together, adverse conditions strongly influence how sustainable cycling will be promoted and maintained as a practical transportation modal in cities.
Adverse conditions associated with cycling can be monitored in different ways. The advent of the Internet of Things (IoT) technologies has opened a strong development trend, making it possible the use of different affordable sensors to monitor a vast number of variables [
8]. This way, bicycles can be endowed with sensor units, allowing them to gather essential environmental information to be further transmitted, stored, and processed. In parallel, accidents and urban violence incidents are registered mainly by the governments, usually through traffic agents and police officers, are often stored into public databases that can be openly mined. However, crowd-sourcing approaches may also be adopted in this scenario [
9,
10]. Then, exploiting all this information and adopting cycling maps in the considered cities as a reference, a better perception of the quality of cycling paths can be achieved.
Therefore, monitored environmental data may be the basis for evaluating the quality of cycling paths in cities, with distributed sensors on bikes and data mining algorithms providing the required information. In this scenario, however, precise identification of the quality of cycling paths requires georeferenced processing of all monitoring samples and historical data, allowing the correct association of paths and quality indicators. As a result, sensors-based bike-centric monitoring approaches have to be equipped with GPS devices, as well as traffic accidents and urban violence records must include GPS coordinates of the area of occurrence. Actually, such GPS-based monitoring paradigm is a common approach that has been adopted mainly in smart city scenarios [
8,
11].
Finally, the computed quality of the cycling paths in a city should be displayed to the cyclists easily and intuitively, fostering the adoption of the discussed solution. For that, comprehensive maps should be used to display helpful information to the cyclists.
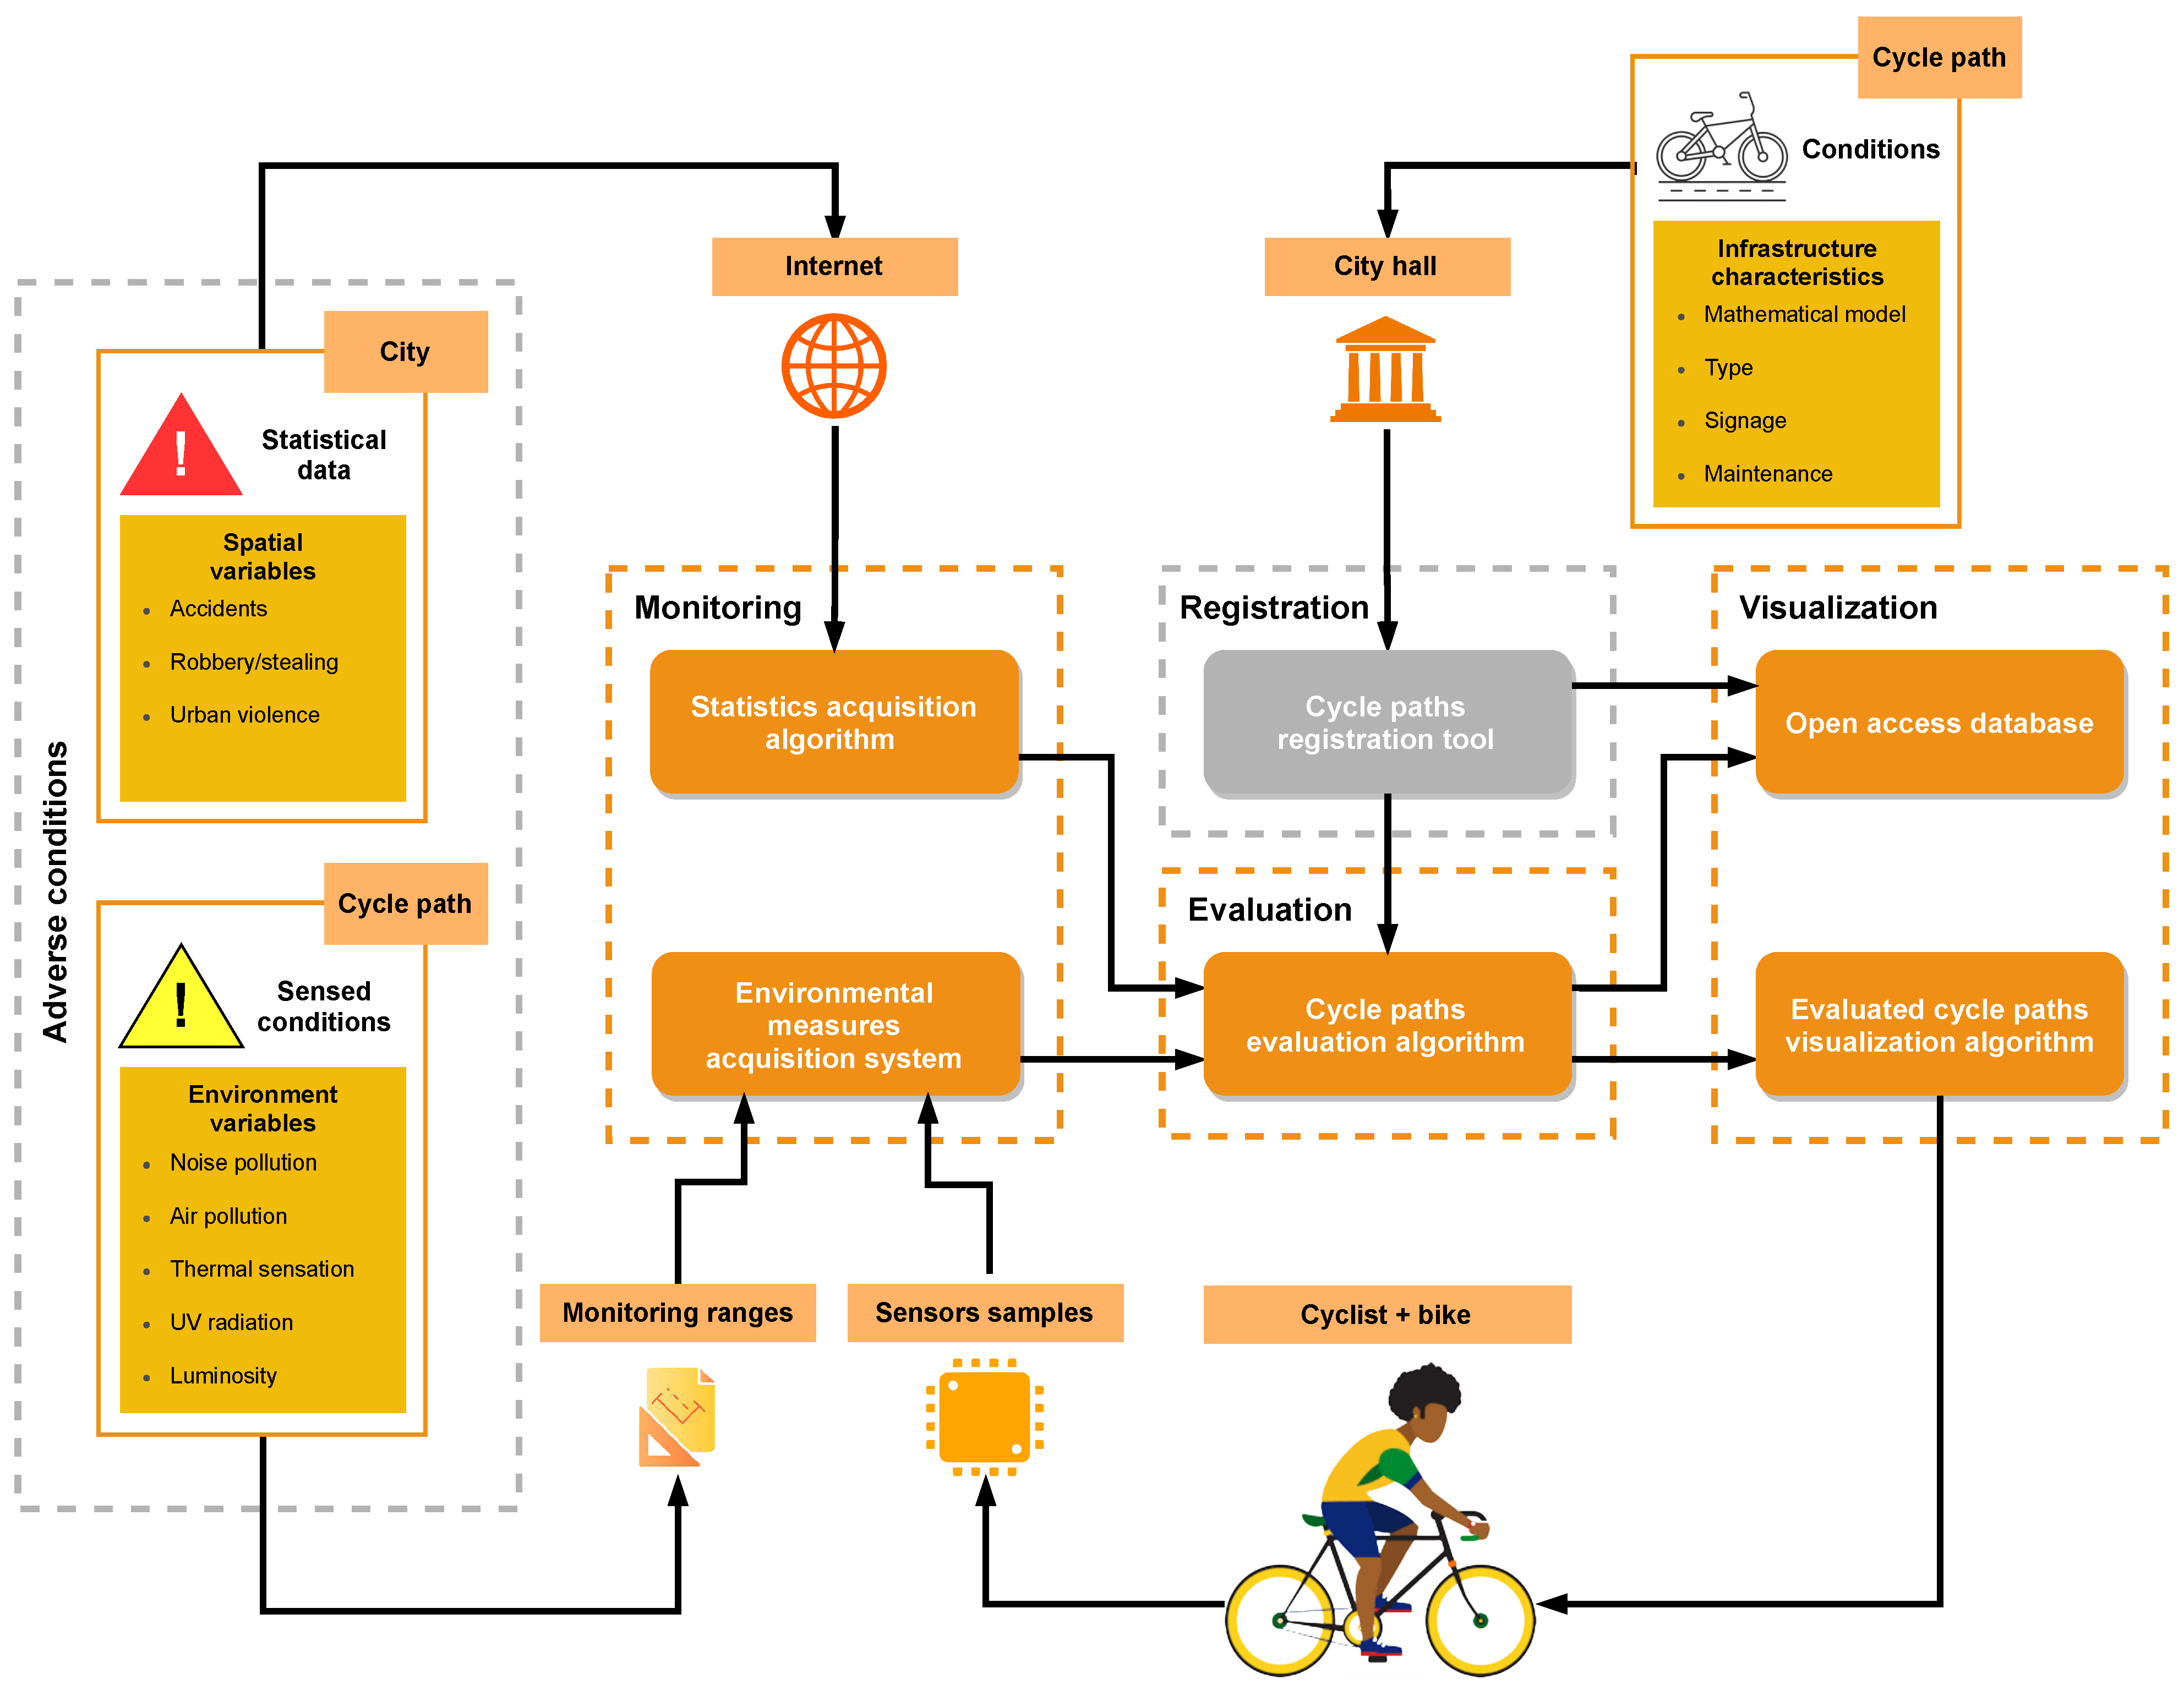
Considering all challenges mentioned earlier and requirements, we believe that the promotion of sustainable cycling will pass through the quality assessment of cycling paths in urban areas. For that, the processing cycle of monitoring, evaluation, and visualization has to be considered as a whole, as depicted in
Figure 1.
This article proposes the iBikeSafe, a comprehensive multi-tier approach that performs flexible monitoring, robust evaluation, and innovative visualization of the quality of cycling paths, being an effective solution to inform cyclists about adverse conditions and to indicate governmental policies should improve cycling areas. This proposal is also implemented as a particular system, assembling some independent modules into a unified multi-parameter system, the BrazilCycling, formatting the interactions of those modules for compatibility and performance issues. Finally, a case study is considered for the iBikeSafe-complaint BrazilCycling implementation, demonstrating how a city in Brazil could exploit the proposed approach to promote sustainable smart cycling.
The remainder of this article is organized as follows.
Section 2 presents some related works that influenced this article. The proposed iBikeSafe approach is described in
Section 3. A practical implementation for the iBikeSafe approach is described in
Section 4.
Section 5 presents a case study for the iBikeSafe, taking the city of Natal, Brazil, as reference. Finally, conclusions and references are presented.
2. Related Works
The daily lives of cyclists in a modern urban context can be subject many risk factors that can potentially degrade their health after long exposition periods. Additionally, large cities may also produce different dangerous situations that may affect safety while cycling, causing injuries or even death in the worst scenarios. Environmental factors that affect cycle paths (temperature, pollution, ultraviolet radiation, light, etc.) can subject cyclists to the development of several long-term health problems. In addition, unfavorable characteristics of the cycle paths (quality of the pavement, signage, etc.) and historical risks of accidents and urban violence occurrences (theft, robbery, etc.) may be indicators of immediate cycling dangers when moving on a city. Putting all these together, cycling in large urban areas may have some inherent risks that should be appropriately known, ultimately supporting the development of more sustainable cities.
Given the importance of understanding the nature and the spatial and temporal characteristics of such problems, the factors that may negatively impact the life of cyclists should be properly modeled. However, it is also extremely important to create tools that help cyclists when choosing their routes (based on concerns with their health/safety) and the development of applications that can guide public authorities when improving those cycle paths. In this context, the iBikeSafe comes as a multi-modular approach responsible for monitoring, evaluation, and visualization of the perceived quality of the cycle paths built in a city. This approach is composed of particular subsystems, which perform some defined activities related to the state-of-the-art in their respective areas.
For the “Monitoring module” of the iBikeSafe approach, two services are expected to be created. The first service is related to the data gathering of environmental conditions (variables), which will be performed by attaching multi-sensor units onto bicycles. Some concepts expected from such a service come from using the Internet of Things paradigm applied to monitoring systems. This type of IoT application is very recurrent in researches found in the literature. Thus, this section discusses some papers from this area that are related to how the Monitoring module was developed for the iBikeSafe approach (
Table 1).
In [
12], the authors focused on sensing the infrastructure conditions of cycle paths, using micro-controllers and sensors attached to bikes to identify imperfections on the surface of the cycle paths. Actually, this research line is focused on analyzing the infrastructure of cycle paths (or roads) through sensors, bringing some important contributions [
2,
13]. Differently, in [
14] a computational solution was developed to analyze infrastructural data aspects by coupling smartphones to bikes, allowing the collection of data from the GPS and the accelerometer devices already present in the smartphone, supporting the desired analysis.
In our previous work presented in [
15], we proposed the development of a system to monitor predefined environmental variables that affect the health and safety of cyclists. Additionally, in [
16] we proposed a framework for configurable mobile multi-sensor monitoring units that are capable of measuring both environmental and infrastructure variables.
Actually, as an essential characteristic to be remarked, some approaches in the literature need a network with Internet access to operate, while some works have a local storage scheme for the collected data, which can be automatically sent to a cloud service when the device connects to the Internet, as in [
15,
16]. It is worth mentioning that the assumption of constant (online) monitoring by connected bikes in a city may be unrealistic in many cases, either due to the absence of networking services or due to budget restrictions.
The second service of the iBikeSafe Monitoring module, described in the next section, is related to the gathering of urban statistical data present on the Internet, which may be associated with the area of Big Data. The data collected by this subsystem is related to the immediate risk conditions for cycling, which is extremely important to decide if a cycle path has an acceptable quality for safe and satisfactory cycling practice. For the development of this subsystem, it is proposed to create a web crawler to gather urban statistical data from the Internet and process it, formatting and exporting this information. Some literature have proposed such a data mining process targeted at urban data in different contexts. In [
17], the authors exploited this technique to search for some information in order to classify two cities based on safety, infrastructure, and health conditions. Similarly, in [
18] a research was conducted to collect general information from thirteen Indonesian cities in order to identify specific aspects.
In a different research line, the work in [
19] employed no particular tool to perform an automated search of accidents involving cyclists data in the city of Seoul. Instead, in that paper, data were collected manually by accessing a specific database to identify the safety level for cycling in that city. Although performing such data collection in a non-automatic way, the presented results and discussions in that work are relevant to mature the perception of quality evaluation of urban cycling, contributing to the development of this article.
Finally, in order to better describe and compare the presented related works, highlighting their main characteristics concerning what is being expected for the definition of the iBikeSafe approach,
Table 2 summarizes the discussed contributions following a uniform pattern.
Due to the comprehensive nature of the proposed iBikeSafe approach, only the Monitoring module and its two services are not sufficient to achieve the desired goals. Then, based on the premise of indicating the cycle paths quality for cyclists and the public authorities, the iBikeSafe approach also includes an Evaluation module, which exploits the Monitoring module data as input. This way, research works in those related areas were also considered, discussed as follows.
Implementing the iBikeSafe Evaluation module is crucial to create an important parameter when choosing cycling routes, letting cyclists correctly choose the best paths according to their quality (and not only distance, as usual). Such choice can be based on several aspects: something very personal or a common opinion among cyclists. Usually, they are concerned about travel on cycle paths that make cycling safe and enjoyable, preferring flat cycle paths with good signage, away from the roads and without irregularities [
2,
4,
20]. In addition, cyclists are also looking for safe and well-lit regions with favorable environmental conditions for cycling practice, opening up a wide range of parameters for evaluating cycle paths.
Knowing this, some researchers have already been concerned with developing solutions to evaluate cycle paths according to some of these mentioned parameters. In work presented in [
21], authors developed a metric to evaluate cycle paths, but without any system to automate this process. In that work, the authors considered ecological, social, environmental, and technical aspects in order to create a way to guide the city’s public authorities in cycle path planning. Differently, works presented in [
22,
23] employed an alternative methodology to evaluate cycle paths, based on surveys applied to defined cyclists populations. The average results are then used to evaluate the quality of cycle paths.
In our previous work published in [
24], we developed a metric for evaluating cycle paths based on Fuzzy logic, which is capable of qualifying them into five different levels based on environmental and infrastructure data. In that work, it is also proposed the development of an application that uses that metric to automatically and periodically evaluate cycle paths.
Table 3 summarizes the works for quality evaluation of cycle paths.
Since the proposed iBikeSafe approach will collect environmental and infrastructure data of cycle paths, through the Monitoring module services, and qualify it, using the Evaluation module service, it becomes possible to provide valuable data to the end-users: cyclists and governmental authorities. To achieve this final goal, the iBikeSafe approach also encompasses a module that provides a way to present the cycle path data and easily to understand. Composed of two services, the iBikeSafe Visualization module captures data from the Evaluation module to process it, generating maps and historical graphs, and making it available for users access (initially) through a web page.
The cycle paths data visualization by end-users is a crucial topic for works in research lines related to cycling conditions. In the literature, it is possible to find some papers that are based on the visualization of cycle paths, or routes taken by cyclists, through the use of web and/or mobile technologies and with different purposes.
In [
25], a web application was developed to allow users to access cycle paths maps, which are registered through the collection of data from volunteer cyclists in Madrid. In [
26], the authors performed research that is not limited to just one city, developing a mobile application for cyclists to register cycle paths, being able to indicate imperfections in those paths. Additionally, in that research, the city public authorities can access cycle paths information through a web page, allowing them to make decisions. Finally, in [
27], the authors created a digital cycling platform to influence casual cyclists to adopt bikes as their primary means of transport. In that work, a mobile and a web application were developed to present some route and cyclists information.
Table 4 summarizes works in this particular research area.
Therefore, as discussed in this section, the proposed iBikeSafe approach is composed of multiple services covered by different related works, although considering different strategies and technological methods. However, although some services are already addressed in the state-of-the-art, no previous solution has provided a comprehensive approach that encompasses all challenges of monitoring, evaluation, and visualization of the quality of cycle paths concerning adverse conditions for cycling, to the best of our knowledge.
3. Proposed iBikeSafe Approach
Developed to allow the monitoring, evaluation, and comprehensive visualization of cycle paths in urban environments, the iBikeSafe approach aims to indicate the perceived quality of any number of cycle paths in a particular city. As discussed before, such quality will be related to the potential damage that cycle paths may bring to the health and safety of cyclists. Therefore, this approach was carefully modeled to allow executing the expected functions in a flexible and scalable way.
The first goal of the iBikeSafe approach is to perceive adverse conditions that negatively impact the cycle paths quality from the cyclists’ health and safety point of view. To make it possible, the iBikeSafe structure comprises the Monitoring module, which provides two services capable of collecting adverse conditions data through mobile sensing and web crawling techniques.
Since iBikeSafe can collect data that may directly or not affect the cyclists, it is necessary to transfer data to the Evaluation module. Then, that module can group the information retrieved from the Monitoring module, processing it through a cycle path qualification service. After that, it is possible to generate easy-to-view data for cyclists and public authorities, employing visual resources like maps and graphs.
The generation of data for visualization purposes is the expected service of the Visualization module. Composed of a function for generating maps and graphs of cycle paths and a function responsible for making such data available through the Internet, this last module of the iBikeSafe approach is crucial in the sense that it provides the ultimately required information to support sustainable smart cycling.
Therefore, this section defines the conceptual modules and the expected services of the proposed iBikeSafe approach.
3.1. Monitoring Module: Environmental Sensing
The use of mobile monitoring units attached to the most diverse objects or people (wearable systems) is a very current and common practice due to the emergence of the Internet of Things. Therefore, researchers worldwide are looking for intelligent solutions aimed at improving the practice of cycling through innovative cycling tools, which have a wide range of applications focused on characteristics such as planning, monitoring, and qualification of cycle paths, among others. In this sense, some solutions focused on monitoring cycle paths have been developed based on the integration of IoT technologies with bikes, eventually supporting the creation of the Internet of Bikes (IoB) concept.
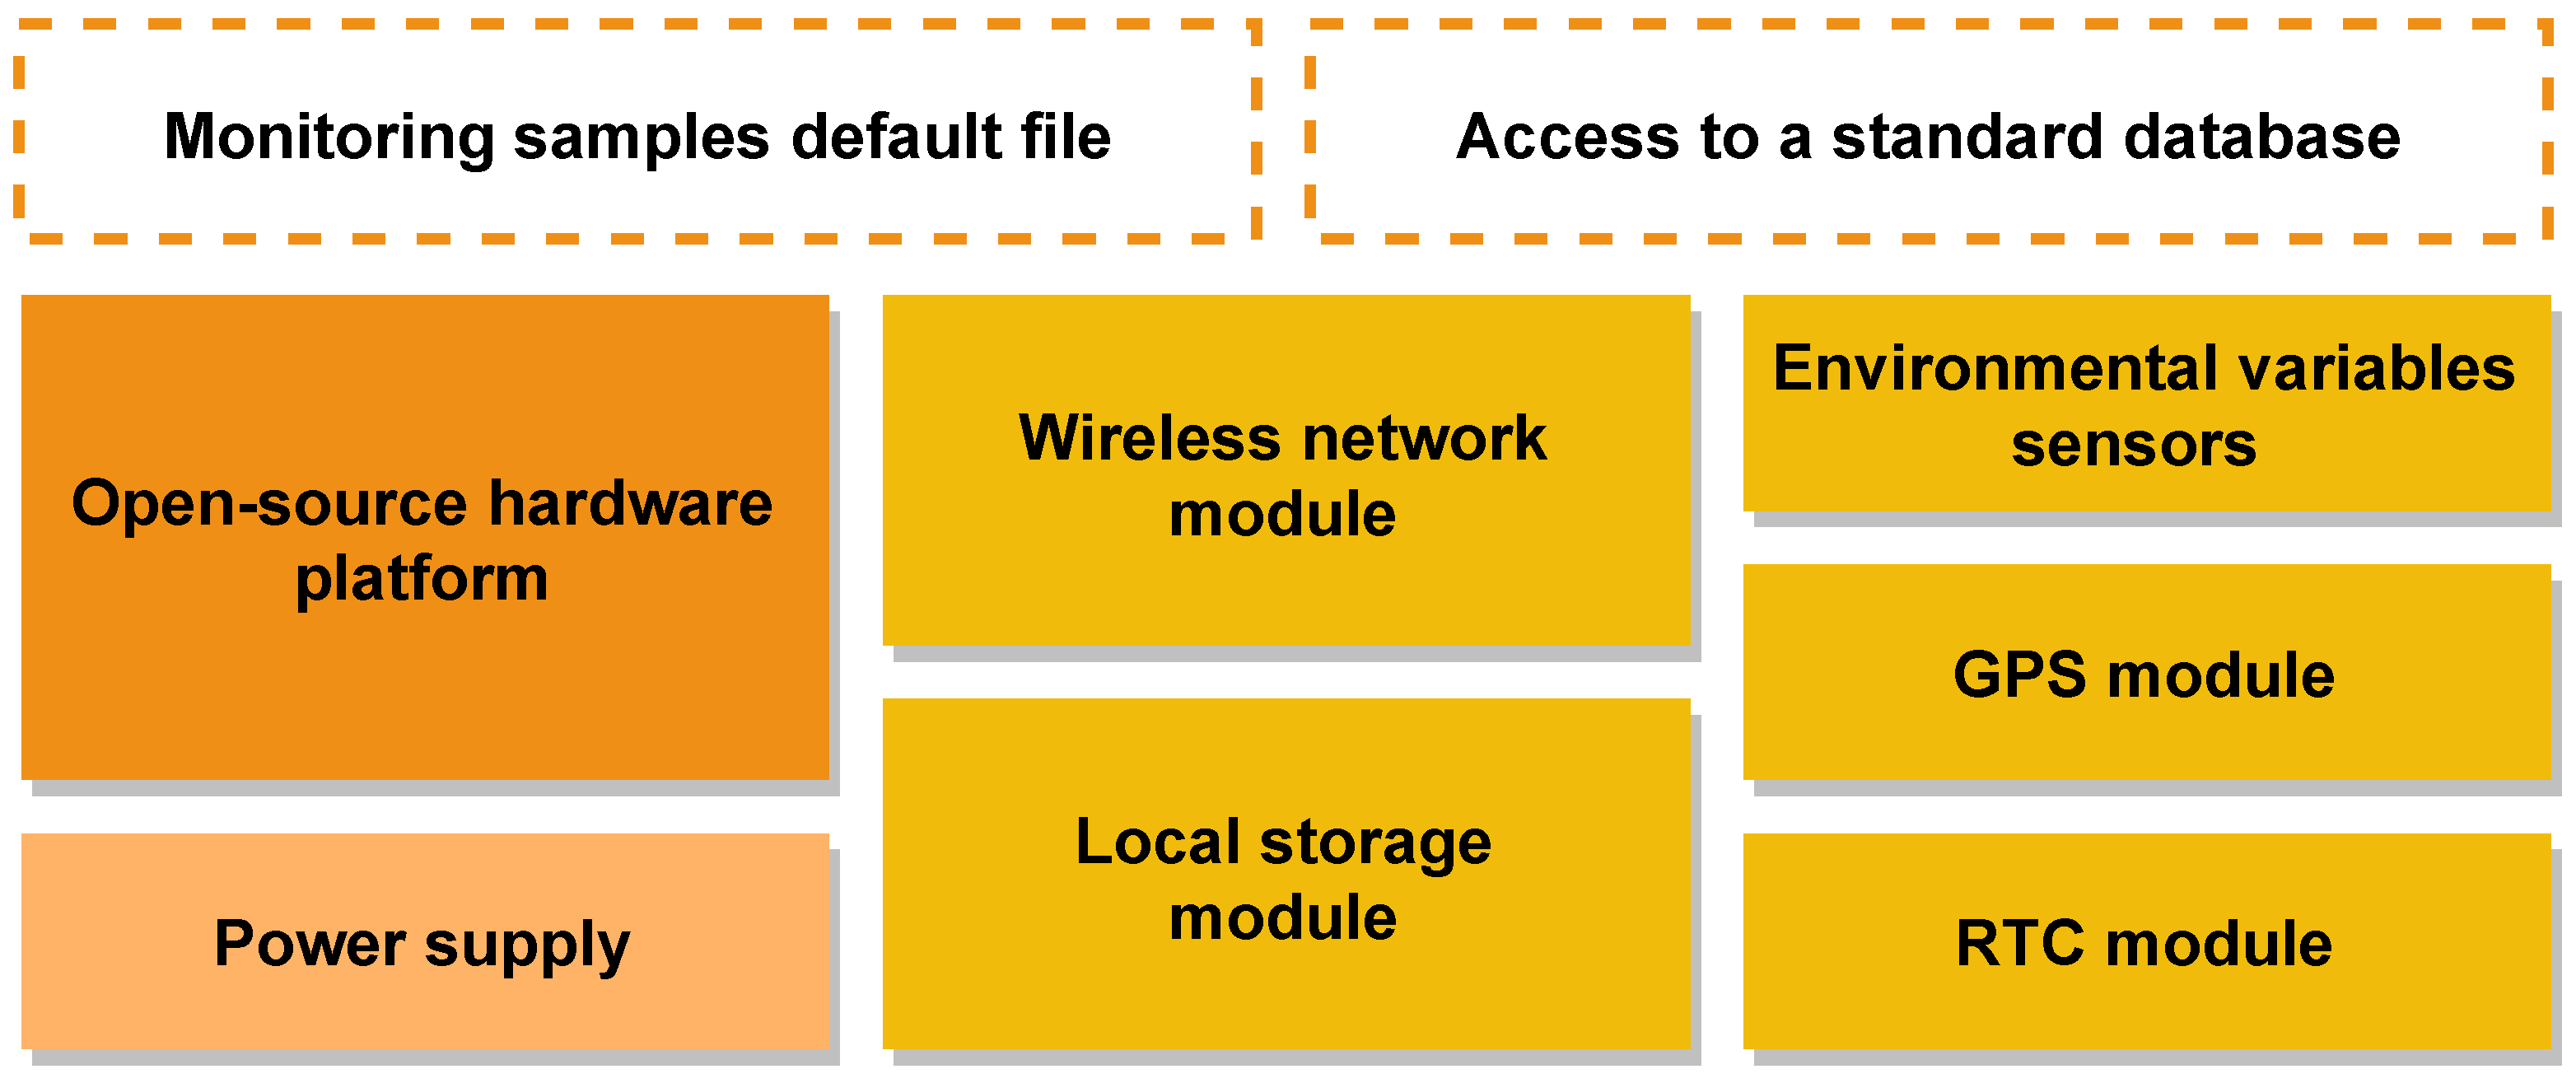
In this way, one of the iBikeSafe services was defined to be responsible for capturing the adverse conditions of cycle paths related to environmental variables that negatively impact the cyclists’ lives. Furthermore, such service was associated with the definition and eventual creation of a mobile sensing unit to be attached to bikes, following a set of fundamental requirements (
Figure 2).
Inserted into the iBikeSafe sensing unit to perform all basic device operations (
Figure 3), the open-source hardware platform is the core of the proposed device, having a direct connection with all other components presented in
Figure 2. Furthermore, this component is intended to have low-power consumption and low-medium computing capacity, being a small dimensions board. Following these definitions, we can mention some affordable off-the-shelf open-source hardware platforms that can be employed, such as microcontrollers (Arduino, ESP8266, PIC, Raspberry Pi pico, etc.) and single-board computers (Raspberry Pi 2/3/4, Beaglebone, etc.).
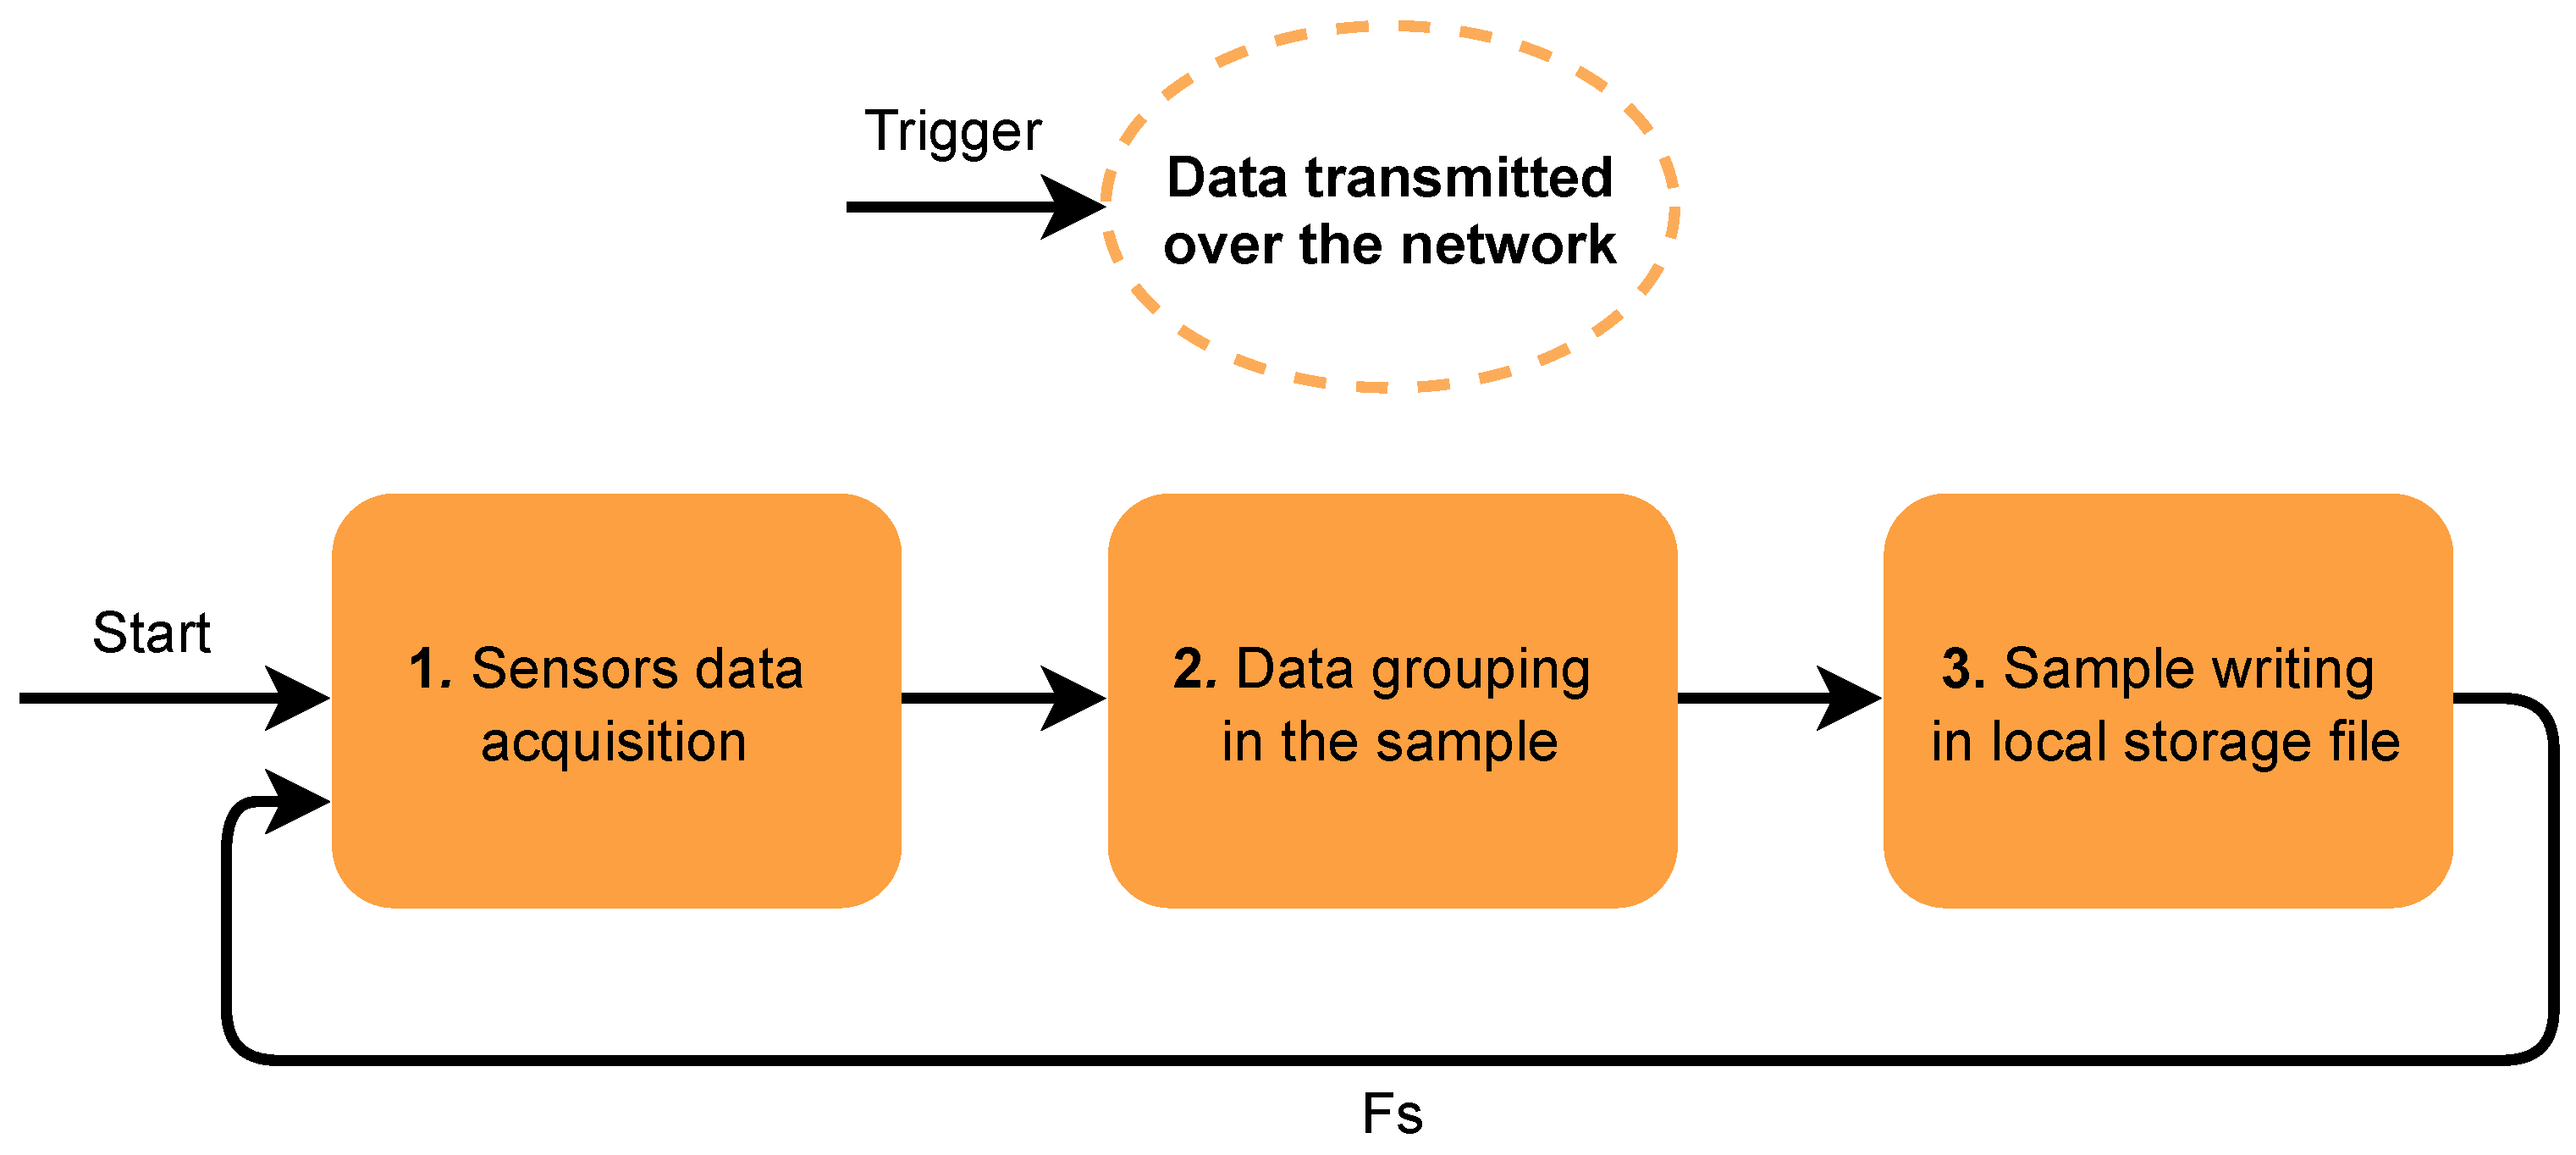
In order to use one of these open-source hardware platform options as the iBikeSafe sensing unit core, it is necessary to develop a firmware capable of running the state machine presented in
Figure 3. That firmware should work based on the intermittent execution of three states, according to a iBikeSafe approach implementation. For this execution, a variable sampling frequency
was defined to represent the interval between the execution of the three synchronous states defined for a generic mobile sensing unit [
16].
The first synchronous state of the sensing unit consists of reading the data from the sensors and modules, as depicted in
Figure 2 (GPS, RTC, and environmental variables sensors), converting the data to a known information type (latitude, longitude, date, time, temperature, humidity, UV radiation, etc.). After collecting this information, the firmware running on the sensing unit core groups that data into a “sample”, identified by a timestamp. In addition, this sample has the location of the cycle path stretch from where the sample was acquired, as well as the environmental data for that geolocation and time.
After grouping a particular sensing data into a sample, this group of information is written in the last line of a dd-mm-yyyy.csv file present in the local storage module, which contains all daily monitoring files not uploaded yet. As presented in Listing 1, such “samples file” stores the sensing samples that have not been transmitted yet to the (cloud) database, having its first line dedicated to defining which environmental variables are being informed through an identifier i, with and . The variable E defines the maximum number of different types of sensing data (temperature, humidity, pressure, UV radiation, etc.) that is being considered in a system, and, of course, it requires a previous mapping between any id i to a particular sensing data type.
| Listing 1: An example of a samples file containing some monitoring samples generated by the sensing unit. |
| |
| 1 2 3 |
| 17:39:00 | −12.282060 | 12.060282 | 29.8 | 73 | 100 |
| 17:40:00 | −12.282061 | 12.060282 | 29.8 | 73 | 100 |
| 17:41:00 | −12.282062 | 12.060282 | 29.8 | 73 | 100 |
| 17:42:00 | −12.282063 | 12.060282 | 29.8 | 73 | 100 |
| 17:43:00 | −12.282063 | 12.060282 | 29.8 | 73 | 100 |
| 17:44:00 | −12.282063 | 12.060282 | 29.8 | 73 | 350 |
| 17:45:00 | −12.282063 | 12.060282 | 29.8 | 73 | 100 |
| 17:46:00 | −12.282064 | 12.060282 | 29.8 | 73 | 100 |
In all lines of the samples file excepting the first one, the samples grouped in the execution of state two are presented (
Figure 3). Since each bike may have a particular configuration of enabled sensor devices attached to it, multiple sensing configurations may be used in a city. Thus, for a particular bike
b in the system, for
and
, for a total number of
B bikes, there will be a set of possible variables that can be measured by a monitoring unit attached to that bicycle, which is
,
,
,...,
, having
as the variable
E for bike
b.
Therefore, for each sample line in the samples file, we have the following order of information: time, latitude, longitude,
,
,...,
, which are all separated by a blank space. Since the sensing unit core collects and stores the samples, following the defined states, sending this collected data to a unified database in the Cloud becomes possible. For this, an asynchronous state capable of sending data through a wireless network (WiFi, GSM, Bluetooth, LoRaWAN, etc.) was created, being responsible for forwarding the information to the Cloud service that contains the database. The activation of this state, described in
Figure 3, is triggered according to the iBikeSafe implementation, which can be a device button, an upload interval, or other defined condition.
This way, according to the features defined for the proposed sensing unit, it becomes possible to attach several units to bikes to collect data in a myriad of cities around the world, taking into account the sensing particularities of each considered city. Such data are one of the groups of information required for quality evaluation, as discussed in the following subsections.
3.2. Monitoring Module: City Statistics
Unlike the sensing service of the iBikeSafe approach, the cities statistical data service does not have physical units attached to bicycles to collect the necessary information. Differently, this service is proposed to have several Internet databases as its information source, such as public databases from news corporations and police or government open databases. So, to collect statistical data that indicates some historical risk to cyclists’ health and safety, this iBikeSafe Monitoring module service proposes the use of algorithms capable of automatically and periodically searching for this information in some previously defined databases present on the Internet.
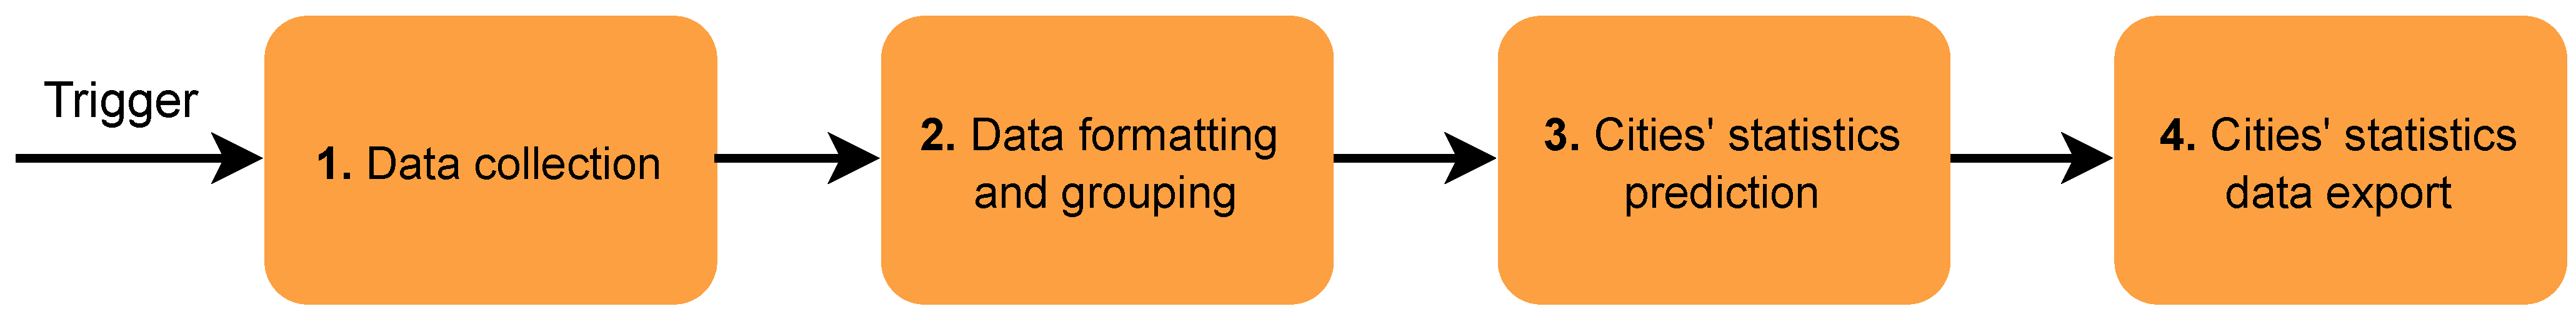
In order to perform this function satisfactorily, retrieving truthful and reliable data, a set of operations was defined, as described in
Figure 4.
Following a periodically triggered process, with the frequency defined according to the iBikeSafe approach implementation, the algorithm responsible for collecting cities’ statistical data (that impacts the cyclists’ life and safety) has four well-defined states. In the first state, it was proposed that the service uses some automated data collection tool, such as a web crawler, to capture the necessary information in the Internet databases, covering the entire web or only a defined specific set of databases.
Once the search engine collects the data, the algorithm moves to the second state. Then, the collected data are formatted and grouped according to the referring city and later sent to the third state of the algorithm, which will count all data by city, predicting the numbers for each statistical variable and generating a CSV file as the example presented in the Listing 2, referred as the “statistics file”.
| Listing 2: An example of a statistics file containing information about the monitored cities. |
| |
| 1 2 |
| Feira_de_Santana-BR | 5 | 3 |
| Salvador-BR | 3 | 5 |
| Amsterdam-NT | 0 | 1 |
| New_Delhi-IN | 6 | 7 |
The file containing the monitored cities statistics has a pattern name based on the data collection period. Thus, for a monthly monitoring period, we have the mm-yyyy.csv statistics file. As for the file content, we have the first line informing the identifiers j, with and of the statistical variables , with variable S representing the maximum number of different types of statistical variables (robbery/theft, urban violence, traffic accidents, etc.) that are being considered in the statistical data collection system and mapped to a specific id j. Additionally, for the following lines after the first one, we have the statistics of each monitored city formatted the pattern: city name and country code, and .
With the achieved statistics stored in that file, the algorithm that implements the statistical data collection service executes its last state, uploading this file into a Cloud database for use by the Evaluation module. Once the data collected by the Monitoring module, through both the sensing and statistical data collection services, are sent to their respective databases, the Evaluation module is capable of qualifying the cycle paths for a given monitoring period, as will be further explained.
3.3. Evaluation Module
Created to qualify cycle paths according to the adverse conditions captured by the Monitoring module, the Evaluation module performs its function based on the registered cycle paths and the data provided by the Monitoring module. For this, the service responsible for executing this function of the iBikeSafe approach must be able to import the monitoring data from the already discussed databases, importing the cycle paths structural data and processing it to evaluate the cycle paths to the iBikeSafe implementation.
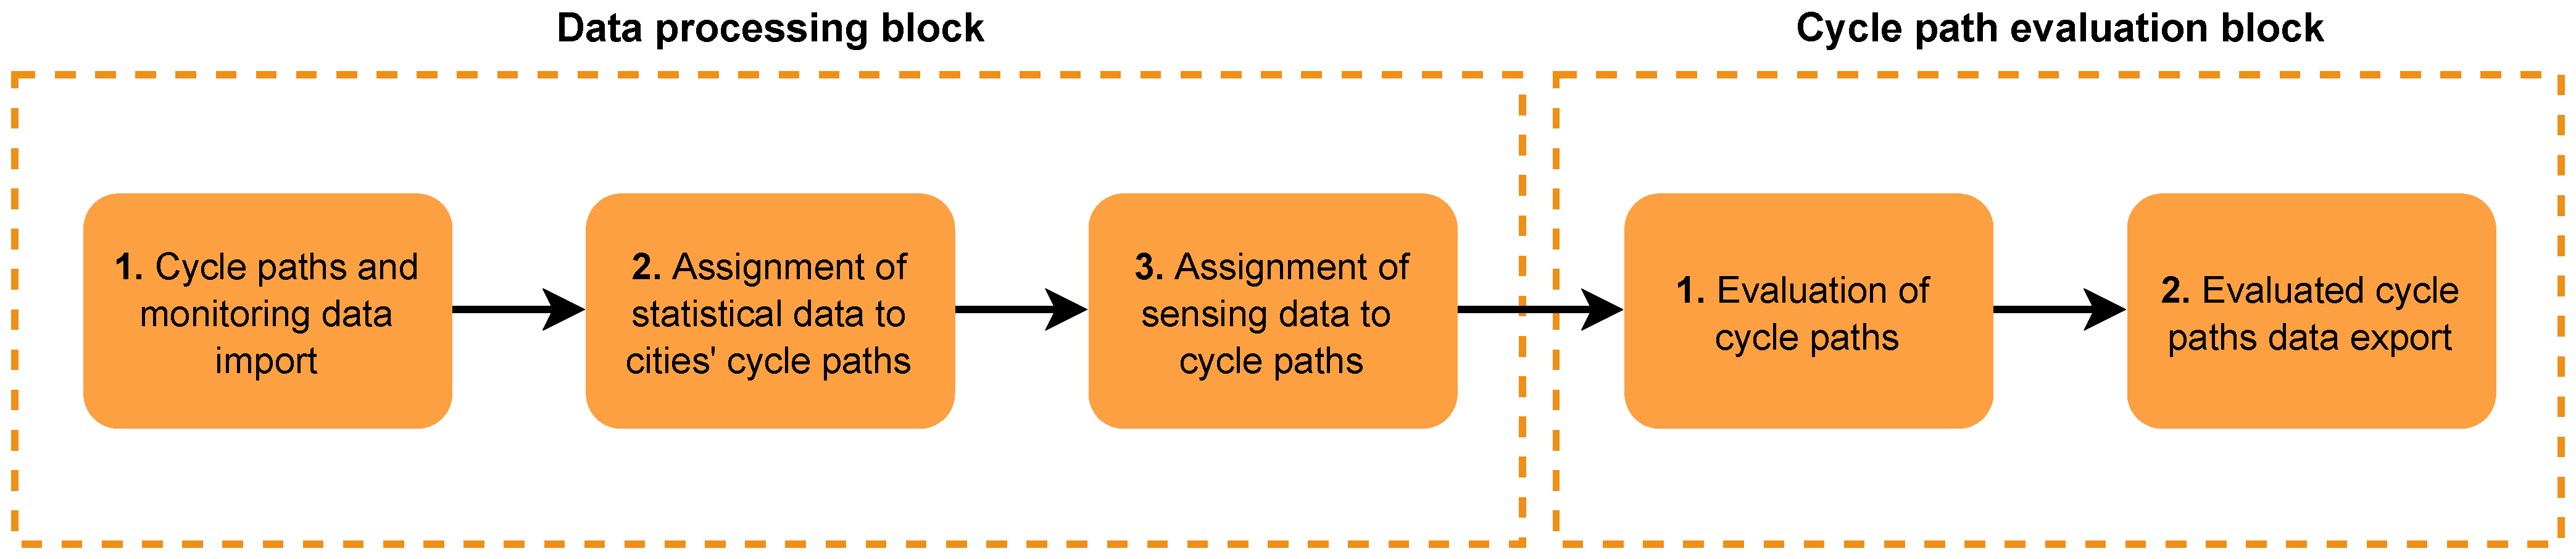
So, for a better understanding of the functioning of this service, a state diagram was created and divided into two blocks, as presented in
Figure 5: The data processing and the cycle path evaluation blocks.
In the states of the first block, the iBikeSafe approach evaluation service performs three operations. First, the proposed algorithm must be able to import the data from both the Monitoring module and the cycle path registration subsystem, which can be a manual input tool accessed by cities’ public authorities, as illustrated in
Figure 1, or an automatic data collection tool from an existing Internet databases, such as the CycleOSM.
After importing the necessary data for cycle paths evaluation, it is necessary to execute the following two data processing states. These states consist of attributing the statistics of a given city to all its registered cycle paths, taking as reference a city’s name comparison, and assigning sensing data to the cycle paths corresponding to geolocation data of each sample. Once these data are processed, each registered cycle path will have its respective data, allowing the execution of the evaluation block states.
The iBikeSafe cycle paths evaluation service uses the monitoring data associated with the registered cycle paths to qualify it, exploiting a technique used for a specific approach implementation. Hence, this approach allows the evaluation of the cycle paths in different ways, being able to use only mathematics or applying artificial intelligence techniques, and generating different quality indicators, such as quality levels, color patterns, and numerical grades.
However, only the cycle paths evaluation does not fulfill the expected goals of this approach, which is to provide valuable and easy-to-use data about the cycle paths quality concerning its potential damage to the cyclists’ health and safety. Thus, there is a need for a second state for the cycle path evaluation block, which is the grouping of all evaluated cycle paths according to any particular iBikeSafe implementation to transmit it to the last specified module, which is the Visualization module.
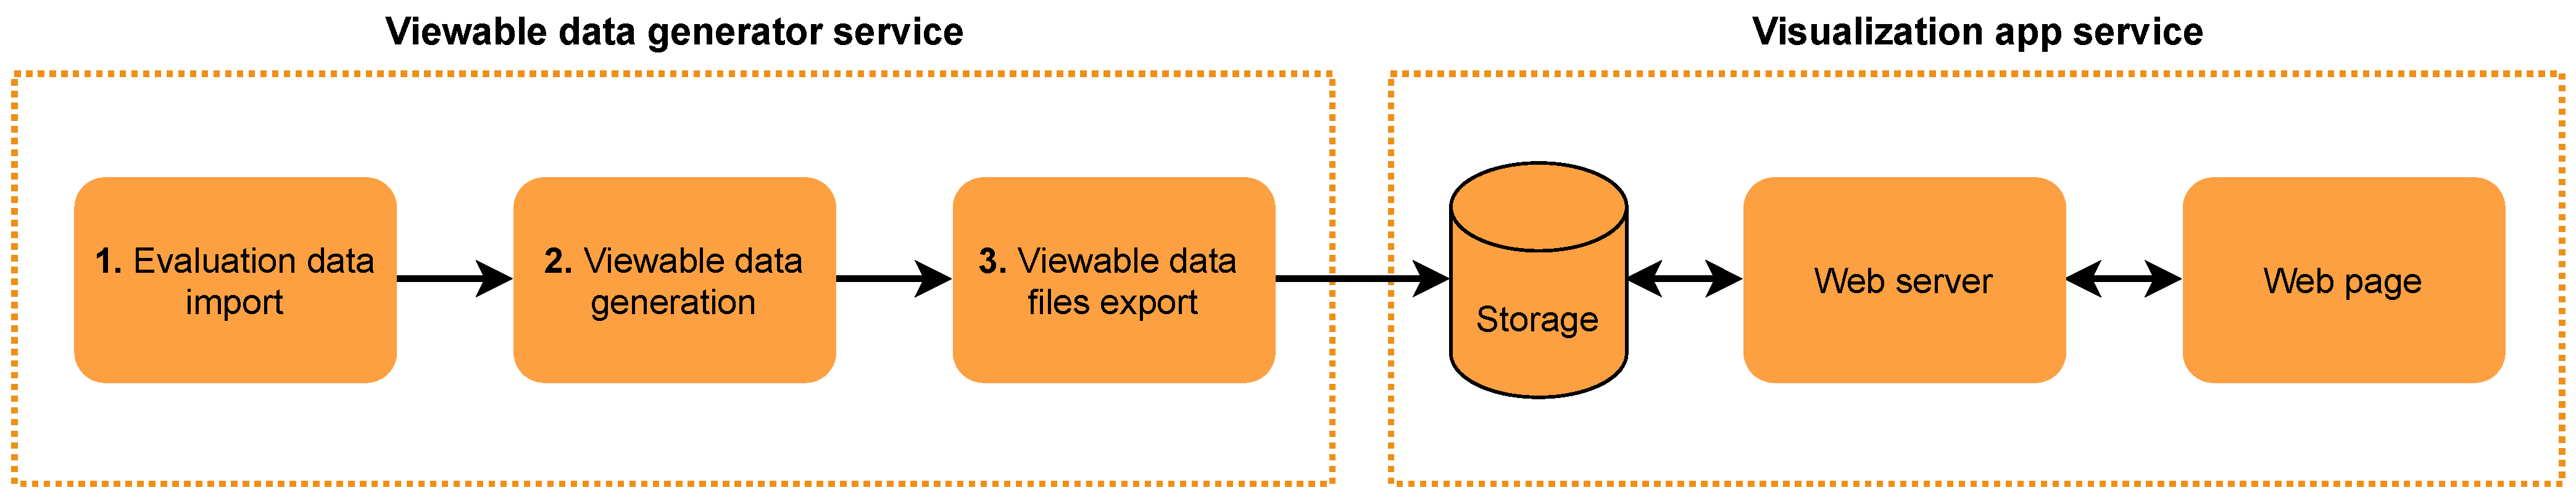
3.4. Visualization Module
Designed to support the visualization of the quality of cycle paths, the Visualization module of the iBikeSafe has two well-defined services. The first service, called “viewable data generator”, is responsible for getting the data from evaluated cycle paths, exported by the Evaluation module, and generating files with the viewable data from the cycle path. Such files will then be transmitted to the second service, which defines the generic functions of a flexible visualization app.
All data generated by the first iBikeSafe Visualization module service (maps, graphs, numerical data, etc.) is stored in files identified by the cycle paths evaluation period. The visualization app can access this data to process it for better presentation, showing them to the users according to defined search queries.
Figure 6 presents the general functioning of this module, which is based on the integration of the two proposed services.
Finally, as discussed in this section, the proposed iBikeSafe approach defines a set of modules and services to guide implementing of any quality evaluation system targeted at cycle paths. Actually, in order to implement this approach according to the needs of any particular city, it is essential to highlight that those different requirements will demand different programs and hardware components. Therefore, in order to illustrate a practical application for the iBikeSafe, the following section will present a particular implementation of the proposed approach, focused on quality evaluation of cycle paths in Brazilian cities.
4. BrazilCycling: A Implementation of the iBikeSafe
Based on all defined procedures in the iBikeSafe approach, a particular implementation was designed to demonstrate how it can be used practically. Such implementation, referred to as BrazilCycling, is based on previous works of the authors and additional specifications, being described as follows:
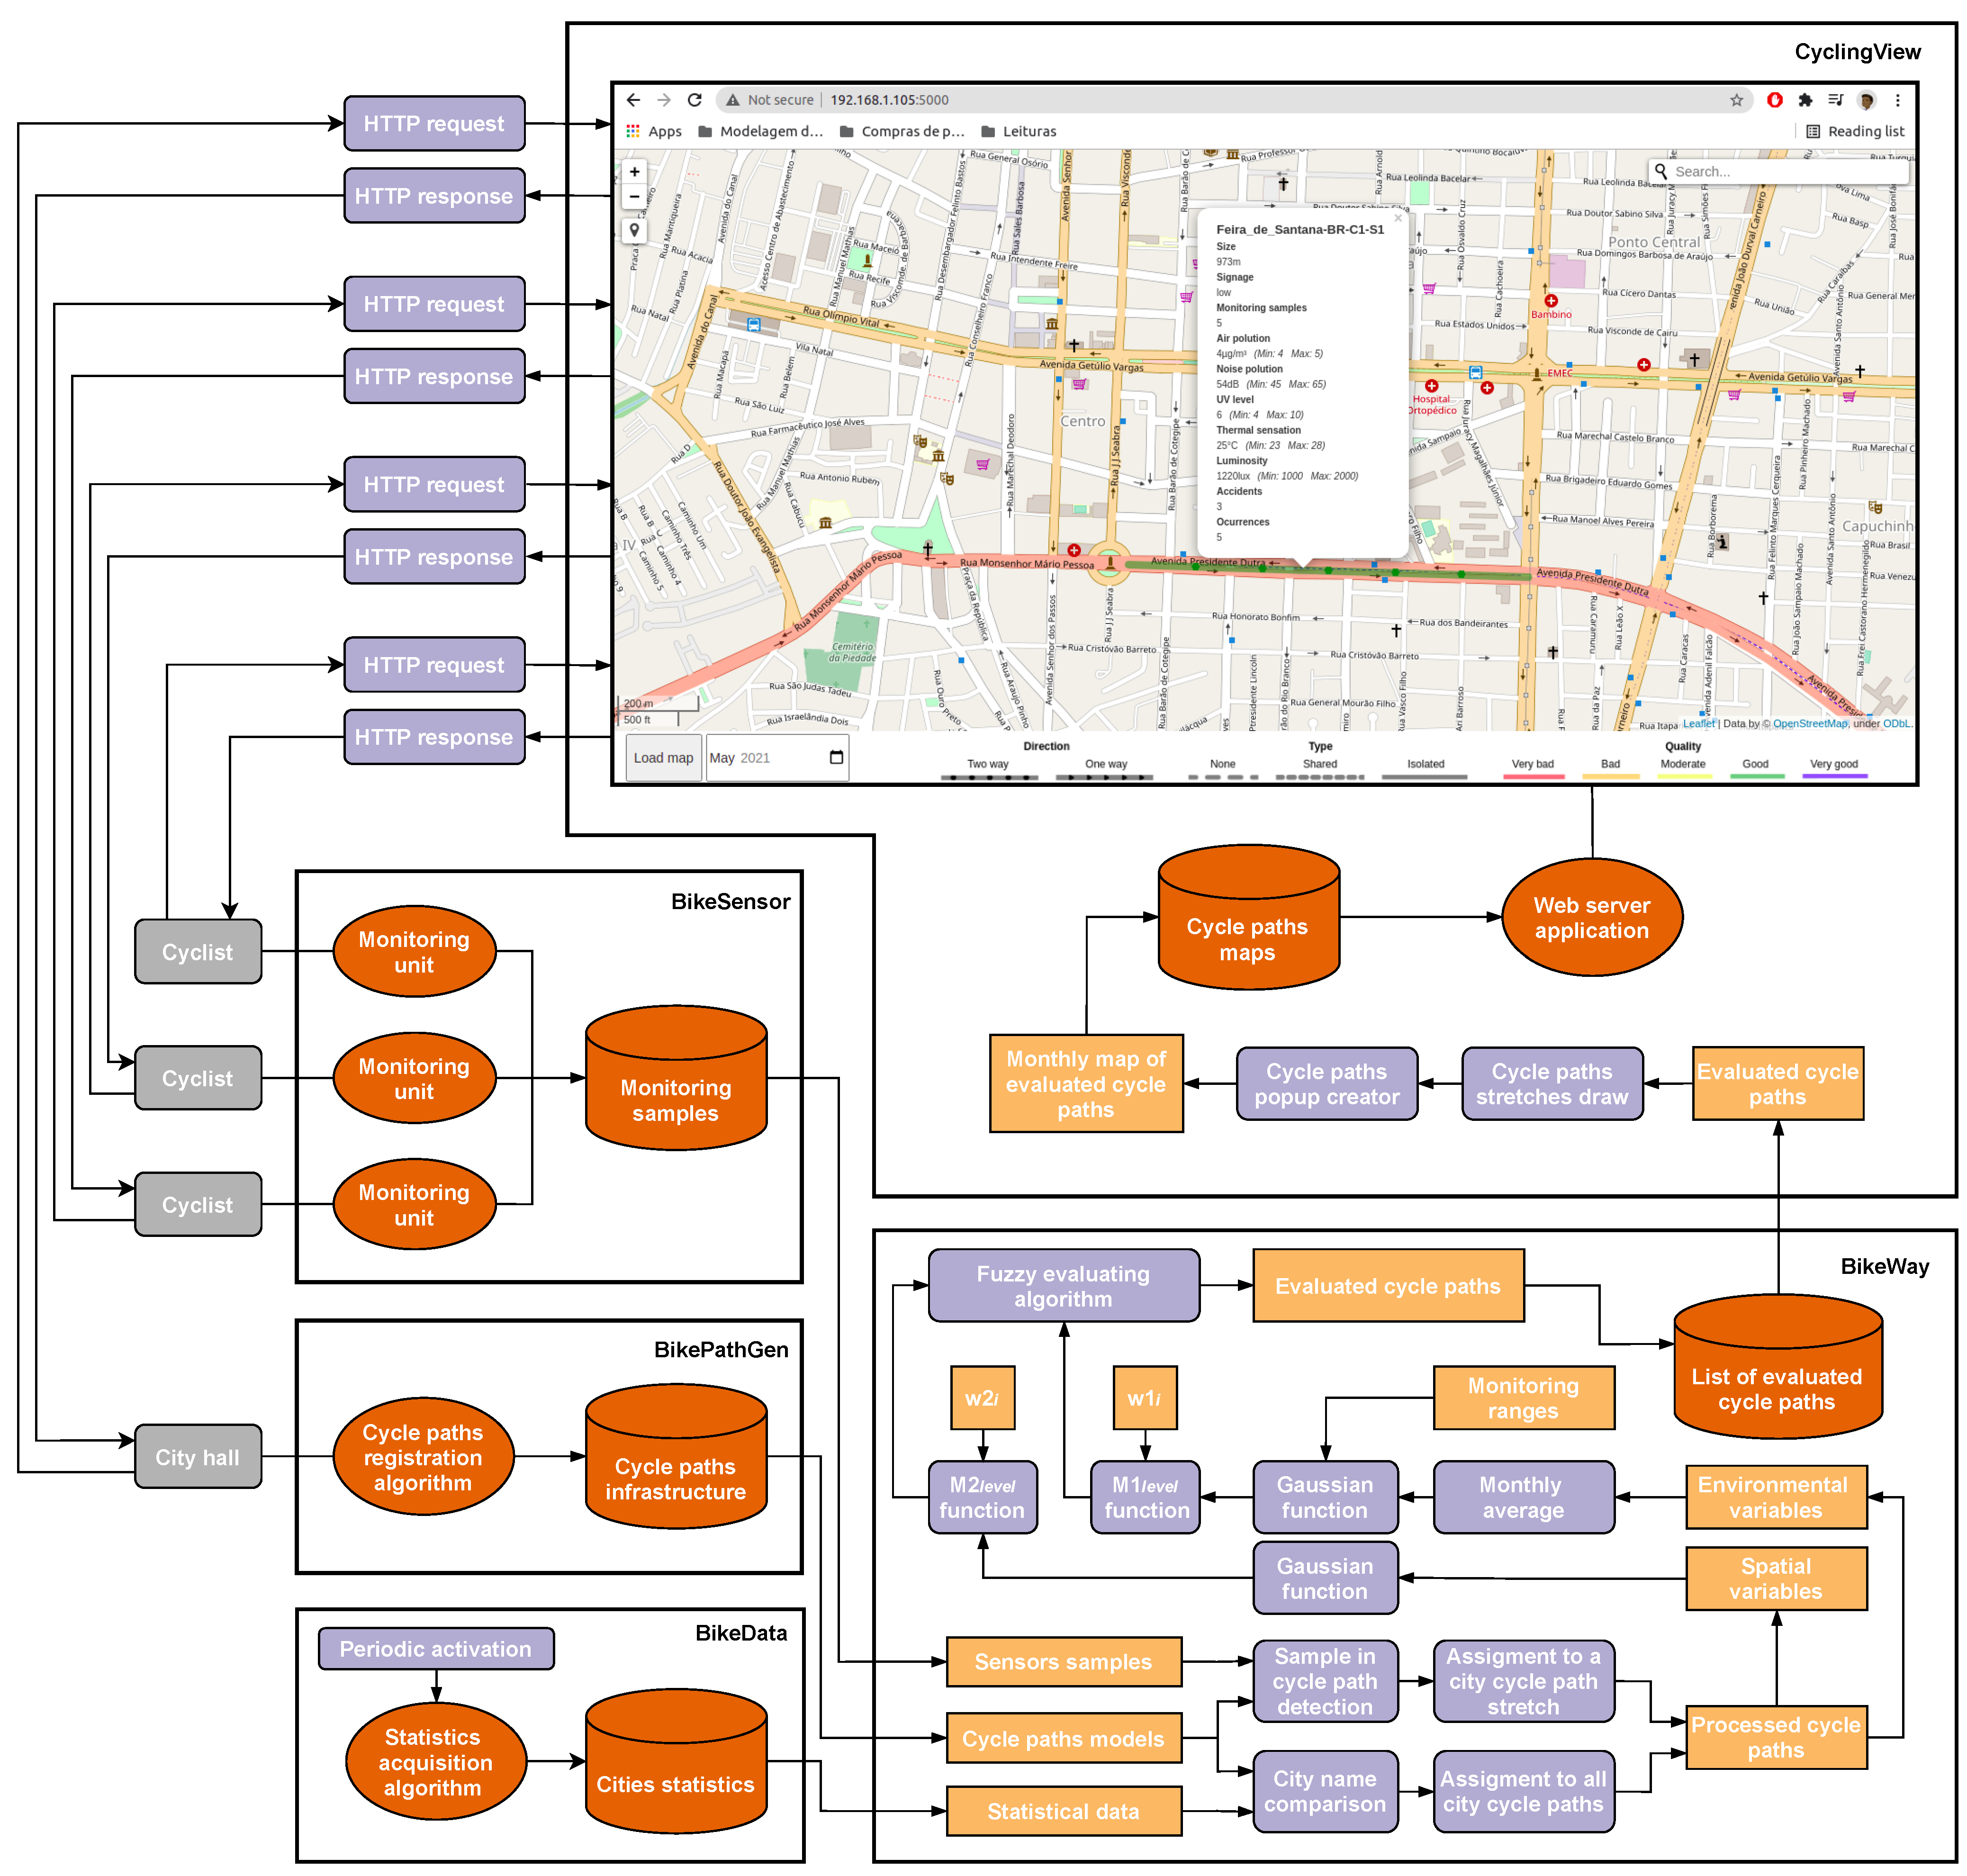
Figure 7 demonstrates the integration details of all subsystems in the iBikeSafe-complaint BrazilCycling implementation.
The following subsections provide an overview of each subsystem that composes the BrazilCycling implementation.
4.1. Monitoring Module: BikeSensor and BikeData
Composed of two similar services, the Monitoring module of the iBikeSafe approach is responsible for capturing information related to adverse cycling conditions, as discussed before. For the BrazilCycling implementation, the subsystems used to compose those services are known as BikeSensor and BikeData.
The BikeSensor consists of a system designed to collect environmental information such as air and noise pollution, temperature, humidity, ultraviolet radiation, and luminosity, exploiting for that Mobile Monitoring Stations (MMS) attached onto bikes. Each bike has an MMS attached to it, which periodically senses the environment and eventually transmits such sensed data to a Data Central Unit (DCU). Once the data collected by the MMS is sent to the DCU, it becomes accessible to various consumer applications, such as the cycle paths evaluation service expected to be provided by the iBikeSafe approach. Those consumer applications are referred to as BikeSensor Client (BSC) [
15] in the BrazilCycling implementation.
Considering the BikeSensor central logical unit, the Mobile Monitoring Station is defined from a multi-sensor hardware framework to support the development of adaptable monitoring units for mobile applications, as defined in [
16]. The definition of this framework makes the MMS fully adaptable to support any set of variable environmental monitoring sensors, which are identified from a basic configuration in a system file read at the beginning of the MMS firmware execution [
16].
In addition to the sensor set dynamic configuration implemented by the MMS firmware, it is also responsible for running different processing states. The IDLE state puts the MMS into a standby state, making its power consumption low and saving battery power. When entered in the IDLE state, the MMS can change to the MONITORING state when the cyclist presses a specific button.
In the MONITORING state, the MMS performs the synchronous states presented in
Figure 3, which allows the collection of georeferenced environmental data samples, as well as the writing of these samples in a file in the same way as presented in Listing 1. This way, the synchronous states are executed at a frequency
until the cyclist intervenes, which places the MMS in the IDLE state when pressing the monitoring button again.
The cyclist can press another button from the IDLE state, which moves the MMS firmware to the SETUP state, connecting it to a WiFi network via the WiFi Protected Setup (WPS) protocol. Since the MMS has unsent monitoring samples files and it is connected to the Internet, the MMS state machine changes to the UPLOADING state, triggering the execution of the asynchronous state presented in
Figure 3, transmitting the files to the DCU.
Therefore, with the execution of these logical states by an MMS, it is possible to implement all the minimum requirements defined for the iBikeSafe sensing service. In addition, the architecture presented in
Figure 2 was also satisfied, since the following parts represent the necessary components: Raspberry Pi Zero HW (open-source hardware platform + wireless network module + RTC module), 5 V 2.5 A regular 2600 mAh battery (power supply), SD class 10 card with 8 GB (local storage module), GY-NEO6MV2 (GPS sensor) device and environmental sensors.
The BikeData system also has a well-defined structure that is presented in
Figure 7. This system implements a web crawler that is monthly activated in order to execute the states presented in
Figure 4, searching cities’ statistical data (traffic accidents, robbery/theft, and urban violence), formatting and grouping it, predicting city statistics and exporting it to a database following the file format presented in Listing 2.
With the functioning of these two systems, the Monitoring module has been fully represented for this implementation of the iBikeSafe approach, generating data to be used in the Evaluation module.
4.2. Evaluation Module: BikeWay
BrazilCycling defines the BikeWay evaluation system as the Evaluation module service of the iBikeSafe approach. This system is responsible for combining environmental sensing and city statistics data in order to qualify cities’ cycle paths using Fuzzy logic and following the steps presented in the
Figure 5 [
24].
The first step performed by the BikeWay system consists of importing data from the Monitoring module (BikeSensor and BikeData, for this implementation) and from the cycle path registration subsystem, which in this implementation is named as BikePathGen, a system capable of allowing public authorities to register their cities’ cycle paths by marking points on a map available on a web site, as presented in
Figure 7.
Once the BikePathGen registers the cycle paths, their mathematical models (defined as undirected graphs with vertices represented by the geographic coordinates and the edges represented by the cycle paths stretches) are exported to a database in city-named files with the content exemplified in Listing 3.
| Listing 3: an example of a cities’ cycle paths file. |
| |
| { |
| "statisticDataWeights": [0.3, 0.3, 0.3], |
| "monitoringDataWeights": [0.2, 0.2, 0.2, 0.2, 0.2], |
| "paths": [ |
| { |
| "ID": "Feira_de_Santana-BR-C1", |
| "constructionDate": "01/02/2021", |
| "maintenanceDate": "01/03/2021", |
| "inspectionDate": "01/03/2021", |
| "creator": "gov", |
| "stretches": [ |
| { |
| "ID": "Feira_de_Santana-BR-C1-S1", |
| "P0": [-12.259720085744956, -38.96384053644054], |
| "P1": [-12.259990743034352,-38.95488161248777], |
| "type": 1, |
| "direction": 0, |
| "signage": 1 |
| } |
| ] |
| } |
| ] |
| } |
With all the necessary data to evaluate the imported cycle paths, the BikeWay system executes an information pre-processing step. First, the cities’ statistical data is assigned to all cycle paths present in the imported files from BikePathGen by comparing the cities’ names, with the name pattern being equal to that followed by the statistical data collection service.
In addition, the BikeWay system verifies if all samples collected by the BikeSensor belong to one of the cycle paths registered by the BikePathGen. This verification is done by calculating the distance between a sensing sample in a particular city and the stretches of all city’s cycle paths. Since this distance is less than d, the sample is considered to belong to the cycle path stretch, with d is a configuration parameter usually defined as a few meters.
After pre-processing the information, each stretch of each registered cycle path has statistical data and a set of samples related to it, making it possible to apply the evaluation metric following the steps presented in
Figure 7.
First, statistical data are grouped into a category named BW-Infrastructure, consisting of spatial variables. Meanwhile, the sensing data compose the BW-Environment group, categorized by environmental variables. Then, it is calculated the monthly average from the samples of each cycle path stretch. After grouping these variables, the system has monthly indexes for each variable in both groups. However, these variables have different value ranges, complicating the execution of the system’s next steps. Thus, Gaussian functions were defined for each variable to translate their respective values to a limit from ”0.0” (best) to ”1.0” (worst) [
24].
With the values translated to equal ranges, the BikeWay system advances to calculate the impact levels of each group on the cyclists’ health and safety, which are: (BW-Environment) and (BW-Infrastructure). These levels are calculated through the weighted average of its variables that have the weights and , presented in the Listing 3 as ”monitoringDataWeights” and ”statisticDataWeights”.
After processing the levels of both groups, in the range from “0.0” to “1.0”, these values are sent to the Fuzzy BikeWay classifier. In that, the groups levels of all cycle paths stretches are processed, resulting in a quality index based on five levels: very bad, bad, moderate, good and very good. With all cycle paths evaluated by their stretches, the last step to be performed by the BikeWay system for the monthly cycle paths evaluation is to export the data to the Visualization module. For this, files are generated for each city following the BikePathGen files name pattern and with the content exemplified in Listing 4.
| Listing 4: An example of cities’ evaluated cycle paths. |
| |
| { |
| "paths": [ |
| { |
| "ID": "Feira_de_Santana-BR-C1", |
| "constructionDate": "01/02/2021", |
| "maintenanceDate": "01/03/2021", |
| "inspectionDate": "01/03/2021", |
| "creator": "gov", |
| "stretches": [ |
| { |
| "ID": "Feira_de_Santana-BR-C1-S1", |
| "P0": [-12.259720085744956, -38.96384053644054], |
| "P1": [-12.259990743034352,-38.95488161248777], |
| "direction": 0, |
| "signage": 1, |
| "statisticData": [3, 5, 1], |
| "monitoringDataAvg": [4.46, 54, 6.2, 25.2, 1220], |
| "monitoringDataMin": [4, 45, 4, 23, 1000], |
| "monitoringDataMax": [5.8, 65, 10, 28, 2000], |
| "BikeWayQuality": "Good" |
| } |
| ] |
| } |
| ] |
| } |
4.3. Visualization Module: CyclingView
Representing the visualization module service of the BrazilCycling implementation, the CyclingView will consist of a system divided into two software components: the map generator and the visualization web application. The map generator software is responsible for importing the data from the evaluation module, generating the map with cycle paths evaluated for a given month, and exporting it in a
mm-yyyy.html file, following the data generator service depicted in
Figure 6.
The map generated by the CyclingView service has all registered and evaluated cycle paths plotted with some characteristics that indicate their conditions related to quality, type, and direction, as detailed on the web page presented in
Figure 7. In addition, that map allows the user to click on cycle path stretches, displaying a popup with general information about it.
After generating the monthly cycle path map, the CyclingView map generator exports the HTML file to a system folder, accessible by the visualization web application. This second software component is composed of a server to listen to the users’ requests, who choose the evaluation months for the maps to be presented on the visualization web app.
Therefore, the BrazilCycling implementation of the iBikeSafe approach, comprising the BikeSensor, BikeData, BikePathGen, BikeWay, and CyclingView subsystems, stands as a practical solution for low-cost evaluation of the quality of cycle paths. However, due to the COVID-19 Pandemic scenario and the required social distances measures, it has become hard to perform large-scale adoption of the BrazilCycling implementation. In this sense, it was considered a case study for the BrazilCycling in a middle-size Brazilian city, initially validating the adoption of the iBikeSafe approach as a guide for quality evaluation of cycle paths in modern cities.
5. Evaluating the Quality of Cycle Paths in a Real City: A Case Study
After defining the BrazilCycling implementation, a Brazilian city was chosen to be used as a case study for this iBikeSafe-compliant implementation. Besides validating the proposed bike-based monitoring, evaluation, and visualization model, this case study aims to present practical details of how any implementation of the iBikeSafe approach could be used in an actual city. Therefore, for the conducted experiments and data analysis, the medium-size Brazilian city of Natal was chosen.
Being the sixteenth biggest capital in Brazil, this northeastern city located in the state of Rio Grande do Norte has an area of approximately 167 km
and a population of almost 900,000 inhabitants, according to the Brazilian Institute of Geography and Statistics (IBGE) [
28]. In addition, this city has a cycling structure of 83.47 km with an expected increase of 15km until the end of 2021, which is a significant infrastructure compared to the vast majority of Brazilian cities.
Concerning the implemented cycle paths structure, 82.6% of the population approves the use of bikes as an alternative means of mobility, mainly in counter-proposal to public transport. In addition, a survey applied by municipal and state agencies to 800 city inhabitants estimates that 62.1% of the Natal population have adopted the use of bicycles as their primary means of transport since the beginning of the COVID-19 Pandemic [
29].
This increasing popularization of the cycling practice in Natal, primarily due to the period that the coronavirus Pandemic has marked, is mainly due to the city’s inhabitants search for the social distancing that public transport makes inevitable. However, it is vital to know if these approximately 26,000 cyclists who make about 58,000 trips/day have the proper conditions to practice cycling in terms of health, infrastructure and, safety. Thus, in this section, we apply the iBikeSafe-based BrazilCycling implementation to evaluate a set of cycle paths to understand their quality and use these data to compare with the information provided by cyclists about their perceptions of the city’s cycling structure.
5.1. Registering an Existing Cycle Path
Considering the Brazilian city of Natal as the target scenario, a subregion of it was used as the input for the implemented system. Such subregion was defined as reference the University of Rio Grande do Norte (UFRN), a public institution primarily located in the central area of Natal. This University is the fourth-best University in its region, and one of the 25 top-ranked in Brazil [
30]. It has five campuses, including the central campus, which is by far the largest of them. Its central campus gathers 47,000 students and 2300 faculty members, besides other employees and the external community circulating daily [
31]. Thus, the cycle paths on the UFRN central campus will be the main focus of the performed analysis.
The UFRN central campus offers comfortable amenities, such as restaurants and cafes, bank agencies, bookstores, a multi-sport gym, art gallery, post office, among other facilities [
31]. In addition, the campus is connected to the urban network of the city of Natal through a Ring Road circumscribing the campus, which was created to accommodate conventional transport, such as cars, motorcycles, and buses in the urban public transport system.
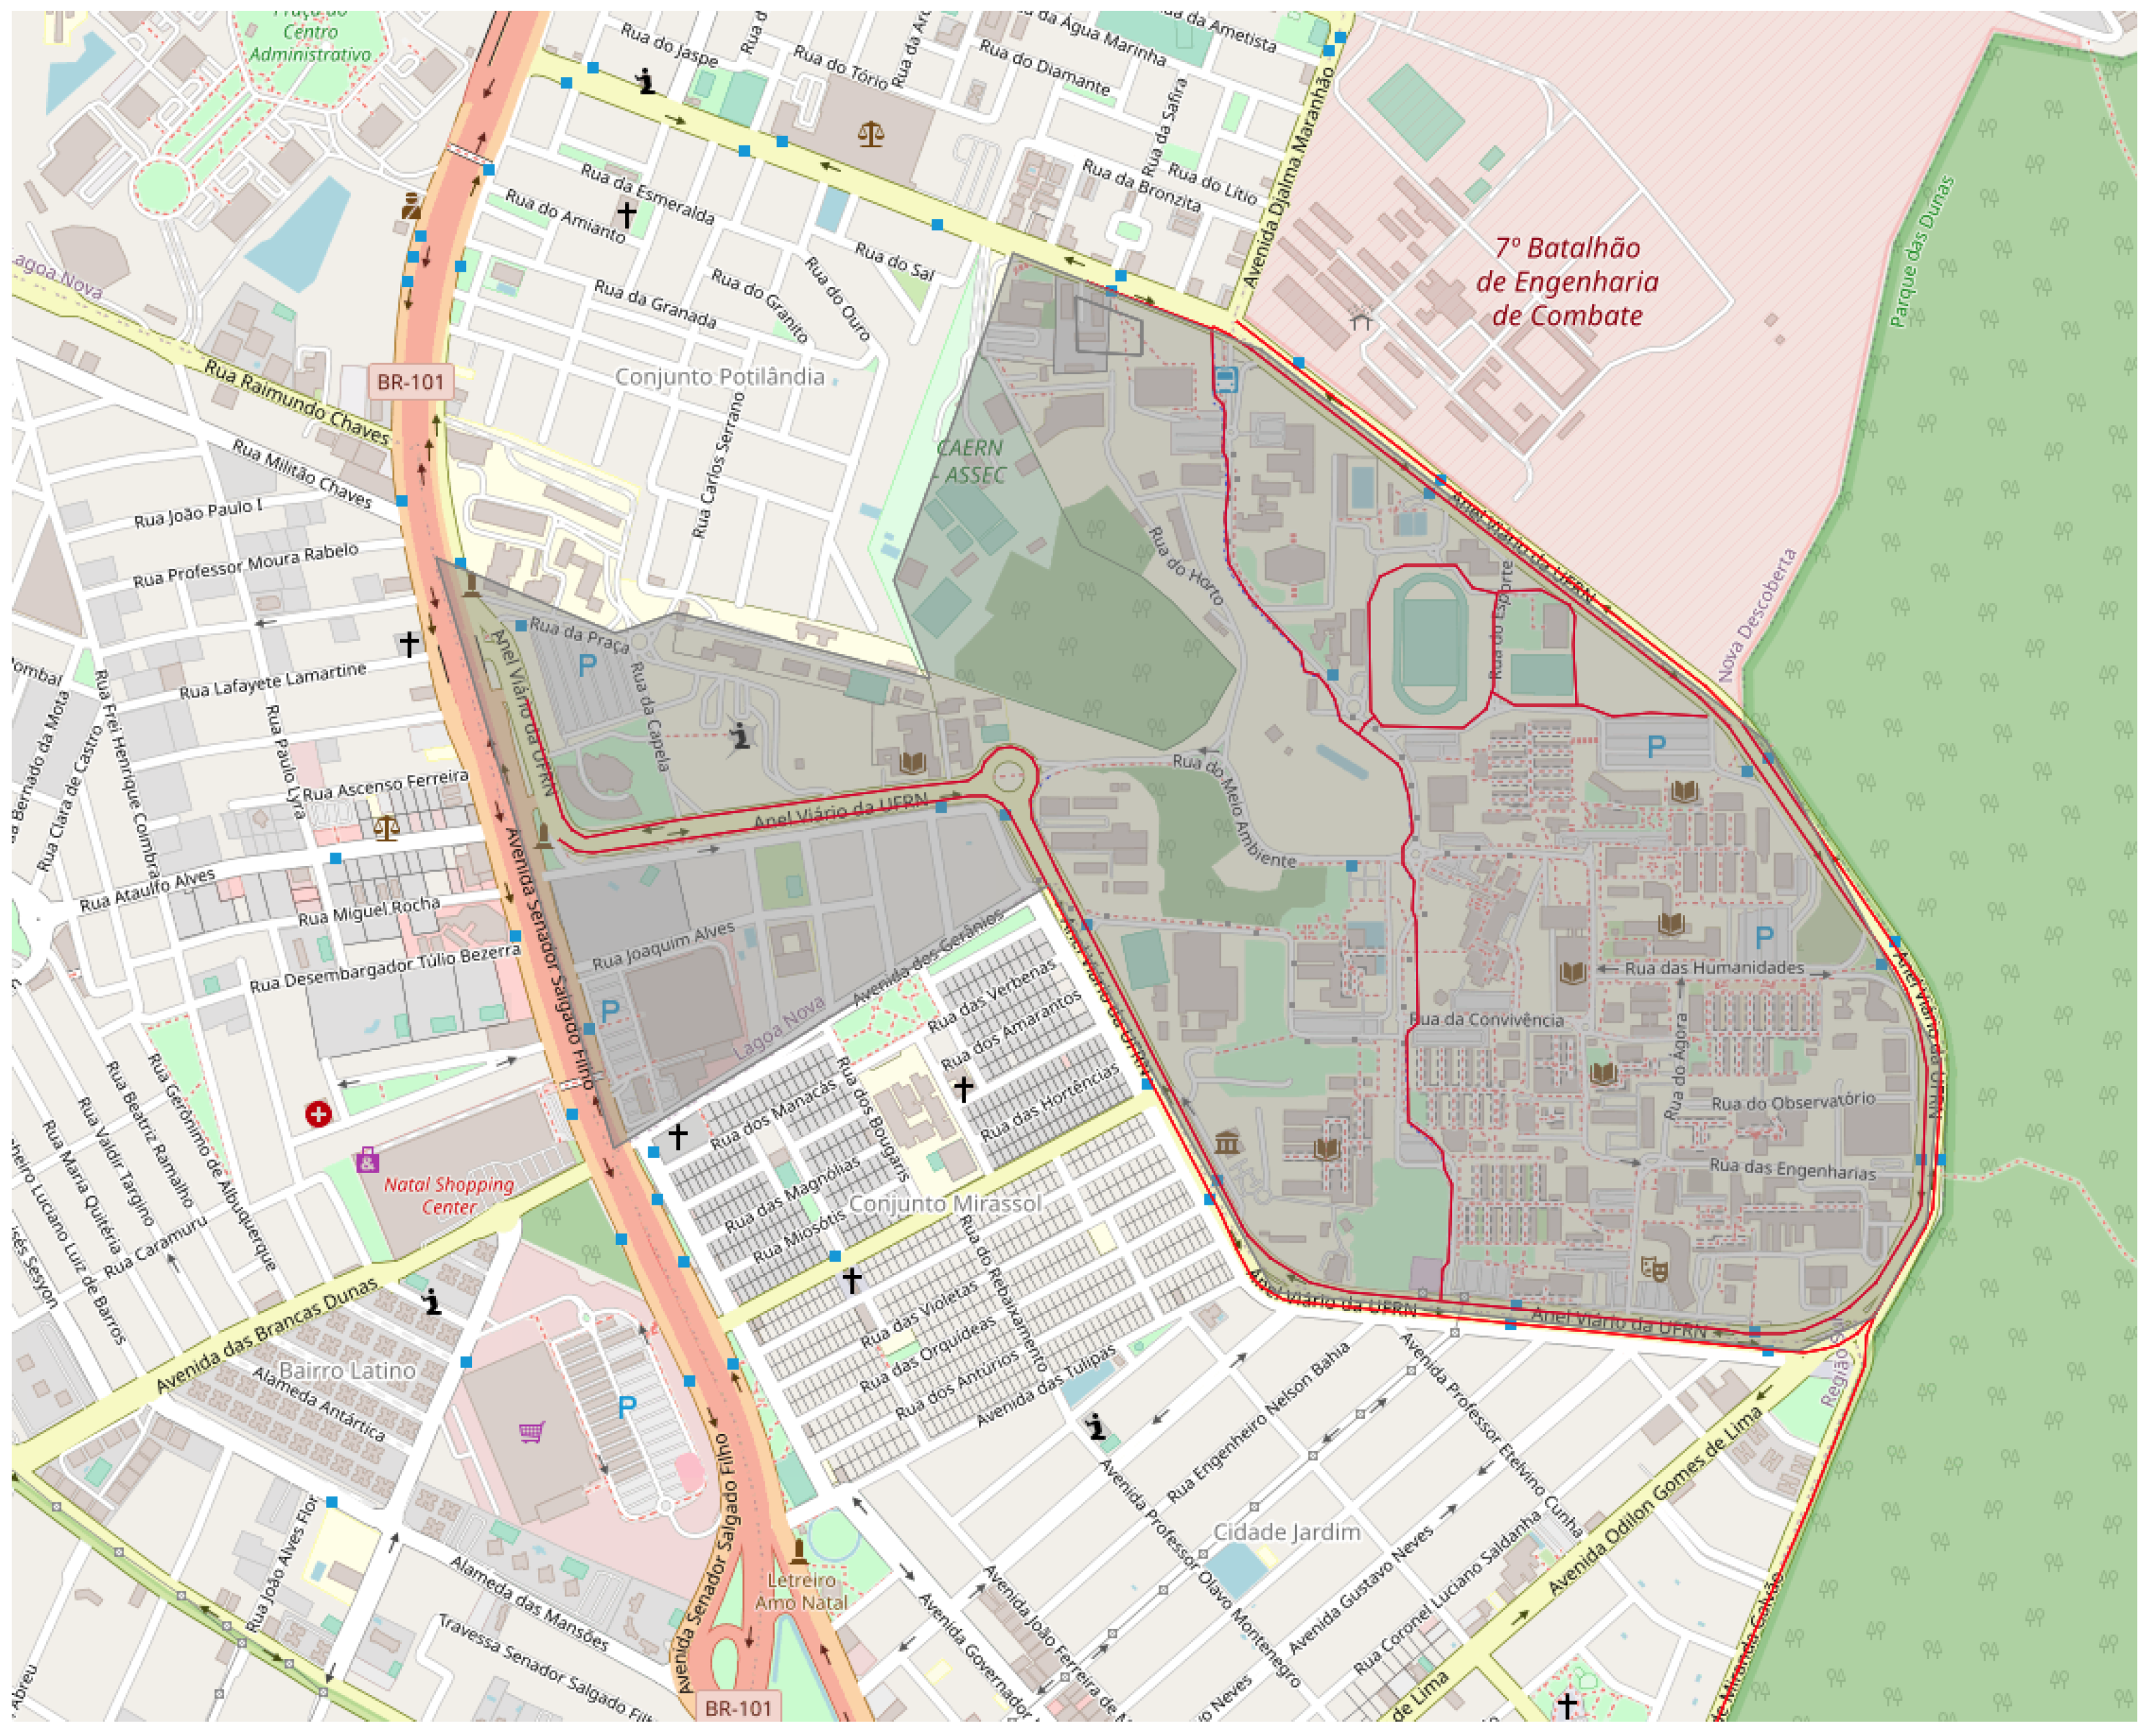
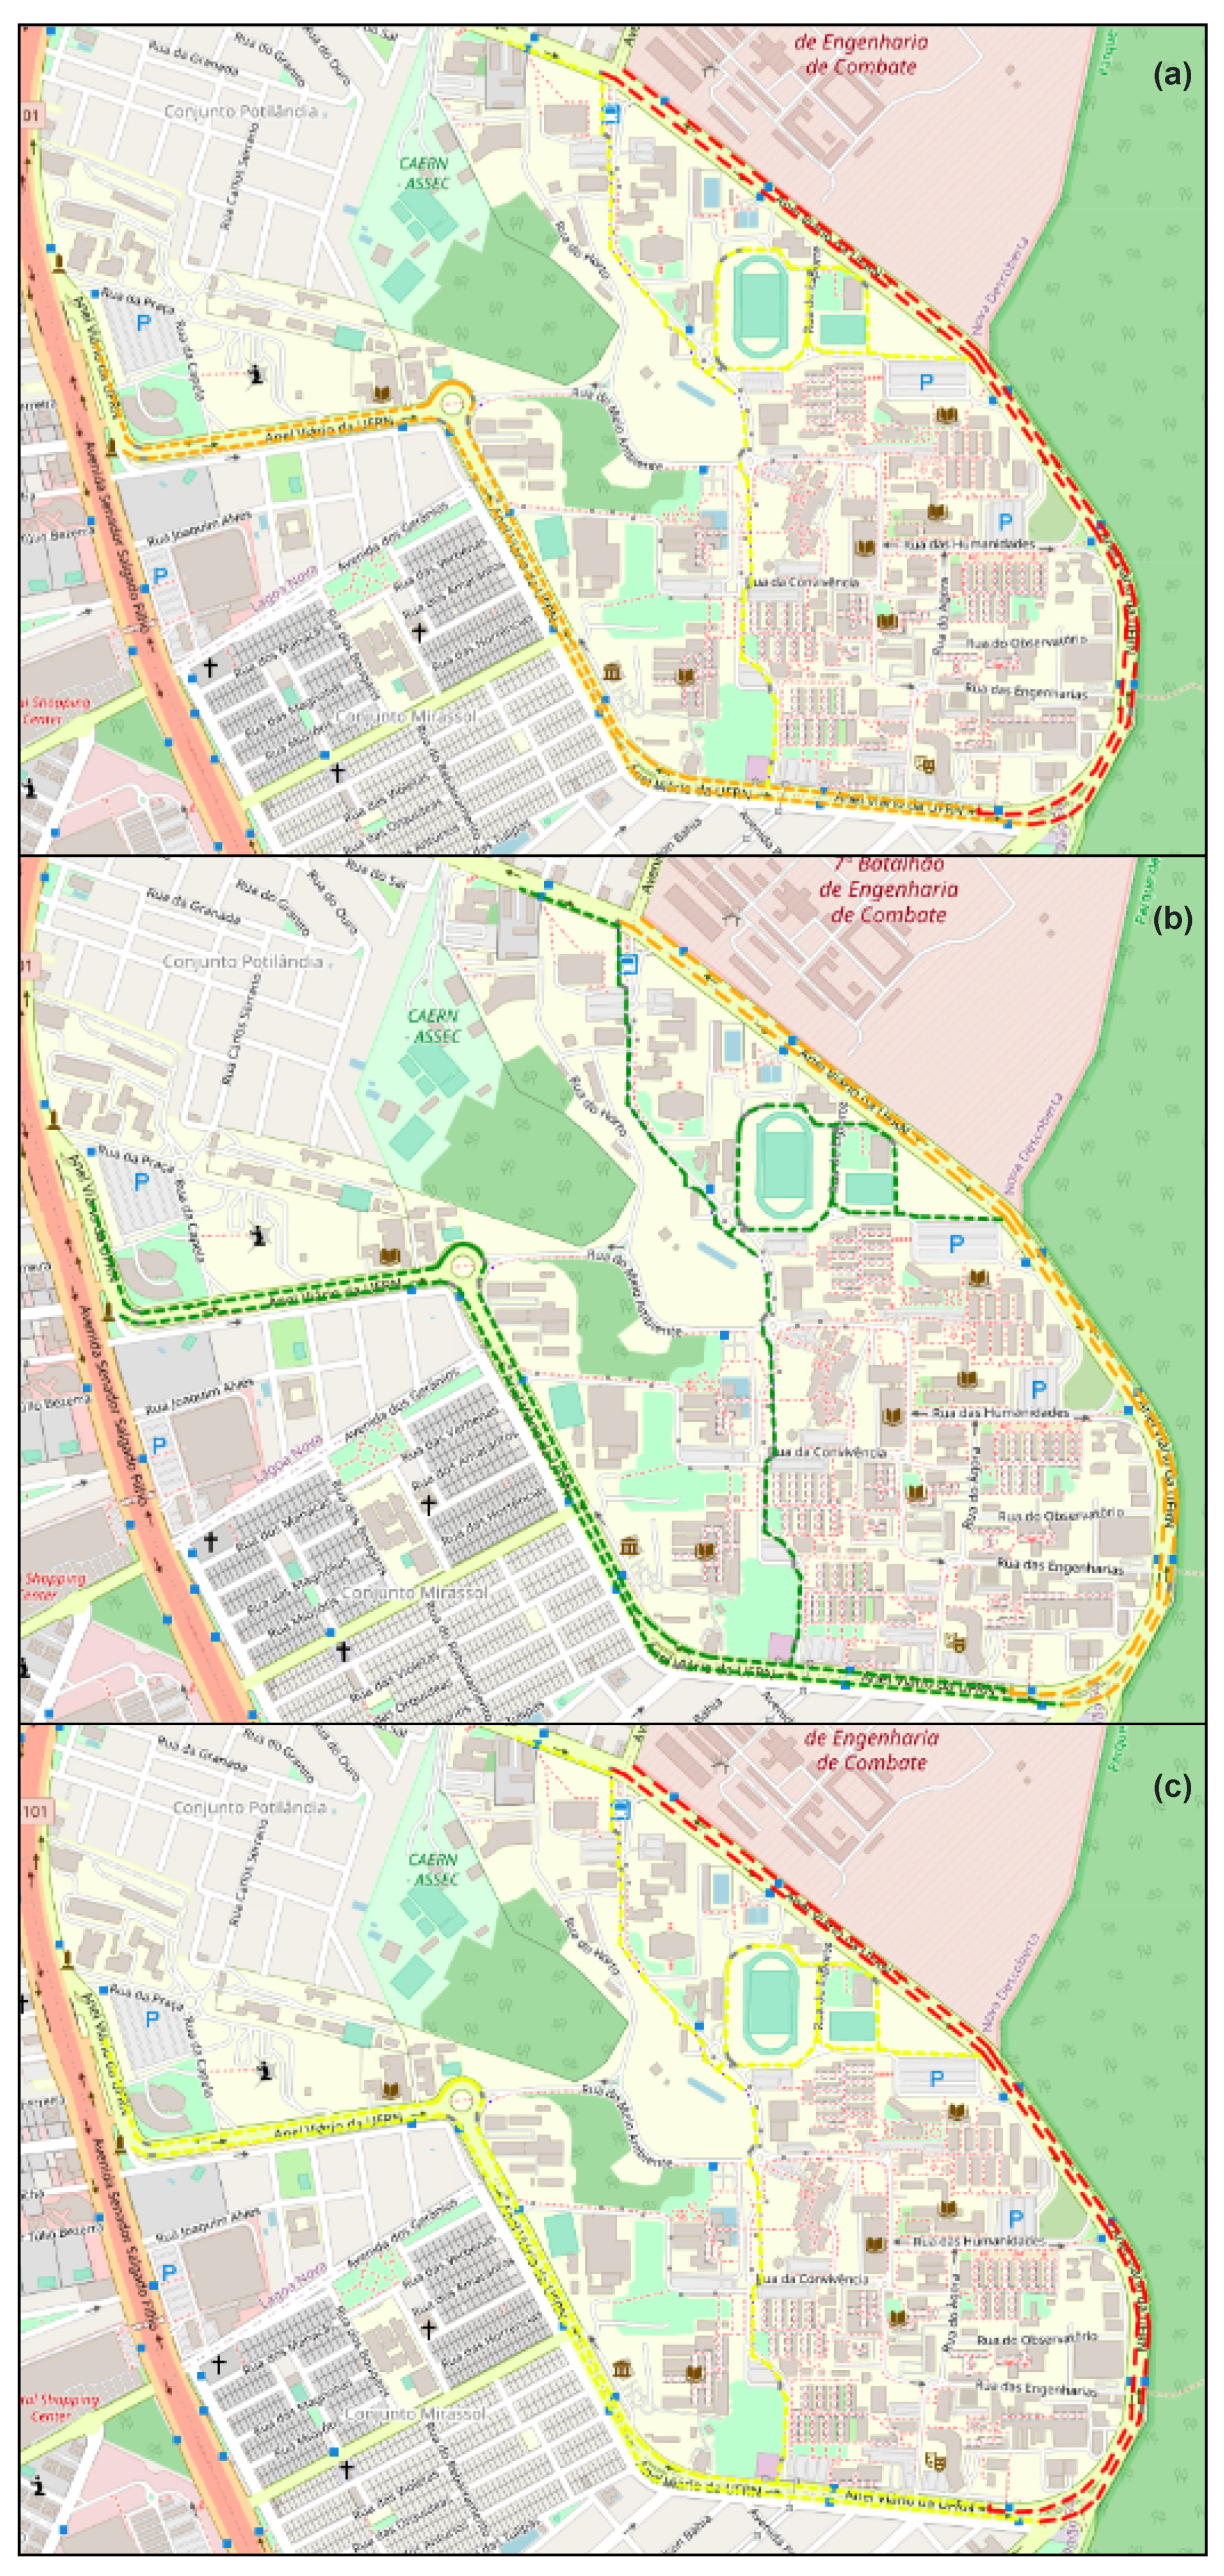
The University has initiated the construction of cycle lanes around and inside the campus to promote sustainable mobility among its users. As part of its campus expansion plan, it has built over 5 km of cycle lanes so far (represented by the red lines on
Figure 8), which skirt the campus to the east and join with Ring Road. According to the Engineering Department head, cyclists have to share the lane (road) with other traffic users. In additional, the cycling infrastructure contributes to the connection between large areas of the campus, such as the university residence, classrooms, laboratories, multi-sport gymnasium, and university restaurants. According to [
32], finding a way to provide a campus bike-sharing system is possible using the current infrastructure, but specific issues stand in the way of implementation. For example, there are long-distance paths shared with other vehicles, bringing safety concerns. Also, there are not enough trees along the campus tracks, potentially posing a disadvantage for cycling given the high levels of solar radiation in Natal due to its geographic position (near the Equator line).
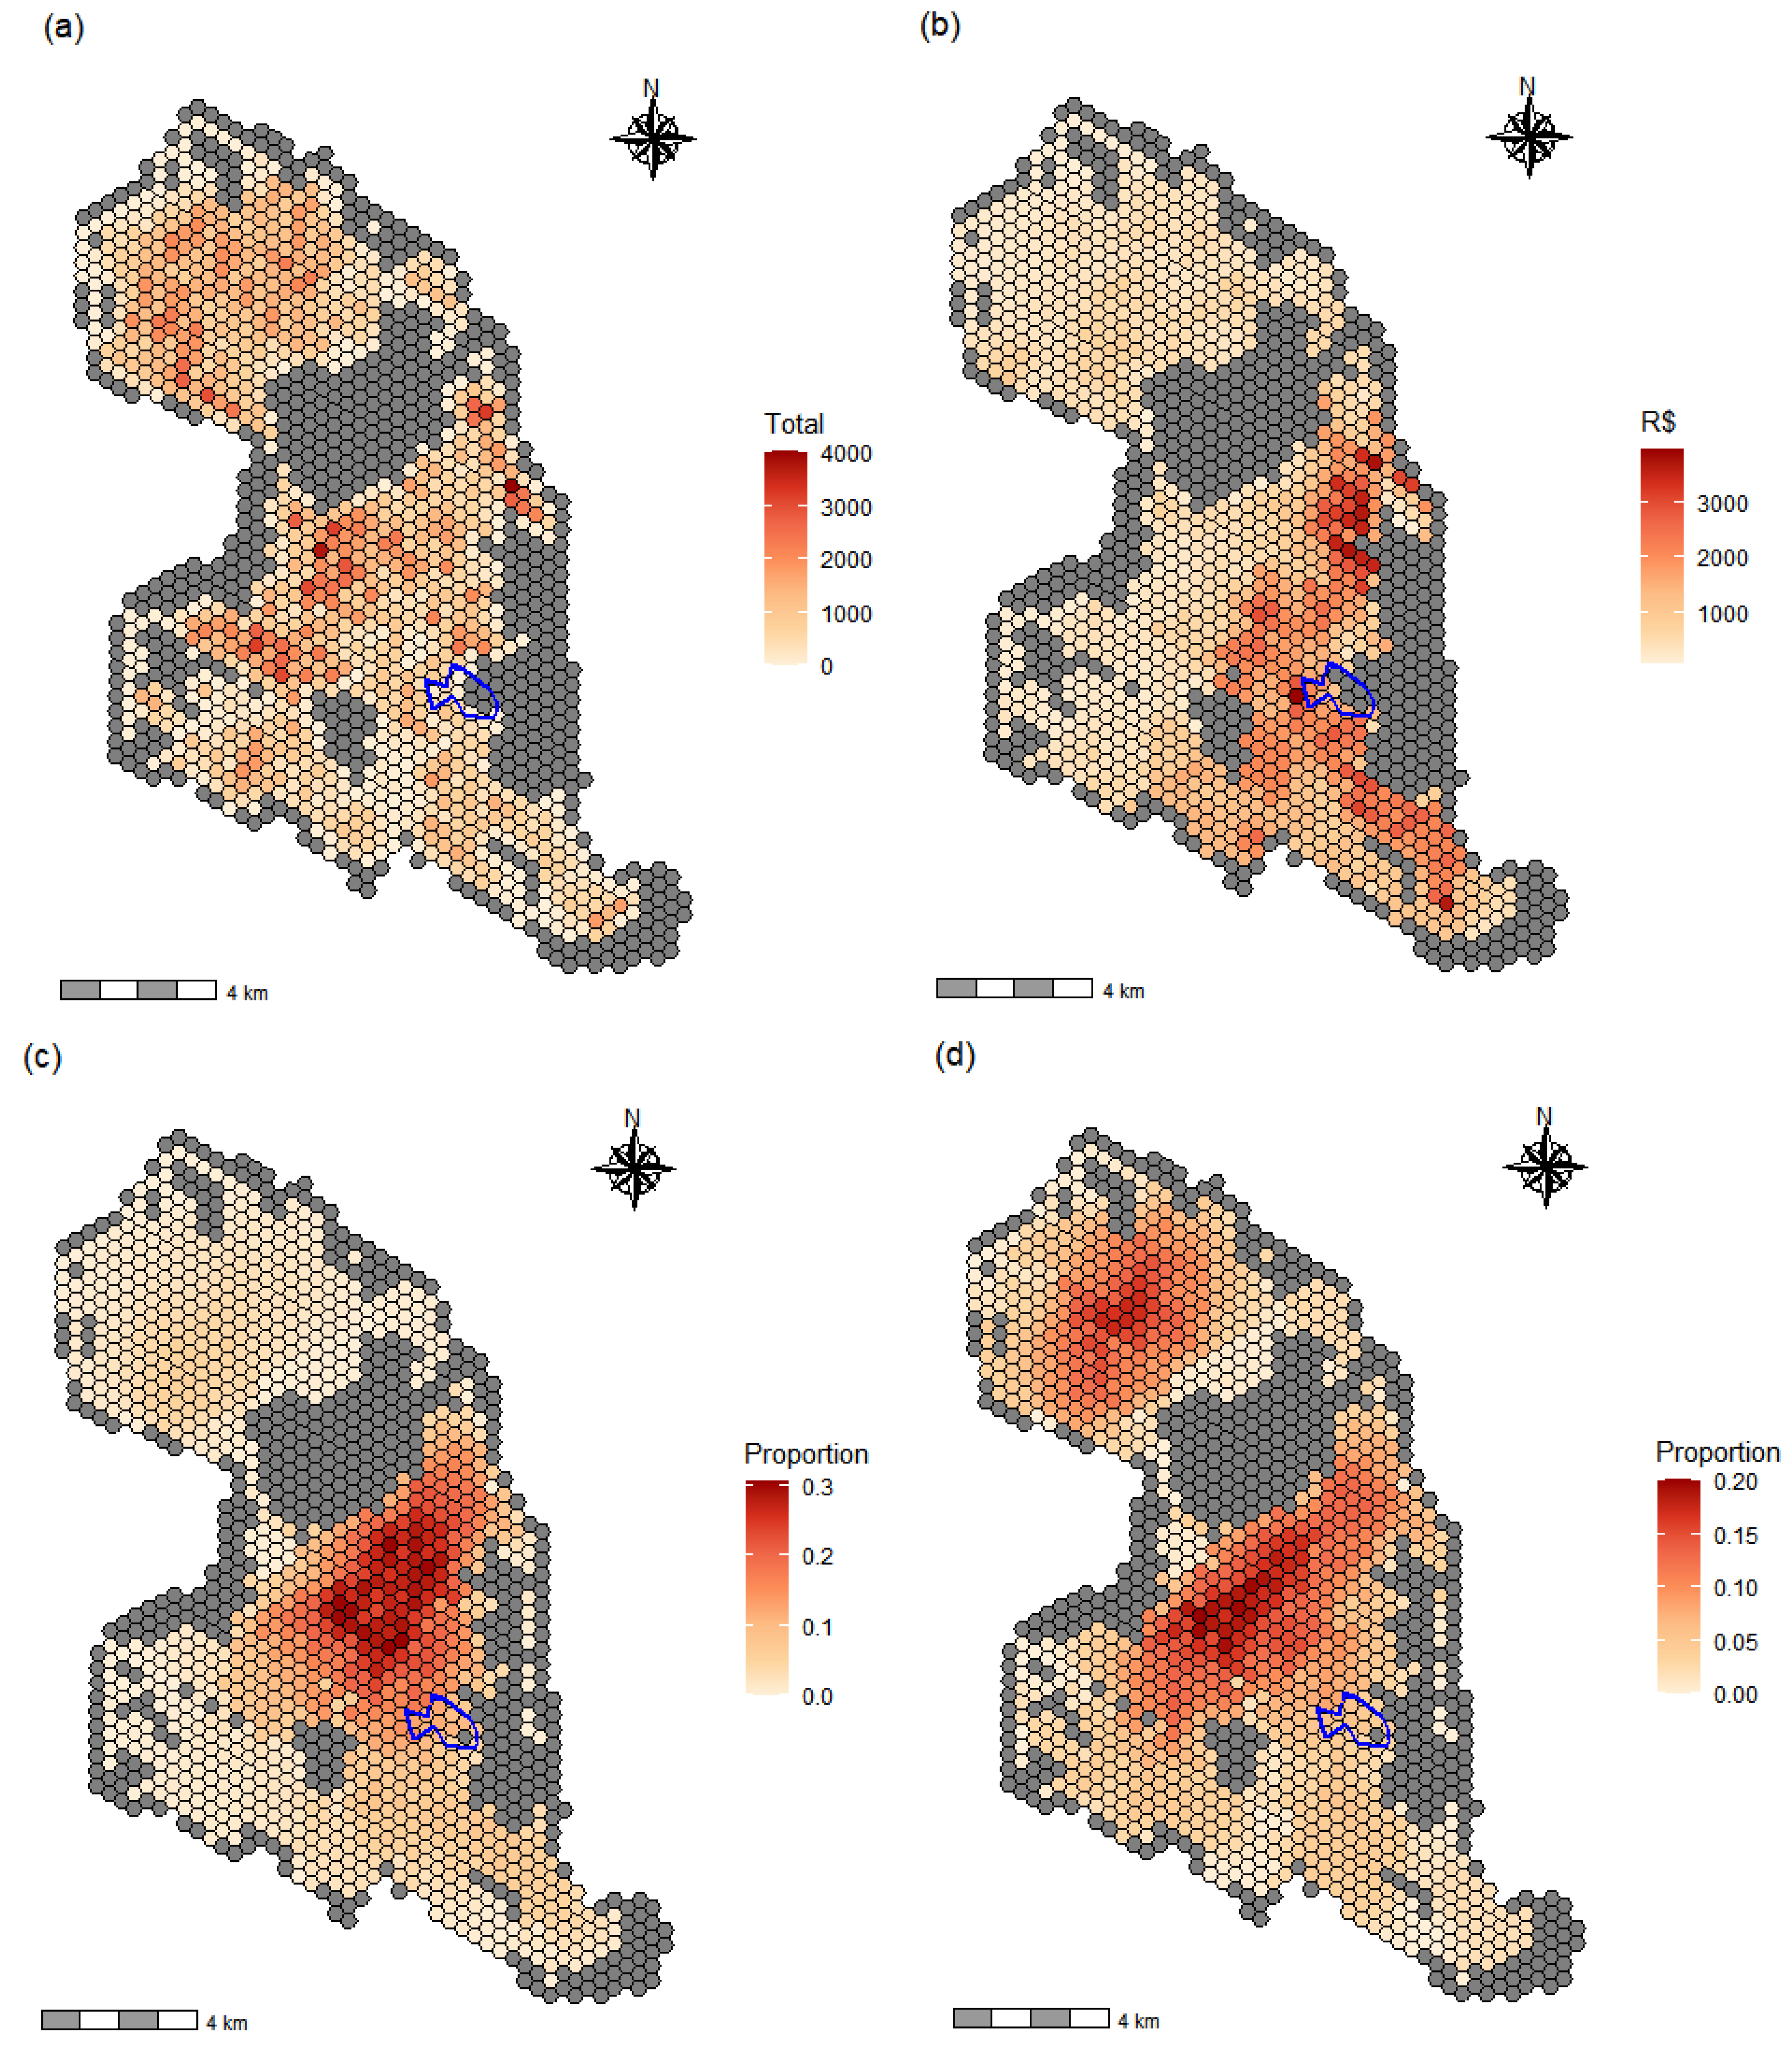
Figure 9 presents the socioeconomic characterization of the UFRN central campus. It also presents the available cycle paths in the region that could be used to increase transportation for students and faculty. These data were obtained from the Institute of Applied Economic Research (IPEA), a Brazilian government agency that proposes innovative analyses, developing surveys on the economy to monitor, evaluate and give technical-scientific support in economic and social policies. Using census information, satellite images, and collaborative mapping, it is possible to calculate accessibility levels for a set of 20 municipalities.
This study used the hexagonal mesh already available for the city of Natal. The hexagonal mesh is a digital model of the urban area that describes the space more efficiently than other models, like the irregular network grid or the planar grid. Four indicators were selected: (a) distribution of the total population and (b) the average household income per capita, both indicators coming from the 2010 Demographic Census, (c) proportion of formal jobs and (d) proportion of public primary schools, both accessible in trips of up to 15 min using bicycles. The central campus of UFRN is represented on the maps by the blue line. To note, hexagons that do not contain information for indicators are gray-colored.
According to
Figure 9, the central campus is located in the South Zone of Natal, an area that has more remarkable economic development and a smaller population than other zones in the city. This is expressed in the distribution of households and the average income living in the South Zone and its surrounding areas. Therefore, expanding the cycle path network beyond the central campus of UFRN and covering other areas of that region can serve as a stimulus for developing this sustainable modal. According to a survey for the city of Natal, the South Zone represents the region of the city in which people use bicycles the least in their daily lives [
29].
Associated with the lack of access to formal jobs, the proportion of these opportunities in trips of a maximum of 15 min tends to be more significant in the western portion of UFRN and precisely in the area where there is a discontinuity of the bike path that runs around the campus, and where a highway that has no lane exclusive for cyclists also connects the university to important commercial centers in the region. This presents the danger of traffic accidents involving cyclists trying to use the same roadways as commuters, as they are being forced to share the road with high-speed traffic. Concerning the percentage of public schools accessible by cyclists, it was lower and relatively homogeneous in the region surrounding the central campus of UFRN, especially in the West Zone of the city.
5.2. Attaching Mobile Monitoring Units to Bicycles
Under the recent initiative to implement and improve cycle lanes on the UFRN main campus, the BrazilCycling implementation can provide valuable data to cyclists. Furthermore, the implemented services can indeed be used to identify potential problems that can disturb cycling or risk the cyclists’ health and safety. Hence, it is expected the implementation and proper configuration of the BikeSensor Mobile Monitoring Station (MMS) on bicycles, as well as the other resources defined in the previous section.
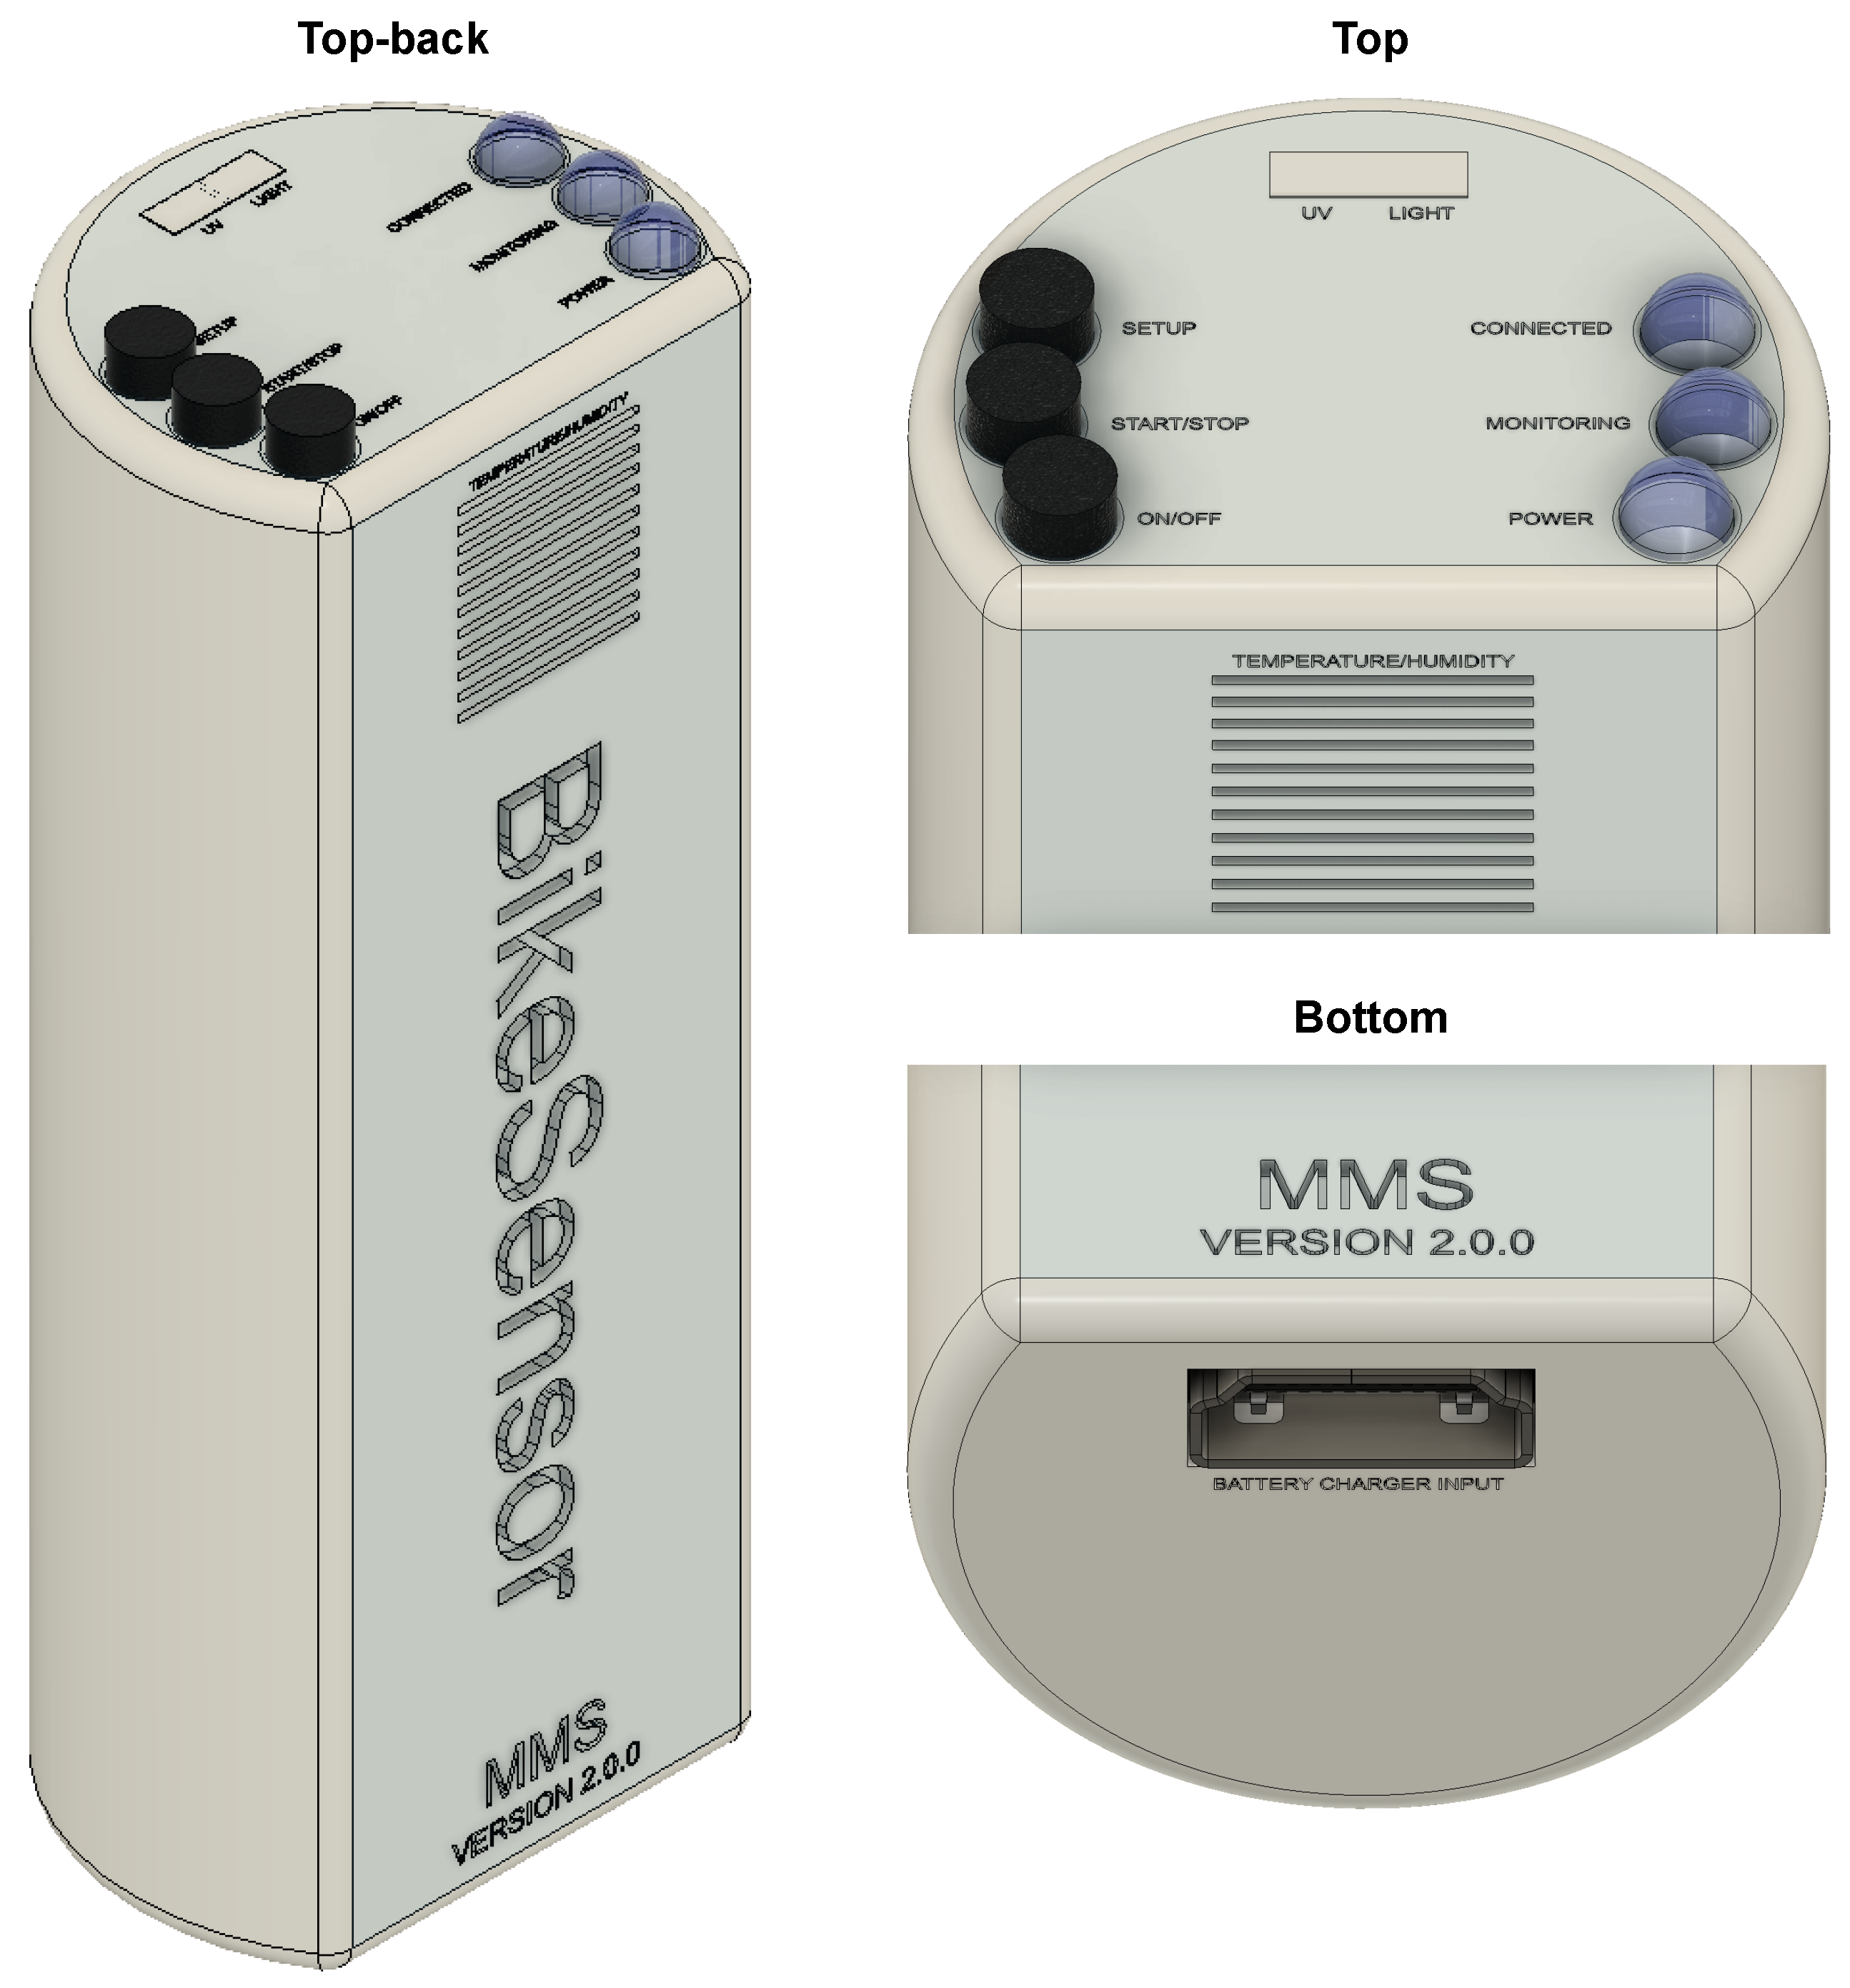
In the desired configuration, the MMS can capture data related to air pollution, noise pollution, ultraviolet radiation, thermal sensation (temperature and humidity), and luminosity that affects the cycle paths of the UFRN central campus. For this, the sensing units have the design presented in
Figure 10, which has two light entrances on top for luminosity and UV radiation sensors data collection, and an air entrance on the back for temperature/humidity, air, and noise pollution sensors.
In addition to environmental data collection, the MMS proposed version in this scenario has three buttons that allow connecting the unit to the Internet, starting monitoring, and turning the module ON or OFF. These actions performed by the cyclist result in light signals presented by LEDs also depicted in the
Figure 10, which inform that the sensing unit is connected to the Internet, collecting environmental monitoring data and turned ON or OFF, respectively.
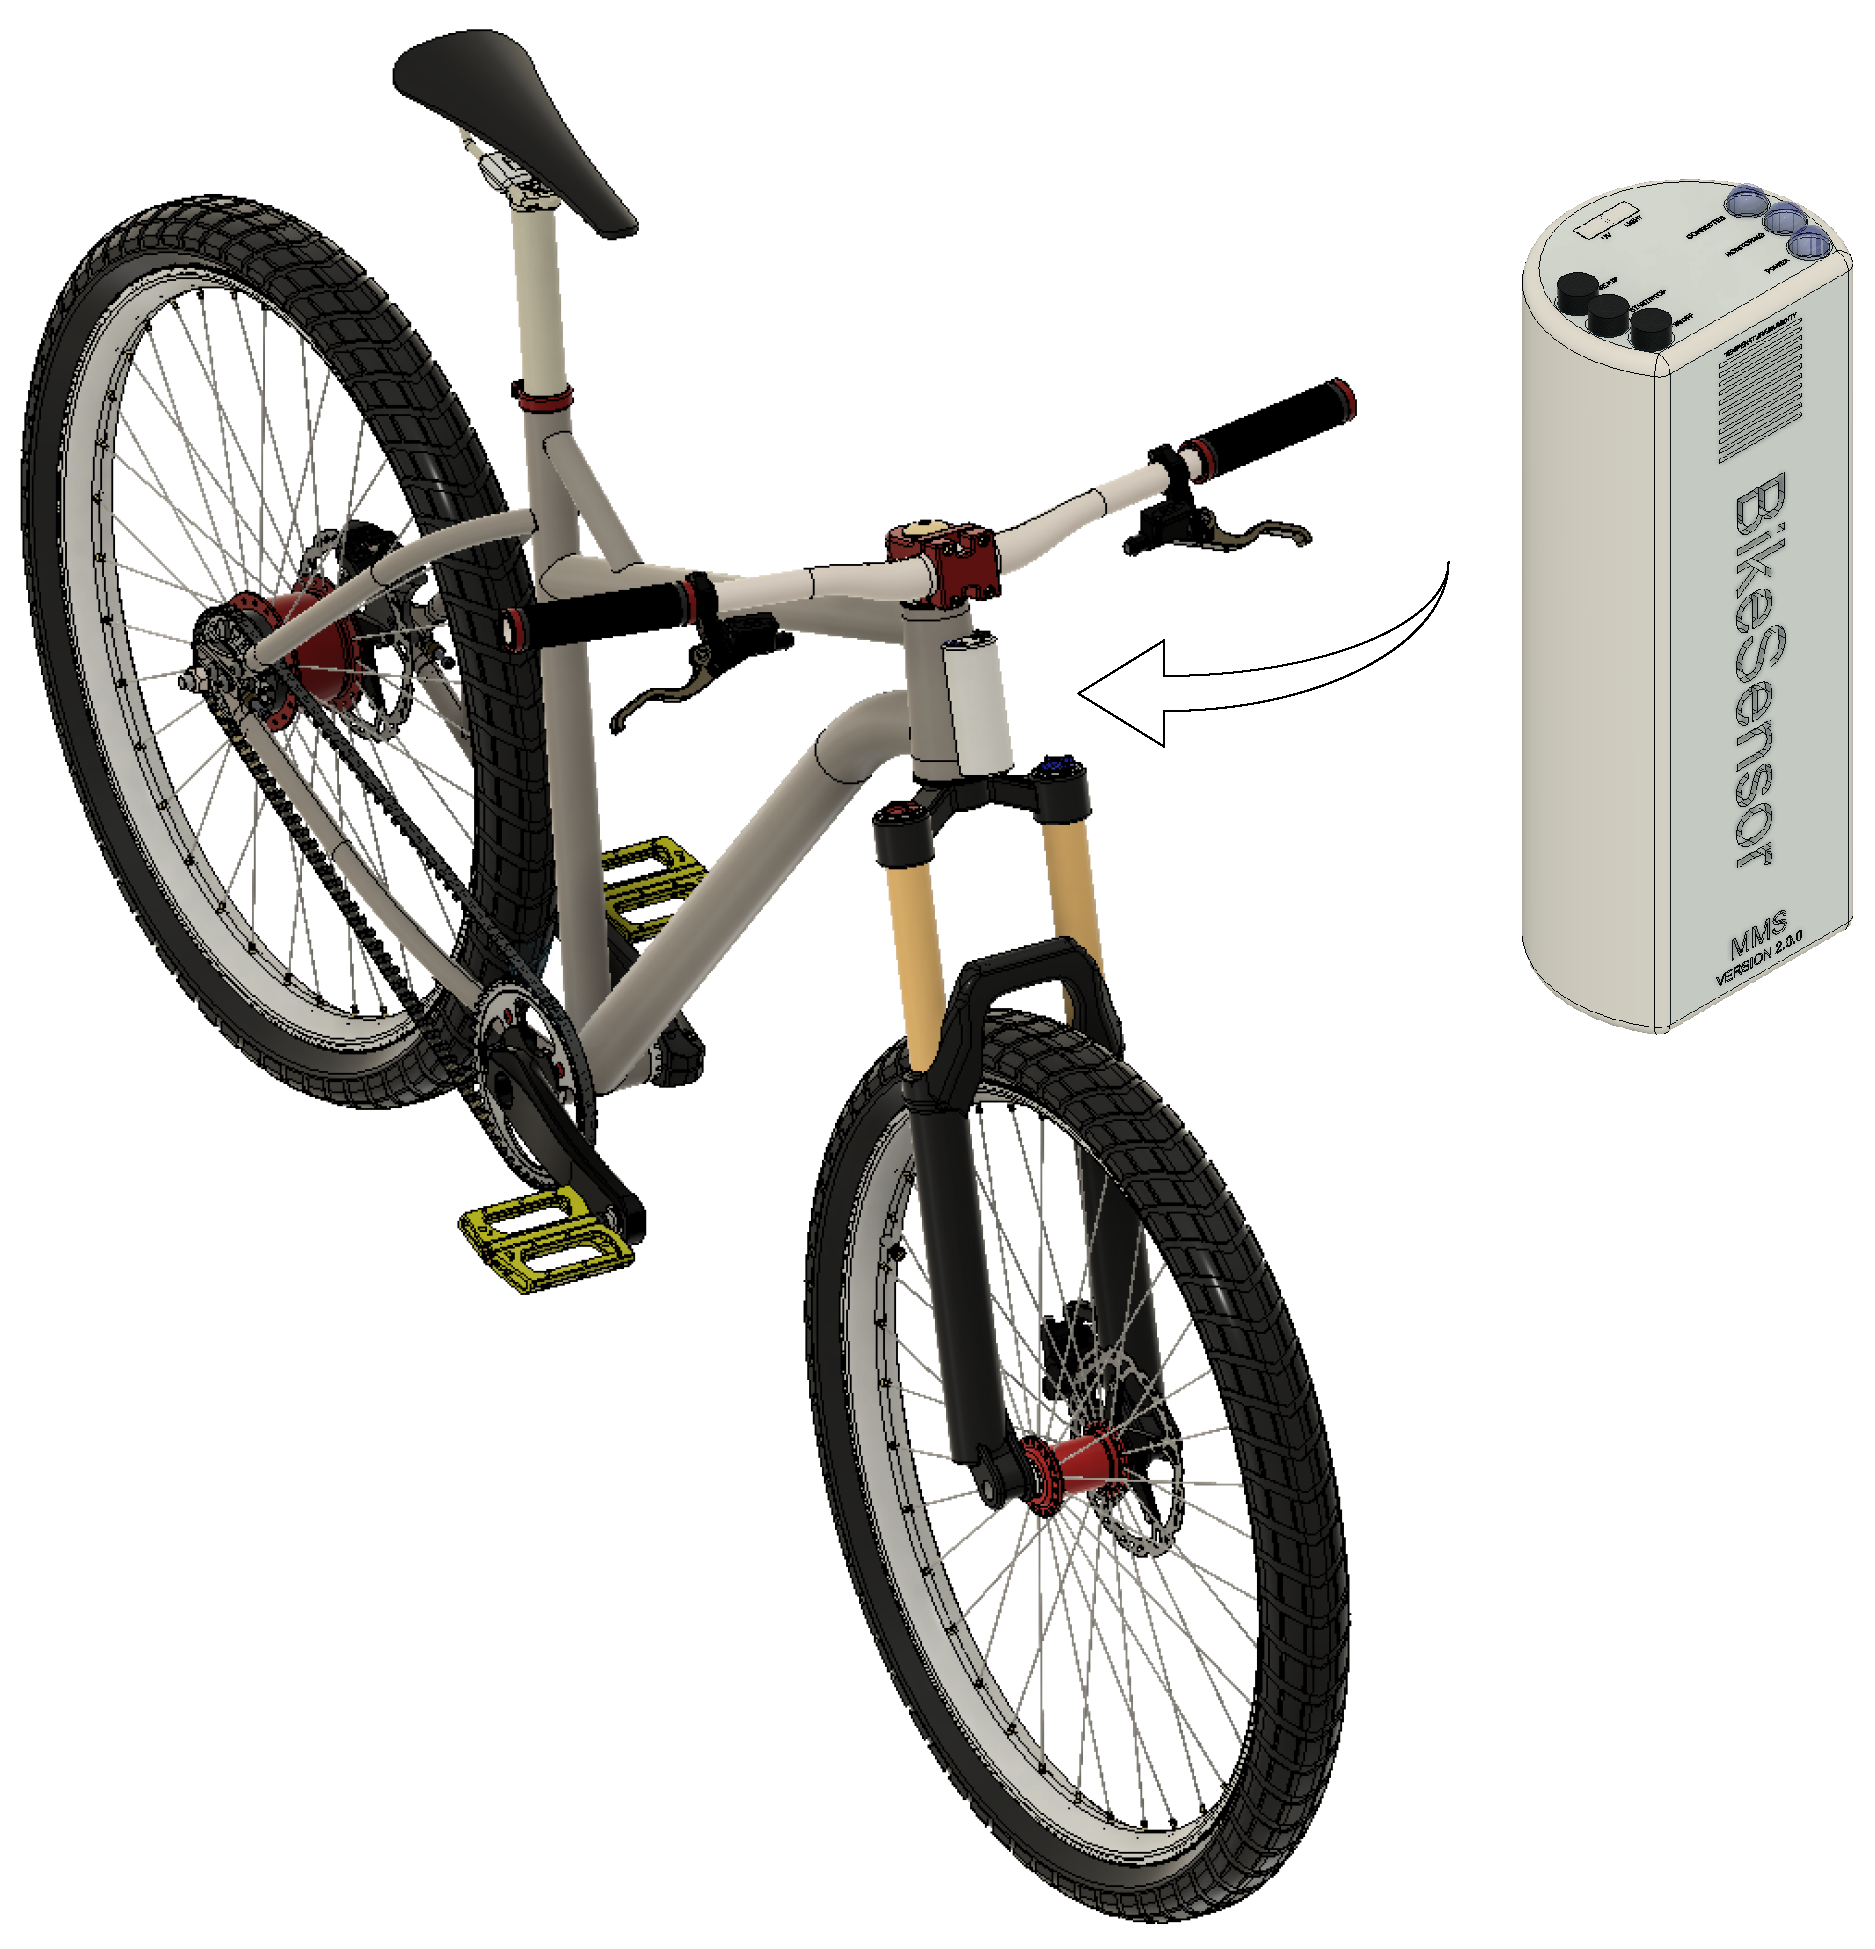
Having 100 × 35 × 30 mm, this version of the MMS also features a micro USB input on its bottom for charging the battery present in the module. With these dimensions, this sensing unit could be easily attached to a regular bicycle in the position indicated in
Figure 11.
Positioned as presented in
Figure 11, the MMS can collect multiple data. With the application of these units on a large number of bikes, students and workers cycling on the campus would support extensive data collection of environmental data, potentially daily. However, although fully modeled and programmed, massive deployment of the MMS units could not be performed due to budget restrictions and the effects of the COVID-19 Pandemic, being left for future works. This way, data collection described in the following subsection mainly was obtained from open databases, still supporting the other services of the BrazilCycling implementation.
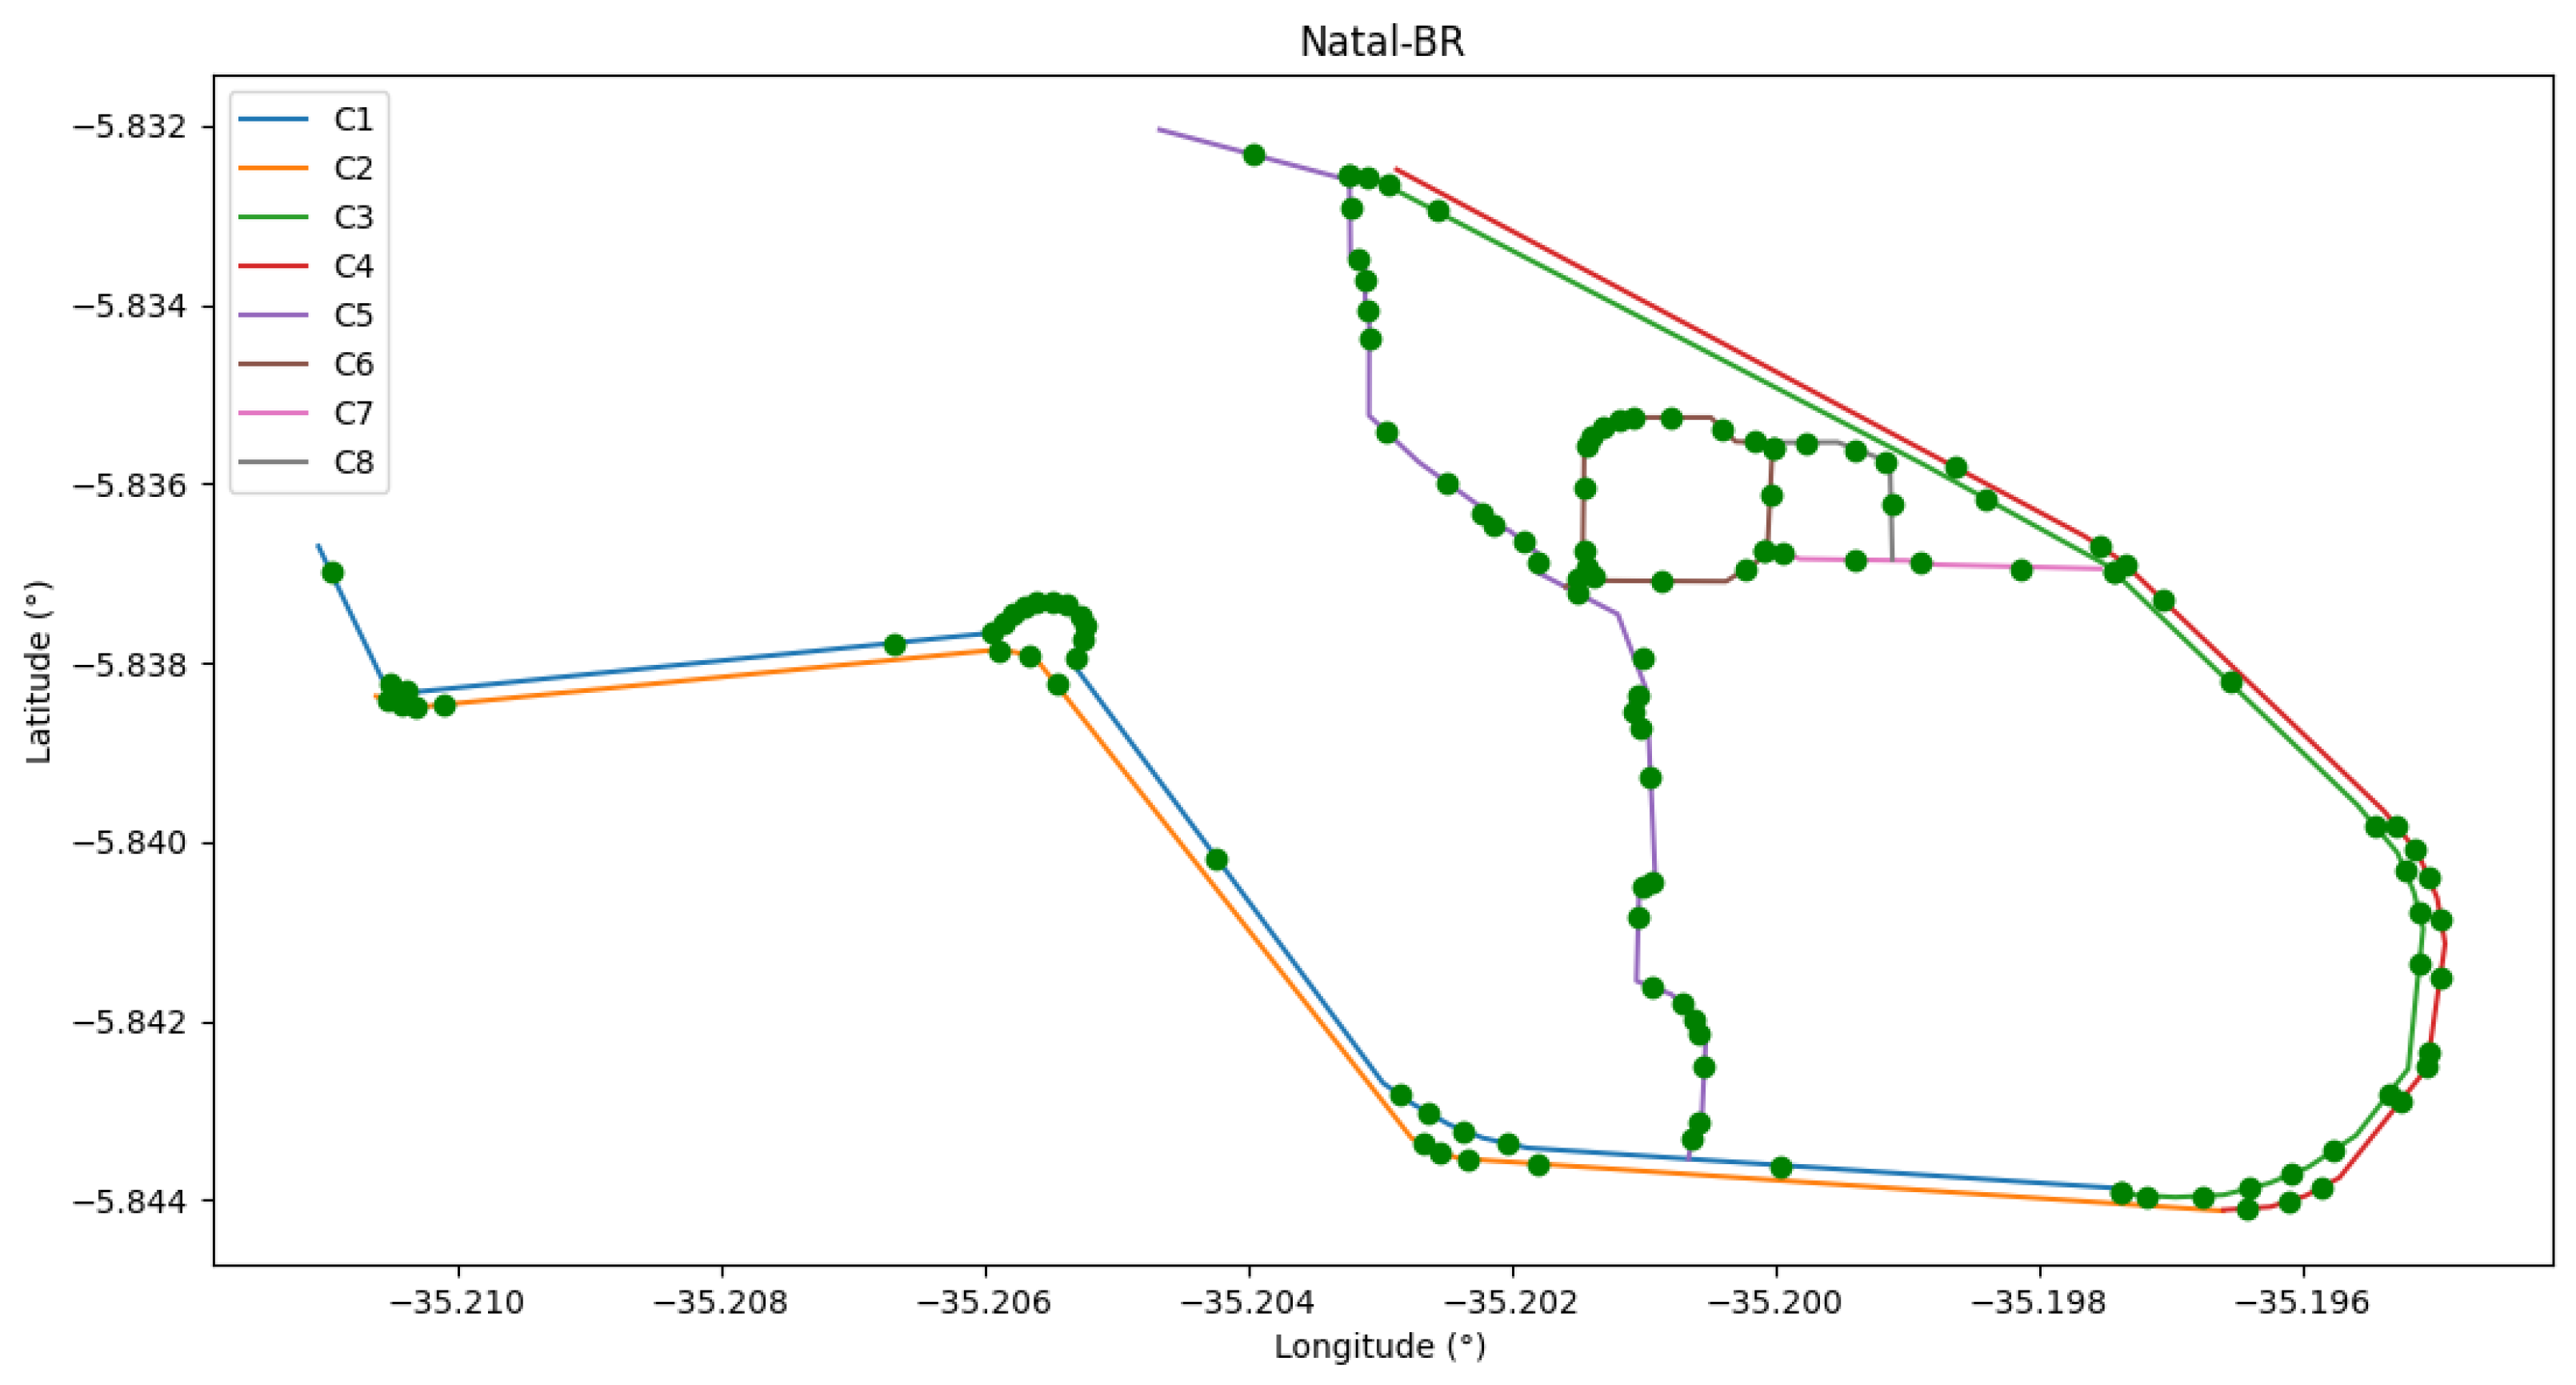
5.3. Cycle Paths and Monitored Adverse Conditions
Considering the cycling structure of the UFRN central campus, and after retrieving and processing open data provided by the City Hall [
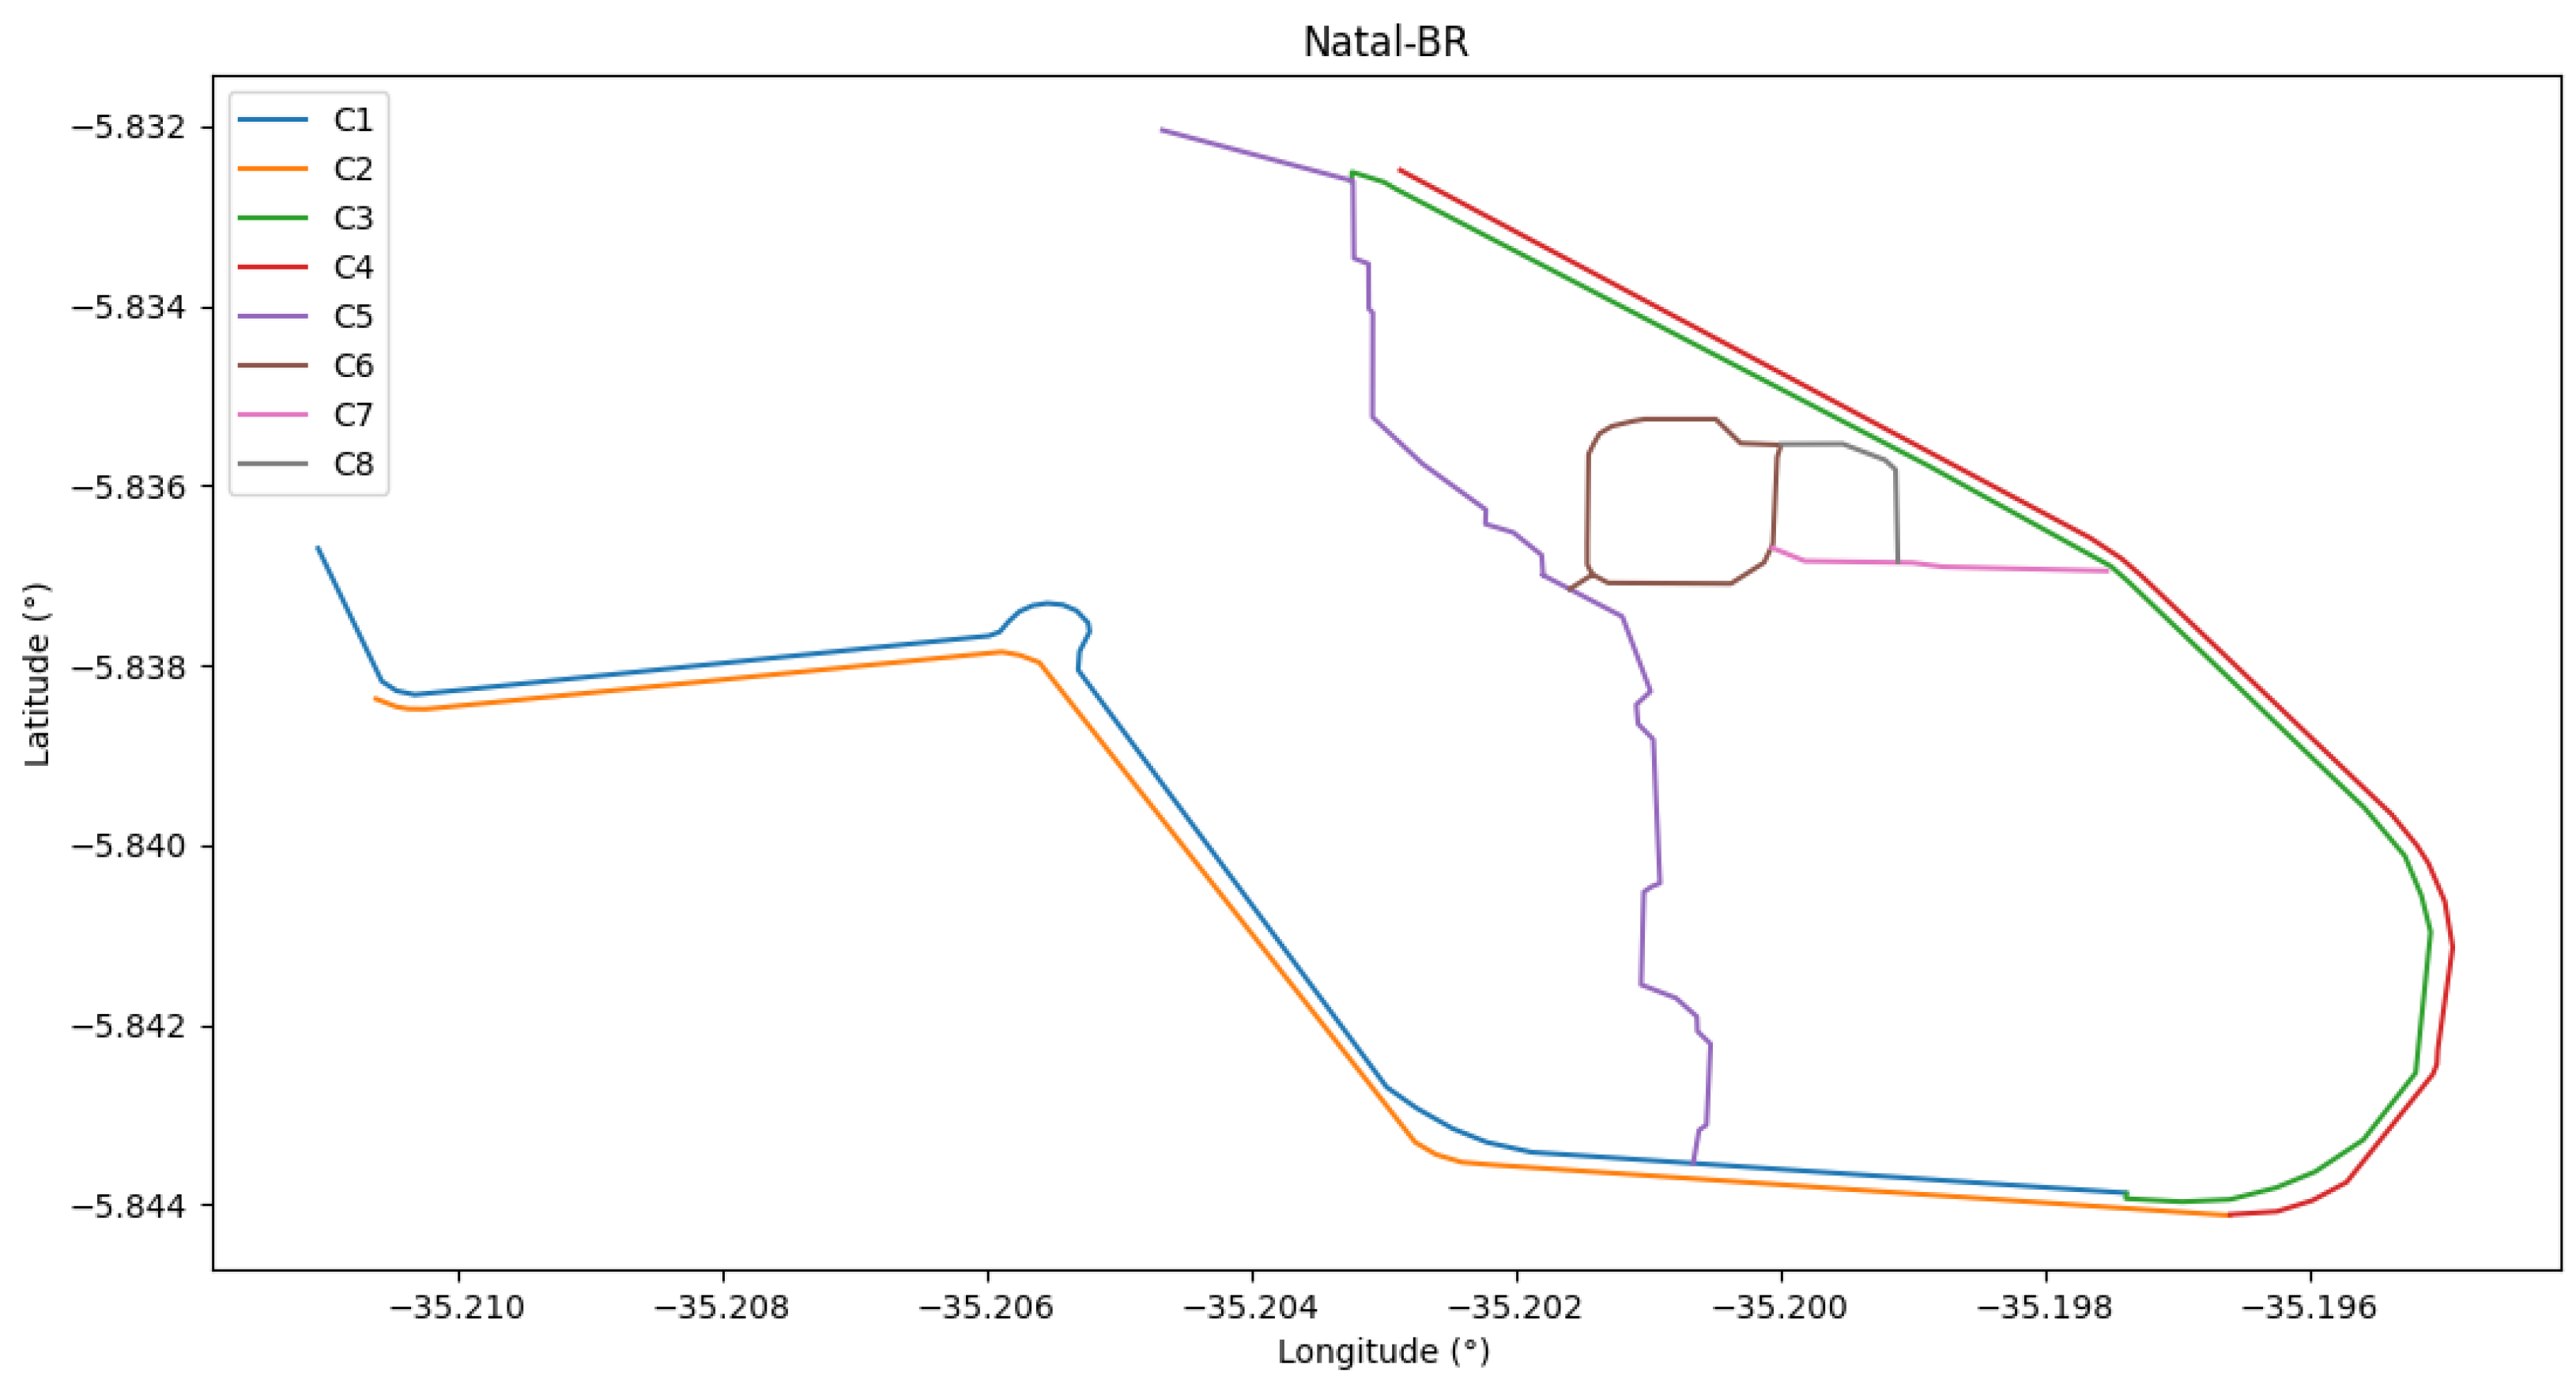
36], the first step for data collection in order to evaluate those cycle paths was to create the models for the eight cycle paths present in that region. In a typical BrazilCycling implementation, those data would be registered by the City Hall through the BikePathGen subsystem, especially considering the burden of registering a large number of cycle paths. However, for the scope of this evaluation phase, the desired models were registered manually, being depicted in
Figure 12.
From the cycling map already available for the city of Natal, it was possible to identify the bike paths in the region of the central campus of UFRN. This identification allowed it to be viewed using the Google Maps Street View tool, making it possible to verify the type of each cycle path and adding this significant metadata to the set of collected information from the cycle map (cycle path direction and administrator).
In addition to the cycle paths, the Google Maps service allowed the visualization of the car traffic level on the roads through its traffic visualization layer. Once all the desired data were collected empirically, the next step of registering the cycle paths consisted of capturing each point’s coordinates that create the cycle paths through their stretches connected between two sequential points. This way, it was possible to collect information from the cycle paths presented in
Table 5, generating graphs that represent the eight cycle paths on the UFRN central campus, as presented in
Figure 12.
With all the bike paths modeled and exported in the Natal-BR.json file, as exemplified in Listing 3, the way to collect environmental data was decided. For this, 117 geographic coordinates were collected related to different monitoring points, which were retrieved exclusively from each stretch of the eight registered cycle paths (
Figure 13).
From the empirically defined monitoring points, simulating the passage of bicycles with a MMS attached to them, it was possible to group the environmental variables data defined for this application in a period from January to December 2020. Collected through Accuweather, this specific period was defined in order to allow a more comprehensive analysis of the cycle paths conditions during the emergence of the COVID-19 Pandemic. Doing so, it was possible to divide that year into three phases: pre-pandemic (January and February), beginning of the Pandemic with severe restrictions (March and April), and relaxation of social distancing restrictions (May to December). As mentioned before, this monitoring phase was simulated instead of using an MMS physical implementation, although the same processing steps were considered when formatting and transmitting the sensed data.
The impact of environmental variables for each of the defined phases did not vary considerably because the Pandemic only affected the flow of cars near the cycle paths, with slight variation in air and noise pollution rates, which were not significant (
Table 6). However, the statistical data collected through the Secretariat of Public Security and Social Defense of the state of Rio Grande do Norte had considerable variation along 2020 [
37].
Composing those data, monthly information on accidents and urban violence (injurious homicide, police intervention, bodily injury followed by death, robbery/stealing, and femicide) that occurred in the city of Natal was considered. As
Table 6 presents, accident rates are naturally high in the city. However, in the second phase of 2020, these rates had a considerable decrease, indicating an improvement in the cycle paths quality because this variable is critical since it brings immediate risk to the cyclist’s life.
Therefore, with all data from the monitoring module and the cycle path registration subsystem simulated for 2020, it became possible to evaluate the eight cycle paths at the UFRN central campus, providing processed data to be exploited by the CyclingView subsystem.
5.4. Cycle Paths Evaluation and Visualization
For the monthly generation of quality maps, the collected data were formatted according to the files exemplified in Listings 1–3, in order to provide data as input to the BrazilCycling evaluation system, the BikeWay. Thus, the data presented in
Table 6 were processed in order to evaluate the cycle paths according to their quality within the group of five BikeWay levels, as presented in
Table 7.
Being rated as very bad (VB), bad (B), moderate (M), good (G), or very good (VG), the considered cycle paths obtained roughly the same quality results for each month of 2020. From the analysis of these cycle paths qualities, which are a reflection of the variation in the city statistical data between the phases of fighting the COVID-19 Pandemic in the city of Natal, it was possible to perceive the following aspects:
C5 to C8 are the best-rated cycle paths overall. This is due to the fact that these cycle paths are located on the UFRN campus, they have shared paths, and they are located in an environment with low car traffic;
C1 and C2 have an average rating in relation to the others. They have shared lanes and they are located on an avenue with reasonable car traffic;
C3 and C4 are the worst evaluated because there are no actual cycle paths, causing cyclists to compete for space with the many cars present on these stretches due to high traffic;
The 2020’s pre-pandemic phase was marked by very high rates of accidents and urban violence, which resulted in very bad to moderate ratings on all cycle paths;
When the Pandemic started and restrictions were imposed to prevent the propagation of the virus, a phase defined as “severe restrictions”, there was a significant improvement in the perceived quality of shared cycle paths, which reached good quality due to the low accidents rate. Meanwhile, the stretches with non-existent cycle paths were still considered as being bad because they posed an immediate risk to cyclists who were forced to pedal alongside cars;
After the relaxation of restrictions, there was again an increase in the accident rate, reducing the cycle paths perceived quality. However, environmental variables tended to soften due to the arrival of Autumn and Winter, causing shared cycle paths to reach a moderate level while non-existing cycle paths decreased from bad to very bad;
For every month, the urban violence rates were very high, and in this case, they did not influence the variation in the quality of the cycle paths.
According to the performed analysis, the most impacting factors about the chosen cycle paths in Natal are the structural conditions of the cycle paths and the high number of recurrent accidents in the city. In the survey “Cycling perception by people in Natal” (Percepção dos Natalenses Quanto ao Uso da Bicicleta) developed by the Federation of Commerce of Property, Services, and Tourism of Rio Grande do Norte with a population of 800 people, 53.1% of respondents said that drivers are a disincentive factor for cycling due to their poor education, which can directly reflect on the high rate of accidents.
In that survey, 51.9% of the participants stated that the quality of cycle paths could improve, as there are many places that force cyclists to compete for space with cars, such as the evaluated C3 and C4 cycle paths. Finally, another negative aspect mentioned by 55.6% of the survey participants is related to public safety, which, as seen in the data collected for 2020, has terrible statistics.
So, in order to guide those responsible for the construction and maintenance of cycle paths and/or the public authorities in order to improve these aspects, accurate implementation of BrazilCycling becomes feasible and very usual since the evaluations in the scope of this work have synergy with the cyclist’s perception in the considered city. Thus, it is imperative to provide visualization tools for these cycle paths for feedback on their qualities for cyclists and public authorities. In this context, data from the eight monitored and evaluated cycle paths were provided to the CyclingView subsystem, which generated maps for all monitoring months (following a pattern per phase of 2020), as presented in
Figure 14. As an essential remark, the color pattern presented in that figure follows the specifications in [
24], which is based on a heatmap standard with worse qualities displayed closer to the red and best qualities displayed as blue marks.
6. Conclusions
Adopting sustainable cycling initiatives is an fundamental challenge in modern cities, directly related to improving urban mobility services and promoting healthier habits. Although it has been a significant trend lately, with many cities struggling to improve their cycling infrastructure, innovative solutions should be created in different scopes to support better the transition from traditional mobility patterns to sustainable alternative transportation.
When overcoming several difficulties for sustainable cycling, the quality of the cycle paths is a significant characteristic to be considered. While some works have addressed the cycling quality of the available paths, for example, according to their pavement and signaling, there is an urgent need to better perceive the adverse conditions that bike paths may have on cyclists in a city, especially concerning their health and safety. Understating such negative impacts may be crucial to support smart cycling further.
The proposed iBikeSafe approach is an important step toward adopting of monitoring, evaluation, and visualization services to improve urban cycling since the perceived quality of cycling paths would be better known. In this sense, the proposed services and the interactions among them are important contributions to the area. Furthermore, besides the formal definitions of the iBikeSafe approach, the proposed iBikeSafe-complaint BrazilCycling implementation is another significant contribution, indicating how a comprehensive system comprising monitoring, evaluation, and visualization services could be implemented for accurate monitoring. In addition, however, although other implementations based on the iBikeSafe generic services could be implemented.
Finally, considering the BrazilCycling implementation, the presented simulated results for Natal, a medium-sized Brazilian city, are valuable as an important implementation and evaluation example, indicating how the proposed approach could be used in the real world. In this context, the achieved results were satisfactory, contributing to the overall validation of the proposals.
As future works, the monitoring module of the BrazilCycling implementation, notable to the MMS units, will be physically developed and attached to bicycles. The objective is to endow a large set of bikes with monitoring capabilities, which will provide monitoring samples to the overall quality evaluation of the cycle paths. This final phase will also be performed in Natal, supporting more accurate quality evaluations.


