Article

A Data-Driven Situational Awareness System for Enhanced Air Cargo Operations Emergency Control

by
Christos Spandonidis
1,*,
Fotis Giannopoulos
1,
Areti Petsa
1,
Periklis Eleftheridis
1 and
Elias Sedikos
2
1
Prisma Electronics SA, Leof. Poseidonos 42, 17675 Kallithea, Greece
2
Prisma Electronics LTD, 111a George Lane, London E18 1AN, UK
*
Author to whom correspondence should be addressed.
Submission received: 22 June 2021 / Revised: 13 July 2021 / Accepted: 22 July 2021 / Published: 24 July 2021

Abstract

:
Based on the constant need for safety and operational cost optimization, the air-cargo industry is continually evolving in the context of Industry 4.0. Used wisely, data can help the industry to provide critical resilience that will allow authorities to take proper measures/actions in response to unexpected disasters and secure societal protection. The “INTELLICONT” project combines state-of-the-art technologies blended with novel solutions to improve the loading/unloading time, the structural status awareness, and the safety and security of the air-cargo related operations (prior to, during, and after the flight), as well as to enhance their capabilities related to the execution of their duties. The suggested system is contextually aligned and harmonized with the existing international and EU regulations. In the present work, the remote monitoring and control system for intelligent aircraft cargo containers have been presented from the software perspective. The intelligent containers integrate three types of sensors, Structural Health Monitoring, fire suppression, and locking status indication. The focus has been given to the design and development of a Human Machine Interface (HMI) capable to visualize all related data for better and safer control of the aircraft cargo. It is shown that the system can contribute to making the air transportations safer, environmentally friendlier, faster and with the lowest possible cost.

1. Introduction

While different definitions have been introduced by many authors from the concept of the smart city, its description by [1] as a large conglomeration of citizens, businesses, institutions, and agencies working towards a continually improving quality of life, is one of the most illustrative. Airports are a crucial part of every large city globally that provide the means for pleasure transportation [2] as well as business development [3]. Besides, while sea-based cargo transfer dominates the global trading industry, air cargo is crucial for time-critical, high-value, and perishable goods [4]. Its importance in the latter case was emphasized during the last two years because of the COVID-19 pandemic and the need for the timely transfer of vaccinations and paramedic supplies [5]. As a result, air cargo operations are a “living cell” of any efficient smart city concept.
Within the heart of air cargo operations lies the Unit Load Devices (ULDs). According to the International Air Transport Association (IATA) [6], an estimated one million aircraft ULD are operating in nearly all airports globally. ULDs are mainly primitive aluminum cage structures with minimal structural properties and substantial tar weight which penalizes the net loading capacity and fuel burn. They rely on permanent transportation components and crew intervention to be moved and secured in the cargo deck, which further increases aircraft weight, loading time, and operating cost. Moreover, being practically the only removable aircraft part that is handled by other than the operating crew members, ULDs have a strong impact on in-flight safety. After a series of cargo fire incidents, the Federal Aviation Administration (FAA) recently presented a new regulation [7] on fire-resistant ULDs. A potential emergency, threatening to humans’ lives and the environment during the air cargo life cycle, from a simple fire to a major stability accident, is strongly related to the timely and accurate actions of the involved team(s) of First Responders (FRs). As a result, modern ULDs should be able to restrain the loads and provide fire immunity and/or suppression capabilities with enhanced information to FR teams [8].
The majority of studies on the field have to do with the management and optimization of the operation of ULDs [9,10,11,12], mainly because there is a great impact on the delivery cost involved with cargo handling activities. In [13], a review of the most important efforts towards this direction is provided. Moreover, in [14], the authors provide an up-to-date list of key players within air cargo operations and briefly describe relevant issues from their different perspectives. While operational efficiency of air cargo transportation is of the utmost importance, unfortunately, incidents having cargo transfer as the core event are not rare. For air operations, the monitoring of the status of air cargo should be a topic of great interest due to the serious hazard of cargo which can lead to a safety-related alert. Battery presence is particularly dangerous since it turns what appears to be safe cargo into easily flammable cargo with a very detrimental effect on the carrier safety. Following [7], more than 100 incidents related to battery inflammation in cargo holds have been reported since 2019. More than half of them were related to the transfer of dangerous cargo, while 5% resulted in major operational destruction. Recent statistics [10] reveal a bleak picture of air cargo operations safety. As shown in Figure 1, almost 50% of accidents have to do with cargo, Low-Cost Carrier (LCC), and Full-Service Network Carrier (FSNC) operations.
The number of efforts focusing on the safety and monitoring of ULDs is significantly lower, although there are some examples of solutions developed for the remote monitoring and control of cargo handling [15], Structural Health Monitoring [16,17,18], and intelligent fire detection systems [19,20,21]. While important, none of the available solutions provide a complete solution for the remote monitoring and control of the container regarding its structure, status, location, handling fire and smoke warnings, and monitoring data. Working towards this direction, IATA, through its project called “Interactive Cargo” [22], aims to provide a regulatory regime to enable and ease the use of connected devices that interact with air cargo. The project involves a large number of stakeholders, but mainly focuses on air cargo tracking.
To address these issues, the “INTELLICONT” project integrates the best available technologies with novel solutions to Enhance Situational Awareness and support relevant crew and technical staff in the execution of their duties and involvement. In our previous work (under evaluation) we focused on the description of a novel intelligent Remote Monitoring System that is capable of receiving a feed from sensors in real-time and performing a preliminary analysis of sensor data and data from other sources (e.g., battery status). The objective of the current work is to describe the intelligent Human Machine Interface, which enables an adaptive smart working environment for air cargo operations crews, considering restrictions and needs of the harsh environment. Pillars of our architecture are (a) the novel visualization tool, (b) data fusion architecture, and (c) the standardized interconnection methods that will secure accurate predictions. To the best of the authors’ knowledge, no similar system that involves different aspects of ULD safety has been presented.
The main innovation of our work is the development of a system capable: (i) of creating strategies and methods regarding the safety of passengers and FRs, easily integrated into the existing ULD systems and technologies; (ii) of creating a complex collaborative system for surveillance, detection, and monitoring of safety-related incidents and events; (iii) of creating situational awareness, future escalation projection, and early warning methods to prevent safety issues; (iv) of allowing easy engagement and smooth cooperation of different FR levels (crew, headquarters, authorities, emergency response teams) in an air cargo related crisis; (v) of modelling, classifying and preserving pieces of evidence and easily reporting a safety event.
The rest of the article is organized as follows. Section 2 briefly presents the general concept of the project. The functionality of the intelligent ULDs is introduced in Section 3. Section 4 describes how the ULD is connected with the HMI developed for the data visualization to the users. The structure of the HMI is presented in Section 5. In Section 6, the proof-of-concept testing procedure followed is described. Finally, the conclusions are summarized in Section 7.

2. General Architecture

The main goal of the “INTELLICONT” project is to develop, manufacture, and validate a new intelligent lightweight aircraft cargo container with integrated functions for restraining, transportation, and fire/smoke suppression, with sensing and wireless monitoring capabilities. The smart ULDs (Unit Load Devices) will be transferred upon a robotic platform and placed safely at the aircraft’s cabin. Low-cost and low-energy sensors in the container with status (identification, location, locking state) detect critical events, fire/smoke, impacts, and accidental misuse during the loading and flight phases. The core of the system is the integrated Remote Monitoring System (RMS), which exploits recent advances in sensor network methodologies to assess the state of criticality, and to identify and monitor possible incidents. The general concept is presented in Figure 2.
The platform’s design was based on LAROS™ [23] and PrismaSense™ [24] systems, which were redesigned to meet the standards of the Aviation industry [8] using the wireless communication protocols (Wi-Fi) to transmit all collected & synchronized data to the HMI, where it can be stored, also ensuring data integrity and enhancing transparency in the case of future analysis and/or investigation, in a very efficient manner in terms of cost, speed, and safety. Transferred data can be further processed at the fleet level and combined with data coming from remote systems (FR teams, drones, satellites, weather forecasts, etc.). A hybrid data fusion architecture will enable the distribution of both processing power and storage capacity to different levels. In short, the data flow pipeline of the RMS System will be the following:
  • Smart Collectors set up a secure wireless network inside the ULD to transmit the processed data to the HMI with a user-defined sampling rate and the ability to maintain and customize them remotely. The wireless protocol will be based on IEEE 802.15.4, with additional layers and data format to cover the requirements of the airport environment and increase the network quality of service, while secure transfer protocols ensure scalability of the solution;
  • Data from collectors will further be transferred to the in-field HMI. All data are stored in data lakes for an extended period (up to one year, depending on the number of sensors and sampling rate). Being the upper layer of the onboard architecture at this level, two tasks will be performed: (a) the execution of ML and AI algorithms for early warning reasoning, (b) Real-Time Visualization via Augmented Reality alerting of all outcomes;
  • Through HMI, data from the collector network on each of the ULDs are delivered to the robotic platforms. HMIs secure (a) the uninterrupted connectivity with dedicated collector networks, and (b) the collection of data that needs to be processed in real-time. HMIs on each air cargo loading/unloading operation establish a separate wireless network for data exchange between them;
  • HMI periodically produces binary files and compresses them to reduce the size of the data to be sent via normal satellite broadband to the data center (Cloud Computing). The cloud could collect the processed data from a wide range of airplanes/ULDs (fleet wise) and handle them accordingly for the following fleet-level data analytics, data storage (Cloud level), and tracking/monitoring of incidents. Besides, third party data (e.g., weather, societal, satellite imaging disease dispersion), as well as data from in-field FR teams (drones, on-sea FR, nearby vessels), will be entered in the main database in the same format.
The smooth flow of information between the different components of the RMS system solution is performed through the design and development of user-friendly, fully parameterized, flexible software components. The status of each container (e.g., container number, position-locking state, structural condition), will be available in a Human Machine Interface (HMI) through a wireless communication network, such that problems would be detected, and proper measures would be taken, as shown in Figure 3. Figure 4 provides an overview of the decision-making flow (use case).

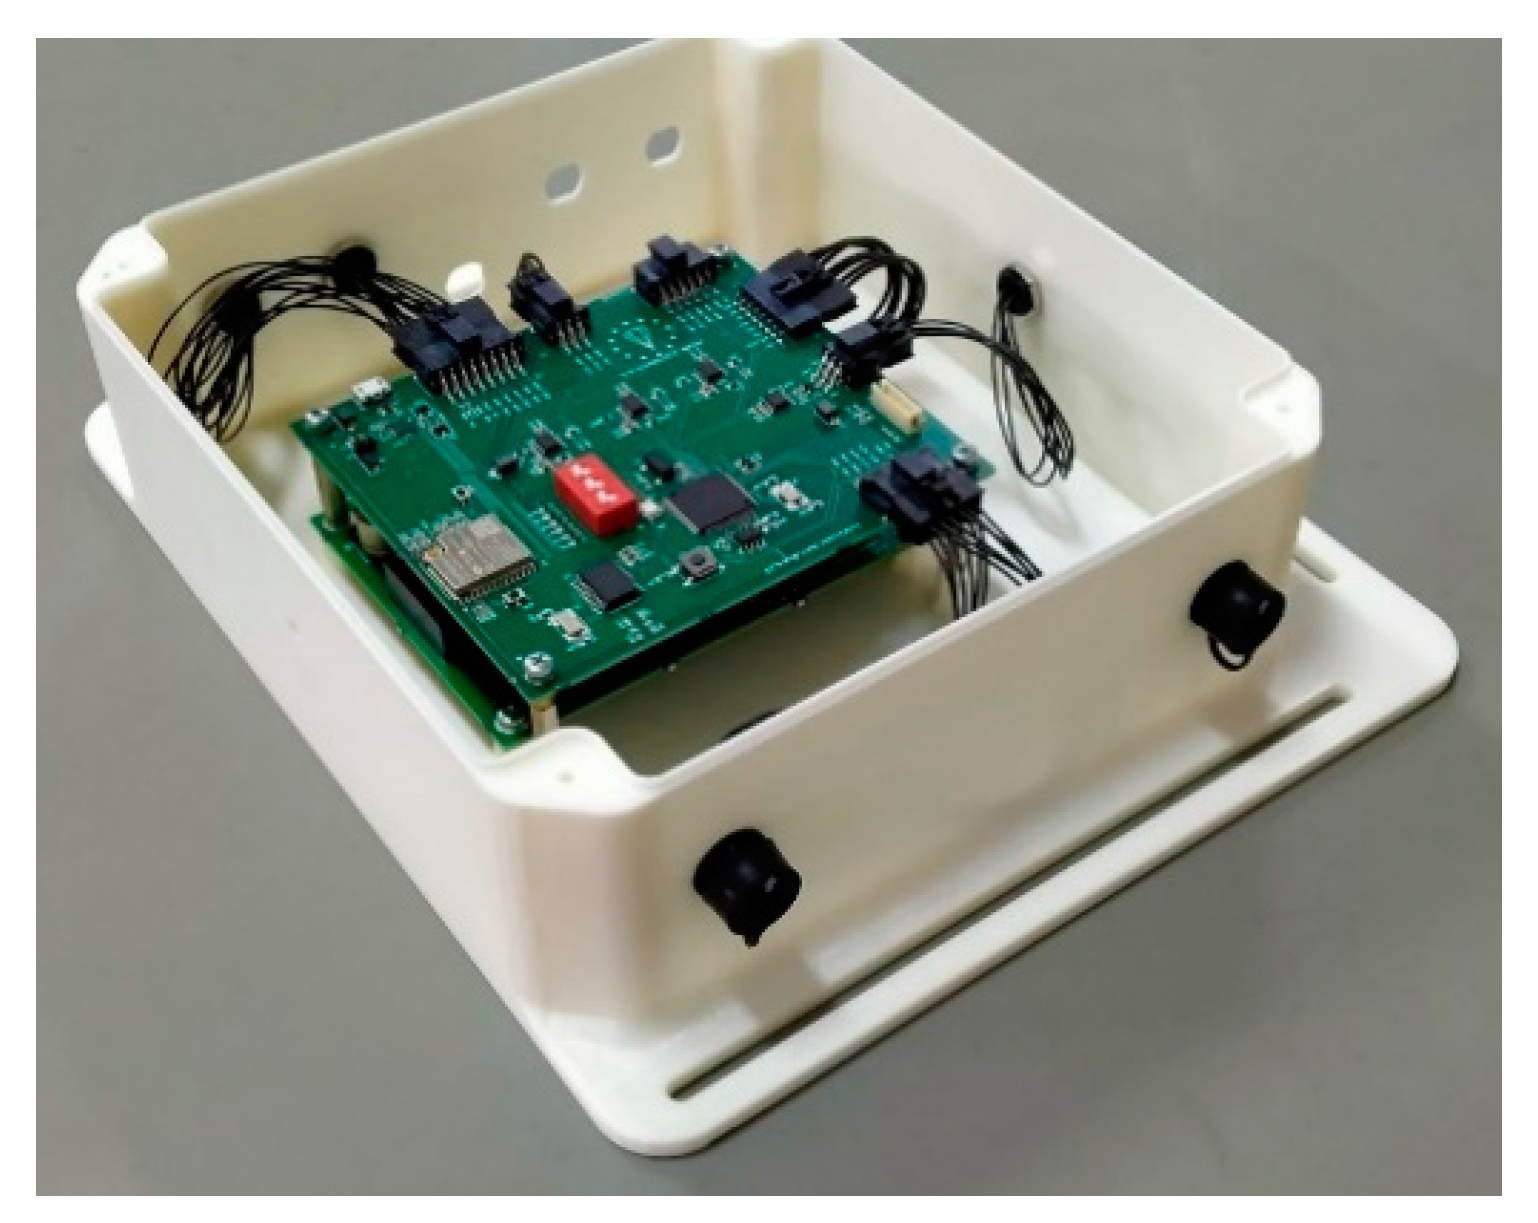
3. ULD Remote Monitoring System

Every sensor placed on the ULD is connected to the Main Board, which is responsible for collecting and processing data. The Main Board is powered by the Power Supply Board which provides the necessary voltage levels to the Main Board and the sensors (Table 1). The Main Board also includes a wireless communication module to transmit the sensors’ data. Figure 5 illustrates the ULD Remote Monitoring System assembled.
The ULD is designed to be at one of three states: Idle, Normal, and Lock. Regardless of the state, it will respond to every command sent by the HMI.
  • Idle: data from sensors are collected, although nothing is reported. If a smoke alarm happens, it will be reported to HMI. The system can still receive commands.
  • Normal: ULD will periodically report its measurements to the HMI, depending on its “report period” setting. It will also spontaneously send alarms to the HMI.
  • Lock: designed for the loading–unloading phase. ULD sends every 100 ms lock feedback to the robotic platform through HMI.
The ULD’s power supply is provided by two packs of batteries. A battery pack manager board is responsible for measuring the voltage of every cell of each battery every ten seconds. The charge percentage of each pack is calculated into a running average to smooth readings. At ULD Normal state, at the report, the charge percentage is sent to HMI. The switching between the two battery packs is done by a power source selector board. The first battery is always the first to deplete, after which comes the second. The convention used is that, at 0%, the pack does not provide power for the ULD to function properly while, at 100%, the battery pack is at its maximum charge capacity. The battery pack manager boards, the power source selector board, and the battery packs are shown in Figure 6.
RMC system can control three basic operations:

3.1. Smoke/Fire Detection

The smoke detector, PMC1103-03 of Siemens, needs to receive a request for data, and then it replies via the Controller Area Network (CAN) bus. However, it will spontaneously send data if it detects conditions for a smoke alarm, i.e., high smoke optical signal combined with high temperature and low humidity. Besides, the smoke detector transmits its status according to the list below:
  • Degraded mode: if any of the secondary parameters fail, the smoke detector enters degraded mode and relies on primary parameters only;
  • Warning: internal monitoring of the smoke detector triggered on a minor fault criterion, recording the occurrence;
  • Prefault: once the contamination of the detector reaches a fixed threshold, the smoke detector provides, through this flag, the necessity for maintenance;
  • Standby: the smoke detector is operational, but not in operation;
  • Alarm: the smoke detector has detected smoke signals or heat elevation signals that its algorithm identifies as a potential fire event and triggers the alarm;
  • Fault: internal monitoring of the smoke detector triggered in major fault criteria, recording the occurrence.

3.2. Monitoring the Structural Health of the ULD

The piezoelectric elements (×3) provide an analog voltage. This is measured every 20 ms in 12-bit resolution into an exponential average of 80% for each element by the ULD microprocessor, except when reporting the data. When the ULD is powered on, a calibration procedure is executed and a calibration reference is created for each element, assuming the conditions cause relaxed values. After every measurement, the current value is set as the calibration difference and compared to the threshold for an alarm or not.

3.3. Supervision of the Locking Status of the ULD

The magnetic position elements (×8) provide an analog voltage. This is measured every 20 ms in 12-bit resolution for each element into an exponential average of 80% by the ULD microprocessor, except when reporting the data. The switch contact elements provide on–off data. This is measured at ULD Normal state right before the report message is sent to the HMI and at the ULD Lock state right before the lock feedback message is sent to the HMI (every 100 ms).

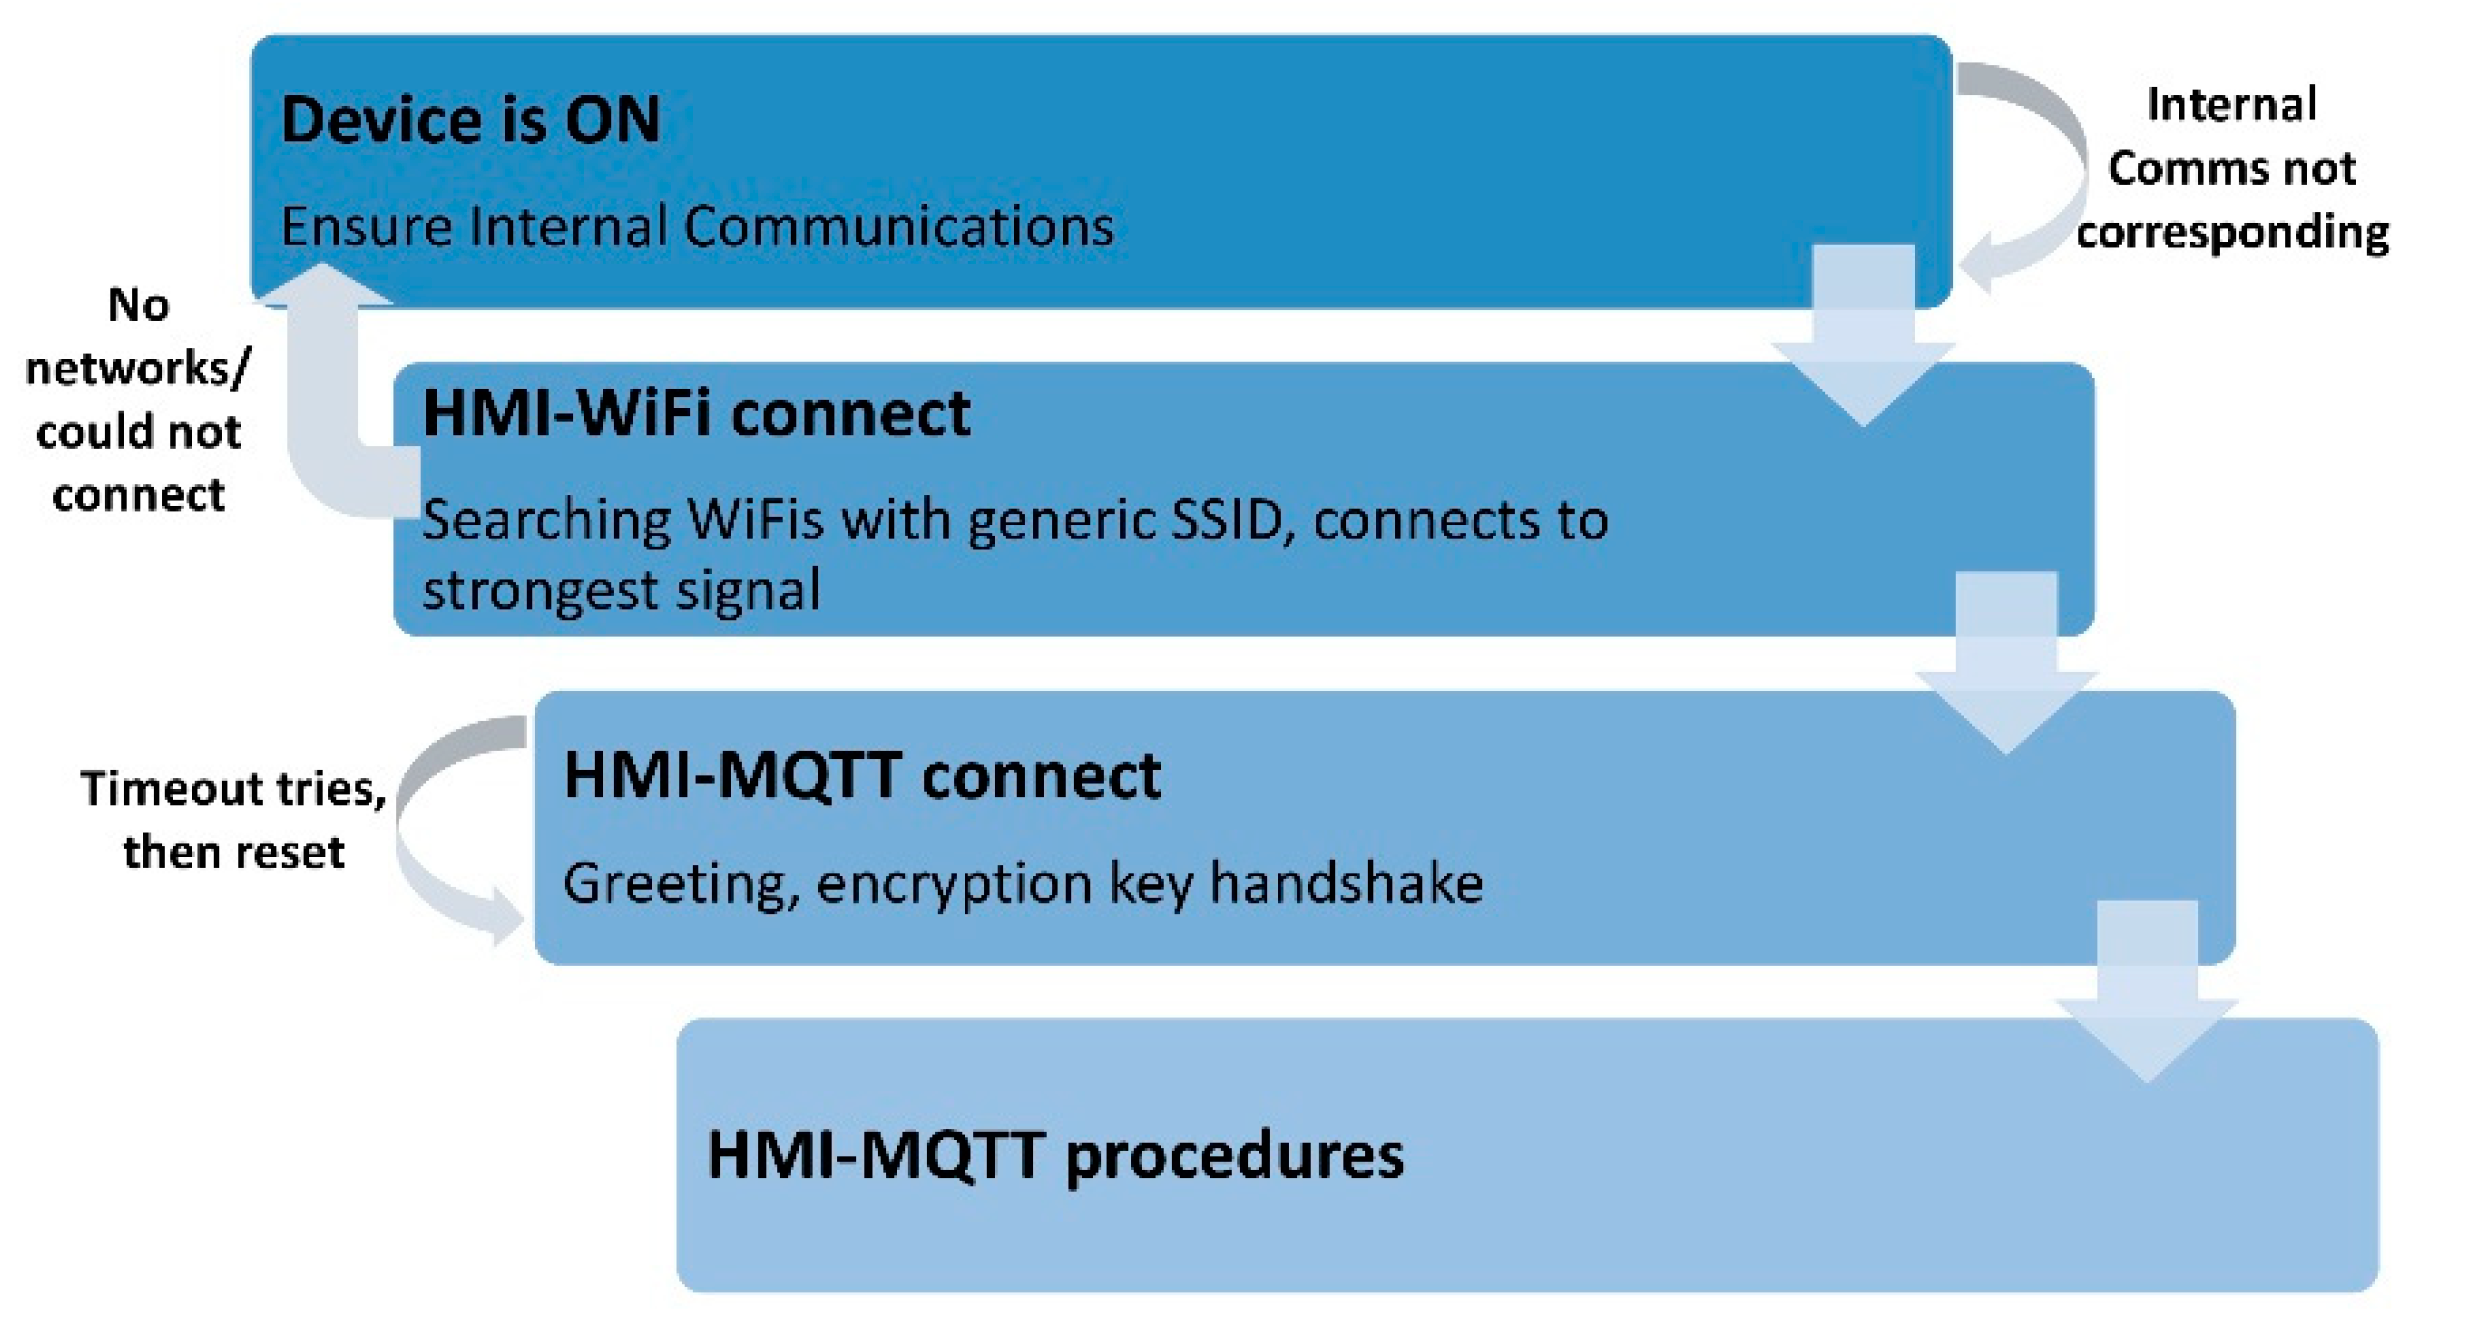
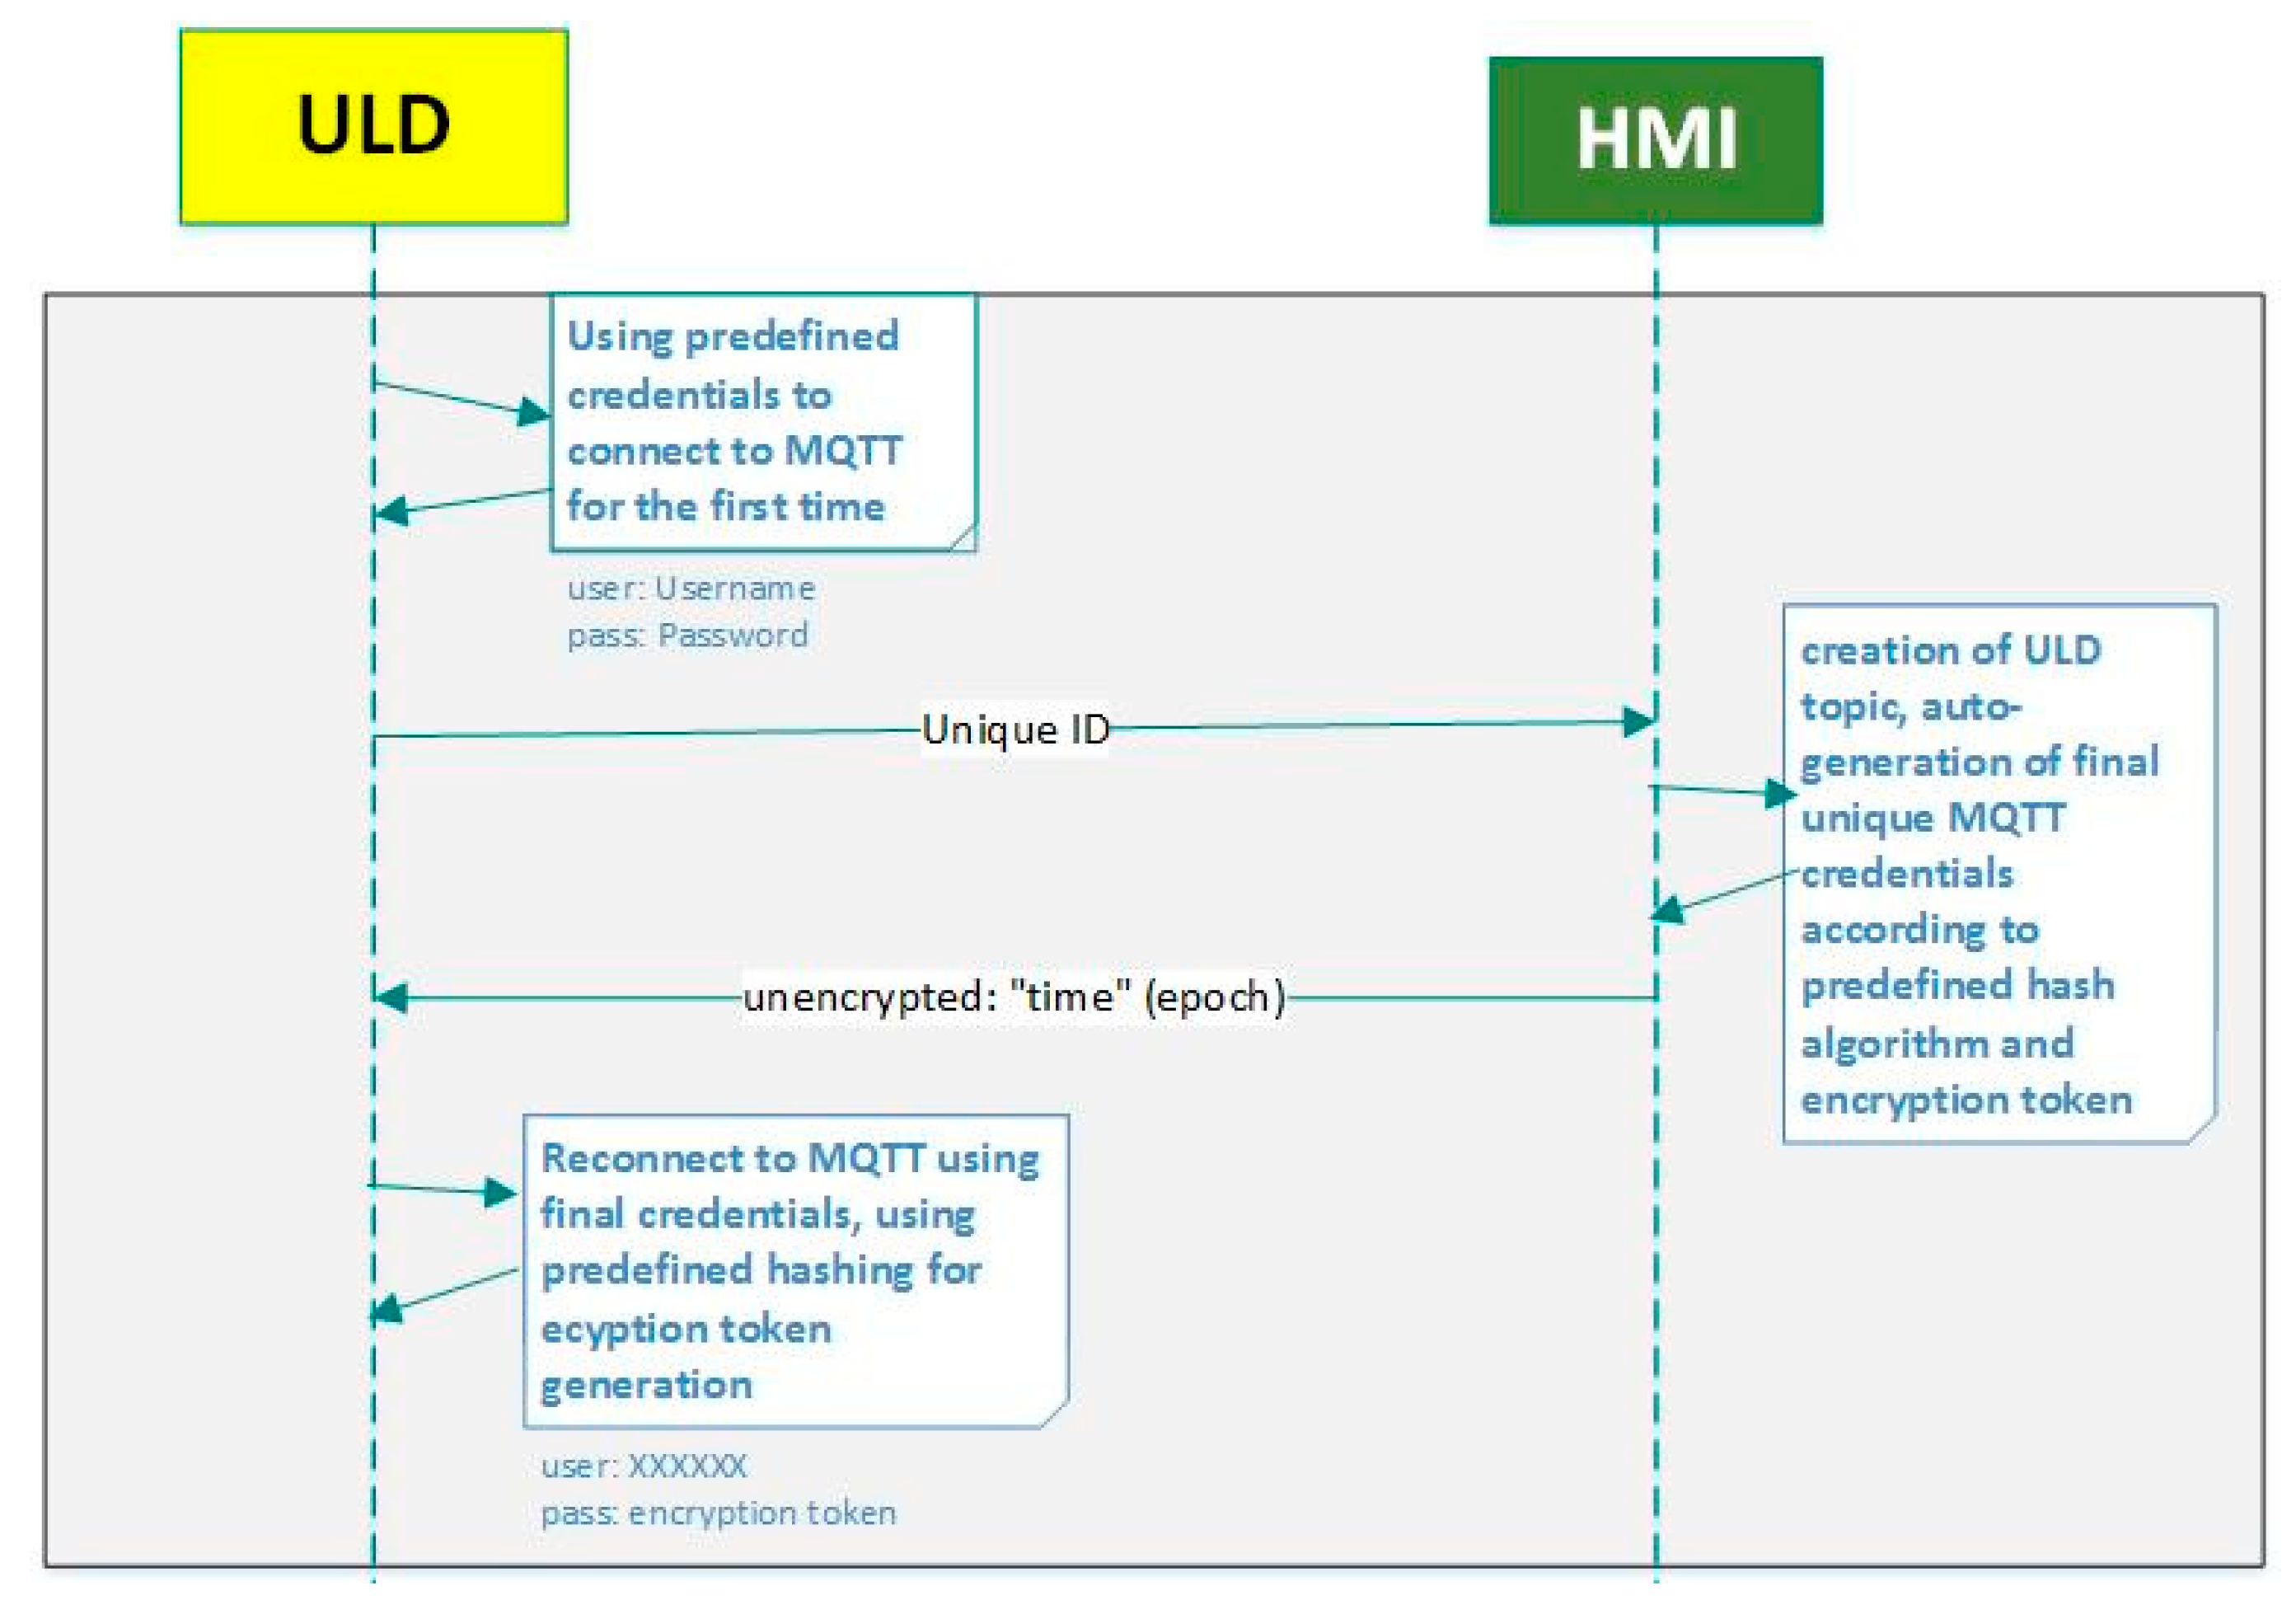
4. Communication Link

The ULD is designed to take measurements from sensors independently using settings ordered by the HMI wirelessly via Message Queuing Telemetry Transport (MQTT) protocol for when and how often to report that information. The ULD-internal timing of settings is supervised by RTOS mechanisms. The connectivity main frame of ULD can be seen in Figure 7.
It is a procedure that is fully automatic, with only one care of the installer agent: that the ULD and HMI are close enough for the Wi-Fi connection when the power is on. When the device (ULD) is given power, internal communications are ensured. If that is not ensured, the device resets. Otherwise, the device scans for Wi-Fi with Service Set Identifier (SSID) beginning with “INTELLICONT”, which the HMI broadcasts, and connects to the one with the strongest signal. This means that there can be many installations with “INTELLICONT” HMI nearby, but the ULD will connect to the closest one. One should consider that this will happen when a ULD is powered on. Again, if no networks are found, or if the Wi-Fi connection cannot be established, the device resets. That functionality can be power consuming, thus it is recommended that the matter of when to power the ULD be cared for. Then, a connection to HMI’s Message Queuing Telemetry Transport (MQTT) server with pre-configured static settings is tried a maximum number of times before a reset. If successfully connected to the MQTT server, the MQTT Ack - encryption key exchange happens between the ULD and HMI, as seen in the sequential diagram of Figure 8. After that, having secured the connection, the ULD awaits orders from the HMI to serve each of the HMI-ULD needed functionalities.

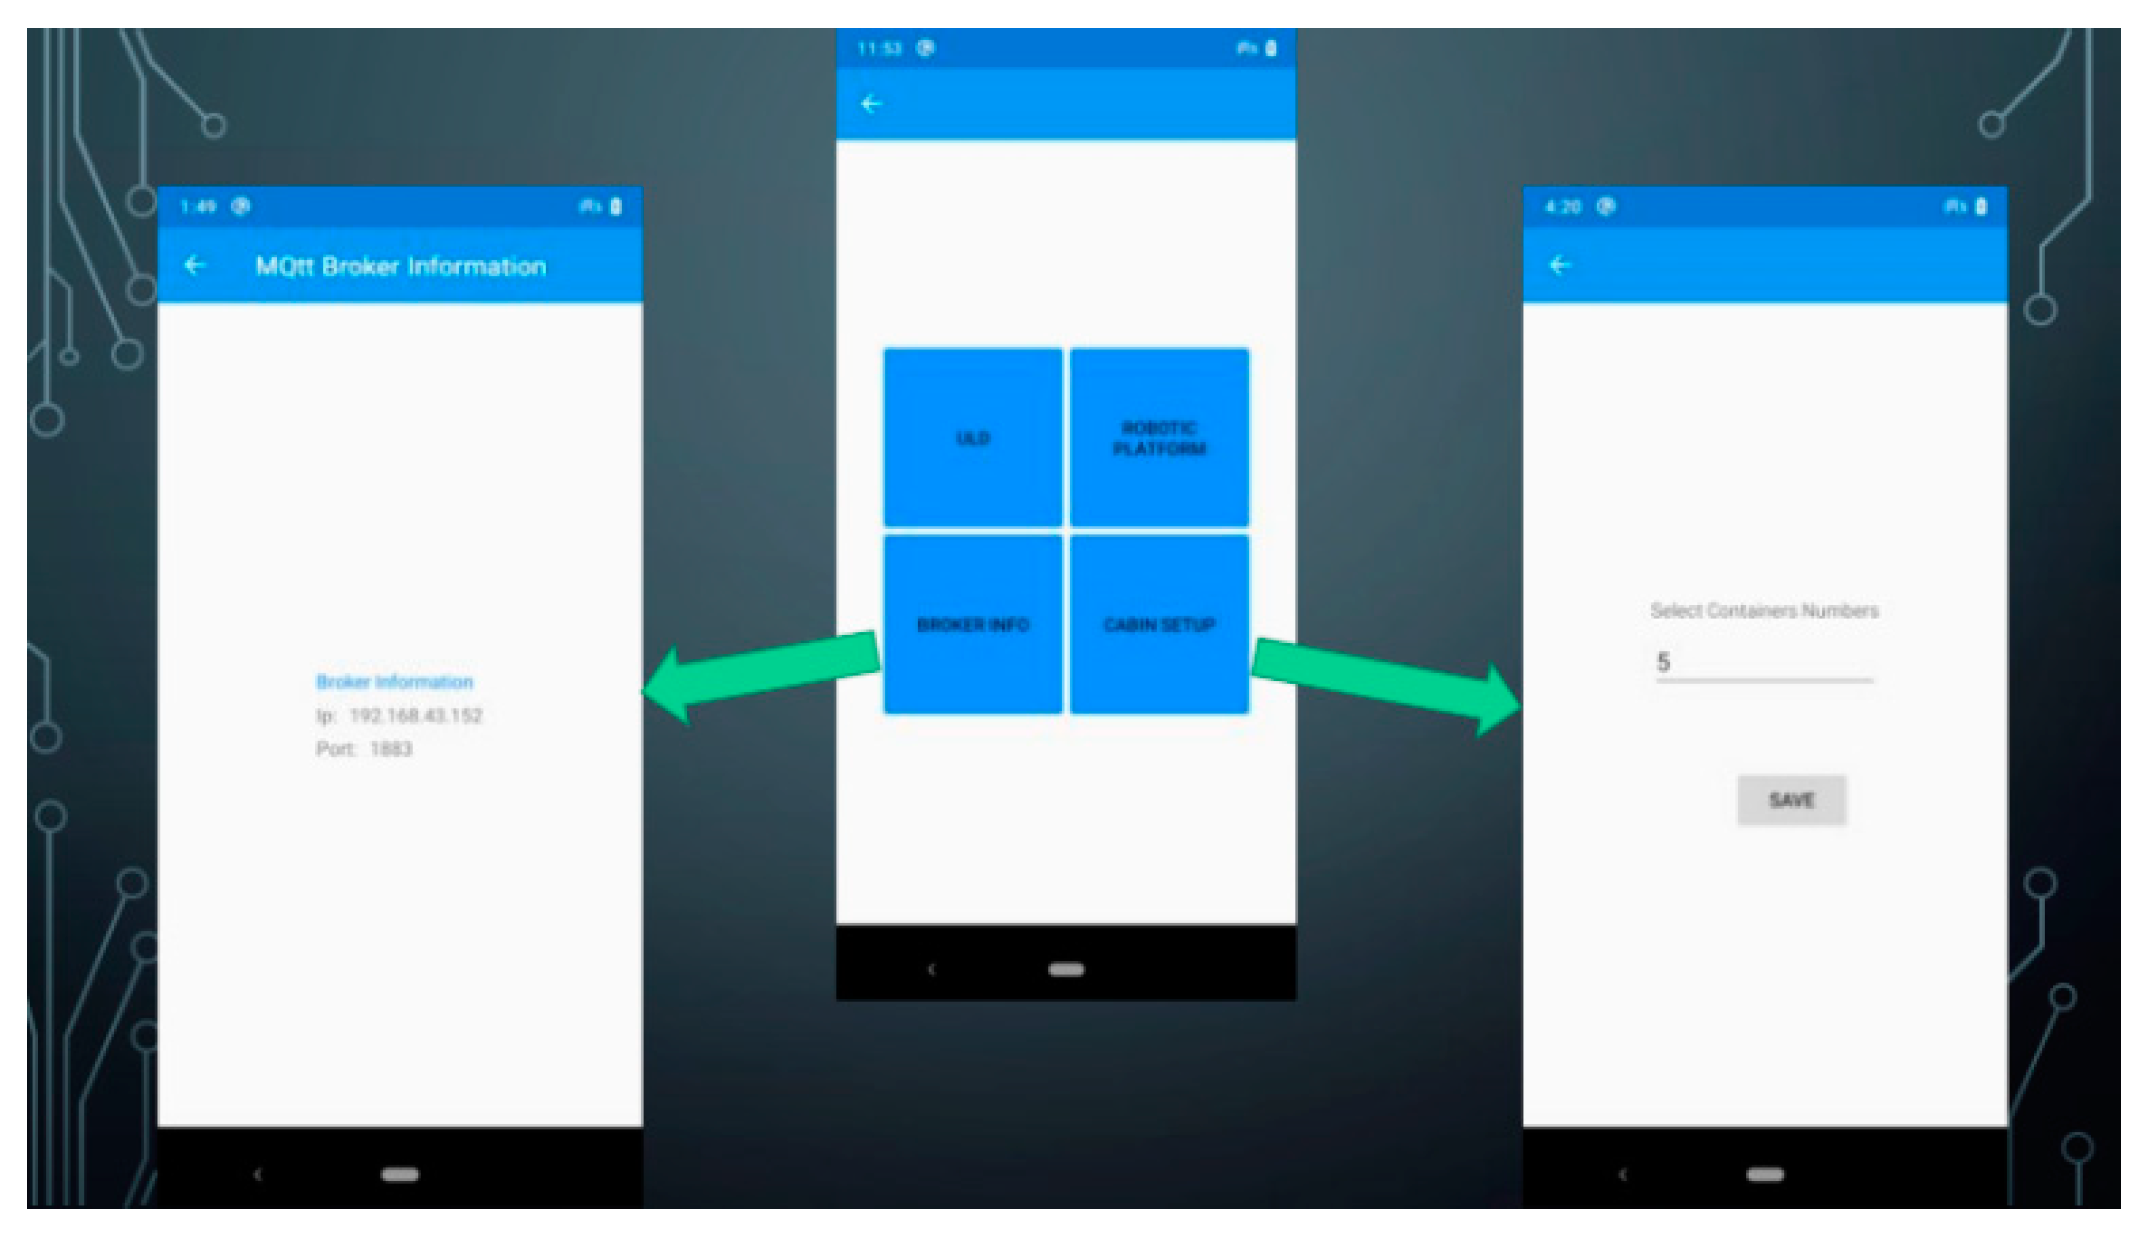
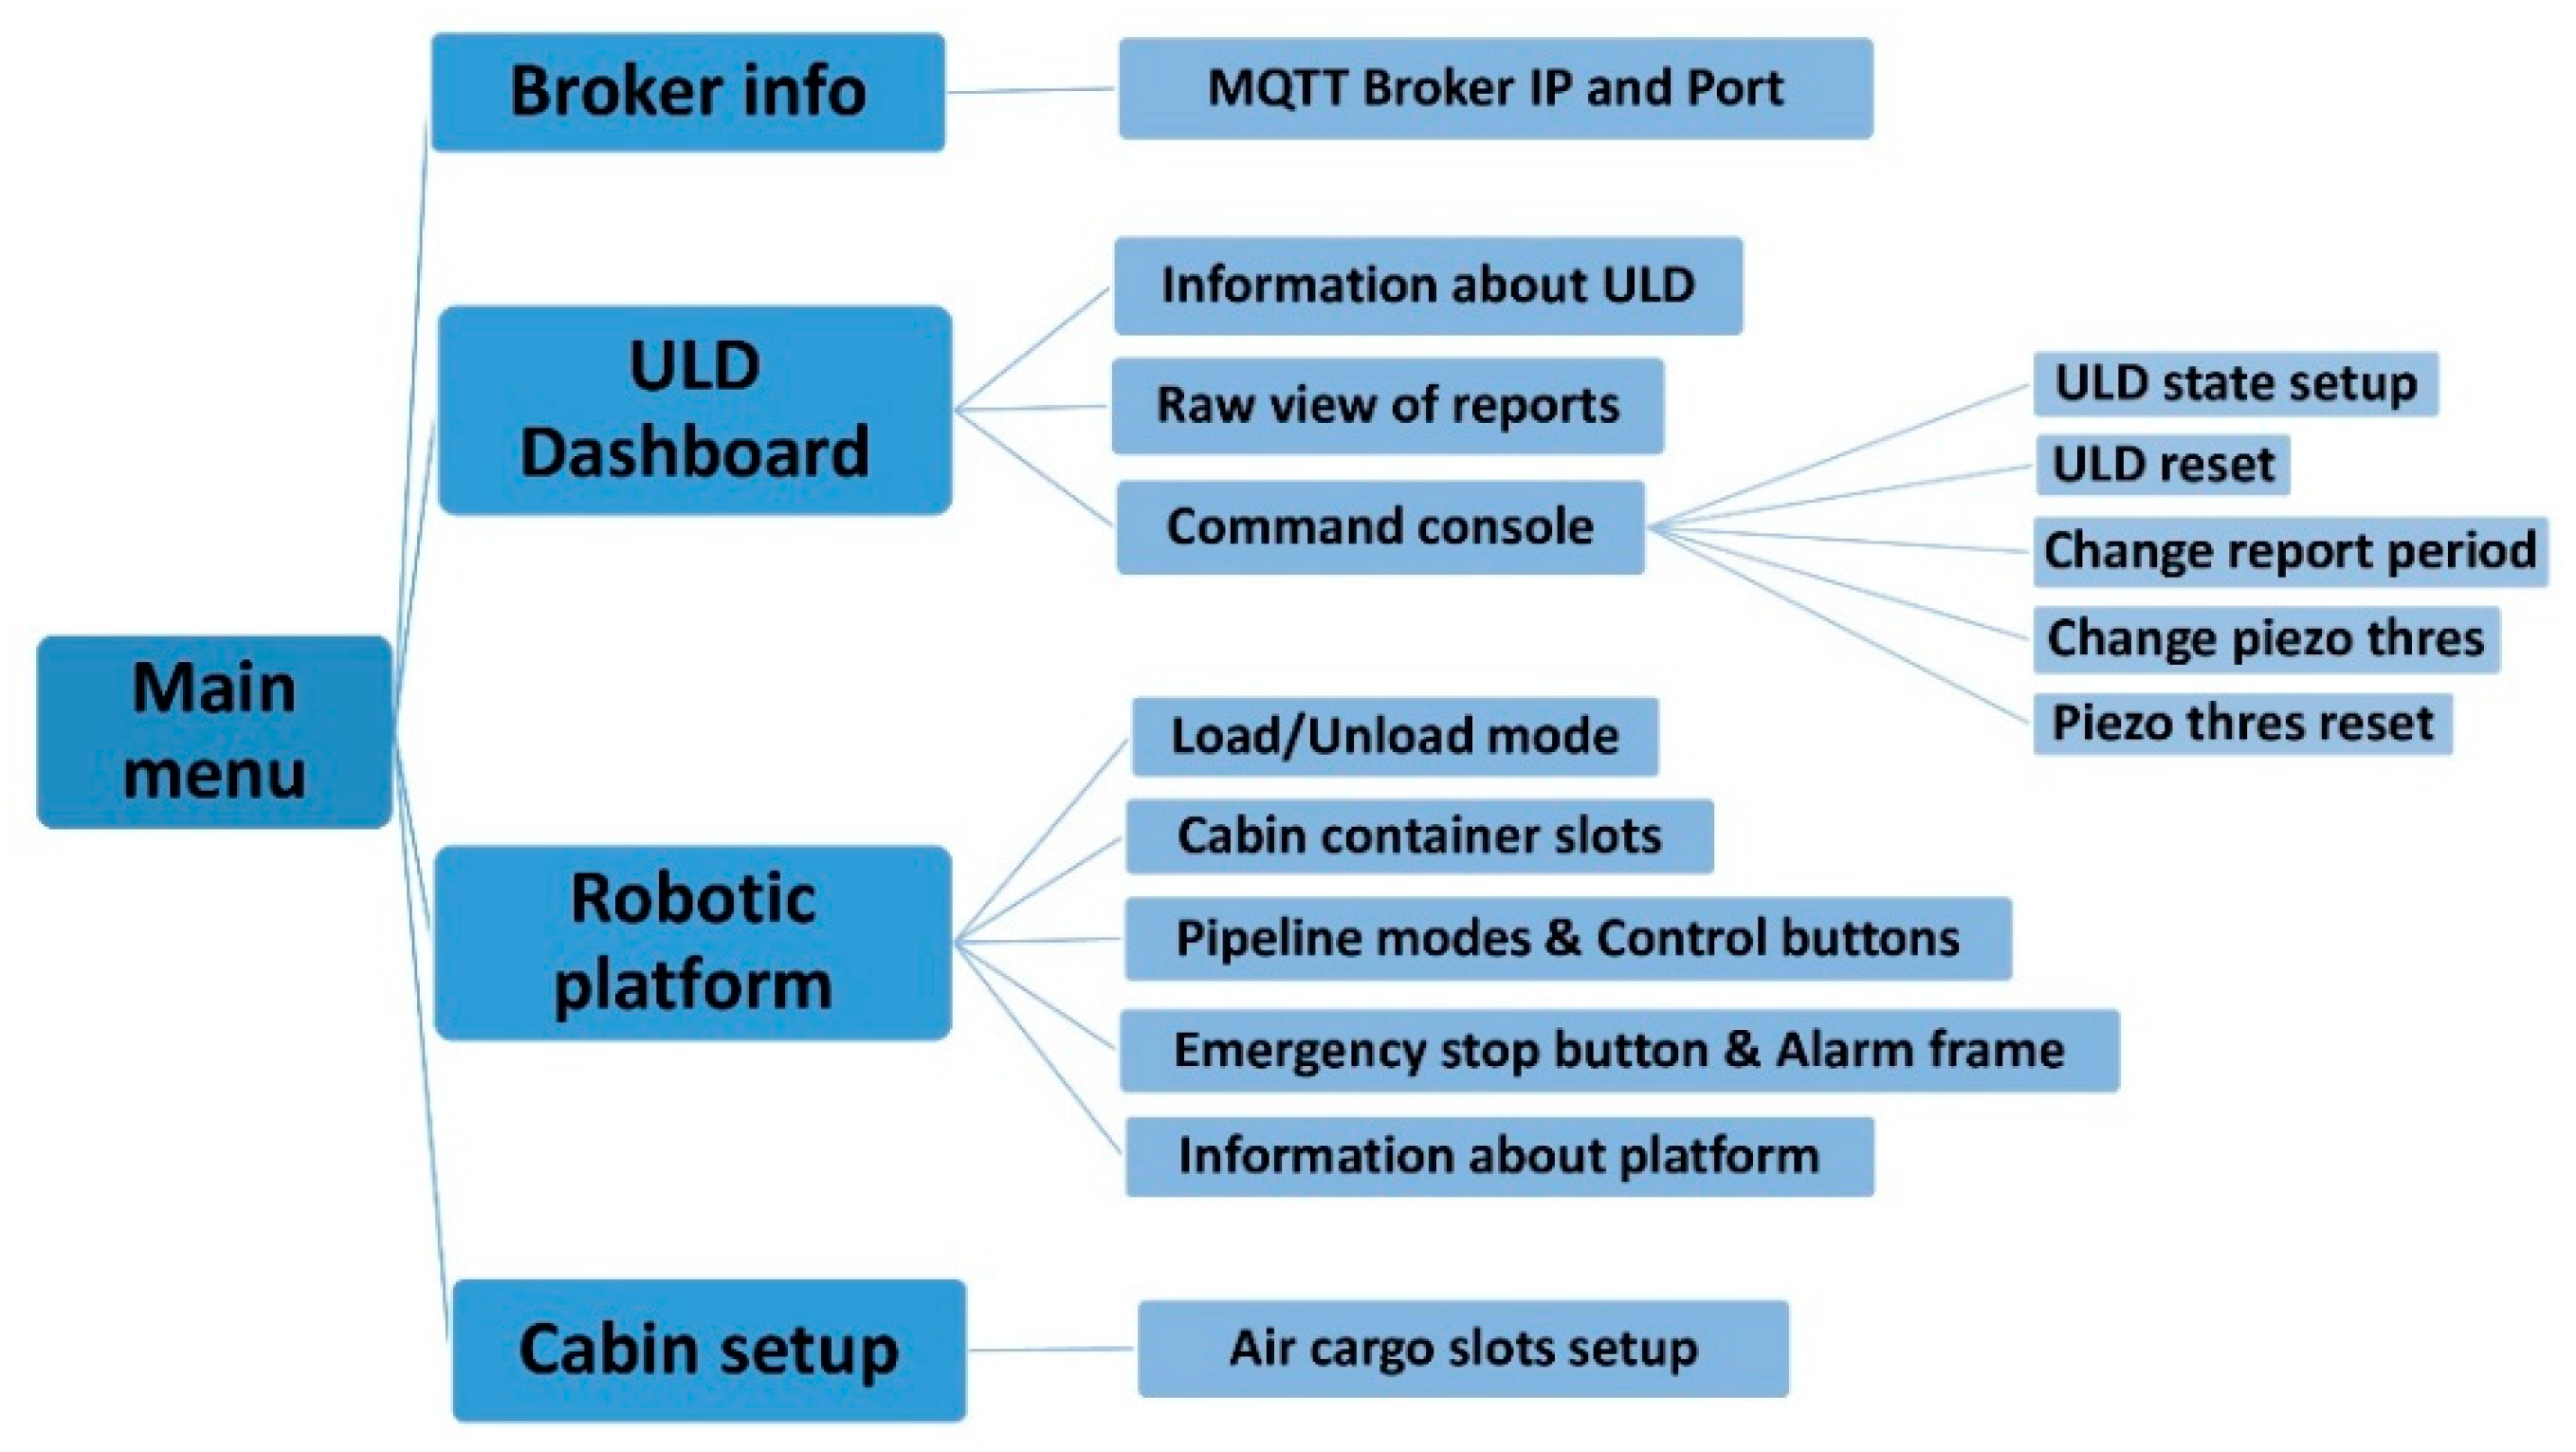
5. Human Machine Interface

“INTELLICONT” is a cross-platform application for portable devices with the same functionalities in all platforms and small changes in UI. It requires the minimum OS versions to operate shown in Table 2.
The “INTELLICONT” Application communicates with the ULDs and Robotic Platform via Wi-Fi. A hotspot needs to open in a portable device before the “INTELLICONT” application is opened. The page in Figure 9 contains the main operating menu for the HMI application. From here, the user can navigate to the ULD Dashboard for monitoring ULDs, to the Robotic Platform Dashboard for monitoring and control of the robotic platform for loading and unloading ULDs to air-cargo, to the MQTT Dashboard for information about MQTT Broker Internet Protocol (IP) address and port, and to Cabin Setup to setup air-cargo slots.
Figure 10 shows how the HMI is structured. The ULD Dashboard Page and the ULD Information and Raw Data Pages are described below.

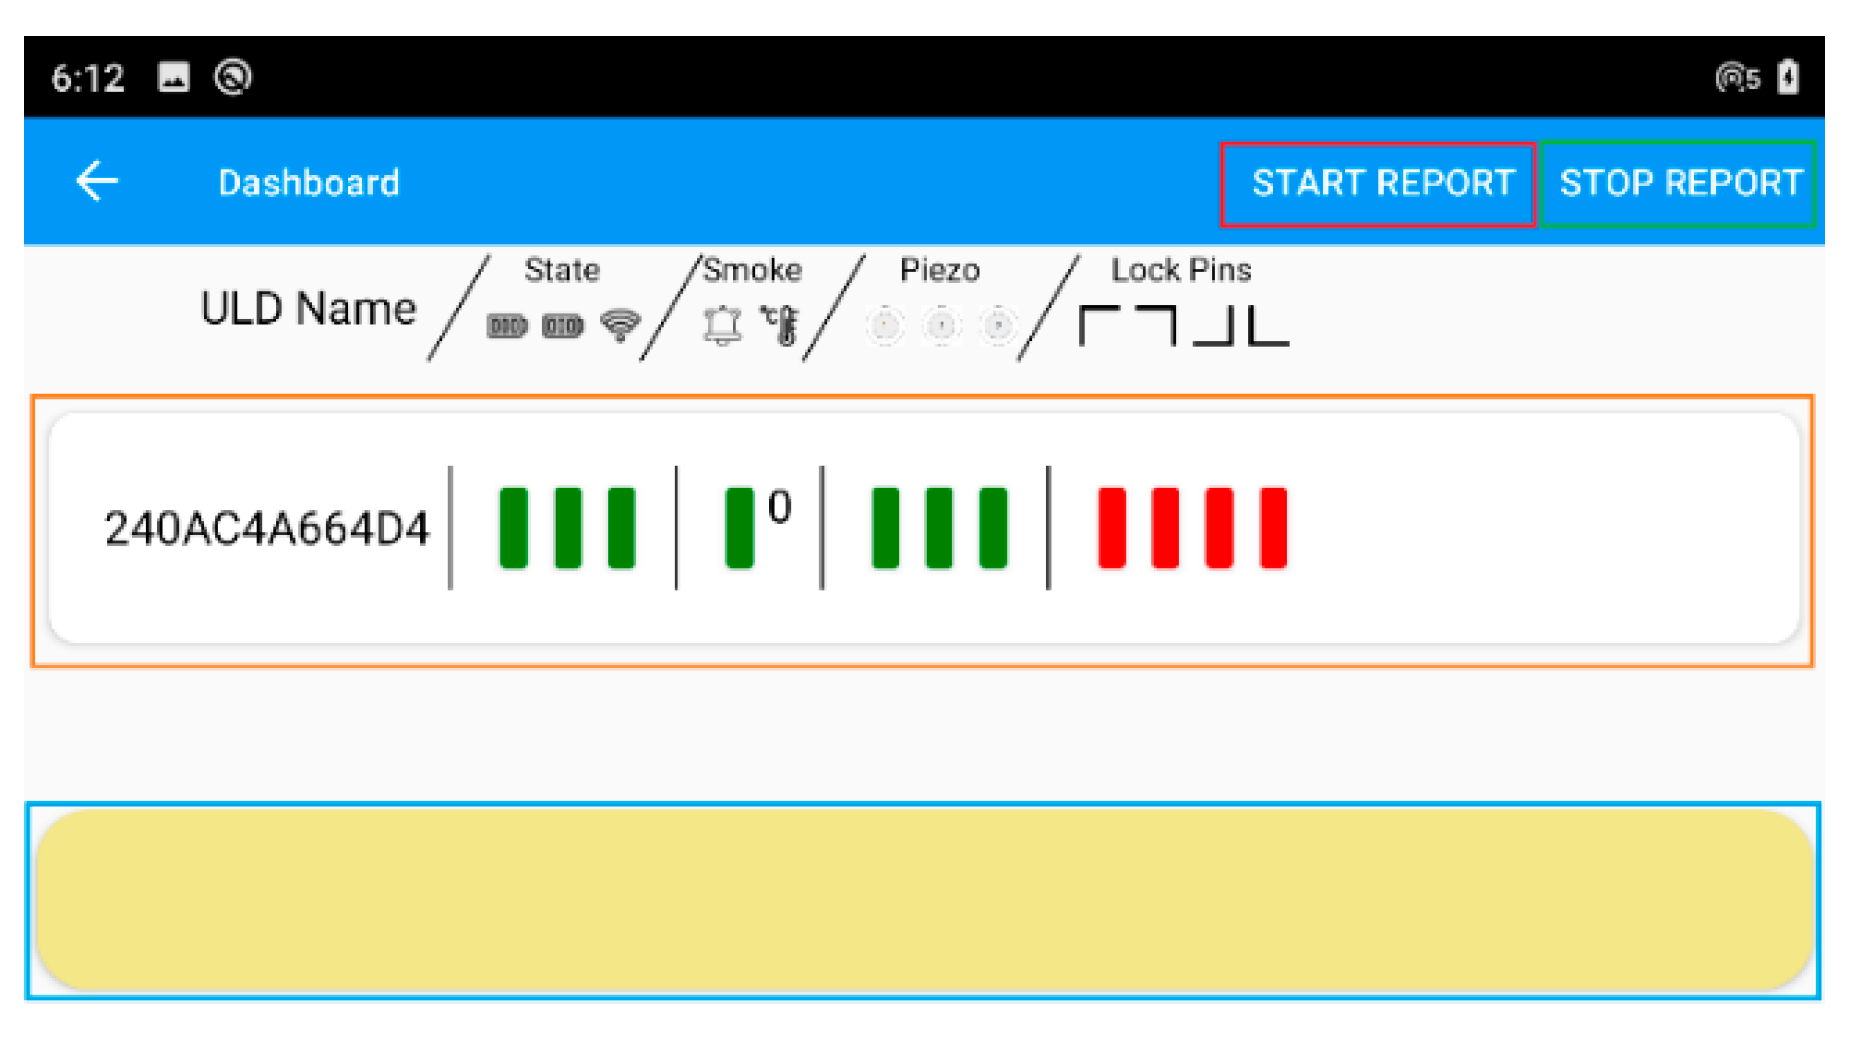
5.1. ULD Dashboard Page

In the ULD Dashboard Page (Figure 11), the user can see all registered ULD devices and their status indicators for batteries, Wi-Fi, smoke, piezo, magnetics, and alarms, and by selecting one the user can navigate to the ULD Information Page to see more detailed measurements. More specific presentation areas of the ULD Dashboard page with colored frames are:
  • ULD Device Frame with ULD name, Batteries Status color indicators, Smoke Sensor Status and Temperature, Piezo Sensor threshold status color indicators, and Magnetic Sensors corner combination color indicators. When it is pressed, it navigates to the ULD Information Page for more analytic ULD measurements;
  • Alarm Frame used to present real-time alarms from ULD devices;
  • Start Report Button that changes all ULD states to Normal for obtaining measurement reports;
  • Stop Report Button that changes all ULD states to Idle for stopping the obtention of measurement reports.

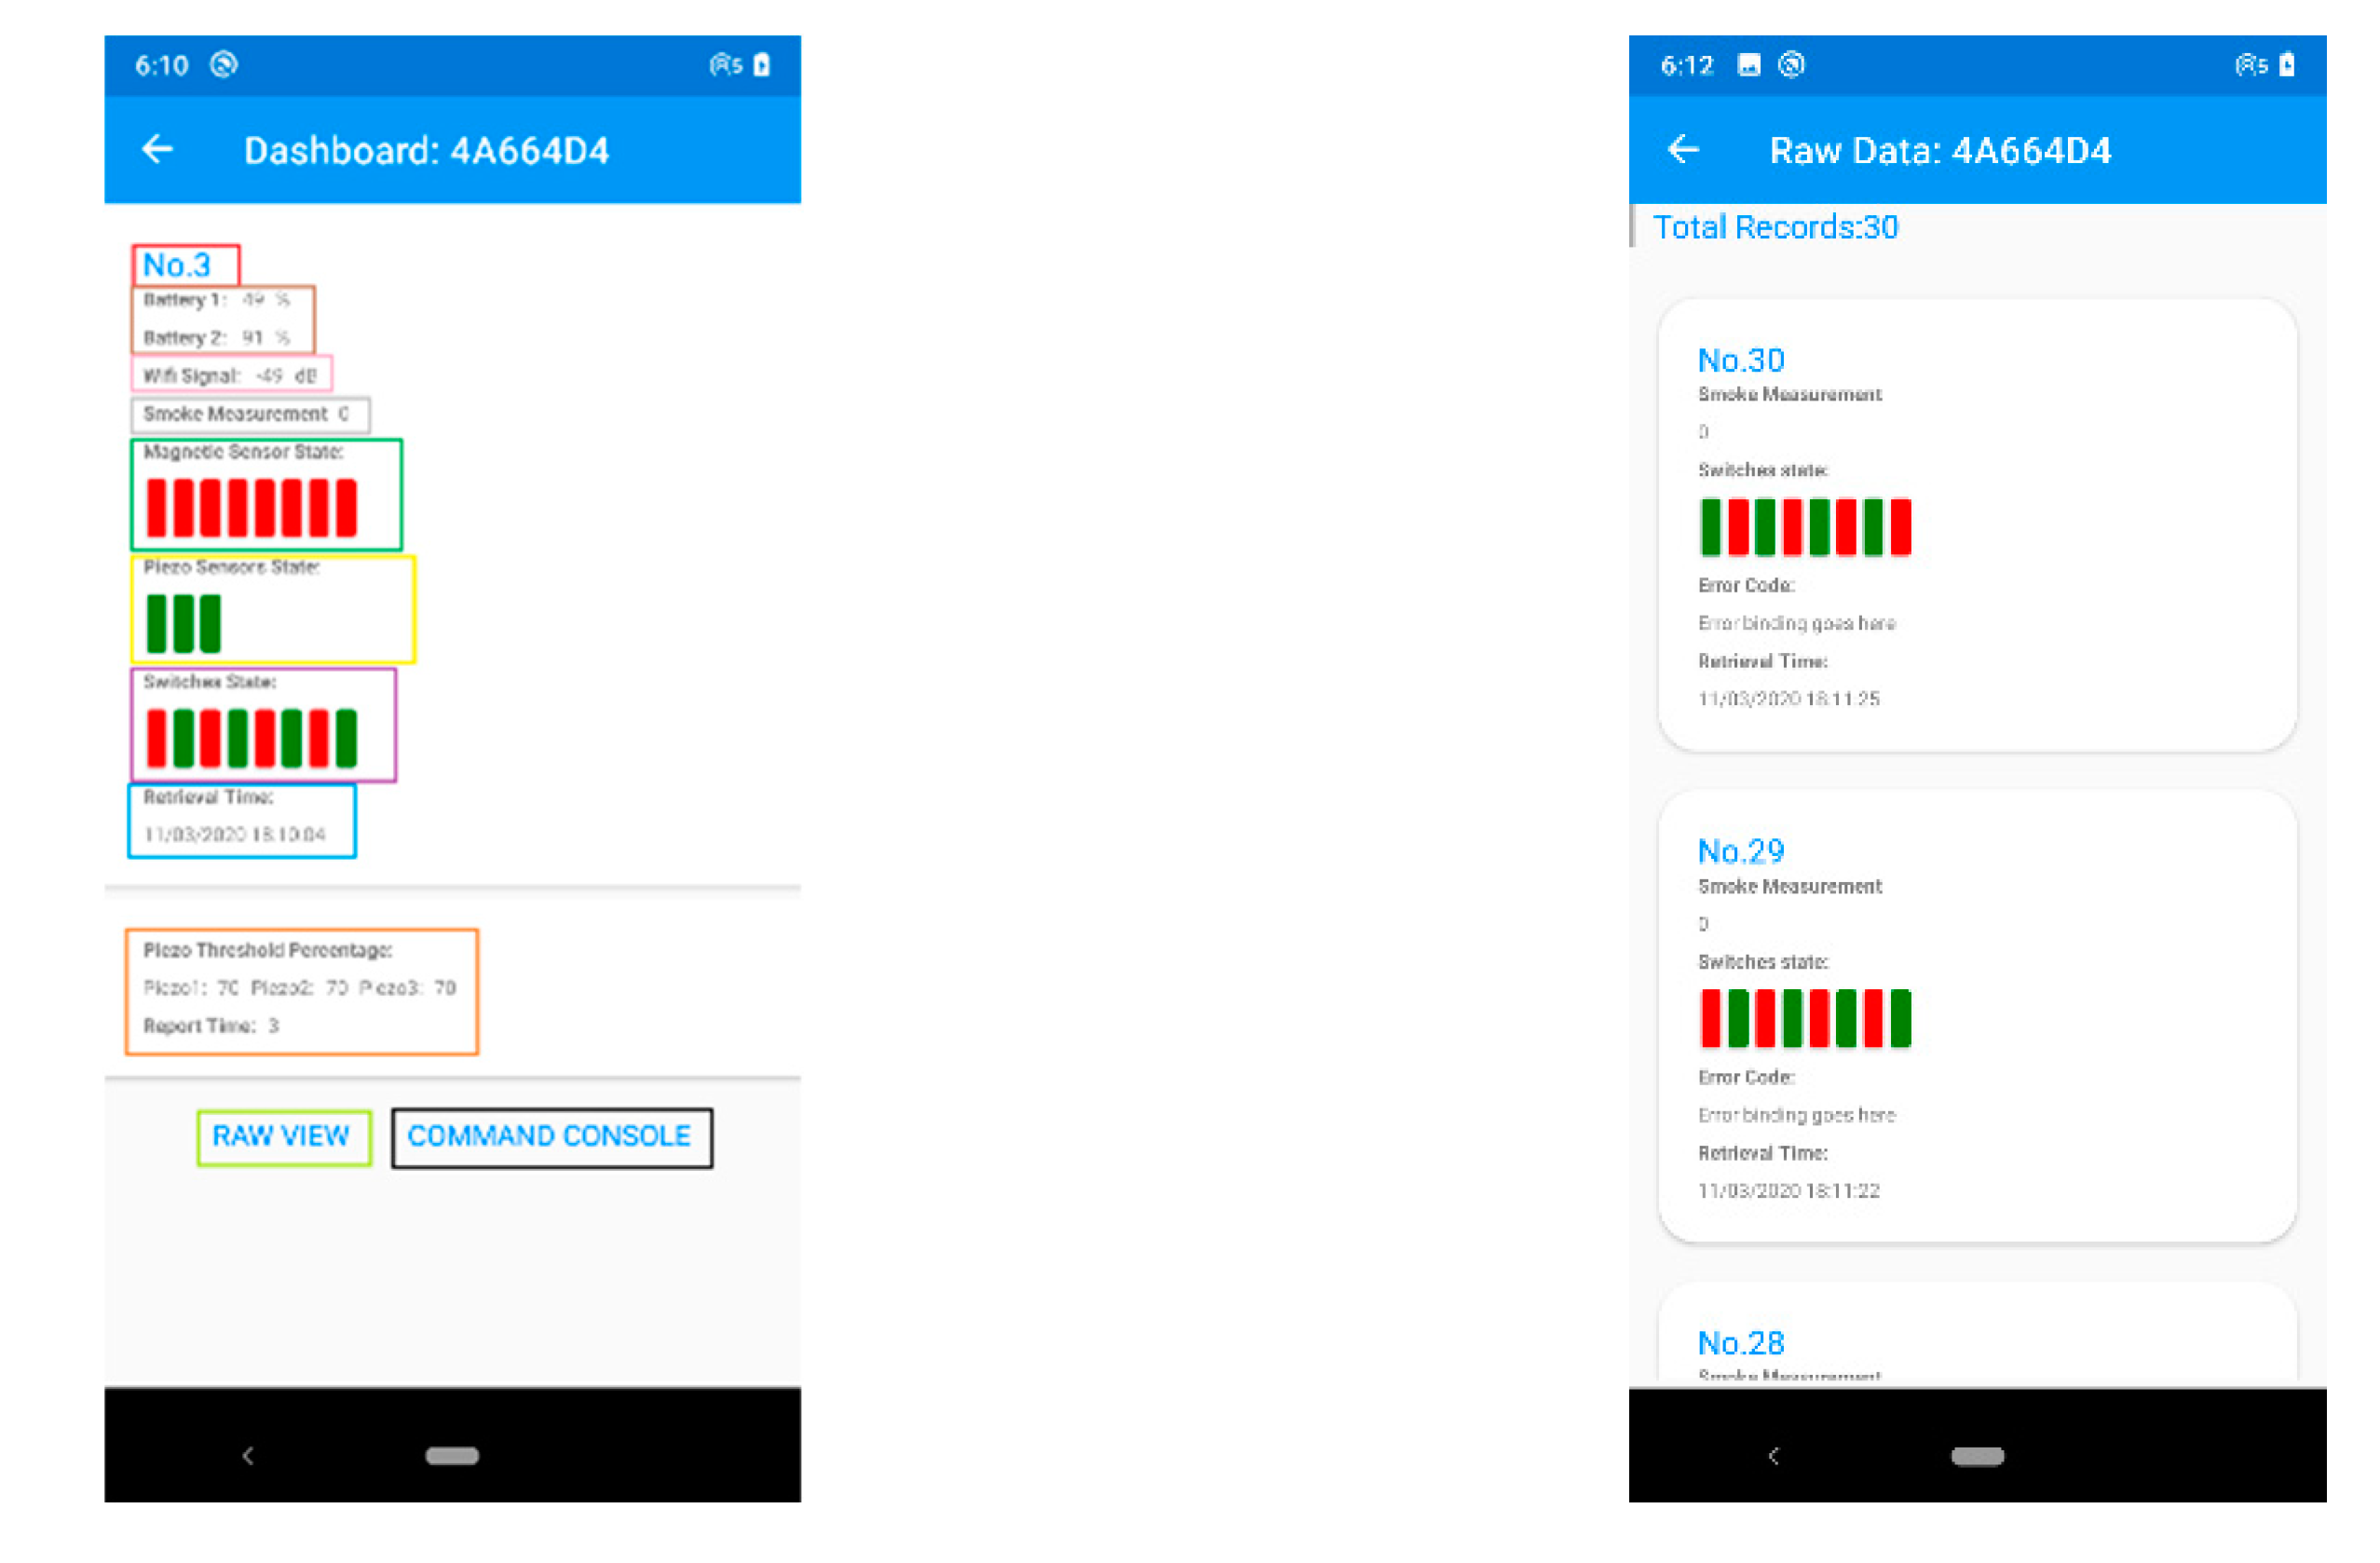
5.2. ULD Information and Raw Data Pages

In the ULD Information Page, there are the ULD measurement indicators shown in Figure 12, on the left in the color frames:
  • The number of Measurement packages;
  • The percentage level of the ULD’s Batteries;
  • Strength of Wi-Fi signal in dB;
  • Smoke measurement that comes from the smoke detector sensor;
  • Color indicators for eight Magnetic Sensors. If the value of the sensor is above 3200, then the indicator of the Magnetic is “Green”. Otherwise it is “Red”;
  • Color indicators for three Piezo Sensors. If the value of the sensor is above a threshold, then the indicator of the piezo is “Red”. Otherwise it is “Green”;
  • Color indicators for eight Digital Sensors. If the value of the sensor is 0, then the indicator of the sensor is “Green”. Otherwise it is “Red”;
  • Package Date and Time;
  • Piezo Sensors threshold and ULD report time in seconds.
The Raw Data Page contains all of the ULD measurement packages inside the Local Database with the same information as the ULD Information Page.

5.3. Robotic Platform Dashboard Page

In the Robotic Platform Dashboard Page (Figure 13), the user can see and interact with the active Robotic Platform by tapping each pipeline action and selecting the specific cabin container slots to load and unload ULDs and see real-time alarms and statuses from the Robotic Platform. More specifically, the Robotic Platform Dashboard Page areas with colored frames are:
  • Cabin Container slots that can set up from Cabin Setup Page and have color indicators for states: (i) container slot activity completed, (ii) container slot waiting for action, (iii) container slot in progress, (iv) container slot selected for action, and (v) Container Slot Activity Error;
  • Robotic Platform connecting ULD name and selection of Robotic Platform mode (Load/Unload);
  • Robotic Platform Pipeline Modes buttons;
  • Robotic platform Information: name, location, battery percentage, and signal strength in Db;
  • Robotic Platform Message console with colored frame messages: (i) Prompt Messages that prompt for user action, (ii) Warning Messages (i.e., “Low Battery”,” Weak Signal”), (iii) Error Messages Ongoing, task will be interrupted;
  • Alarm Frame which is used to present real-time alarms from Robotic Platform Pipeline;
  • Emergency Stop Button that, when tabbed, stops all actions from the Robotic Platform and releases two buttons fort the user: (i) Continue Button that continues the action of the Robotic Platform, (ii) Disable Button that disables the Robotic Platform after the user accepts the popup security notification;
  • Robotic Platform Pipeline control buttons: (i) GoHome Button that moves the Robotic Platform to Home Position, (ii) Connect Button, connecting Robotic Platform to ULD, (iii) Load Button, loading ULD after a user selects a Container Slot for Loading Mode and Unload ULD from Selected Container Slot for Unloading Mode, (iv) Unlock Button, which sets connected ULD to “Lock” state to Unlocking ULD from Container Slot and then sets the ULD back to “Idle” state after unlocking is completed, (v) Lock Button sets the connected ULD to “Lock” state to locking ULD to selected Container Slot and then sets the ULD back to the “Idle” state after locking is completed;
  • Robotic Platform Pipeline control buttons have colored states to indicate actions: (i) waiting for future actions, (ii) action in progress, (iii) action completed, and (iv) action Error.

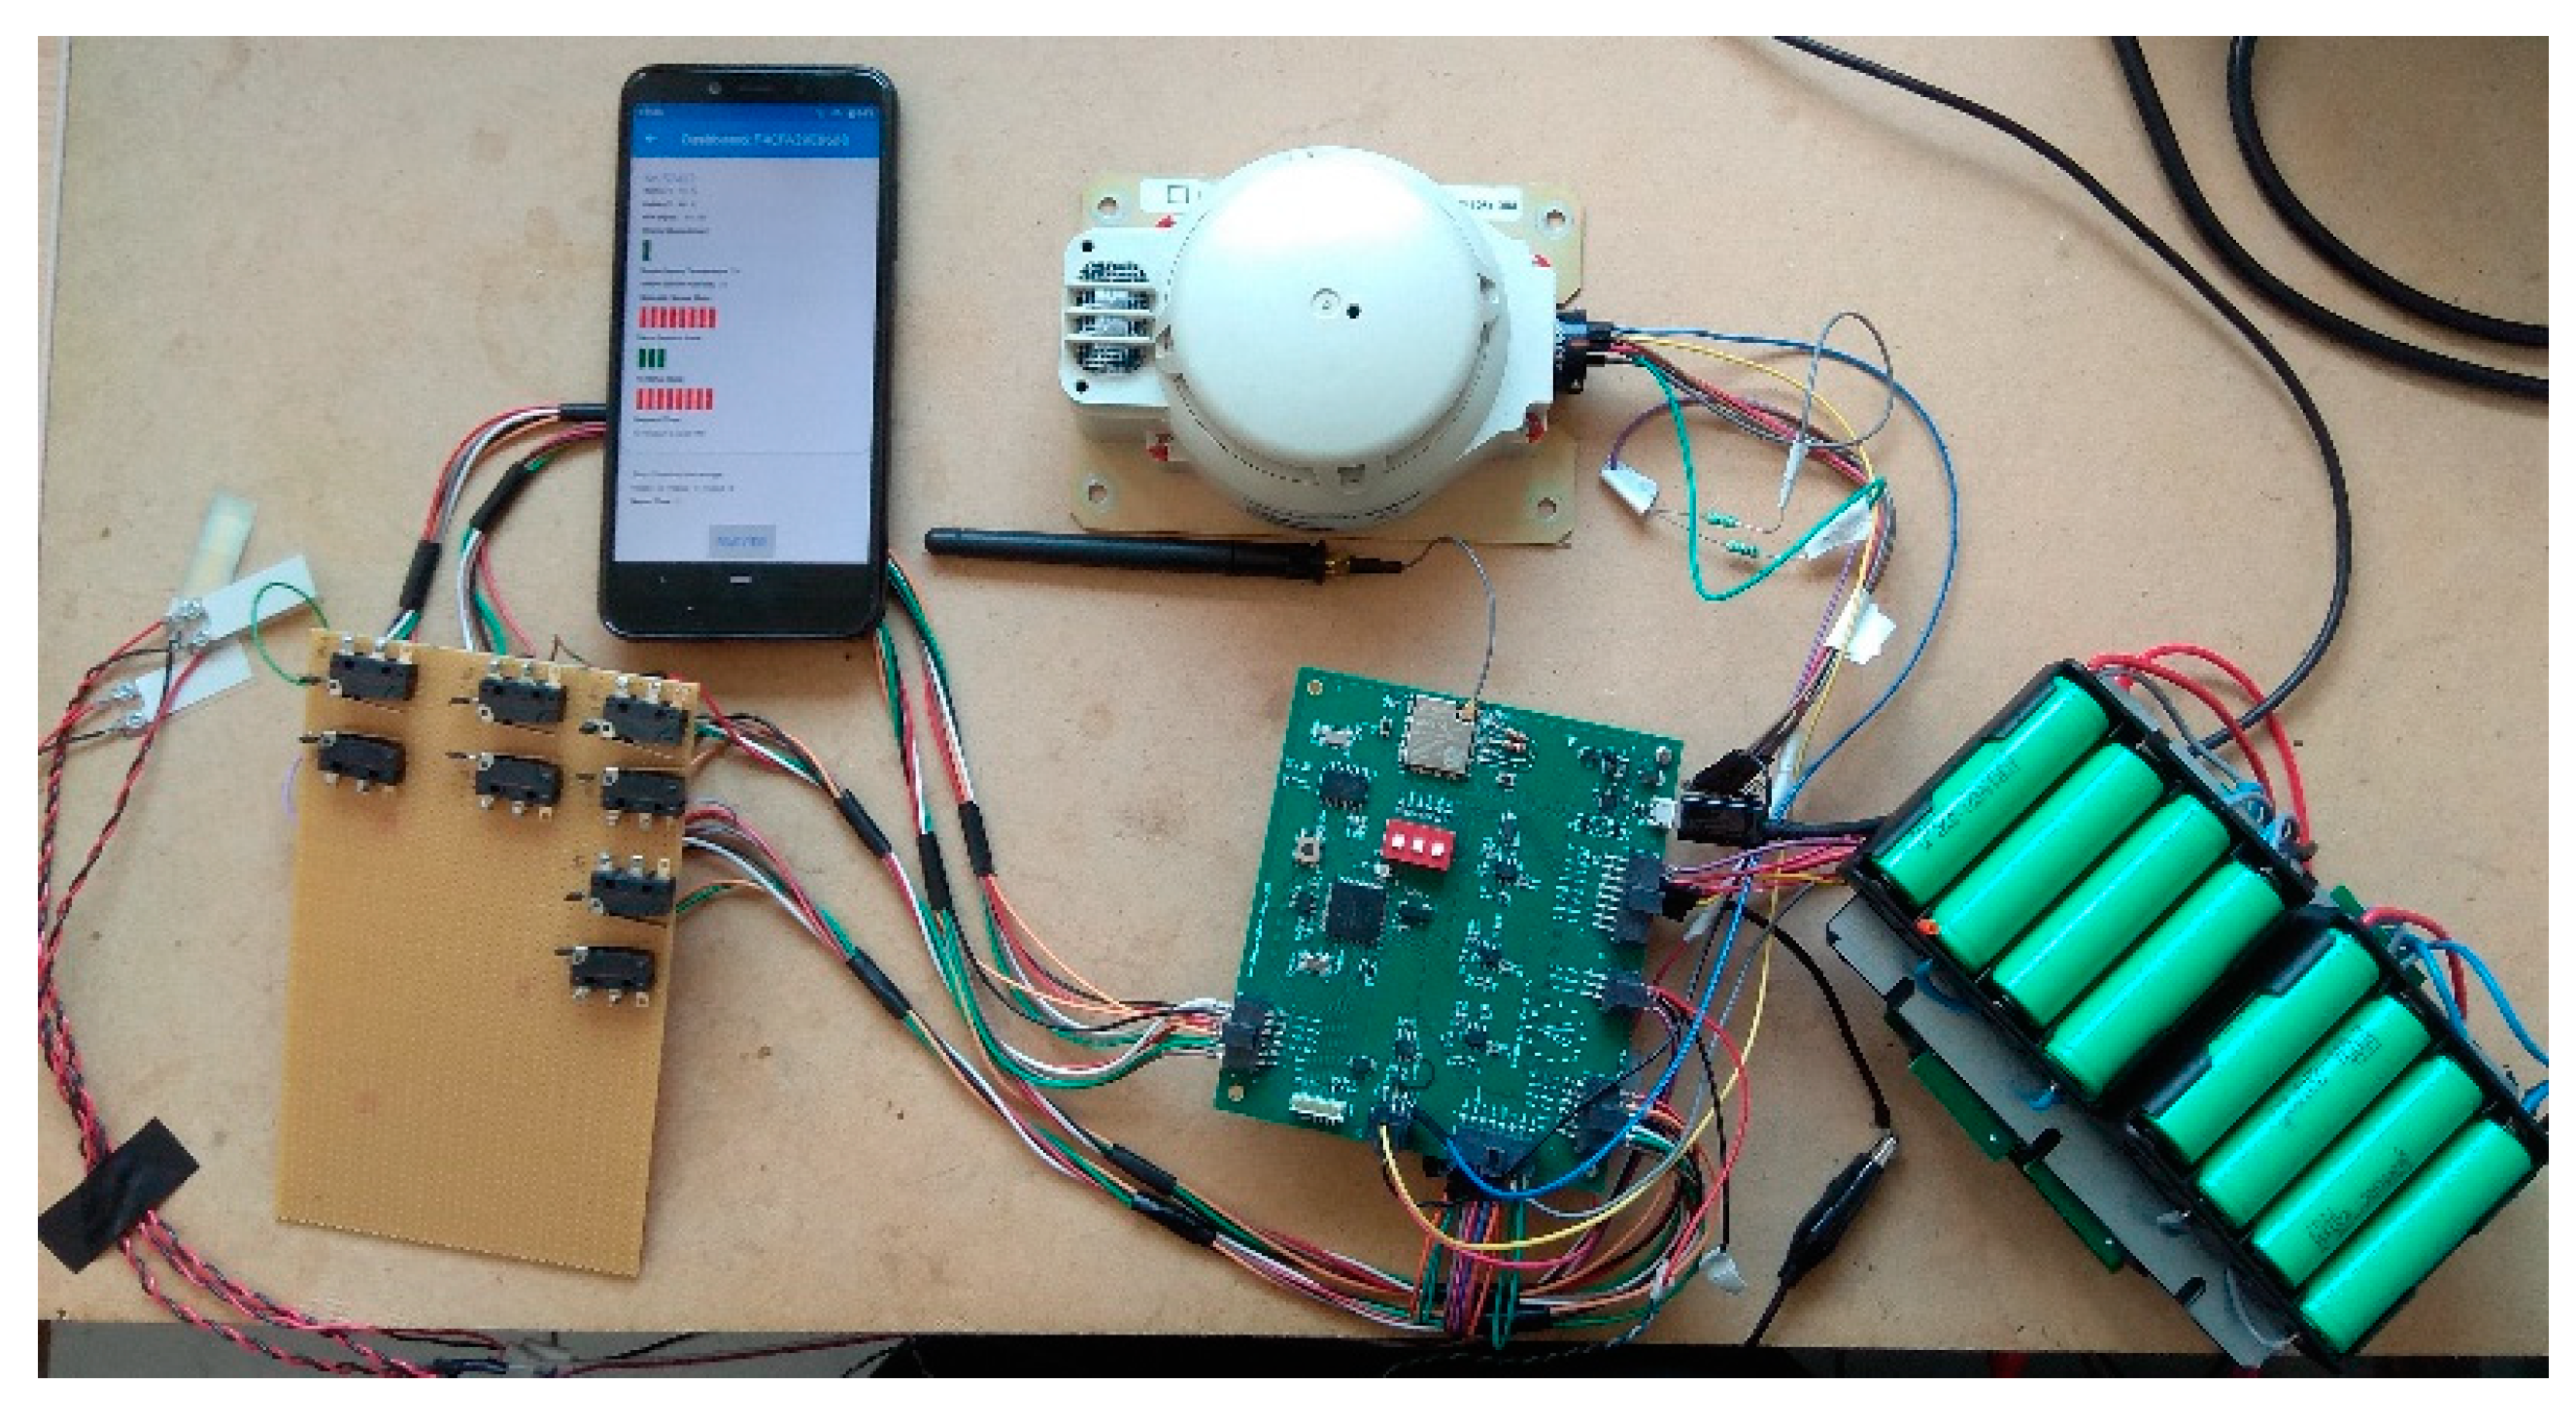
6. Proof of Concept Testing

In the context of Proof-of-concept testing, all the hardware components of a ULD are fully operating and the application is connected to the ULD. The power supply is provided by two battery packs that switch when the pack voltage is under a threshold. The full “INTELLICONT” system is shown in Figure 14.
This prototype system Proof Test Schedule provides a summary of the performed Proof tests for Hardware (HD) components, Software (SW) modules, and Data validation after “INTELLICONT” RMC installation in the ULD. Components to be evaluated are summarized in Table 3.
The test plan followed can be briefly described as follows.

6.1. Hardware (HW) Component’s Verification

These tests are intended to verify that the HW configuration complies with system specifications (operational, performance, etc.). The test includes a comparison of HW configuration onboard with that described in the relevant deliverable. The components selected, including the sensors and the circuit boards, are the same as the ones that are going to be installed in the containers during the system’s pilot testing. The integrity and robustness of the measurements were assured by performing each series of measurements at least three times, according to the standard laboratory test practice. Each test is described in the corresponding paragraph.

6.1.1. Accuracy and Stability Testing

In the context of the Lab Scale Tests, the operation of boards and sensors operation has been checked repeatedly to define the durability and the stability of the RMC system. It is noted that accuracy tests were similar to the stability ones; however, the latter involved longer testing duration.

6.1.2. System Testing

This test involved the evaluation of the RMC operation according to its specifications. The evaluation procedure included testing the system under both normal and non-normal conditions so that the platform’s operation and outputs could be tested during its normal operating conditions, as well as in the case of malfunction.

6.2. Software (SW) Module Testing

The software testing followed a similar but firmly different procedure. The purpose of SW tests was to ensure that the code runs correctly given the equations of the model and the initial requirements for operability and functionality. Three kinds of reliability tests were scheduled (static, dynamic, and passive), following standard software testing practice [25]. Besides, data integrity and user experience tests were performed as described below.

6.2.1. Static Testing

This kind of test involved Unit Tests and a series of proofreading tests, as well as data flow and static program analysis. Using different breakpoints, both the algorithmic flow of the code and the algorithmic rationality were evaluated. While, by the end of the development, a systematic static test set was performed, the process was initiated by the early stages of development (mainly with unit tests) and was performed in many iterative stages throughout the development lifecycle.

6.2.2. Dynamic Testing

This kind of test is commonly known as “debugging” and involves the in-depth analysis of the function of the software after it has been released or at the very late stages. In contrast to the static tests that mainly focus on software verification, these tests involve its validation. Besides, the performance of each software module is performed during these tests. In our case, the performance is crucial, especially during the loading stage where data need to be transferred from the ULD to the robotic platform in high transfer rate, thus special attention was given towards the test of this module.

6.2.3. Passive Testing

To test the function of the software in normal operational conditions, a series of log and error files were produced by the embedded code. The system provides different kinds of log files, from operational status and condition to time of function execution and completion flags. The main part of this test was performed in parallel to the field tests and the analysis of the involved files was performed off-line (after the completion of the tests).

6.2.4. Data Validation

These tests involve the comparison of characteristic obtained results with the same data obtained by visual inspection of the tester. This test involves (a) calculation of data packages loss and time shift, and (b) collection and transfer of data in periodic intervals between several Smart Collector devices and a remote server. All data integrity tests were performed via the HMI application. Testing proved that all values were successfully transferred to the end destination without loss or duplication and on the correct sampling rate. Deviation from the precise sample timing intervals occurred. This deviation was of the order of one (1) second, which is assumed to happen due to noise in the link budget.

6.2.5. User Acceptance

User Acceptance includes evaluation of Graphical Interface Design and Human Experience of the installation procedure, as well as customization effectiveness, and visualization quality and data export usefulness.

6.3. Fault Tree Analysis

One of the main features a system should adopt to be able to be approved for use in aviation is the in-depth fault tree analysis both for hardware and software components. According to the category, the system has to provide evidence that provisions for alternative paths, in case a major component fails, have been made. Figure 15 presents the faulty conditions that the platform was tested in. The activation of the auto-connect provision is timely when the system faces connection loss, malfunctioning sensors, or an under-voltage supply.

6.4. General Outcome of Laboratory Testing

Table 4 provides an overview of the testing amongst major perform very well following system-specific findings (if any) and suggestions for improvement. Limitations or restrictions faced during the testing shall also be briefly included.

7. Concluding Remarks

Key figures for accidents reported by IATA [7] reveal the importance of safety during operations involving air cargo. Safe and accurate ULD operations, after all, have been proven to be crucial during emergencies (e.g., the COVID-19 pandemic), where both accuracy and proper cargo handling are of vital importance [6]. In our view, the proposed HMI platform will contribute to reaching the expected safety assurance because it provides a holistic intervention that not only addresses the FR needs of the target use cases, but also produces a mindset change in the involved stakeholders (e.g., Operation Departments, line managers, crew, airport authorities, etc.), which combine in a synergic way: digital technology innovations, advanced data processing techniques and decision support, and organizational changes in business processes.
Μajor risks for the safety of the FR involved in air cargo operations are the ones involved with continuous tracking capabilities of container ID, locking status, fire/smoke warnings, and logs of impact events. One additional risk, vital to the safety of the FR (especially the medical teams), is the one involved with the early warning capability for incidents and the real-time assessment of the condition of the incident, especially when rules such as social distancing are not possible all the time.
Towards reducing these risks, a Remote Monitoring and Control system was developed. The RMS has a profound impact on the adoption of several innovative technologies in the aviation sector. These include sensing, monitoring, data fusion, and distributed computing. To reduce these risks and enhance health and safety working conditions, a Decision Support Platform has been developed and described during this work, which aims to pave the way towards a more sophisticated policy-making process and standardization. Furthermore, the HMI platform will benefit operators in increasing efficiency, reducing downtime and costs, and ensuring the safe operation of their assets.
The next step would be the analysis of data collected from field and pilot tests. In addition, the platform will be redesigned to be fully customizable to the role and activity of each FR member, as well as with responsible Artificial Intelligence (e.g., [26]) and Augmented Reality (AR) components that will run on smart glasses. The aim is to extend first responder capability to “percept” crucial information, including visualized Air Cargo Standard Operational Procedures and Emergency Response Plans/Check Lists, and make more risk-informed decisions during on-field operations.

Author Contributions

Conceptualization, C.S.; Data curation, F.G., A.P. and E.S.; Formal analysis, C.S., F.G. and E.S.; Investigation, E.S.; Methodology, C.S.; Project administration, C.S. and F.G.; Software, C.S., P.E. and E.S.; Supervision, C.S. and F.G.; Validation, C.S., A.P. and P.E.; Visualization, C.S. and P.E.; Writing—original draft, C.S. and A.P.; Writing—review & editing, C.S., F.G. and A.P. All authors have read and agreed to the published version of the manuscript.

Funding

This research was partly funded by CLEANSKY2, H2020-EU.3.4.5.1. IADP Large Passenger Aircraft.

Acknowledgments

This work was supported by the project of Development and Manufacturing of Intelligent Lightweight Composite Aircraft Container (Project ID: 785472), funded under: H2020-EU.3.4.5.1. IADP Large Passenger Aircraft. We also thank Bommie Xiong, section managing editor, for the support throughout paper submission process.

Conflicts of Interest

The authors declare no conflict of interest.

References

  1. Snow, C.; Håkonsson, D.; Obel, B. A smart city is a collaborative community: Lessons from smart Aarhus. Calif. Manag. Rev. 2016, 59, 92–108. [Google Scholar] [CrossRef]
  2. Khan, M.S.; Woo, M.; Nam, K.; Chathoth, P.K. Smart city and smart tourism: A case of Dubai. Sustainability 2017, 9, 2279. [Google Scholar] [CrossRef] [Green Version]
  3. Tesoriere, G.; Campisi, T.; Canale, A.; Severino, A.; Arena, F. Modelling and simulation of passenger flow distribution at terminal of Catania airport. In AIP Conference Proceedings; AIP Publishing LLC: Melville, NY, USA, 2018; Volume 2040, p. 140006. [Google Scholar]
  4. Emde, S.; Abedinnia, H.; Lange, A.; Glock, C.H. Scheduling personnel for the build-up of unit load devices at an air cargo terminal with limited space. OR Spectrum 2020, 42, 397–426. [Google Scholar] [CrossRef]
  5. Allam, Z.; Jones, D.S. On the coronavirus (COVID-19) outbreak and the smart city network: Universal data sharing standards coupled with artificial intelligence (AI) to benefit urban health monitoring and management. Healthcare 2020, 8, 46. [Google Scholar] [CrossRef] [PubMed] [Green Version]
  6. IATA. Available online: https://www.iata.org/en/programs/cargo/unit-load-devices/ (accessed on 21 June 2021).
  7. Safety Alert for Operators (SAFO) 16001 (1/19/16). Available online: http://www.faa.gov/other_visit/aviation_industry/airline_operators/airline_safety/safo (accessed on 21 June 2021).
  8. EASA, Certification Specifications for Large Aeroplanes—Cs-25, no. September. 2008. Available online: https://www.easa.europa.eu/certification-specifications/cs-25-large-aeroplanes (accessed on 21 June 2021).
  9. Baxter, G.; Kourousis, K. Temperature controlled aircraft unit load devices: The technological response to growing global air cargo cool chain requirements. J. Technol. Manag. Innov. 2015, 10, 157–172. [Google Scholar] [CrossRef] [Green Version]
  10. Kharoufah, H.; Murray, J.; Baxter, G.; Wild, G. A review of human factors causations in commercial air transport accidents and incidents: From to 2000–2016. Prog. Aerosp. Sci. 2018, 1, 1–3. [Google Scholar] [CrossRef]
  11. Kupfer, F.; Meersman, H.; Onghena, E.; Van de Voorde, E. The underlying drivers and future development of air cargo. J. Air Transp. Manag. 2017, 1, 6–14. [Google Scholar] [CrossRef]
  12. Lange, A. Does cargo matter? The impact of air cargo operations on departure on-time performance for combination carriers. Transp. Res. Part A Policy Pract. 2019, 1, 214–223. [Google Scholar] [CrossRef]
  13. Brandt, F.; Nickel, S. The air cargo load planning problem-a consolidated problem definition and literature review on related problems. Eur. J. Oper. Res. 2019, 1, 399–410. [Google Scholar] [CrossRef]
  14. Feng, B.; Li, Y.; Shen, Z.J. Air cargo operations: Literature review and comparison with practices. Transp. Res. Part C: Emerg. Technol. 2015, 1, 263–280. [Google Scholar] [CrossRef]
  15. Verstichel, J.; Vancroonenburg, W.; Souffriau, W.; Vanden Berghe, G. A mixed-integer programming approach to the aircraft weight and balance problem. Procedia Soc. Behav. Sci. 2011, 20, 1051–1059. [Google Scholar] [CrossRef]
  16. Lurkin, V.; Schyns, M. The airline container loading problem with pickup and delivery. European J. Oper. Res. 2015, 244, 955–965. [Google Scholar] [CrossRef] [Green Version]
  17. Rojek, J.; Rosenfeld, R.; Decker, S. The influence of driver’s race on traffic stops in Missouri. Police Q. 2004, 7, 126–147. [Google Scholar] [CrossRef]
  18. Dong, T.; Kim, N.H. Cost-effectiveness of structural health monitoring in fuselage maintenance of the civil aviation industry. Aerospace 2018, 5, 87. [Google Scholar] [CrossRef] [Green Version]
  19. Qing, X.; Li, W.; Wang, Y.; Sun, H. Piezoelectric transducer-based structural health monitoring for aircraft applications. Sensors 2019, 19, 545. [Google Scholar] [CrossRef] [PubMed]
  20. Zhang, Q.; Wang, Y.C.; Soutis, C.; Gresil, M. Development of a fire detection and suppression system for a smart air cargo container. Aeronaut. J. 2021, 125, 205–222. [Google Scholar] [CrossRef]
  21. Yadav, A.; Agawal, A.; Sachwani, T. Design and analysis of an intelligent fire detection system for aircraft. Int. J. Eng. Technol. Manag. Res. 2018, 28, 260–273. [Google Scholar] [CrossRef]
  22. Interactive Cargo. Available online: https://www.iata.org/en/programs/cargo/e/interactive-cargo/ (accessed on 21 June 2021).
  23. Spandonidis, C.; Giordamlis, G. Data-centric operations in oil & gas industry by the use of 5G mobile networks and industrial Internet of Things (IIoT). In Proceedings of the 13th International Conference of Digital Telecommunication, Athens, Greece, 22–26 April 2018; p. 16. [Google Scholar]
  24. Spandonidis, C.; Tsantilas, S.; Giannopoulos, F.; Giordamlis, C.; Zyrichidou, I.; Syropoulou, P. Design and Development of a New Cost-Effective Internet of Things Sensor Platform for Air Quality Measurements. J. Eng. Sci. Technol. Rev. 2020, 13, 81–91. [Google Scholar] [CrossRef]
  25. Graham, D.; Van Veenendaal, E.; Evans, I. Foundations of Software Testing; Cengage Learning: Boston, MA, USA, 2008; pp. 57–58. ISBN 9781844809899. [Google Scholar]
  26. Theodoropoulos, P.; Spandonidis, C.C.; Themelis, N.; Giordamlis, C.; Fassois, S. Evaluation of different deep-learning models for the prediction of a ship’s propulsion power. J. Mar. Sci. Eng. 2021, 9, 116. [Google Scholar] [CrossRef]
Figure 1. Percentage of safety accidents related to human error, for different air carrier operations. The majority of the accidents are related to air cargo operations.
Smartcities 04 00057 g001
Figure 2. General Concept.
Smartcities 04 00057 g002
Figure 3. Remote Monitoring System architecture.
Smartcities 04 00057 g003
Figure 4. HMI application use cases illustration.
Smartcities 04 00057 g004
Figure 5. The Remote Monitoring and Control (RMC) system inside its Housing.
Smartcities 04 00057 g005
Figure 6. Battery supply and management system.
Smartcities 04 00057 g006
Figure 7. ULD connectivity block diagram.
Smartcities 04 00057 g007
Figure 8. MQTT Ack - encryption key exchange.
Smartcities 04 00057 g008
Figure 9. Main menu.
Smartcities 04 00057 g009
Figure 10. Flowchart of HMI design.
Smartcities 04 00057 g010
Figure 11. ULD Dashboard Page.
Smartcities 04 00057 g011
Figure 12. ULD Information (left) and Raw Data (right) Page.
Smartcities 04 00057 g012
Figure 13. Robotic Platform Page.
Smartcities 04 00057 g013
Figure 14. “INTELLICONT” full system.
Smartcities 04 00057 g014
Figure 15. Faulty test conditions.
Smartcities 04 00057 g015
Table 1. Remote Monitoring System technical specifications.
ComponentFeatureSpecificationQuantity/ULD
RMS Processing UnitSystem clock16-bit RISC up to 20-MHz1
Ultra-low power consumption295 µA/MHz at 8 MHz, 3.0 V
Analog-to-Digital Converter (ADC)12-bit
Wireless Communication Wi-Fi802.11 n (2.4 GHz)1
Communication rateup to 150 Mbps
Structural Health Monitoring (SHM) sensorOutput voltage100 mV to 100 V3
Fire detection sensorSiemens PCM1103-03Temperature-humidity1
ULD lock sensorsContact switches30 operations/min (max)8
Position sensorsSensitivity: 0.90 mV/Gauss8
Table 2. Operating Systems Supported Versions.
Operating SystemMinimum VersionTarget Version
WindowsWindows 10Windows 10
AndroidAndroid 5.0 (API Level 21)Android 9.0 (API Level 28)
Table 3. ULD Components for Evaluation.
ProductIdentifierDescription
CollectorRMC-CCollector with different channels for sensor acquisition
Power Supply Unit (PSU)RMC-PSUBoard for power management and distribution
Table 4. Overall Testing Outcome per Component.
ProductIdentifierComments
Testing SystemPassThe prototype complies with system specifications
SW ModulePassN/A
Data QualityPassCorrections in HW and SW performed before the final release
User AcceptancePassMinor changes performed before the final release
Testing System in Non-normal conditionsPassThe system responds satisfactorily in faulty conditions
Publisher’s Note: MDPI stays neutral with regard to jurisdictional claims in published maps and institutional affiliations.

