
Dynamic Restaurants Quality Mapping Using Online User Reviews


1
Department of Management, La Salle Faculty, Ramon Llull University, 08022 Barcelona, Spain
2
Department of English and Linguistics, Universitat de Lleida, 25003 Lleida, Spain
3
Department of Information and Communication Technologies, ICESI University, Cali 760031, Colombia
*
Author to whom correspondence should be addressed.
Smart Cities 2021, 4(3), 1104-1112; https://0-doi-org.brum.beds.ac.uk/10.3390/smartcities4030058
Submission received: 15 June 2021
/
Revised: 22 July 2021
/
Accepted: 30 July 2021
/
Published: 2 August 2021
(This article belongs to the Special Issue Systems, Applications and Services for Smart Health)
Abstract
:Millions of users post comments to TripAdvisor daily, together with a numeric evaluation of their experience using a rating scale of between 1 and 5 stars. At the same time, inspectors dispatched by national and local authorities visit restaurant premises regularly to audit hygiene standards, safe food practices, and overall cleanliness. The purpose of our study is to analyze the use of online-generated reviews (OGRs) as a tool to complement official restaurant inspection procedures. Our case study-based approach, with the help of a Python-based scraping library, consists of collecting OGR data from TripAdvisor and comparing them to extant restaurants’ health inspection reports. Our findings reveal that a correlation does exist between OGRs and national health system scorings. In other words, OGRs were found to provide valid indicators of restaurant quality based on inspection ratings and can thus contribute to the prevention of foodborne illness among citizens in real time. The originality of the paper resides in the use of big data and social network data as a an easily accessible, zero-cost, and complementary tool in disease prevention systems. Incorporated in restaurant management dashboards, it will aid in determining what action plans are necessary to improve quality and customer experience on the premises.
1. Introduction
E-commerce sites such as TripAdvisor and Yelp have increased exponentially over the last decade or so. They are continuously innovating in order to facilitate consumer decision-making through a system of user evaluation of products and/or services (in the case of restaurants: food, service, atmosphere, etc.). Meanwhile, national health departments have limited resources to dispatch inspectors, leaving out many restaurants or being unable to carry out visits with required frequency, for example, to verify if the quality has improved [1]. From a smart cities perspective, local authorities faced with inadequate resources are, in effect, urban decision-makers stymied in their progress towards achieving smarter cities and improved living standards [2]. Consequently, there is a veritable need for implementation of systems to support strategic decision-making, with the aim of adopting smart city health initiatives in mind [3].
Cities are generating a lot of data that could be availed of for improvement of services provided to citizens. Millions of users generate online data about service experience when visiting a restaurant, a bar, or a cinema. These online-generated reviews (OGRs) written by the customers themselves are an important part of e-commerce website design, as they reflect the customer experience [4]. For the companies listed, it is crucial, since reviews naturally have an influence on visitor behavior [5] and are, as to be expected, directly linked to financial performance [6].
The academic field covering OGR computing is very large since text, visual data, and image tags can reveal important information [7]. Many authors have argued the potential positive effects of OGRs for health protection [1,8,9]. They claim OGRs could fill this gap, even if the idiosyncratic nature of data collection brings specific challenges [10,11]. Understanding of this information, therefore, remains rather poor, despite the importance of OGRs in decision-making about buying a product [12], listening to music [13], voting for a presidential election [14,15,16,17,18], or choosing a restaurant [19,20,21]. Consequently, the present study extends incipient research into the question of how to put OGRs to good use for restaurant inspection purposes, protecting citizens’ health in the process. The research objective is to evaluate how OGRs might be efficiently used to predict restaurant health condition distribution at the city scale and reveal unknown health risks. Our methodology consists of, with the help of a Python-based scraping library, collecting a set of data and comparing it to related restaurant health inspection reports. Our results reveal that there is a correlation between the health inspectors’ data and OGRs garnered from TripAdvisor. In other words, OGRs can dynamically indicate restaurant quality.
The originality of the paper resides in the use of big data as an easily accessible, zero-cost, complementary tool in disease prevention systems. Incorporated in restaurant management dashboards, OGR data can aid in determining actions necessary to improve overall quality and customer experience on the premises. The remainder of this manuscript is organized as follows. The next section briefly sketches out the current state of affairs and reviews previous studies that have used OGRs to resolve urban issues. This section is followed by a mapping out of the methodology employed to analyze OGRs and yields the results. The results are presented in Section 3 and discussed thereafter in Section 4. Finally, the paper concludes in Section 5 with theoretical and managerial implications, as well as directions for future research.
2. Literature Review
In the last decade or so, studies have also begun to look at how big data can be integrated as a complementary tool in restaurant hygiene inspections. The importance of this field of activity in terms of maintenance and improvement of living standards can hardly be overstated, not least because one of its ultimate objectives is health protection, for example through reducing risk of food poisoning and encouraging better sanitary conditions. Research carried out in California has shown that implementation (by local authorities) of stricter measures for public disclosure of inspection results can lead to reduced hospitalization rates linked to suspected foodborne illnesses [22,23]. Enforcing requirements to post inspection grades at a given establishment has also been shown to affect business revenue considerably [24], since obviously many patrons will be deterred from frequenting a restaurant with a publicly visible poor score.
The present research topic explores links between online-generated reviews (OGRs) and restaurant inspection scores. The use of online reviews (of products, hotels, restaurants, etc.) tends to have the effect of reducing uncertainty for customers prior to making decisions [25]. Since one of the key factors in the decision to patronize a restaurant is consumer perception of its hygiene standards [26], exploring the links between restaurant OGRs and hygiene inspection scores is a logical step forward in putting these vast datasets to purposeful ends in terms of minimizing health risks.
While research linking user reviews to health inspections is still in its incipient stages, the sparse studies that do exist show simple and linear regression between the two variables, and thus are convincing as to the utility of such investigation. For instance, a 2019 US-based study, drawing on datasets from the social networking site Yelp, confirmed the unequivocal impact of health inspection results on online restaurant reviews [9]. That is, as one might expect, “critical health inspection results lead to a decrease in star ratings” ([9], p. 1370). The study also found that severe health inspection results trigger quality improvements, and, importantly, that restaurants with poorer overall ratings are more likely to see a rise in fake reviews, presumably in an attempt to mitigate the obvious negative effects of such results. More importantly, an earlier study by Kang et al. [1] reported a significant correlation between reviews on social media (also using Yelp) and prediction of actual restaurant inspection scores, reporting “over 82% accuracy in discriminating severe offenders from places with no violation” ([9], pp. 1443–1444). In focusing on restaurants with severe violations, the authors also report finding a number of clear lexical cues in reviews which correlated with the inspection results [1].
These studies open up vast potential for uses of big data as a complementary tool in the field of restaurant inspection, a field which has many challenges to contend with. For instance, research to date has yielded mixed results in terms of the capacity of inspections to predict outbreaks of foodborne illnesses [5]. Not only that, but doubt has been cast over consumer ability to correctly interpret inspection information [27], and issues arise around environmental health officers’ subjective categorization of violations. These issues aside, local governments and health departments of course have limited resources. Kang et al. [1] even report that no inspection records were available for over 50% of restaurants found on Yelp at the time of their study in Seattle, suggesting limited coverage. Hence, assistance in targeting establishments at risk of committing food safety infractions are highly likely to be an aid in effectively deploying available resources. We would also posit that making better use of big data, in particular OGRs, for such purposes may act as a further incentive for dining establishments to promote a safe food environment, also potentially bolstering consumer confidence in existing health inspection procedures.
The current study contributes to this early line of research, looking to restaurant inspection scores in the context of Manhattan, New York, and OGRs posted in the same jurisdiction by users of TripAdvisor, a leading global online platform for reviews on restaurants. To the best of our knowledge, neither of these variables have been explored in similar research. Since studies on the topic to date have focused on American cities, we deem New York a good choice of location in extending this line of research. In addition, its high concentration of restaurants has yielded 1045 restaurant inspection results, alongside 50,618 OGRs for our data analysis. In addition, the sheer volume of tourists to New York precludes possible bias that may arise from overconcentration of any one cultural group, by ruling out culturally relative judgements of cleanliness, hygiene standards, or otherwise.
3. Materials and Methods
Using the case of Manhattan in New York City, our methodology draws on two compiled datasets entailing restaurant health inspection results and online restaurant reviews posted to TripAdvisor for corresponding restaurants. To address our research question, we employed a four-step approach.
3.1. First Step—Analysis of the Restaurant Health Inspection Report
Restaurant health inspections are carried out by local government health departments to ascertain the compliance of restaurants with food safety conditions and requirements. The inspection entails various aspects such as food handling, food temperature, and conditions of infrastructure hygiene. Vermin control is also carried out. In the event of infraction, the restaurant is penalized with a poor inspection rating. Systems for these ratings and disclosure thereof differs according to jurisdiction. In New York, they are made publicly visible to customers by being displayed in restaurant windows [1]. Even if they are also available online, clients must search in an Excel sheet of >100,000 lines, which renders the task laborious https://health.data.ny.gov/Health/Food-Service-Establishment-Last-Inspection/cnih-y5dw (accessed on 31 July 2021). From the dataset, we extracted two variables for our study: (a) the health inspection date and (b) the health inspection score, which is the sum of violation points for inspection demerits of a given restaurant. It is important to note that the higher the health score is, the worse the conditions of the particular restaurant are. This system evaluation works in the opposite way to the TripAdvisor’s rating by number of stars.
3.2. Second Step—Analyzing the TripAdvisor Data
Restaurants listed on TripAdvisor (www.tripadvisor.com accessed on 30 May 2021) accumulate OGRs composed of the following elements: textual review, review posting time, and OGR scorings. With the help of a Python-based scraping library, we were able to retrieve this data. The algorithm and our repository are available at the GitHub.com website https://github.com/SebasGarcia08/reviews-summarization (accessed on 31 July 2021). GitHub.com hosts projects which can be accessed and managed using the standard Git command-line interface and allows users to browse repositories on the site. It also provides social networking-like functions such as feeds, follows, and wikis. As a recent upgrade, it offers a social network feature which shows when developers work on a future version (coined as fork) and which fork or branch inside this fork is the newest.
We calculated two review scores for each restaurant as per Formulas (1) and (2) below. One formula takes into account reviews between today and the date of health inspection (Formula (2)) and the second takes into account reviews before this date and after 1 March (Formula (1)). To obtain the requisite information on quality, we calculated the mean star scoring evolution when at least one review exists within 30 days before and after the inspection date.
Mean star scoring is calculated according to Formulas (1)–(3) below:
where n and m are the number of OGRs between the respective periods.
Finally, we calculate:
OGR_extract_var (x) = OGR_extract_before (x) − OGR_extract_after (x)
3.3. Third Step—Developing a Relationship Model Joining the Two Datasets
The two datasets have in common the names and addresses of restaurants. The address is important since Manhattan has different chains of restaurants (e.g., Hard Rock Cafe, Domino’s, etc.) which have the same name and can thus be confused. However, official health inspection reports do not include the restaurant URLs necessary to download OGRs. Consequently, we assigned a group of 21 students (working on a smart city project at Ramon Llull University (Spain)—bachelor’s level) a sampling of the report and asked them to manually input the TripAdvisor URLs. The result was a list of URLs that was compatible for use with our Python script.
3.4. Fourth Step—Analyzing a Possible Correlation Inside the Final Dataset
Our dataset covers 1045 restaurants’ health inspections posted from 1 March 2018 to 1 March 2021. We compared the two sets of data, the one retrieved from TripAdvisor, and the other from the national health system. It covers 50,618 restaurant OGRs which are also divided into two parts: prior to the inspection date and after it. Before processing the OGRs to make our calculations, we conducted a preprocessing of the data, defining and calculating the reviewers’ popularity through two dimensions: the average number of friends and their general rating behavior, i.e., the average number of stars they award restaurants on the platform. Accordingly, a small number of users’ OGRs were eliminated. Namely, those that were awarding excessive positive scoring in order to whitewash restaurant quality (positive fake news) or very negative ones (negative fake news) were removed. The correction based on this preprocessing yielded a refined, and only very slightly reduced dataset.
To address the research question, we then analyzed the possible correlation between the variation of the star rating observed (variable: “OGR_extract_var”) and the health inspection results (variable: the “health score”). The variation considered is a subtraction between the period before and after the health inspection date.
4. Results
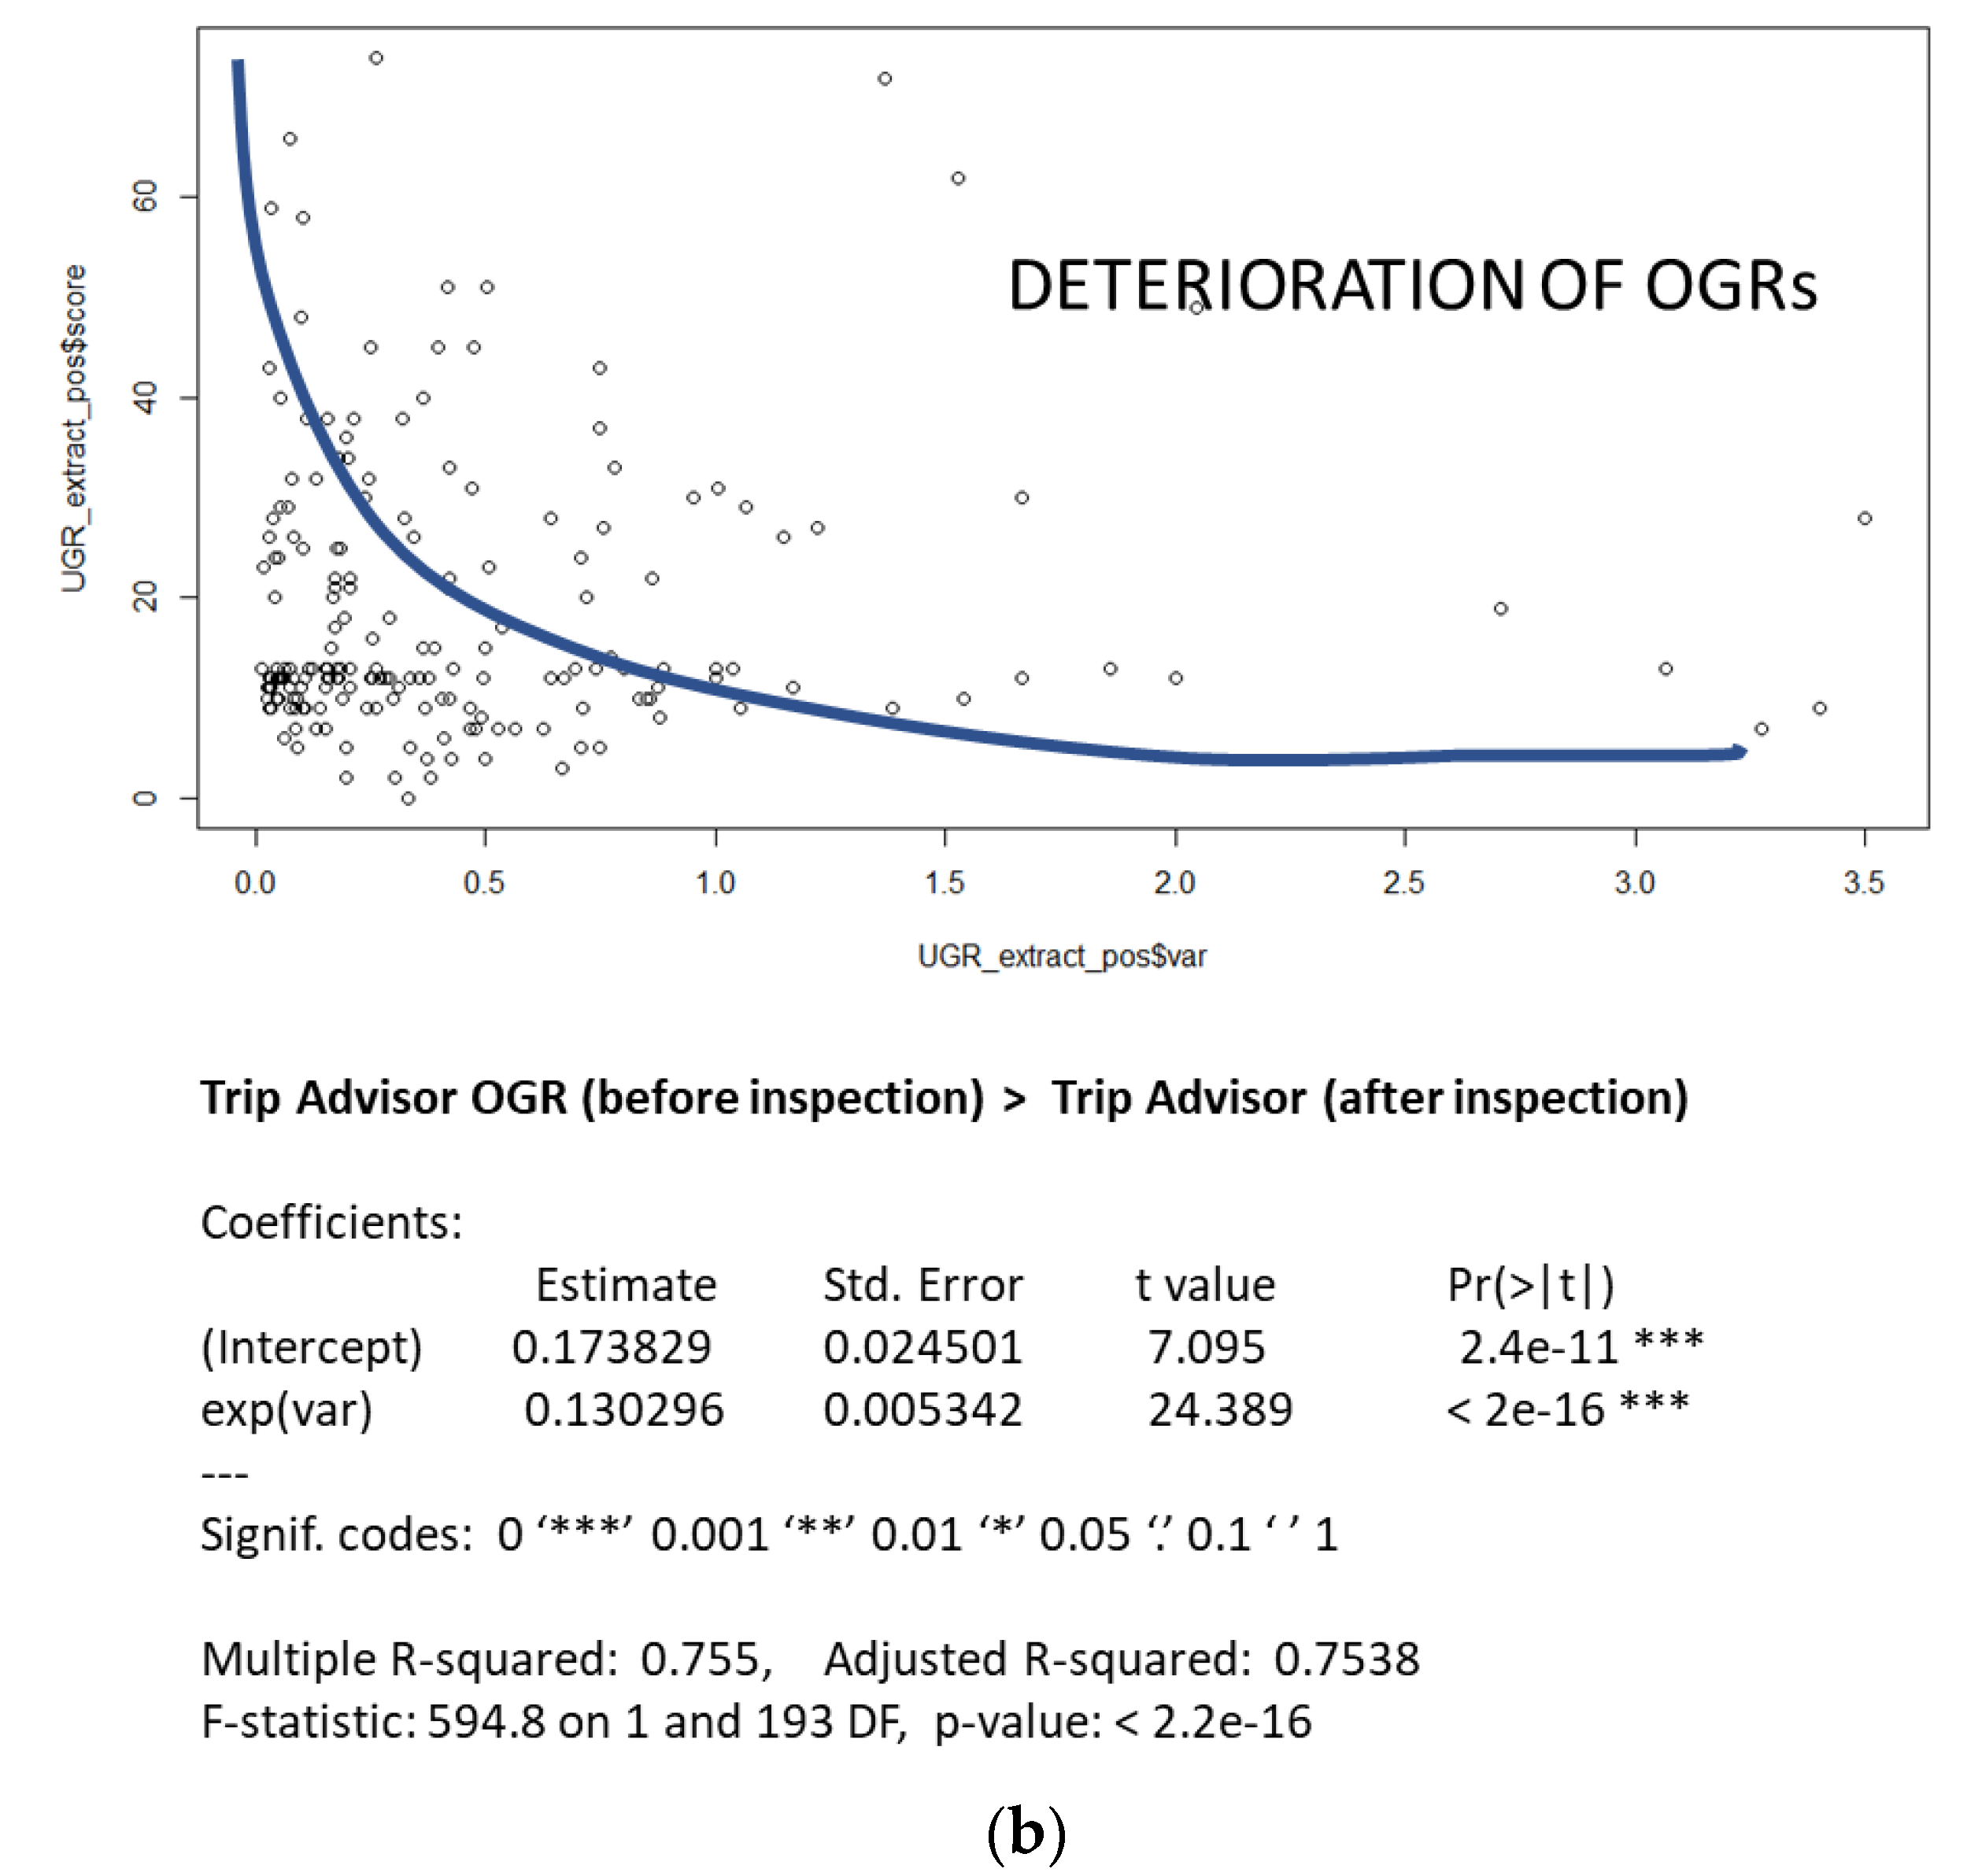
The results of our study (“health score” versus “OGRs_extract_var”) are presented in Figure 1a,b. Figure 1b represents negative evolution, i.e., there is a deterioration of the OGRs, while Figure 1a shows when the evolution is positive. For Figure 1b, we observe a logarithmic correlation, while in Figure 1a we observe an exponential correlation, with significance degrees of 0.002185 and <2.2 × 16−10 p-values, respectively. We interpret these results as follows. If TripAdvisor reviews worsen (“OGR_extract_var” with positive values), we conclude that the restaurant’s owner has reacted with a corrective action plan. The latter increases restaurant quality and compliance with food safety regulations, and the consecutive health score results lower (which is, we recall, synonymous with the lower irregularities in these reports).
On the contrary, if TripAdvisor reviews improve, i.e., “OGR_extract_var” with negative values (Figure 1a), the New York Health report score improves also, and the number of infractions and health score of consecutive inspection are therefore low. This result suggests that an improvement observed by visitors leads to a better inspection grading. Finally, when the OGRs scoring average shows little change during the periods before and after the inspection (“OGR_extract_var” with values close to 0), the health inspection scoring worsens on average. We posit that this is because an absence of (negative) OGRs on restaurant quality is likely to lead to lack of improvement-oriented action by owners and/or management, i.e., akin to a laissez-faire approach, manifesting in deterioration of the food quality and hygiene conditions.
In sum, our findings reveal a U-shaped behavior or correlation between health inspection ratings and OGR scorings. To improve visualization of the results, we decided to use the Quantum GIS (QGIS) software platform, a free and open-source desktop geographic information system (GIS) application, to map the OGR and health inspection results. QGIS allows users to create maps composed of either raster or vector layers and based on the geolocalization of all the restaurants. The results are shown in Figure 2 and illustrate, firstly, how OGRs can be used to identify patterns/clusters of health risks related to distribution of restaurant health conditions on a city scale. Secondly, they reveal a clear visual overlap between OGRs and health inspection results. The correlation rate is 0.82. This outcome confirms, at a macro level, the benefits of OGRs and their potential beneficial uses for heath protection [28,29,30].
5. Discussion
OGRs can be categorized in terms of quantitative (e.g., average number of stars, review wordcount) and qualitative characteristics (e.g., general opinion, sentimental polarity of the experience, predictive lexical cues) [1,25,28,30,31]. The quantitative characteristics of OGRs are heuristic cues displayed close to the product or service proposed that inform about customer experience and/or (dis)satisfaction [19,32]. Recent papers have shown a simple and linear regression between OGRs and health inspections [1,9]. Our results shed further light on these findings. They show the relation is more complex and has a U-shaped behavior. Our study, in fact, demonstrates a negative causality between OGRs and health system scores. In other words, negative variation of OGRs can predict a possible diminution of the official health system scoring. Our correlation corroborates findings which confirm the direct influence of health inspections on restaurant reviews [9].
Moreover, since the OGRs are posted daily to websites such as TripAdvisor, our findings highlight the real-time and dynamic role that customers’ reviews could play in the area of health inspection. Therefore, thinking more broadly, i.e., citywide, our results indicate that the OGRs could be a good assistance for cities which have a department of health with limited resources hindering frequency of inspections and/or follow up of hygiene or cleanliness issues. They can potentially serve as a new contribution to smart city health systems and form part of a decision support toolset to aid urban managers in adopting and implementing health initiatives [3]. Moreover, when these health issues are localized in a specific zone, such as in the Lower Manhattan area (Figure 2), they can be leveraged to look for factors external to the restaurant. By using appropriate techniques and bridging the vocabulary gap between health seekers and healthcare knowledge [10], an influence zone can be determined [33,34] and the objective of plague or disease propagation prevention achieved.
The penetration rate of smart phones is currently reaching 121% in developed countries, whereas in developing countries it is already 90% and continues to rise [35]. Therefore, the proliferation of these devices represents an important opportunity to generate OGRs and improve health conditions. Regarding the possible generalization of our findings, our methodology is based on a case study. This type of approach is fruitful for studying complex phenomena and is increasingly common in business research, where case studies have been used to analyze diverse phenomena [1,36]. They are highly recommended for the analysis of social networks [36], such as TripAdvisor in our case. Case studies are also appropriate in the early phases of theory development when key variables and their relationships are to be explored and the revision of the literature shows incipient understanding of the phenomenon at hand [14,17,37].
6. Conclusions
Much potential for smarter cities resides in the opportunity to analyze freely available, large quantities of user reviews generated upon visiting a restaurant or employing an urban service. These online-generated reviews (OGRs) reflect customer experiences [4] and are an important decision aid in customers’ purchase decision-making processes [9]. By collecting and analyzing OGRs in tandem with health inspection scores, our study aims to demonstrate that restaurant health inspection results can be reflected by OGRs. In other words, OGRs can be seen as a proxy for predicting the likely outcome of the next health inspection of a given restaurant. The practical implications are twofold. Correctly processed by the owner of the company listed, OGRs constitute valuable information to guide implementation of corrective actions and thus lead to an increase in restaurant quality and safe food handling. For local governments constrained by limited resources, they can be used to predict health risks and orientate the prioritization of restaurants for official inspection. The theoretical implications constitute new evidence that data analytics could be an additional and valuable source of information to support such decision-making processes. Uncovering the multiple ways in which big data, social, and unstructured data can potentially improve the management of cities makes for novel scientific contribution [18,38,39,40].
The present study, however, has some limitations which can be addressed by future research. First, our results should be confirmed by performing similar research in other cities to verify their scalability. The validation of different cases could then support the development of an urban prediction model and a comprehensive theoretical decision support system. Second, a further study could carry out a fine-grained analysis of OGRs to identify characteristics that could influence visitors’ perceptions, such as reviewers’ nationality. Indeed, the standards of quality, cleanliness, or service attention vary from one country to another, and could be considered. Finally, this research focuses on the quantitative aspects of OGRs, taking into account the star average scoring. Future research should seek to also include the analysis of qualitative information present in the OGRs which, when summarized and categorized, could also be of assistance to the health inspectors by anticipating valuable information about the restaurants they will want to audit [41].
Author Contributions
D.G.: writing—original draft—supervision; C.C.: writing—review & editing; S.G.A.: investigation—methodology—curation—software. All authors have read and agreed to the published version of the manuscript.
Funding
This research received no external funding.
Institutional Review Board Statement
Not applicable.
Informed Consent Statement
Not applicable.
Conflicts of Interest
The authors declare no conflict of interest.
References
- Kang, J.S.; Kuznetsova, P.; Luca, M.; Choi, Y. Where Not to Eat? Improving Public Policy by Predicting Hygiene Inspections Using Online Reviews. In Proceedings of the 2013 Conference on Empirical Methods in Natural Language Processing, Seattle, WA, USA, 18–21 October 2013; pp. 1443–1448. [Google Scholar] [CrossRef]
- Bokolo, A.J.; Petersen, S.A. A Smart City Adoption Model to Improve Sustainable Living. In Proceedings of the Annual NOKOBIT Conference, Narvik, Norway, 26–27 November 2019; Volume 27. [Google Scholar]
- Pal, D.; Triyason, T.; Padungweang, P. Big Data in Smart-Cities: Current Research and Challenges. Indones. J. Electr. Eng. Informatics 2018, 6, 351–360. [Google Scholar] [CrossRef] [Green Version]
- Camilleri, A.R. The Importance of Online Reviews Depends on When They Are Presented. Decis. Support Syst. 2020, 133, 113307. [Google Scholar] [CrossRef]
- Filion, K.; Powell, D.A. The Use of Restaurant Inspection Disclosure Systems as a Means of Communicating Food Safety Information. J. Foodserv. 2009, 20, 287–297. [Google Scholar] [CrossRef]
- Bi, J.W.; Liu, Y.; Fan, Z.P.; Cambria, E. Modelling Customer Satisfaction from Online Reviews Using Ensemble Neural Network and Effect-Based Kano Model. Int. J. Prod. Res. 2019, 57, 7068–7088. [Google Scholar] [CrossRef]
- Gao, Y.; Wang, M.; Zha, Z.; Shen, J.; Li, X.; Wu, X. Visual-Textual Joint Relevance Learning for Tag-Based Social Image Search. IEEE Trans. Image Process. 2013, 22, 363–376. [Google Scholar] [CrossRef]
- Lu, Y.; Wu, J.; Peng, J.; Lu, L. The Perceived Impact of the Covid-19 Epidemic: Evidence from a Sample of 4807 SMEs in Sichuan Province, China. Environ. Hazards 2020, 19, 323–340. [Google Scholar] [CrossRef]
- Siering, M.; Janze, C. Information Processing on Online Review Platforms. J. Manag. Inf. Syst. 2019, 36, 1347–1377. [Google Scholar] [CrossRef]
- Jiang, S.; Qian, X.; Shen, J.; Fu, Y.; Mei, T. Author Topic Model-Based Collaborative Filtering for Personalized POI Recommendations. IEEE Trans. Multimed. 2015, 17, 907–918. [Google Scholar] [CrossRef]
- Zhou, C.; Xiu, H.; Wang, Y.; Yu, X. Characterizing the Dissemination of Misinformation on Social Media in Health Emergencies: An Empirical Study Based on COVID-19. Inf. Process. Manag. 2021, 58, 102554. [Google Scholar] [CrossRef]
- Zhou, Y.; Yang, S.; Li, Y.; Chen, Y.; Yao, J.; Qazi, A. Does the Review Deserve More Helpfulness When Its Title Resembles the Content? Locating Helpful Reviews by Text Mining. Inf. Process. Manag. 2020, 57, 102179. [Google Scholar] [CrossRef]
- Song, X.; Liu, Y.; Xue, L.; Wang, J.; Zhang, J.; Wang, J.; Jiang, L.; Cheng, Z. Time-Series Well Performance Prediction Based on Long Short-Term Memory (LSTM) Neural Network Model. J. Pet. Sci. Eng. 2020, 186, 106682. [Google Scholar] [CrossRef]
- Grimaldi, D. Can We Analyse Political Discourse Using Twitter? Evidence from Spanish 2019 Presidential Election. Soc. Netw. Anal. Min. 2019, 9, 49. [Google Scholar] [CrossRef]
- Grimaldi, D.; Diaz, J.; Arboleda, H. Inferring the Votes in a New Political Landscape: The Case of the 2019 Spanish Presidential Elections. J. Big Data 2020, 7, 58. [Google Scholar] [CrossRef]
- Grimaldi, D.; Fernandez, V. The Road to School. The Barcelona Case. Cities 2017, 65, 24–31. [Google Scholar] [CrossRef]
- Grimaldi, D.; Fernandez, V.; Carrasco, C. Heuristic for the Localization of New Shops Based on Business and Social Criteria. Technol. Forecast. Soc. Change 2018, 142, 249–257. [Google Scholar] [CrossRef]
- Grimaldi, D.; Diaz, J.; Arboleda, H.; Fernandez, V. Data Maturity Analysis and Business Performance. A Colombian Case Study. Heliyon 2019, 5, e02195. [Google Scholar] [CrossRef]
- Changchit, C.; Klaus, T.; Lonkani, R. Online Reviews: What Drives Consumers to Use Them. J. Comput. Inf. Syst. 2020, 1–10. [Google Scholar] [CrossRef]
- Li, J.; Zhang, C.; Chen, X.; Hu, Y.; Liao, P. Survey on Automatic Text Summarization. J. Comput. Res. Dev. 2021, 58, 1–21. [Google Scholar] [CrossRef]
- Lei, X.; Qian, X.; Zhao, G. Rating Prediction based on Social Sentiment from Textual Reviews. IEEE Trans. Multimed. 2016, 18, 1910–1921. [Google Scholar] [CrossRef]
- Jin, G.Z.; Leslie, P. The Effect of Information on Product Quality: Evidence from Restaurant Hygiene Grade Cards. Q. J. Econ. 2003, 118, 409–451. [Google Scholar] [CrossRef] [Green Version]
- Simon, P.A.; Leslie, P.; Run, G.; Jin, G.Z.; Reporter, R.; Aguirre, A.; Fielding, J.E. Impact of Restaurant Hygiene Grade Cards on Foodborne-Disease Hospitalizations in Los Angeles County. J. Environ. Health 2005, 67, 32–36. [Google Scholar]
- Henson, S.; Majowicz, S.; Masakure, O.; Socket, P.; Jones, A.; Hart, R.; Carr, D.; Knowles, L. Consumer Assessment of the Safety of Restaurants: The Role of Inspection Notices and Other Information Cues. J. Food Saf. 2006, 26, 275–301. [Google Scholar] [CrossRef]
- Sun, X.; Han, M.; Feng, J. Helpfulness of Online Reviews: Examining Review Informativeness and Classification Thresholds by Search Products and Experience Products. Decis. Support Syst. 2019, 124, 113099. [Google Scholar] [CrossRef]
- Worsfold, D.; Worsfold, P.M. Evaluating Food Hygiene Inspection Schemes: ‘Scores on Doors’ in the UK. Int. J. Consum. Stud. 2007, 31, 582–588. [Google Scholar] [CrossRef]
- Almanza, B.A.; Ismail, J.; Mills, J.E. The Impact of Publishing Foodservice Inspection Scores. J. Foodserv. Bus. Res. 2002, 5, 45–62. [Google Scholar] [CrossRef]
- Salehan, M.; Kim, D.J. Predicting the Performance of Online Consumer Reviews: A Sentiment Mining Approach to Big Data Analytics. Decis. Support Syst. 2016, 81, 30–40. [Google Scholar] [CrossRef]
- Zheng, X.; Zhu, S.; Lin, Z. Capturing the Essence of Word-of-Mouth for Social Commerce: Assessing the Quality of Online e-Commerce Reviews by a Semi-Supervised Approach. Decis. Support Syst. 2013, 56, 211–222. [Google Scholar] [CrossRef]
- Lu, X.; He, S.; Lian, S.; Ba, S.; Wu, J. Is User-Generated Content Always Helpful? The Effects of Online Forum Browsing on Consumers’ Travel Purchase Decisions. Decis. Support Syst. 2020, 137, 113368. [Google Scholar] [CrossRef]
- Wu, C.; Che, H.; Chan, T.Y.; Lu, X. The Economic Value of Online Reviews. Mark. Sci. 2015, 34, 739–754. [Google Scholar] [CrossRef]
- Kang, Y.; Cai, Z.; Tan, C.W.; Huang, Q.; Liu, H. Natural Language Processing (NLP) in Management Research: A Literature Review. J. Manag. Anal. 2020, 7, 139–172. [Google Scholar] [CrossRef]
- Cheema, M.A.; Lin, X.; Zhang, W.; Zhang, Y. Influence Zone: Efficiently Processing Reverse k Nearest Neighbors Queries. In Proceedings of the 2011 IEEE 27th International Conference on Data Engineering, Hannover, Germany, 11–16 April 2011; pp. 577–588. [Google Scholar] [CrossRef] [Green Version]
- Cheema, M.A.; Brankovic, L.; Lin, X.; Zhang, W.; Wang, W. Continuous Monitoring of Distance-Based Range Queries. IEEE Trans. Knowl. Data Eng. 2011, 23, 1182–1199. [Google Scholar] [CrossRef] [Green Version]
- International Telecommunication Union (ITU). Measuring the Information Society Report: 2014; International Telecommunications Union: Geneva, Switzerland, 2014. [Google Scholar]
- Liedtka, J. Learning to Use Design Thinking Tools for Successful Innovation. Strategy Leadersh. 2011, 39, 13–19. [Google Scholar] [CrossRef]
- Gibbert, M.; Ruigrok, W.; Wicki, B. What Passes as a Rigorous Case Study? Strateg. Manag. J. 2008, 29, 1465–1474. [Google Scholar] [CrossRef]
- Derqui, B.; Grimaldi, D. Data on the Sustainability Profile and Food Waste Management in Primary and Secondary Schools: The Case of the Catalonia Region in Spain. Data Br. 2020, 28, 104825. [Google Scholar] [CrossRef] [PubMed]
- Grimaldi, D.; Fernandez, V.; Carrasco, C. Exploring Data Conditions to Improve Business Performance. J. Oper. Res. Soc. 2019, 72, 1087–1098. [Google Scholar] [CrossRef]
- Ramirez, F.; Palominos, P.; Camargo, M.; Grimaldi, D. A New Methodology to Support Smartness at the District Level of Metropolitan Areas in Emerging Economies: The Case of Santiago de Chile. Sustain. Cities Soc. 2021, 67, 102713. [Google Scholar] [CrossRef]
- Kim, K.; Park, O.J.; Yun, S.; Yun, H. What Makes Tourists Feel Negatively about Tourism Destinations? Application of Hybrid Text Mining Methodology to Smart Destination Management. Technol. Forecast. Soc. Chang. 2017, 123, 362–369. [Google Scholar] [CrossRef]
Figure 1.
(a): Zone of improvement according to TripAdvisor OGR evolution. (b): Zone of deterioration according to TripAdvisor OGR evolution.
Figure 1.
(a): Zone of improvement according to TripAdvisor OGR evolution. (b): Zone of deterioration according to TripAdvisor OGR evolution.


Figure 2.
Visualization of the NYC health inspection and UGR ratings evolution.

Publisher’s Note: MDPI stays neutral with regard to jurisdictional claims in published maps and institutional affiliations. |
© 2021 by the authors. Licensee MDPI, Basel, Switzerland. This article is an open access article distributed under the terms and conditions of the Creative Commons Attribution (CC BY) license (https://creativecommons.org/licenses/by/4.0/).
Share and Cite
MDPI and ACS Style
Grimaldi, D.; Collins, C.; Acosta, S.G. Dynamic Restaurants Quality Mapping Using Online User Reviews. Smart Cities 2021, 4, 1104-1112. https://0-doi-org.brum.beds.ac.uk/10.3390/smartcities4030058
AMA Style
Grimaldi D, Collins C, Acosta SG. Dynamic Restaurants Quality Mapping Using Online User Reviews. Smart Cities. 2021; 4(3):1104-1112. https://0-doi-org.brum.beds.ac.uk/10.3390/smartcities4030058
Chicago/Turabian StyleGrimaldi, Didier, Carly Collins, and Sebastian Garcia Acosta. 2021. "Dynamic Restaurants Quality Mapping Using Online User Reviews" Smart Cities 4, no. 3: 1104-1112. https://0-doi-org.brum.beds.ac.uk/10.3390/smartcities4030058