
Application of Deep Learning on UAV-Based Aerial Images for Flood Detection


1
School of Built Environment, University of New South Wales, Kensington, Sydney, NSW 2052, Australia
2
School of Civil Engineering and Surveying, University of Southern Queensland, Springfield, QLD 4300, Australia
*
Author to whom correspondence should be addressed.
Smart Cities 2021, 4(3), 1220-1242; https://0-doi-org.brum.beds.ac.uk/10.3390/smartcities4030065
Submission received: 20 August 2021
/
Revised: 10 September 2021
/
Accepted: 16 September 2021
/
Published: 18 September 2021
Abstract
:Floods are one of the most fatal and devastating disasters, instigating an immense loss of human lives and damage to property, infrastructure, and agricultural lands. To cater to this, there is a need to develop and implement real-time flood management systems that could instantly detect flooded regions to initiate relief activities as early as possible. Current imaging systems, relying on satellites, have demonstrated low accuracy and delayed response, making them unreliable and impractical to be used in emergency responses to natural disasters such as flooding. This research employs Unmanned Aerial Vehicles (UAVs) to develop an automated imaging system that can identify inundated areas from aerial images. The Haar cascade classifier was explored in the case study to detect landmarks such as roads and buildings from the aerial images captured by UAVs and identify flooded areas. The extracted landmarks are added to the training dataset that is used to train a deep learning algorithm. Experimental results show that buildings and roads can be detected from the images with 91% and 94% accuracy, respectively. The overall accuracy of 91% is recorded in classifying flooded and non-flooded regions from the input case study images. The system has shown promising results on test images belonging to both pre- and post-flood classes. The flood relief and rescue workers can quickly locate flooded regions and rescue stranded people using this system. Such real-time flood inundation systems will help transform the disaster management systems in line with modern smart cities initiatives.
1. Introduction and Background
On average, 60,000 lives are lost to natural disasters every year, accounting for 0.1% of the global deaths [1]. These natural disasters include floods, earthquakes, hurricanes, landslides, and others. Floods are the most frequently occurring natural disasters globally, representing 40% of global natural disasters [2]. Climate change, hurricanes, heavy precipitation, glacier melting, and winter storms are the underlying factors to be blamed for the dramatic rise in flood risks [3,4].
Floods have induced damages amounting to hundreds of millions of dollars on average, along with the loss of thousands of human lives [5,6,7,8]. Apart from the loss of lives, floods cause great damage to the infrastructure and property, agricultural lands, crops, and livestock, resulting in huge economic losses, which must be minimized in the era of focus on sustainability and smart cities [9,10,11]. Extreme rainfall events occurring in the first decade of the new millennium have caused a substantial increase in flood events, raising the flood-related losses from USD 6 billion to USD 10 billion. Accordingly, billions of dollars have been invested in implementing effective flood control measures [2,12]. The associated rescue missions, rehabilitation, and relief services also place an additional economic burden on the economic development of the affected country. According to an estimate of flood-related economic loss in 2012, the world lost USD 19 billion to floods in various global regions. Due to untimely detection of floods and lack of accurate and fast technologies that could automatically detect the occurrence of flooding in an area, lives are lost as aids and recovery services cannot be provided on time. This signifies the need to use advanced digital technologies to detect flood-affected areas quickly and accurately so that rescue activities can be initiated as soon as possible [2,12,13,14,15,16,17,18]. Such timely flood detection is crucial to efficiently plan relief missions and rescue the stranded people, thus minimizing its economic impacts and casualties [19,20,21].
Geographic Information System (GIS) is an important component that provides essential disaster management decision support and analytical capabilities [21,22]. It enables the authorities to acquire, save, manage, and analyze spatial or geographic data to provide appropriate disaster response [23,24]. GIS can automatically determine the flood-affected regions and integrate the results with the available geographic data, thus assisting in the better detection of floods [21]. It has been used to determine rescue routes and the available transport facilities in flood-affected areas [25,26]. However, this technology relies heavily on the availability of information about the disaster. Such information is only available after a couple of days, if not weeks, resulting in a slow response in an emergency case such as a flood. Global Positioning System (GPS) is a global navigation satellite system (GNSS) that provides geolocation and time information to a GPS receiver anywhere on or near the Earth where there is an unobstructed line of sight to four or more GPS satellites [23]. This technology has been frequently used in post-flood disaster management and relief activities. An example is that of the GPS sensor nodes installed on the rooftop of a building, providing relative position information from both pre- and post-flood disaster periods.
The changes in geolocation points between different building components before and after the flood are calculated and used to estimate damage, building movement scale, and factors such as stress and strain for a precise assessment of the damage. Similarly, the images captured by GPS-enabled devices can be further analyzed using image processing techniques to detect a flood event. However, GPS-based estimations have a certain degree of ambiguity, as the exact location of the flooded area cannot be mapped. This is because there is roughly an error of 15 m for every 3 km in the GPS results [27]. Moreover, another limitation of the GPS is that it relies on internet services. In times of emergency, network services such as the internet and Wi-Fi are mostly unavailable. Hence, technologies such as GIS and GPS become inaccessible. This leads to a lack of precise data about the location of flooded areas and the affected people requiring aid. Accordingly, the rescue services may be delayed or interrupted.
Satellite imaging has been used to capture high-quality images of the target area. These images are analyzed using image processing methods such as edge detection, segmentation, and pixel-based analysis [28,29]. However, the quality of these satellite images is greatly affected by noise, illumination conditions, weather, and other barriers between the earth and the satellite, such as clouds [30]. Furthermore, due to the large number of high-resolution images stored in the satellite databases, the speed of image processing is affected, resulting in a slower response. To address the speed concerns, remote sensing techniques are used to collect data of large areas quickly. Moreover, these techniques also allow the generation of detailed descriptions of the objects without having any direct connection. The working mechanism involves using optical and radar imagery to measure water levels to define the scope of a flooded area [31].
Similarly, object detection has been utilized with aerial images to extract features that can be analyzed to make flood-related response decisions. Target recognition of landmarks such as roads and buildings from aerial images has been done using Hough transform and isotropic surround suppression to find rescue routes [32,33]. Furthermore, edge detection methods can be used to identify and extract objects from images, such as detecting a horizontal water line representing the surface level of water on roads and streets or the height of a dam [28]. Bridge detection has been performed using aerial images to aid disaster relief missions by mining and analyzing multispectral aerial image patterns [32,33]. Synthetic Aperture Radar (SAR) has been used to capture remote images, define a pixel-based threshold and classify flooded or non-flooded regions [34]. Mason et al. [35] used image segmentation and classification techniques on SAR images for real-time flood detection. However, the quality of images and availability of internet or satellite connectivity may affect disaster response planning. Therefore, alternate methods need to be explored and utilized for disaster response planning in flooded regions [36].
Accordingly, Unmanned Aerial Vehicles (UAVs) can be used as efficient tools that can capture high-resolution spatial images from the target sites [22]. These UAVs are widely used these days instead of the traditional imaging tools such as satellite imaging and GPS-based monitoring as smart technologies in the industry 4.0 era [37,38,39,40,41]. UAVs can quickly collect precise image data and transmit it to their respective off-site servers for sharper, smarter, and more informed responses [41]. Similarly, Artificial Neural Network (ANN) models are increasingly used for flood prediction and detection [42,43]. Chang et al. [44] proposed a hybrid ANN-based model using a self-organizing map (SOM) and the recurrent nonlinear autoregressive network with exogenous inputs (RNARX) to generate regional flood inundation maps during storms events. The authors stated that the 4 × 4 SOM network could cluster inundation depths of the target area, while the RNARX network can forecast the inundation depths.
Similarly, Chang et al. [45] developed an early flood warning system by integrating a hydrodynamic model, k-means clustering algorithm, and support vector machines (SVM) to detect typhoon flood events and accurately predict both the inundation depth and extent [46]. Fuzzy-logic-based systems are also quite popular and have been used to forecast river water levels and raise an early alarm in case of floods [47]. Harmonic analysis and change detection have been used on multi-temporal data for flood detection, with an accuracy of 80% [48]. Likewise, a new method for change detection and thresholding (CDAT) was used with SAR images to delineate the extent of flooding for the Chobe floodplain in the Caprivi region of Namibia [49]. A Bayesian network has also been proposed to integrate remotely sensed data, such as multi-temporal SAR intensity images and interferometric-SAR coherence data, with geomorphic and other ground information such as roads and buildings [50].
Furthermore, a back-propagation-based ANN method called Multilayer Perceptron (MLP) has been used to predict floods using rainfall time series data and water levels in a weir that can spread into the cities [51]. Similarly, a Wavelength Neural Network (WNN) has been used for flood modeling [52]. Thus the pertinent literature shows that image processing and machine learning techniques have been widely used for flood detection, but deep learning is rare and not well experimented with or documented for such purposes [46]. This presents a gap targeted on the current study.
Accordingly, a set of key landmarks comprising roads and buildings is detected and extracted in this study. These landmarks are added to the original dataset used to train a deep learning model to help the disaster management team plan an effective response. The study demonstrates the results using original and altered datasets and compares them with previous flood detection methodologies to highlight their significance. A case study approach is adopted where the flood-prone area of northern Pakistan, known as Swat, is investigated, and the technique is applied to extract landmark objects in the flooded region.
The motivation for using UAVs for capturing aerial images of the disaster-hit region is due to its potential to capture high-resolution images in a short period without requiring human assistance. This makes UAVs safe to investigate high-risk areas that are unreachable by humans during disaster events. Thus, UAVs are ideal for acquiring image data in disasters. The idea of integrating machine learning and image processing for flood detection and damage assessment facilitates generating results in the least amount of time, which are accurate and precise without relying on human intervention. The problem addressed in this paper is the “detection of floods”. For this purpose, UAVs are used that are complemented through the implementation of deep learning models on aerial images acquired by them. The detection and monitoring of flooded areas in rural zones are essential to assess the damages to critical infrastructure, find and locate the population, and find an evacuation route for the disaster victims. The proposed system ensures the extraction of key landmarks such as roads, buildings, and bridges that are georeferenced with the stored maps to make appropriate post-disaster decisions.
Pakistan is a developing country with a growing economy that is faced with several challenges. These challenges range from cost and time overruns in projects to brain drain, lack of competitiveness of local industries, corruption, political instability, lack of legal frameworks and insurances, and frequent natural disasters such as floods and earthquakes [21,24,53,54,55,56,57,58]. The regularly occurring devastating floods severely dent the local economy. In Pakistan, flood events in 2010, 2011, and 2013 caused immense destruction and fatalities [21]. Pakistan has faced a loss of approximately USD 38 billion owing to floods in the past 70 years [59,60]. In 2010, massive floods caused by the monsoon rains caused 2000 casualties, affected 20 million people, caused food shortage for 7.8 million people, and resulted in damages worth USD 16 billion [21]. The healthcare facilities of the country also suffered as 436 settings providing health-related facilities were lost in the disaster [61]. The underlying cause of floods in Pakistan is heavy rainfall every year during the monsoon season (July–August). Last year alone, more than 230 lives were lost to the floods generated by monsoon rains in Pakistan [62,63,64]. Therefore, there is a dire need to propose effective flood mapping techniques in Pakistan.
For pertinent flood detection in this study, Convolution Neural Network (CNN) is used. It is a multilayer neural network, and one of the most classical and common deep learning frameworks [65]. Previously, this classification model has demonstrated excellent performance for image classification, segmentation, and extraction [65,66]. One advantage is its self-learning ability, as it can automatically learn features from large datasets by organizing multiple layers of neurons. Traditional machine learning models such as SVM have been used for flood detection that has shown good results, but the complexity of this model grows significantly as the training dataset increases. Apart from that, SVMs need to be tuned to find the optimal kernel function for training. The parameter optimization related to the kernel function is the key factor affecting the classification effect [66]. Therefore, to handle datasets such as the one in the current study, researchers are moving towards deep learning and utilizing deep learning models such as RNN and CNN for image classification and segmentation problems. Previously, CNN has been applied for the classification of data captured through remote sensing [67]. However, the application of CNN for flood mapping is rare and has not been thoroughly investigated. Therefore, the current study utilizes CNN to detect floods from aerial images captured through UAVs in Pakistan.
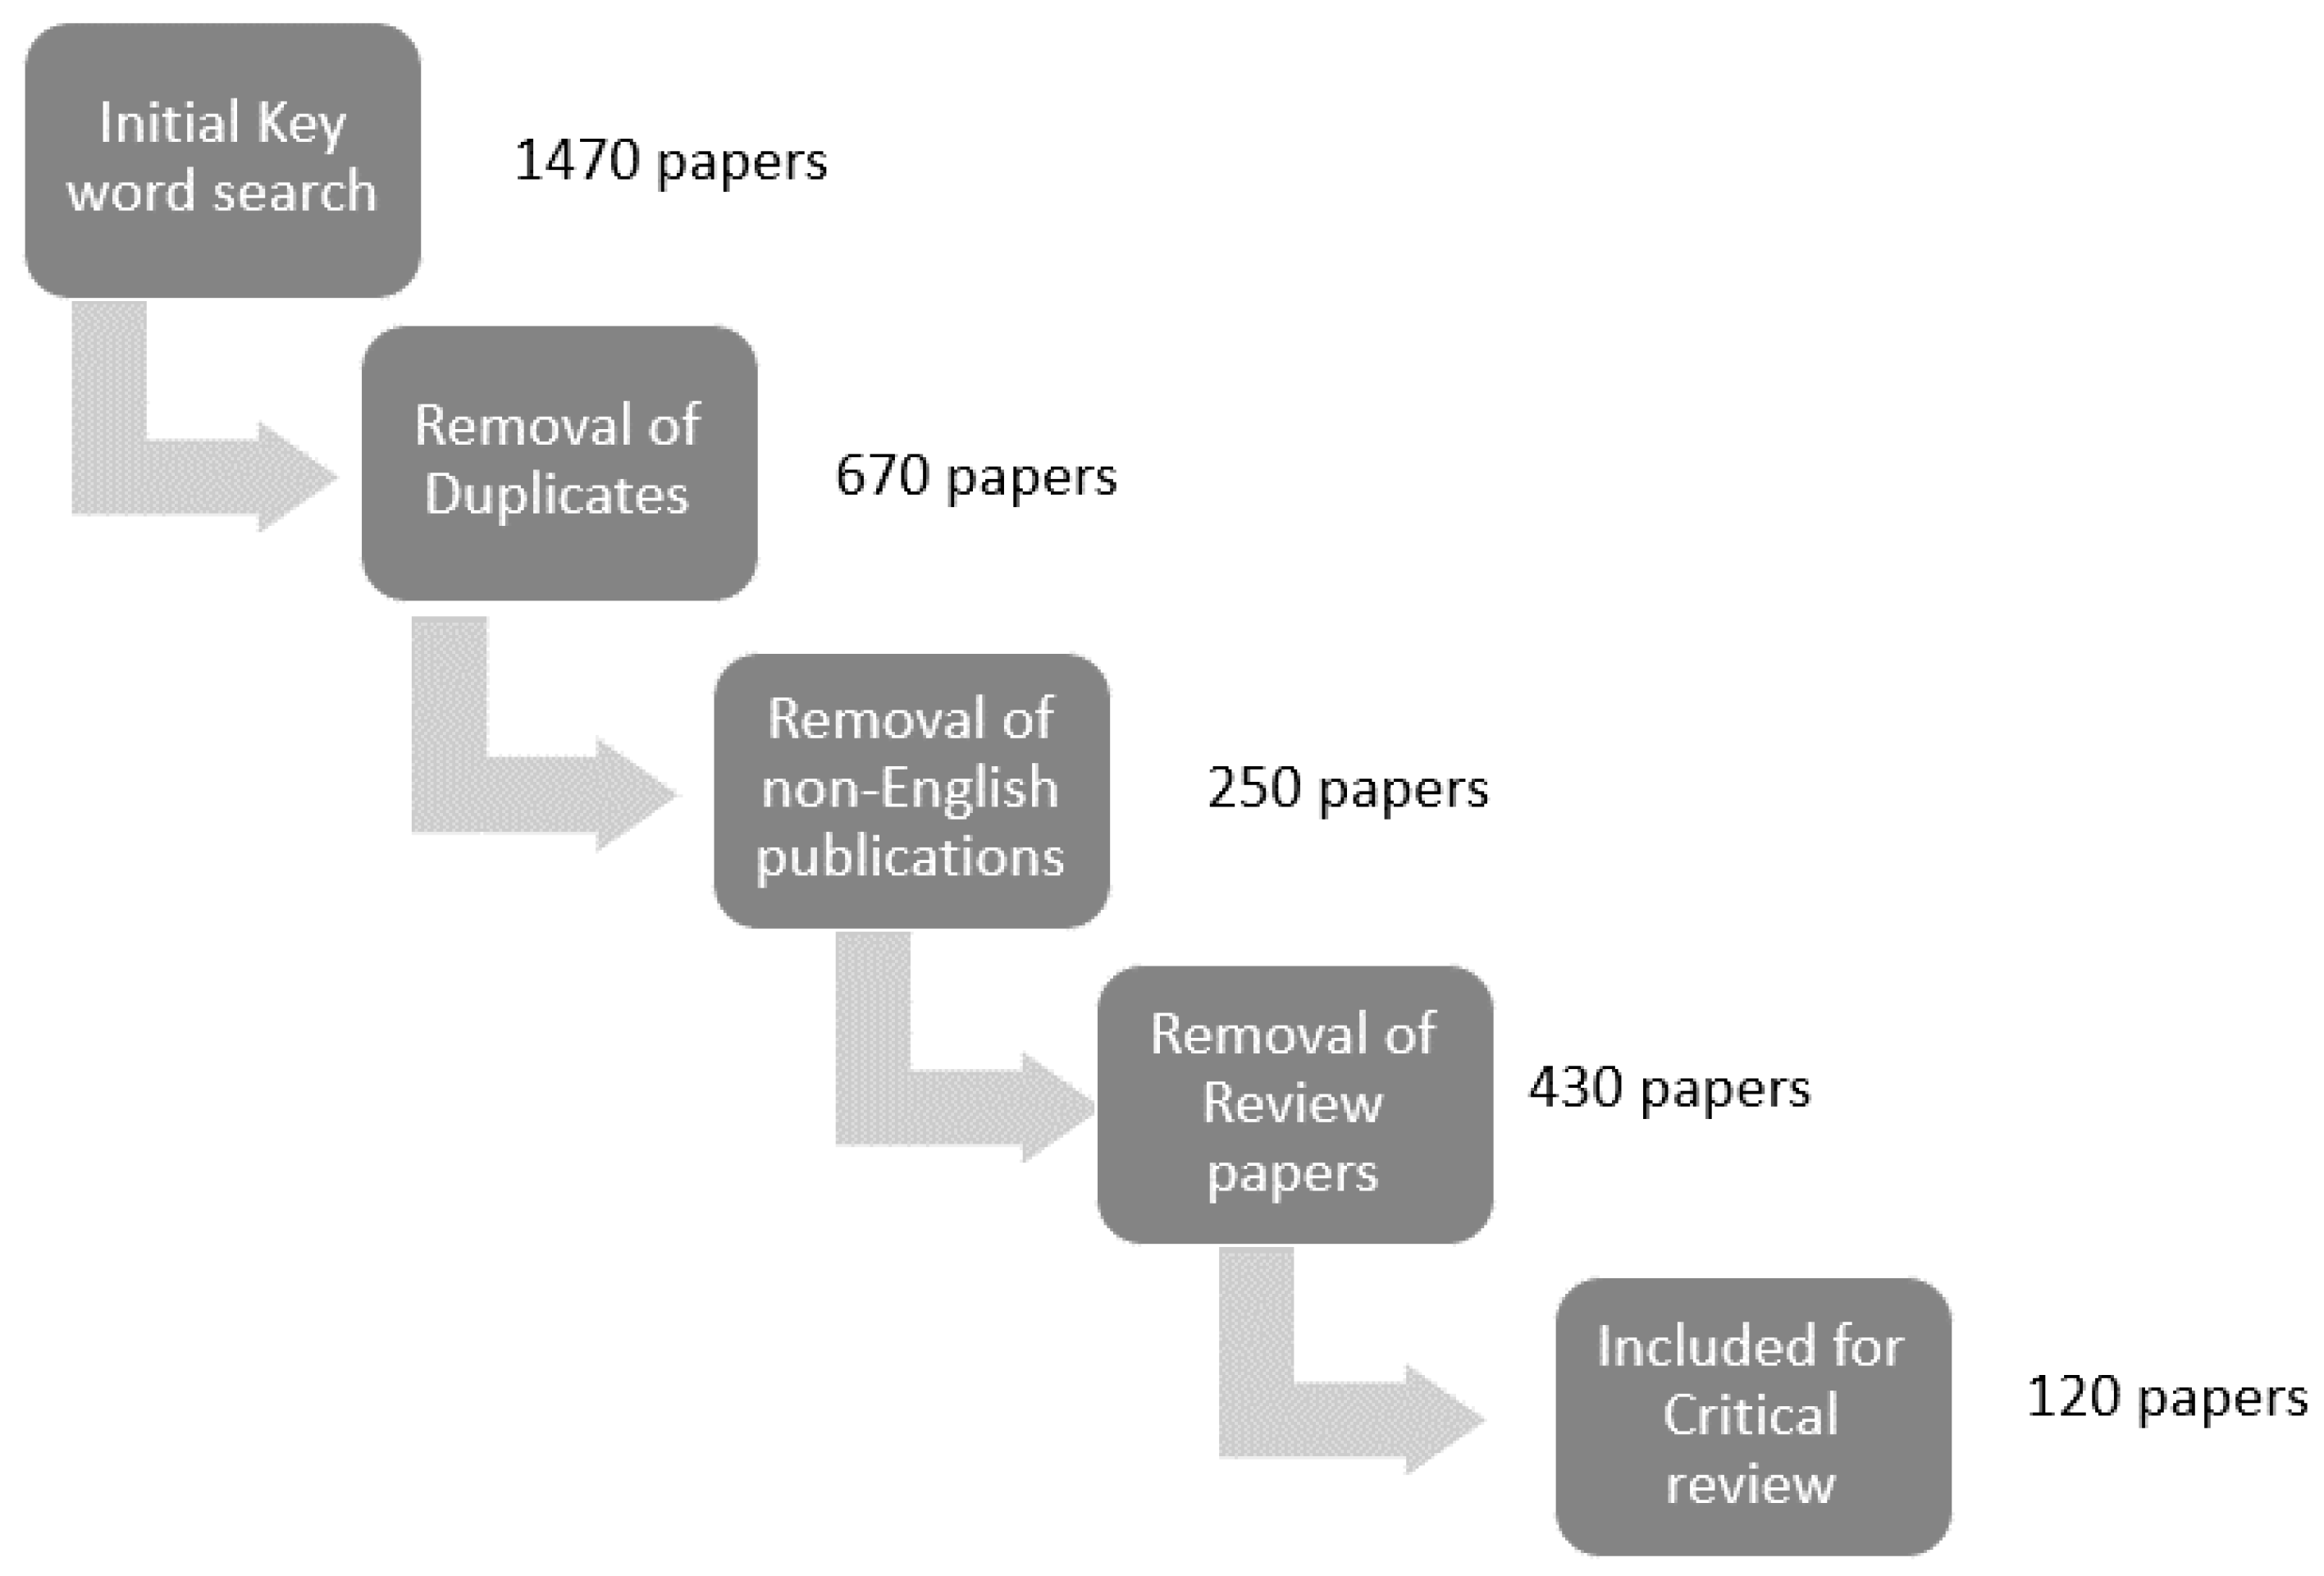
In the current study, a detailed literature review of the recently used flood detection technologies was performed to obtain insights into the existing methods used for flood detection. This information was subsequently used to select the most appropriate methodologies/parameters well suited to our data set. Moreover, by reviewing the existing work, current gaps in the research were identified, and proper strategies to overcome these gaps were devised and implemented. For this purpose, several search queries were formulated and used in literature search engines (i.e., Scopus and Web of Science) to extract the most recent studies using literature retrieval methods [2,9,10,11,12,17,18,68,69]. The search process was restricted to the last decade (2010–20) so that the most recent articles were retrieved. The review process was conducted in two phases: article retrieval and screening, as shown in Figure 1. The literature review was performed by removing duplicates articles, and screening research articles, book chapters, and conference papers published in the English language only.
After the screening process, a total of 98 articles were shortlisted. Among these, 34% of articles proposed image-processing-based techniques for flood mapping, 26% used machine learning, 21% were based on deep learning, and 19% of articles used methods belonging to other domains, as shown in Figure 1.
The paper is organized as follows. The Section 2 explains the research methodology adopted in this study. One of the most flood-prone areas in the country, i.e., Swat, is discussed as a case study, and the process of acquiring images for the dataset from this area is also elaborated. The Section 3 presents an overview of the evaluation process, experimental results, and comparison with existing techniques. Finally, the overall achievements and limitations of the proposed study are presented, and the study is concluded.
2. Research Methodology
2.1. Case Study Area
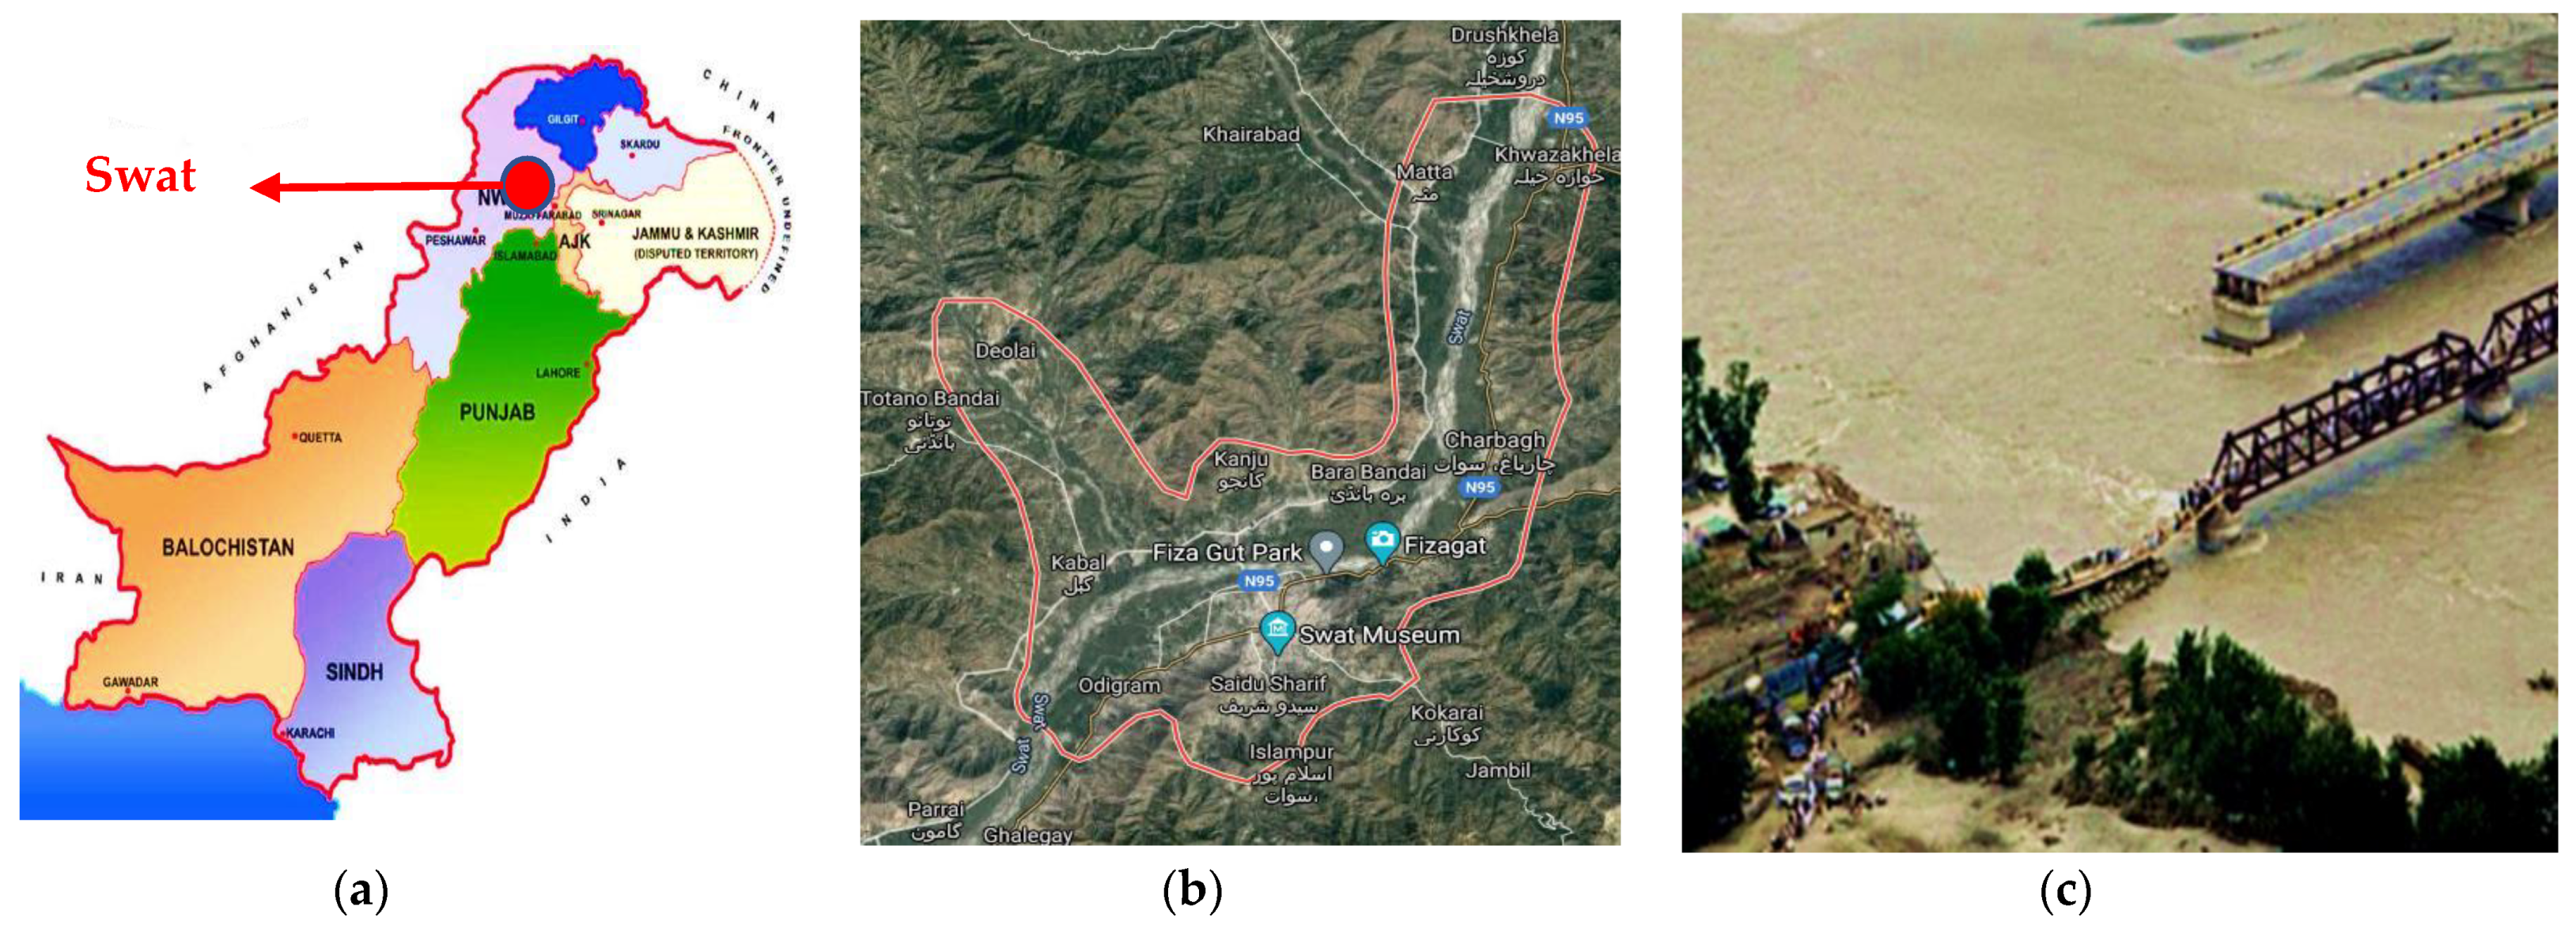
The case study for the current study is the Swat valley, a district of Khyber Pakhtunkhwa, situated in northern Pakistan, as shown in Figure 2a,b. Located at the convergence of two rivers, called “Daral” and “Swat”, this region is constantly at high risk of floods and was severely affected by floods in 2010. Last year alone, 30 lives were lost, and 38 others were injured in this region during the recent flash flood event. In addition, more than 130 houses, 1 bridge, and a worship place have been damaged or destroyed in these flash floods. Furthermore, several roads have been blocked or damaged by flash floods, isolating many communities [64].
Swat is enlisted under the high-risk areas for floods by Pakistan Disaster Management Authority (PDMA). According to PDMA, this area can become completely inaccessible if hit by a massive flood again. The recent flash flooding tested this statement and proved rightful as there occurred a significant delay in rescue services due to the inaccessibility of the land and damage of connecting bridges leading to more fatalities. Owing to this significance, this area is selected as a case study for the current research.
To address the flood risks in this region, multispectral aerial images from this area were captured for developing a comprehensive dataset. A Red-Green-Blue (RGB) image captured by UAV from this region is shown in Figure 2c that covers a residential area of Swat. The spatial resolution of the image is 0.23 m, allowing precise detection of inundated areas. The image has a size of 19,956 × 12,444 and covers an overall area of approximately 11 . In total, 300 images were captured by the UAV, whereas the remaining dataset was constructed using the pre- and post-flood images collected from the local databases maintained by PDMA.
2.2. Proposed System Workflow
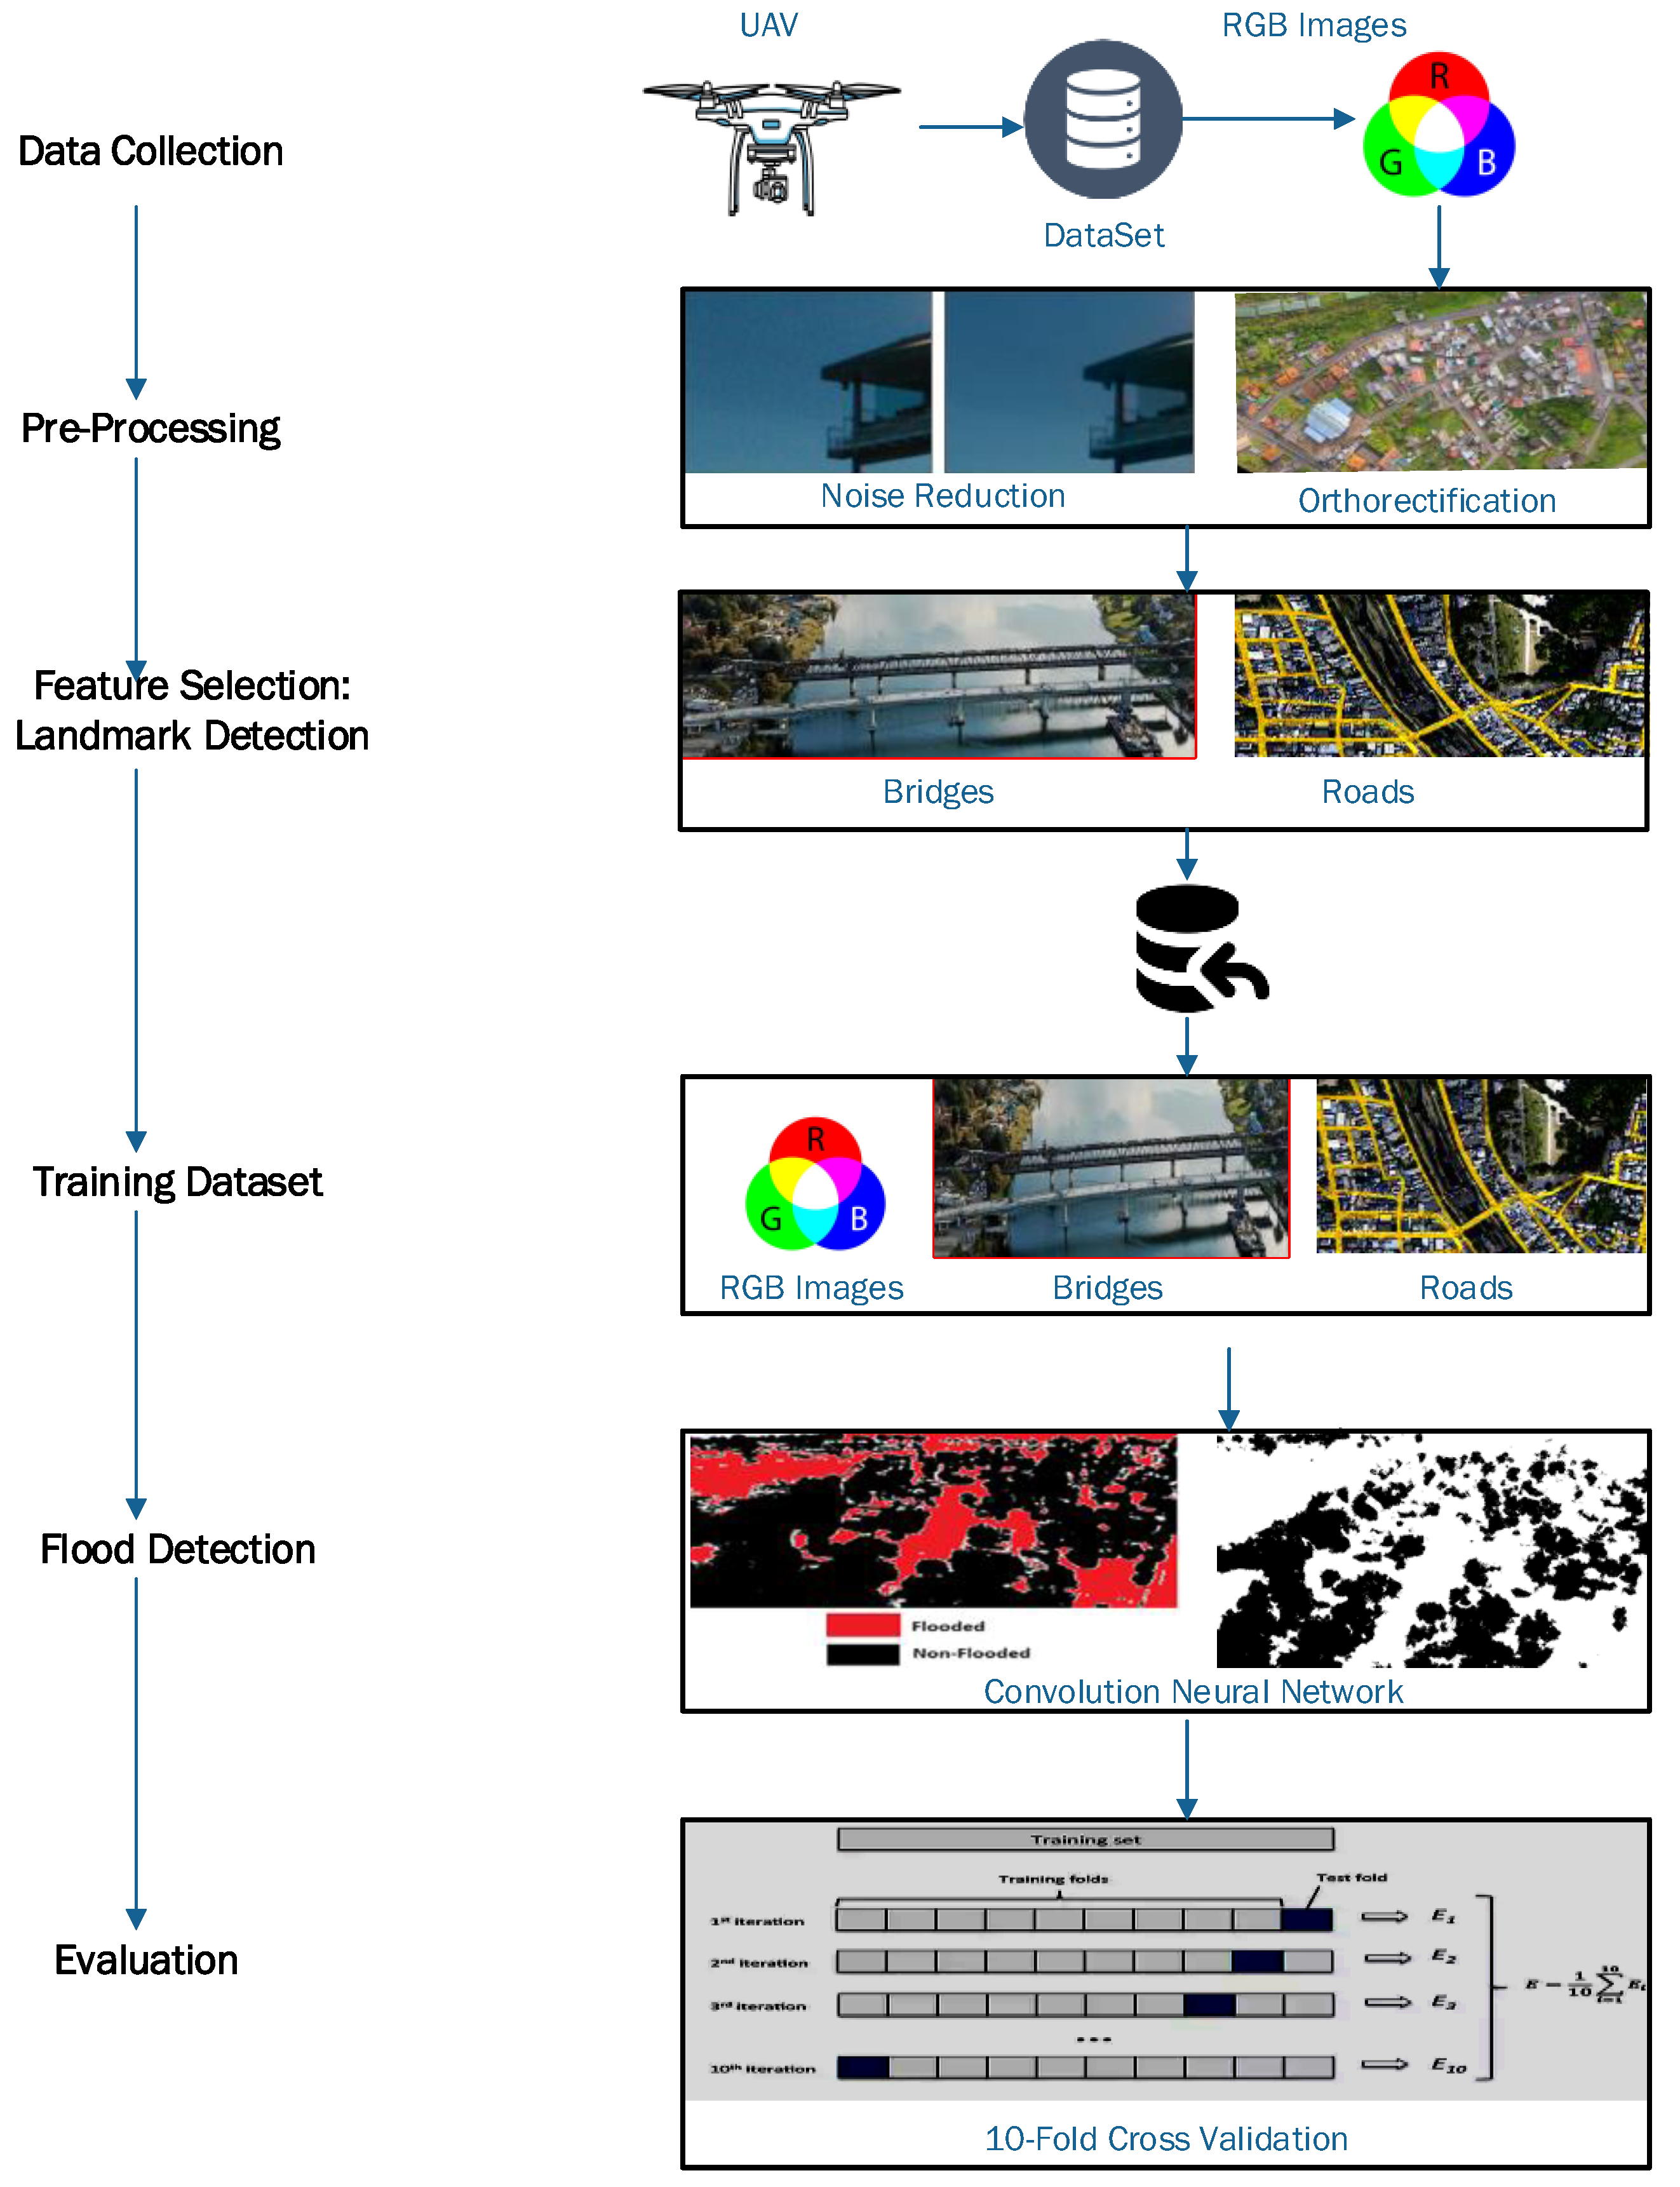
An abstract-level flowchart of the proposed methodology is shown in Figure 3 that has six major steps:
- Image acquisition and data collection using UAV;
- Preprocessing of the images;
- Selection of landmarks features for detection;
- Training the model on the dataset;
- Flood detection using image classification;
- Performance evaluation of the proposed system.
2.2.1. Image Acquisition
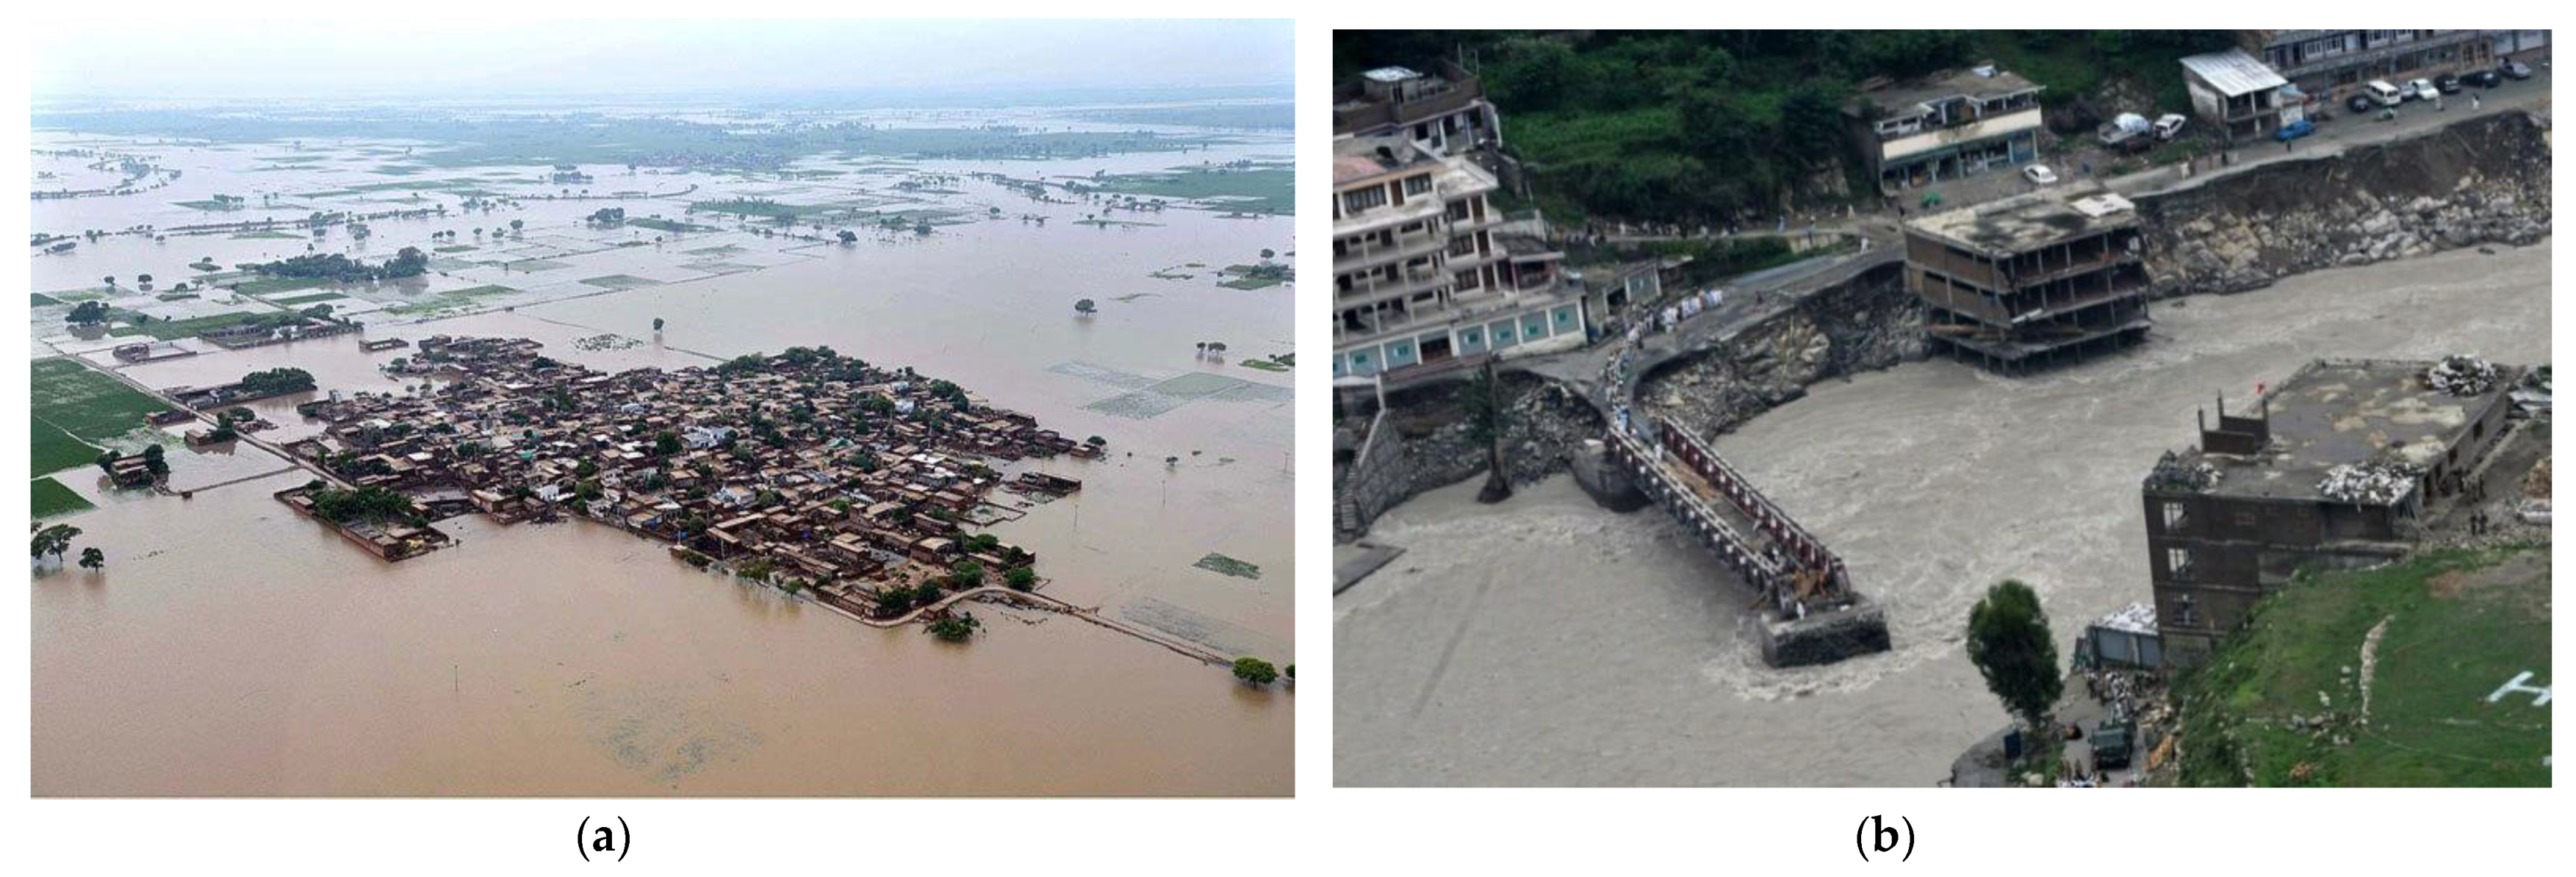
For surveillance of the flooded areas and their inundation detection, a small-sized UAV called River-map was selected. Go-Pro® digital camera was onboard for capturing high-resolution RGB aerial images of the case study area. Using this set up, real-time surveillance of the case study area was performed on 2 September 2020, as shown in Figure 4a,b, highlighting the destruction caused by the flood in this area. The images show that most roads are sunk into the water, and buildings are collapsed due to the high intensity of floodwater, making the process of relief work more difficult and time-consuming, if not impossible.
The data acquired by the UAV was in the form of RGB images with some level of distortion. Such distortion is an inherent characteristic of the images captured through satellite imagery or an aerial imaging system. Furthermore, the surface of the earth has some topographical differences, and due to an inclined angle of satellite, the UAV, or the aerial camera, the distance between the displayed features may not be 100% accurate or a true representative of the ground realities. The distortion in images increases with an increase in the topographical variance of the landscape. This distortion must be eliminated to infer meaningful insights from the captured images. For this purpose, the image processing technique of “orthorectification” was applied. The orthorectification process removes the effects of tilts and terrain from the images to create a planimetrically correct image. The resultant orthorectified image had a more constant scale showing captured features in their ‘true’ positions.
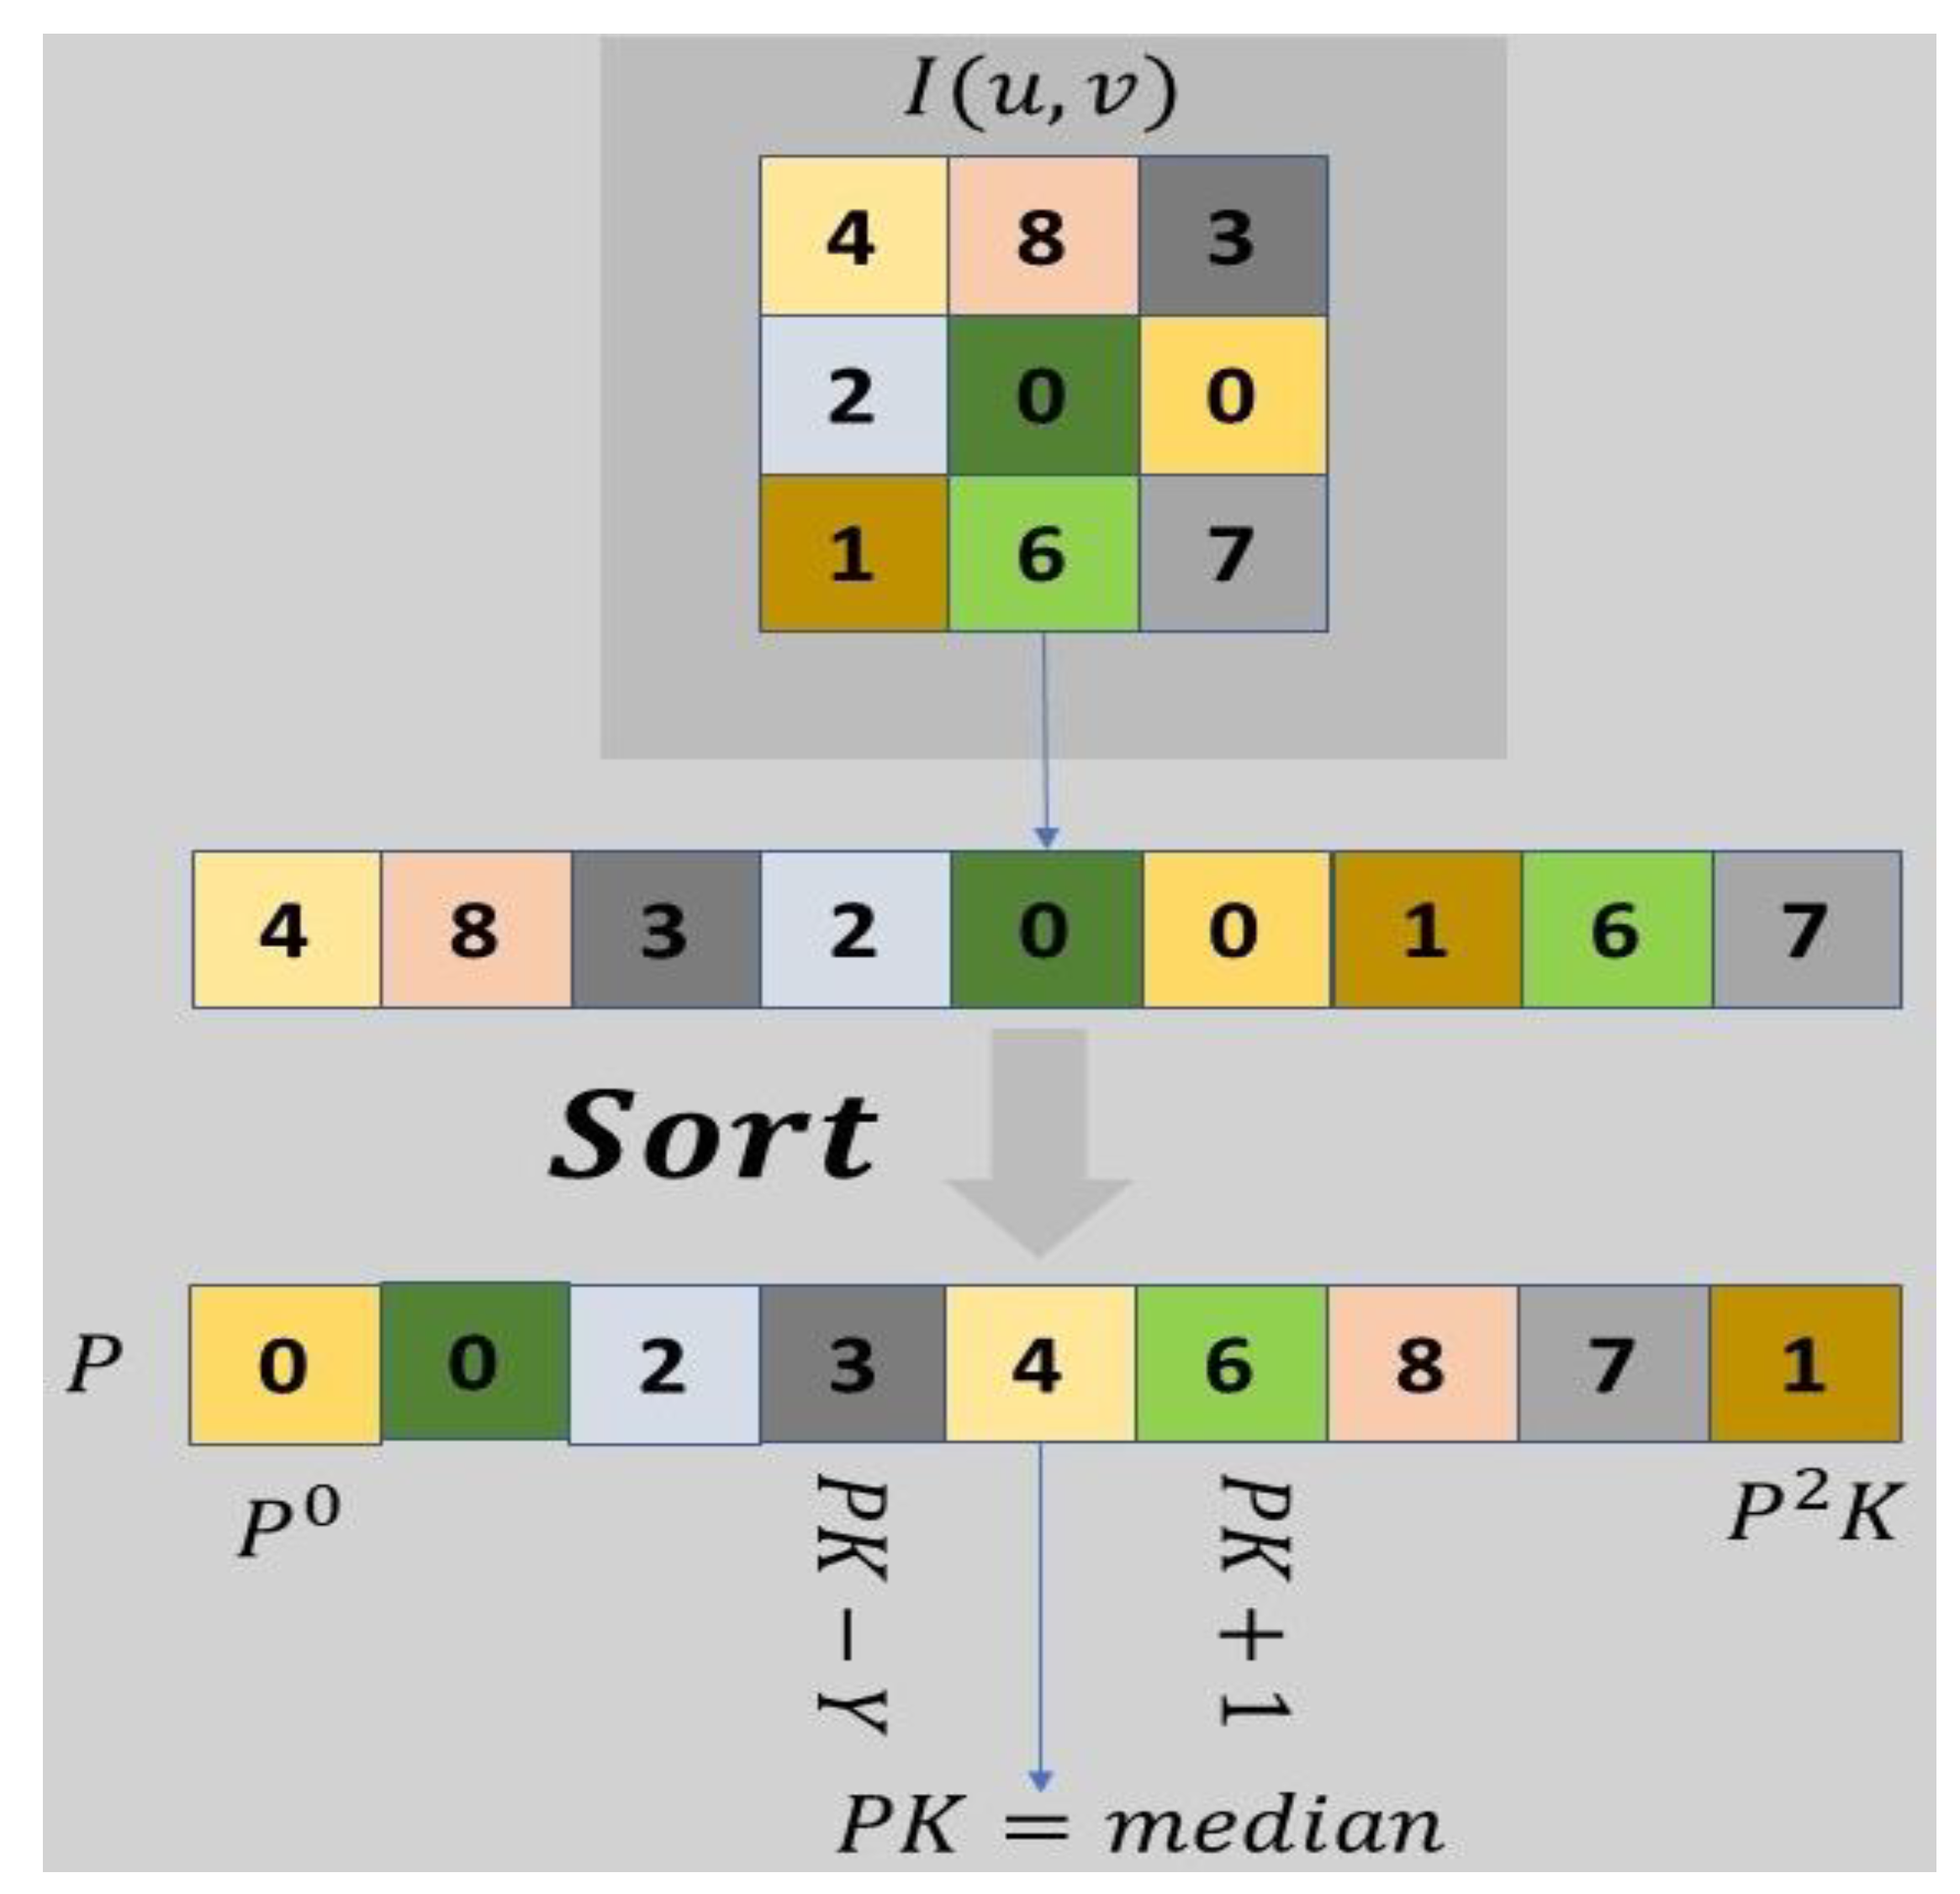
Furthermore, the captured images may have some noise due to environmental factors such as air pollution, dust, smoke, and fog. Therefore, a median filter with good de-noising power and mathematical accuracy is applied to the captured images to reduce this noise. The median filter is one of the popular order-statistic filters that is effectively used in digital image processing. It is a nonlinear filter used to remove “salt and pepper” noise from images while maintaining the edges of features. This filter was applied to the captured images in the current study so that the feature extraction in the next steps would not be affected, and high-quality images can be utilized for inferring meaningful results. A fixed filtering window size is used in a median filter, and the pixel value (target pixel) is replaced by the median value of the intensity levels of its neighboring pixels. Herein, the filter sorts all pixels in a window according to their numerical value and replaces the value of the target pixel with the median of the values of pixels in that window as shown in Figure 5. The working of the median filter is described using Equation (1) and Figure 5, respectively:
Here, R is defined as the moving region for all values in the median filter, I′(u, v) represents the current location, and I(u + i, v + j) denotes the corresponding image element.
2.2.2. Preprocessing
Image preprocessing is a prerequisite step to enhance the quality of the input images and prepare them for further processing in the subsequent steps. It involves downloading the raw images from the UAV’s digital camera, storing them in a database, removing noise, and applying orthorectification. Data preprocessing is performed to take into account different variations (i.e., size, shape, and brightness) in images. Therefore, after data collection, preprocessing was performed in the current study to remove unwanted objects and noise from the captured images. Additionally, the brightness and sizes of the collected images were also adjusted, followed by the removal of unwanted background regions/surfaces using image cropping. For the proposed CNNs, data augmentation was performed based on random image cropping and patching that was further used for label generation and flood detection in the entire training procedure [70]. Furthermore, the feature selection was conducted by extracting landmark features from the preprocessed images using a supervised learning approach.
In the current study, landmark objects are restricted to bridges, buildings, and roads. The extracted landmarks are then combined with the raw Red-Green-Blue (RGB) images to build the feature space for training a CNN classifier. Furthermore, the classifier is evaluated to test its flood detection capability on new test images. Finally, the performance is assessed using the confusion matrix derived from the validation process.
2.2.3. Selection of Landmarks Features for Detection
In the context of image classification, feature selection plays a vital role in achieving high accuracy. Good features can enhance the inter-class separation and decrease the in-class variance [71]. Thus, it is imperative to capture and select high-quality images with more pronounced attributes for getting accurate results. The images captured by the UAV in the current study had three color bands: red, green, and blue, which are not sufficient to achieve high classification performance since many other objects on the ground may have the same color leading to false detections by the classifier. Thus, it is necessary to extract relevant features from the input images, increase the inter-class separability, and remove irrelevant and redundant parts of the images. By analyzing the aerial images, it was noticed that most of the key landmarks were roads, buildings, and bridges that were subsequently chosen as target landmarks to be extracted using an automated tool. From the literature review, common image processing techniques used for road detection from images are edge detection and line-based extraction used in this study.
Supervised learning was utilized in this study to detect the objects of interest using the Haar cascade classifier. This classifier uses Haar-like features to identify objects from images. The main advantage is its high computational speed, making it suitable for real-time landmark detection when planning emergency responses. Thus, this method is adopted to detect roads, bridges, and buildings such as houses from the input images in the current study. Instead of looking at the pixels in an image, a Haar-like feature detector analyzes rectangular blocks and computes the total pixel intensity in the region. It then determines the differences between the calculated sums of each region.
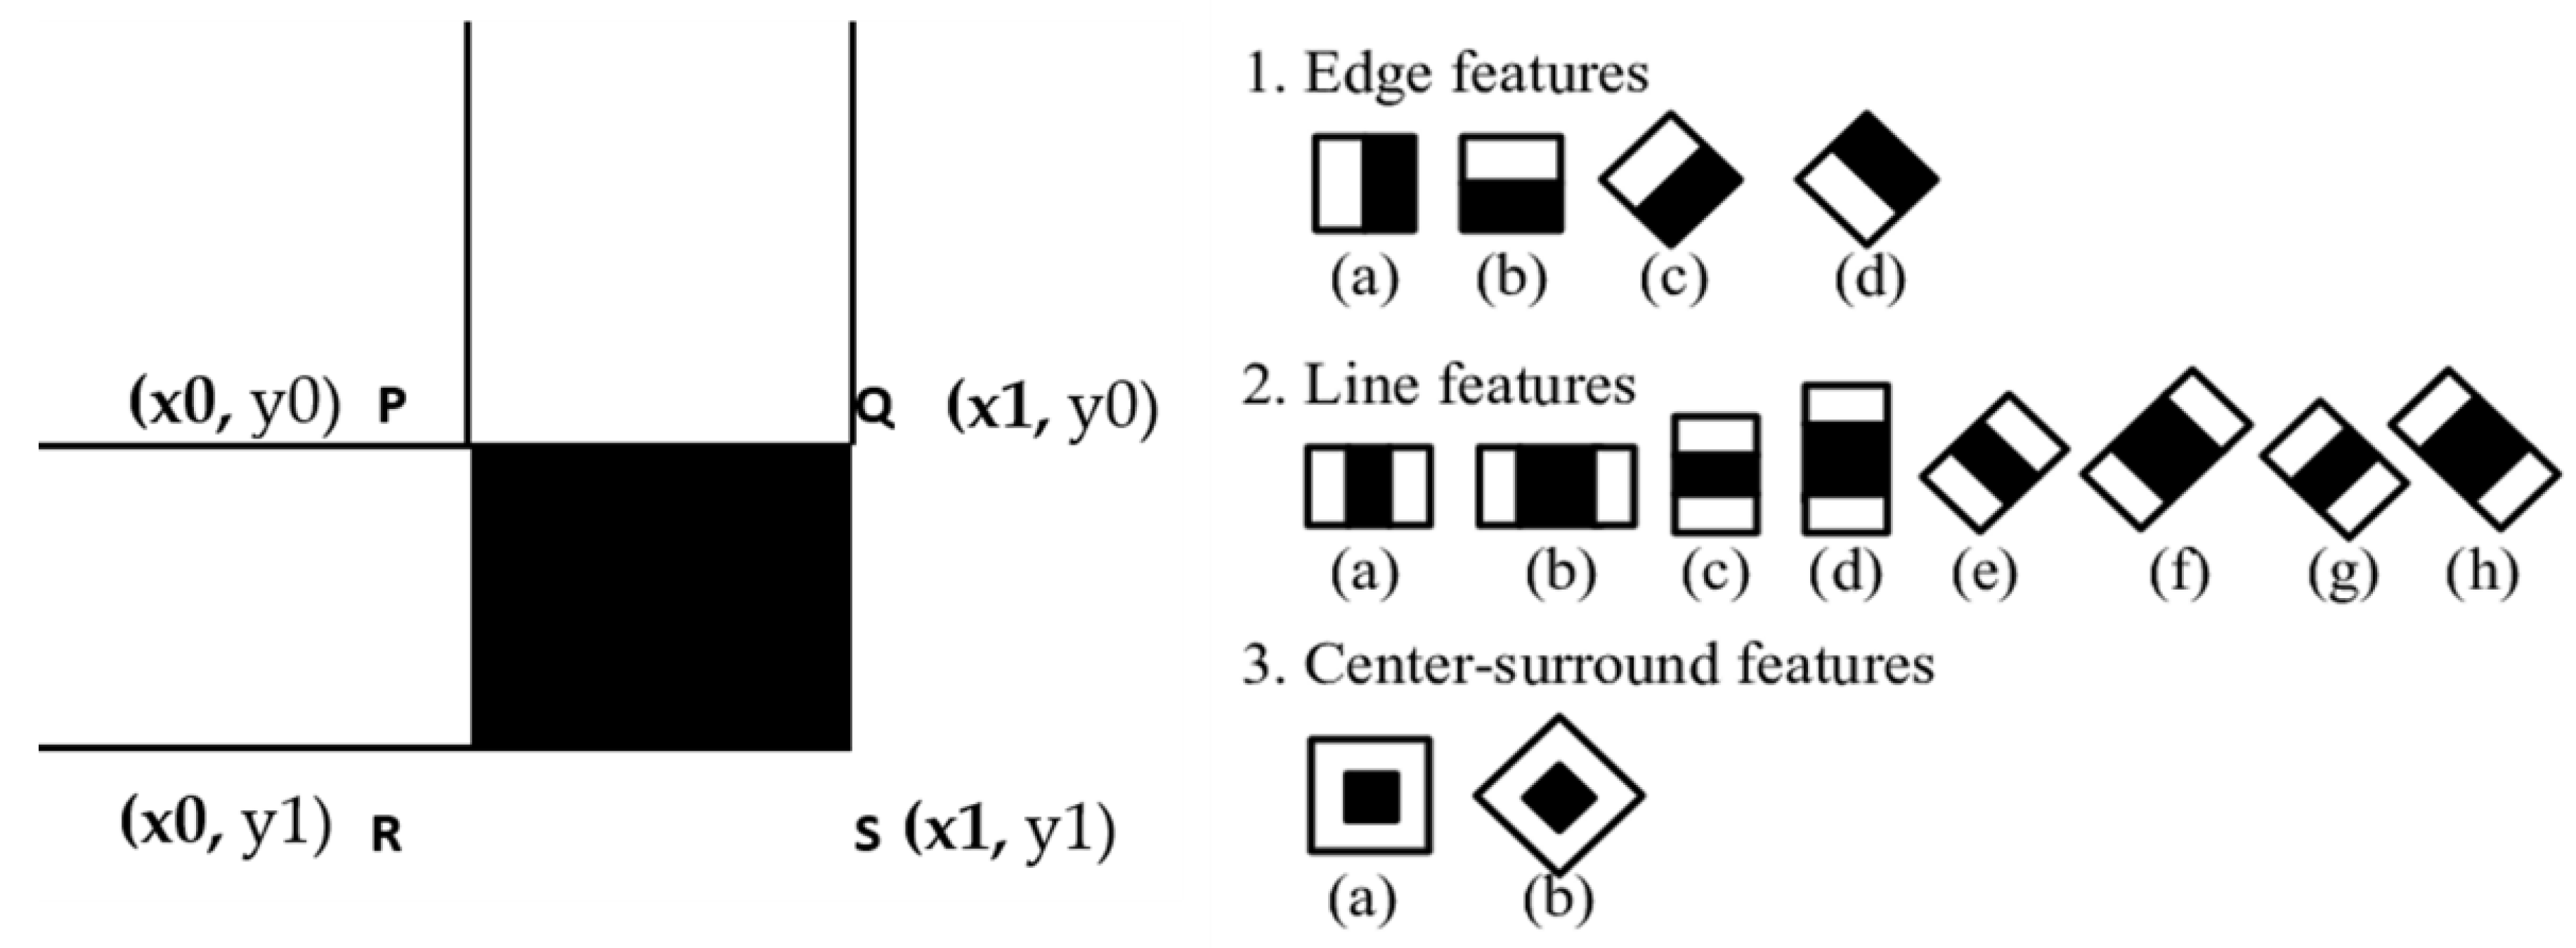
For example, consider the shaded area shown in Figure 6. If ‘I’ denotes the integral image and ‘P’, ‘Q’, ‘R’, and ‘S’ are points of a rectangular area in this image. The points P, Q, R, and S represent the four reference points used for the computation of images values on the black region. These points are described as P(x0, y0), Q(x1, y0), R(x0, y1), and S(x1, y1), respectively, as shown in Figure 6. The sum of the shaded region/area with points P, Q, R, and S is calculated using the sum(PQRS), as described in Equation (2). Thus, the sum(PQRS) can be computed in a constant time using only four references, i.e., I(P(x0, y0)), I(Q(x1, y0)), I(R(x0, y1)) and I(S(x1, y1)) to the integral image (Equation (2) [72,73,74], as follows:
This use of integral images helps in achieving computational efficiency, which is lacking in traditional methods. Haar-like features consist of predefined edge, line, and center-surround features, as shown in Figure 6. A strong classifier such as the Haar classifier can detect a feature under varying illumination, scale, and color. This makes the Haar classifier an ideal method for landmarks detection in aerial images, as these images can have varying lighting conditions and color properties during day and night or under different climatic conditions. Accordingly, it has been used in the current study.
2.2.4. Training Datasets
The RGB format is one of the most prominent encoding formats used for the representation of most natural images. As discussed earlier, for training the CNN, we used the original images in the RGB format that were used to extract landmark features from the preprocessed images using a supervised learning approach. The collected dataset contained both original RGB images and the landmarks extracted from these images in the feature selection stage. Generally, during the training procedure, the high performance CNNs are likely to display chances of over-fitting, which might be due to the memorization of the non-generalized image features by the CNNs that are present in the training set. Therefore, using a sufficient set of training samples is extremely important to avoid the over-fitting of the model [75]. Collecting a sufficient set of training samples is costly; therefore, data augmentation methods such as flipping, resizing, and random cropping are used to cater to it [76,77]. Applying the aforementioned augmentation techniques is essential to increase the level of variations in the collected images to prevent model over-fitting [76,77]. Accordingly, these have been used in the current study.
Additionally, for the current study, both training and test sets were visually interpreted. The visual interpretation of both sets highlighted that the test set images contain five pixel classes (i.e., buildings, bridges, roads, soil, vegetation, and water). However, all the classes were not present in all training images, thus leading to an imbalance problem. This imbalance problem was resolved using a balancing function based on median frequency in which a weight is assigned to each of the five-pixel classes that are absent in an image using the following Equation (3):
where ‘cf’ represents the class frequencies calculated over the whole dataset that are calculated using Equation (4):
The frequency of each of the classes in the training dataset of the current study is shown in Table 1.
By analyzing the map of Swat, training samples containing the images of river “Swat” and river “Daral” were eliminated to avoid the ambiguity arising from their classification under the flooded category. Overall, the training dataset contained 3000 images that were utilized for the current study. These images are used to extract the landmark features and subsequently aid in rescue operations.
To train the classifier, a set of labeled positive sample images containing the object to be detected and a set of labeled negative samples that do not contain the object are needed [78]. These datasets were constructed from scratch for the case study area as there is no previous research that used supervised learning for object detection in aerial images in the case study area. Images were gathered from available online databases of Microsoft Bing Maps, Google Maps, and Google Earth. Furthermore, images were extracted at varying altitudes, brightness, and scales to form a dataset containing diverse images. A total of 3000 aerial images of buildings (1000), bridges (1000), and images of roads (1000) were extracted for the case study area.
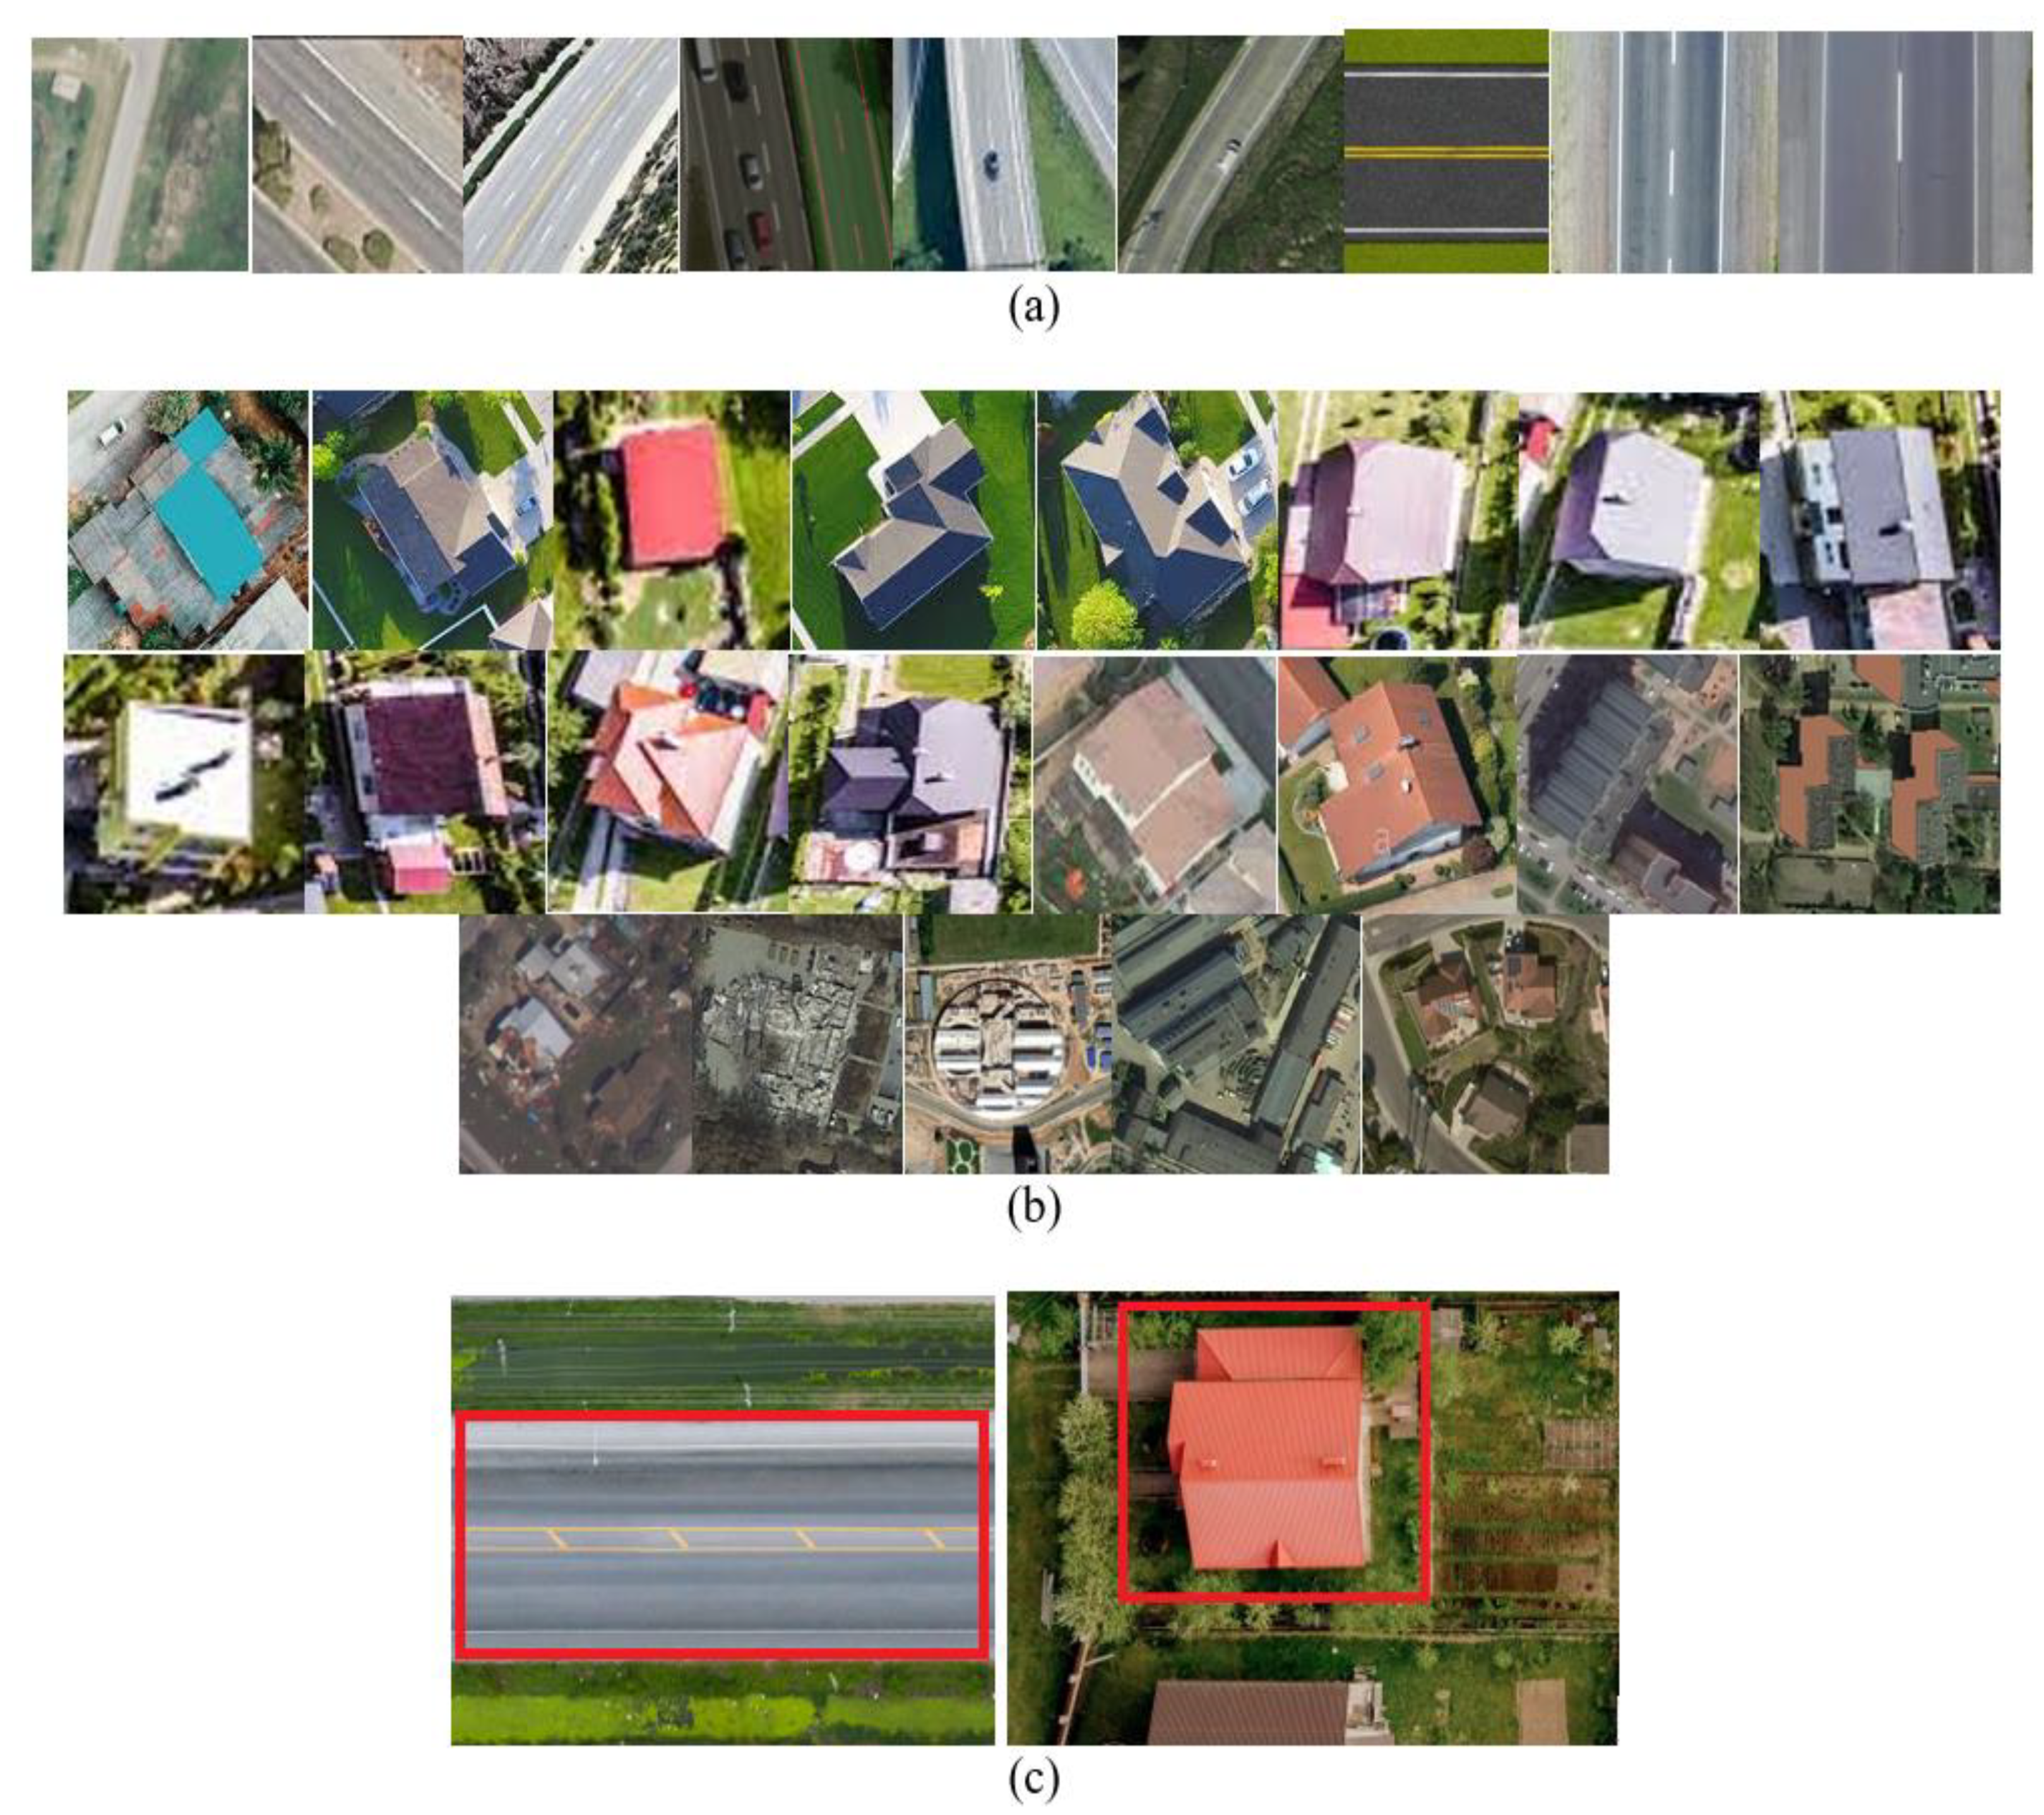
Figure 7 shows part of the road and building images datasets used for training the classifier. The next step was to label objects in each of the downloaded images. This involves highlighting, cropping, and naming the target object in each image. Furthermore, a negative training set was developed by cropping the regions not containing the target object from the images. In total, 1000 negative samples were collected for buildings, bridges, and road datasets, respectively. Finally, the OpenCV computer vision library, which provides the utility to train a Haar cascade classifier, was used for training. This involves creating a feature vector of the training dataset and providing it as an input to the classifier. The detected images of buildings and roads were cropped and added to the original dataset containing the RGB images, as shown in Figure 7.
2.2.5. Flood Detection Using Image Classification
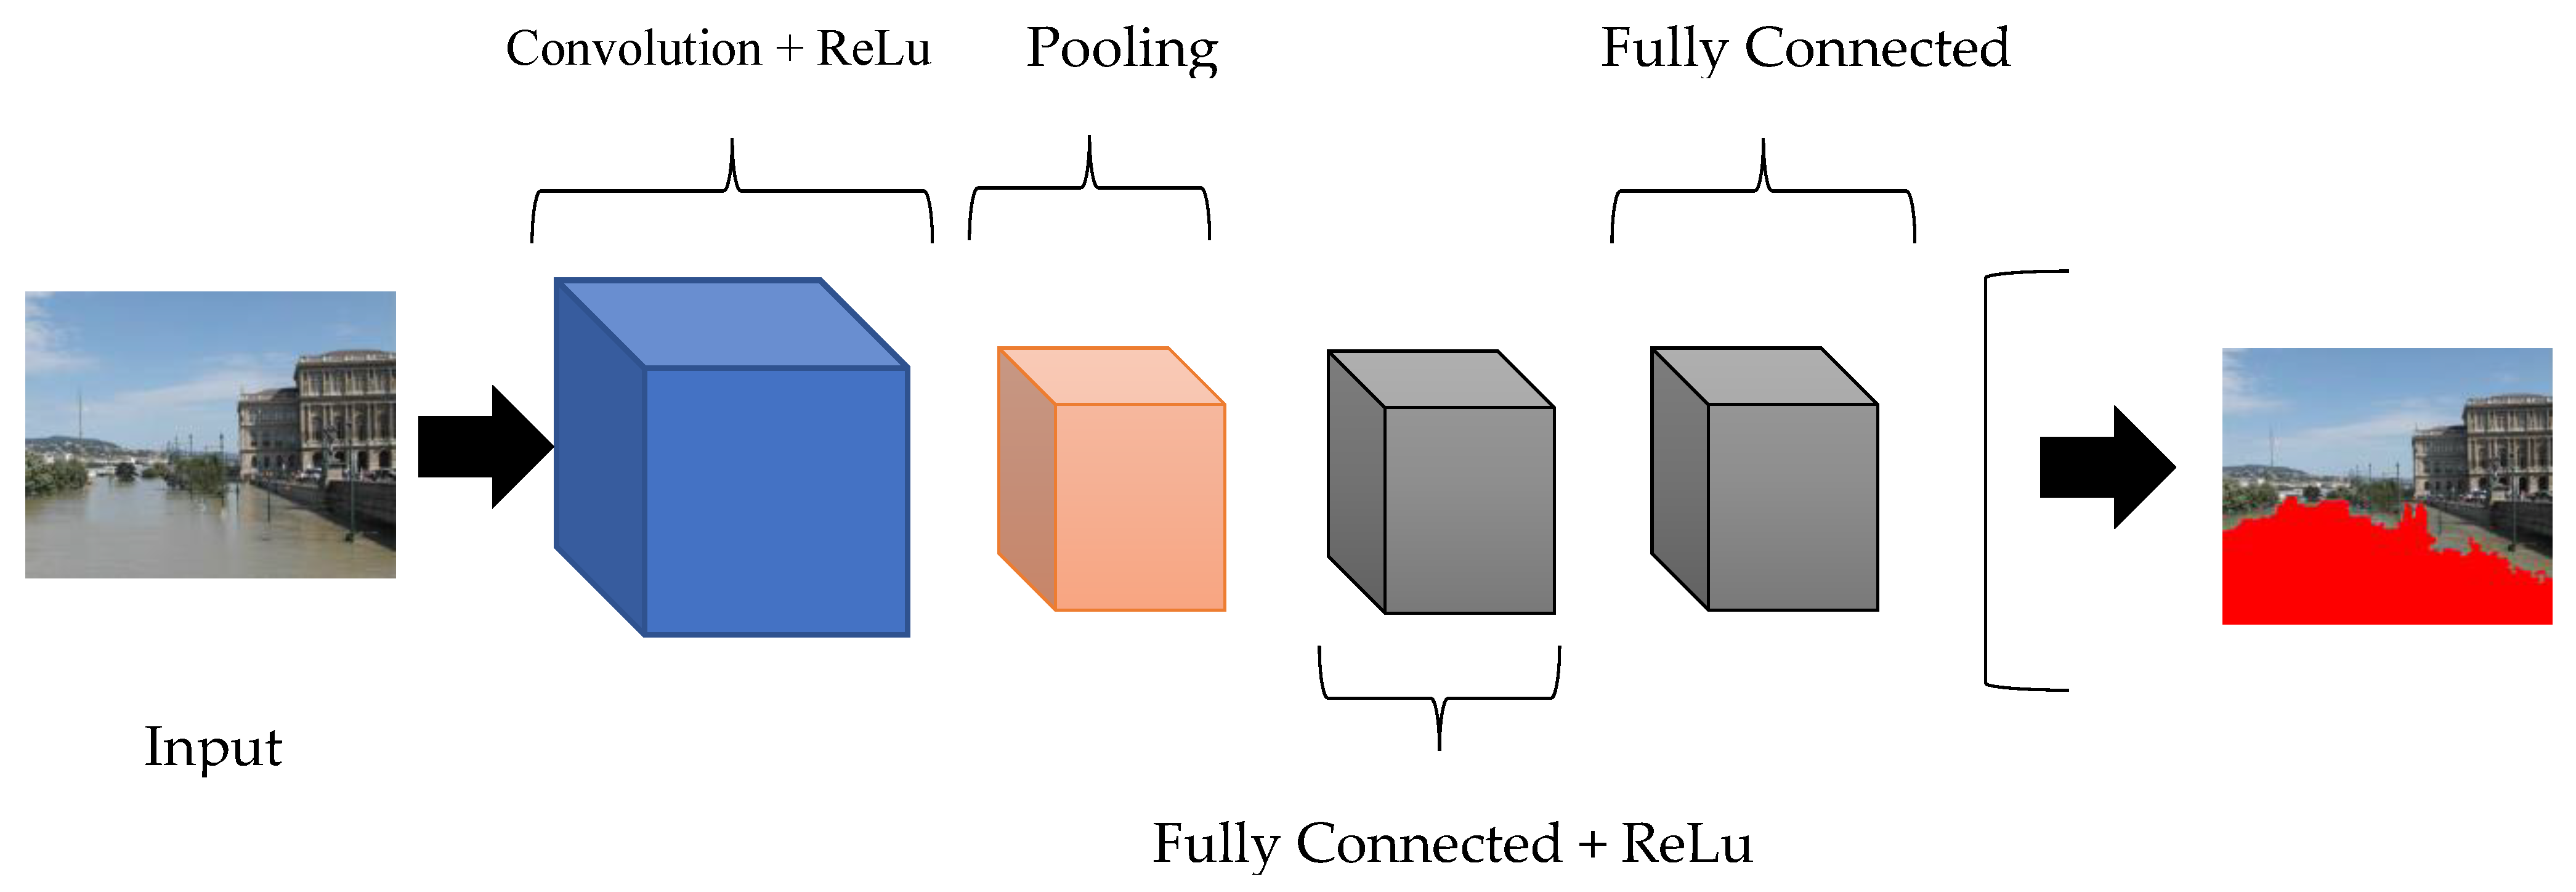
CNN has been used in this study for detecting floods. The architecture for CNN is shown in Figure 8, in which three layers are used: convolution, pooling, and fully connected layers.
Convolution is a common analytical operation that is applied to signal and image processing problems. Different features from an image, such as texture and edges, can be obtained using a convolution function. The overlapping area of two functions, ‘x’ and ‘y’, can be computed using the convolution operator. If ‘x’ is the original function and ‘y’ represents its flipped form, Equation (5) can determine the third function ‘c’ [43,52] as follows:
Furthermore, a digital image is viewed as a two-dimensional function such as ‘x(a, b)’ in image processing. Therefore, using a two-dimensional convolution function, ‘y(a, b)’, the output image ‘c(a, b)’ can be determined through Equation (6) as follows:
Similarly, in the case of a colored image that contains three channels, red, green, and blue, the input image of width ‘w’ and length ‘l’ is an array of size ‘S’, which is calculated using Equation (7) as follows:
S = 3 × w × l
A feature map is obtained as an output of the convolutional layer. This is obtained by taking a sum of the inputs () of all neurons multiplied by their weights (), plus a bias value () and an activation function as shown in Equation (8):
The Rectified Linear Unit (ReLU) is a standard activation function for neural networks. It makes the model easier to train and brings better performance outcomes. This function activates a node by outputting the input directly if it is positive and otherwise returning zero. This has been applied in the current study.
A pooling layer is added immediately after the convolutional layer and applied to decrease the width and height of the test image in the current study. This simplifies the computation as the number of parameters is reduced by decreasing the spatial size. This also tackles the over-fitting problem. Max pooling is the most widely used pooling technique in which a filter of size “s × s” is selected, and a maximum operation is applied over the “s × s”-sized subset of the image. After the pooling layer is added, a fully connected layer is introduced in which each neuron receives input from every neuron present in the previous layer. Computation, based on the multiplication of matrices and a bias offset, is used to determine the output. The aim is to compute class scores to classify the image in the current study.
2.2.6. Results Extraction and Performance Evaluation of the Proposed System
Images captured by the UAV in the current study contained rich spatial information and hence consumed more memory space. Due to limited memory capacity, these images were divided into smaller patches of 525 × 525 in size. To test the model, an evaluation method based on 10-fold cross-validation was applied, in which the dataset was divided into 10 equal parts or folds. This method was used to overcome the problem of overfitting of data and enhance the generalization performance of the classifier. One fold was used as the test set in each iteration, and the remaining parts were combined and used for training the system. This step was repeated 10 times, taking a new set for testing in each iteration, thus using unique testing set in each step. The classification accuracy and error were calculated using accuracy and error percentages from all 10 folds.
To train the CNN, images from both flooded and non-flooded categories were fed to the first convolutional layer, followed by two convolutional layers, a pooling layer, and finally, two fully connected layers. Initially, data is collected when the concept of CNNs is introduced, and models are trained using machine learning. Accordingly, in this study, data collection was performed using images from the flooded and non-flooded categories. This was followed by data preprocessing and labeling. For data labeling, different techniques, including bonding box and semantic segmentation, can be used. Accordingly, in this study, we have used semantic segmentation, which is a pixel-by-pixel labeling method where the water pixels, and the background pixels were extracted separately. Thus, an improved version of CNN was used in this study. Herein, the final fully connected layers produce only two outputs that classify the image into either a flooded or non-flooded category.
During the learning process, weights of the input variables were tuned in the convolutional layer in this study by taking random values for the parameters and updating them using back-propagation. The learning rate was 0.0001, and the maximum epoch value was set as 5 for all classes. A total of 167,400 iterations were conducted in the training process of the 10-fold validation. As a result of the training, the model learned to link images with class labels and make predictions about test images. It took a 24-hour period for cross-validation using an Intel Quad Core i7-8550U Processor at 1.8 GHz to extract the results. For assessing the performance of the system, a confusion matrix was used to assess and highlight the accuracy of the classification method. It provided a complete measure of the performance of a classifier by separating correct predictions from the incorrect ones for each class in the dataset. The confusion matrix was divided into four cells representing true positives (T.P.), true negatives (T.N.), false positives (F.P.), and false negatives (F.N.), as shown in Table 2.
Other measures such as precision, recall, and F-score were taken along with accuracy for performance evaluation of the classifier, as the accuracy alone does not give sufficient information about the class-wise results. For example, consider a dataset having 100 images, of which 95 belong to the non-flooded class and 5 belong to the flooded class. If all the images are classified as non-flooded, the accuracy will still be 95%, even though the flood was not successfully detected in any of the images. Hence, relying only upon accuracy may not be the right approach, and other measures are needed need to be put in place. Accordingly, in this study, other measures such as recall, precision, and others calculate the TP. The formula for these performance measures, including the accuracy, recall, precision, f-score, true positive rate, and false-positive rate, are given in Equations (9)–(14):
Overall, in terms of the time taken to conduct the study, it took almost nine hours to preprocess the input raw images. This included noise removal and orthorectification operations. Landmarks extraction by training a Haar cascade classifier and cropping the landmarks took 5 h. Finally, training the CNN-based deep neural network using the updated dataset took 24 h. Using the trained model to extract flooded regions took almost eight hours. This is a reasonable time to preprocess, analyze, extract features, and train a flood detection model from scratch, beginning with remotely sensed raw data to instigate an immediate response plan. Compared to other techniques that take weeks or sometimes months to plan a proper response, the current method is speedy and accurate. Upon completing the training process, testing was carried out using 300 aerial images of buildings and roads that included images captured at varying altitudes, scales, and illumination conditions. The classifier correctly identified roads and buildings from the dataset with 91% and 94% accuracy, respectively.
3. Results and Discussions
As explained in the method section, the model was first trained using the original dataset and the generated test results. Table 3 shows the confusion matrix generated by applying a dataset of test images to the trained model. The test dataset consists of 400 flooded and 400 non-flooded images. The results show that out of a total of 800 images, 675 were correctly classified, showing an 84.4% accuracy.
Table 4 shows the confusion matrix generated after applying the test images dataset to a model trained using the altered (improved) dataset. This resulted in 728 out of 800 images being correctly classified, making the trained model 91% accurate.
By applying Equations (9)–(12) to determine accuracy, recall, precision, and f-Score, respectively, we get the values as reported in Table 5. The results with and without landmarks addition have been compared in Table 5. The overall accuracy of 91% has been recorded after adding landmarks to the dataset, with a 6% improvement in the accuracy achieved using the original dataset. Furthermore, as shown in Table 5, the precision, recall, and f-scores of the model have been improved by 8%, 5%, and 6%, respectively, when the altered dataset is used to train the CNN model.
Compared to other studies, Fuentes et al. [64] used semantic metadata and visual cues to train a CNN model for flood detection and achieved an average accuracy of 83.96%. Feng et al. [71] obtained an accuracy of 87.5% using texture features and random forests along with RGB images for flood mapping. Elkhrachy [79] obtained an accuracy of 84.4% using an Analytical Hierarchical Process (AHP) to determine the relative impact weight of flood causative factors. Tehrany et al. [80] used different kernel types with an SVM classifier to develop a flood susceptibility mapping system integrated with GIS and achieved an accuracy of 84.97%. Thus, the current study system shows superior results compared to similar studies.
Table 6 compares the performance of the proposed system with recent methodologies for flood detection. These results show that the proposed flood-mapping model outperforms the recently proposed techniques for flood detection. The only method that shows results superior to the current CNN method is the deep learning neural network. However, the difference is minor (1%); hence the two methods can yield nearly similar results. Hence based on its high performance, the proposed model is very promising for real-time flood mapping.
Figure 9 depicts the dependence of the classification accuracy on the number of images in the training set used in the current study. The x-axis and y-axis represent the number of training samples in the dataset and the corresponding classification accuracies, respectively. This graph indicates that the accuracy increases considerably with an increase in the number of input samples in the training set. Hence, expanding the size of the training dataset is one way to improve the performance of this model. If more training data, say a million or even billions of samples, are used, a better performance will be achieved as predicted by the graph. Adding the key distinguishing features to the training set helps the network learn more about classifying the images. The idea is to increase the size of the dataset by applying processes that imitate real-world variations. In this research, the background or irrelevant features present in the images were cropped.
Furthermore, the classification model was trained on a set of key features to be analyzed while distinguishing the classes. This is synonymous with the tactics used by a human while differentiating between a set of images manually. The performance of a learning model depends deeply on the training dataset, so expanding the dataset in a meaningful way is one way to yield a high classification accuracy. However, this approach can be expensive and slows down the training, so the tradeoff should be carefully analyzed.
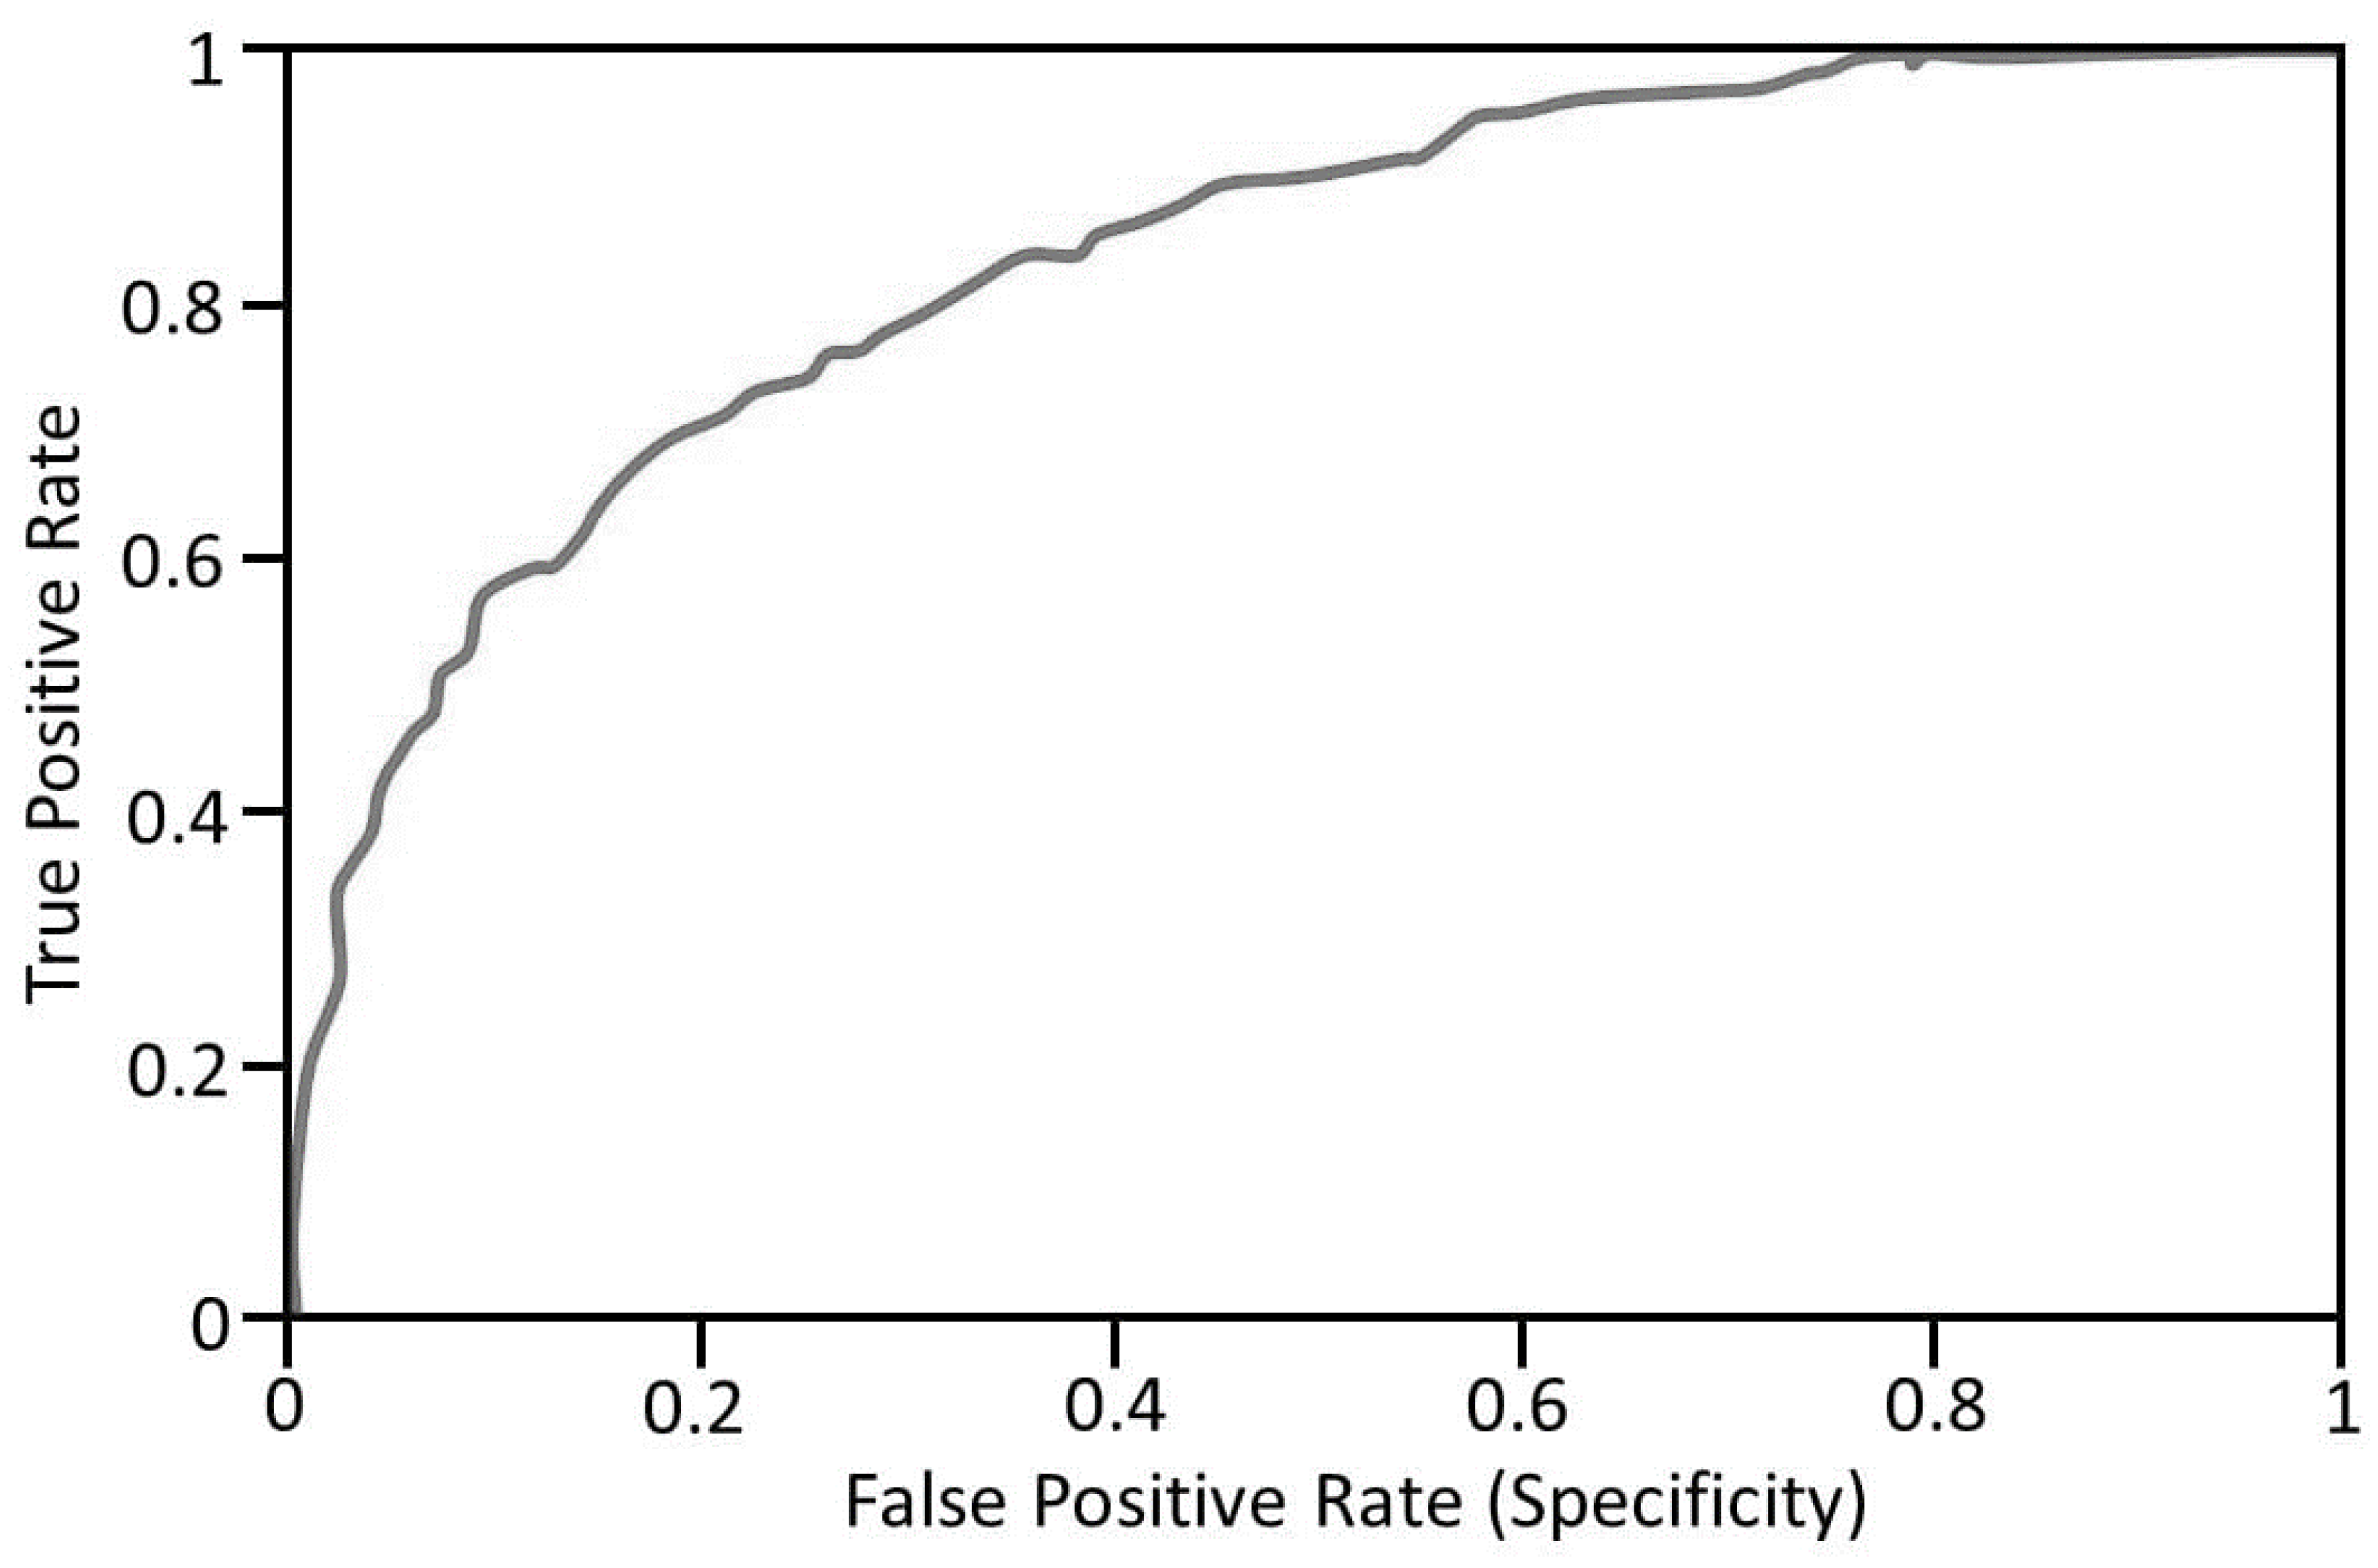
Figure 10 illustrates a Receiver Operator Characteristic (ROC) curve plotted using true positive rate (TPR) (y-axis) against False Positive Rate (FPR) (x-axis) with a cut-point of 0.5 probability. The area under the curve (AUC) represents one value that summarizes the result of the ROC curve. A value of AUC close to one represents its good classification performance, while AUC = 0.5 represents a bogus or no-skill model. For the CNN-based model in the current study, the values of AUC, TPR, and FPR are 95.7, 88.0, and 86.7%, respectively. Accuracy is the most simple and intuitive measure for highlighting classification performance. However, there are certain conditions where accuracy may not be a satisfactory measure. For example, if only one of a thousand test images belongs to the flooded class, the accuracy of a model predicting each image as “negative or non-flooded” will still be 99.99%. Unlike accuracy, ROC curves are not sensitive to the imbalance of classes in the dataset. They depict the ability of a model to distinguish between classes. The classification model in the example provided will have an ROC curve of 0.5, representing a “no skill” prediction model.
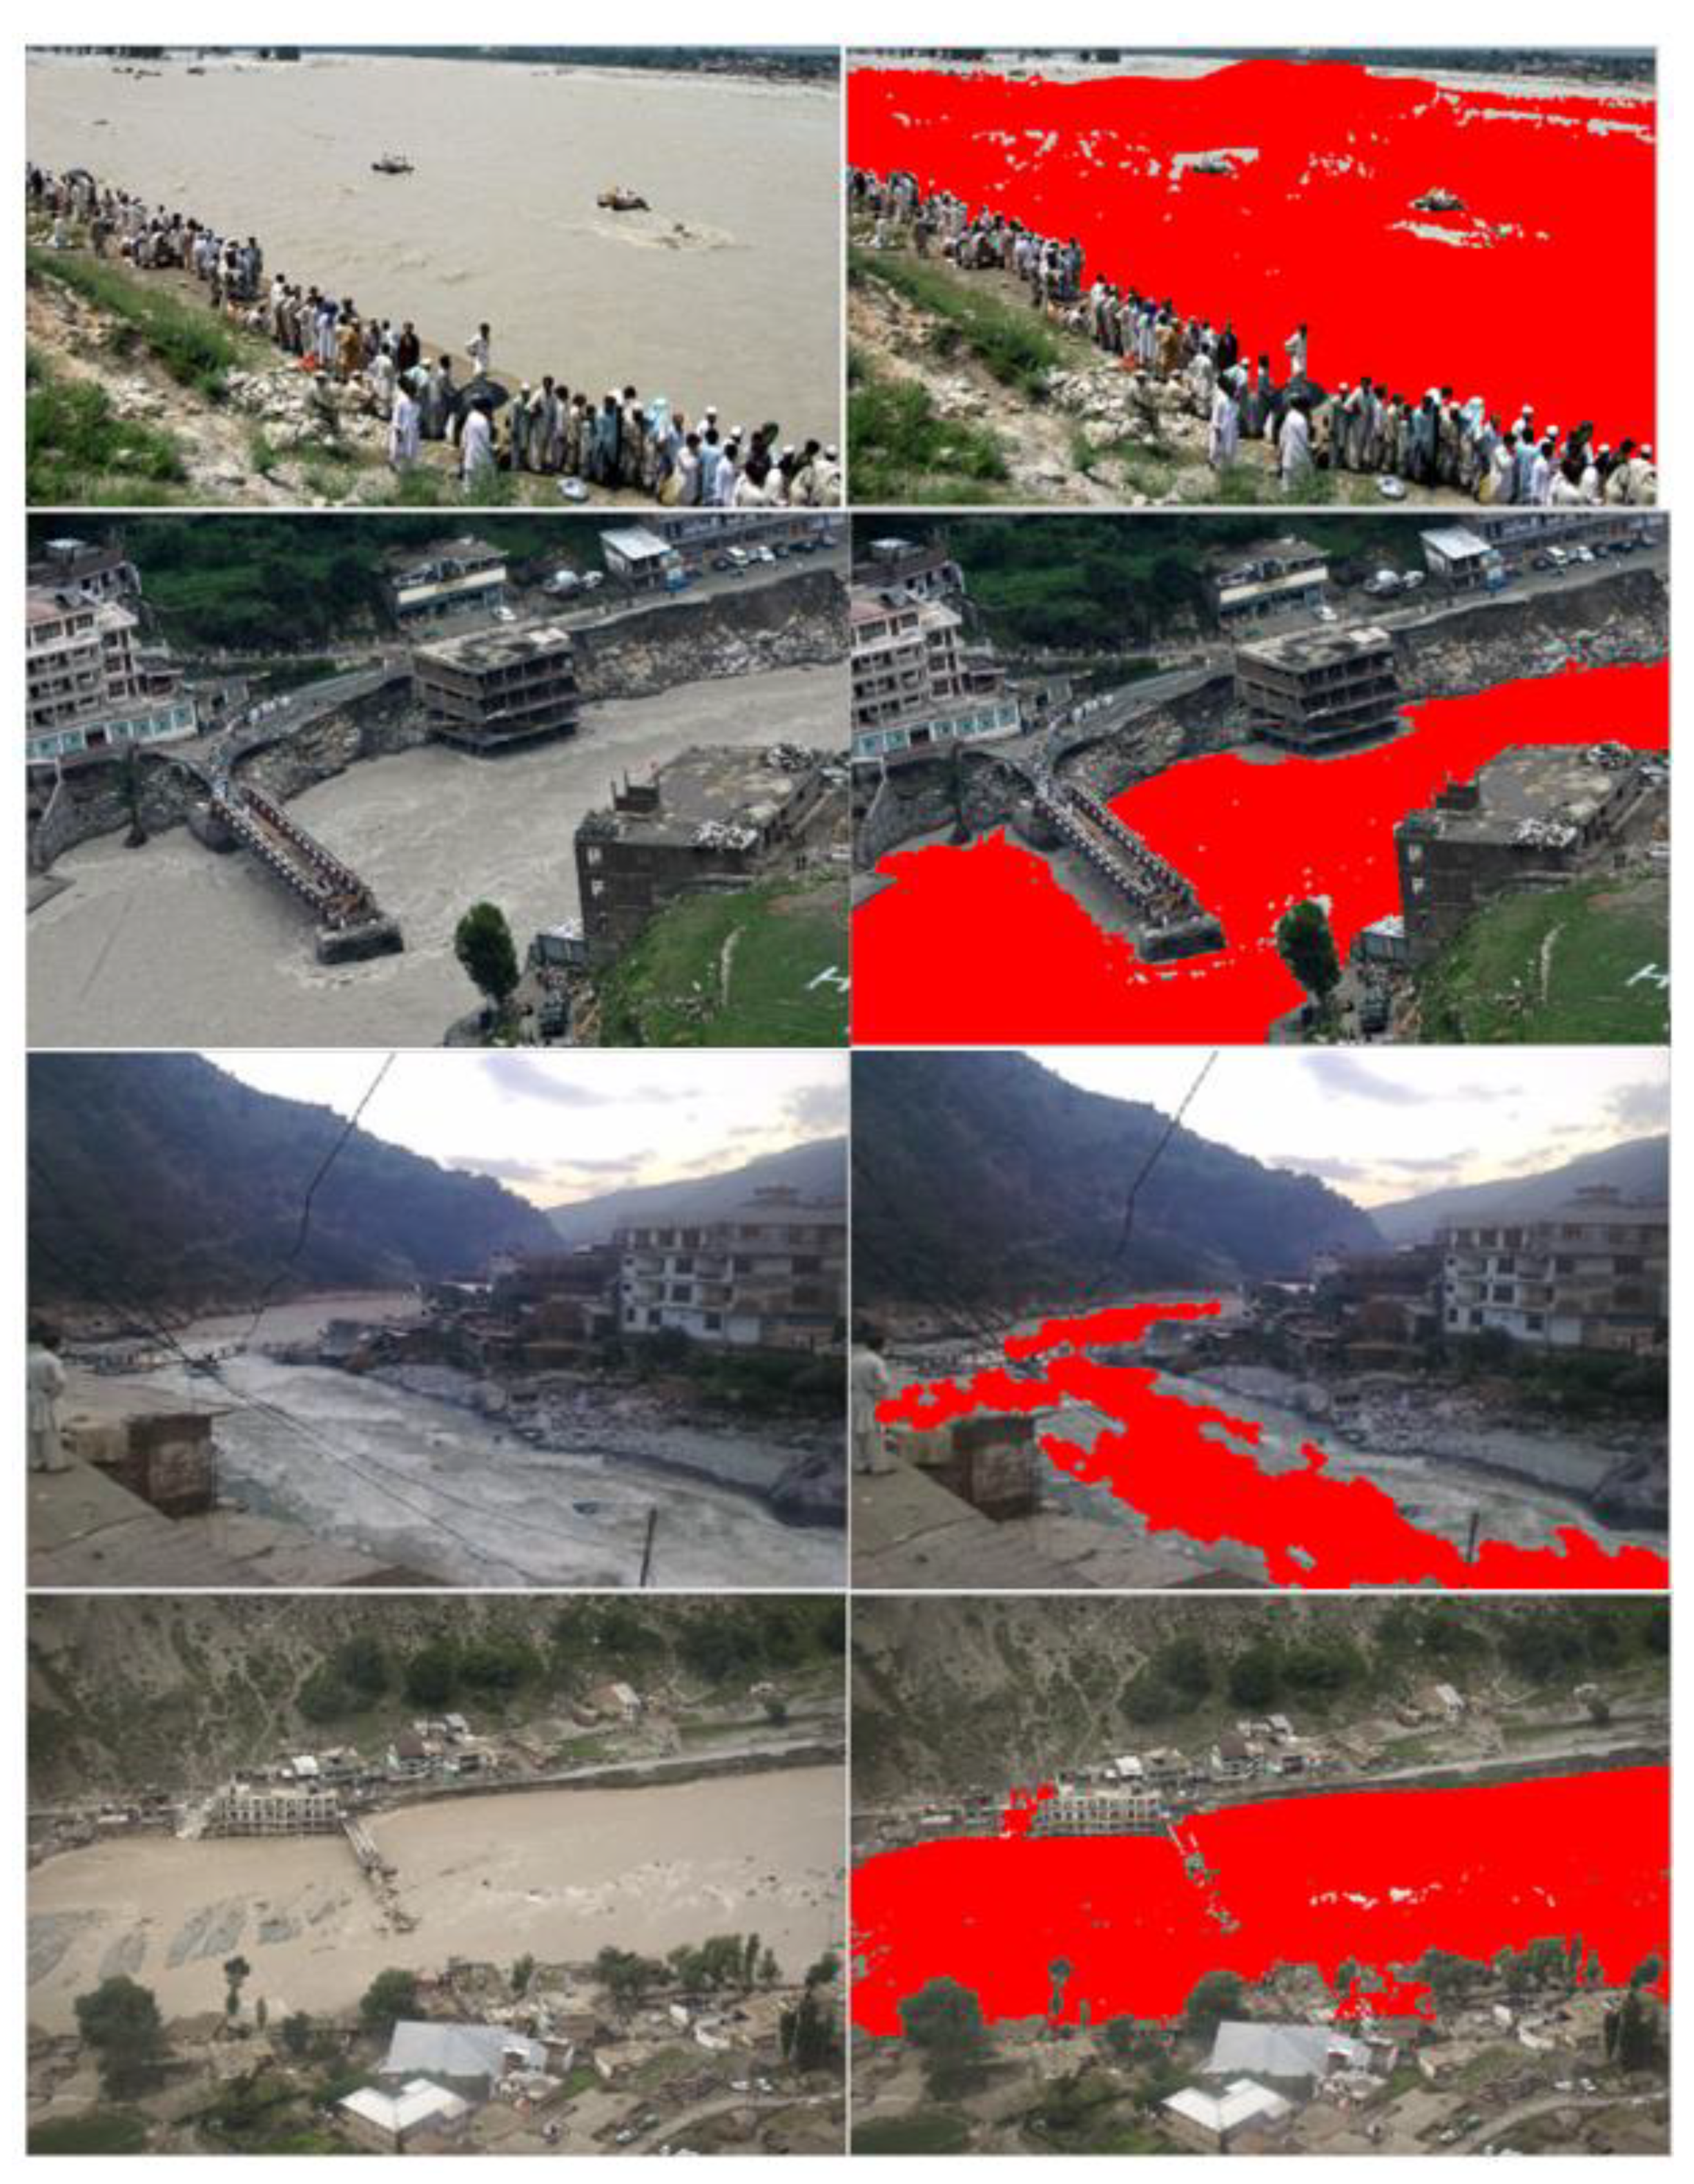
The output of the flood detection model is tested with 50 new test images captured from the case study area using the UAVs. Figure 11 shows sample test images used with the current model. Firstly, orthorectification and noise filtering were applied to the input image. The image at this stage was smoother, with certain noise arising from the shadows, reflections, or other factors completely removed or reduced to some extent. The color attributes of the image were preserved as the prediction model was trained for classifying multispectral images. This image was then fed to the trained CNN model for predicting its class. The classifier presented its output as shown in Figure 11, where the red highlighted regions show flooding. Accordingly, the image was classified as “flooded”, and hence responses can be instigated. The results clearly demonstrate the efficiency of the model for detecting and mapping flooded regions. All major areas in the image showing floodwater were identified. Some little patches of flooded regions may have been misclassified due to shadows or reflections in the image. However, the image will still be classified as flooded, which is the main objective of the CNN model in the current study. Furthermore, it must be noted that whenever we utilize real time imagery for capturing the shore or collateral regions, there are chances of achieving true negatives. Therefore, the edges of water were not classified in Figure 11. Overall, all the significant flood-affected areas were detected by the model.
In summary, UAV-based image acquisition is a promising method to capture high-resolution spatial images of the disaster site during emergencies such as floods. Such images containing rich information about the ground objects boost the performance of machine learning models. The associated image processing techniques result in increased precision and accuracy of the landmark identification and helps instigate a proper emergency response. UAVs are not restricted by their takeoff and landing conditions, making them more flexible and safer to be used than man-driven aerial vehicles. They also fly at a low altitude, enabling them to overcome the limitation of satellite imaging, such as blocking target view due to cloud cover or other barriers and accessing otherwise inaccessible locations. Thus, such imagery has the edge over GIS-based satellite imagery.
Furthermore, the type of sensor used with the UAV determines the effectiveness of the real-time data. By using a digital camera such as the Go-Pro® used in the current study, high-quality images can be captured and quickly sent to the server based on the ground station. These images can be seen on screen in real-time, allowing for relief workers to make quick decisions in an emergency. This addresses the limitations of commercial cameras where RGB images will only be accessible after the landing of the UAV and cannot be viewed or analyzed in real-time hence delaying the response and hindering the rescue operation. Thus, to provide the feature of real-time surveillance, a versatile camera such as a Go-Pro ® should be used with the UAV.
A deep learning approach based on CNN was used in the current study to classify the images that showed highly promising results. By including landmark features with the original dataset, a 5% improvement in overall accuracy was recorded. This is because expanding the dataset results in more data to the model, leading to increased learning and forming a better and improved prediction model. However, the results are highly dependent on the content of images and features for training. Key landmarks must be extracted and added to the training dataset to provide the model with the most relevant features. A comparison with recent flood mapping techniques that used SVM, random forests, deep learning, and AHP shows that the CNN model of the current study had superior performance. Furthermore, it had comparable results to deep learning neural-network-based image processing. Hence, deep learning approaches are highly recommended for flood detection in aerial images captured through UAVs. This will help pave the way for smart disaster management in the Industry 4.0 era and move towards the goals of smart cities and regions.
The current study does not detect or assess the population to provide aid and potential calculating damages to the population. Furthermore, it is limited to a maximum coverage area through a limited number of UAVs. Due to limited battery timings of UAVs, i.e., 30–45 min, the regions should be prioritized for capturing images and detecting floods. To deal with this, swarm intelligence should be considered where UAVs can be made smart/intelligent by a heuristic-based approach.
4. Conclusions
This study presented a hybrid model for landmarks-based feature selection and CNN-based flood detection. The key landmarks (i.e., roads, bridges, and buildings) were detected using supervised learning and added to the training dataset through swift response instigation, which was further used for training the CNN model. The inclusion of landmark features with the original RGB images significantly improved the model’s performance. Moreover, using the CNN model on a large dataset based on aerial images has shown superior results, which surpassed traditional machine learning classifiers. Thus, successful implementation of UAV-based imaging for flood inundation mapping has been demonstrated in the study, proving that UAVs are ideal for the facilitation of real-time surveillance of inundated regions. Additionally, an accuracy of 92% was observed for extraction of the inundated areas from images. An overall 5% improvement in accuracy was observable when landmark features were included in the dataset. Overall, our model demonstrated an improvement over previous techniques that used classifiers such as SVM and random forests.
The outcomes of this research are directly aligned with the United Nations International Strategy for Disaster Reduction and Sendai Framework for Disaster Risk Reduction 2015–2030 that is aimed at providing practical solutions to rescue people in flood-affected areas. Our study can help the disaster management authorities (i.e., PDMA) in Pakistan to carry out post-disaster rescue services efficiently and quickly. This will help them to supply aid and relief to the stranded people, thus saving lives and reducing the impacts of disasters such as floods. This will pave the way for the adoption of smart technologies in the Industry 4.0 era.
A limitation of the proposed model is that it highlights the flood-affected and submerged areas using the two-dimensional images captured by UAV and cannot specify the depth of floodwater in the region, which may be needed to analyze the extent of flood intensity in a region. This issue can be overcome using technologies such as Digital Elevation Model (DEM) and Light Detection and Ranging Equipment (LiDAR). In the future, the accuracy of the system can be enhanced by expanding the dataset through the addition of more landmarks and features. Additionally, the feature selection based on rivers, people, and vehicles can also improve the quality of the dataset. Furthermore, other deep learning approaches, including RNN and LSTM, can be explored to perform flood inundation mapping in addition to its detection. Similarly, the study can be merged with vehicle routing techniques to plan rescue and emergency first aid responses in disaster-struck areas. This will help the flood management, fire, and search and rescue authorities in any country. Accordingly, the goals of modern smart cities and smart regions could be achieved.
Author Contributions
Conceptualization, H.S.M. and F.U.; methodology, H.S.M., F.U., S.Q. and A.H.; software, H.S.M. and F.U.; validation, H.S.M., F.U., S.Q. and A.H.; formal analysis, H.S.M. and F.U.; investigation, H.S.M. and F.U.; resources, H.S.M., F.U. and A.H.; data curation, H.S.M., F.U., S.Q. and A.H.; writing—original draft preparation, H.S.M. and F.U.; writing—review and editing, H.S.M., F.U., S.Q. and A.H.; visualization, H.S.M. and F.U.; supervision, F.U. and A.H.; project ad-ministration, H.S.M. and F.U.; funding acquisition, F.U. and A.H. All authors have read and agreed to the published version of the manuscript.
Funding
This research received no external funding.
Institutional Review Board Statement
Not applicable.
Informed Consent Statement
Not applicable.
Data Availability Statement
The data is available with the first author and can be shared with anyone upon reasonable request.
Conflicts of Interest
The authors declare no conflict of interest.
References
- Garavaglia, A.M. Disaster Preparedness and Recovery: How Arts Organizations Can Help Re-engage the Community through Arts-Driven Initiatives after a Natural or Human-Made Disaster. Master’s Thesis, Drexel University, Philadelphia, PA, USA, 2019. [Google Scholar]
- Munawar, H.S.; Hammad, A.; Ullah, F.; Ali, T.H. After the flood: A novel application of image processing and machine learning for post-flood disaster management. In Proceedings of the 2nd International Conference on Sustainable Development in Civil Engineering (ICSDC 2019), Jamshoro, Pakistan, 5–7 December 2019. [Google Scholar]
- Lenderink, G.; Van Meijgaard, E. Increase in hourly precipitation extremes beyond expectations from temperature changes. Nat. Geosci. 2008, 1, 511–514. [Google Scholar] [CrossRef]
- Ashley, S.T.; Ashley, W.S. Flood fatalities in the United States. J. Appl. Meteorol. Climatol. 2008, 47, 805–818. [Google Scholar] [CrossRef]
- Ptak, M.; Konarzewski, K. Numerical Technologies for Vulnerable Road User Safety Enhancement, in New Contributions in Information Systems and Technologies; Springer: Berlin/Heidelberg, Germany, 2015; pp. 355–364. [Google Scholar]
- Van Ree, C.C.D.F.; Van, M.; Heilemann, K.; Morris, M.W.; Royet, P.; Zevenbergen, C. FloodProBE: Technologies for improved safety of the built environment in relation to flood events. Environ. Sci. Policy 2011, 14, 874–883. [Google Scholar] [CrossRef]
- Arrighi, C.; Pregnolato, M.; Dawson, R.J.; Castelli, F. Preparedness against mobility disruption by floods. Sci. Total Environ. 2019, 654, 1010–1022. [Google Scholar] [CrossRef]
- Guha-Sapir, D.; Below, R.; Hoyois, P. EM-DAT: International Disaster Database; Université Catholique de Louvain: Brussels, Belgium, 2015. [Google Scholar]
- Qayyum, S.; Ullah, F.; Al-Turjman, F.; Mojtahedi, M. Managing smart cities through six sigma DMADICV method: A review-based conceptual framework. Sustain. Cities Soc. 2021, 72, 103022. [Google Scholar] [CrossRef]
- Ullah, F.; Sepasgozar, S.M.; Thaheem, M.J.; Al-Turjman, F. Barriers to the digitalisation and innovation of Australian smart real estate: A managerial perspective on the technology non-adoption. Environ. Technol. Innov. 2021, 22, 101527. [Google Scholar] [CrossRef]
- Ullah, F.; Qayyum, S.; Thaheem, M.J.; Al-Turjman, F.; Sepasgozar, S.M. Risk management in sustainable smart cities governance: A TOE framework. Technol. Forecast. Soc. Chang. 2021, 167, 120743. [Google Scholar] [CrossRef]
- Munawar, H.S.; Qayyum, S.; Ullah, F.; Sepasgozar, S. Big data and its applications in smart real estate and the disaster management life cycle: A systematic analysis. Big Data Cogn. Comput. 2020, 4, 4. [Google Scholar] [CrossRef] [Green Version]
- Ullah, F.; Sepasgozar, S.M.; Wang, C. A systematic review of smart real estate technology: Drivers of, and barriers to, the use of digital disruptive technologies and online platforms. Sustainability 2018, 10, 3142. [Google Scholar] [CrossRef] [Green Version]
- Felli, F.; Liu, C.; Ullah, F.; Sepasgozar, S. Implementation of 360 videos and mobile laser measurement technologies for immersive visualisation of real estate & properties. In Proceedings of the 42nd AUBEA Conference, Singapore, 26–28 September 2018. [Google Scholar]
- Low, S.; Ullah, F.; Shirowzhan, S.; Sepasgozar, S.M.; Lee, C.L. Smart digital marketing capabilities for sustainable property development: A case of Malaysia. Sustainability 2020, 12, 5402. [Google Scholar] [CrossRef]
- Ullah, F.; Sepasgozar, S.M. Key factors influencing purchase or rent decisions in smart real estate investments: A system dynamics approach using online forum thread data. Sustainability 2020, 12, 4382. [Google Scholar] [CrossRef]
- Ullah, F.; Sepasgozar, S.M.; Shirowzhan, S.; Davis, S. Modelling users’ perception of the online real estate platforms in a digitally disruptive environment: An integrated KANO-SISQual approach. Telemat. Inform. 2021, 63, 101660. [Google Scholar] [CrossRef]
- Ullah, F.; Sepasgozar, S.M.; Thaheem, M.J.; Wang, C.C.; Imran, M. It’s all about perceptions: A DEMATEL approach to exploring user perceptions of real estate online platforms. Ain Shams Eng. J. 2021. [Google Scholar] [CrossRef]
- Ward, P.J.; Jongman, B.; Kummu, M.; Dettinger, M.D.; Weiland, F.C.S.; Winsemius, H.C. Strong influence of El Niño Southern Oscillation on flood risk around the world. Proc. Natl. Acad. Sci. USA 2014, 111, 15659–15664. [Google Scholar] [CrossRef] [PubMed] [Green Version]
- Lindenschmidt, K.-E. Quasi-2D approach in modeling the transport of contaminated sediments in floodplains during river flooding—model coupling and uncertainty analysis. Environ. Eng. Sci. 2008, 25, 333–352. [Google Scholar] [CrossRef] [Green Version]
- Atif, S.; Umar, M.; Ullah, F. Investigating the flood damages in Lower Indus Basin since 2000: Spatiotemporal analyses of the major flood events. Nat. Hazards 2021, 108, 2357–2383. [Google Scholar] [CrossRef]
- Munawar, H.S.; Ullah, F.; Khan, S.I.; Qadir, Z.; Qayyum, S. UAV assisted spatiotemporal analysis and management of bushfires: A case study of the 2020 victorian bushfires. Fire 2021, 4, 40. [Google Scholar] [CrossRef]
- Khamespanah, F.; Delavar, M.R.; Moradi, M.; Sheikhian, H. A GIS-based multi-criteria evaluation framework for uncertainty reduction in earthquake disaster management using granular computing. Geod. Cartogr. 2016, 42, 58–68. [Google Scholar] [CrossRef] [Green Version]
- Aslam, B.; Maqsoom, A.; Khalid, N.; Ullah, F.; Sepasgozar, S. Urban overheating assessment through prediction of surface temperatures: A case study of karachi, Pakistan. ISPRS Int. J. Geo-Inf. 2021, 10, 539. [Google Scholar] [CrossRef]
- Sowmya, K.; John, C.; Shrivasthava, N. Urban flood vulnerability zoning of Cochin City, southwest coast of India, using remote sensing and GIS. Nat. Hazards 2015, 75, 1271–1286. [Google Scholar] [CrossRef]
- Liu, C.; Li, Y. GIS-based dynamic modelling and analysis of flash floods considering land-use planning. Int. J. Geogr. Inf. Sci. 2017, 31, 481–498. [Google Scholar] [CrossRef]
- Sam Khaniani, A.; Nikraftar, Z.; Zakeri, S. Evaluation of MODIS Near-IR water vapor product over Iran using ground-based GPS measurements. Atmos. Res. 2020, 231, 104657. [Google Scholar] [CrossRef]
- Akbar, Y.M.; Musafa, A.; Riyanto, I. Image processing-based flood detection for online flood early warning system. In Proceedings of the 6th Indonesian-Japan Joint Scientific Symposium 2014, Yogyakarta, Indonesia, 29–30 October 2014. [Google Scholar]
- Cao, H.; Zhang, H.; Wang, C.; Zhang, B. Operational flood detection using Sentinel-1 SAR data over large areas. Water 2019, 11, 786. [Google Scholar] [CrossRef] [Green Version]
- Al-Wassai, F.A.; Kalyankar, N. Major limitations of satellite images. J. Glob. Res. Comput. Sci. 2013, 4, 51–59. [Google Scholar]
- Hall, A.C.; Schumann, G.J.P.; Bamber, J.L.; Bates, P.D.; Trigg, M.A. Geodetic corrections to Amazon River water level gauges using ICESat altimetry. Water Resour. Res. 2012, 48, W06602. [Google Scholar] [CrossRef] [Green Version]
- Munawar, H.S.; Zhang, J.; Li, H.; Mo, D.; Chang, L. Mining multispectral aerial images for automatic detection of strategic bridge locations for disaster relief missions. In Pacific-Asia Conference on Knowledge Discovery and Data Mining; Springer: Berlin/Heidelberg, Germany, 2019. [Google Scholar]
- Munawar, H.S.; Maqsood, A.; Mustansar, Z. Isotropic surround suppression and Hough transform based target recognition from aerial images. Int. J. Adv. Appl. Sci. 2017, 4, 37–42. [Google Scholar] [CrossRef]
- Anusha, N.; Bharathi, B. Flood detection and flood mapping using multi-temporal synthetic aperture radar and optical data. Egypt. J. Remote Sens. Space Sci. 2020, 23, 207–219. [Google Scholar] [CrossRef]
- Mason, D.C.; Davenport, I.J.; Neal, J.C.; Schumann, G.J.-P.; Bates, P.D. Near real-time flood detection in urban and rural areas using high-resolution synthetic aperture radar images. IEEE Trans. Geosci. Remote Sens. 2012, 50, 3041–3052. [Google Scholar] [CrossRef] [Green Version]
- Reynolds, H.N.; Sheinfeld, G.; Chang, J.; Tabatabai, A.; Simmons, D. The tele-intensive care unit during a disaster: Seamless transition from routine operations to disaster mode. Telemed. E-Health 2011, 17, 746–749. [Google Scholar] [CrossRef] [PubMed] [Green Version]
- Fernández-Hernandez, J.; González-Aguilera, D.; Rodríguez-Gonzálvez, P.; Mancera-Taboada, J. Image-based modelling from unmanned aerial vehicle (UAV) photogrammetry: An effective, low-cost tool for archaeological applications. Archaeometry 2015, 57, 128–145. [Google Scholar] [CrossRef]
- Langhammer, J.; Vacková, T. Detection and mapping of the geomorphic effects of flooding using UAV photogrammetry. Pure Appl. Geophys. 2018, 175, 3223–3245. [Google Scholar] [CrossRef]
- Rahnemoonfar, M.; Murphy, R.; Miquel, M.V.; Dobbs, D.; Adams, A. Flooded area detection from uav images based on densely connected recurrent neural networks. In Proceedings of the IGARSS 2018–2018 IEEE International Geoscience and Remote Sensing Symposium, Valencia, Spain, 22–27 July 2018. [Google Scholar]
- Zakaria, S.; Mahadi, M.R.; Abdullah, A.F.; Abdan, K. Aerial platform reliability for flood monitoring under various weather conditions: A review. In GeoInformation for Disaster Management Conference; Springer: Berlin/Heidelberg, Germany, 2018. [Google Scholar]
- Ullah, F.; Al-Turjman, F.; Qayyum, S.; Inam, H.; Imran, M. Advertising through UAVs: Optimized path system for delivering smart real-estate advertisement materials. Int. J. Intell. Syst. 2021, 36, 3429–3463. [Google Scholar] [CrossRef]
- Abbot, J.; Marohasy, J. Input selection and optimisation for monthly rainfall forecasting in Queensland, Australia, using artificial neural networks. Atmos. Res. 2014, 138, 166–178. [Google Scholar] [CrossRef]
- Sulaiman, J.; Wahab, S.H. Heavy rainfall forecasting model using artificial neural network for flood prone area. In IT Convergence and Security; Springer: Berlin/Heidelberg, Germany, 2017; pp. 68–76. [Google Scholar]
- Chang, L.-C.; Amin, M.Z.M.; Yang, S.-N.; Chang, F.-J. Building ANN-based regional multi-step-ahead flood inundation forecast models. Water 2018, 10, 1283. [Google Scholar] [CrossRef] [Green Version]
- Chang, M.-J.; Chang, H.-K.; Chen, Y.-C.; Lin, G.-F.; Chen, P.-A.; Lai, J.-S.; Tan, Y.-C. A support vector machine forecasting model for typhoon flood inundation mapping and early flood warning systems. Water 2018, 10, 1734. [Google Scholar] [CrossRef] [Green Version]
- Ofli, F.; Meier, P.; Imran, M.; Castillo, C.; Tuia, D.; Rey, N.; Briant, J.; Millet, P.; Reinhard, F.; Parkan, M. Combining human computing and machine learning to make sense of big (aerial) data for disaster response. Big Data 2016, 4, 47–59. [Google Scholar] [CrossRef] [PubMed] [Green Version]
- Ashrafi, M.; Chua, L.H.C.; Quek, C.; Qin, X. A fully-online Neuro-Fuzzy model for flow forecasting in basins with limited data. J. Hydrol. 2017, 545, 424–435. [Google Scholar] [CrossRef]
- Schlaffer, S.; Matgen, P.; Hollaus, M.; Wagner, W. Flood detection from multi-temporal SAR data using harmonic analysis and change detection. Int. J. Appl. Earth Obs. Geoinf. 2015, 38, 15–24. [Google Scholar] [CrossRef]
- Long, S.; Fatoyinbo, T.E.; Policelli, F. Flood extent mapping for Namibia using change detection and thresholding with SAR. Environ. Res. Lett. 2014, 9, 035002. [Google Scholar] [CrossRef]
- D’Addabbo, A.; Refice, A.; Pasquariello, G.; Lovergine, F.P.; Capolongo, D.; Manfreda, S. A Bayesian network for flood detection combining SAR imagery and ancillary data. IEEE Trans. Geosci. Remote Sens. 2016, 54, 3612–3625. [Google Scholar] [CrossRef]
- Widiasari, I.R.; Nugroho, L.E. Deep learning multilayer perceptron (MLP) for flood prediction model using wireless sensor network based hydrology time series data mining. In Proceedings of the 2017 International Conference on Innovative and Creative Information Technology (ICITech), Salatiga, Indonesia, 2–4 November 2017. [Google Scholar]
- Supratid, S.; Aribarg, T.; Supharatid, S. An integration of stationary wavelet transform and nonlinear autoregressive neural network with exogenous input for baseline and future forecasting of reservoir inflow. Water Resour. Manag. 2017, 31, 4023–4043. [Google Scholar] [CrossRef]
- Ullah, F.; Thaheem, M.J.; Siddiqui, S.Q.; Khurshid, M.B. Influence of Six Sigma on project success in construction industry of Pakistan. TQM J. 2017, 29, 1754–2731. [Google Scholar] [CrossRef]
- Sheikh, N.A.; Ullah, F.; Ayub, B.; Thaheem, M.J. Labor productivity assessment using activity analysis on semi high-rise building projects in Pakistan. Eng. J. 2017, 21, 273–286. [Google Scholar] [CrossRef]
- Ayub, B.; Ullah, F.; Rasheed, F.; Sepasgozar, S. Risks in EPC hydropower projects: A case of Pakistan. In Proceedings of the 8th International Civil Engineering Congress (ICEC) Ensuring Technological Advancement through Innovation Based Knowledge Corridor, Karachi, Pakistan, 23–24 December 2016. [Google Scholar]
- Maqsoom, A.; Khan, M.U.; Khan, M.T.; Khan, S.; Ullah, F. Factors influencing the construction time and cost overrun in projects: Empirical evidence from Pakistani construction industry. In Proceedings of the 21st International Symposium on Advancement of Construction Management and Real Estate; Springer: Berlin/Heidelberg, Germany, 2018. [Google Scholar]
- Mehmood, Y.; Zahoor, H.; Ullah, F. Economic-efficiency analysis of rawalpindi bypass project: A case study. In Innovative Production and Construction: Transforming Construction Through Emerging Technologies; World Scientific: Singapore, 2019; pp. 531–555. [Google Scholar]
- Ullah, F.; Thaheem, M.J.; Sepasgozar, S.M.; Forcada, N. System dynamics model to determine concession period of PPP infrastructure projects: Overarching effects of critical success factors. J. Leg. Aff. Disput. Resolut. Eng. Constr. 2018, 10, 04518022. [Google Scholar] [CrossRef]
- Aslam, M. Flood management current state, challenges and prospects in Pakistan: A review. Mehran Univ. Res. J. Eng. Technol. 2018, 37, 297–314. [Google Scholar] [CrossRef] [Green Version]
- Rathor, H.R.; Nadeem, G.; Khan, I.A. Pesticide susceptibility status of Anopheles mosquitoes in four flood-affected districts of South Punjab, Pakistan. Vector-Borne Zoonotic Dis. 2013, 13, 60–66. [Google Scholar] [CrossRef] [PubMed]
- Hussain, A.; Routray, J.K. Status and factors of food security in Pakistan. Int. J. Dev. Issues 2012, 11, 1446–8956. [Google Scholar] [CrossRef]
- The Guardian, Pakistan Floods: At least 90 killed in monsoon rains. The Guardian, 26 August 2020. Available online: https://www.theguardian.com/world/2020/aug/26/pakistan-floods-at-least-90-killed-in-monsoon-rains (accessed on 6 October 2020).
- Khan, R. Flash Floods Triggered by Rain Kill 15 People in NW Pakistan. Washington Post, 2 September 2020. Available online: https://www.washingtonpost.com/world/asia_pacific/flash-floods-triggered-by-rain-kill-15-people-in-nw-pakistan/2020/09/02/7e12ccf0-ed05-11ea-bd08-1b10132b458f_story.html (accessed on 6 October 2020).
- Relief Web. Pakistan: Floods and Landslides—August 2020. Available online: https://reliefweb.int/disaster/fl-2020-000185-pak-0 (accessed on 6 October 2020).
- Bhandare, A.; Bhide, M.; Gokhale, P.; Chandavarkar, R. Applications of convolutional neural networks. Int. J. Comput. Sci. Inf. Technol. 2016, 7, 2206–2215. [Google Scholar]
- Chang, F.-l.; Huang, C.; Liu, C.; Zhao, Y.; Ma, C. Traffic sign detection based on Gaussian color model and SVM. Chin. J. Sci. Instrum. 2014, 35, 43–49. [Google Scholar]
- Zhang, W.; Tang, P.; Zhao, L. Remote sensing image scene classification using CNN-CapsNet. Remote Sens. 2019, 11, 494. [Google Scholar] [CrossRef] [Green Version]
- Ullah, F. A beginner’s guide to developing review-based conceptual frameworks in the built environment. Architecture 2021, 1, 3. [Google Scholar] [CrossRef]
- Qadir, Z.; Ullah, F.; Munawar, H.S.; Al-Turjman, F. Addressing disasters in smart cities through UAVs path planning and 5G communications: A systematic review. Comput. Commun. 2021, 168, 114–135. [Google Scholar] [CrossRef]
- Zeiler, M.D.; Fergus, R. Visualizing and understanding convolutional networks. In European Conference on Computer Vision; Springer: Berlin/Heidelberg, Germany, 2014; pp. 818–833. [Google Scholar]
- Feng, Q.; Liu, J.; Gong, J. Urban flood mapping based on unmanned aerial vehicle remote sensing and random forest classifier—A case of Yuyao, China. Water 2015, 7, 1437–1455. [Google Scholar] [CrossRef]
- Pham, M.-T.; Cham, T.-J. Fast training and selection of haar features using statistics in boosting-based face detection. In Proceedings of the 2007 IEEE 11th International Conference on Computer Vision, Rio de Janeiro, Brazil, 14–21 October 2007. [Google Scholar]
- Chung, B.W.; Park, K.-Y.; Hwang, S.-Y. A fast and efficient haar-like feature selection algorithm for object detection. J. Korean Inst. Commun. Inf. Sci. 2013, 38, 486–491. [Google Scholar]
- Tapia, E. A Note on the Computation of Haar-Based Features for High-Dimensional Images; Freie Universität Berlin, Institut für Informatik: Berlin, Germany, 2009. [Google Scholar]
- Zintgraf, L.M.; Cohen, T.S.; Adel, T.; Welling, M. Visualizing deep neural network decisions: Prediction difference analysis. arXiv 2017, arXiv:1702.04595. [Google Scholar]
- Simonyan, K. and A. Zisserman; Very deep convolutional networks for large-scale image recognition. arXiv 2014, arXiv:1409.1556. [Google Scholar]
- He, K.; Zhang, X.; Ren, S.; Sun, J. Deep residual learning for image recognition. In Proceedings of the IEEE Conference on Computer Vision and Pattern Recognition, Las Vegas, NA, USA, 27–30 June 2016. [Google Scholar]
- Viola, P.; Jones, M. Rapid object detection using a boosted cascade of simple features. In Proceedings of the 2001 IEEE Computer Society Conference on Computer Vision and Pattern Recognition, Kauai, HI, USA, 8–14 December 2001. [Google Scholar]
- Elkhrachy, I. Flash flood hazard mapping using satellite images and GIS tools: A case study of Najran City, Kingdom of Saudi Arabia (KSA). Egypt. J. Remote Sens. Space Sci. 2015, 18, 261–278. [Google Scholar] [CrossRef] [Green Version]
- Tehrany, M.S.; Pradhan, B.; Mansor, S.; Ahmad, N. Flood susceptibility assessment using GIS-based support vector machine model with different kernel types. Catena 2015, 125, 91–101. [Google Scholar] [CrossRef]
- Bui, D.T.; Hoang, N.-D.; Martínez-Álvarez, F.; Ngo, P.-T.T.; Hoa, P.V.; Pham, T.D.; Samui, P.; Costache, R. A novel deep learning neural network approach for predicting flash flood susceptibility: A case study at a high frequency tropical storm area. Sci. Total Environ. 2020, 701, 134413. [Google Scholar]
- Lopez-Fuentes, L.; van de Weijer, J.; Bolanos, M.; Skinnemoen, H. Multi-modal deep learning approach for flood detection. MediaEval 2017, 17, 13–15. [Google Scholar]
Figure 1.
Detailed process of screening for the most relevant papers related to our research questions.
Figure 1.
Detailed process of screening for the most relevant papers related to our research questions.

Figure 2.
(a) Swat District on a map of Pakistan; (b) Swat area; (c) aerial image of a flood-hit area in Swat.
Figure 2.
(a) Swat District on a map of Pakistan; (b) Swat area; (c) aerial image of a flood-hit area in Swat.

Figure 3.
Proposed methodology.

Figure 4.
Flooded regions of Swat Valley. (a) A village (b) A damaged bridge.

Figure 5.
The working of the median filter for noise removal.

Figure 6.
Integral image and Haar-like features.

Figure 7.
(a) Subset of aerial road images used for training (b) Subset of aerial building images used for training (c) Haar Cascade Classifier Results.
Figure 7.
(a) Subset of aerial road images used for training (b) Subset of aerial building images used for training (c) Haar Cascade Classifier Results.

Figure 8.
Proposed architecture diagram of CNN.

Figure 9.
Graph showing classification performance with the number of samples in the training dataset.
Figure 9.
Graph showing classification performance with the number of samples in the training dataset.

Figure 10.
ROC Curve.

Figure 11.
Flood mapping results on input test images.


Table 1.
Frequency of each class in the dataset.
| Class | Frequency (%) |
|---|---|
| Buildings | 30.1 |
| Roads | 42.8 |
| Soil | 11.9 |
| Grass | 10 |
| Water | 5.2 |
| Bridges | 1.1 |
Table 2.
The confusion matrix.
| Predicted Values | Actual Values | |
|---|---|---|
| Positive | Negative | |
| Positive | TP | FP |
| Negative | FN | TN |
Table 3.
Confusion matrix generated for a model trained using an original dataset.
| Predicted Class | ||||
|---|---|---|---|---|
| Flooded | Non-Flooded | Total | ||
| Actual Class | Flooded | 352 | 48 | 400 |
| Non-Flooded | 77 | 323 | 400 | |
Table 4.
Confusion matrix generated for a model trained using an altered dataset.
| Predicted Class | ||||
|---|---|---|---|---|
| Flooded | Non-Flooded | Total | ||
| Actual Class | Flooded | 371 | 19 | 400 |
| Non-Flooded | 33 | 357 | 400 | |
Table 5.
Experimental results.
| No. | Metrics | Altered Dataset (Landmarks + Original Images) | Original Dataset (Without Landmarks) |
|---|---|---|---|
| 1 | Accuracy | 91% | 84.4% |
| 2 | Precision | 0.92 | 0.84 |
| 3 | Recall | 0.95 | 0.90 |
| 4 | F-Score | 0.93 | 0.87 |
Table 6.
Comparison of flood mapping results of the current study with previous research.
| No. | Method | Accuracy Result | Images in Dataset | Location |
|---|---|---|---|---|
| 1 | Deep Learning Neural Network [81] | 92% | 1464 | Lao Cai, Vietnam |
| 2 | Semantic metadata and visual data with Convolutional Neural Network [82] | 83.96% | 6600 | Misc (Flickr images) |
| 3 | Random Forest Classifier [71] | 87.5% | 5000 | Yuyao, China |
| 4 | Analytical Hierarchical Process [79] | 84.4% | 519 | Najran City, Kingdom of Saudi Arabia |
| 5 | Support Vector Machines (SVM) [80] | 84.97% | 1000 | Terengganu, Malaysia |
| 6 | Proposed Model (CNN with landmarks extraction) | 91% | 3000 | Swat, Pakistan |
Publisher’s Note: MDPI stays neutral with regard to jurisdictional claims in published maps and institutional affiliations. |
© 2021 by the authors. Licensee MDPI, Basel, Switzerland. This article is an open access article distributed under the terms and conditions of the Creative Commons Attribution (CC BY) license (https://creativecommons.org/licenses/by/4.0/).
Share and Cite
MDPI and ACS Style
Munawar, H.S.; Ullah, F.; Qayyum, S.; Heravi, A. Application of Deep Learning on UAV-Based Aerial Images for Flood Detection. Smart Cities 2021, 4, 1220-1242. https://0-doi-org.brum.beds.ac.uk/10.3390/smartcities4030065
AMA Style
Munawar HS, Ullah F, Qayyum S, Heravi A. Application of Deep Learning on UAV-Based Aerial Images for Flood Detection. Smart Cities. 2021; 4(3):1220-1242. https://0-doi-org.brum.beds.ac.uk/10.3390/smartcities4030065
Chicago/Turabian StyleMunawar, Hafiz Suliman, Fahim Ullah, Siddra Qayyum, and Amirhossein Heravi. 2021. "Application of Deep Learning on UAV-Based Aerial Images for Flood Detection" Smart Cities 4, no. 3: 1220-1242. https://0-doi-org.brum.beds.ac.uk/10.3390/smartcities4030065