
Identifying and Quantifying Factors Determining Dynamic Vanpooling Use

 ,
, 
Abstract
:1. Introduction
2. Literature Review
3. Methods
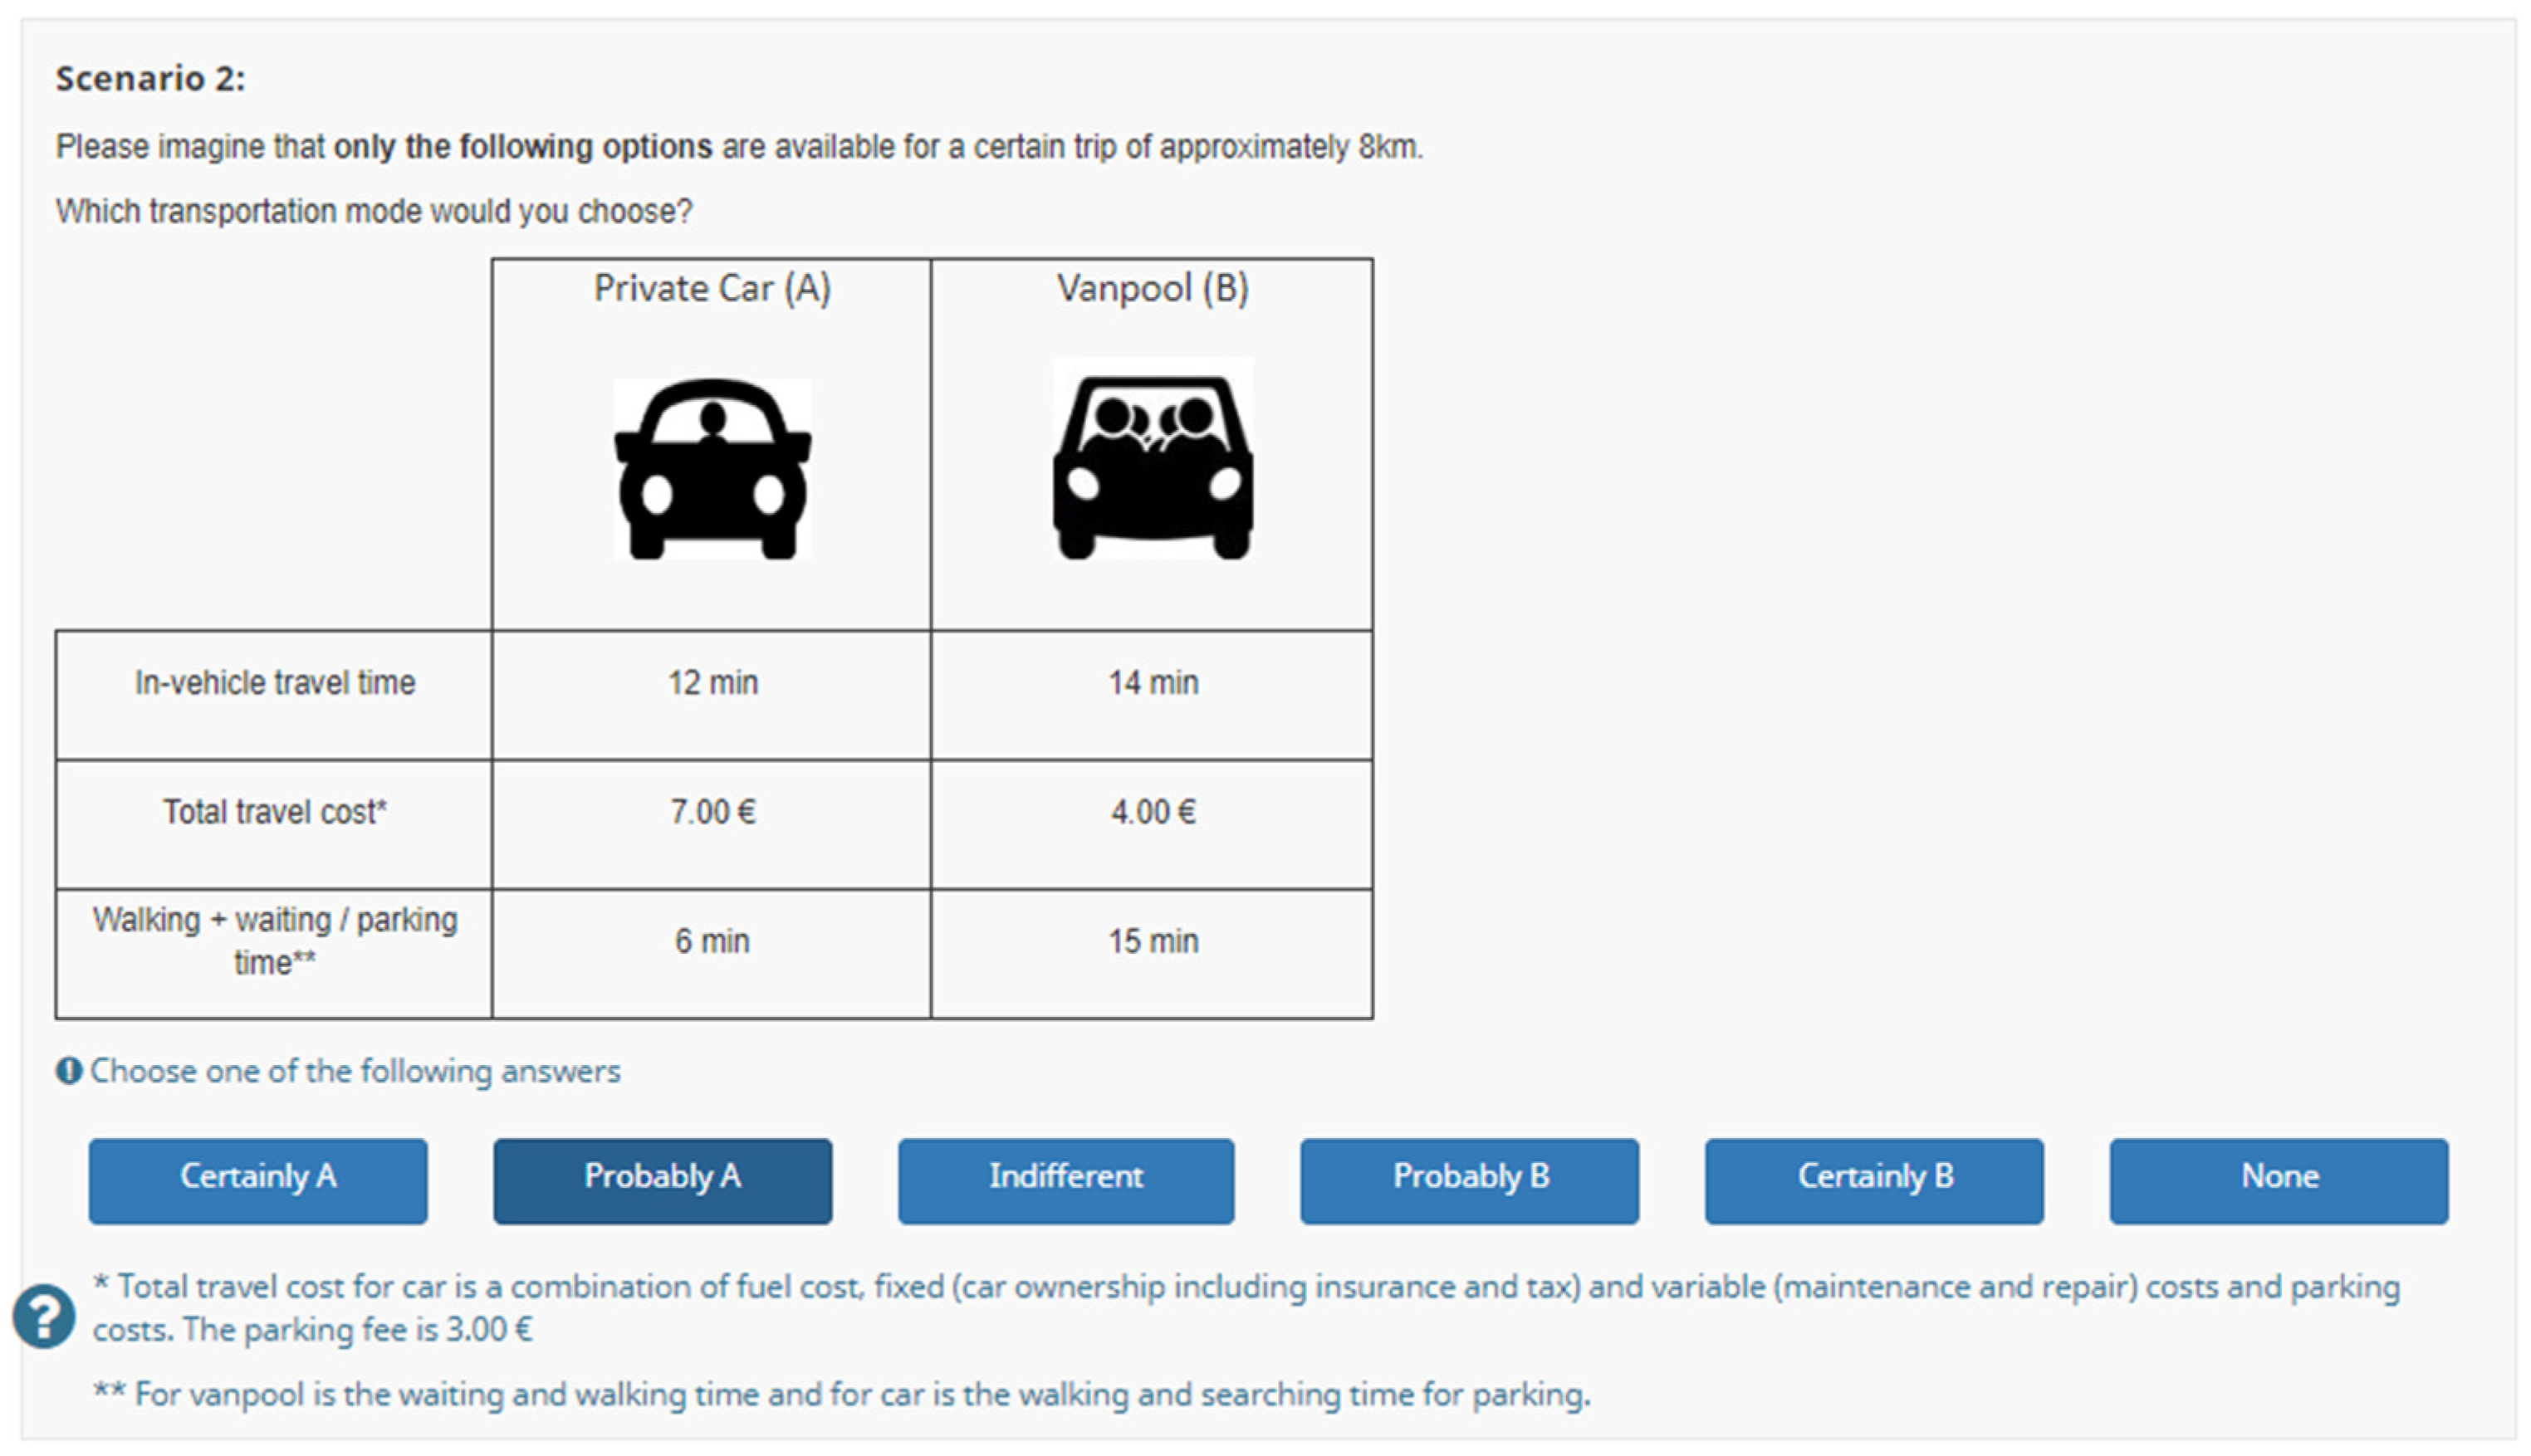
3.1. Survey Design
3.2. Behavioral Model
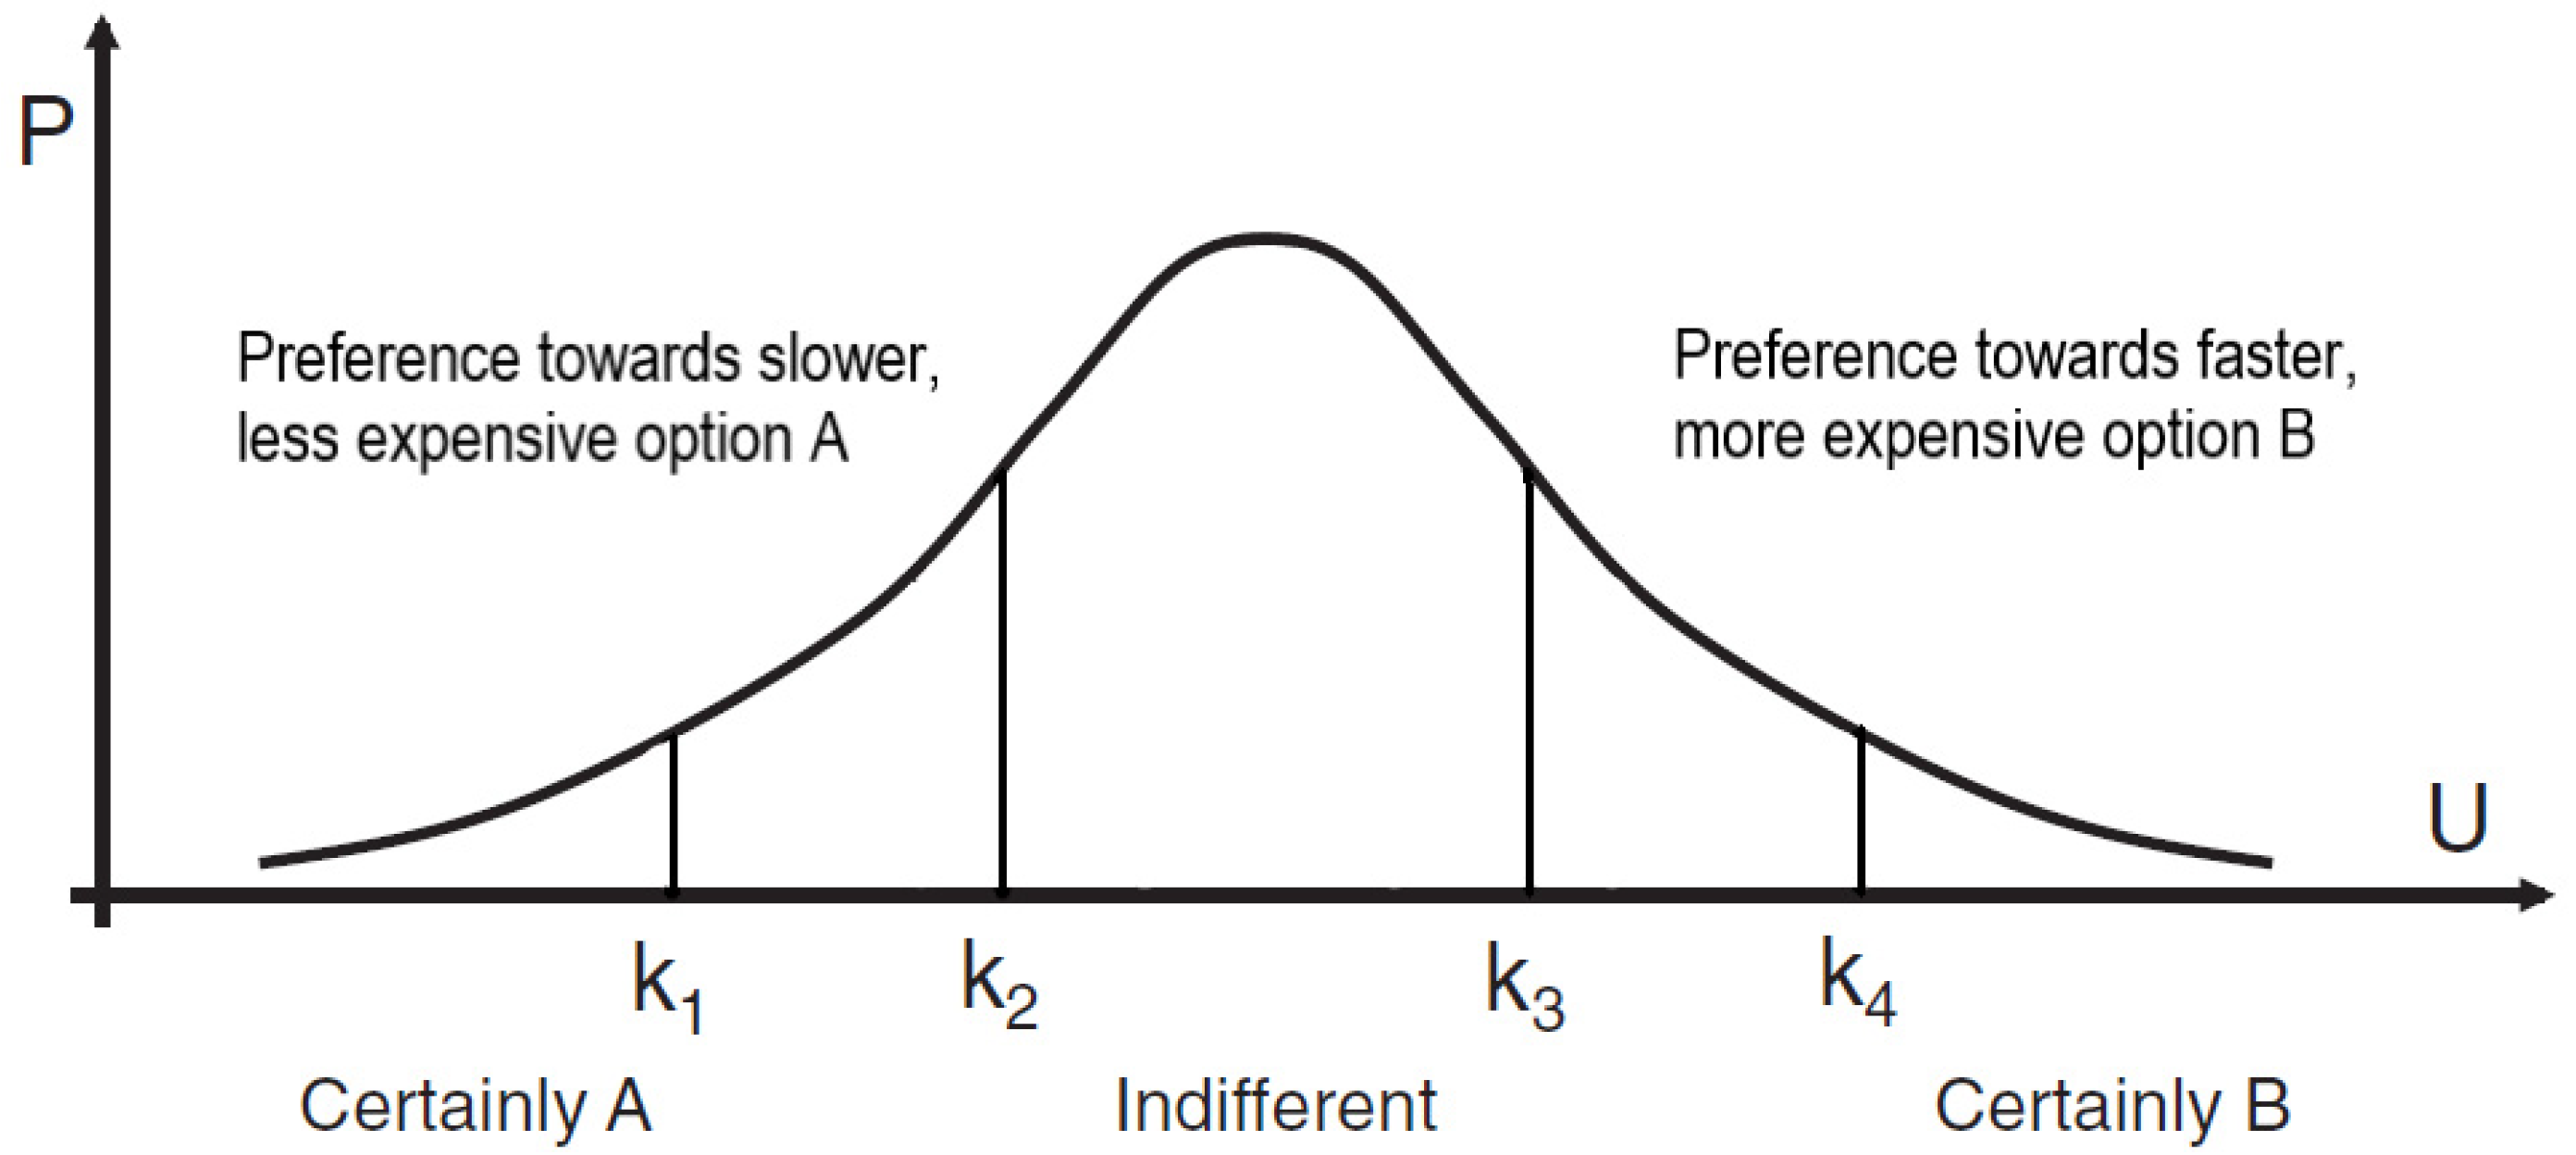
3.2.1. Ordered Probit Model
3.2.2. Multinomial Logit Model (MNL)
- : deterministic or systematic element of alternative i for the individual q;
- : parameters of exploratory variables;
- : independent variable.
3.2.3. Willingness-to-Pay
- : estimated coefficient of travel time;
- : estimated coefficient of travel cost.
4. Model Estimation and Analysis
4.1. Data Collection and Sample Identity
4.2. Model Estimation Results
4.2.1. Ordered Probit Model
4.2.2. Multinomial Logit Model
4.2.3. Value of Time
- : Value of in-vehicle travel time;
- : Value of walking/waiting or parking time;
- : estimated coefficient of in-vehicle travel time;
- : estimated coefficient of travel cost;
- : estimated coefficient of walking/waiting or parking time.
5. Discussion
5.1. Commute Habits
5.2. Environmental Awareness and Affinity to Technology
5.3. Limitations and Future Work
6. Conclusions
Author Contributions
Funding
Institutional Review Board Statement
Informed Consent Statement
Data Availability Statement
Conflicts of Interest
References
- Research Institute for Housing, Urban and Mobility Studies (OTB). Smart Cities Ranking of European Medium-Sized Cities. 2018. Available online: http://www.smart-cities.eu/download/smart_cities_final_report.pdf (accessed on 12 August 2021).
- Zhou, Y.; Huang, Y.; McGlynn, J., III; Han, A. Who Will You Share a Ride with: Factors that Influence Trust of Potential Rideshare Partners. In Proceedings of the 6th International Workshop on Urban Computing UrbComp’17, Halifax, NS, Canada, 14 August 2017. [Google Scholar]
- Schreieck, M.; Wiesche, M.; Krcmar, H. Design and Governance of Platform Ecosystems—Key Concepts and Issues for Future Research. In Proceedings of the 24th European Conference on Information Systems (ECIS), Istanbul, Turkey, 12–15 June 2016. [Google Scholar]
- Narayanan, S.; Chaniotakis, E.; Antoniou, C. Shared Autonomous Vehicle Services: A Comprehensive Review. Transp. Res. Part C Emerg. Technol. 2020, 111, 255–293. [Google Scholar] [CrossRef]
- Kircher, D.; Wapensky, L. Vanpooling: An Overview; Publication EPA-908/1–78-001; US Environmental Protection Agency, Region VIII: Denver, CO, USA, 1978.
- Ditmore, C.; Deming, D.A. Comparative Analysis of Vanpool and Single Occupant Commuters’ Self-reported Stress Level Before and After the Commute. ICoMaaS 2017 Proceedings. pp. 83–135. Available online: https://scholarworks.alaska.edu/handle/11122/6529 (accessed on 12 August 2021).
- Tirachini, A.; Chaniotakis, E.; Abouelela, M.; Antoniou, C. The sustainability of shared mobility: Can a platform for shared rides reduce motorized traffic in cities? Transp. Res. Part C 2020, 117, 102707. [Google Scholar] [CrossRef]
- Currie, G.; Fournier, N. Why most DRT/Micro-Transits fail–What the survivors tell us about progress. Res. Transp. Econ. 2020, 83, 100895. [Google Scholar] [CrossRef]
- Dong, Y.; Wang, S.; Li, L.; Zhang, Z. An empirical study on travel patterns of internet based ride-sharing. Transp. Res. Part C Emerg. Technol. 2018, 86, 1–22. [Google Scholar] [CrossRef]
- Su, S.; Chaniotakis, E.; Narayanan, S.; Jiang, H.; Antoniou, C. Clustered Tabu Search Optimization for Reservation—Based Shared Autonomous Vehicles. Transp. Lett. Int. J. Transp. Res. 2020. [Google Scholar] [CrossRef]
- Li, D.; Antoniou, C.; Jiang, H.; Shen, W.; Zhang, L.; Han, W. How Scheduling Advances Affect Level of Service, Fleeting, and Critical Mass in Smartphone-Based Vanpooling. In Proceedings of the 99th Annual Meeting of the Transportation Research Board, Washington, DC, USA, 9–13 January 2020. [Google Scholar]
- Li, D.; Antoniou, C.; Jiang, H.; Xie, Q.; Shen, W.; Han, W. The value of prepositioning in smartphone-based vanpool services under stochastic requests and time-dependent travel times. Transp. Res. Rec. 2019, 2673, 26–37. [Google Scholar] [CrossRef]
- Bischoff, J.; Maciejewski, M.; Nagel, K. City-wide shared taxis: A simulation study in Berlin. In Proceedings of the 2017 IEEE 20th International Conference on Intelligent Transportation Systems (ITSC), Yokohama, Japan, 16–19 October 2017; pp. 275–280. [Google Scholar]
- Tirachini, A.; Gomez-Lobo, A. Does ride-hailing increase or decrease vehicle kilometers traveled (VKT)? A simulation approach for Santiago de Chile. Int. J. Sustain. Transp. 2020, 14, 187–204. [Google Scholar] [CrossRef]
- Vitetta, A. A quantum utility model for route choice in transport systems. Travel Behav. Soc. 2016, 3, 29–37. [Google Scholar] [CrossRef]
- Hancock, T.O.; Broekaert, J.; Hess, S.; Choudhury, C.F. Quantum probability: A new method for modelling travel behaviour. Transp. Res. Part B Methodol. 2020, 139, 165–198. [Google Scholar] [CrossRef]
- Di Gangi, M.; Vitetta, A. Quantum utility and random utility model for path choice modelling: Specification and aggregate calibration from traffic counts. J. Choice Model. 2021, 40, 100290. [Google Scholar] [CrossRef]
- Frei, C.; Hyland, M.; Mahmassani, H. Flexing service schedules: Assessing the potential for demand-adaptive hybrid transit via a stated preference approach. Transp. Res. Part C Emerg. Technol. 2017, 76, 71–89. [Google Scholar] [CrossRef]
- Alonso-González, M.J.; van Oort, N.; Cats, O.; Hoogendoorn-Lanser, S.; Hoogendoorn, S. Value of time and reliability for urban pooled on-demand services. Transp. Res. Part C Emerg. Technol. 2020, 115, 102621. [Google Scholar] [CrossRef]
- Kang, S.; Mondal, A.; Bhat, A.C.; Bhat, C.R. Pooled Versus Private Ride-Hailing: A Joint Revealed and Stated Preference Analysis Recognizing Psycho-Social Factors; Technical Paper; Department of Civil, Architectural, and Environmental Engineering, The University of Texas at Austin: Austin, TX, USA, 2020; Volume 124, p. 102906. [Google Scholar]
- Sarriera, J.M.; Álvarez, G.E.; Blynn, K.; Alesbury, A.; Scully, T.; Zhao, J. To share or not to share: Investigating the social aspects of dynamic ridesharing. Transp. Res. Rec. 2017, 2605, 109–117. [Google Scholar] [CrossRef] [Green Version]
- Lavieri, P.S.; Bhat, C.R. Modeling individuals’ willingness to share trips with strangers in an autonomous vehicle future. Transp. Res. Part A Policy Pract. 2019, 124, 242–261. [Google Scholar] [CrossRef]
- Alonso-González, M.J.; Cats, O.; van Oort, N.; Hoogendoorn-Lanser, S.; Hoogendoorn, S. What are the determinants of the willingness to share rides in pooled on-demand services? Transportation 2021, 48, 1733–1765. [Google Scholar] [CrossRef]
- Ko, E.; Kim, H.; Lee, J. Survey Data Analysis on Intention to Use Shared Mobility Services. J. Adv. Transp. 2021, 2021, 5585542. [Google Scholar] [CrossRef]
- Atasoy, B.; Glerum, A.; Bierlaire, M. Mode choice with attitudinal latent class: A Swiss case-study. In Proceedings of the Second International Choice Modeling Conference, Leeds, UK, 4–6 July 2006; pp. 1–16. Available online: https://infoscience.epfl.ch/record/167866 (accessed on 12 August 2021).
- Steck, F.; Kolarova, V.; Bahamonde-Birke, F.; Trommer, S.; Lenz, B. How Autonomous Driving May Affect the Value of Travel Time Savings for Commuting. Transp. Res. Rec. J. Transp. Res. Board 2018, 2672, 11–20. [Google Scholar] [CrossRef] [Green Version]
- Kolarova, V.; Steck, F.; Cyganski, R.; Trommer, S. Estimation of the value of time for automated driving using revealed and stated preference methods. Transp. Res. Procedia 2018, 31, 35–46. [Google Scholar] [CrossRef]
- Krueger, R.; Rashidi, H.T.; Rose, M.J. Preferences for shared autonomous vehicles. Transp. Res. Part C Emerg. Technol. 2016, 69, 343–355. [Google Scholar] [CrossRef]
- Gosling, D.S.; Rentfrow, J.P.; Swann, B.W. A very brief measure of the Big-Five personality domains. J. Res. Personal. 2003, 37, 504–528. [Google Scholar] [CrossRef]
- Wheeler, R.E. optFederov. AlgDesign. The R Project for Statistical Computing. 2004. Available online: http://www.r-project.org/ (accessed on 12 August 2021).
- R Core Team. R: A Language and Environment for Statistical Computing; R Foundation for Statistical Computing: Vienna, Austria, 2020; Available online: http://www.R-project.org/ (accessed on 12 August 2021).
- Antoniou, C.; Polydoropoulou, A. The value of privacy. Evidence from the use of mobile devices for traveler information systems. J. Intell. Transp. Syst. Technol. Plan. Oper. 2015, 19, 167–180. [Google Scholar] [CrossRef]
- Antoniou, C.; Matsoukis, E.; Roussi, P. A methodology for the Estimation of Value-of-Time Using State-of-the-Art Econometrics Models. J. Public Transp. 2007, 10, 3. [Google Scholar] [CrossRef] [Green Version]
- Bierlaire, M. PandasBiogeme: A Short Introduction. 2018. Available online: https://transp-or.epfl.ch/documents/technicalReports/Bier18.pdf (accessed on 13 April 2020).
- Bierlaire, M. PandasBiogeme Documentation. 2021. Available online: https://biogeme.epfl.ch/documents.html (accessed on 3 September 2021).
- Kuppam, A.R.; Pendyala, R.M.; Rahman, S. Analysis of the Role of Traveler Attitudes and Perceptions in Explaining Mode-Choice Behavior. Transp. Res. Rec. 1999, 1676, 68–76. [Google Scholar] [CrossRef]
- Train, K.E. Discrete Choice Methods with Simulation; Cambridge University Press: Cambridge, UK, 2003. [Google Scholar]
- Mcfadden, D. Conditional logit analysis of qualitative choice behavior. In Frontiers in Econometrics; Academic Press: Cambridge, MA, USA, 1973; pp. 105–142. ISBN 0-12-776150-0. [Google Scholar]
- Wardman, M.; Chintakayala, V.P.K.; de Jong, G. Values of travel time in Europe: Review and meta-analysis. Transp. Res. Part A Policy Pract. 2016, 94, 93–111. [Google Scholar] [CrossRef]
- Parady, G.; Taniguchi, A.; Takami, K. Travel behavior changes during the COVID-19 pandemic in Japan: Analyzing the effects of risk perception and social influence on going-out self-restriction. Transp. Res. Interdiscip. Perspect. 2020, 7, 100181. [Google Scholar] [CrossRef]
- Shamshiripour, A.; Rahimi, E.; Shabanpour, R.; Mohammadian, A.K. How is COVID-19 reshaping activity-travel behavior? Evidence from a comprehensive survey in Chicago. Transp. Res. Interdiscip. Perspect. 2020, 7, 100216. [Google Scholar] [PubMed]
- Tirachini, A.; Antoniou, C. The economics of automated public transport: Effects on operator cost, travel time, fare and subsidy. Res. Transp. Econ. 2020, 21, 100151. [Google Scholar] [CrossRef]


| Alternative | Attribute | Attribute Levels |
|---|---|---|
| Private car | In vehicle travel time | 12, 20, 28 min |
| Total travel cost | 5.00€, 7.00€, 9.00€ | |
| Walking time and searching time for parking | 2, 6, 10 min | |
| Public Transportation | In-vehicle travel time | 16, 26, 36 min |
| Total travel cost | 1.50€, 2.20€, 2.90€ | |
| Walking and waiting time | 7, 12, 17 min | |
| Dynamic Vanpool | In-vehicle travel time | 14, 24, 34 min |
| Total travel cost | 4.00€, 6.00€, 8.00€ | |
| Walking and waiting time | 5, 10, 15 min |
| Characteristic | Attribute | Percentage (%) |
|---|---|---|
| Gender | Male | 48.7% |
| Female | 49.3% | |
| Prefer not to answer | 1.0% | |
| Age | 18–25 | 16.6% |
| 26–35 | 48.8% | |
| 36–45 | 20.5% | |
| 46–55 | 8.8% | |
| 55–65 | 3.9% | |
| >65 | 0.5% | |
| Prefer not to answer | 1.0% | |
| Education level | High school | 5.9% |
| Vocational school | 6.8% | |
| Bachelor | 30.2% | |
| Master | 44.9% | |
| Doctorate | 11.2% | |
| Prefer not to answer | 0.9% | |
| Main occupation | Full-time employed | 61.0% |
| Part-time employed | 8.3% | |
| Student | 26.3% | |
| Currently unemployed | 2.9% | |
| Housewife or houseman | 1.5% | |
| Household size | 1 | 29.8% |
| 2 | 35.1% | |
| 3 | 20.0% | |
| 4+ | 15.1% | |
| Driver’s license | Yes | 81.2% |
| No | 18.8% | |
| Car availability | 0 | 38.2% |
| 1 | 30.0% | |
| 2 | 28.0% | |
| 3+ | 3.9% | |
| Income | Up to 500€ | 3.9% |
| 500–1000€ | 12.7% | |
| 1000–2000€ | 21.0% | |
| 2000–3000€ | 13.7% | |
| 3000–4000€ | 9.3% | |
| 4000–5000€ | 10.2% | |
| 5000–6000€ | 6.8% | |
| 6000–7000€ | 4.9% | |
| 7000–8000€ | 3.4% | |
| 8000–9000€ | 0.5% | |
| More than 9000€ | 3.4% | |
| Prefer not to answer | 10.2% | |
| Main commute mode | Car as a driver | 34.1% |
| Car as a passenger | 3.4% | |
| Public transportation | 48.8% | |
| Bicycle | 9.8% | |
| Walk | 2.0% | |
| Other | 1.5% | |
| Commuting time | Up to 30 min | 22.2% |
| 30 min to less than 60 min | 44.0% | |
| 60 min to less than 90 min | 22.2% | |
| More than 90 min | 11.6% |
| Variables | Coeff. Estimate | Robust Asympt. Std. Error | Robust t-Stat | Robust p-Value |
|---|---|---|---|---|
| In-vehicle travel time | −0.0673 | 0.00575 | −11.7 | 0.00 |
| Total travel cost | −0.335 | 0.0228 | −14.7 | 0.00 |
| Waiting/Walking time | −0.0448 | 0.00607 | −7.38 | 0.00 |
| PT | 0.189 | 0.0563 | 3.36 | 0.00 |
| Age: 18–25 | −0.195 | 0.082 | −2.36 | 0.00 |
| Age: 46–65 | −0.255 | 0.0935 | −2.73 | 0.01 |
| Car as commute mode | 0.211 | 0.0684 | 3.08 | 0.01 |
| 60 < Commuting time < 90 | 0.246 | 0.0632 | 3.89 | 0.00 |
| Employee | −0.437 | 0.116 | −3.76 | 0.00 |
| Income < 3000€ | −0.11 | 0.057 | −1.90 | 0.03 |
| Student | −0.562 | 0.12 | −4.63 | 0.00 |
| Household size: 2 | −0.127 | 0.0594 | −2.15 | 0.01 |
| Household size > 4 | −0.272 | 0.0835 | −3.56 | 0.02 |
| Commute satisfaction | −0.083 | 0.0311 | −2.68 | 0.01 |
| Number of cars in household: 3 | 0.558 | 0.1425 | 3.92 | 0.00 |
| Driving License | 0.461 | 0.0784 | 5.88 | 0.00 |
| Carsharing membership | 0.183 | 0.070 | 2.63 | 0.02 |
| Bike-sharing membership | −0.265 | 0.0775 | −3.41 | 0.00 |
| Real-time information services | 0.0652 | 0.0222 | 2.94 | 0.00 |
| Affinity to technology | 0.0686 | 0.0355 | 1.93 | 0.03 |
| Social media | −0.048 | 0.0234 | −2.05 | 0.04 |
| Extraverted, enthusiastic | 0.065 | 0.0314 | 2.07 | 0.04 |
| Sympathetic, warm | −0.110 | 0.0358 | −3.07 | 0.00 |
| Threshold parameters for index model | ||||
| k1 | −1.775 | 0.272 | −6.56 | 0.00 |
| k2 | −0.821 | 0.2688 | −3.05 | 0.00 |
| k3 | −0.659 | 0.2687 | −2.45 | 0.00 |
| k4 | 0.224 | 0.2687 | 0.83 | 0.00 |
| Summary statistics | ||||
| Number of observations: 1845 | ||||
| Number of estimated parameters: 27 | ||||
| Initial log-likelihood: −2780.77 | ||||
| Final Log-likelihood: −2507.13 | ||||
| Likelihood ratio test: 547.30 | ||||
| Rho-square for the final model: 0.10 | ||||
| Variables | Coeff. Estimate | Robust Asympt. Std. Error | Robust t-Stat | Robust p-Value |
|---|---|---|---|---|
| In-vehicle travel time (Car) | −0.137 | 0.0258 | −5.20 | 0.00 |
| Total travel cost (Car) | −0.445 | 0.112 | −4.14 | 0.00 |
| Walking/Parking time (Car) | −0.0938 | 0.0352 | −2.65 | 0.01 |
| In-vehicle travel time (Dynamic vanpool) | −0.147 | 0.0203 | −7.33 | 0.00 |
| Total travel cost (Dynamic vanpool) | −0.722 | 0.0769 | −9.15 | 0.00 |
| Waiting/Walking time (Dynamic vanpool) | −0.0755 | 0.0253 | −3.03 | 0.00 |
| In-vehicle travel time (PT) | −0.104 | 0.0206 | −4.79 | 0.00 |
| Total travel cost (PT) | −0.811 | 0.193 | −4.00 | 0.00 |
| Waiting/Walking time (PT) | −0.133 | 0.0316 | −3.96 | 0.00 |
| Age: 26–45 (PT) | −0.616 | 0.26 | −2.42 | 0.02 |
| Age: 56–65 (Car) | −1.25 | 0.524 | −2.73 | 0.01 |
| Monthly income > 7000€ (PT) | −0.946 | 0.447 | −2.10 | 0.04 |
| Bachelor’s or Master’s degree (PT) | 0.571 | 0.241 | 2.36 | 0.02 |
| Student (PT) | 0.582 | 0.294 | 2.00 | 0.05 |
| PT as commute mode (PT) | 1.31 | 0.312 | 4.05 | 0.00 |
| Bike as commute mode (Car) | −0.817 | 0.409 | −2.04 | 0.04 |
| 30 < Commuting time < 60 (Car) | −0.591 | 0.217 | −2.75 | 0.01 |
| 30 < Commuting time < 60 (PT) | −0.816 | 0.249 | −3.33 | 0.00 |
| 60 < Commuting time < 90 (PT) | −0.946 | 0.289 | −3.39 | 0.00 |
| Commuting time > 90 (Car) | −0.656 | 0.333 | −1.88 | 0.06 |
| Driving license (Car) | 0.968 | 0.274 | 3.55 | 0.00 |
| Driving license (PT) | −1.42 | 0.364 | −3.82 | 0.00 |
| Available cars in household: 3 (PT) | −1.45 | 0.615 | −2.18 | 0.03 |
| Carsharing membership (PT) | −0.546 | 0.267 | −1.99 | 0.05 |
| Bike-sharing membership (Car) | −0.73 | 0.314 | −2.14 | 0.03 |
| Bike-sharing membership (PT) | 0.797 | 0.343 | 2.13 | 0.03 |
| PT seasonal ticket (Car) | −0.578 | 0.234 | −2.54 | 0.01 |
| PT seasonal ticket (PT) | −0.946 | 0.313 | −2.94 | 0.00 |
| Carsharing familiarity (Car) | −0.186 | 0.0939 | −2.07 | 0.04 |
| Uber familiarity (Car) | 0.191 | 0.0942 | 2.05 | 0.04 |
| Real-time information services (Car) | 0.204 | 0.0857 | 2.48 | 0.01 |
| Environmental awareness (Car) | −0.302 | 0.117 | −2.56 | 0.01 |
| Anxious, easily upset (PT) | −0.316 | 0.102 | −3.14 | 0.00 |
| Disorganized, careless (PT) | 0.233 | 0.124 | 2.02 | 0.04 |
| Conventional, uncreative (PT) | 0.279 | 0.11 | 2.78 | 0.01 |
| Sympathetic, warm (Car) | −0.298 | 0.12 | −2.61 | 0.01 |
| Sympathetic, warm (PT) | 0.273 | 0.131 | 2.31 | 0.02 |
| Summary statistics | ||||
| Number of observations: 1182 | Number of estimated parameters: 37 | |||
| Initial log-likelihood: −819.30 | Final Log-likelihood: −600.11 | |||
| Likelihood ratio test: 438.38 | ||||
| Rho-square for the final model: 0.268 | Rho-square-bar for the final model: 0.222 | |||
| OP Model | MNL Model | |
|---|---|---|
| Generalized VOTiv | 12.05 €/h | - |
| Generalized VOTw/pt | 8.02 €/h | - |
| VOTiv (Car) | - | 18.47 €/h |
| VOTw/pt (Car) | - | 12.65 €/h |
| VOTiv(Vanpool) | - | 12.22 €/h |
| VOTw/pt (Vanpool) | - | 6.27 €/h |
| VOTiv (PT) | - | 7.69 €/h |
| VOTw/pt (PT) | - | 9.84 €/h |
Publisher’s Note: MDPI stays neutral with regard to jurisdictional claims in published maps and institutional affiliations. |
© 2021 by the authors. Licensee MDPI, Basel, Switzerland. This article is an open access article distributed under the terms and conditions of the Creative Commons Attribution (CC BY) license (https://creativecommons.org/licenses/by/4.0/).
Share and Cite
Tsiamasiotis, K.; Chaniotakis, E.; Qurashi, M.; Jiang, H.; Antoniou, C. Identifying and Quantifying Factors Determining Dynamic Vanpooling Use. Smart Cities 2021, 4, 1243-1258. https://0-doi-org.brum.beds.ac.uk/10.3390/smartcities4040066
Tsiamasiotis K, Chaniotakis E, Qurashi M, Jiang H, Antoniou C. Identifying and Quantifying Factors Determining Dynamic Vanpooling Use. Smart Cities. 2021; 4(4):1243-1258. https://0-doi-org.brum.beds.ac.uk/10.3390/smartcities4040066
Chicago/Turabian StyleTsiamasiotis, Konstantinos, Emmanouil Chaniotakis, Moeid Qurashi, Hai Jiang, and Constantinos Antoniou. 2021. "Identifying and Quantifying Factors Determining Dynamic Vanpooling Use" Smart Cities 4, no. 4: 1243-1258. https://0-doi-org.brum.beds.ac.uk/10.3390/smartcities4040066