
An Anthropocentric and Enhanced Predictive Approach to Smart City Management


1
CIICESI, Escola Superior de Tecnologia e Gestão, Instituto Politécnico do Porto, 4610-156 Felgueiras, Portugal
2
Instituto Superior de Engenharia do Porto (ISEP), Instituto Politécnico do Porto, 4249-015 Porto, Portugal
3
ADiT-LAB, Instituto Politécnico de Viana do Castelo, 4900-347 Viana do Castelo, Portugal
*
Author to whom correspondence should be addressed.
†
These authors contributed equally to this work.
Smart Cities 2021, 4(4), 1366-1390; https://0-doi-org.brum.beds.ac.uk/10.3390/smartcities4040072
Submission received: 5 August 2021
/
Revised: 14 October 2021
/
Accepted: 15 October 2021
/
Published: 21 October 2021
Abstract
:Cities are becoming increasingly complex to manage, as they increase in size and must provide higher living standards for their populations. New technology-based solutions must be developed towards attending this growth and ensuring that it is socially sustainable. This paper puts forward the notion that these solutions must share some properties: they should be anthropocentric, holistic, horizontal, multi-dimensional, multi-modal, and predictive. We propose an architecture in which streaming data sources that characterize the city context are used to feed a real-time graph of the city’s assets and states, as well as to train predictive models that hint into near future states of the city. This allows human decision-makers and automated services to take decisions, both for the present and for the future. To achieve this, multiple data sources about a city were gradually connected to a message broker, that enables increasingly rich decision-support. Results show that it is possible to predict future states of a city, in aspects such as traffic, air pollution, and other ambient variables. The key innovative aspect of this work is that, as opposed to the majority of existing approaches which focus on a real-time view of the city, we also provide insights into the near-future state of the city, thus allowing city services to plan ahead and adapt accordingly. The main goal is to optimize decision-making by anticipating future states of the city and make decisions accordingly.
1. Introduction
Over the course of the 20th century, the population living in cities has increased from 220 million to nearly 2.8 billion, and according to the available forecasts, that figure will increase to nearly 6.9 billion in 2050, which will be close to almost 70% of the world’s population [1,2].
The social and technological challenges that this entails led to the emergence of the so-called Smart Cities (SC). This development was possible due to technological advances in fundamental areas within the hardware, software and communication technologies, areas that provide continuous observations, and accurate data measurements from the physical world. Among the most significant enablers was the growth of Internet-connected devices in use: in 2020, these devices amounted to around 23 billion, and this figure is expected to increase to 75 billion by 2025 [3].
Aside from the technological enablers, the emergence of Smart Cities was also motivated by the search for a solution to the problems associated with the exponential growth of urbanization [4]. Due to their potential implications in urban planning and design, sustainability, social digitalization, and cities’ smart governance embedding practices [5,6], Smart Cities have been attracting an unprecedented amount of attention among different stakeholders, especially those within academia, industry, and public policy making.
Smart Cities will employ information and communication technologies (ICT) to efficiently manage the growing level of urbanization, and the amount of energy consumed, improving the citizens’ economic standard, as well as raising people’s awareness and capabilities to efficiently use and embed information and communication technologies [7]. This will allow us to address many of the issues that current inhabitants face in their day-to-day living, which are significant challenges for city managers. Addressing these issues will contribute towards the improvement of citizens’ quality of life, enhancing overall wealth creation.
Among the myriad of challenges that current cities are facing, some can be pointed out as the most significant ones, due to their economic, environmental or social impacts. One of the most relevant nowadays, due to its impact at several levels, is that of mobility. In this regard, Smart Cities will favor the adjustment to proper mobility solutions, which could improve traffic management, reducing its environmental impacts, and enhancing the amount of interaction with the official authorities in charge [7,8], guiding the creation of sustainable and safer traffic systems through the use of Big Data [9].
This will definitely help optimize the design and management of transport services in a future automated city [10], which will play an important role in the adoption of modern intelligent transportation systems (ITS), as well as in solving problems such as congestion control and peak load reduction [9]. It will also facilitate the construction of an eco-friendly environment by optimizing the vehicles’ route planning [8,11], and thus the smart parking approaches that could alleviate the deadlocks in parking problems [7]. This will contribute to create cities with low to zero carbon emissions, through the adoption and development of sustainable practices [1], and by ensuring the alignment of Smart Cities with the UN sustainable development goals [8].
Another major problem in nowadays’ cities is that of air pollution. Several approaches have been presented in recent years for pollution monitoring or prediction. In [12], the authors propose AirSense: a crowd-sensing based air quality monitoring system aimed at collecting and aggregating sensor data to monitor air pollution. Specifically, the authors use low power and low cost air monitoring devices, in conjunction with smart devices, to collect data from crowds collaboratively. Other authors focus on predicting particulate matter using urban big data, with the goal of minimizing the need for specific and costly monitoring infrastructure [13]. For this purpose, the authors integrate heterogeneous multiple sources of urban data and predict the particulate matter based on transfer learning, using neural networks and regression models.
Many other issues and challenges could be pointed out. However, some aspects can be summarized from the existing literature, as further detailed in Section 2: (1) they are descriptive rather than predictive (they are useful for assessing the current state of the city only); (2) they tend to focus on a single problem; and (3) they are often developed by prioritizing technical or cost-related requirements rather than anthropocentric ones.
The main goal of this work is to address these shortcomings by proposing a holistic and anthropocentric approach to the development of Smart Cities, in which predictive capabilities are present from the start and support context-aware and intelligent services. Indeed, the best practices within the context of a Smart City usually highlight an anthropocentric approach for the development of a truly smart and sustainable city [14]. Therefore, the Smart City’s roadmap should include and develop the adoption of green approaches which could support urban development, establishing the proper conditions to ensure the attainment of a sustainable future [15].
This paper proposes a system developed in accordance with these principles. It considers data from different sources, including sensor streaming data (e.g., public lighting system, environmental sensors, parking availability) and batch data (e.g., map information), and stores them in a way that facilitates the creation of services for managing the city and the life of its citizens. The main goal is not only for city managers to have access to live data, but also to take decisions using predictive services, so that they can plan ahead and make the best possible decisions.
We also adopt a connected approach, in which each infrastructure, equipment or source of data in the city is not only geo-referenced, but also stored in a way that preserves the physical relationships between them. To achieve this, we store every element and the associated data in a graph that represents the city. Queries related to the data can be done not only for a specific element, but also for a certain area. Moreover, it is possible to query the infrastructure of the city regarding its structure or relationships. For instance, we know not only the location of a certain luminary, but also the elements that it connects to (e.g., a specific part of a road or a parking lot). Finally, the last innovative element of this work is to create future instances of this graph, which represents future states of the city, populated by predictive models. This allows for city planners and services to have a forecast of the near future of the state of the city, and decide accordingly.
The expected results are twofold. From and engineering and software development perspective, we hope to validate this approach, and to be able to integrate multiple sources of real-time data into a single system, allowing a holistic view of the state of the city. From a research perspective, we hope to develop predictive models that can effectively provide human decision-makers and autonomous services with accurate data regarding the future state of the city, so that the effectiveness of higher-tier services in city management can be improved. Specifically, in this paper, we describe and validate some services that were already implemented, such as routing traffic based on the future state of parking lots, congestion, or air or noise pollution. Other services can however be developed that build on the fundamental functionalities described here.
The paper is organized as follows. Section 2 defines the problem and scope of this work, and makes a review of the literature of some of the main topics addressed. Section 3 describes the architecture that is proposed to address the problem, with a focus on how data are used to predict future states of the city and how these states can be used by the implemented services. This section also details the methodology followed in the development of the work. Section 4 describes some of the services already developed, from a functional standpoint. The next Section describes the methodology followed for validating each of these services and the results obtained. The paper ends with Section 6 and Section 7, which present, respectively, a critical analysis of the results in the former, and the conclusions drawn from the implementation of this system, the limitations and the future work in the latter.
2. Literature Review
As addressed in Section 1, population growth is responsible, to some extent, for limiting the current way of life within urban metropolises. Therefore, cities are being challenged towards properly handling the negative externalities felt mainly on areas such as environment performance (air quality), traffic management (people commuting; urban logistics; traffic hazards, road surface irregularities as well as their impact on vehicle motion; and road accidents), noise production, energy consumption, or waste and recycling management [2,16,17]. It is also critical to ensure an efficient and sustainable use of the limited resources and services available, regarding key areas, such as access to healthcare, education, culture/leisure activities, public services and transportation [6,18].
Nowadays, it is clear that this kind of challenges can only be addressed through the use of massive amounts of data, exploited through technologies or approaches such as machine learning [7,19,20], the Internet of Things [21,22,23], decision support systems [24,25], expert systems [26], and cybersecurity [27], among others. These technologies are used, precisely, because the human decision maker is no longer able to efficiently manage all the existing information and constraints. This is a relatively new reality that calls for new solutions [28].
From our experience, these challenges can no longer be seen as isolated, in the sense that many of them are interconnected and affect each other. For the same reason, solutions to deal with them should also not be vertical or isolated, but rather horizontal. That is, solutions should take into consideration inputs from multiple sources (be they multi-dimensional or multi-modal), and adopt a holistic and integrated view, that has the principal goal of addressing these challenges, while always placing the citizens at the center.
There are thus many challenges when dealing with evolving complex systems such as Smart Cities. The most promising solutions rely on technological approaches for acquiring and processing huge volumes of data to ensure that ML algorithms can evolve towards achieving better results, and therefore support decision-making into dealing properly with complex challenges felt and ensuring the adoption of smart and sustainable decisions.
This requires an effective integration of data sources, despite their differences, as well as an integration of the services that use these data, so that they can be used in a seamless and transparent way, maximizing the potential benefits gained from data analytics. An architecture that addresses these issues is described in detail in Section 3.
This analysis of the literature also points out that the concept of Smart Cities, and other related ones, are often challenging to define or delimit [29]. In our opinion, this difficulty stems from the fact that Smart Cities emerged from the intersection of a multitude of fuzzy concepts, such as intelligence, smart, IoT, or any other concept referring to the use of ICT and AI for the management of a city. Moreover, different authors use different scales when defining a Smart City, ranging from the more holistic views, in which all the systems of the city are viewed and treated as a single large structure [30], to those that divide a Smart City into smaller dimensions or layers, and tackle the development of each one individually to make it simpler [31].
In [32], for instance, the authors propose an integrative framework that is constituted by eight critical factors in the development of Smart Cities: management and organization, technology, governance, policy context, people and communities, economy, built infrastructure, and natural environment. Other authors look at the goals or challenges that must be solved by a Smart City, namely [33]: developing a new understanding of urban problems; effective and feasible ways to coordinate urban technologies; models and methods for using urban data across spatial and temporal scales; developing new technologies for communication and dissemination; developing new forms of urban governance and organisation; defining critical problems relating to cities, transport, and energy; and identifying risk, uncertainty, and hazards in the Smart City. Local governments and other stakeholders can thus look at this kind of archetypes to properly frame their Smart Cities development initiatives.
Evidently, there are tradeoffs between holistic and stratified approaches. Namely, a stratified approach will be, in principle, easier to develop as large challenges are broken down into smaller ones, and originate smaller and simpler building blocks for a Smart City. However, there’s also an increased effort for the integration and compatibility of all these blocks at several levels (e.g., data collection, service interoperability). Some authors have proposed frameworks or approaches to facilitate the integration of these building blocks into larger functional units. For instance, in [34], the authors propose UIOT-FMT: A Universal Format for Collection and Aggregation of Data from Smart Devices. The main goal is to unify the processes that use data from Smart City sensors, allowing one to create a universal format for use in carrying out public services, such as emergency response by the police and regular law maintenance.
From the existing literature, it can thus be concluded that there is a multitude of different views on what a Smart City is and how it should be developed. The work proposed in this paper is in line with the view of [30], in the sense that we also believe that only a holistic view on a Smart City can lead to a full and seamless integration of all its components. Moreover, we believe that this integration must start at the data level, treating data in a transparent and universal manner independently of its provenance, scope, or goal. The architecture proposed in this paper precisely reflects this view.
However, we would like to go beyond the literature in two specific points. First, Smart Cities must be thought up and designed with humans in mind. That is, they must be human-centered, and not technology-centered. In other words, one should not seek to develop solutions based on how easy or cheap they are to implement, in terms of technology, but rather on how they will contribute to the well-being, safety, equality and quality of life of the inhabitants of the city. The second relevant aspect of this work is the predictive aspect. We argue that Smart Cities’ services should be designed with predictive capabilities in mind, and not only with the purpose of providing access to data in real-time.
Indeed, the behavior of cities, which emerges from the combination of it’s citizens’ behaviors, can often be seen as a complex system, with some degree of periodicity. For instance, traffic flow in a given street has a more or less predictable behavior during one day, week, or year, since it mostly varies in similar ways in these time periods.
In that sense, it is possible to predict it in order to anticipate better decisions. For instance, a citizen traveling from point A to point B in a city may get different paths at different times of the day, depending on the state of the traffic. Generally, routing is always done based on the current state of traffic in the city. Predictive capabilities will allow citizens to plan a trip beforehand, with the system providing the best path according to the predicted traffic in that specific time frame.
Thus, the approach proposed in this paper relies on some key ideas:
- Integration of multiple data sources, so that the Smart City management can be seen in an holistic way, and data-based services can be easily integrated to build higher-value ones;
- Augmented predictive capabilities to foresee the state of the city in the future and ensure the ability to plan ahead, even to develop services that use these predictions;
- Citizen-centric services, that will place the quality of life and well-being of citizens at the focus of Smart City management.
3. Overview of the Proposed Architecture
In Section 2, we stated our view on the scope and challenges of Smart Cities management adopted in this paper. Namely, we propose a system that integrates multiple sources of data seamlessly, and that will provide predictive core services for Smart City management. These services should also be easy to integrate in order to facilitate the development of higher-level ones through composition.
In this Section, we describe the system proposed to achieve this goal (Figure 1). Its architecture considers, as main data sources, the city-wide IoT infrastructure, and map information. The IoT infrastructure provides streaming data about the city state. It may include many different dimensions of the city management, including energy, public lighting, mobility, parking lot occupation, or air pollution. Map information describes the city’s assets in a geo-referenced way, including streets, intersections, public lighting luminaries, meteorological or air quality stations, among others.
Streaming data are used in two different ways. On the one hand, they are used to update the graph of the city, as described below, in order to provide a real-time queryable unified data source. On the other hand, data are also stored in a relational database, as historic data. This generates growing datasets, which are used to train machine learning models, or to conduct traditional data analysis tasks, such as exploratory analyses or reporting. Currently, machine learning models in the pool answer problems, such as predicting air pollution in given parts of the city, predicting air luminosity (which is used to automatically dim public lighting luminaries), predict energy consumption, or predict parking lot occupancy.
A more detailed view of the streaming component of this architecture is given in Figure 2. Here, two different types of streaming data sources are considered: public lighting luminaries and weather stations. The luminaries used are in the Arquiled’s Arquicity R1 Efficiency model, which provides data at 5-min intervals regarding the luminary operation, including temperature, energy consumption, dimming, etc. The weather station produces data at 1-min intervals about ambient light, temperature, rain, wind speed and direction, among others.
In this case, these devices act as data producers. Data are sent to a Kafka broker, which is responsible for storing it in the form of streams of data, organized into topics. Each topic represents a different quantity being measured in a specific device, making it possible for consumers to choose specifically which data sources to use. As data are received in real-time, they are used to update the graph with the current state of the city as well as stored for historic purposes. The graph is updated according to the location of the luminaries and weather stations. Additionally, the data are also made available for external applications, which must only register as consumers in the Kafka cluster, to access all the data produced in real-time. Additional information about the implementation of this system is given in [35], in which a group of more than 300 luminaries and a weather station is used to collect data about the state of the public lighting system and of the environment, and to automatically manage the lighting settings to minimize consumption.
Map data, on the other hand, can be seen as static, in the sense that they rarely change. These data are stored in a graph database. Graph databases have been a great alternative to relational databases, especially when dealing with complex interconnected datasets. Graph databases offer high scalability, performance and flexibility [36]. In the case of this work, a Neo4j (https://neo4j.com/, accessed on 20 October 2021) database is used. In this database, data are stored in the form of nodes and relationships. Each node represents an entity and each relationship represents how two nodes are related. Neo4j also provides a web-interface and the Cypher query language to conduct database operations against the data model.
Thus, nodes store city assets, such as sensors, routes, intersections, public lighting luminaries, among others. Nodes ideally have an associated geographical location. Relationships represent connections between these assets. In the case of routes or intersections, a relationship means that it is possible to travel by road from one point to the other. In the case of luminaries, a relationship means that they are connected to each other on the street. Other examples include an interconnection between a parking lot and one or more routes or intersections, which represent the entrances and/or exists to/from the parking lot. This allows the system to answer queries, such as “what is the shortest path from point A to parking lot B”.
Both nodes and relationships have properties. Node properties describe aspects such as the type of node (e.g., parking lot, intersection, luminary) or relevant environmental aspects in their vicinity (e.g., traffic congestion level, air temperature, parking lot occupancy, luminary dimming, or temperature). Relationships share some of these properties, and may have additional ones (e.g., distance, type of route).
Properties of nodes and relationships are, indeed, what allow for the integration of these two completely different sources of data (streaming sensor data and map data), and support the development of services. This is done by updating the relevant properties in the graph when new readings for a given source of data arrive.
There is thus a streaming graph that represents the current state of the city in terms of its assets and their most recent properties. For this reason, this is called the City Graph. This graph can be queried to answer specific information needs of the city managers, or to implement relevant services for city management or for the citizens, as further described in Section 4.
This graph is, however, only descriptive in the sense that it encodes the current state of the city. The predictive component of the envisioned system is implemented as follows. Multiple instances of the City Graph are created, each one representing a different point in time in the future. Typically, these graphs represent moments in the near future, separated by relatively short periods of time (e.g., 1 h). In Figure 1, the graph at represents the current City Graph, with the most recent data received from the data sources, while the graphs , and could represent the state of the city after 1, 2 and 3 h, respectively.
To obtain these graphs, the existing machine learning models in the pool are used: models are used to predict the values of the properties of the nodes and relationships, and the graphs are updated accordingly. Each graph thus represents the predicted snapshot of the city at a given time in the near future. For instance, if there is a model for predicting parking lot occupancy, the occupancy property of each of the parking lots in these graphs will be updated accordingly, for the specific time being simulated. The same happens for the other properties for which there are models.
All these graphs share the same exact structure and properties; only the values of their properties change. This means that services can use either one of them seamlessly and transparently. Thus, a path finding service can find the best path between two points at the current moment, or it can find it in a point in the future in the exact same way, just by querying a different graph.
On the one hand, this approach allows city managers to look into the possible future state of the city and take decisions accordingly. It also allows for the development of services that take into account this predicted future state and react or prepare accordingly. Services that build on this premise that have already been implemented are described in Section 4, such as dynamically routing cars according to the expected traffic at the time, or dynamically selecting a parking lot according to the expected occupancy at the time.
Methodology
The work described in this project has a twofold nature: it is constituted by both software development and research tasks. For this reason, a mixed methodology was followed.
In what concerns the design and and implementation of the architecture described in this section, a mixture of incremental and iterative methodologies was used. At an early stage, an incremental approach was used that started with the implementation of the databases and the Kafka broker. These were the basic working blocks without which the functionalities of the system would not be possible. Afterwards, the development moved to an iterative approach, in which functionalities were gradually implemented and continuously tested and deployed.
In each cycle, the steps were as follows: a new data source was connected to the Kafka broker, data would start to be stored in the databases, and afterwards, a machine learning task was spawned to use those data to make future predictions. The first of such iterations was to connect a group of more than 300 public lighting luminaries (Arquiled’s Arquicity R1 Efficiency model), in use in a Portuguese municipality. These luminaries can be controlled remotely, in real-time, and produce data about their state, including about energy consumption, operating temperature, etc. When a new source of data was added, the development moved to the following source, repeating the process.
Concerning the machine learning tasks, the CRISP-DM (Cross Industry Standard Process for Data Mining) [37] methodology was followed as it is appropriated when dealing with this type of machine learning problem [38,39,40]. The methodology is composed of the following phases:
- Business understanding phase, in which the problem is analyzed: it is necessary to define and understand the business goals, get familiar with the business concepts, and define the type of machine learning problem;
- Data understanding phase, includes tasks such as collecting, describing and exploring the data to be used in the process. It is important to get acquainted with the data, since one needs to know which type of data is available to perform the modeling and what are the best machine learning algorithms to apply, considering the business goals defined in the previous phase;
- Data preparation phase, in which data pre-processing techniques are used to prepare the chosen dataset for the application of machine learning algorithms;
- Modeling phase, in which the study, selection and application of the machine learning algorithms take place;
- Evaluation phase, in which the obtained results in the previous phase are analyzed and evaluated and, if necessary, the configuration parameters of the algorithms are adapted to try to achieve better results. Moreover, in this phase, it is assessed whether the business goals and criteria are met, considering the created models;
- Deployment phase, in this phase model outcomes are put into practice. The results are explained to customers/decision makers, and measures are suggested to put into practice the conclusions achieved in the previous phase.
This methodology helps by providing a standard process model, which helps through the whole process, from the understanding and definition of the business problems, to the analysis and evaluation of the machine learning outcomes and its deployment. Furthermore, in this work, it was followed in the two cases that require the application of machine learning algorithms.
4. Provided Services from the Proposed Architecture
This section describes the services that have been implemented so far using the architecture detailed in Section 3.
The map data that were used to validate the proposed architecture, as described in Section 5, were acquired from OpenStreetMaps (OSM). OSM is an open-source project that provides free geographic data. In OSM, data are represented as nodes, ways, or relations. A node represents a point on the earth’s surface, and it contains information about the unique identifier of the point (ID number), a pair of coordinates (latitude and longitude) and tags with additional information (set of key/value pairs). A way represents linear features and boundaries and it consists of an ordered list of nodes. A relation represents additional information of both elements, nodes and ways, to explain how elements work together.
Data were extracted from OSM using the Overpass API, which is an OSM provided tool that allows to get the OSM data through an XML query, and it was stored in the graph database. A region which includes the whole city of Porto, in Northern Portugal, was selected to extract data. For this area, all the nodes and waypoints were acquired.
Next, data that were not relevant were excluded, including nodes or waypoints that referred to pedestrian or other types of paths (e.g., steps, cycle ways). Relevant properties were also added to the data. These include the distance between each two connected nodes, calculated through the Haversine formula [41]. After being calculated, the distance was normalized (min–max normalization).
A limitation of this work is that there is not, at the moment, an IoT infrastructure implemented in the city. To simulate it, we used publicly available datasets (e.g., parking lot occupancy, air pollution), as well as datasets previously created by the research team in related projects (e.g., energy consumption in a local public lighting network, meteorological datasets).
To simulate the IoT infrastructure, datasets are streamed in real-time according to the frequency of their data. Thus, the system behaves as if these data are being received in real-time from data sources. In the future, as new data sources become available in streaming, they need only to be replaced in the broker.
The following sub-sections describe some of the services that were already implemented.
4.1. Intelligent Path Finding Service
One of the most important aspects in the management of a city is traffic management, which may have a significant impact on the efficiency of the transportation systems, air and life quality, among others.
Currently, traffic management in cities is done through legislation, and implemented using traffic signs, traffic lights, and similar elements. This traditional way of managing traffic is rather static, in the sense that changes are slow and very rare. For instance, if the city intends to decrease traffic in a given central area, it may place traffic signs that forbid or limit the access of certain types of vehicles at given times of the day. On the one hand, this measure will take some time to implement, and will have associated costs. On the other hand, the measure is not context-aware in the sense that should pollution or noise limitations be exceeded outside the defined time period, vehicles will still be able to enter that area.
The main goal of this service is to propose a soft traffic management system, that can complement these traditional measures. It considers a set of services for optimizing traffic at a city level. For instance, instead of each driver optimizing her/his own route through the city, a common route-finding service is used, which takes into consideration not only the preferences of the driver (e.g., shortest path, quickest path), but also the preferences and policies of citizens and city managers (e.g., decreasing pollution, noise, or traffic in a given area). This might result in some individual situations that are not optimized, but will result in an overall improvement for the city.
This approach was deemed soft traffic management, in the sense that it does not really enforce decisions. Let us consider that a driver uses this route-finding algorithm to go from point A to point B. If the driver is not satisfied with it, she/he can always resort to her/his own GPS application, and follow a preferred route. However, as citizens gain an increased conscience about the role and impact of each individual on the society, and the importance of social capital [42], this kind of systems will gain increased relevance. At the same time, cities can also give back to citizens who decide to contribute to the common cause, namely through gamification or rewards programs.
Finally, in an era in which driving is becoming autonomous, this kind of system can be more easily implemented, namely through legislation that could force autonomous cars to abide by the rules and policies of each city they are driving in.
This service, as opposed to traditional driver routing services, does not aim to optimize the path for a specific driver. Instead, it will provide a path that takes into consideration driver preferences (e.g., shortest path, quickest path), but in the frame of city’s state and management policies. So, a driver may not be directed through the shortest route if this route goes through a pollution or noise hotspot at that time.
The Intelligent Path Finding Service is implemented as follows. The main goal is, as mentioned previously, to find the best path between two points. The notion of best is, however, not the traditional one (e.g., shortest, quickest). Here, the quality of a path is given by an optimization function that will take into consideration the characteristics of the path and the city’s traffic management preferences.
Traffic management preferences are defined by city managers through the UI. Managers do so by creating a weights vector W that includes four values: , , and (). These variables represent, respectively, the weights of distance, noise pollution, congestion and air pollution. So, if the city manager wants to prioritize the minimization of noise, she/he may attribute weights of . On the other hand, a weights vector of would hold results similar to the drivers’ individual navigation services.
In order to find the best path, this service uses a modified version of the Dijkstra algorithm [43]. Specifically, the concept of distance is now given by a weighed sum of the properties of the way (geographical distance, pollution, noise and congestion). Thus, paths will tend to reflect the city managers’ preferences.
A change in the preferences of the managers and/or on the state of the city (e.g., an increase in the level of pollution or traffic in a given area) will potentially lead to different routes. More importantly, these routes do not optimize the path of each individual driver in the city, but optimize all their paths, according to the city’s preferences.
4.2. Parking Lot Occupancy
The parking lot occupancy service allows one to predict the number of free parking spots at each of the city’s parking lots, at any given time.
Since, as mentioned earlier, there is currently no IoT infrastructure in place in the city, the Santa Monica dataset was used to implement this service. This dataset describes the state of parking lots at 5-min intervals, 24 h a day. Given that this dataset does not describe parking lots in the same city of the map data, parking lots were given random positions inside the map. The data were transformed in order to extract relevant features, such as day, month, year, hour of the day, week day, among others. The problem was thus not treated as a time-series one. Figure 3 shows the typical fluctuation of the distribution of available parking spots during the day in the Pier Deck parking lot. It shows how, in certain hours of the day, it is common for a parking lot to have very few or no free parking spots.
This is one of the services that can easily be integrated with others. A common use case would be for a citizen to go to a given point in the city and want to find an available parking spot in the vicinity. Given that parking lots are stored as nodes in the city graph, much like roads and other elements, it is possible to find the nearest parking lots in the destination and their predicted free spots. The user or the system could thus select the path to the parking spot that is closest to the destination, and with the most predicted free spots.
This example of integration between services is detailed in Section 5.
4.3. Public Lighting Management
Public lighting is another key element in a city, with an especially visible impact on the citizens’ daily living. At a management level, it affects mostly energy consumption and distribution, and thus the city’s expenditures with energy. From the citizens’ point of view, it affects perceived security, comfort and safety [44].
The main goal of this service is to leverage technological solutions to automatize and optimize the management of public lighting networks, by optimizing decision-making to a level that would be unattainable solely by human decision-makers. Specifically, luminaries are managed individually according to their own operational characteristics, in order to minimize energy consumption while maximizing lifetime and lighting quality and level. This is based on previous findings of the research team, in which it was shown that even different luminaries of a same model may exhibit different physical properties, which affect energy consumption or operational temperature, for instance [45]. This can be attributed to differences resulting from the assembly phase, in which aspects such as the correct placement of a heat sink or other components end up affecting the operation and efficiency of the luminary.
In this service, we explore these differences to optimize each luminary individually, based on its characteristics, which are modeled individually. Moreover, we use ambient luminosity data in order to be able to automatically dim the luminaries in real time, while maintaining the necessary level of luminosity.
The dataset used to implement this service was collected by the research team, from a network of more than 300 luminaries, in a Portuguese city. The dataset contains 3,855,818 instances of data, each averaging 5 min of operation of a specific luminary. The variables include dimming, accumulated energy (Wh), temperature, uptime, and instant voltage, among others.
Environmental data were also collected and integrated with the luminary dataset. The data, collected from a local weather station, include humidity, wind speed and direction, air and dew temperature, wind gust, solar irradiance, rain or air pressure. The main goal of the integration of these two datasets is to allow one to study how environmental factors influence aspects, such as luminary operating temperature (which directly affects lifetime and light quality) or lighting level.
Data describing ambient luminosity, due to moonlight or other artificial sources such as billboards, were also collected. To this end, luminosity sensors were placed on top of the luminaries, as well as at the pedestrian level. The goal is to study and model how much of the luminosity measured at pedestrian level is due to the luminary or to other external factors, at different levels of dimming.
The key idea of this service is thus to take as input the characteristics and model of each luminary and, based on the current ambient luminosity in its location (due to moonlight and other sources), provide the best dimming of the luminary, at the time, in order to minimize energy consumption, while maintaining lighting standards.
The reasonableness and validity of this approach can be assessed through Figure 4. The figure shows how the luminosity at pedestrian level changes according to the dimming of the luminary, not excluding the effects of external sources of light.
4.4. Air Pollution
Air pollution is one of many important factors that influence the daily life of many people [46]. By definition, an air pollutant is a substance that can have adverse effects on humans, animals or vegetation. It represents a great risk to human health, and it is associated with adverse health issues in humans and diseases in multiple systems, including the respiratory, cardiovascular, nervous, urinary and digestive systems [47]. However, curiously, humans are the main source of contribution to air pollution, mostly through fuel combustion (from motor vehicles), heat and power generation, industrial facilities, municipal and agricultural waste sites, among others (as shown in Table 1) [48].
The main known pollutants are:
- Nitrogen oxides (NOx)—highly reactive gases. NO (nitric oxide) and NO2 (nitrogen dioxide) are two kinds of gases that are referred to as nitrogen oxides (NOx).
- Sulfur dioxide (SO2)—one of a group of gases called sulfur oxides (SOx).
- Ozone (O3)—secondary pollutant, which means that it is produced when carbon monoxide, methane, and other volatile organic compounds (VOC) are oxidized, in the presence of NOx and sunlight.
- PM and PM—particles, with diameters that are, respectively, 10 and 2.5 micrometers or smaller, that could be inhaled by humans.
In this work, the goal of including air pollution is twofold. On the one hand, we aim to update the city graph in real time, so that the city state in terms of air pollution can be easily visualized, and so that other services can use these data. On the other hand, we also update the future instances of the graph with the predicted level of pollution of the different parts of the city. This is mainly intended to be used by other services. For instance, the intelligent path finding service may use the predicted level of pollution to choose the best route for a given vehicle in the future.
We specifically chose NOx and PM, since these gases are among the most harmful particles to human health. The ability to predict future values of these and other pollutants is therefore very important, both for the city managers, as well as for other services that can use the predicted data.
Since there are no available datasets of air quality for the city of Porto, we decided to use the dataset created by the Department for Environment Food and Rural Affairs of the UK [49]. It provides information about air quality over 1500 monitoring sites across the UK, measuring NOx, NO, NO2, SO2, O3, PM and PM levels (in µg/m—micrograms per cubic meter of air).
So, to implement this service, we analyzed the evolution of the cited pollutants in different areas of the UK. For illustration purposes, we randomly chose 6 monitoring sites:
- Port Talbot Margam (POR) (Latitude/Longitude: 51.583950, −3.770822, Altitude: 5 m), located in an urban industrial environment in South Wales.
- Middlesbrough (MID) (Latitude/Longitude: 54.569297, −1.220874, Altitude: 10 m) monitoring site is located in an urban industrial environment in the North East in a residential area.
- Nottingham Centre (NOT) (Latitude/Longitude: 52.954730, −1.146447, Altitude: 41 m) is on an urban background environment. The monitoring site is located in East Midlands.
- Southampton Centre (SOU) (Latitude/Longitude: 50.908140, −1.395778, Altitude: 7 m) monitoring site is located on an urban background environment in South East.
- Narberth (NAR) (Latitude/Longitude: 51.781784, −4.691462, Altitude: 160 m), located on a rural background environment located in South Wales.
- London Marylebone Road (LON) (Latitude/Longitude: 51.522530, −0.154611, Altitude: 35 m) monitoring site is on an urban traffic environment located in London.
Each of the 6 datasets contains 8760 instances and hourly information about emissions of the main pollutants (NO2, NOx, SO2, O3, PM and PM) between 1 January 2019 and 31 December 2019.
5. Results
This section describes the validation of the architecture and proposed services that was conducted. Validation was carried out in two ways: through the development of a prototype of the user interface; and through the training of models and development of proposed services. As previously mentioned, there is still no access to an IoT infrastructure in the city. For this reason, this Section also shows how the UI can be used to generate data. The key idea is that the city manager can easily create hotspots of pollution or traffic; for instance, in order to create specific conditions that she/he wants to simulate.
5.1. User Interface
Given the absence of sensor data for some relevant metrics, we chose to simulate these data by allowing city managers to define their own areas of pollution, congestion or noise. On the one hand, they can do so in order to simulate actual pollution/noise/congestion hotspots in the city. On the other hand, this simulation tool can also be used to analyze different scenarios (e.g., how traffic would be routed).
To insert a hotspot, a city manager has two options. Under the first one, he selects the desired type of hotspot (i.e., pollution, noise or congestion), defines its severity (a number between 0 and 1), clicks a point in the map, and then drags to create a circle with a given radius. The effect of this is that all nodes and connections inside the circle will be updated with a new value for the selected phenomenon. The intensity of the phenomenon decreases from the center to the edge of the circle, proportionally to the distance to the center.
Under the second option, the user may select a group of nodes (such as a specific road) and create a hotspot that is not circular, but that applies only to the selected nodes. This second option is typically used for simulating traffic congestion.
Figure 5 shows three excerpts from the UI. Figure 5a shows the definition of a new air pollution zone in a given region of the city. Figure 5b shows how traffic is routed between two specific points if the preferences of the city favor the minimization of traveled distance (). Figure 5c, on the other hand, shows traffic routing if preferences favor the minimization of air pollution ().
5.2. Intelligent Path Finding and Parking
In order to validate the integration of the Intelligent Path Finding Service, a specific application was developed. The main goal of the application is to find the most adequate parking spot for a driver at the destination of its route.
To this end, several configurations of three machine learning models were trained to predict the number of free parking spots at a given time and parking lot, using a grid search scheme with cross-validation. The first model to be tested was a deep learning model [50] with different architectures of hidden layers and three different activation functions: Rectifier, Tanh and Maxout. The second model was a generalized linear model (GLM) [51], and the third was a gradient boosting machine (GBM) [52]. The performance metrics of the best model of each type are detailed in Table 2.
The deep learning model, given its superior performance, was thus selected to power the developed application. Thus, using this application, a driver first picks the point in the city where she/he wants to go. The application uses the Intelligent Path Finding Service to compute the best path to that point, as well as the estimated time of arrival.
Then, it predicts the number of available free parking spots in the n closest parking lots, and picks the one that has more expected free spots. The calculated path is then updated, to have, as a destination, the selected parking spot. It is this final spot that is provided to the user.
This application, which can be seen as an example of building on top of an existing service to provide a useful functionality for citizens, has several advantages. On the one hand, it optimizes the route of the driver in accordance with the city’s rules, minimizing air pollution, noise or congestion, as desired. Moreover, it selects the parking lot with a higher predicted number of free spots. This allows the driver to park more efficiently, minimizing the negative impact of driving around while searching for a free parking spot.
5.3. Public Lighting Management
The validation of the proposed service for the efficient management of public lighting networks was implemented through the following methodology. All datasets were integrated into a single one using the timestamp. A machine learning model was trained to predict luminosity at pedestrian level. The inputs of this model are the characteristics of a luminary, as well as its operating conditions and the environmental variables at the time. The output is a numeric variable that represents the expected value of luminosity at pedestrian level in a given context.
The model thus learns how the external and internal factors of the luminary, together with its current configuration, affect the luminosity measured at pedestrian level, and how much of this luminosity is due to each of these factors.
The training of the model was done using the Random Forest algorithm. This is a popular ensemble learning algorithm that, despite its relative simplicity, achieves generally good performance, while being resilient to overfitting [53].
In this work, the resulting ensemble is composed of 50 trees, in which each tree was trained with 60% of the input variables, selected randomly from the dataset. The model currently in use has an RMSE of 3.68 (), which is rather satisfactory for this application domain.
The precision of the model can be observed in Figure 6, which plots the observed value of luminosity for a randomly selected luminary and night, at pedestrian level, as well as the luminosity predicted by the model for that same luminary and night. The correlation between the two data series is 0.89.
Figure 7, on the other hand, depicts how ambient luminosity varies during one night (brown line), and how different levels of dimming in a luminary are predicted to influence the luminosity measured at the pedestrian level. From the observation of the figure, it can be concluded that, for this specific luminary/night, the optimum dimming would be around 60%. This level of dimming provides the necessary level of luminosity according to the EN 13201 standard, while also minimizing energy consumption.
This service can thus be used to select the most appropriate dimming for each luminary in the public lighting network, in an automatic and individual way, in order to minimize energy consumption, while ensuring lighting standards. More details on how the service can be used to select an optimum level of dimming can be found in [35].
The model estimates the optimum dimming of each luminary, in order to minimize energy consumption, while ensuring lighting quality standards. To implement the public lighting management service, the model is used in an interactive way, by an algorithm similar to a binary search, as further detailed in [35]. The experiments carried out show that it is possible to achieve a reduction in energy consumption of nearly 30% when compared to a rigid luminary management scheme, with pre-defined on/off times.
Such a level of optimization would never be possible using traditional approaches or purely human-based decision-making, as these methods cannot efficiently deal with all this volume and variety of data, nor with the near real-time velocity at which automated decisions are taken.
5.4. Air Pollution
This section describes the process through which the service for predicting the levels of air pollution was validated. A standard machine learning methodology was followed in which, after the training of a model, it was used to predict the main pollutants’ emission through the day in the different stated locations. As said before, our goal is to predict the levels of NOx and PM.
The goal of the service is to predict emissions on a specific location and hour of the day. For this purpose, a machine learning model was trained. Specifically, an ensemble model was used. Ensemble learning algorithms are powerful and widely used machine learning algorithms, with a special resilience to overfitting. In this case, the gradient boosted regression trees algorithm [52] was used to build the prediction model. This algorithm falls into the category of boosting ensembles, and is well-known and widely used in the research community for regression problems [54,55,56,57,58].
The trained model is composed of multiple single models—in this case, regression trees—which are often deemed weak learners. Each model is trained based on the loss function (mean squared error) of the previous model. More precisely, in a first iteration, this algorithm creates a regression tree, and then the next tree is trained using the loss function, and after multiple iterations, the algorithm returns a model with high accuracy for predictive results. During the process, the model evolves to minimize the error by focusing on instances that were previously misclassified.
The following methodology was followed. The model was trained with 60% of the instances, selected randomly, using the hold-out method. The best output was obtained with a configuration of 150 trees, maximum depth of 7, and a learning rate of 0.1. The performance measures of all models created are detailed in Table 3.
As stated before, the model predicts a numerical value (emission of the gas) throughout the day. Figure 8 shows how the emissions can vary in the different locations (Figure 8a-SOU, Figure 8b-POR, Figure 8c-NAR, Figure 8d-LON, Figure 8e-MID and Figure 8f-NOT). The x-axis represents the hours of the day (1 h to 24 h), and the y-axis represents the emission values (in micrograms per cubic meter air or µg/m). The expected NOx values are represented by the black line, and the observed values are represented by the blue line. The expected PM values are represented by the green line, and the PM observed values are represented by the orange line.
There is a clear similarity between the plots of zones with similar characteristics and, as expected, each plot reflects the behavior of the surrounding environment of each zone. Figure 8f (NOT) and Figure 8a SOU, representing urban background environments, present relatively higher values of NOx emissions (when compared to the NOx values of the other zones), varying between 30 and 60/70 µg/m and a lower range of PM emissions (varying between 15–20 µg/m). In Figure 8b (POR) and Figure 8e (MID), representing urban industrial environments, it is possible to see that the NOx emissions may vary between 10 and 35 µg/m and PM emissions vary from 15–20 µg/m. On the other hand, Figure 8d (LON), representing an urban traffic environment, presents the higher range of NOx emissions. As can be seen, the emissions of NOx are higher than the PM in all of the previous zones. Finally, Figure 8c (NAR), representing a rural background environment, is the zone with lower NOx emission values, with values varying from 3–6 µg/m. Only in the NAR zone, the PM emissions are higher than those of NOx throughout the day, varying from 10–12 µg/m.
Regarding the evolution of the emissions of NOx and PM throughout the day, it is visible that, in all zones and in the first hours of the day (between 1 a.m. and 6 a.m.), the NOx emissions are usually low (considering the emissions of the rest of the day). In Figure 8b,c, in the last hours of the day (between and 12 p.m.), the emissions are also relatively low. In general, in all locations, the high peaks of NOx emissions usually happen around 8 a.m./9 a.m. (higher peaks in all the plots except in Figure 8d), and again in the afternoon, at around 6/7 p.m. Only in Figure 8d is it possible to see a larger range of hours with higher NOx emission values (between 8 a.m. and 6 p.m.), which means that the level of NOx emissions in Figure 8d remains higher throughout the day, possibly due to high car traffic between 8 a.m. and 6 p.m. In almost all charts, the PM values always remain in the same range, without very high peaks. The exception is the case of POR, where it is possible to conclude that there is a clear maximum peak around 12 p.m.; so much so, that the emissions of PM are higher than those of NOx between 12 p.m. and 4 p.m.
6. Discussion
As the population living in cities grows to unprecedented levels, new challenges must be tackled by city designers and managers, so that the quality of life and services can be maintained and resist all the internal and external stressors. In this paper, we proposed and implemented the prototype of an architecture to address some of these challenges, while focusing on the well-being and quality of life of the inhabitants of the city.
The proposed architecture relies on a graph database that stores; not only the state of the city at a given time (in terms of the values read from its sensors), but also the absolute and relative location of its infrastructure. Moreover, the architecture also includes a predictive component that allows services and city stakeholders to make decisions based on the predicted state of the city in the near future.
The results can thus be analyzed from two perspectives: an engineering one, related to the validation of the implemented prototype, and a research one, related to the predictive models.
Concerning the architecture itself, whose central element is a graph oriented database, the proposal is not entirely novel, in the sense that other authors have proposed similar approaches for IoT or Smart Cities. For instance, in [59], the authors use a graph database for managing IoT assets. However, their proposal is focused on smaller environments such as smart homes. In [60] the authors use five different graphs to store information about and IoT infrastructure, each of which is used for different purposes, such as modeling people’s relationships, people’s relationships towards IoT devices (e.g., ownership), people’s location, or permissions. The focus of their architecture is however mostly on data processing, and in smaller IoT environments, rather than Smart Cities. In [61] the authors propose a graph database integrated with REST APIs, whose focus is entirely on security. Specifically, the authors extend a graph edge property by adding access protocol permissions and checking permissions using the APIs with authentication.
Similar approaches to those discussed so far can be found. The architecture proposed in this paper, albeit similar in terms of technologies, has several distinguishing factors. First, most of the existing solutions model only the infrastructure and/or the way in which each of its elements is related with each other, such as in [62]. On the contrary, in this work, we store not only this kind of information (relative location), but also the absolute location of the infrastructure in terms of their geographical coordinates. This allows for the development of more efficient services (e.g., routing of city drivers or of city maintenance teams), and provides for a much richer decision environment. Namely, it allows for the design of geo-referenced visualizations, in which sensors, luminaries, city assets, and other elements are placed in their exact position.
Another key distinguishing factor of the proposed system is the use of multiple instances of the graph, for representing future states of the city. To this end, the predictive models are used to populate future instances of the graph with the predicted values. Specifically, we implemented the prediction of parking lot occupancy, as well as the prediction of indicators of air quality. Other potential applications include the prediction of traffic in specific regions or roads of a city, or the prediction of meteorology. The main innovation in this is that the services that use the present instance of the graph (e.g., path finding) can be used exactly in the same way, but with predicted data rather than real-time data. For instance, a driver can choose a path to drive over and a parking lot to park in, not based on the present state of traffic, but on the predicted traffic and parking lot occupancy at the time of arrival or travel. As far as we know, no other work in the literature was found with such a functionality.
Concerning the results of the predictive models, these are in general positive. Specifically, we worked on three main problems: to predict the occupancy of a given parking lot at a given time, to predict the level of several air pollutants, and to predict the luminosity at pedestrian level on a road, considering the predicted level of ambient luminosity and luminary-specific factors. The fact that a proprietary dataset was used in the third case makes it difficult to compare the results with other works. Nonetheless, as can be seen by the results (namely in Figure 6), the developed model accurately predicts the level of luminosity (RMSE = 3.68, ), and can be used in real-time for the individualized management of the lighting network.
Concerning the other two applications, results can be compared with those in the literature, although with some limitations. In what concerns air pollutants, the main limitation is that there are many different air pollutants (e.g., O, NO, SO, PM, PM, CO), and different authors look at different groups of pollutants. Given that the most frequent measures of model accuracy are scale-dependent (e.g., RMSE), only models for predicting the same variable can be compared. Moreover, data collected in regions with very different levels of pollution also decrease the validity of the comparison. While this limits the extent of the comparison of results, some works can still be found that analyze the same variables that we do (i.e., NOx and PM).
In what concerns air pollution, our results show an RMSE ranging between 2.14 and 47.85 for NOx (), and between 5.34 and 11.32 for PM (), depending on the station considered.
Other works in the literature show similar results. In [63], the authors propose a novel spatiotemporal convolutional long short-term neural network for air pollution prediction. They also test a group of other models for comparison. Depending on the model considered, the values of RMSE obtained by the authors range between 12.08 and 39.92. In comparison, our results are very similar. In [64], the authors trained an artificial neural network for predicting multiple air pollutants. Concerning PM, the only pollutant in common with the ones analyzed in this paper, the authors report an RMSE ranging between 200.9 and 343.4, depending on the station. Our results, in this indicator, are fairly better. Additionally, an extensive survey of models for air pollution prediction can be found in [65]. Despite the significant range of different works in terms of air pollution indicators or models used, our results are in line with those found in the literature.
Concerning the prediction of parking lot occupancy, the results are also highly dependent on the parking lots compared, as each one has a different capacity, which affects scale-dependent metrics. In our work, the value of the MAE for park occupancy prediction ranged between 39.43 and 137.27, depending on the algorithm used.
The results reported in the literature show, above all, a significant variability. This can be explained by the dependence on the dataset used. In [66], the authors test several prediction strategies (e.g., polynomial fitting, Fourier series, K-means clustering, time series). Their results point to an MSE ranging between 100 and 600, depending on the parking lot considered, and on the day of the week. Other than this work, we could not find recent papers that had comparable approaches, datasets, or results. However, the results obtained are positive and show that the model can be used for predicting parking lot occupancy, with a significant accuracy.
7. Conclusions
In recent years, Smart Cities have emerged as a promising way of tackling the challenges that most modern cities are currently facing or are going to face soon. The main goal that motivated this work was to define an architecture for Smart Cities that could meet certain criteria: to be holistic, by integrating different sources of data into a single repository; to be context-aware, by storing data in a connected way that resembles the physical relationships between infrastructures, devices and locations in the city; to be anthropocentric, by supporting services that focus on the citizen; and to be predictive, so that future states of the city could be anticipated. In practical terms, we aimed at validating the prototype of the proposed architecture, as well as the services developed, namely those based on predictive models.
There were two main lines of action. An engineering one, which dealt with the challenges of integrating different sources of connected data into a single system, so that data could be queried and used independently of their provenance, in a transparent manner, and a research one, which essentially dealt with the development of accurate machine learning models to predict the future states of the different dimensions being monitored (e.g., air pollution, traffic), and consequently, the future states of the city.
From this work, several main conclusions can be drawn. First, a few systems can be found in the literature that model the problem using a graph database. However, this use is often limited. Some use them merely to store information about relationships between infrastructure or users; others use them to store data about the city state (e.g., sensor data). In this work, we show that graph databases can be use for far more, namely: storing data about infrastructure, namely about their relative and absolute location and about their state; and storing data about the future states of the city, provided by predictive models. The main advantage of this is that it allows for existing services to operate just as well on future data. Thus, when a citizen uses a service that develops in the future (e.g., finding a parking spot for a trip later in the day), the service will use the predicted state of the city at the time, instead of the current state.
We also show that it is possible to accurately predict the values of multiple relevant factors in the city, such as air pollution and parking lot occupation. We also show that it is also possible to model the operation of the infrastructure of the city, in order to optimize it. Specifically, we model the operation of a public lighting network, and how ambient light and other factors can be used to optimize energy consumption through individualized and real-time management.
The development of such systems will have implications at several levels. In theoretical terms, this work contributes with the proposal of new possibilities for the development of better services for Smart Cities, in which different sources of data are integrated into a single database. Moreover, data and its sources are connected, and can be queried against their relative and absolute location, for example. We also show how multiple instances of this graph, that represents the city structure and state, can be populated with future states of the city, through the use of predictive models. All this represents a major contribution against the current literature.
From a practical standpoint, the main contribution of this work is to show that it is indeed possible to implement such an architecture with currently available and free technologies. While data collected by the team were only used in one of the problems addressed (i.e., public lighting management), real data from publicly available datasets were used in the remaining problems. This work shows that accurate predictive models can be developed for multiple relevant domains in the city, and that these can be used for services that are relevant for the life of its citizens.
Finally, these theoretical and practical developments will result in positive social outcomes. From a broad perspective, systems such as this will make the management of cities more efficient and sustainable, as city managers, who are responsible for high-level decision-making and planning, will have access to relevant services and data about the present and future state of the city. Indeed, both human actors and services will have access to a graph in which the main elements of the city are represented, together with their relationships, but in which the values are predictions for a certain time in the future. In truth, this represents a snapshot into a provable future state of the city, which will allow human decision-makers and services to plan ahead, in order to avoid undesirable states.
Moreover, the system can be used as a simulation, to better understand how certain services would react to specific changes in the environment. For instance, how would traffic be routed if there were certain spots of pollution in the city? All in all, the proposed system may represent a significant improvement towards better decision-making, which will reflect on the quality of life, security and well-being experienced by citizens.
The development of these functionalities resulted in some key innovative aspects. These include the use of a graph to represent the city and its different assets, which include two types of meta-information: one that contains its geo-spacial location, and the other that describes how each asset is connected to others. This allows us not only to query the collected data but also to query the infrastructure of the city, such as “which luminaries are in a specific parking lot”, or “which ambient sensors are within a certain radius of a given point”. Moreover, another interesting aspect is the use of multiple instances of this graph. One represents the present state of the city, with all the latest values for the available sensors. Additional instances are maintained that represent future states of the city. These instances maintain the same structure of the original graph, but the values are populated by the predictive models. All in all, this constitutes an innovative way to model a city from a data generation and use perspective, which may significantly improve the decision-making of the several stakeholders in charge of managing a city.
The proposed system is also citizen-centric, in the sense that it aims to provide services that put the inhabitant of the city in the center. This includes her/his well-being, comfort, security and quality of life. To this end, this work proposed to sacrifice individual and egoistic views on the conception of city services, and replace them with a holistic notion. Thus, services no longer aim to optimize the preferences of each individual citizen, but rather to optimize or improve the common good of everyone.
The main limitation in the present work that must be acknowledged is that it is still not connected to streaming sensors in the city due to a lack of infrastructure; the only exception being the public lighting network, which already produces data in real-time. Nonetheless, a prototype of the system was implemented and validated using real data sources, whose locations were artificially set on the map in order to ascertain the feasibility of the proposed approach.
As is visible in the various plots in Figure 8, and analyzing the results of the models in each of the zones in Table 3, the averages of expected and predicted values are quite similar to those observed, helping to predict the emissions for both gases, depending on the characteristics of each zone throughout the day. This model, integrated in its respective service, is used to accurately predict pollution level in different parts of the city, and thus allow other services to take into consideration the future states of the city in what concerns air pollution.
The quality of the predictive models can also still be further improved, although the results obtained are in line with those in the literature, as discussed in Section 6. However, the accuracy of the models was not the main focus of the work so far. Instead, we aimed at building a working prototype of the proposed system. In future work, we will use meta-learning techniques to find the best algorithm/configuration combination, which we expect will result in better models, with smaller error metrics.
We believe that the proposed approach is worth pursuing, in the sense that it might encompass advantages at several levels for a city. In future work, we will proceed to integrate the proposed system with live data from the city’s sensors, and assess how services behave with different preferences, and under different conditions.
We believe that in the near future, as the challenges associated with overpopulation become harder, innovative solutions must be found. The vision of each Human by itself is no longer suited. With this work, we expect to contribute to the notion that global problems must be tackled globally, in a multi-modal way, combining multiple sources of information seamlessly, relying on automated optimization techniques that improve the decision-making skills of humans, and placing the greater good above individual desires.
Simultaneously, several integration aspects from different kind of data sources must require the system’s integrity and security, as well as to ensure that private and personal data are protected and used under ethical standards. The technological literacy of some citizens also needs to be properly tackled with user experience design, which ensures the ability of any person to not be put aside. The integration of all systems should also include a gamification approach towards enabling a cultural shift to favor the adoption of sustainable practices among citizens, with systems’ personalization mechanisms to generate the adequate benefits to trigger and reinforce smart and sustainable governance policies.
Author Contributions
All authors contributed equally to this work. All authors have read and agreed to the published version of the manuscript.
Funding
This research received no external funding.
Acknowledgments
This work was supported by FCT—Fundação para a Ciência e a Tecnologia, through project UIDB/04728/2020.
Conflicts of Interest
The authors declare no conflict of interest.
References
- Sodiq, A.; Baloch, A.A.; Khan, S.A.; Sezer, N.; Mahmoud, S.; Jama, M.; Abdelaal, A. Towards Modern Sustainable Cities: Review of Sustainability Principles and Trends. J. Clean. Prod. 2019, 227, 972–1001. [Google Scholar] [CrossRef]
- Ameer, S.; Shah, M.A.; Khan, A.; Song, H.; Maple, C.; Islam, S.U.; Asghar, M.N. Comparative analysis of machine learning techniques for predicting air quality in smart cities. IEEE Access 2019, 7, 128325–128338. [Google Scholar] [CrossRef]
- Nauman, A.; Jamshed, M.A.; Ali, R.; Cengiz, K.; Kim, S.W. Reinforcement learning-enabled Intelligent Device-to-Device (I-D2D) communication in Narrowband Internet of Things (NB-IoT). Comput. Commun. 2021, 176, 13–22. [Google Scholar] [CrossRef]
- Silva, B.N.; Khan, M.; Han, K. Towards sustainable smart cities: A review of trends, architectures, components, and open challenges in smart cities. Sustain. Cities Soc. 2018, 38, 697–713. [Google Scholar] [CrossRef]
- Zheng, C.; Yuan, J.; Zhu, L.; Zhang, Y.; Shao, Q. From digital to sustainable: A scientometric review of smart city literature between 1990 and 2019. J. Clean. Prod. 2020, 258, 120689. [Google Scholar] [CrossRef]
- Bibri, S.E.; Krogstie, J. Smart sustainable cities of the future: An extensive interdisciplinary literature review. Sustain. Cities Soc. 2017, 31, 183–212. [Google Scholar] [CrossRef]
- Ullah, Z.; Al-Turjman, F.; Mostarda, L.; Gagliardi, R. Applications of Artificial Intelligence and Machine learning in smart cities. Comput. Commun. 2020, 154, 313–323. [Google Scholar] [CrossRef]
- Ismagilova, E.; Hughes, L.; Dwivedi, Y.K.; Raman, K.R. Smart cities: Advances in research—An information systems perspective. Int. J. Inf. Manag. 2019, 47, 88–100. [Google Scholar] [CrossRef]
- Neilson, A.; Daniel, B.; Tjandra, S. Systematic review of the literature on big data in the transportation domain: Concepts and applications. Big Data Res. 2019, 17, 35–44. [Google Scholar] [CrossRef]
- Nagy, A.M.; Simon, V. Survey on traffic prediction in smart cities. Pervasive Mob. Comput. 2018, 50, 148–163. [Google Scholar] [CrossRef]
- Saharan, S.; Bawa, S.; Kumar, N. Dynamic pricing techniques for Intelligent Transportation System in smart cities: A systematic review. Comput. Commun. 2019, 150, 603–625. [Google Scholar] [CrossRef]
- Dutta, J.; Gazi, F.; Roy, S.; Chowdhury, C. AirSense: Opportunistic crowd-sensing based air quality monitoring system for smart city. In Proceedings of the 2016 IEEE SENSORS, Orlando, FL, USA, 30 October–3 November 2016; IEEE: Piscataway, NJ, USA, 2016; pp. 1–3. [Google Scholar]
- Honarvar, A.R.; Sami, A. Towards sustainable smart city by particulate matter prediction using urban big data, excluding expensive air pollution infrastructures. Big Data Res. 2019, 17, 56–65. [Google Scholar] [CrossRef]
- Yigitcanlar, T.; Kamruzzaman, M.; Foth, M.; Sabatini-Marques, J.; da Costa, E.; Ioppolo, G. Can cities become smart without being sustainable? A systematic review of the literature. Sustain. Cities Soc. 2019, 45, 348–365. [Google Scholar] [CrossRef]
- Gazzola, P.; Del Campo, A.G.; Onyango, V. Going green vs going smart for sustainable development: Quo vadis? J. Clean. Prod. 2019, 214, 881–892. [Google Scholar] [CrossRef] [Green Version]
- Awan, F.M.; Minerva, R.; Crespi, N. Improving Road Traffic Forecasting Using Air Pollution and Atmospheric Data: Experiments Based on LSTM Recurrent Neural Networks. Sensors 2020, 20, 3749. [Google Scholar] [CrossRef] [PubMed]
- Alvi, U.; Khattak, M.A.K.; Shabir, B.; Malik, A.W.; Muhammad, S.R. A Comprehensive Study on IoT Based Accident Detection Systems for Smart Vehicles. IEEE Access 2020, 8, 122480–122497. [Google Scholar] [CrossRef]
- Kirimtat, A.; Krejcar, O.; Kertesz, A.; Tasgetiren, M.F. Future Trends and Current State of Smart City Concepts: A Survey. IEEE Access 2020, 8, 86448–86467. [Google Scholar] [CrossRef]
- Mohammadi, M.; Al-Fuqaha, A. Enabling cognitive smart cities using big data and machine learning: Approaches and challenges. IEEE Commun. Mag. 2018, 56, 94–101. [Google Scholar] [CrossRef] [Green Version]
- Nosratabadi, S.; Mosavi, A.; Keivani, R.; Ardabili, S.; Aram, F. State of the art survey of deep learning and machine learning models for smart cities and urban sustainability. In International Conference on Global Research and Education; Springer: Berlin/Heidelberg, Germany, 2019; pp. 228–238. [Google Scholar]
- Din, I.U.; Guizani, M.; Rodrigues, J.J.; Hassan, S.; Korotaev, V.V. Machine learning in the Internet of Things: Designed techniques for smart cities. Future Gener. Comput. Syst. 2019, 100, 826–843. [Google Scholar] [CrossRef]
- Teng, H.; Liu, Y.; Liu, A.; Xiong, N.N.; Cai, Z.; Wang, T.; Liu, X. A novel code data dissemination scheme for Internet of Things through mobile vehicle of smart cities. Future Gener. Comput. Syst. 2019, 94, 351–367. [Google Scholar] [CrossRef]
- Ji, W.; Xu, J.; Qiao, H.; Zhou, M.; Liang, B. Visual IoT: Enabling internet of things visualization in smart cities. IEEE Netw. 2019, 33, 102–110. [Google Scholar] [CrossRef]
- Pettit, C.; Bakelmun, A.; Lieske, S.N.; Glackin, S.; Thomson, G.; Shearer, H.; Dia, H.; Newman, P. Planning support systems for smart cities. City Cult. Soc. 2018, 12, 13–24. [Google Scholar] [CrossRef]
- Maitakov, F.G.; Merkulov, A.A.; Petrenko, E.V.; Yafasov, A.Y. Development of decision support systems for smart cities. In International Conference on Electronic Governance and Open Society: Challenges in Eurasia; Springer: Berlin/Heidelberg, Germany, 2018; pp. 52–63. [Google Scholar]
- Pramanik, M.I.; Lau, R.Y.; Demirkan, H.; Azad, M.A.K. Smart health: Big data enabled health paradigm within smart cities. Expert Syst. Appl. 2017, 87, 370–383. [Google Scholar] [CrossRef]
- Diro, A.A.; Chilamkurti, N. Distributed attack detection scheme using deep learning approach for Internet of Things. Future Gener. Comput. Syst. 2018, 82, 761–768. [Google Scholar] [CrossRef]
- Ta-Shma, P.; Akbar, A.; Gerson-Golan, G.; Hadash, G.; Carrez, F.; Moessner, K. An ingestion and analytics architecture for iot applied to smart city use cases. IEEE Internet Things J. 2017, 5, 765–774. [Google Scholar] [CrossRef] [Green Version]
- Albino, V.; Berardi, U.; Dangelico, R.M. Smart cities: Definitions, dimensions, performance, and initiatives. J. Urban Technol. 2015, 22, 3–21. [Google Scholar] [CrossRef]
- Moss Kanter, R.; Litow, S.S. Informed and Interconnected: A Manifesto for Smarter Cities. Harvard Business School General Management Unit Working Paper. 2009. Available online: https://www.hbs.edu/faculty/Pages/item.aspx?num=36185 (accessed on 15 October 2021).
- Komninos, N. Intelligent Cities: Innovation, Knowledge Systems and Digital Spaces; Routledge: London, UK, 2013. [Google Scholar]
- Chourabi, H.; Nam, T.; Walker, S.; Gil-Garcia, J.R.; Mellouli, S.; Nahon, K.; Pardo, T.A.; Scholl, H.J. Understanding smart cities: An integrative framework. In Proceedings of the 2012 45th Hawaii International Conference on System Sciences, Maui, HI, USA, 4–7 January 2012; IEEE: Piscataway, NJ, USA, 2012; pp. 2289–2297. [Google Scholar]
- Batty, M.; Axhausen, K.W.; Giannotti, F.; Pozdnoukhov, A.; Bazzani, A.; Wachowicz, M.; Ouzounis, G.; Portugali, Y. Smart cities of the future. Eur. Phys. J. Spec. Top. 2012, 214, 481–518. [Google Scholar] [CrossRef] [Green Version]
- Seljeseth, M.; Yamin, M.M.; Katt, B. UIOT-FMT: A Universal format for collection and aggregation of data from smart devices. Sensors 2020, 20, 6662. [Google Scholar] [CrossRef]
- Nunes, D.; Teixeira, D.; Carneiro, D.; Sousa, C.; Novais, P. Decision intelligence in street lighting management. In World Conference on Information Systems and Technologies; Springer: Berlin/Heidelberg, Germany, 2020; pp. 501–510. [Google Scholar]
- Robinson, I.; Webber, J.; Eifrem, E. Graph Databases; O’Reilly Media, Inc.: Newton, MA, USA, 2013. [Google Scholar]
- Wirth, R.; Hipp, J. CRISP-DM: Towards a standard process model for data mining. In Proceedings of the 4th International Conference on the Practical applications of Knowledge Discovery and Data Mining, Manchester, UK, 18–20 April 2000; Springer: London, UK, 2000; Volume 1. [Google Scholar]
- Ivančáková, J.; Babič, F.; Butka, P. Comparison of different machine learning methods on Wisconsin dataset. In Proceedings of the 2018 IEEE 16th World Symposium on Applied Machine Intelligence and Informatics (SAMI), Kosice and Herlany, Slovakia, 7–10 February 2018; IEEE: Piscataway, NJ, USA, 2018; pp. 000173–000173. [Google Scholar]
- Dhahri, H.; Rahmany, I.; Mahmood, A.; Al Maghayreh, E.; Elkilani, W. Tabu search and machine-learning classification of benign and malignant proliferative breast lesions. BioMed Res. Int. 2020, 2020, 4671349. [Google Scholar] [CrossRef]
- Atiku, S.O.; Obagbuwa, I.C. Machine Learning Classification Techniques for Detecting the Impact of Human Resources Outcomes on Commercial Banks Performance. Appl. Comput. Intell. Soft Comput. 2021, 2021, 7747907. [Google Scholar]
- Sinnott, R.W. Virtues of the Haversine. Sky Telesc. 1984, 68, 159. [Google Scholar]
- Dubos, R. Social Capital: Theory and Research; Routledge: London, UK, 2017. [Google Scholar]
- Dijkstra, E.W. A note on two problems in connexion with graphs. Numer. Math. 1959, 1, 269–271. [Google Scholar] [CrossRef] [Green Version]
- Knight, C. Field surveys of the effect of lamp spectrum on the perception of safety and comfort at night. Light. Res. Technol. 2010, 42, 313–329. [Google Scholar] [CrossRef]
- Carneiro, D.; Sousa, C. The influence of external factors on the energy efficiency of public lighting. In Proceedings of the CAPSI’18—18th Conference of the Portuguese Association for Information Systems, Santarem, Portugal, 12–13 October 2018; CAPSI: Delhi, India, 2018; Volume 39. [Google Scholar]
- Mayer, H. Air Pollution in cities. Atmos. Environ. 1999, 33, 4029–4037. [Google Scholar] [CrossRef]
- Kampa, M.; Castansa, E. Human health effects on air pollution. Environ. Pollut. 2008, 151, 362–367. [Google Scholar] [CrossRef] [PubMed]
- World Health Organization. Ambient (Outdoor) Air Pollution. Available online: https://www.who.int/news-room/fact-sheets/detail/ambient-(outdoor)-air-quality-and-health (accessed on 4 September 2020).
- Department for Environment Food & Rural Affairs. Interactive Monitoring Networks Map. Available online: https://uk-air.defra.gov.uk/interactive-map (accessed on 4 September 2020).
- LeCun, Y.; Bengio, Y.; Hinton, G. Deep learning. Nature 2015, 521, 436–444. [Google Scholar] [CrossRef]
- Dobson, A.J.; Barnett, A.G. An Introduction to Generalized Linear Models; CRC Press: Boca Raton, FL, USA, 2018. [Google Scholar]
- Friedman, J.H. Greedy function approximation: A gradient boosting machine. Ann. Stat. 2001, 29, 1189–1232. [Google Scholar] [CrossRef]
- Breiman, L. Random forests. Mach. Learn. 2001, 45, 5–32. [Google Scholar] [CrossRef] [Green Version]
- Persson, C.; Bacher, P.; Shiga, T.; Madsen, H. Multi-site solar power forecasting using gradient boosted regression trees. Sol. Energy 2017, 150, 423–436. [Google Scholar] [CrossRef]
- Nieto, P.J.G.; García-Gonzalo, E.; Arbat, G.; Duran-Ros, M.; de Cartagena, F.R.; Puig-Bargués, J. Pressure drop modelling in sand filters in micro-irrigation using gradient boosted regression trees. Biosyst. Eng. 2018, 171, 41–51. [Google Scholar] [CrossRef]
- Pan, Y.; Chen, S.; Qiao, F.; Ukkusuri, S.V.; Tang, K. Estimation of real-driving emissions for buses fueled with liquefied natural gas based on gradient boosted regression trees. Sci. Total Environ. 2019, 660, 741–750. [Google Scholar] [CrossRef]
- Deng, L.; Yang, W.; Liu, H. Predprba: Prediction of protein-rna binding affinity using gradient boosted regression trees. Front. Genet. 2019, 10, 637. [Google Scholar] [CrossRef] [PubMed] [Green Version]
- Song, Y.; Zhou, H.; Wang, P.; Yang, M. Prediction of clathrate hydrate phase equilibria using gradient boosted regression trees and deep neural networks. J. Chem. Thermodyn. 2019, 135, 86–96. [Google Scholar] [CrossRef]
- Smidt, H.; Thornton, M.; Ghorbani, R. Smart application development for IoT asset management using graph database modeling and high-availability web services. In Proceedings of the 51st Hawaii International Conference on System Sciences, Hilton Waikoloa Village, HI, USA, 3–6 January 2018. [Google Scholar]
- D’silva, G.M.; Thakare, S.; Bharadi, V.A. Real-time processing of IoT events using a Software as a Service (SaaS) architecture with graph database. In Proceedings of the 2016 International Conference on Computing Communication Control and automation (ICCUBEA), Pune, India, 12–13 August 2016; IEEE: Piscataway, NJ, USA, 2016; pp. 1–6. [Google Scholar]
- Ueta, K.; Xue, X.; Nakamoto, Y.; Murakami, S. A distributed graph database for the data management of IoT systems. In Proceedings of the 2016 IEEE International Conference on Internet of Things (iThings) and IEEE Green Computing and Communications (GreenCom) and IEEE Cyber, Physical and Social Computing (CPSCom) and IEEE Smart Data (SmartData), Chengdu, China, 15–18 December 2016; IEEE: Piscataway, NJ, USA, 2016; pp. 299–304. [Google Scholar]
- Ali, S.; Wang, G.; Fatima, K.; Liu, P. Semantic Knowledge Based Graph Model in Smart Cities. In International Conference on Smart City and Informatization; Springer: Berlin/Heidelberg, Germany, 2019; pp. 268–278. [Google Scholar]
- Wen, C.; Liu, S.; Yao, X.; Peng, L.; Li, X.; Hu, Y.; Chi, T. A novel spatiotemporal convolutional long short-term neural network for air pollution prediction. Sci. Total Environ. 2019, 654, 1091–1099. [Google Scholar] [CrossRef]
- Maleki, H.; Sorooshian, A.; Goudarzi, G.; Baboli, Z.; Birgani, Y.T.; Rahmati, M. Air pollution prediction by using an artificial neural network model. Clean Technol. Environ. Policy 2019, 21, 1341–1352. [Google Scholar] [CrossRef]
- Cabaneros, S.M.; Calautit, J.K.; Hughes, B.R. A review of artificial neural network models for ambient air pollution prediction. Environ. Model. Softw. 2019, 119, 285–304. [Google Scholar] [CrossRef]
- Stolfi, D.H.; Alba, E.; Yao, X. Can I Park in the City Center? Predicting Car Park Occupancy Rates in Smart Cities. J. Urban Technol. 2020, 27, 27–41. [Google Scholar] [CrossRef]
Figure 1.
Overview of the main elements of the proposed architecture, from a data flow perspective.

Figure 2.
Detailed view of the streaming component of the architecture.

Figure 3.
Typical fluctuation of free parking spots in the Pier Deck parking lot during the day.

Figure 4.
Luminosity measured at pedestrian level without excluding the effects of ambient luminosity (Source: [35]).
Figure 4.
Luminosity measured at pedestrian level without excluding the effects of ambient luminosity (Source: [35]).

Figure 5.
Details of the prototype of the interface: (a) creating a hotspot of pollution in a given region of the city; (b) traffic routing with (minimizing distance); (c) traffic routing with (minimizing air pollution).
Figure 5.
Details of the prototype of the interface: (a) creating a hotspot of pollution in a given region of the city; (b) traffic routing with (minimizing distance); (c) traffic routing with (minimizing air pollution).

Figure 6.
Observed luminosity at pedestrian level for a randomly selected night, and luminosity predicted by the model (). (Source: [35]).
Figure 6.
Observed luminosity at pedestrian level for a randomly selected night, and luminosity predicted by the model (). (Source: [35]).

Figure 7.
Observed ambient luminosity (bottom line) and predicted luminosity at pedestrian level with different dimmings. (Source: [35]).
Figure 7.
Observed ambient luminosity (bottom line) and predicted luminosity at pedestrian level with different dimmings. (Source: [35]).

Figure 8.
Daily NOx and PM emissions at the different locations: observed NOx (blue)/predicted NOx (black) average values and observed PM (orange)/predicted PM (green) average values.
Figure 8.
Daily NOx and PM emissions at the different locations: observed NOx (blue)/predicted NOx (black) average values and observed PM (orange)/predicted PM (green) average values.


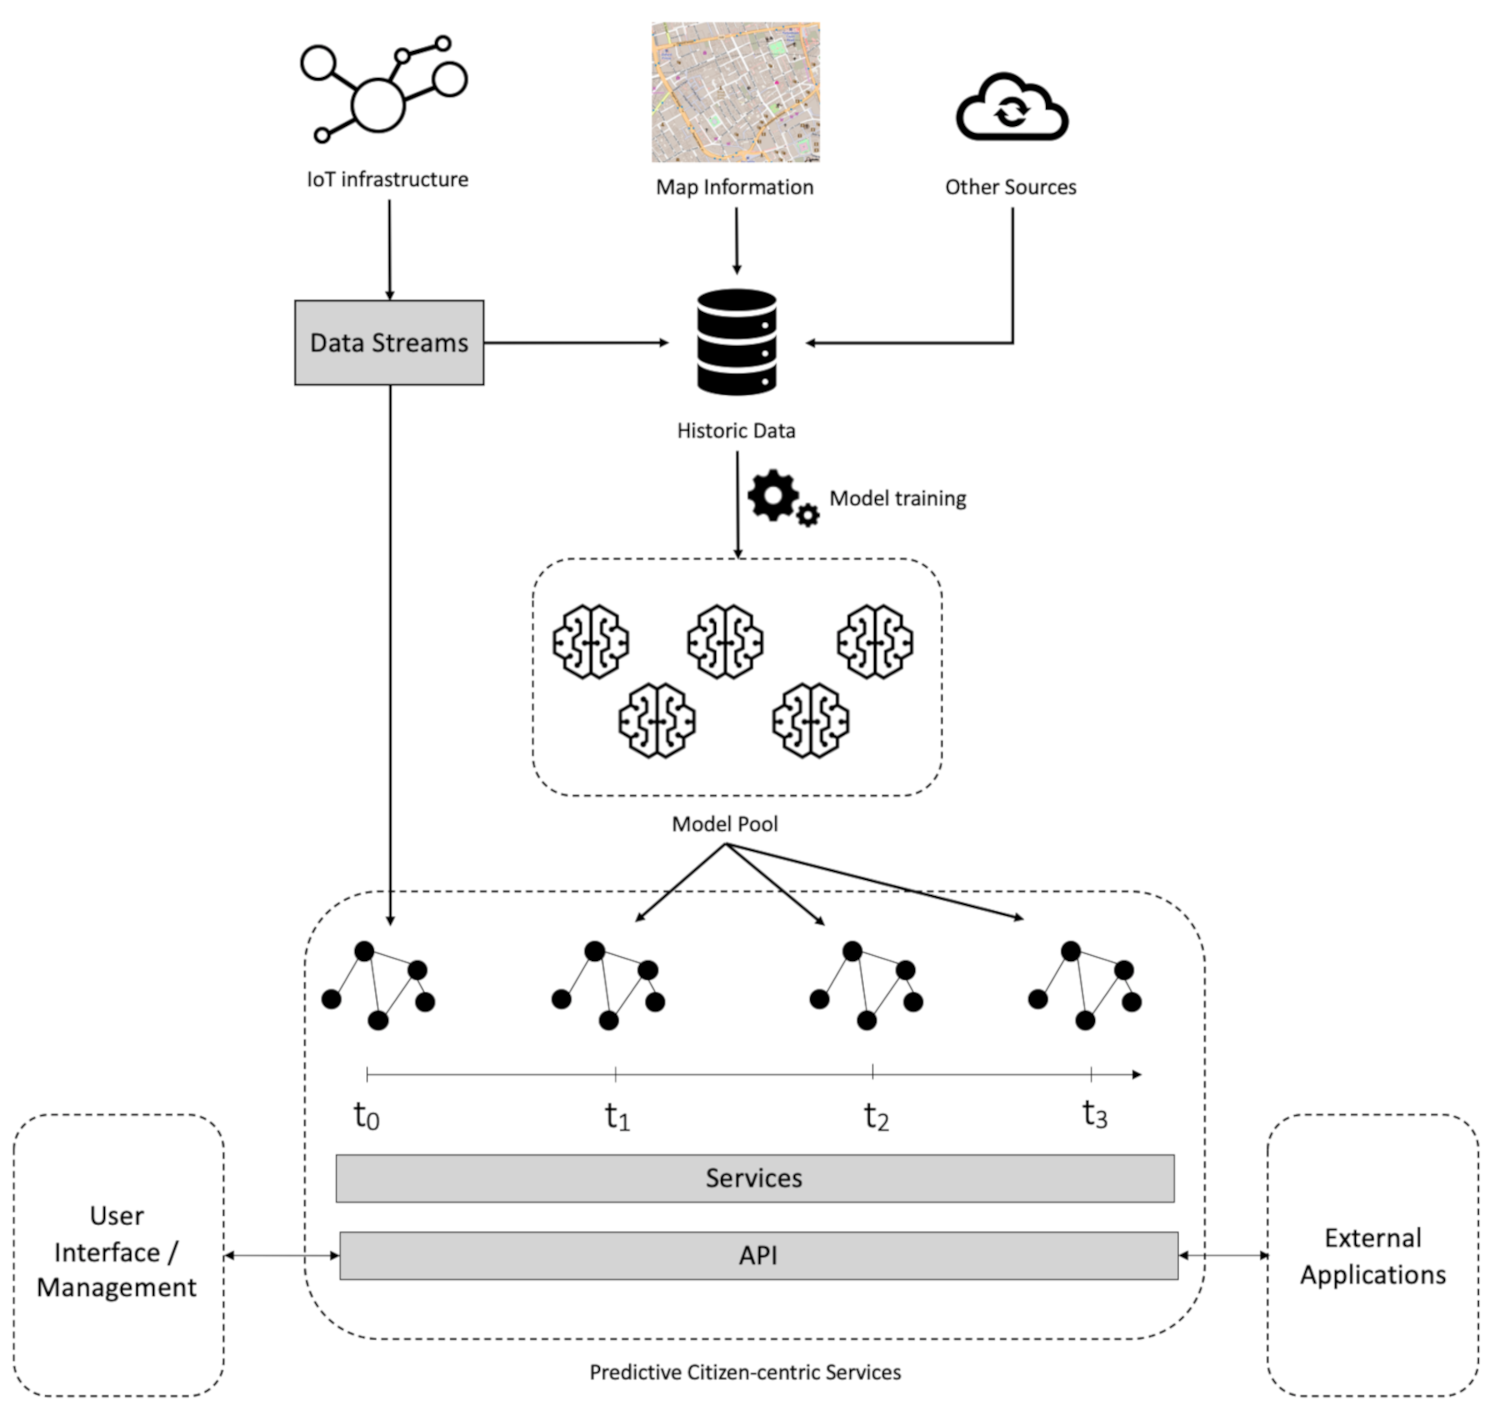
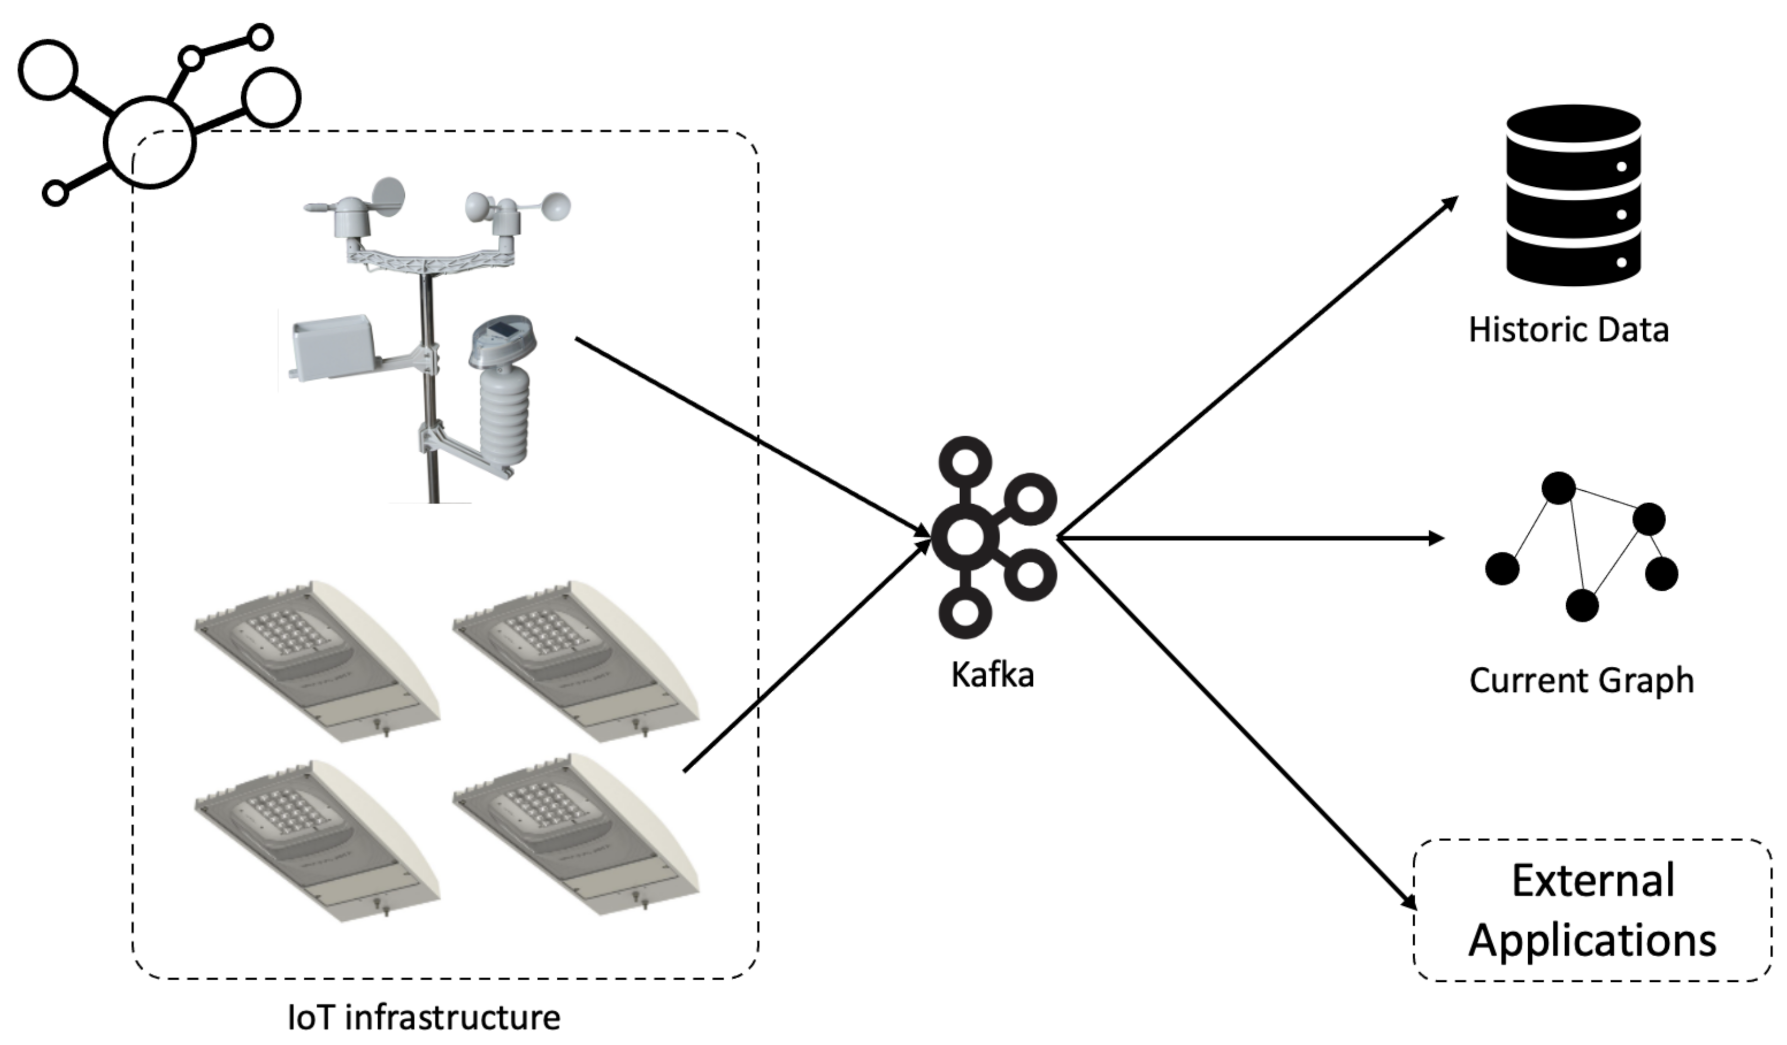
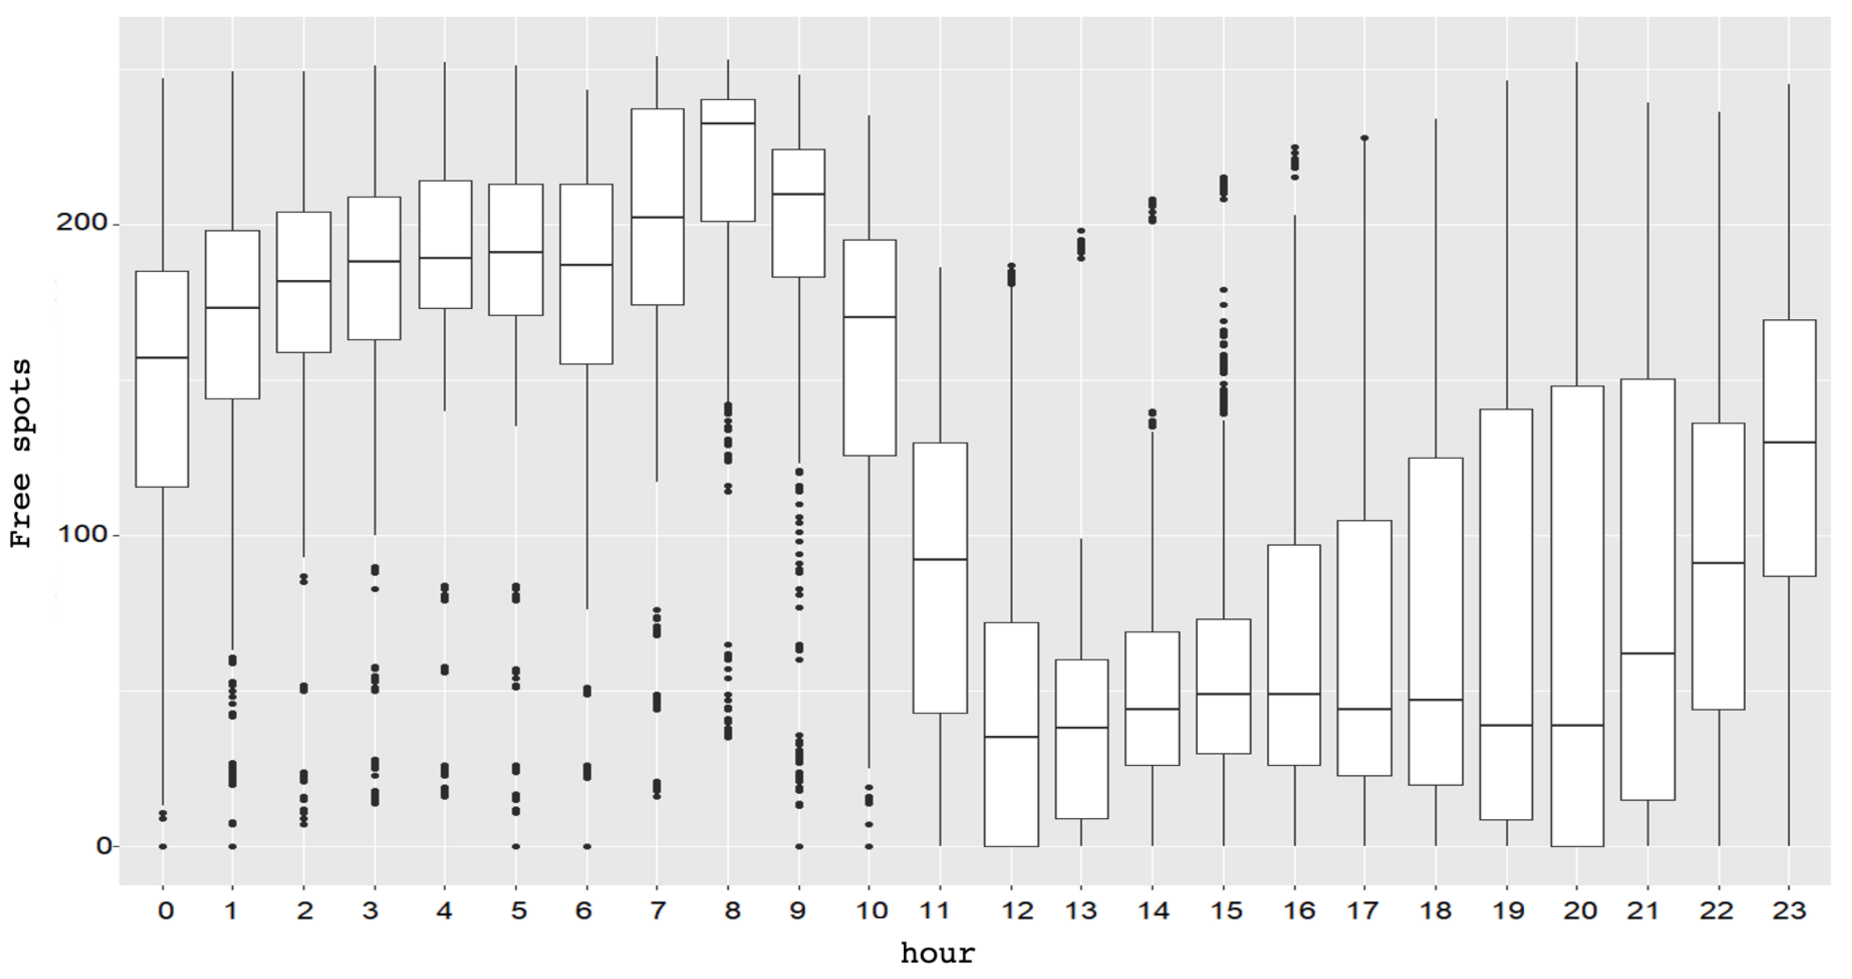
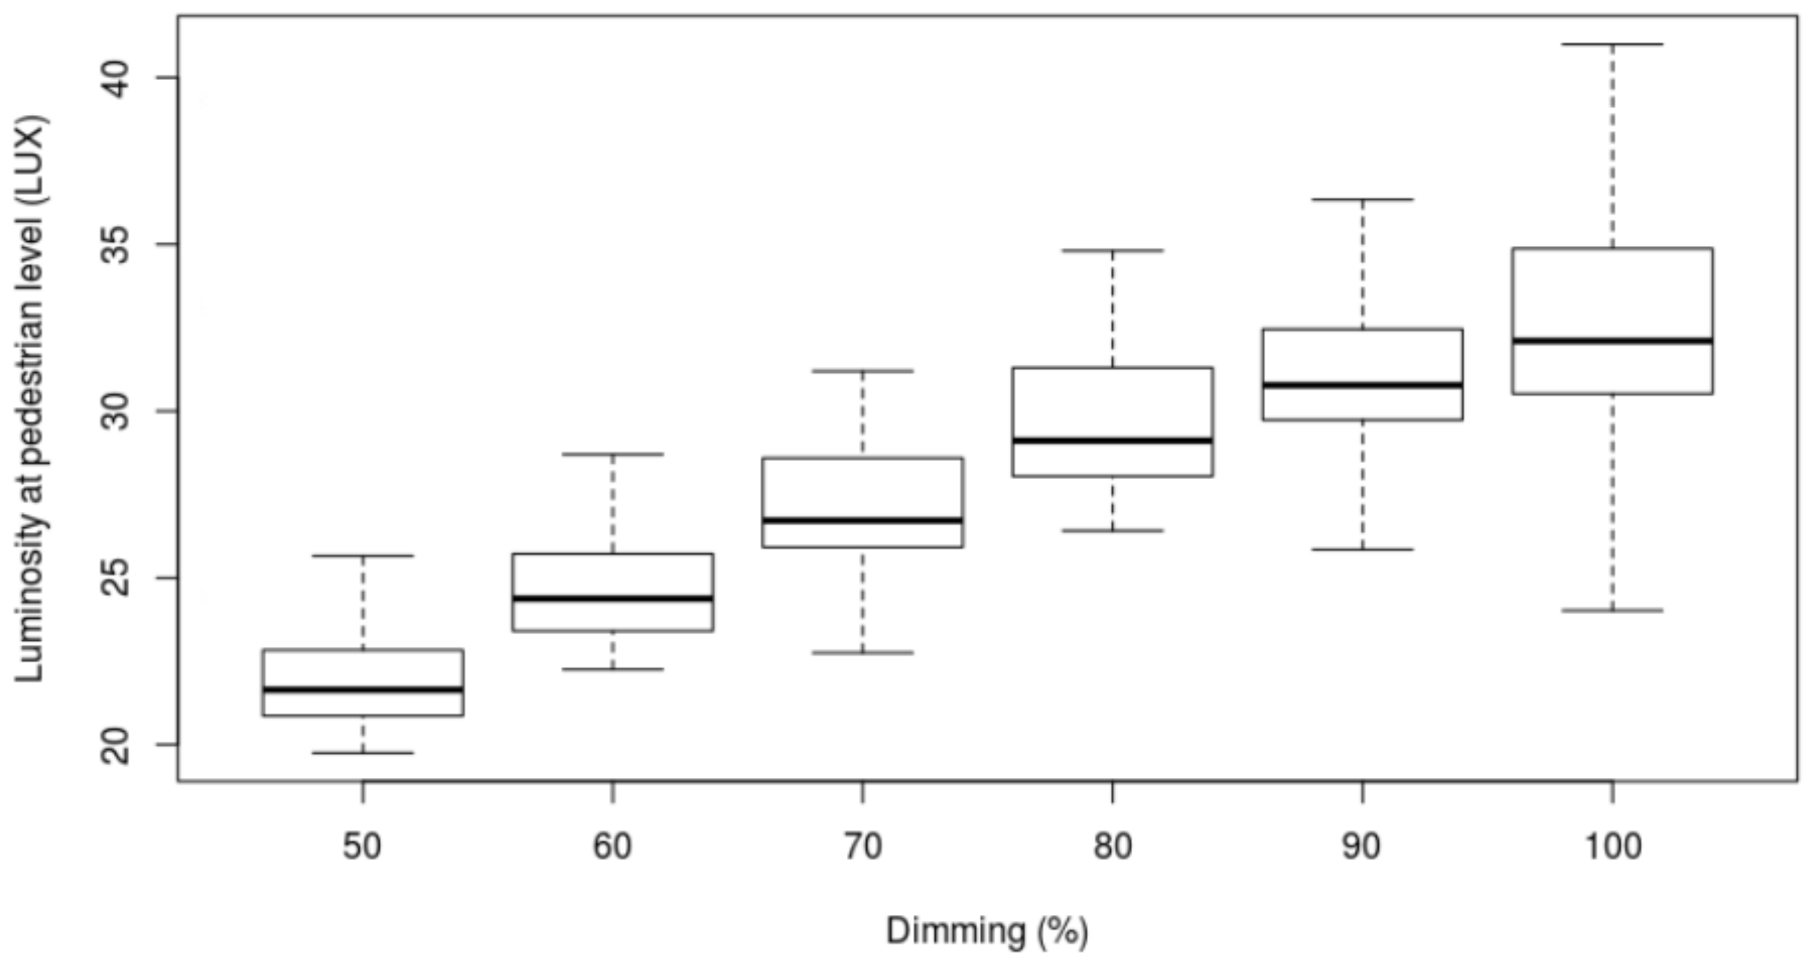
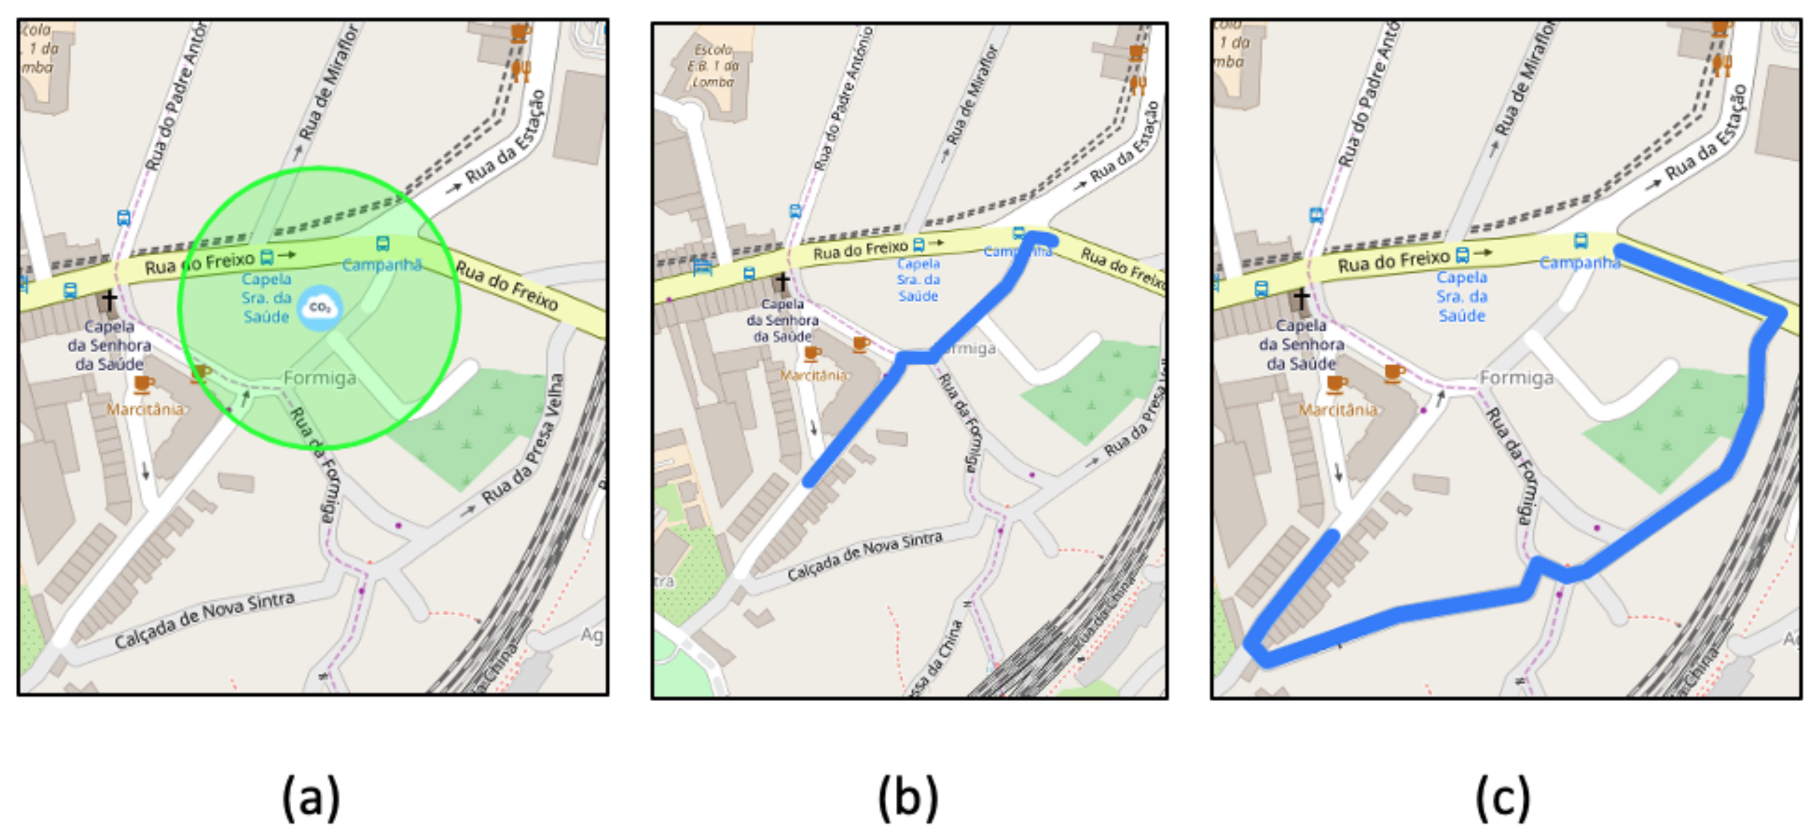
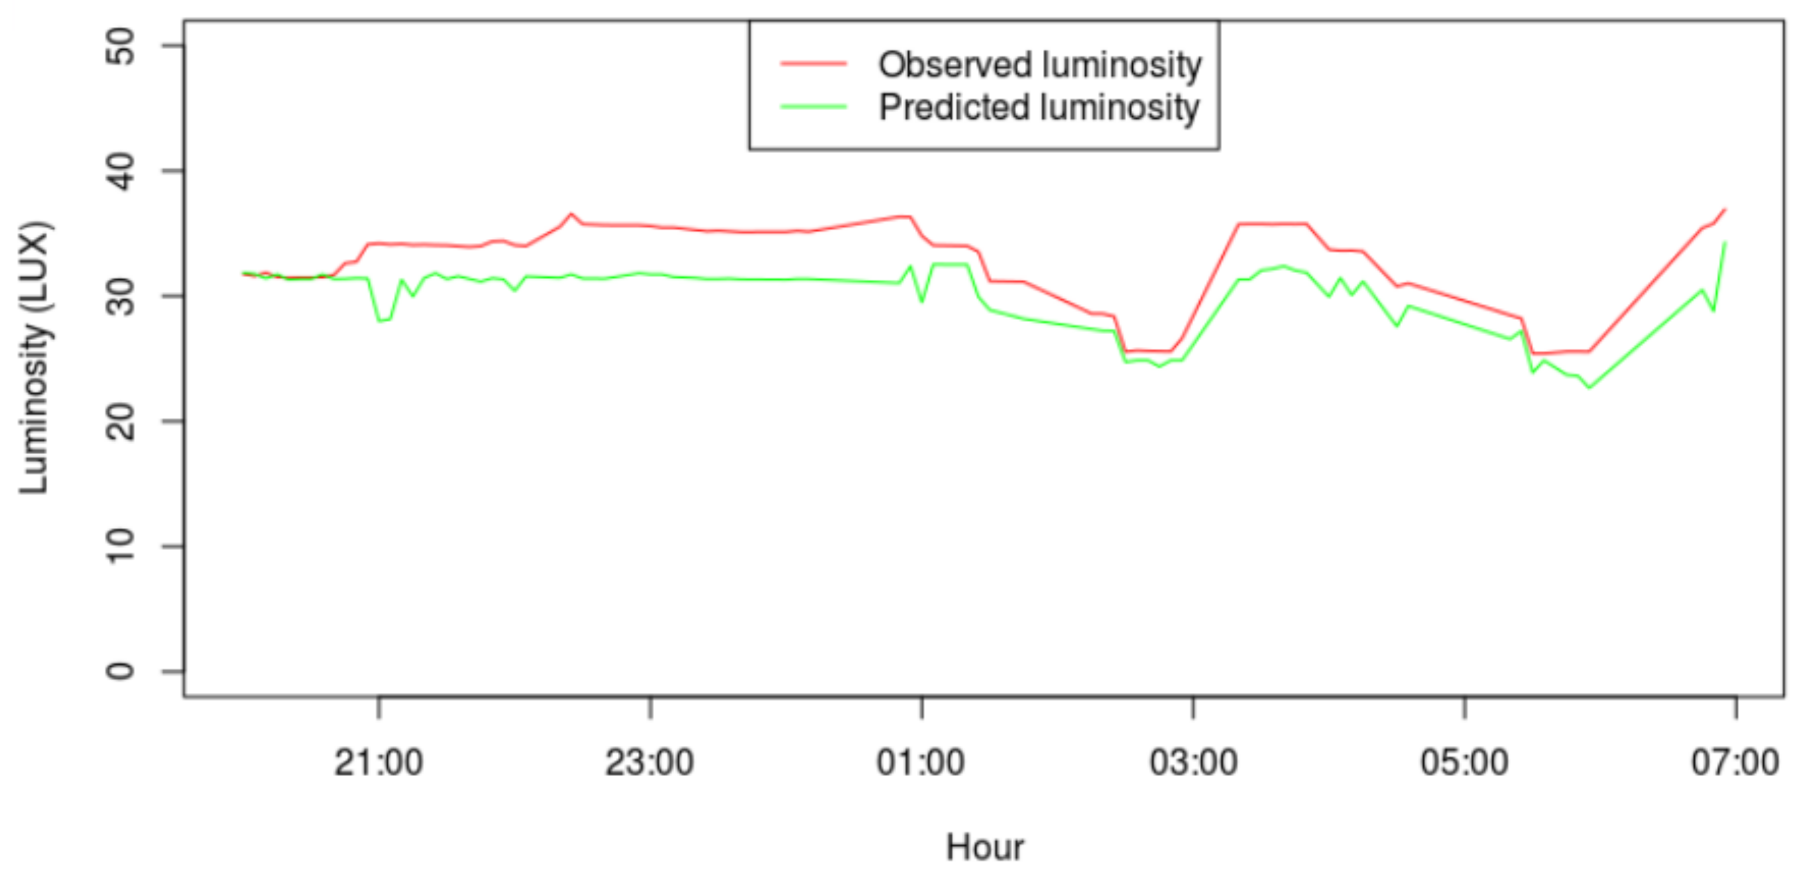
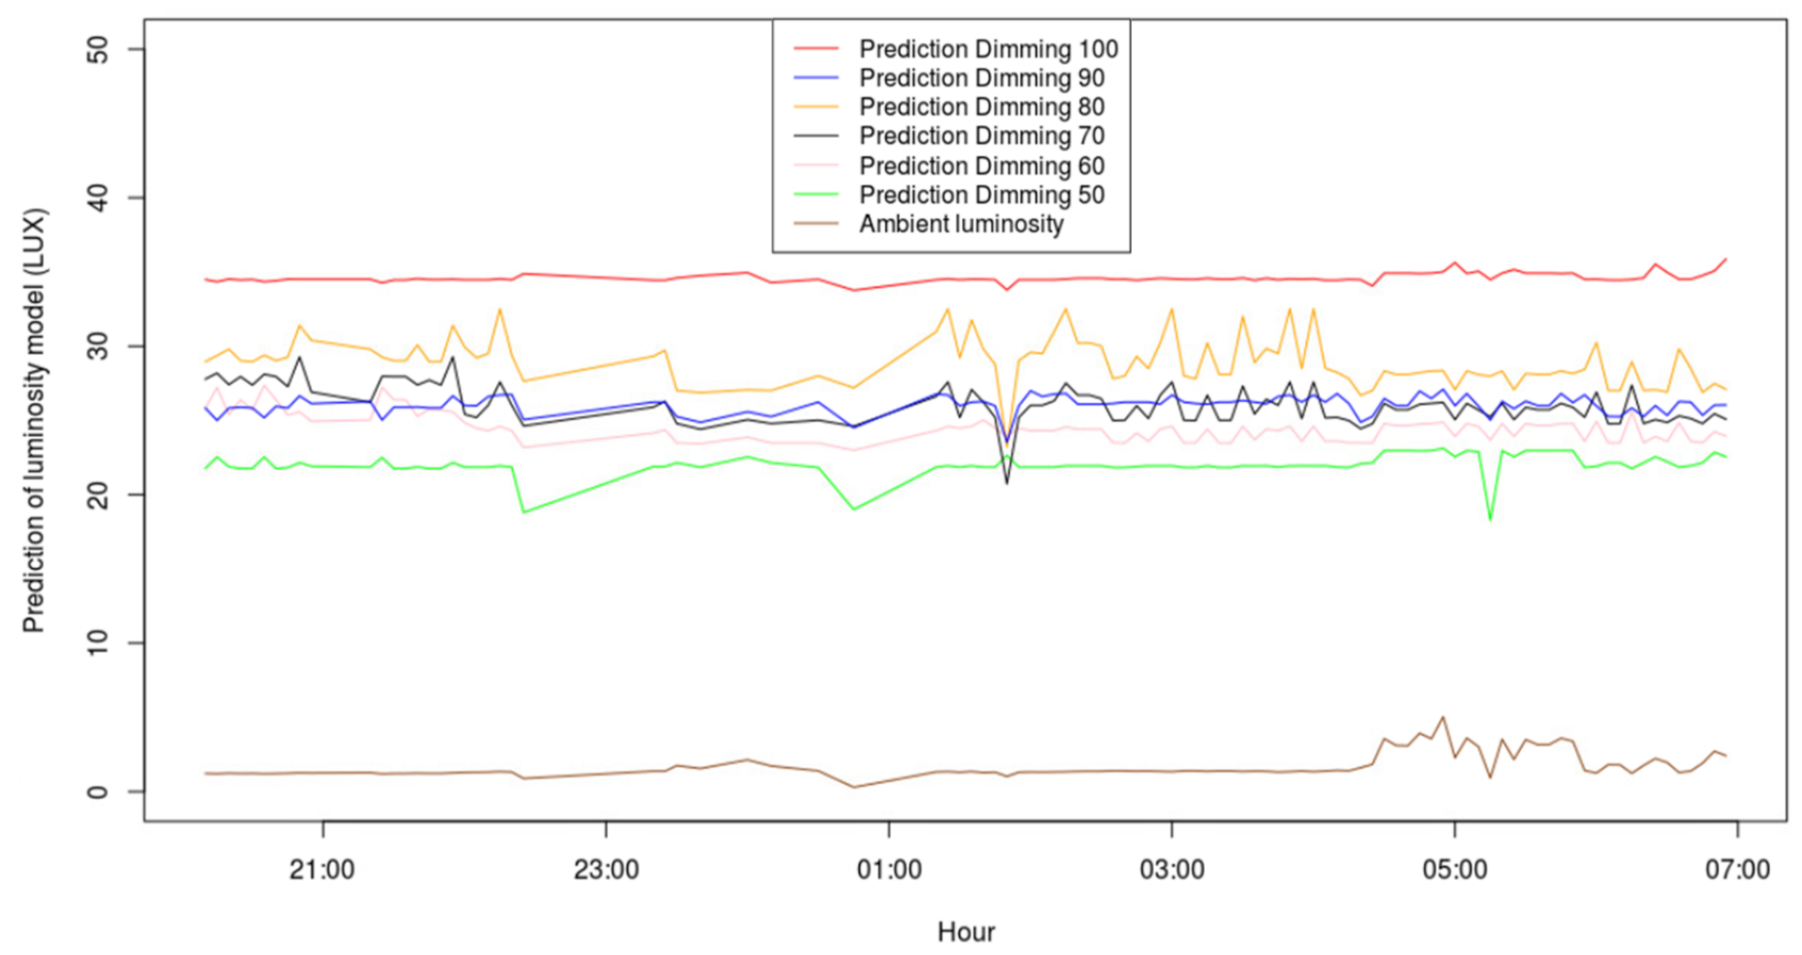
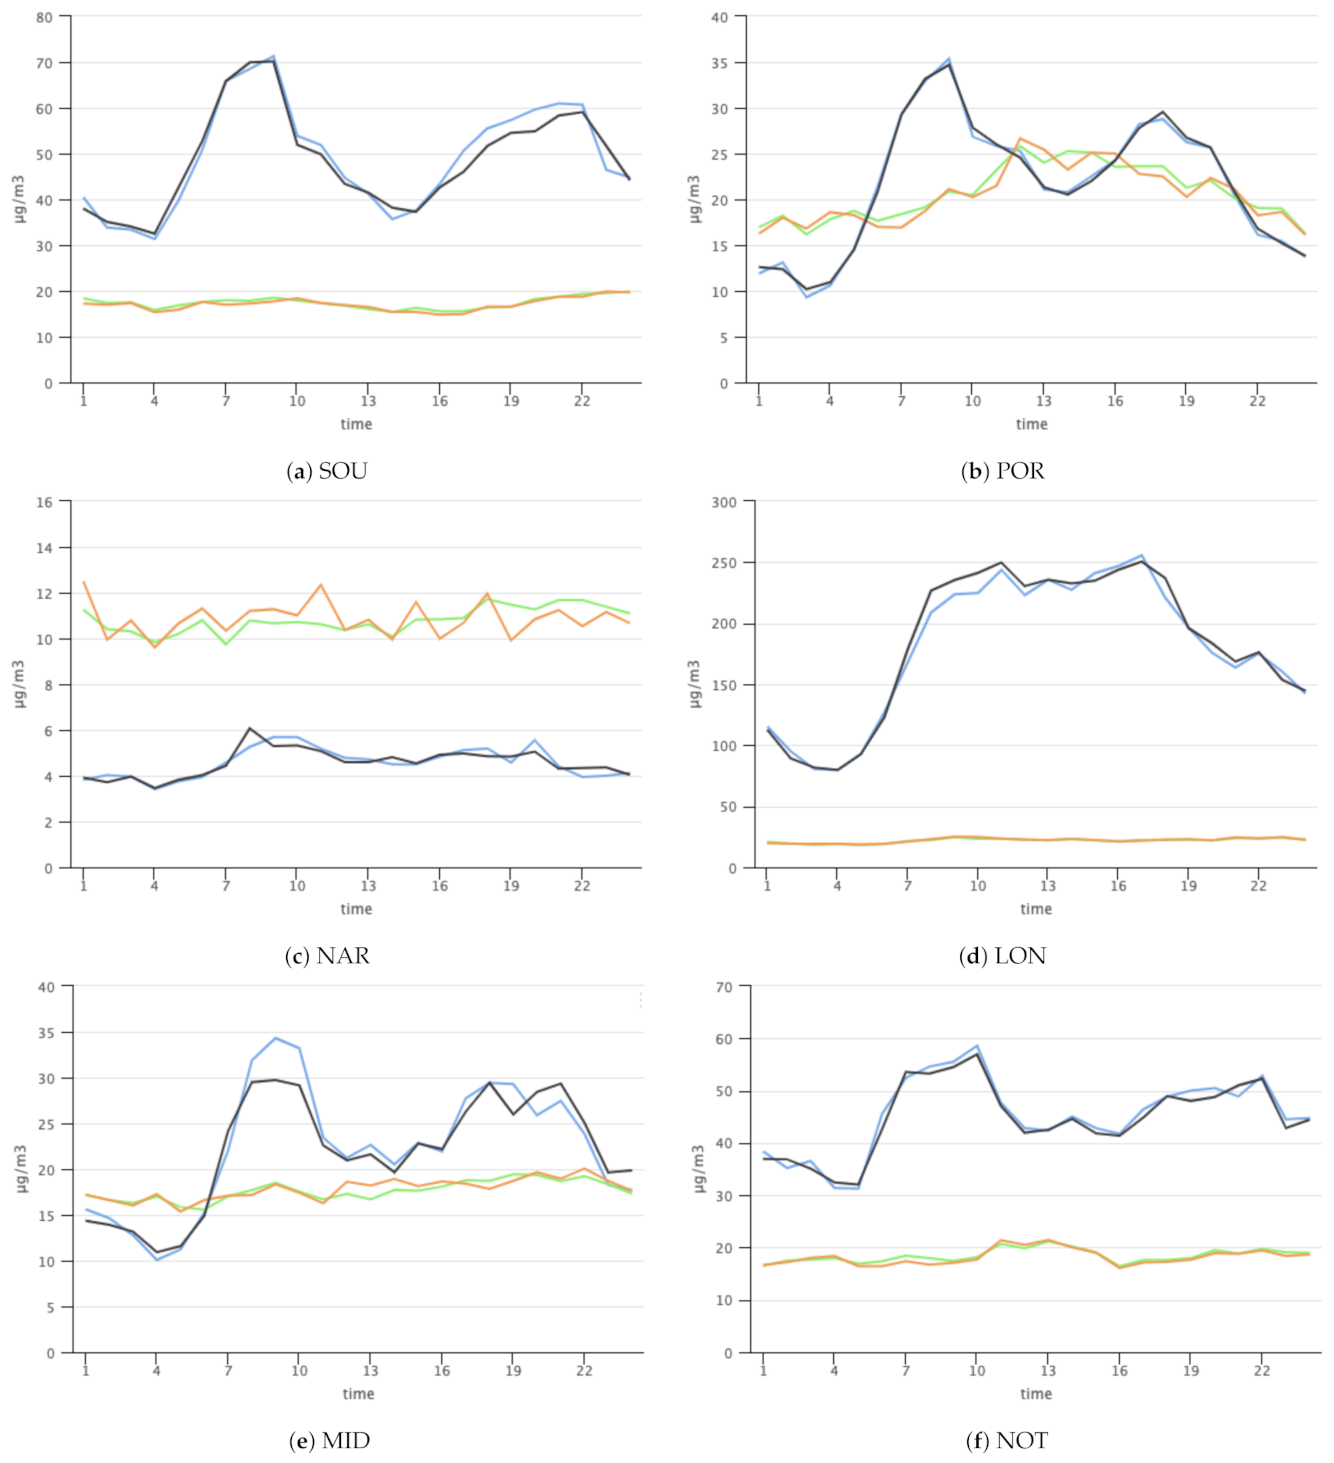
Table 1.
Main contributors to air pollution.
| Type of Pollutant | Sources |
|---|---|
| NOx | Power generation, industrial and traffic sources |
| SO2 | Burn of fossil fuels and melt of mineral ores |
| PM/PM | Combustion engines, solid-fuel and other industrial activities |
| O3 (sources of NOx and VOC) | Motor vehicle, industrial facilities and chemicals solvents |
Table 2.
Performance of the best configuration model found for each model after parameter optimization through grid search.
Table 2.
Performance of the best configuration model found for each model after parameter optimization through grid search.
| Model | MAE | |
|---|---|---|
| GLM | 0.56 | 137.27 |
| Deep Learning | 0.95 | 39.43 |
| GBM | 0.89 | 53.48 |
Table 3.
Performance measures obtained for each model (NOx and PM).
| Pollutant | Location | RMSE | Correlation | MAE | Error Rate (%) |
|---|---|---|---|---|---|
| NOx | SOU | 17.611 +/− 3.610 | 0.952 +/− 0.018 | 9.606 +/− 0.431 | 19.18 |
| POR | 8.566 +/− 1.347 | 0.901 +/− 0.022 | 5.230 +/− 0.287 | 22.4 | |
| NAR | 2.142 +/− 0.526 | 0.829 +/− 0.061 | 1.165 +/− 0.058 | 20.60 | |
| LON | 47.854 +/− 3.639 | 0.923 +/− 0.015 | 32.896 +/− 1.809 | 17.70 | |
| MID | 11.438 +/− 2.118 | 0.896 +/− 0.033 | 5.476 +/− 0.351 | 19.93 | |
| NOT | 15.536 +/− 2.175 | 0.939 +/− 0.015 | 8.674 +/− 0.449 | 17.58 | |
| PM | SOU | 5.932 +/− 0.841 | 0.844 +/− 0.040 | 4.107 +/− 0.166 | 21.68 |
| POR | 11.324 +/− 1.548 | 0.762 +/− 0.034 | 6.740 +/− 0.430 | 25.80 | |
| NAR | 4.143 +/− 0.291 | 0.874 +/− 0.011 | 2.796 +/− 0.088 | 23.22 | |
| LON | 6.301 +/− 0.582 | 0.866 +/− 0.027 | 4.140 +/− 0.108 | 17.11 | |
| MID | 5.516 +/− 0.259 | 0.896 +/− 0.033 | 3.881 +/− 0.107 | 19.93 | |
| NOT | 5.341 +/− 0.474 | 0.913 +/− 0.014 | 3.605 +/− 0.151 | 18.98 |
Publisher’s Note: MDPI stays neutral with regard to jurisdictional claims in published maps and institutional affiliations. |
© 2021 by the authors. Licensee MDPI, Basel, Switzerland. This article is an open access article distributed under the terms and conditions of the Creative Commons Attribution (CC BY) license (https://creativecommons.org/licenses/by/4.0/).
Share and Cite
MDPI and ACS Style
Carneiro, D.; Amaral, A.; Carvalho, M.; Barreto, L. An Anthropocentric and Enhanced Predictive Approach to Smart City Management. Smart Cities 2021, 4, 1366-1390. https://0-doi-org.brum.beds.ac.uk/10.3390/smartcities4040072
AMA Style
Carneiro D, Amaral A, Carvalho M, Barreto L. An Anthropocentric and Enhanced Predictive Approach to Smart City Management. Smart Cities. 2021; 4(4):1366-1390. https://0-doi-org.brum.beds.ac.uk/10.3390/smartcities4040072
Chicago/Turabian StyleCarneiro, Davide, António Amaral, Mariana Carvalho, and Luís Barreto. 2021. "An Anthropocentric and Enhanced Predictive Approach to Smart City Management" Smart Cities 4, no. 4: 1366-1390. https://0-doi-org.brum.beds.ac.uk/10.3390/smartcities4040072