Article

Barcelona under the 15-Minute City Lens: Mapping the Accessibility and Proximity Potential Based on Pedestrian Travel Times

1
Research Group on Mobility, Transportation and Territory (GEMOTT), Department of Geography, Universitat Autònoma de Barcelona, Cerdanyola del Vallès, 08193 Barcelona, Spain
2
Institute of Environmental Science and Technology (ICTA-UAB), Universitat Autònoma de Barcelona, Cerdanyola del Vallès, 08193 Barcelona, Spain
3
Barcelona Institute for Global Health (ISGlobal), 08003 Barcelona, Spain
*
Author to whom correspondence should be addressed.
Submission received: 25 November 2021 / Revised: 27 January 2022 / Accepted: 27 January 2022 / Published: 11 February 2022

Abstract

:
Many academics, urban planners and policymakers subscribe to the benefits of implementing the concept of the 15-Minute City (FMC) in metropolises across the globe. Despite the interest raised by the concept, and other variants of chrono-urbanism, to date, only a few studies have evaluated cities from the FMC perspective. Most studies on the subject also lack a proper well-defined methodology that can properly assess FMC conditions. In this context, this study contributes to the development of an appropriate FMC-measuring method by using network analysis for services and activities in the City of Barcelona (Catalonia, northeastern Spain). By using network analyst and basing our analysis on cadastral parcels, this study is able to detail the overall accessibility conditions of the city and its urban social functions based on the FMC perspective. The resulting spatial synthetic index is enhanced with the creation of partial indexes measuring the impact of education, provisioning, entertainment, public and non-motorized transport, and care facilities. The results show that most residents of this dense and compact city live in areas with proximity to services, that can clearly be labeled as FMC, although there are some shortfalls in peripheral areas. Results validate the FMC methodology as a viable method to highlight spatial inequalities at the microscale level, a valuable tool for the development of effective planning policies.

1. Introduction

The 15-Minute City (FMC) is a new holistic model for urban planning that gains momentum in the debates revolving around the development of sustainable cities. Aligned with chrono-urbanism, the ambition is to transform the city towards being a polycentric city, with major components that include proximity, capable of fulfilling its social functions in a more egalitarian way [1]. For this purpose, the main daily activities should ideally be located within 15 min on foot or by bicycle.
This concept was coined in 2015 by Carlos Moreno, professor at the Sorbonne University (Paris, France) and advisor to the French politician and Mayor of Paris (2014), Anne Hidalgo, who in turn used it as a political slogan for her successful re-election campaign in 2020 [2,3]. It is not surprising that there is interest aroused by this model among municipal administrations of medium and large cities around the world, and in the academic fields linked to urbanism and planning. The FMC has been seen as a potentially effective model that can respond to various Sustainable Development Goals (SDGs) and be adapted to the criteria defined in the New Urban Agenda, both approved by the United Nations [4]. This interest has increased exponentially as a result of the health crisis caused by COVID-19, due to the long period of confinement of the population in proximity environments and the need for a rapid adaptation of cities to new problems. The FMC also seems to respond well to these new socio-sanitary challenges [1,5,6], which is why the concept has gained great popularity [7].
Although necessary urban social functions to accommodate the benefits of the FMC concept have been specified [8], these should be adapted in accordance with the specificities of each city (geographical, urban, cultural, political, social, etc.), which opens the debate on how adaptable this idea is to any territory. Barcelona is no stranger to this debate, and in the present study, it is considered whether this large, dense, compact, and diverse Mediterranean city, where there has been a neighborhood policy and a program of decentralization of facilities for years, currently meets the requirements of the FMC. For this purpose, a novel method of accessibility analysis is put forward that is based on this new approach of the proximity of urban social functions, more specifically, those covered by activities and services. Furthermore, although in recent years there has been a boom in theoretical reflections revolving around the concept of FMC and hyperproximity [5,9,10,11], there is a lack of studies aimed at applying a systematic criterion to the practical analysis of the FMC [6,12,13,14].
For these reasons, the main objective of this study is twofold. The first objective is to develop a standardized quantitative method for the calculation of FMC values at a micro-scale level, and second is to explore whether the city of Barcelona and its neighborhoods already meet the criteria for being considered an FMC. To do so, a set of 24 indicators representing the six key FMC’s urban social functions were calculated. Publicly available georeferenced data from Barcelona’s City Council on the location of public and private facilities were used to measure the distances to each of the city’s cadastral parcels. The resulting synthetic coverage map represents accessibility levels at the building scale and is enhanced with the computation of a set of partial indexes measuring the partial access to the main components of the FMC concept, as follows: education, provisioning, entertainment, public and non-motorized transport, and care [8].

2. Background

Based on residents in urban settings having access to most or all their basic needs at a space-time distance of less than 15 min, on foot or by bicycle [2,3], the 15-Minute City (FMC) seeks to improve the quality of life of citizens thanks to the saving of time in their daily movements, the improvement of their health and the environment, the change towards active modes of transport, and more equal access to the various urban social functions [15]. For the conciliation of the new citizen needs, Moreno proposes the transformation towards a polycentric city characterized by proximity, diversity, density, and ubiquity [2]. Thus, it is committed to a planning model that promotes urban environments of proximity or hyper proximity, at the neighborhood scale where the territory is capable of fulfilling its most basic social functions such as housing, work, commerce, health, education, and entertainment [1].
Departing from the perspective of chrono-urbanism, the modern configuration of the FMC proposed by Moreno represents the culmination and combination of a heritage of classic concepts such as the neighborhood unit by Clarence Perry, or the urban vitality approaches of Jane Jacobs [10,16]. The origins of chrono-urbanism can be found in the work of Torsten Hägerstrand and his “geography of time” that emerged in the late 1960s [17], where he highlights the importance of the finiteness of space-time and its limiting effects on human interaction with territories. In the following decades, this discipline has been developed and proved especially useful in transport and accessibility studies [18].
The FMC adopts this space-time perspective of chrono-urbanism and applies it in the distribution of services in order to guarantee levels of accessibility to essential activities and at the same time adapts the configuration of the space to the various urban rhythms. The novelty brought by the FMC is that highlights the proximity of people to the various urban social functions [10]. This temporary focus also has the virtue of endowing the model with a better understanding and public acceptance.
More recently this same theoretical framework can also be found in other theoretical models of chrono-urbanism practices such as Plan Melbourne [19] with its 20-Minute Neighborhoods, based on walking, cycling, or public transport [20]. The approach of Singapore and Beijing combines a longer time threshold for commuting trips (45 to 60 min), and a shorter time threshold for local daily trips (15–20 min) [21,22]. Similar initiatives can be found in Shanghai’s 15 min walk range circle at the community level, or Guangzhou’s basic life circles that span from 30 walking min in rural communities to 15 walking min in urban communities [23]. Mid- to small-sized cities, such as Fredrikstad in Norway, Kilkenny, Tralee, Carlow, or Ennis in Ireland [24], or Hayward and Kalamazoo in the US, have also implemented minute-based time policies. The City of Portland (US) describes their Complete Neighborhoods program as the capacity to access key pre-defined destinations in less than 20 min [25] and even more cities, such as Copenhagen, Rotterdam, Malmö, Vienna, Montreal, Valencia, or Barcelona aim to use the same principles as a tool to abandon the need for the private car [26].
Although the concepts of FMC and hyperproximity have attracted a considerable amount of theoretical debate [5,9,10,11], not many studies have tried to systematize and apply the theoretical conceptualization of the FMC into practice using publicly available spatial information [12,13]. Among the little evidence, some studies analyze the territorial distribution of the prerequisites of proximity such as residential density [12,27], with a focus on the socioeconomic characteristics of the population, mobility, and proximity to basic services [13], or by using both optics in an integrated way [6]. Finally, another relevant and unique study explored the relationship between origin-destination mobility flows and local urban accessibility in Barcelona at the neighborhood level [14]. This study showed how mobility patterns in most neighborhoods in Barcelona are explained by differences in accessibility to different types of amenities.
However, many theoretical and methodological questions remain unresolved, as follows: should the FMC criteria adapt to the geographical, urban, cultural, political, social, etc. specificities of each city? Should Euclidean distances or network-based distances be used? Should all urban services and activities be at the same distance (15 min distance)? What is the optimal spatial scale of analysis? Building blocks or harmonized grid systems? In this line, the present study will propose a methodological approach for the calculation of FMC requirements at a cadastral parcel level to later analyze the meeting of these criteria of the city of Barcelona and its neighborhoods.
Revising the available literature, coverage analysis is the most utilized method to identify the urban areas covered by proximity services. Some studies use radial metric distances between services and residents without taking into account urban morphology [6,28] or based on isochrones, whereby the location of residents and the density of services are linked [13]. Among all the methods, those used by Li et al. [29] and especially Capasso Da Silva et al. [30] stand out, with measurement of accessibility to services based on network analysis, which allows researchers to accurately assess the areas that are accessible and account for the location of activities and residents.
In terms of defining the distance to different services, most sources apply a different Euclidean distance for each destination category. This method aims to consider the different frequency of use, the type of user, the essential nature of the service, or the distance people are willing to walk to access each service. This disparity of distances limiting the area of proximity according to services is in accordance with the work of Moreno et al. [1], in defending flexibility for the definition of times; Capasso Da Silva et al., who affirm that “accessibility is a metric, but what are acceptable parameters for what is considered accessible must be established through policies” (p. 1, [30]); or in the “20-Minute Neighborhood” program of the City of Eugene (Oregon, USA) that applies distances of ¼, ½, and 1 mile depending on various services [31]. It should be appreciated that the travel times defining the proximity space could (and should) be less than 15 min [27,32]. Ryley [33] identifies short trips as those taking less than 10 min, in Melbourne’s “20-Minute Neighborhoods”, where 10 min to one way and 10 min return are counted [33]. From the new urbanism, the 5 min is taken as a reference for the scale defining the neighborhood space of each person [3]. Additionally, depending on the characteristics of each city, we can suggest that the useful distance for imagining improvements in a large city such as Melbourne, does not have to be identical in a compact city such as Barcelona [20,34]. The last determining factor in the measurement of spatio-temporal distances is the mode of transport; the 15 min on foot or by bicycle represent different physical distances due to the difference in speeds. From the FMC approach, access on foot to local services is considered essential, while the use of bicycles is considered as access to city-scale services. Within this logic, most of the sources consulted are based exclusively on movements on foot, which would guarantee almost universal accessibility [35].

3. Materials and Methods
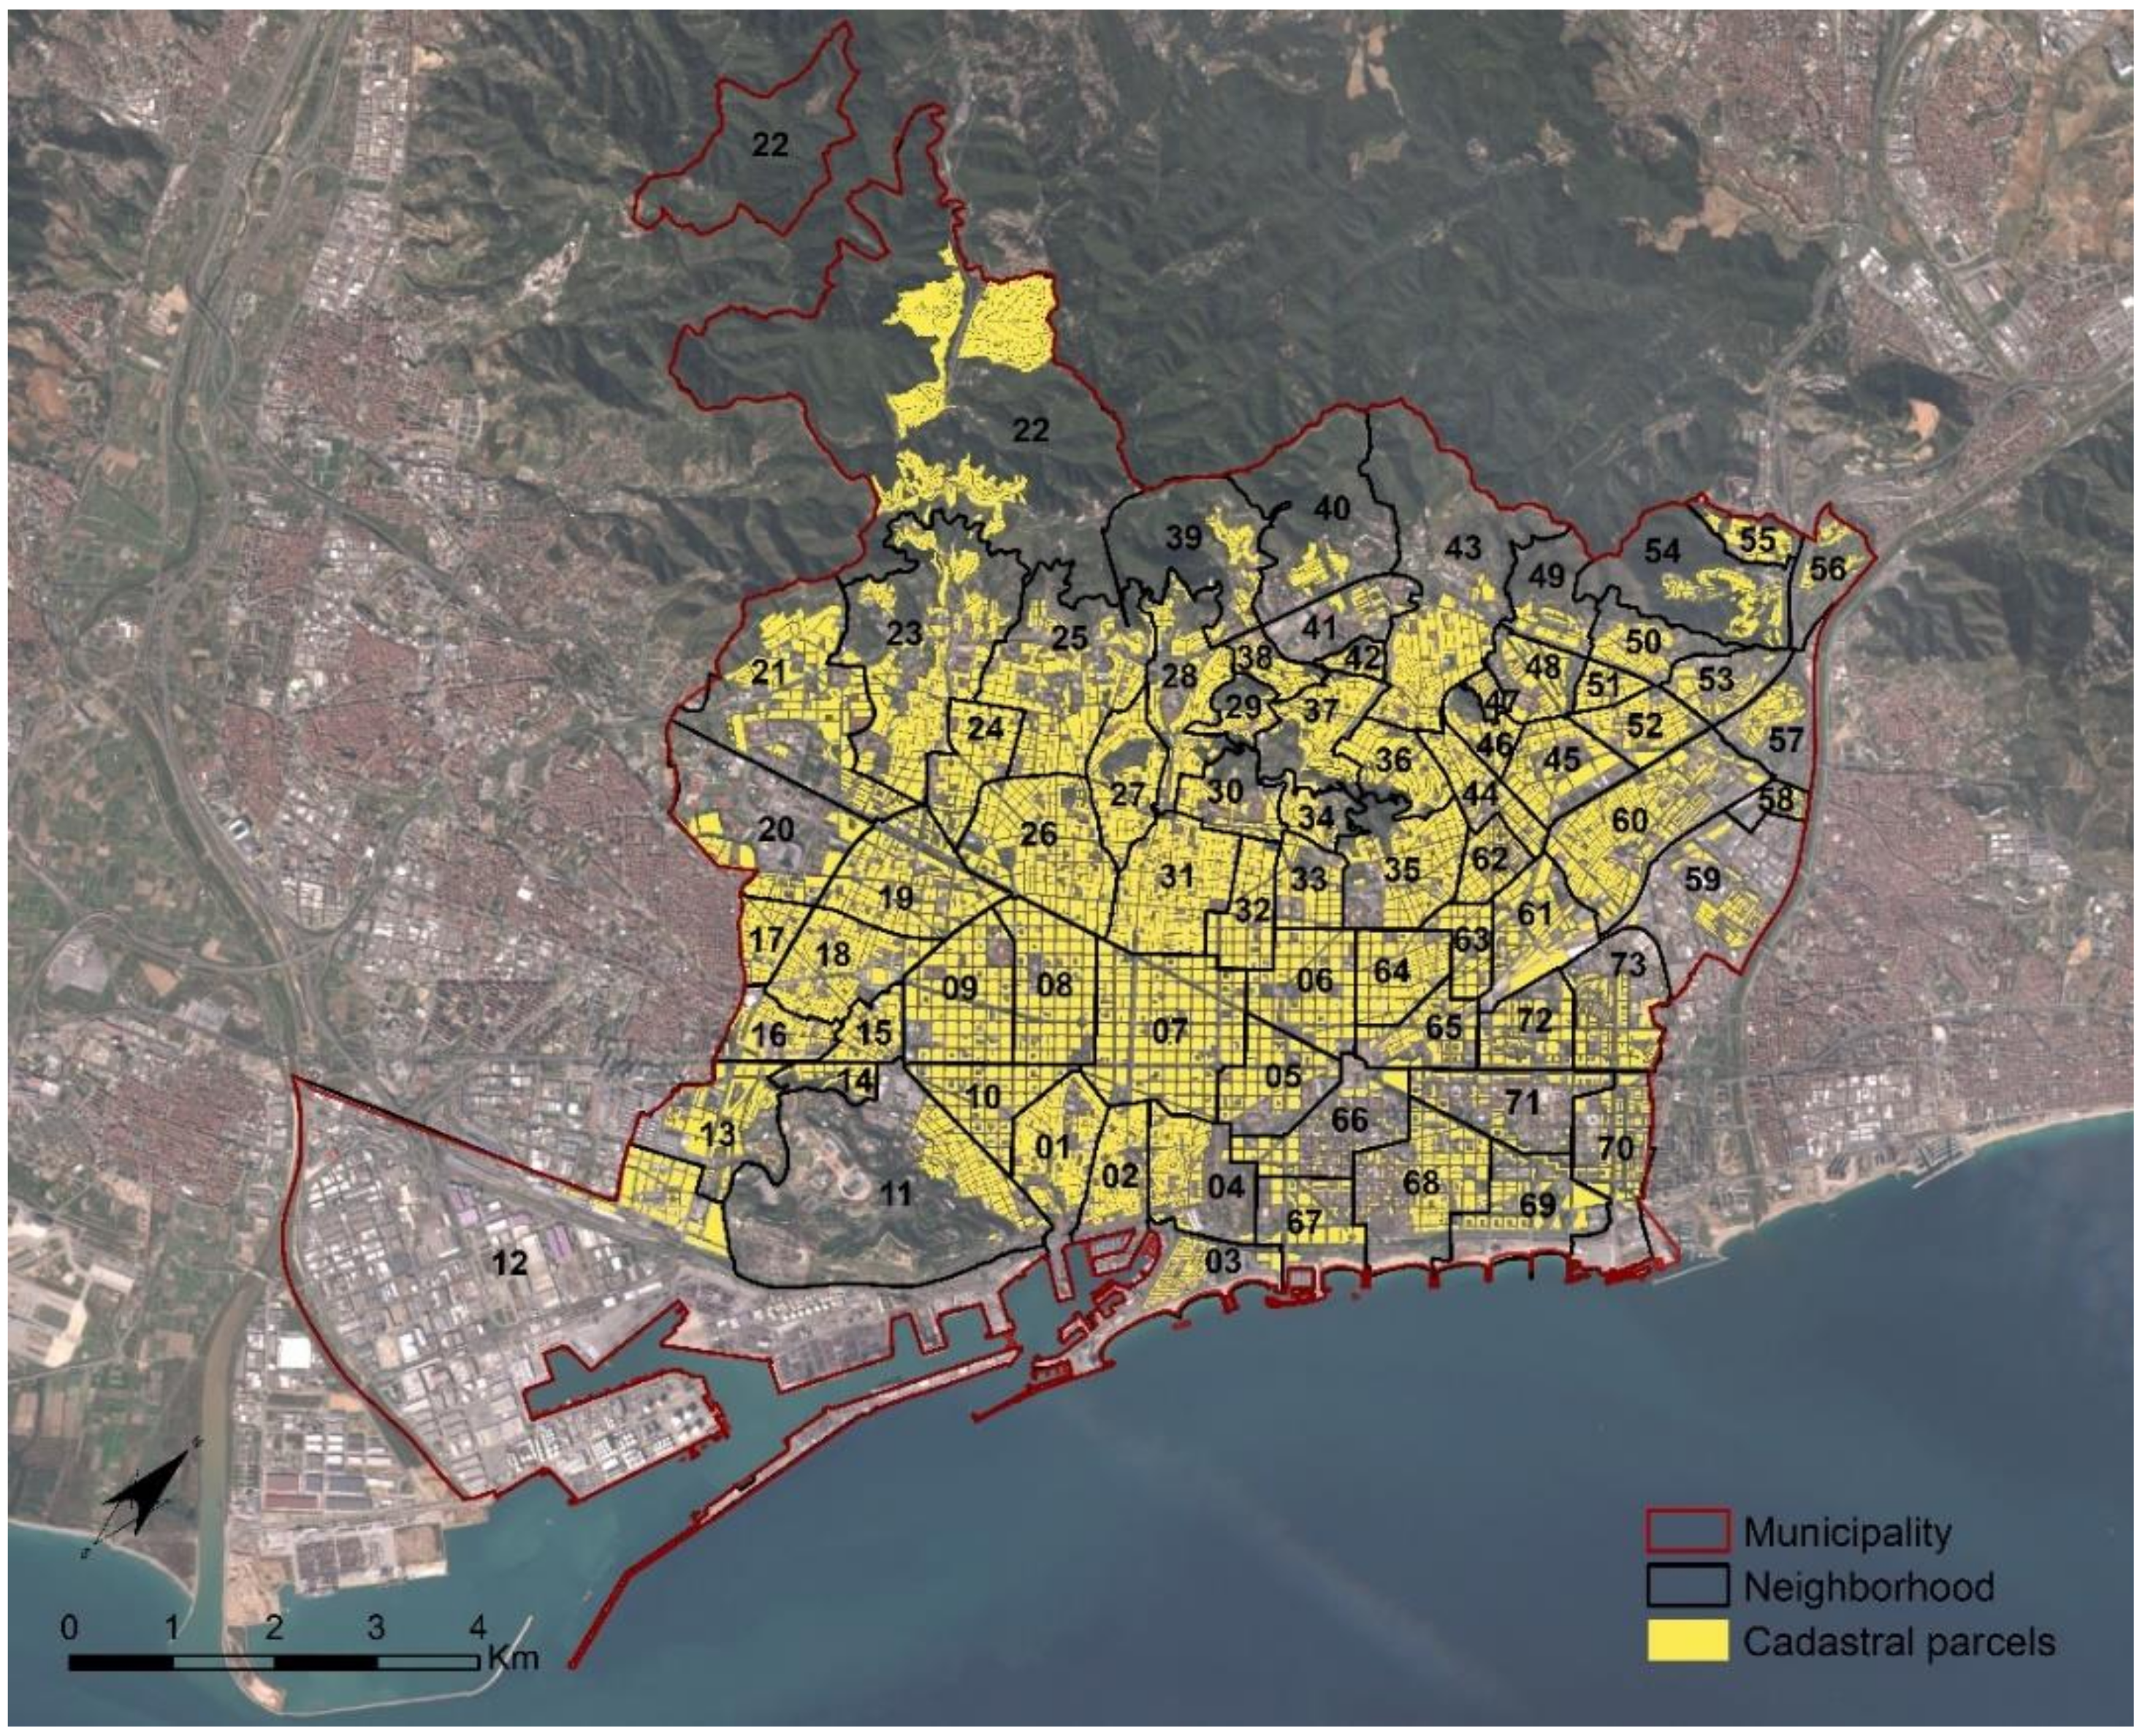
3.1. Study Area

The City of Barcelona is located in the northeast of the Iberian Peninsula. The municipal area covers 101.35 km2 and is mostly urbanized, forming an urban continuum with neighboring municipalities to the northeast and southwest, and is the center of an extensive metropolitan region (i.e., Barcelona Metropolitan Area, AMB in Spanish; Figure 1). Like other Mediterranean cities, Barcelona is characterized overall for being a traditional city with a compact and continuous urban morphology, a high population density, a mixture of land uses, and a commercial structure based on small businesses [36], characteristics that enhance proximity movements [37]. Mobility surveys show us that more than one-third of trips in the city are less than 10 min duration and 76% of these are carried out using non-motorized modes of transport [27]. Its population with 1,664,182 inhabitants (Statistical Institute of Catalonia with Spanish acronym: IDESCAT [38]) is distributed across 73 neighborhoods (see Figure 1 and Table A1 in Appendix A to see the full list of neighborhood codes and names of Barcelona). The neighborhood serves as a territorial unit for the planning of local facilities and services of the city [39]. At the neighborhood level, a certain heterogeneity is identified with regard to the urban vitality proposed by Jacobs, following a center-periphery logic, in which the greatest vitality occurs in the traditional centers (i.e., historic center and the municipalities annexed at the start of the 20th century), medium vitalities occur in the Eixample (Expansion in Catalan) neighborhoods and the surroundings of the hills to the north, and low vitalities in the city limits, maritime waterfront (and harbor), and the 22@ technological and innovation district created in 2000 [40].

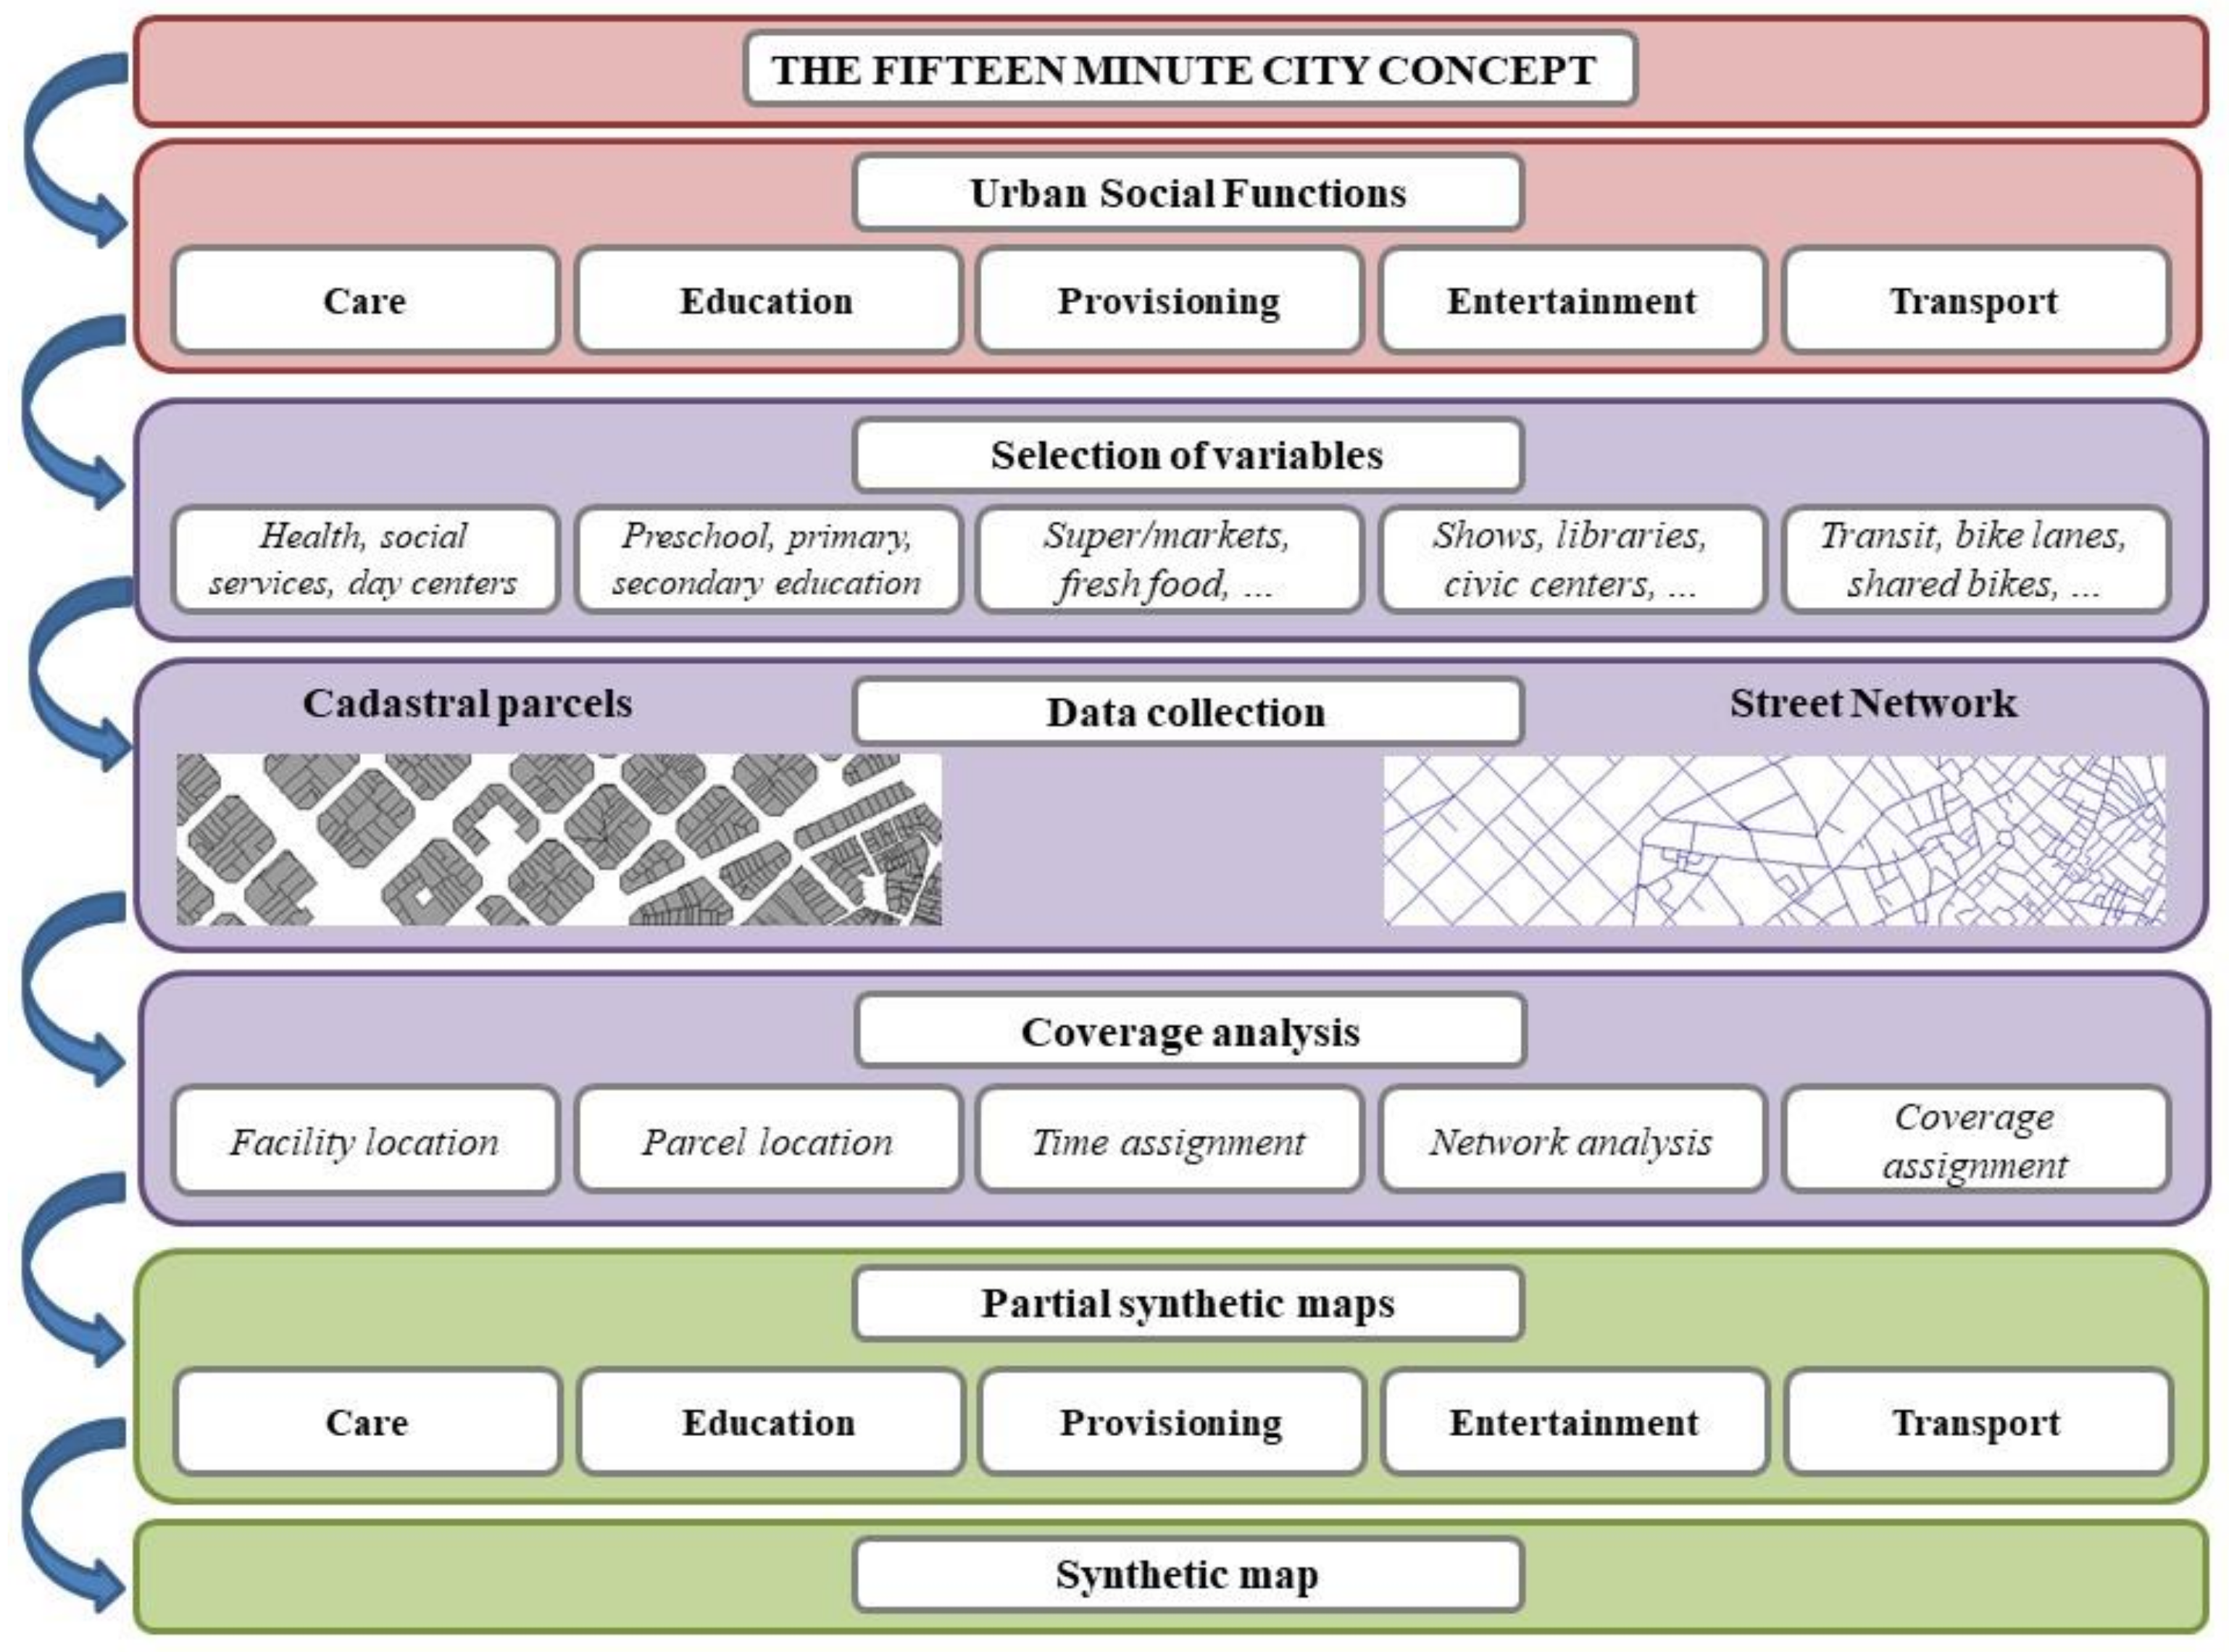
3.2. Methodological Approach

3.2.1. Selection of Indicators for the FMC’s 5 Urban Social Functions

The consulted bibliography has allowed us to observe a certain consensus in the selection of urban social functions, variables, and travel times that can determine their functional proximity, while always being conditioned in each case to the availability of detailed data sources. However, certain divergences have been also detected. In those cases, we prioritized those studies whose variables are most similar to those available for Barcelona; otherwise, we aimed those studies with a focus on the western Mediterranean cities and, particularly, of Spain.
Figure 2 summarizes the proposed methodological approach of this research. Of the 6 urban social functions defined by Moreno et al. [1], it was decided to select and analyze care, education, provisioning, and entertainment. The analysis of functions such as work and living was ruled out due to the lack of detailed georeferenced data and specificity in the definition of accessibility criteria for home or proximity work. On the other hand, access to public and non-motorized transport is also included as a set of components of access to sustainable mobility.
Table 1 shows the selection applied in the present study with the 5 urban social functions and the corresponding 24 variables of facilities, services, and stores and the assigned temporal thresholds. The specific indicators represent the access of the residential parcel to the various variables within the established time. These municipal statistical and cartographic data for the City of Barcelona (abbr. BCN), accessible through the open data portal: Open Data BCN [42], make up the bulk of the primary sources used.
The selection of indicators with their proximity time ranges is based on previous studies in cities such as Málaga [6], Valencia [28], and the sustainability indicators for Spanish cities that are designed by Barcelona’s Urban Ecology Agency [43,44] and other similar models of chrono-urbanism that apply a distance of proximity to activities and services outside Spain [29,30,45]. Following these criteria, the hyper-proximity access criterion (5 min) has been applied to more than 50% of the types of daily activities.
Due to the large volume of data and diversity of activities, the thematic groups, and original activities of the Census of Economic Activities at Street Level in Barcelona (name translated from Spanish) [46] have been taken into account to determine the proximity to shops and provisioning services. We have excluded those activities in which the end-user or consumer is not a resident (business services, wholesale, construction, etc.), as well as activities that are of occasional use (communication centers, souvenir shops, antique outlets, etc.).

3.2.2. Measurement of Distances to the FMC’s 5 Urban Social Functions

For the precise measurement of accessibility, the following 4 basic elements have been used: supply points (the location of services), potential demand points (the location and distribution of Barcelona residents), the distance between supply and demand (walking time and speed), and the transport network (pedestrian-tolerant roads) [47].
The service offering (supply) points were entered as vector layers of points into a geographic information system (GIS; ESRI ArcMap 10.7) from the coordinates provided in the various databases. The location of squares and parks was extracted from the data processing of the Urban Map of Catalonia (MUC is the Spanish acronym) [48], creating new polygonal layers selecting the systems of public free spaces delimited by the MUC, of more than 1000 m2 and 10,000 m2. From the resulting polygonal layer, the multiple vertices on the perimeter of each polygon were transformed into location points [30].
For the residents’ locations, we included all cadastral parcels and centroids were generated for each parcel to permit calculation of the service areas of each urban function.
Using the capabilities of ESRI’s ArcMap Network Analyst tool [49], we modeled a pedestrian road graph assigning a travel cost equivalent to the walking speed of 1.25 m/s or 4.5 km/h (2.796 mi/h) This speed range corresponds to the walking speed of an adult in an urban environment and is consistent with other mobility and transport engineering studies [11,50].
For each variable of the services for urban functions (facilities), a service area was generated, defining different types of influence zones (buffers). In the present study, buffers linked by unique cut-off values (5, 10 or 15 min according to each indicator) were used, with an extension beyond the limits of the 100-m network for the correct inclusion of the centroids of residential parcels.

3.2.3. Systematization and Mapping of the 5 FMC’s Urban Social Functions

Spatial joins were made from the residential centroids with each generated buffer, to determine the inclusion (coverage or access), or exclusion (Yes/No), of each parcel in the various areas of influence corresponding to the different urban functions.
With this information, a synthetic result map of the FMC showing the accessibility of all the cadastral parcels of the city to the set of 24 indicators was also calculated. This index was composed of another set of result maps prepared for each of the 5 urban social functions, in the form of partial indices, calculated as the number of variables within each social function that are simultaneously accessible from each parcel in a range of time. These partial maps can be consulted in the Supplementary Materials.

4. Results

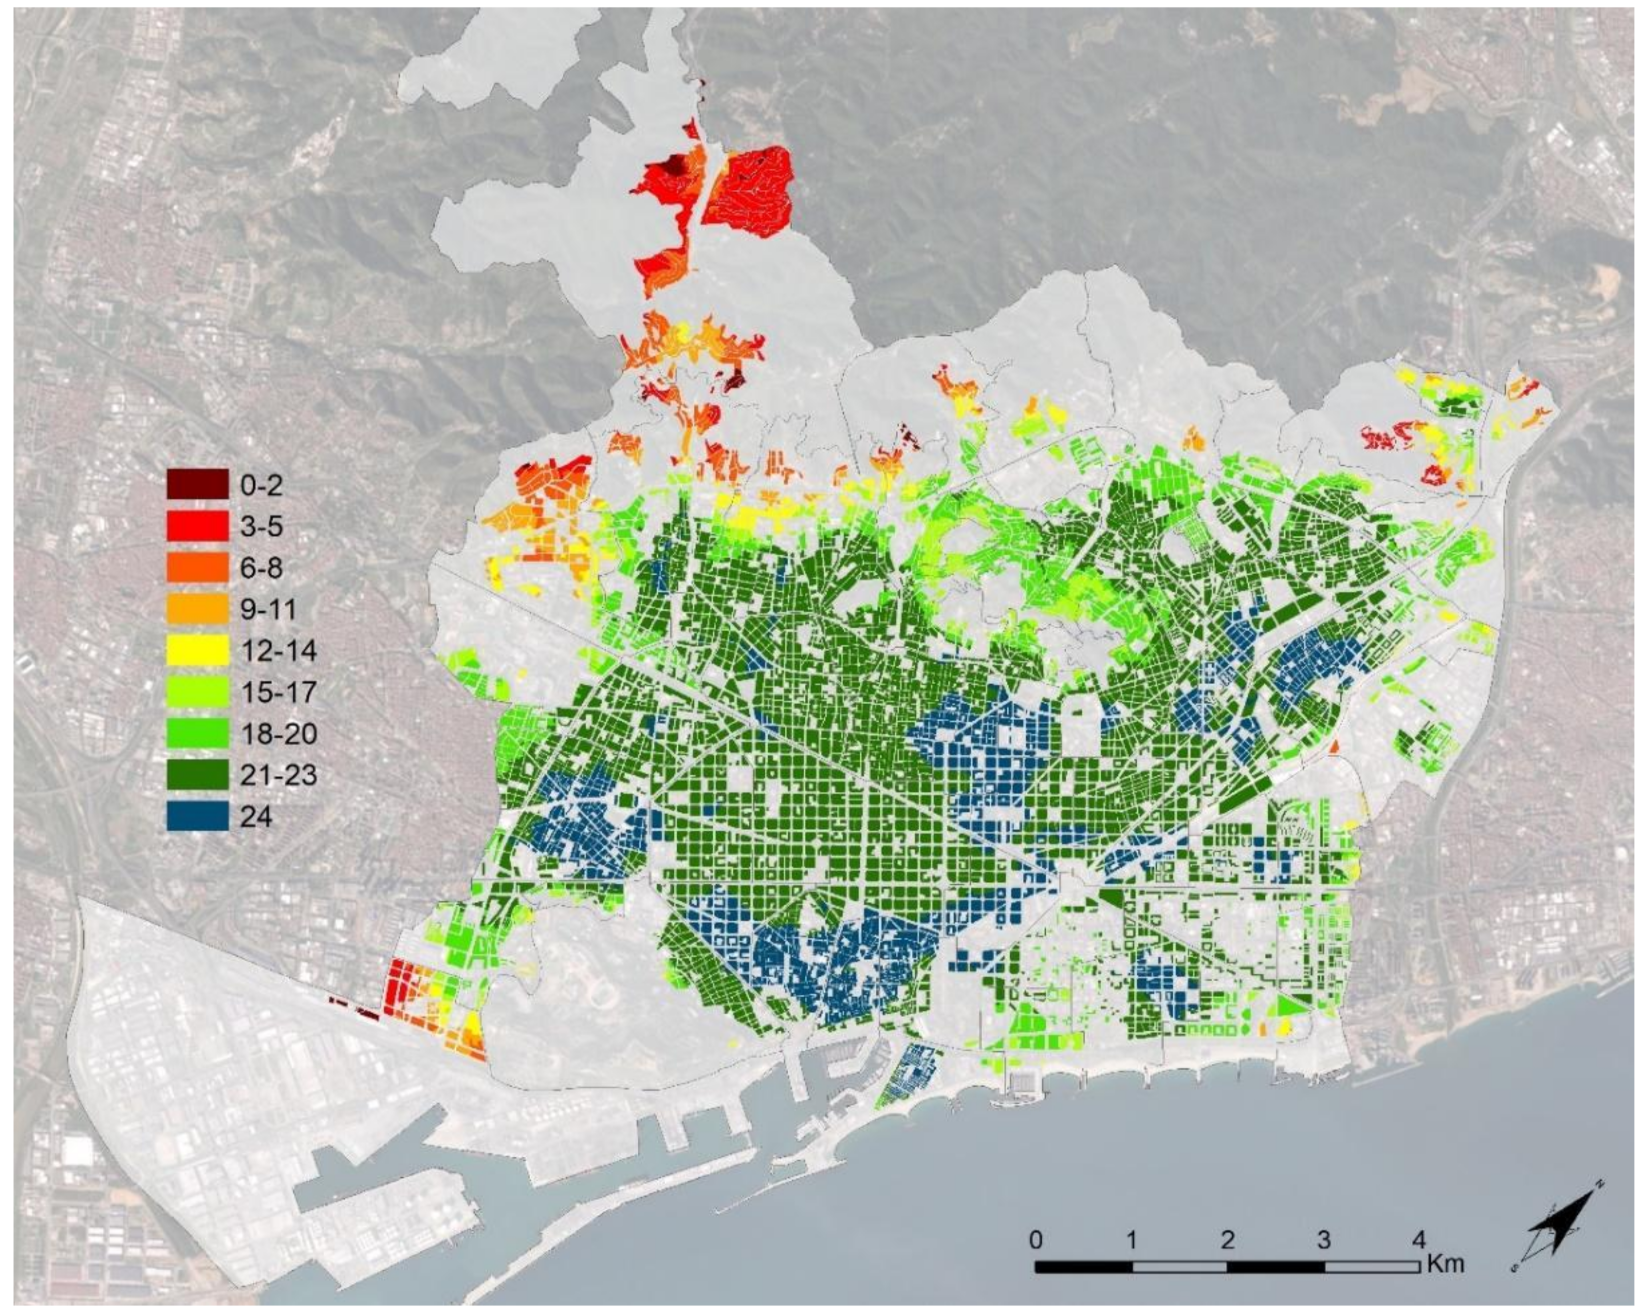
4.1. Synthetic 15-Minute Index

The synthetic map of the 15-Minute City (FMC) of Barcelona (Figure 3) shows a high level of accessibility to basic services in most of the parcels under study. On average, a parcel in Barcelona has 21 of the 24 services analyzed within the FMC range, which shows very high accessibility and an optimal distribution of services within the municipality. However, a spatial relationship of high and low values is observed between the center and the periphery, with a dispersion of the groupings of maximum values.
The parcels with optimal values—those with access to the 24 services analyzed in less than the defined time range in each case—represent 22% of the total for the city. These parcels are concentrated in the historic center (neighborhoods 1, 2, 3 and 4 in Figure 1) and its area of influence in Eixample (5, 6, 7, 8, 9 and 10), as well as in those historic neighborhoods that were annexed to Barcelona at the beginning of the 20th century (Vila de Gràcia (31), Sant Andreu (60), La Sagrera (61), el Poblenou (68), el Clot (65), or Sarrià (23)). Finally, we also find concentrations of areas with optimal accessibility in certain relatively central neighborhoods where housing blocks with high densities predominate (el Congrés i els Indians (62) and Porta (45)).
The dark green parcels represent those with very high values where only the service coverage of one, two, or three variables is missing. Most residential parcels, 54%, are in this strip that we observe covering most spaces contained within the beltway (i.e., ring road), but also some significant parcels within neighborhoods usually considered peripheral (el Bon Pastor (59), Ciutat Meridiana (55), or les Roquetes (50)). The remaining parcels represent 24% of the parcel. This wide strip of values is mainly on the periphery of the city.

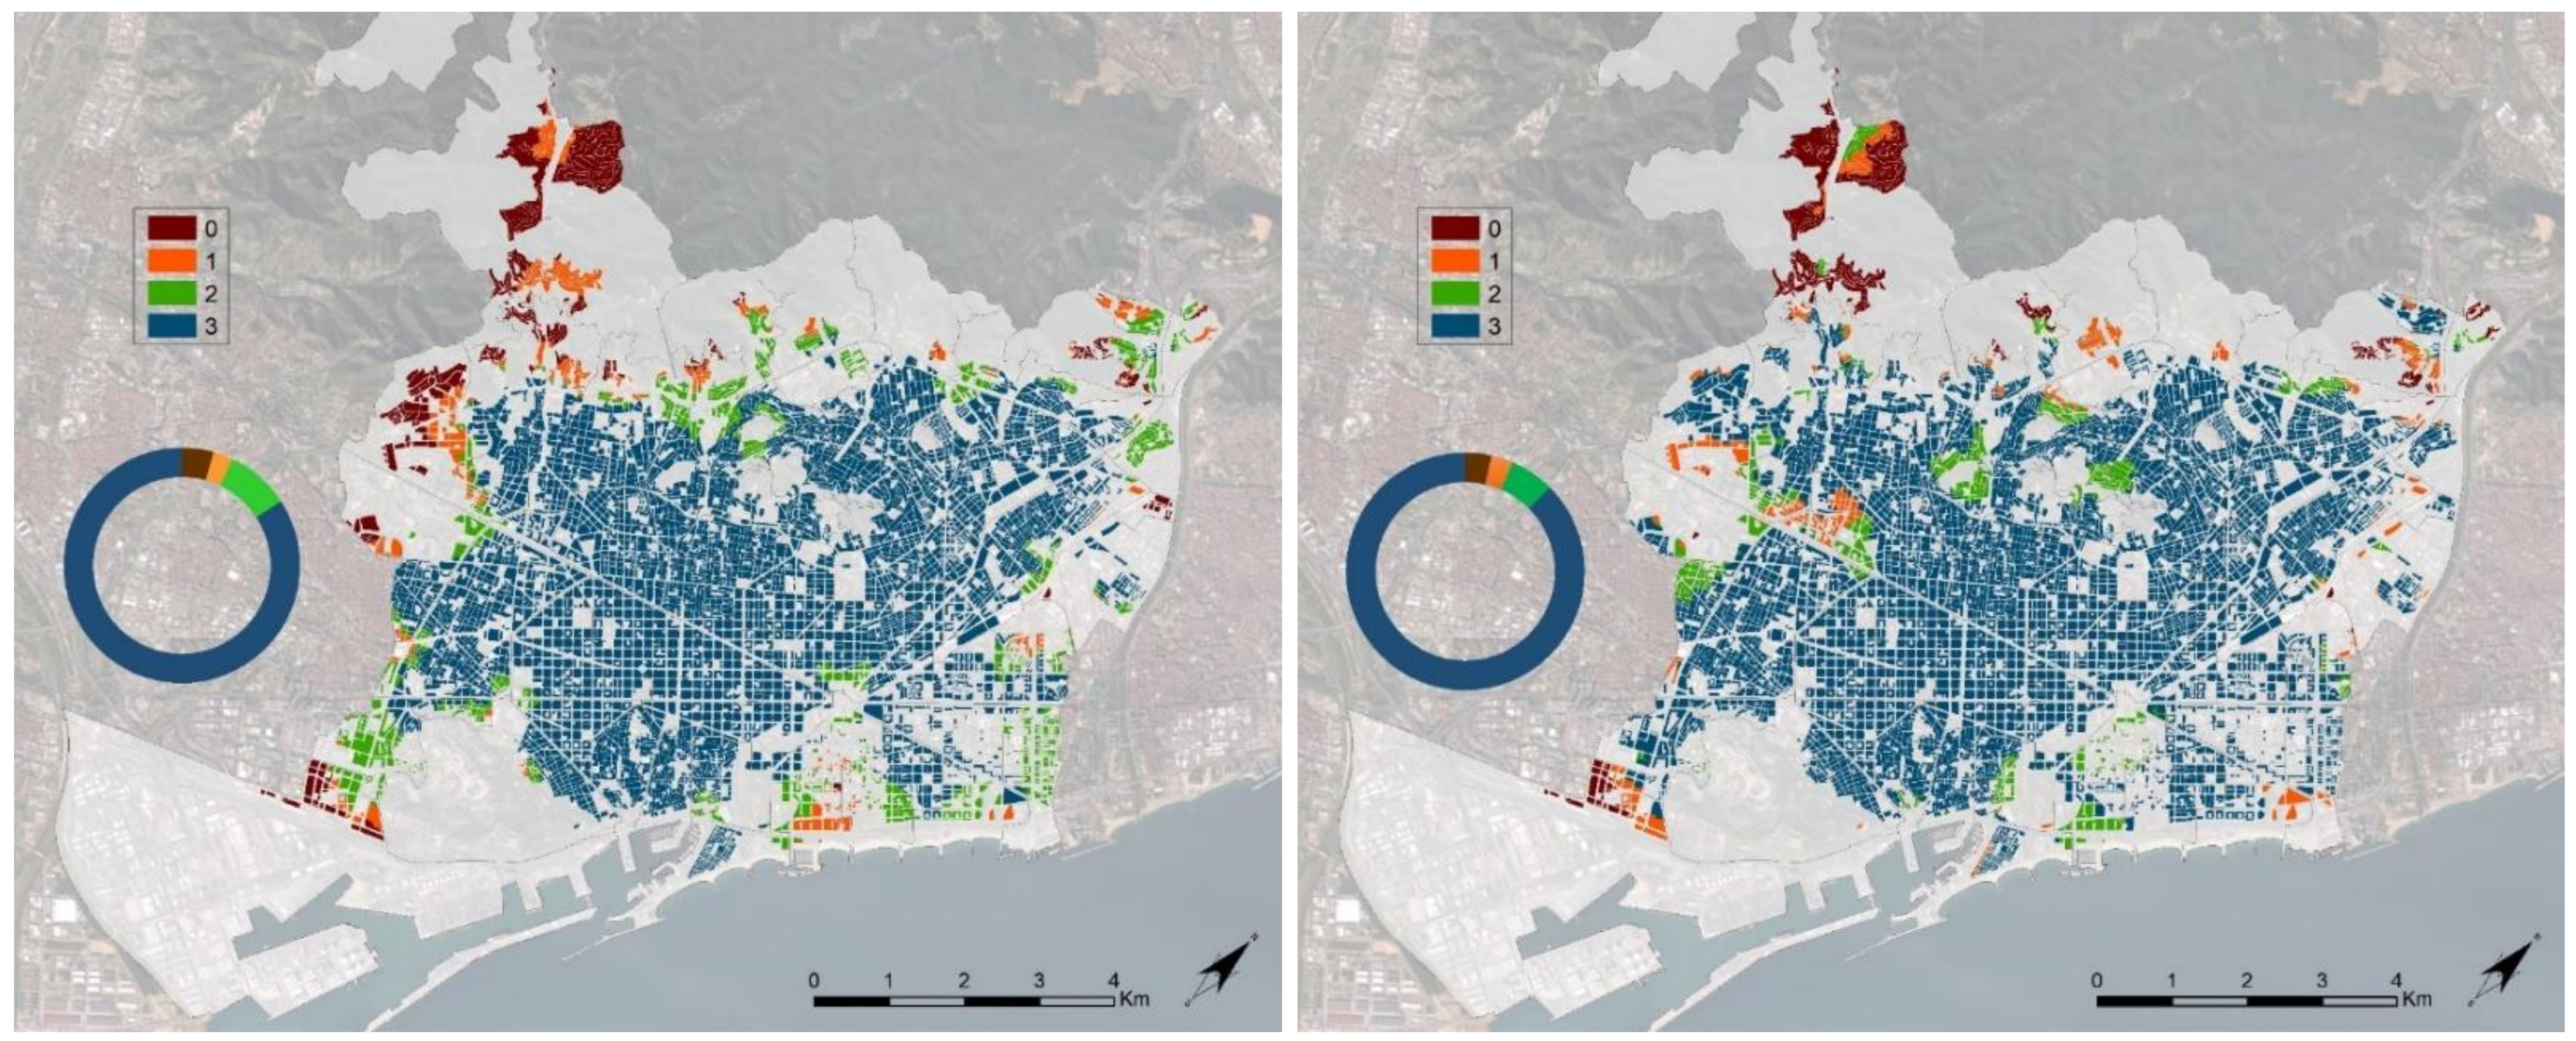
4.2. Partial Indices

Barcelona displays an excellent network of care-oriented proximity, although there are areas with deficits in the most peripheral locations and some coastal neighborhoods (Figure 4, left side). Of all the parcels, 84.2% have simultaneous access to a health center, social services, and a day center for the elderly, variables that in turn are territorially balanced according to the indicators, when covering in the range of 90.5 to 91.5% of the parcel (Table 2).
Education: The education equipment network of the city (Figure 4, right side) means this urban function shows the best results of the five functions analyzed, where 87.4% of the residential parcel has simultaneous access to pre-school, primary, and secondary education proximity. Among the three variables, primary education shows lower coverage values with 87.9%, compared to the best, which is secondary education with 96.1% (Table 1). Despite the high parcel results, large shortcomings are observed on the map in the most peripheral areas and, to a lesser degree, in parcels around the hills to the north, along the coast and, surprisingly, in some central areas of the city, due to the lack of pre-school and primary education equipment.
Provisioning: As we observed in Figure 5 (left side), 83.7% of the scheduled parcels have simultaneous access to most variables (4 or more) including supermarkets, markets, fresh food, daily businesses, catering, and other services. This indicates that most of the urban tissue allows supplies in the proximity environment. Territorial inequalities resemble those already observed in the synthetic map, with the particularity of a central axis of the Eixample, where the concentration of non-daily trade hinders access to food-related variables. Supermarket coverage is excellent (95.4% of parcels) except for neighborhoods 21 and 22. Very high coverage of most diverse services (89.8%), fresh food shops (86%), and non-food daily trade (80.1%), with general shortcomings in peripheral parcels, mainly in the northwest sector, and with a lack of fresh food shops in the center of Eixample (neighborhoods 5, 6, 7, 8 9 and 10 in Figure 1).
Entertainment: The general proximity of the city to leisure or entertainment establishments is very high, with 95% of parcels having access approaching four categories (Figure 5, right side). Optimal results are found in downtown spaces and traditional neighborhoods, but also many of the peripheral neighborhoods. In view of the individual results for the seven indicators (Table 2), five of them have coverage greater than 91.5% of the parcel, showing extensive coverage throughout the territory. On the other hand, the shows, which we identify with cinemas, theaters, and auditoriums (72%), show a great concentration in the historic center and the Vila de Gràcia neighborhood, leaving a large part of the parcel in the northern sector of the city devoid of these services. Finally, the large squares and parks (more than 10,000 m2) reveal deficiencies in large central sectors of the city, such as Eixample’s neighborhoods and Vila de Gràcia, to the west and north, respectively.
The public and non-motorized transport network (Figure 6), which we can associate with access to sustainable mobility, is optimal in most parts of the central city. Only the parcels of the northwest sector in mountainous areas and the extremes of the northern periphery and southern periphery present relevant deficiencies. The indicators of collective rapid transport, day and night bus, all greater than 94.2% of a parcel, show an excellent territorial coverage of public transport in Barcelona. On the contrary, access to cycling infrastructure is optimal only in 71% of the parcels under study.

5. Discussion

Barcelona demonstrates a very high coverage of all the urban functions analyzed, especially in central areas. The optimal distribution of local public facilities and services is due, first of all, to a historical urban tradition characterized by different types of urban development that have endowed the city with (1) a compact, densely populated urban morphology, (2) a mixture of land uses that have facilitated the development of small businesses throughout most of the city [36], and (3) the dynamics of proximity [37]. This urban tradition explains in part why the cadastral parcels with access to a higher number of services are located in the oldest parts of the city, such as the historic center and its area of influence, Eixample, but also in those historic neighborhoods that were annexed to Barcelona at the beginning of the 20th century (i.e., Vila de Gràcia, Sant Andreu, La Sagrera, el Poblenou, el Clot, or Sarrià), which are not always located in central areas. Second, the high average level of access to services in most of the city’s parcels can also be explained by the different regeneration plans for central spaces, and also by the urban and provisioning improvement of the peripheral areas that have been established in the city since the 1980s to the present day as the Llei de Barris (Neighborhood Act) [51] or the present-day Pla de Barris (Neighborhood Plan) [52].
The areas with less accessibility are found mostly on the outskirts, except for the new developments in the coastal area, such as Vila Olímpica i Llacuna del Poblenou, and Diagonal Mar i Front Marítim del Poblenou. In these peripheral areas, low coverage of services is identified, produced by non-residential mono-functional areas and the presence of large border voids, such as the limits of the built city or the large infrastructures, parks, and facilities [16]. In general, in addition to their location on the city limits and close proximity to large infrastructures, the urban development models and architectural styles implanted in these areas have followed models of a functionalist nature with high-rise buildings, private green spaces, and little commercial space [53,54]. These characteristics are not favorable prospects for the creation of proximity dynamics [1,16,27,32].
In the detailed spatial analysis of urban social functions, patterns very similar to those observed in the global results were observed. No specific functions with large deficits are detected. However, a lack of coverage is detected for large squares and parks in central areas, as well as cycling infrastructure, shows, and various supply variables in peripheral areas. Despite the efforts since the 1980s to provide small, high-quality public spaces throughout the city, the high density and compactness, and the high value of the real estate in the central areas make the provision of public open spaces more difficult [55]. As aforementioned, in certain peripheral areas of the city, the low urban densities and compact urban fabric and building design do not favor proximity dynamics and the diversity and density of retail provision.
In methodological terms, this study considers both the location of the available destinations and the demand (i.e., location of the population), while simultaneously incorporating the average walking speed in the calculation of distances, as well as the urban morphology of the environment. This method differs substantially from other approximations from the chrono-urbanism research field that have used radial metric distances between services and residents [6,28] or approximations around the density of services [13]. The present study advances the methodology proposed by Capasso Da Silva et al. [30], by expanding the network analysis beyond the municipal limits, seeking to avoid the modifiable area unit problem (MAUP) [56]. Likewise, the proposed method also adjusts the temporal threshold of what is considered an affordable travel time to the destination type, which estimates the network analysis more precisely.
The results suggest that the Municipality of Barcelona already presents, or is very close to, the conditions of the FMC. This confirms previous studies of daily mobility, which found an important role in proximity mobility in the city. For example, Marquet and Miralles-Guasch [27] estimated that 24% of all trips within the city were made by walking and in less than 10 min, hence covering very short distances. The fact that 76% of the analyzed blocks in the present study have walking access to more than 20 everyday destinations, within less than 15 min, speaks of the extreme walkability levels of most of the City of Barcelona, together with the success of service-allocation strategies led by the city council in past years. It also means that, for most of the population of Barcelona, their surrounding built environment is not constraining their mobility options in any major way. This makes it possible for them to fulfill most of their daily travel in a wide range of transportation modes that, most importantly, include the most democratic and accessible modes, walking and biking.
Because the FMC literature is still young, several issues need to be addressed in the future. On the one hand, future studies will need to overcome municipal boundaries or other arbitrarily set administrative units. The scale of metropolitan analysis is of great importance since, as suggested by Abba [57], without an integrated metropolitan system of 15-minute cities, it would be difficult to reverse the current mobility dynamics that occur in this space. On the other hand, future studies need to explore two large domains such as access to housing and workplaces. Most of the current studies on FMC have used openly accessible geolocated service datasets to calculate FMC accessibility. This represents a methodology with a focus on the most easily attainable goals, impacting the interpretation of results and limiting the FMC analysis to the daily mobility domain, leaving occupational mobility often unaddressed. Moreover, further studies should consider sociodemographic variables, such as age or gender, in order to enrich the discussion regarding equity in access and, thus, to reach a more realistic view on the value of proximity and social exclusion. Finally, and perhaps most importantly, future research should also address the relationship between the provision of accessibility and the travel demand, checking whether the potential of the FMC is exploited by the real population and translated into daily mobility characterized by proximity and use of destinations with short distances in line with study such as Graells-Garrido et al. [14]. Only by studying the real travel behavior of people living in FMC conditions will we be able to understand how far a person is willing to travel to access each specific service or destination, a key step in redesigning the current universal 15 min criteria towards more accurate destination-based criteria.
A future application of FMC metrics may incorporate this accessibility dimension with the possibility to geographically tailor specific transportation push-and-pull measures towards sustainability by acknowledging FMC accessibility metrics. As such, promoting pull measures to disincentivize private car use might be easier or cause less social discomfort in areas where FMC metrics are high, as people can easily find destination alternatives within the range of alternative modes of transport. On the other hand, introducing aggressive measures against car use in areas with low FMC metrics might create significant social unrest, as people may find no viable alternatives due to their most proximate built environment effectively constraining their potential travel adaptation strategies [58].
Finally, our results suggest that the concept of FMC can be very useful to help understand territorial inequalities and guarantee social justice through territorial equality of access to the opportunities offered by the city. However, in the future, interested cities should complement chrono-urban analysis methodologies such as FMC with the necessary provision of georeferenced data, the definition of essential activities, and the desirable time-distance policy. These debates can be highly complex and vary significantly between cities, as demonstrated by the experience of Melbourne and its 20-Minute Neighborhoods [45].

6. Conclusions

The present study uses standardized publicly available spatial data to analyze urban accessibility at a micro-scale level by following the 15-Minute City (FMC) precepts. Results highlight the extent to which the City of Barcelona as a whole, and its composing neighborhoods, already meet the FMC general criteria and the access to its five key urban social functions. The distribution of local public facilities and services across most parts of the city grant Barcelona very high levels of accessibility, especially in central but also peripheral historic neighborhoods. On the other hand, recently developed areas tend to fail in meeting all the FMC’s accessibility criteria.
This study pushes the limits of the methods employed in previous research by incorporating the average walking speed and the street network in the calculation of distances, as well as adjusting the distances to different destination types with different temporal thresholds and expanding them to destinations beyond the city’s municipal limits.
This analysis is not without limitations. The study area of this work has been limited to the City of Barcelona, due to the scarcity of integrated or comparable data within the rest of the metropolitan area (i.e., AMB), a problem shared with Capasso Da Silva et al. [30]. By not having this cartographic information, some of the results could be underrepresented in areas adjacent to the conurbation (i.e., AMB). The study is also limited by reliance on available sources.

Supplementary Materials

The following are available online at https://0-www-mdpi-com.brum.beds.ac.uk/article/10.3390/smartcities5010010/s1, Areas of coverage of the various indicators of the study.

Author Contributions

Conceptualization, G.V. and O.M.; methodology, C.F.-O.; software, C.F.-O.; validation, G.V., O.M. and L.M.; formal analysis, G.V., O.M. and L.M.; investigation, G.V., O.M. and L.M.; resources, G.V., O.M. and L.M.; data curation, C.F.-O.; writing—original draft preparation, C.F.-O.; writing—review and editing, G.V., O.M. and L.M.; visualization, C.F.-O.; supervision, G.V., O.M. and L.M.; project administration, G.V. and O.M.; funding acquisition, G.V. and O.M. All authors have read and agreed to the published version of the manuscript.

Funding

This research was funded by Ajuntament de Barcelona grant number 20S08707 under the Scientific Research Awards for Urban Challenges in the City of Barcelona. This research has also received funding from the European Union’s Horizon 2020 research and innovation program under the Marie Sklodowska-Curie grant agreement (No 845570) and the Ministry of Science and Innovation of Spain under the “Ayudas para contratos Juan de la Cierva-formación 2019” grants (FJC2019-041233-I).

Institutional Review Board Statement

Not applicable.

Informed Consent Statement

Not applicable.

Data Availability Statement

Not available.

Conflicts of Interest

The authors declare no conflict of interest.

Appendix

Appendix A. List of neighborhood codes and names of Barcelona.
Table A1. List of neighborhood codes and names of Barcelona.
1el Raval20la Maternitat i Sant Ramon39Sant Genís dels Agudells58Baró de Viver
2el Barri Gòtic21Pedralbes40Montbau59el Bon Pastor
3la Barceloneta22Vallvidrera, el Tibidabo i les Planes41la Vall d’Hebron60Sant Andreu
4Sant Pere, Santa Caterina i la Ribera23Sarrià42la Clota61la Sagrera
5el Fort Pienc24les Tres Torres43Horta62el Congrés i els Indians
6la Sagrada Famíia25Sant Gervasi - la Bonanova44Vilapicina i la Torre Llobeta63Navas
7la Dreta de l’Eixample26Sant Gervasi - Galvany45Porta64el Camp de l’Arpa del Clot
8l’Antiga Esquerra de l’Eixample27el Putxet i el Farró46el Turó de la Peira65el Clot
9la Nova Esquerra de l’Eixample28Vallcarca i els Penitents47Can Peguera66el Parc i la Llacuna del Poblenou
10Sant Antoni29el Coll48la Guineueta67la Vila Olímpica del Poblenou
11el Poble-sec30la Salut49Canyelles68el Poblenou
12la Marina del Prat Vermell31la Vila de Gràcia50les Roquetes69Diagonal Mar i el Front Marítim del Poblenou
13la Marina de Port32el Camp d’en Grassot i Gràcia Nova51Verdum70el Besòs i el Maresme
14la Font de la Guatlla33el Baix Guinardó52la Prosperitat71Provençals del Poblenou
15Hostafrancs34Can Baró53la Trinitat Nova72Sant Martí de Provençals
16la Bordeta35el Guinardó54Torre Baró73la Verneda i la Pau
17Sants - Badal36la Font d’en Fargues55Ciutat Meridiana
18Sants37el Carmel56Vallbona
19les Corts38la Teixonera57la Trinitat Vella

References

  1. Moreno, C.; Allam, Z.; Chabaud, D.; Gall, C.; Pratlong, F. Introducing the “15-Minute City”: Sustainability, Resilience and Place Identity in Future Post-Pandemic Cities. Smart Cities 2021, 4, 93–111. [Google Scholar] [CrossRef]
  2. Moreno, C. La ville du quart d’heure: Pour un nouveau chrono-urbanisme, La Tribune. 2016. Available online: https://www.latribune.fr/regions/smart-cities/la-tribune-de-carlos-moreno/la-ville-du-quart-d-heure-pour-un-nouveau-chrono-urbanisme-604358.html (accessed on 17 November 2021).
  3. Duany, A.; Steuteville, R. Defining the 15-Minute City. 2021. Available online: https://www.cnu.org/publicsquare/2021/02/08/defining-15-minute-city (accessed on 17 November 2021).
  4. United Nations. 17 Sustainable Development Goals (SDGs). 2015. Available online: https://sdgs.un.org/goals (accessed on 11 November 2021).
  5. Capolongo, S.; Rebecchi, A.; Buffoli, M.; Appolloni, L.; Signorelli, C.; Fara, G.M.; D’Alessandro, D. COVID-19 and Cities: From Urban Health Strategies to the Pandemic Challenge a Decalogue of Public Health Opportunities. Acta Biomed. 2020, 91(2), 13–22. [Google Scholar] [CrossRef] [PubMed]
  6. Marin-Cots, P.; Palomares-Pastor, M. En un entorno de 15 minutos. Hacia la Ciudad de Proximidad, y su relación con el Covid-19 y la Crisis Climática: El caso de Málaga. Ciudad Territ. Estud. Territ. 2020, LII, 685–700. [Google Scholar]
  7. Steuteville, R. The 15-Minute Neighborhood Gets Its 15 Minutes of Fame. Congress for New Urbanism. 2021. Available online: https://www.cnu.org/publicsquare/2021/02/08/defining-15-minute-city (accessed on 17 November 2021).
  8. Garnier, M.; Moreno, C. Ville du ¼ d’heure: Du concept à la mise en place: LIVRE BLANC n°2; Paris, France, 2020. [Google Scholar]
  9. Mardones-Fernández de Valderrama, N.; Luque-Valdivia, J.; Aseguinolaza-Braga, I. La Ciudad Del Cuarto de Hora, ¿una Solución Sostenible Para La Ciudad PostCOVID-19? Ciudad y Territ. Estud. Territ. 2020, LII (205), 653–664. [Google Scholar]
  10. Pozoukidou, G.; Chatziyiannaki, Z. 15-minute city: Decomposing the new urban planning Eutopia. Sustainability 2021, 13, 1–25. [Google Scholar]
  11. Sarrade-Gastelú, N.F.; Sánchez-Albán, M.A.; Miranda-Yanez, D.G.; Paredes-Poveda, T.V.; Arellano-Vizcarra, G.C. Ciudad en pandemia. Una aproximación desde la escala humana a las prioridades urbanas. Rev. Científica Arquit. Urban. 2020, 16, 71–86. [Google Scholar]
  12. Córdoba-Hernández, R.; Aja, A.H.; Fernández-Ramírez, C.; Álvarez-del Valle, L. Hacia la Ciudad de los 15 minutos frente al COVID19. La densidad espacial de Madrid. re-hab. Crisis Urbana, Rehabilitación Y Regeneración. 2020. Available online: http://vps181.cesvima.upm.es/re-hab/2020/05/28/hacia-la-ciudad-de-los-15-minutos-frente-al-covid19-iii-la-capacidad-de-actuacion-sobre-las-calzadas-de-madrid-durante-la-desescalada/ (accessed on 17 November 2021).
  13. Guzman, L.A.; Arellana, J.; Oviedo, D.; Moncada Aristizábal, C.A. COVID-19, Activity and Mobility Patterns in Bogotá. Are We Ready for a ‘15-Minute City’? Travel Behav. Soc. 2021, 24, 245–256. [Google Scholar] [CrossRef]
  14. Graells-Garrido, E.; Serra-Burriel, F.; Rowe, F.; Cucchietti, F.M.; Reyes, P. A city of cities: Measuring how 15-minutes urban accessibility shapes human mobility in Barcelona. PLoS ONE 2021, 16, e0250080. [Google Scholar] [CrossRef] [PubMed]
  15. Appleton, J. The 15-Minute City: Nurturing Communities For Smarter Cities; Bee Smart City: Mülheim an der Ruhr, Germany, 2020; Available online: https://hub.beesmart.city/en/strategy/the-15-minute-city-nurturing-communities-for-smarter-cities (accessed on 19 September 2021).
  16. Jacobs, J. The Death and Life of Great American Cities, 1st ed.; Vintage Books: New York, NY, USA, 1961. [Google Scholar]
  17. Hägerstrand, T. What about People in Regional Science? Pap. Reg. Sci. Assoc. 1970, 66, 1–6. [Google Scholar] [CrossRef]
  18. Neutens, T.; Schwanen, T.; Witlox, F. The prism of everyday life: Towards a new research agenda for time geography. Transp. Rev. 2011, 31, 25–47. [Google Scholar] [CrossRef]
  19. State Government of Victoria. Plan Melbourne. Metropolitan Planning Strategy; State Government of Victoria: Melbourne, Australia, 2014. [Google Scholar]
  20. Stanley, J.R.; Stanley, J.K. Achieving the 20 minute city for Melbourne: Turning our city upside down.; Melbourne, Australia, 2014; pp. 1–25. [Google Scholar]
  21. Hou, L.; Yungang, L. Life circle construction in China under the idea of collaborative governance: A comparative study of Beijing, Shanghai and Guangzhou. Geogr. Rev. Japan Ser. B 2017, 90, 2–16. [Google Scholar]
  22. Land Transport Authority of Singapur. Land Transport Master Plan 2040; Land Transport Authority of Singapore: Singapore, 2019. [Google Scholar]
  23. Zhou, D. Examination of the 15-minute life cycle program of a Chinese mega city: Case study of Guangzhou. WIT Trans. Ecol. Environ. 2019, 238, 97–106. [Google Scholar]
  24. Kilkenny County Council. Kilkenny City and County Draft Development Plan 2021–2027; Kilkenny County Council: Kilkenny, Ireland, 2014; Available online: https://consult.kilkenny.ie/en/consultation/kilkenny-city-and-county-draft-development-plan-2021-2027 (accessed on 17 November 2021).
  25. Steuteville, R.; Portland Pursues the “20-Minute Neighborhood”. Public Square 2008. Available online: https://www.cnu.org/publicsquare/portland-pursues-‘20-minute-neighborhood’ (accessed on 17 November 2021).
  26. OECD. Tackling Coronavirus (COVID-19): Contributing To A Global Effort-Coronavirus (COVID-19): SME Policy Response; OECD: Paris, France, 2020; pp. 1–55. [Google Scholar]
  27. Marquet, O.; Miralles-Guasch, C. The Walkable city and the importance of the proximity environments for Barcelona’s everyday mobility. Cities 2015, 42, 258–266. [Google Scholar] [CrossRef]
  28. Ajuntament de València Plan Especial Del Área Funcional 10. Versión Para Información Pública Y Consultas; Ajuntament de València: València, Spain, 2020. [Google Scholar]
  29. Li, Z.; Zheng, J.; Zhang, Y. Study on the Layout of 15-Minute Community-Life Circle in Third-Tier Cities Based on POI: Baoding City of Hebei Province. Engineering 2019, 11, 592–603. [Google Scholar] [CrossRef] [Green Version]
  30. Capasso da Silva, D.; King, D.A.; Lemar, S. Accessibility in practice: 20-minute city as a sustainability planning goal. Sustainability 2020, 12, 129. [Google Scholar] [CrossRef] [Green Version]
  31. City of Eugene. How Is Walkability Measured? Find Out More about 20-Minute Neighborhoods. 2020. Available online: https://www.eugene-or.gov/1223/How-is-Walkability-Measured (accessed on 13 November 2021).
  32. Marquet, O.; Miralles-Guasch, C. The Use of Proximity in Barcelona. An Analysis through Daily Travel Times. Ciudades 2014, 17, 99–120. [Google Scholar]
  33. Ryley, T. The propensity for motorists to walk for short trips: Evidence from West Edinburgh. Transp. Res. Part A Policy Pract. 2008, 42, 620–628. [Google Scholar] [CrossRef] [Green Version]
  34. Miralles-Guasch, C.; Marquet-Sarda, O. Dinámicas de proximidad en ciudades multifuncionales. CyTET Ciudad Territ. Estud. Territ. 2013, XLV, 503–512. [Google Scholar]
  35. Ureta, S. To move or not to move? Social exclusion, accessibility and daily mobility among the low-income population in Santiago, Chile. Mobilities 2008, 3, 269–289. [Google Scholar] [CrossRef]
  36. Busquets, J. Barcelona. La Construcción Urbanística De Una Ciudad Compacta; Ediciones Del Serbal: Barcelona, Spain, 2004. [Google Scholar]
  37. Marquet, O.; Miralles-Guasch, C. Walking short distances. The socioeconomic drivers for the use of proximity in everyday mobility in Barcelona. Transp. Res. Part A Policy Pract. 2014, 70, 210–222. [Google Scholar] [CrossRef]
  38. IDESCAT. The Municipality in Figures Barcelona (Barcelonès); Statistical Institute of Catalonia: Barcelona, Spain, 2020; Available online: https://www.idescat.cat/emex/?id=080193&lang=en (accessed on 25 November 2021).
  39. Báguena, J. Organització En Barris (Barcelona). 2006. Available online: http://territori.scot.cat/client/print/print_notice.php?IDN=1021 (accessed on 12 November 2021).
  40. Delclòs-Alió, X.; Miralles-Guasch, C. Looking at Barcelona through Jane Jacobs’s eyes: Mapping the basic conditions for urban vitality in a Mediterranean conurbation. Land Use Policy 2018, 75, 505–517. [Google Scholar] [CrossRef]
  41. Institut Cartogràfic i Geològic de Catalunya. Vissir3. 2021. Available online: http://www.icc.cat/vissir3/index.html (accessed on 11 November 2021).
  42. Ajuntament de Barcelona. Open Data BCN. 2020. Available online: https://opendata-ajuntament.barcelona.cat/en (accessed on 11 November 2021).
  43. Agència d’Ecologia Urbana de Barcelona. Sistema de indicadores y condicionantes para ciudades grandes y medianas. Red Redes Desarro. Local Sosten. 2012, 82. [Google Scholar]
  44. Agència d’Ecologia Urbana de Barcelona. Sistema Municipal de Indicadores de Sostenibilidad. In Proceedings of the IV Reun. del Grup. Trab. Indicadores Sostenibilidad la Red Redes Desarro. Local Sosten.; 2010; p. 34. [Google Scholar]
  45. State Government of Victoria. 20-Minute Neighbourhoods: Creating a More Liveable Melbourne; State Government of Victoria: Melbourne, Australia, 2019. [Google Scholar]
  46. Ajuntament de Barcelona. Censo de Actividades Económicas en Planta Baja de la Ciudad de Barcelona. 2019. Available online: https://opendata-ajuntament.barcelona.cat/data/es/dataset/cens-activitats-comercials (accessed on 13 November 2021).
  47. Rojas-Quezada, C.; Martínez-Bascuñán, M.; De la Fuente-Contreras, H.; Schäfer-Faulbaum, A.; Aguilera-Saéz, F.; Fuentes-Mella, G.; Peyrín-Fuentes, C.; Carrasco-Montagna, J. Accesibilidad a Equipamientos Según Movilidad y Modos de Transporte En Una Ciudad Media, Los Ángeles, Chile. An. Geogr. la Univ. Complut. 2019, 39, 177–200. [Google Scholar] [CrossRef] [Green Version]
  48. Generalitat de Catalunya. Mapa Urbanístic De Catalunya. 2011. Available online: http://ptop.gencat.cat/muc-visor/AppJava/home.do (accessed on 17 November 2021).
  49. ESRI. ArcGIS Desktop: Release 10; ESRI: Redlands, CA, USA, 2011. [Google Scholar]
  50. Guío-Burgos, F.A.; Poveda-D’Otero, J.C. Variables microscópicas en la velocidad de caminata. Ing. Transp. 2012, 19, 143–154. [Google Scholar]
  51. Parlament de Catalunya. Llei 2/2004, de 4 de Juny, de Millora de Barris, Àrees Urbanes I Viles Que Requereixen Una Atenció Especial. 2004. Available online: https://www.parlament.cat/document/nom/TL45.pdf (accessed on 24 November 2021).
  52. Ajuntament de Barcelona. Pla de Barris. 2016. Available online: https://www.pladebarris.barcelona/es/ (accessed on 17 November 2021).
  53. Navas-Perrone, M.G. La Vocación Utópica Del Urbanismo: El Caso de la Vila Olímpica de Barcelona. In Proceedings of the XIV Coloq. Int. Geocrítica Las Utopías Y La Construcción La Soc. Del Futur., Barcelona, Spain, 2–7 May 2016. [Google Scholar]
  54. Castro-Mellado, J.L. Espai públic en polígons d’habitatge: Montbau i Ciutat Meridiana (Barcelona). Public Art. Urban Des. Particip. Regen. 2017, 57, 9–42. [Google Scholar]
  55. Vich, G.; Marquet, O.; Miralles-Guasch, C. Green exposure of walking routes and residential areas using smartphone tracking data and GIS in a Mediterranean city. Urban For. Urban Green. 2019, 40, 275–285. [Google Scholar] [CrossRef]
  56. Kwan, M.-P. The Limits of the Neighborhood Effect: Contextual Uncertainties in Geographic, Environmental Health, and Social Science Research. Ann. Am. Assoc. Geogr. 2018, 108, 4452. [Google Scholar] [CrossRef]
  57. Abba, A.P. Las promesas de la ciudad de los 15’. Café de las Ciudades. 2020. Available online: https://cafedelasciudades.com.ar/sitio/contenidos/ver/389/las-promesas-de-la-ciudad-de-los-15.html (accessed on 17 November 2021).
  58. Marquet, O.; Miralles-Guasch, C. Resilient territories and mobility adaptation strategies in times of economic recession: Evidence from the metropolitan region of Barcelona, Spain 2004–2012. Eur. Urban Reg. Stud. 2018, 25, 345–359. [Google Scholar] [CrossRef]
Figure 1. The City of Barcelona. Its 73 administrative neighborhoods and cadastral parcels. Source: own production derived from the 1: 5000 Orthophoto from ICGC, used under a CC BY 4.0 license [41]. See Table A1 in Appendix A for the full list of neighborhood codes and names of Barcelona.
Smartcities 05 00010 g001
Figure 2. The proposed methodological approach. Source: own elaboration based on data from Open Data BCN [42].
Smartcities 05 00010 g002
Figure 3. Synthetic Map of the 15-Minute City in Barcelona. Source: Own elaboration based on data from Open Data BCN [42], the Urban Map of Catalonia (MUC) [48] and the 1: 5000 Orthophoto from ICGC, used under a CC BY 4.0 license [41].
Smartcities 05 00010 g003
Figure 4. Care features (left side) and education (right side). Number of variables accessible simultaneously from each of the parcels. Source: own elaboration based on data from Open Data BCN [42] and the 1: 5000 Orthophoto from ICGC, used under a CC BY 4.0 license [41].
Smartcities 05 00010 g004
Figure 5. Provisioning functions (left side) and entertainment functions (right side). Number of variables accessible simultaneously from each of the parcels. Source: own elaboration based on data from Open Data BCN [42] and the Urban Map of Catalonia (MUC) [48] and the 1: 5000 Orthophoto from ICGC, used under a CC BY 4.0 license [41].
Smartcities 05 00010 g005
Figure 6. Public and non-motorized transport. Number of variables accessible simultaneously from each of the parcels. Source: own elaboration based on data from Open Data BCN [42] and the 1: 5000 Orthophoto from ICGC, used under a CC BY 4.0 license [41].
Smartcities 05 00010 g006
Table 1. Urban social functions and their specific indicators.
Urban Social FunctionsVariablesTemporal Range
(min)
CareHealth10
Social services15
Day centers10
EducationPreschool education5
Primary education5
Secondary education10
ProvisioningSupermarkets10
Markets10
Fresh food +50%5
Daily non-food +50%5
Catering +50%5
Miscellaneous services +50%5
EntertainmentShows10
Libraries15
Civic centers10
Children playgrounds5
Sports facilities10
Squares and parks > 1000 m25
Squares and parks > 10,000 m25
Public and non-motorized transportCollective rapid transport10
Day bus5
Night bus10
Shared bike stations5
Bike Lanes5
Source: own production.
Table 2. Share of cadastral parcels with FMC access to selected services.
Urban Social FunctionsVariables%
CarePrimary care centers90.5
Social Services90.8
Day centers91.5
EducationPreschool Education93.3
Primary education87.9
Secondary education96.1
ProvisioningSupermarkets95.4
Markets71.5
Fresh food86.0
Daily non-food80.1
Catering68.8
Others89.8
EntertainmentShows72.0
Libraries92.9
Children’s play spaces93.7
Sports facilities91.5
Squares and parks > 1000 m299.9
Squares and parks > 10,000 m268.9
Public and non-motorized transportBus98.9
Train94.3
Day bus98.9
Night bus95.3
Shared bike station85.8
Bike Lane70.9
Publisher’s Note: MDPI stays neutral with regard to jurisdictional claims in published maps and institutional affiliations.

