1. Introduction
Smart cities are often visualized as consortium of technologies including sensors, computing systems and services, across many scales that are connected through multiple networks which provide continuous data regarding the activities of people and objects including devices, buildings, and assets in terms of the flow of decisions about the physical, operational, and social form of the city [
1]. On the other hand, as we move towards Web 3.0 with focus on decentralized semantic web [
2,
3], it is unavoidable to imagine smart cities of the future without decentralized Web 3.0 as the underlying information system.
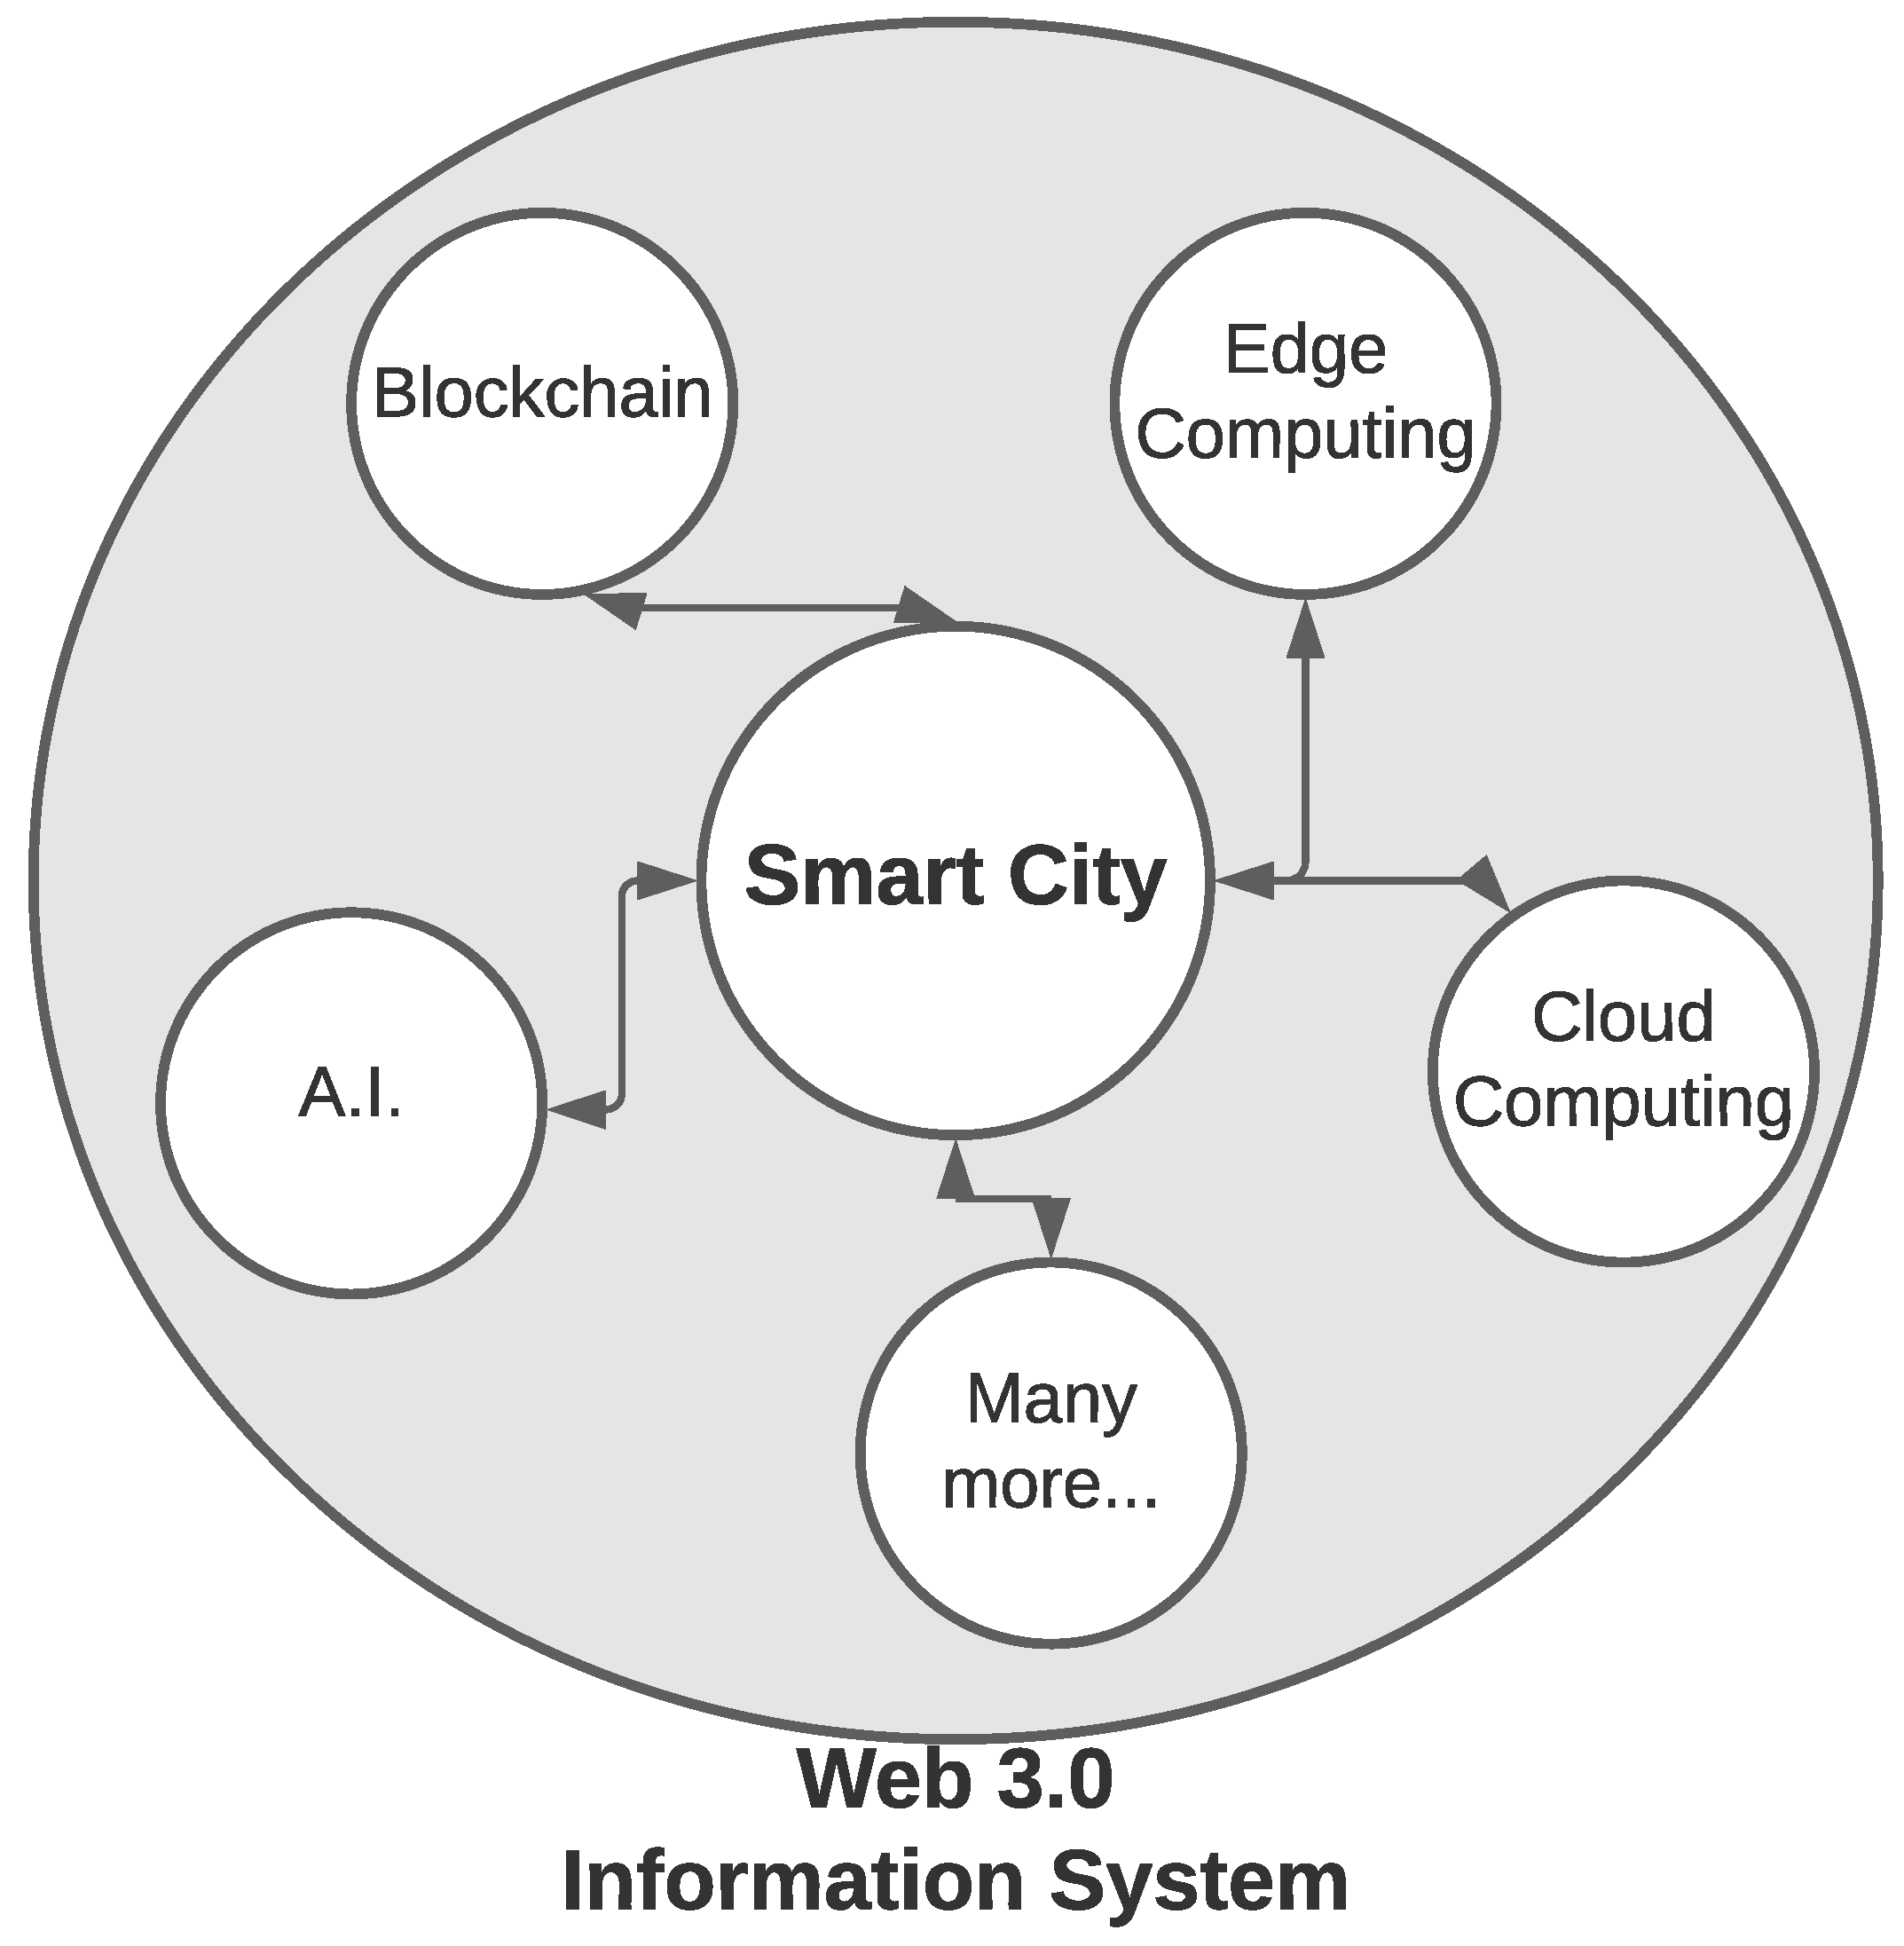
Figure 1 shows the diagrammatic representation of a smart city utilizing Web 3.0 information system along with other technologies such as Blockchain, Artificial Intelligence (A.I. or simply, AI) Cloud Computing, Edge Computing, and many more, to feed information from each other to optimize the efficiency of city operations and services and connect to the citizens [
4]. The key goals of information flow within the smart cities could include a plethora of activities including managing traffic and transportation systems, power plants, utilities, water supply networks, waste, crime detection, information systems, schools, libraries, hospitals, and other community services.
On the other hand, one of the most important issues that the modern society faces today is food wastage, which is both a social issue and an environmental one [
5,
6,
7]. Every year one third of total food produced, which weighs approximately 1.3 billion tonnes and is equivalent to
$2.6 trillion, is lost or wasted. However, more than 820 million people around the globe doesn’t have access to proper nutritious meal [
6]. Moreover, food waste and loss contributes to almost 6% of the total greenhouse gas emissions around the globe, leading to detriment of the environment as well [
7]. That being said, the supporting technologies of a Web 3.0 enabled smart city could be the enabler of reducing food waste and to build a more sustainable planet.
Several studies [
8,
9,
10,
11,
12] have been proposed over the years to utilize blockchain and other technologies such as QR code in conjunction to digitize food supply chain data. Moreover, studies [
13,
14] using blockchain to raise awareness of food waste are also being proposed. However, none of the published studies use blockchain, QR code, cloud computing, and machine learning in conjunction to develop a framework that could reduce food waste.
To reduce food waste, we propose SmartNoshWaste—a Blockchain based multi-layered framework utilizing machine learning (more specifically reinforcement learning), cloud computing and QR code in a decentralized Web 3.0 enabled smart city. Blockchain is an excellent technology to digitize and decentralize food supply chain data, whereas, QR code [
15,
16] could be utilized in concurrence to make the digitized data more accessible to consumers, especially via smartphones. We have chosen cloud computing [
17,
18] for the framework to improve the speed of computation to provide a seamless user experience in validating and accessing the data. Also, cloud computing improves maintainability of software development as the changes in the software could be easily pushed on to the server for it to effect. On the other hand, machine learning being a sub field of AI, where the computing machine improves automatically through experience and by the use of data [
19], such a mechanism can be utilized to learn from the data and henceforth, optimize food waste.
SmartNoshWaste has two layers: (1) Data System Architecture and (2) Machine Learning Module. The goal of the Data System Architecture is to digitize and store food data on the Blockchain using QR code and cloud computing to improve traceability and accessibility of such data and such that intelligence could be used by agents (machines) to reduce waste in Machine Learning Module. To the best of our knowledge this is the first framework to be proposed using Blockchain, cloud computing, QR code and machine learning in conjunction in a Web 3.0 enabled smart city to reduce food waste. To this extent the main contributions of this paper are as follows:
- 1.
Propose SmartNoshWaste, a Blockchain based framework using machine learning, cloud computing and QR code to reduce food waste in a Web 3.0 enabled smart city;
- 2.
Propose a metric to quantify food production and waste data;
- 3.
Experimental evaluation of SmartNoshWaste on real world food data collected from the nosh food management app [
20] and show the efficacy of the proposed framework.
The rest of the paper is organized as follows.
Section 2 briefly mentions some of the key concepts and technologies used in this paper, whereas,
Section 3 mentions the related studies, which are already performed on the topic. In
Section 4 we propose the SmartNoshWaste framework to reduce food waste and
Section 5 shows the experimental evaluation of SmartNoshWaste on real world food data collected from the nosh app. Finally, we discuss the limitations and related future works as part of the proposed framework in
Section 6 and conclude the paper in
Section 7.
3. Related Works
Several studies [
8,
9,
10,
11,
12,
14,
32,
33] have been published on Agri-food production and supply chains over the years. The study in [
34] as proposed by Li et al. developed a dynamic planning mechanism for food supply chain. This mechanism minimizes the losses of food products while simultaneously maximizing the profits for the members of food supply chain. In 2015, the study [
35] provided by Foroglou et al. highlights the applications of blockchain including electronic cash system. In the same study, Foroglou et al. also showed applications of blockchain in different industrial domains such as contracts, voting, intellectual property rights, smart property, and finance. In 2016, the study in [
8] by Tian proposed a food blockchain framework using RFID technology to implement data acquisition, circulation, and sharing in different phases of supply chain including production, processing, warehousing, distribution, and sales links of food supply chain. In the study by Zhao et al. [
9], they foresaw the storage capacity of blockchain being one of the biggest issues for applying BT in food supply chain. Another key challenge on implementing blockchain in supply chain, mentioned in [
9], was the demanding computational power of using such framework. In the study [
36], Singh et al. proposed a secured framework of using BT and Fog-based Architecture Network for Internet of Everything applications in the smart cities. In a different study by Astill et al. [
10], they proposed the use of Internet-of-Things (IoT) at different stages of food production in the supply chain to acquire data of production and supply chain, and henceforth, using BT to create transparency of such data. Another study [
32] uses blockchain in enabling a secure IoT based smart city. Also, Gayialis et al. [
33] proposed a platform to minimize counterfeit labeling and improve traceability of wines and spirits by using a combination of blockchain, anti-counterfeit labels, and sensors. Though these works [
8,
9,
10,
33,
34,
35] are focused on using blockchain as one of the key technologies for purposes such as food data traceability, they do not focus on minimizing food waste nor deal specifically with waste related data.
On the other hand, BT can also affect sustainable business models in the agri-food industry by being a source of innovation [
37,
38]. In [
39], it is also pointed out that diffusion of technological innovations such as BT could attribute to initial lack of knowledge and expertise of the innovation and to scalability issues as well. Henceforth, this calls for a BT based framework in the agri-food industry for traceability, accessibility, and verification of produce to empower sustainable business models and encourage diffusion of such technology.
In the study by Bogner et al. [
40], they proposed a decentralized application to share everyday objects based on a smart contract utilizing Ethereum blockchain and QR code. In this application [
40], smart contract hosted on the blockchain, the local Ethereum client, and a web app is used to identify each object or device based on QR code, which is unique to each object. Despite this approach is utilizing QR code and blockchain together to share objects in a decentralized fashion, the logistics of supply chain, especially in context of food production, is far more complex and hierarchical, which requires a more holistic approach specific to agricultural industry. In [
41], Kumar et al. proposed an approach to prohibit counterfeit of medicine in supply chain using BT and encrypted QR code such that the consumer is able to trace each active ingredients in the medicine. In this approach each ingredient is traced using blockchain mechanism and then embedded as encrypted data in the QR code for further verification by the consumer. The approach in this method [
41] is complex in terms of implementation in the agricultural industry, especially given the distributed nature of the food supply chain. Moreover, tracking each ingredient in the food product also means that additional storage memory is required to trace the ingredients. On the other hand, in the study by Baralla et al. [
42], they proposed an approach to trace European food supply chain data by using BT and QR code. However, the approach uses the Hyperledger Sawtooth, which is a BT suitable for institutes like enterprises while discouraging individual and small farmers with small production capacity to utilize such a technology. Additionally, this approach also do not encourage recovery and verification of data such as expiry date of the food product during the shopping phase of the food supply chain. This multi-level system architecture as proposed in [
42] also generates the QR code at every step of the food supply chain, which makes the QR codes abundant and henceforth, unnecessary. To make it more convenient to access food data in the supply chain by the end-user (consumer) for traceability purposes, in [
12] Dey et al. proposed a method utilizing BT along with QR code and cloud computing.
None of the aforementioned methodologies and studies actually deal with a specific solution dedicated to reducing food waste. In [
14], Marin et al. proposed a learning platform based on BT which tracks food waste in the supply chain and henceforth, contributing to the awareness in food waste reduction utilizing blockchain. However, this study also did not focus on minimizing waste directly.
In [
43], Abdullah et al. proposed an IoT based waste management system in smart cities, focusing on collection, disposal, and utilization of waste in relevant facilities. In [
44], Dubey et al. proposed IoT and machine learning based waste management system, where produced waste is managed at the household and society level of the city. In this study, the authors also focus on managing the different process of waste such as collection, disposal, and utilization. However, these studies [
43,
44] focus on managing waste rather than reducing it.
Given the importance of food waste towards building a more sustainable planet, this calls for a solution that could utilize the key technological infrastructure of Web 3.0 smart cities to reduce food waste happening at different phases in the supply chain.
4. Proposed Framework: SmartNoshWaste
SmartNoshWaste is an extension of our previously published work—FoodSQRBlock [
12] framework. FoodSQRBlock framework digitizes the food supply chain data such that data at the consumer end in a Farm-to-Fork supply chain model is easily accessible by the consumer for traceability. However, the FoodSQRBlock framework lacked two key components to reduce food waste as follows: (1) it did not focus on making the data from all the phases in the supply chain (such as production, processing, distribution, retailing, and consumption) easily accessible to the consumer; (2) it did not focus on reducing food wastage based on the data from the supply chain. SmartNoshWaste is built as an extension of FoodSQRBlock to resolve these.
Our SmartNoshWaste framework has two distinct layers: (1) Data System Architecture and (2) Machine Learning Module. In the Data System Architecture we utilize BT, QR code, and cloud computing to digitize and store the food data such that it can be used in the Machine Learning Module to minimize food wastage.
4.1. Assumptions and Data System Architecture of SmartNoshWaste
In order to design blockchain based framework to minimize food waste, first, we have to digitize food production data such that it is more traceable and accessible at all stages of the supply chain. To achieve this we have to analyze the different phases and activities present within a generic food supply chain. In our proposed framework, we focus our research on Farm-to-Fork supply chain, which has five main phases/stages [
42] identifying a generic food supply chain, consisting of
Production,
Processing,
Distribution,
Retailing,
and Consumption.
In our proposed framework, SmartNoshWaste, first, we aim to digitizing data from the five aforementioned phases (production, processing, distribution, retailing, and consumption). After the digitization of the supply chain data we store the data on the BT for traceability and accessibility by the stakeholders in any phase including farmers and consumers. All digital data regarding the five phases will be recorded and maintained on the blockchain in the cloud. Cloud computing service is chosen for two specific purposes: (1) to improve the computational speed of the processing and transactions on the blockchain; (2) any changes made to the software side of the SmartNoshWaste framework could be easily deployed by the developers across different regions.
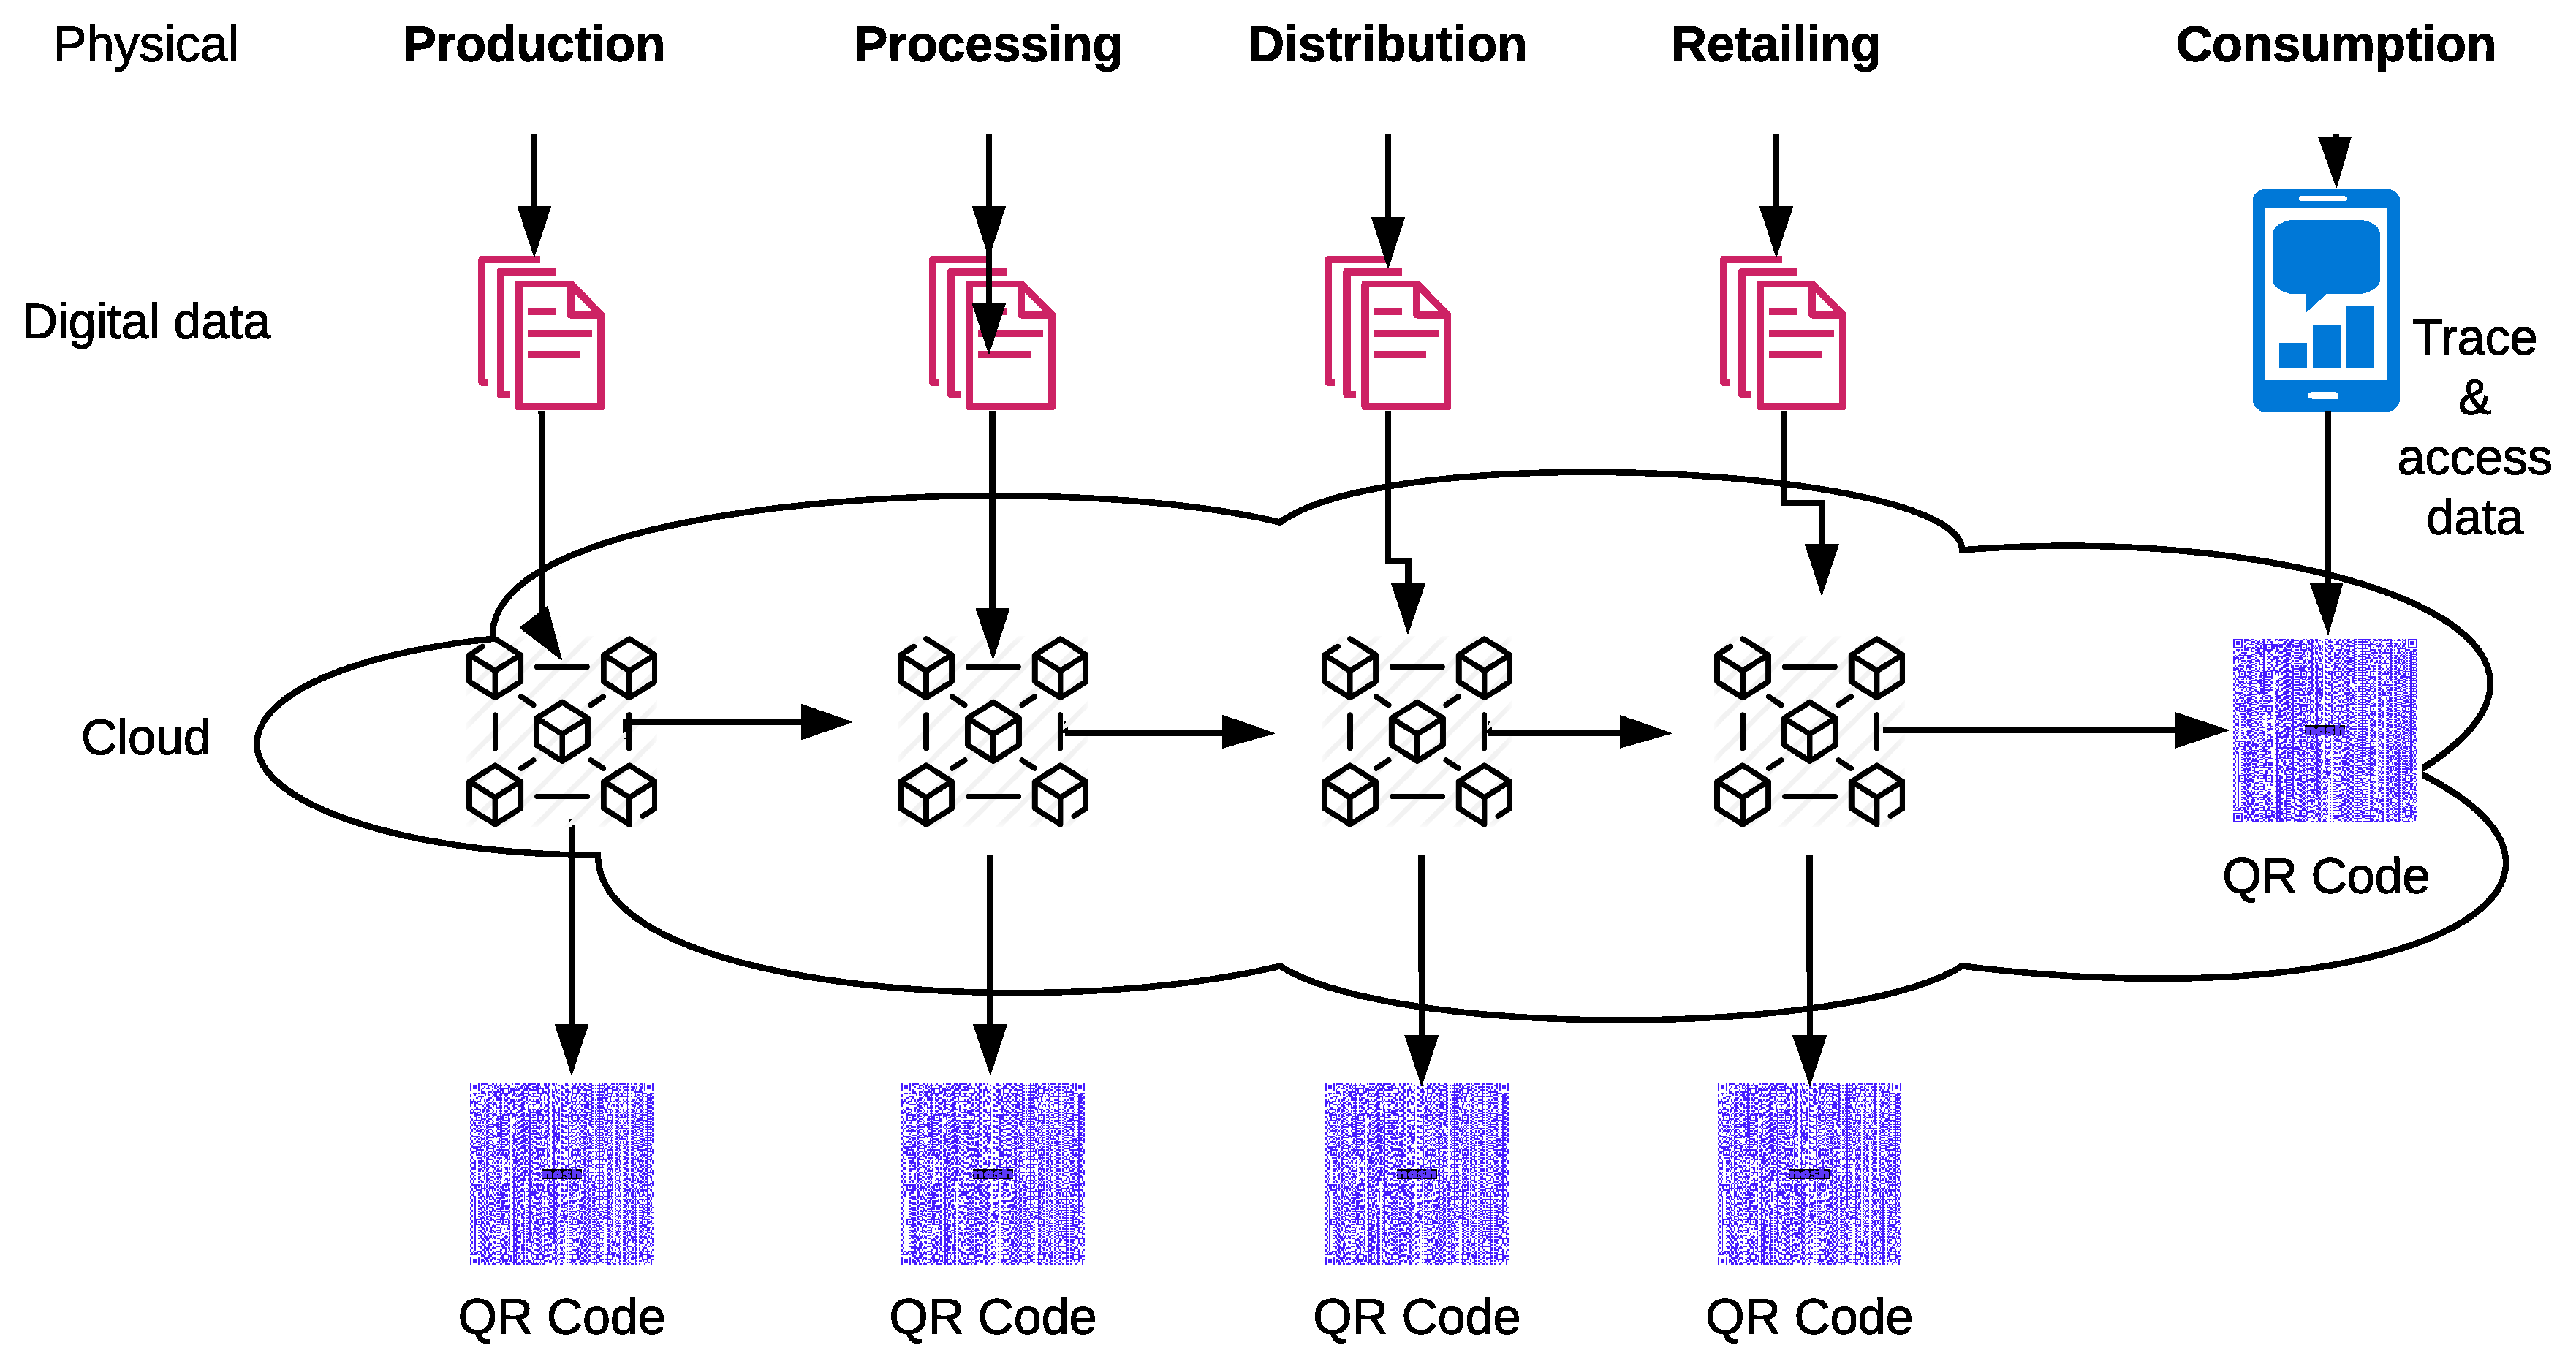
Data System Architecture: To design our BT framework we propose a multilevel system, whose architecture is represented in
Figure 4. Our system has three layers as follows.
Physical layer: This layer comprises of different products from the supply chain from different farmers and producers.
Digital data layer: This layer consists of every single digital data correlated to the produce belonging to the physical layer, which will be used for traceability and accessibility. Example of data about the produce could be the expiry date of the food product, the farm’s identity where it was produced along with the production batch number.
Cloud layer: In this layer, the digital data is processed in the Cloud using BT and made available using QR code at different phases, which is used for traceability and accessibility.
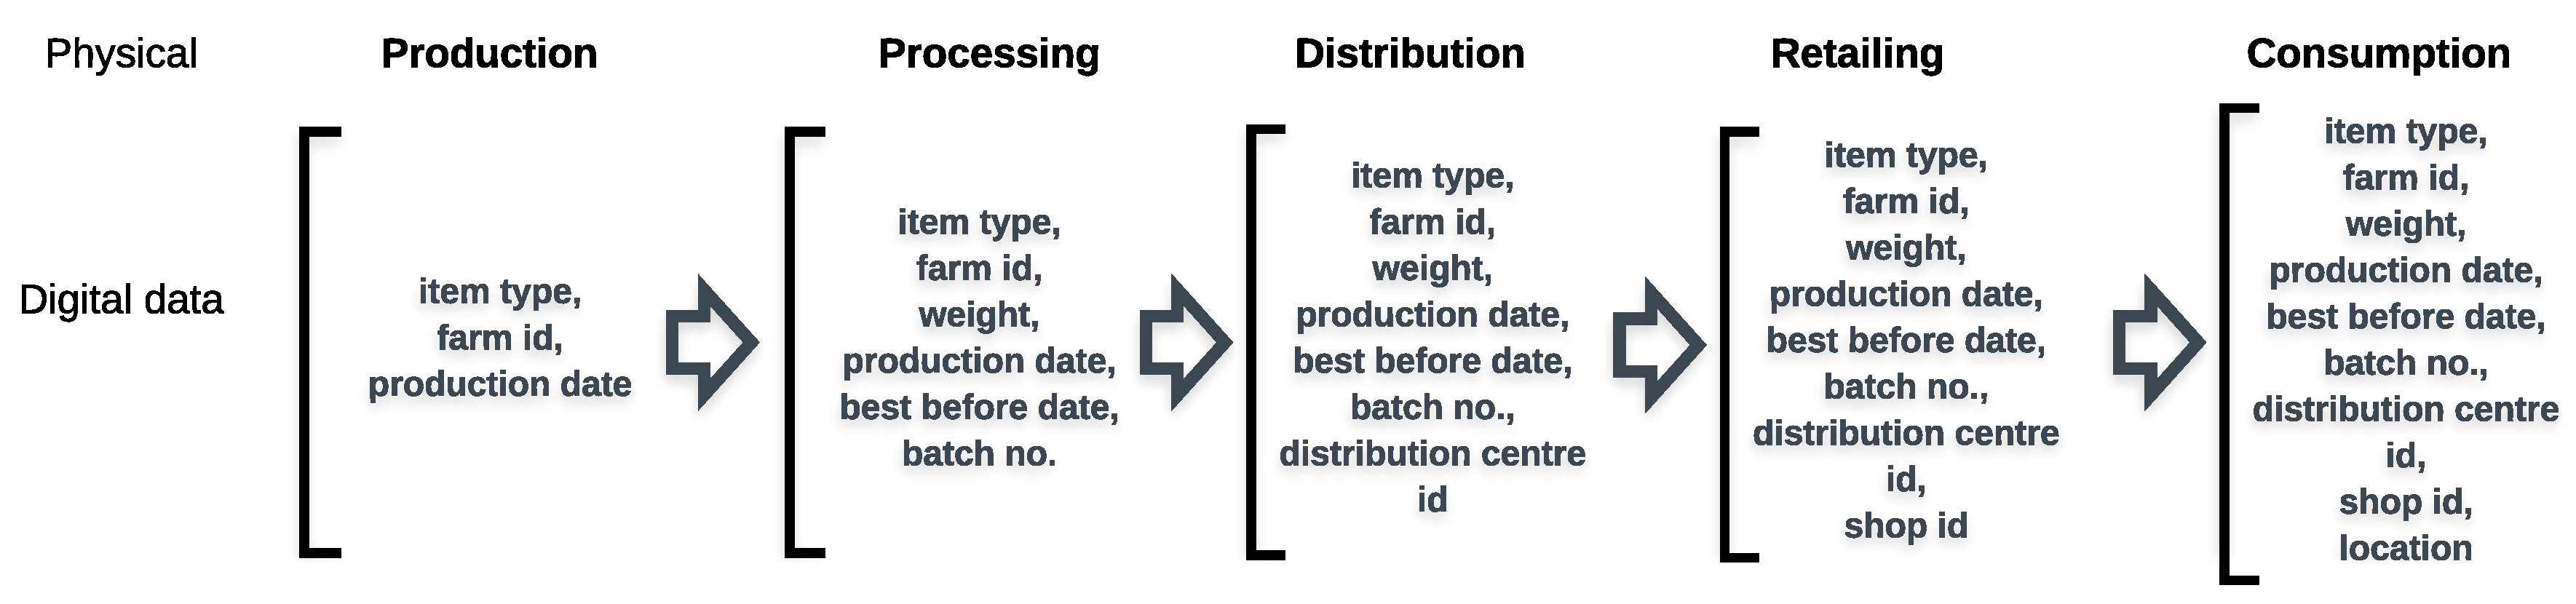
Data stored:
Figure 5 shows the generic data regarding the food item in different phases of the supply chain that are digitized in the digital data layer such that they can be used/stored in the BT framework in the cloud layer. When the food item is produced in the farm the basic data that are stored are: item type, farm id and production date. However, as we progress in to different phases of the supply chain more information about the food item is added and stored in the blockchain. The relevant information about the food item from the production phase are digitized and stored in the genesis block/block 0 and then the item is transported to different phases of the supply chain. As the food item is transported and processed in different phases of the supply chain, more relevant data about the item is added and a new block is created in each phase to store them along with the hash of the previous block. The consumption phases in our proposed framework consist of the following data: item type, farm id, weight, production date, best before date, batch no., distribution centre id, shop id, and location. These data can be modified and vary based on the unique requirements of the farm or processing center or distributor or the country of produce. It should be noted that in order to safeguard the privacy of user, in the consumption phase we only store the geographical location data of the user/consumer tied with the food item data such that the user’s true identity cannot be revealed, however, consumption and wastage details about a particular food item can still be traced.
In each phase of this food supply chain, a new block of data is created, which stores the hash of the previous block such that at any point the food item/ingredient could be tracked and traced. In each step, the block data is also made available in the form of digital QR code (as shown in
Figure 4) such that the digital data about the item on the block is accessible easily to consumers or any stakeholders from any phase in the supply chain. We use the SHA256 algorithm [
45], which is very popular in blockchain nowadays for using the hash function to create the hash of the previous block. In our SmartNoshWaste, we use SHA256 for the hash function because it provides the desirable required security for the associated computational cost on the cloud. If we use a different hash function as in SHA512, then it is computationally more expensive, and henceforth, takes longer to compute on the cloud. In case of using SHA512, it would ultimately increase the computational cost, especially given the fact that thousands of digital data of the food produce will be processed on the cloud every day based on the proposed framework.
Metric to quantify production: We also need to quantify the food production and wastage data such that they could be used by our machine learning module. We have assumed that the amount of food produced is based on consumption, surplus for food security and the amount wasted. In order to achieve this we propose a metric considering the production, consumption, surplus, and wastage of a particular food item each week of each month in a quarter as follows.
In Equation (
1),
P,
C,
S and
W are the total amount of produce for a particular food item, total amount of the food item consumed, the surplus of the food item kept for food security and the amount wasted of the food item, respectively. In the equation,
represents the year (
) and the quarter (
, where
,
and
) of the particular food item being produced, respectively. This is to signify that there are four quarters (
X) (Q1, Q2, Q3, and Q4) and each quarter consist of three months (
N) and each month consists of 4 weeks approximately. A quarter is a three-month period on a company’s financial calendar and we utilize the same concept in food production to quantify and track the data. In the equation,
i signifies the respective phase in the food production supply chain (production, processing, distribution, retailing, and consumption).
For each phases the Equation (
1) will look something as follows, starting from level 1—production phase:
Production:
Processing:
Distribution:
Retailing:
Consumption:
It is also worth noting that except in the production phase the amount produced in processing, distribution, retailing, and consumption maintains a direct relationship with the amount consumed, surplus produced and amount wasted of the food item in the previous phase. This could be denoted by the following equation.
Note: Though we are quantifying production, consumption, surplus and wastage of food, it should be kept in mind that in real world the food supply chain data can often vary due to unforeseen or unknown variables that could often include geographical and political issues. However, to propose a framework to minimize food waste using machine learning we have to make certain assumptions and henceforth, quantifying the data in the aforementioned approach. It should also be kept in mind that often times food wastage and loss is closely related to food surplus [
46,
47] in different phases of the supply chain. For this purpose, we try to minimize food surplus in a particular phase to minimize wastage.
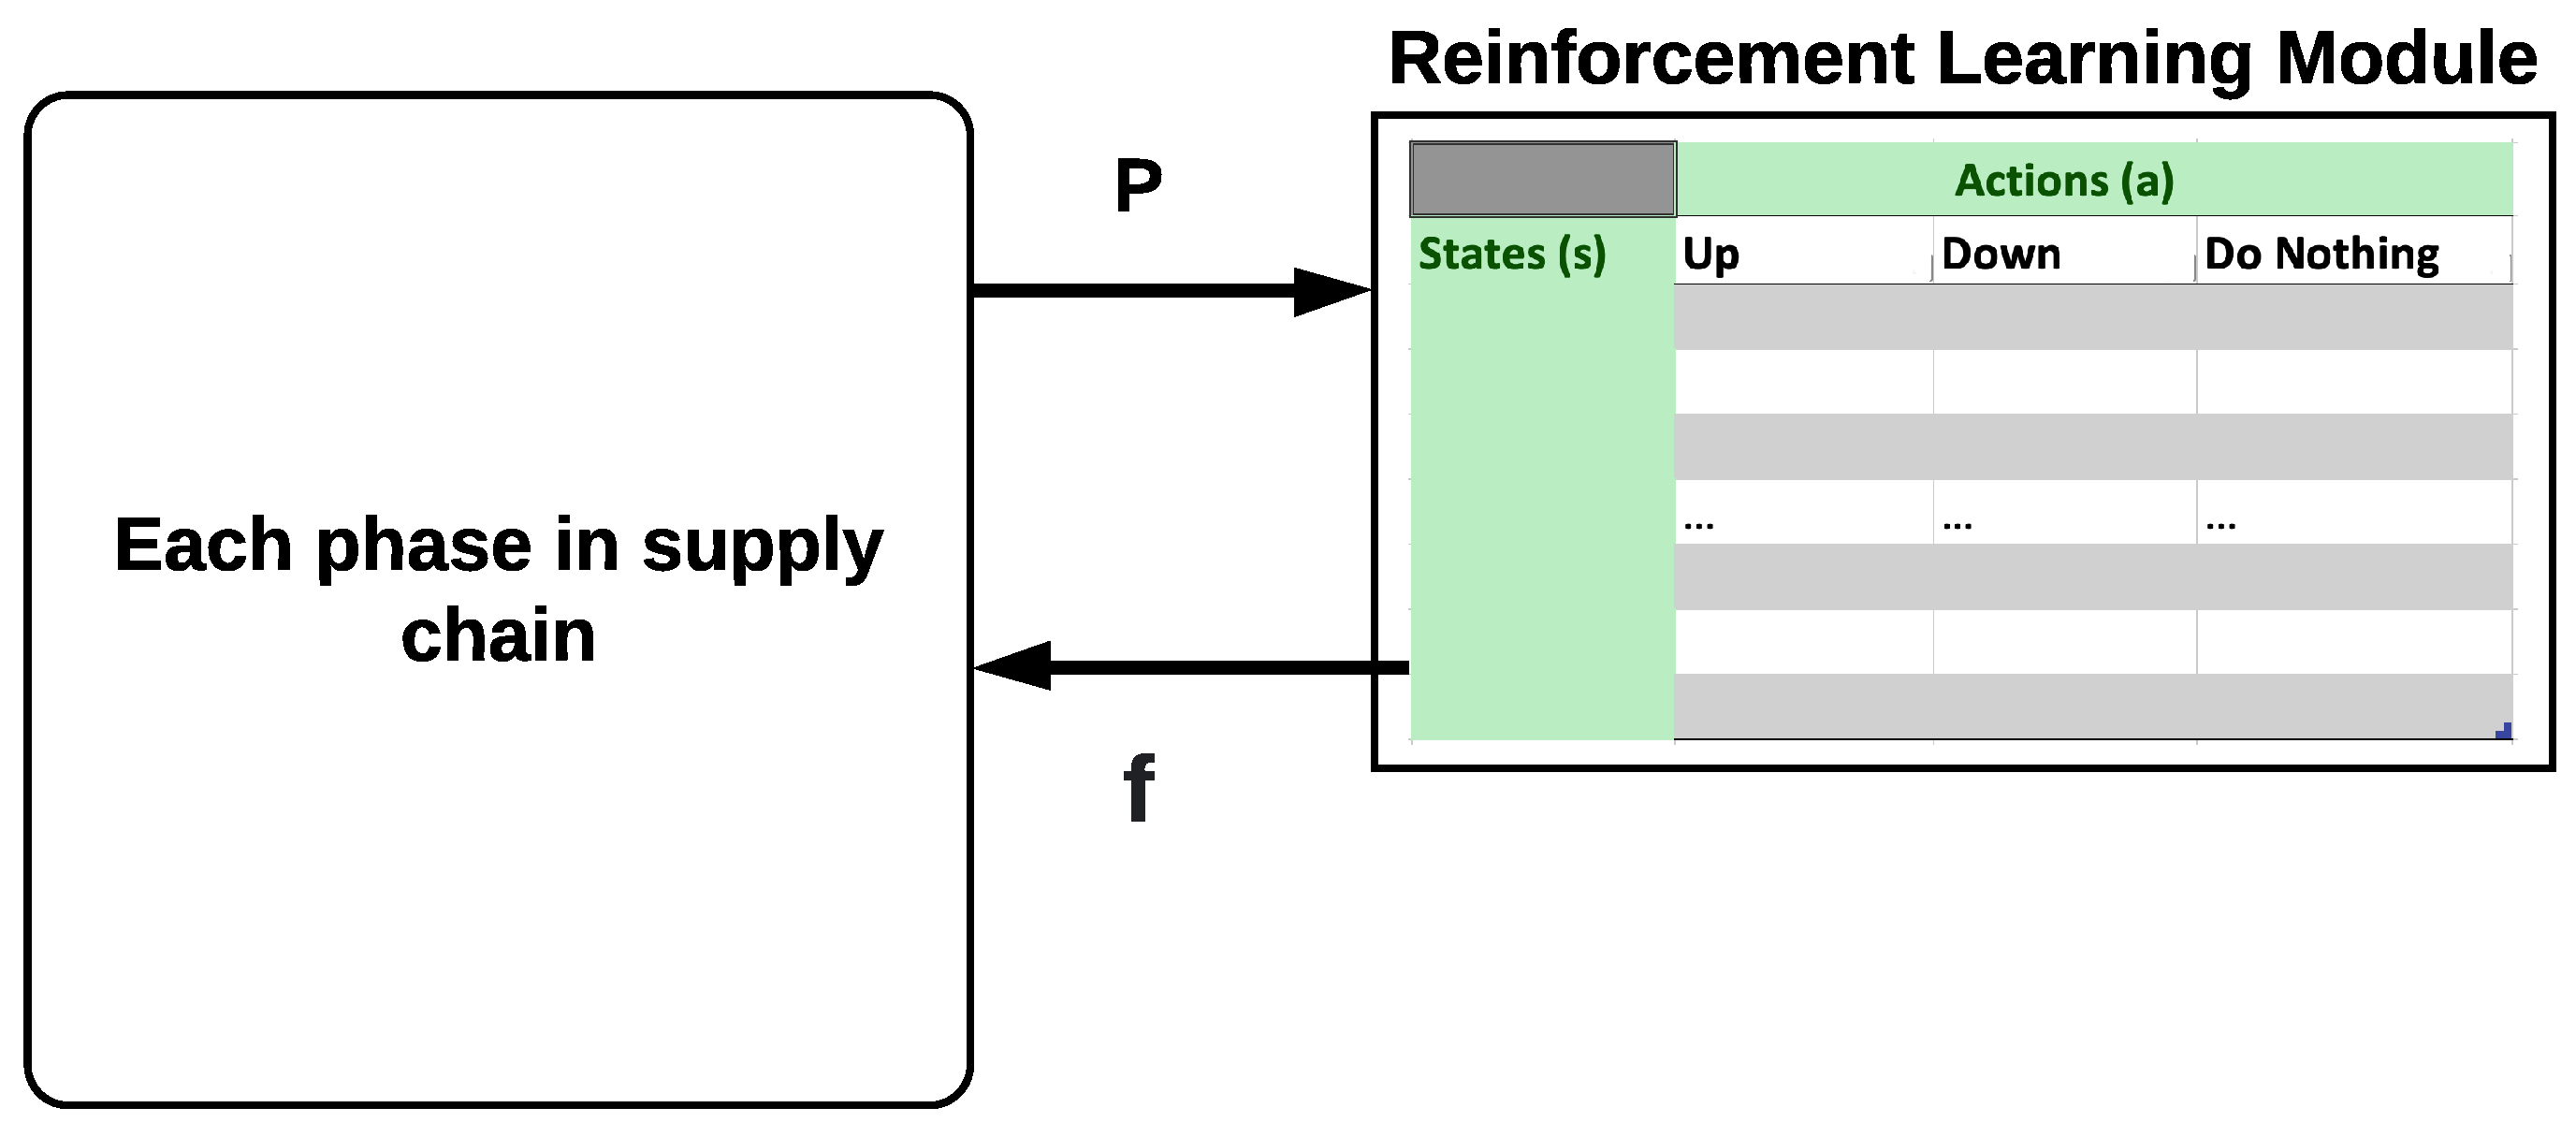
4.2. Machine Learning Module of SmartNoshWaste
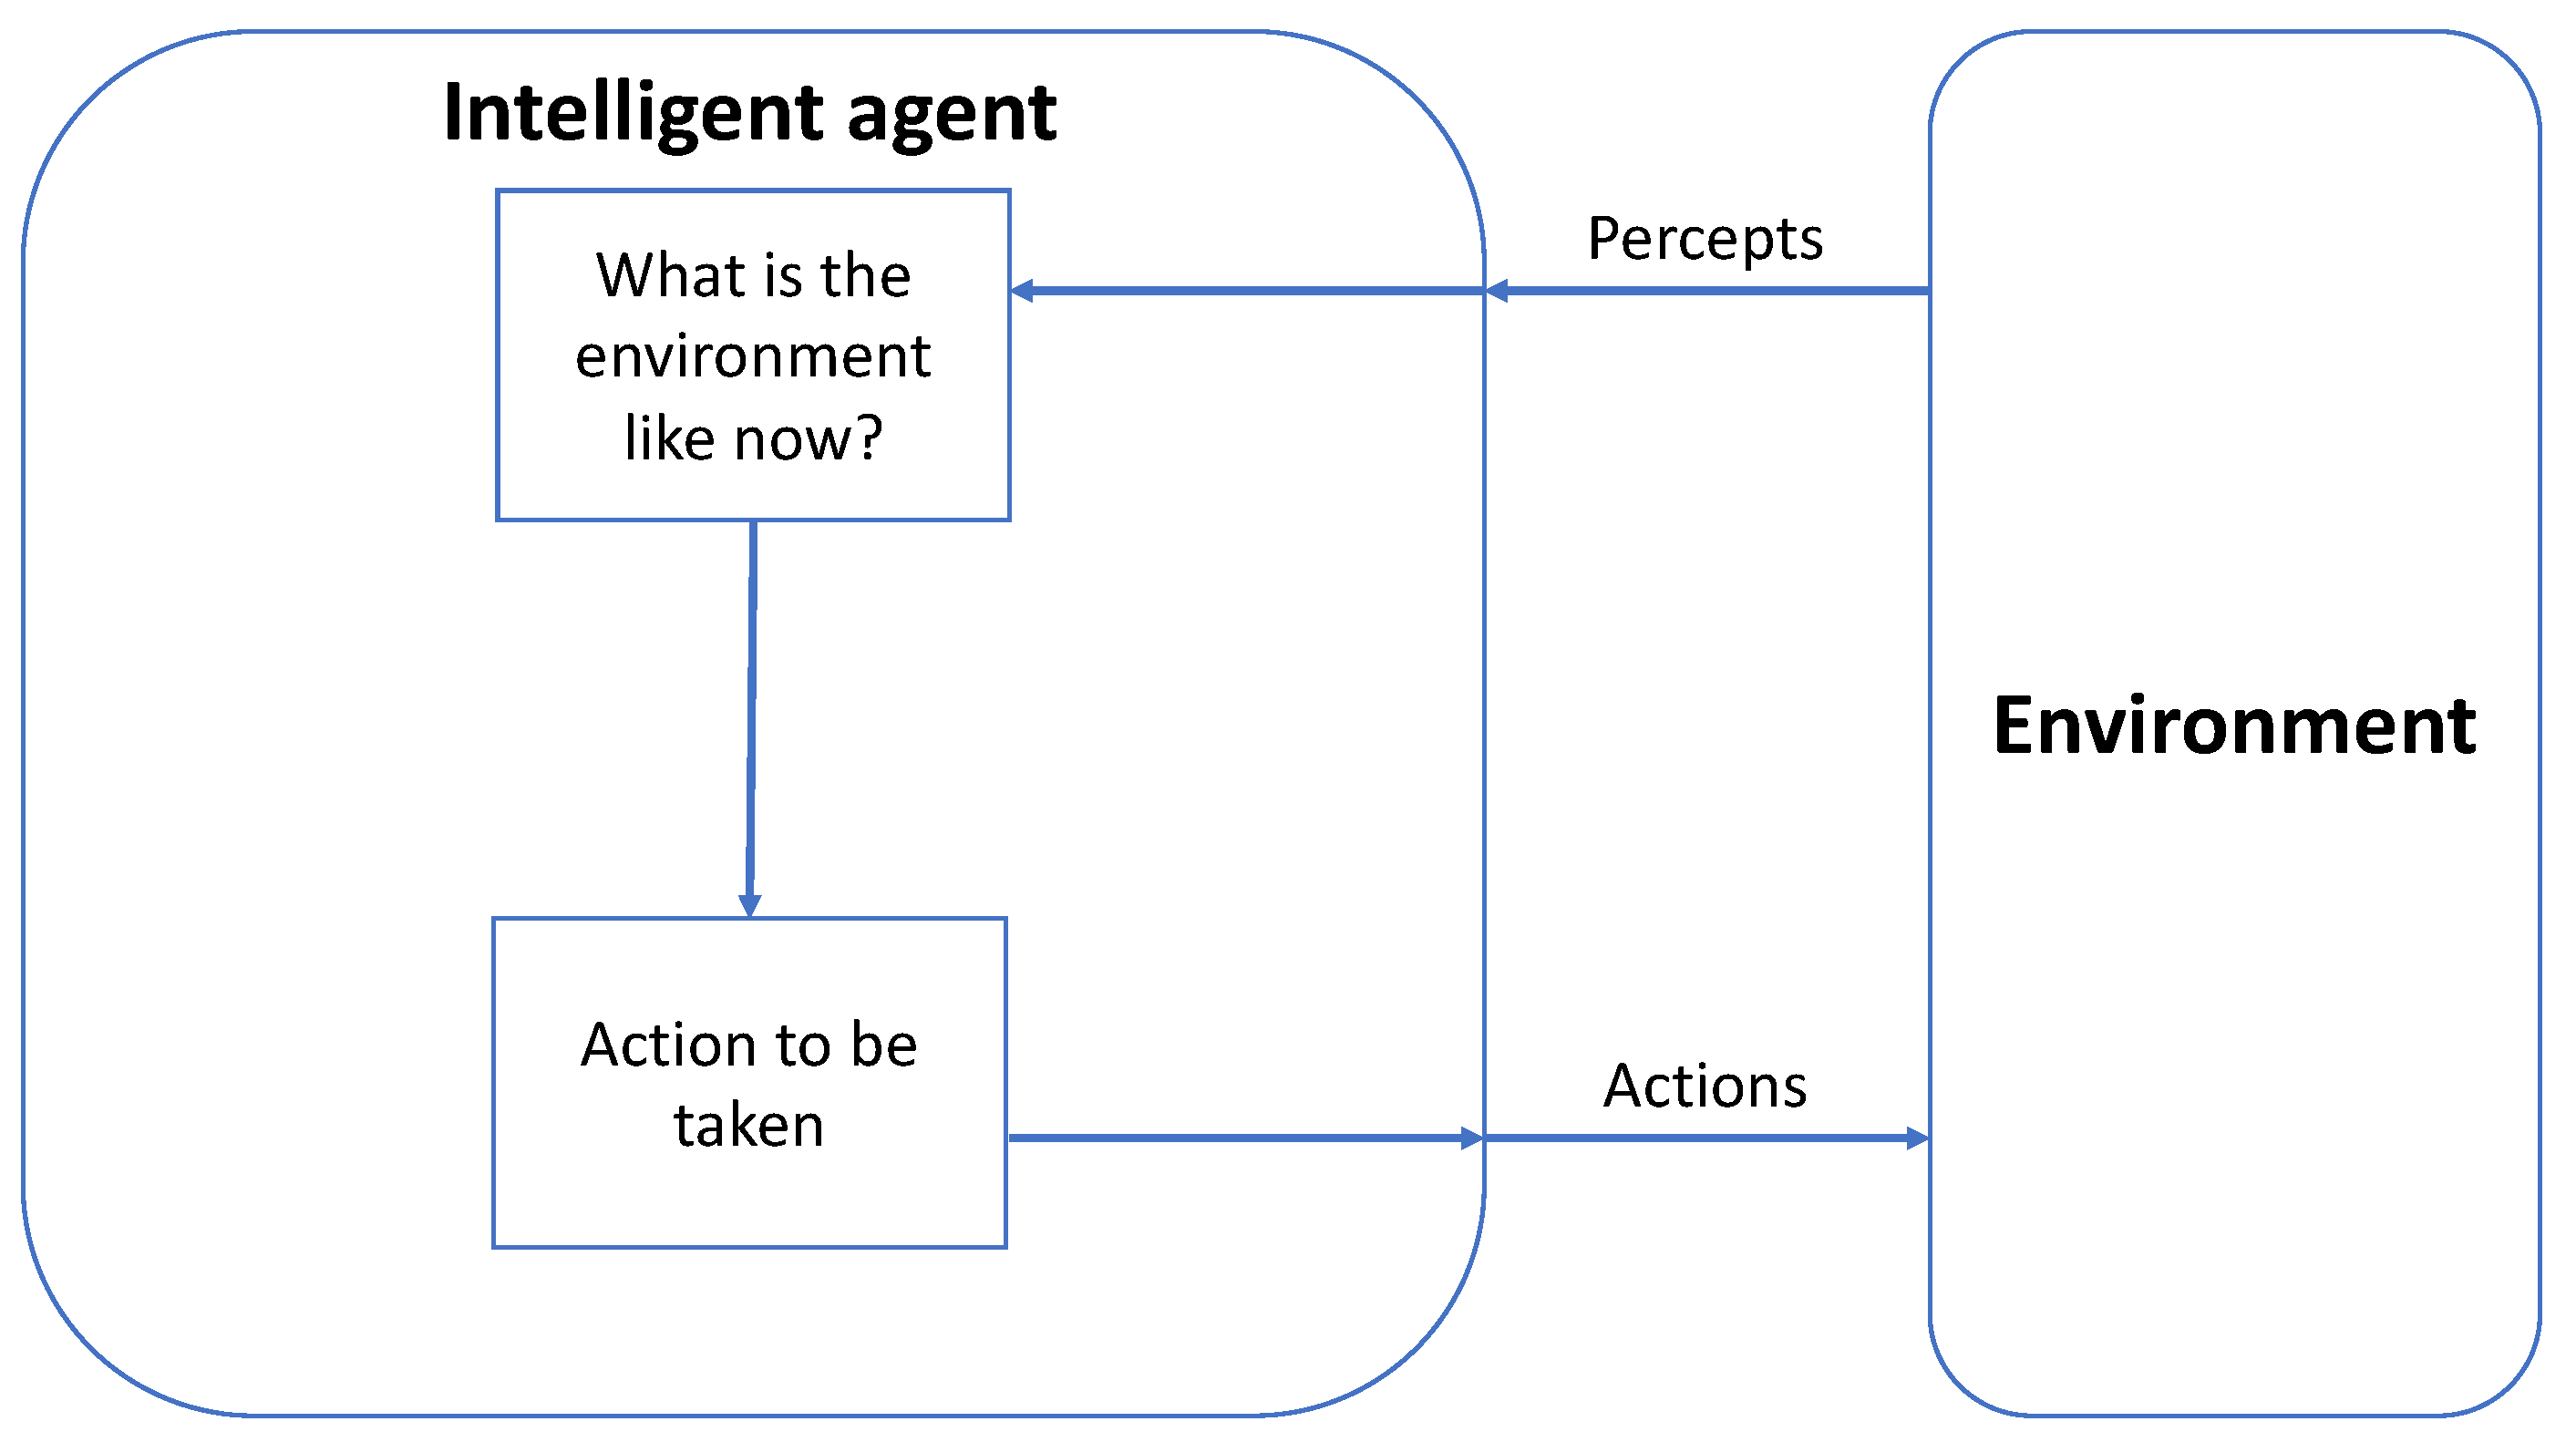
As part of the SmartNoshWaste framework we utilize Q-learning based reinforcement learning (RL) [
48] (as represented in
Figure 6). In Q-learning, the RL agent maintains a table consisting of actions (
a) and states (
s), where it can identify an optimal action-selection policy based on the
Q function that the agent computes. The RL agent determines the environment (
), in which the agent observes the state (
) at a given time instance
t. Then it performs an action (
), and receives a reward (
) for that instance in
. At every time instance (
t-th), the agent chooses an action
from a predefined list of actions where
and
K is the maximum number of actions allowed for a given state. Following the action at time
t any changes are perceived in the
are observed at time
, when the state of
changes to
.
In SmartNoshWaste, the environment
is the production amount (
) of a food item in a particular phase consisting of a tuple of food consumption, surplus, and wastage (
) as per Equation (
1).
The goal of the RL agent is to maximize the reward
in the future. The propagation of information from the future is discounted by a factor called
at every time step such that:
in order to lessen the reward’s effect on the RL agent’s choice of action. For every time step the probability that the agent chooses an action at a given state is defined by a policy function. In this policy, the function, which maximizes the agent’s long term reward generation is called action-value function, which is defined by
and is shown in Equation (
8).
In Equation (
8),
is the learning rate at which the agent learns new information. We have to keep in mind that the optimal
action-value function could be obtained by iteratively updating
in Equation (
8). Now, in order to maximize the reward generation we would require a
reward function (
).
Since, food surplus leads to a lot of wastage if not consumed properly we try to minimize food surplus in order to minimize wastage. Given the fact that food production data is correlated to consumption, surplus, and wastage (as shown in Equation (
1)), if we consider a variable—
f—that denotes the amount of food that should be reduced or increased in the food surplus to minimize wastage in that said phase of supply chain, we can modify Equation (
1) as follows.
In Equation (
9), the value of
f can be positive, negative, or zero. Based on this equation, we can develop our reward function as follows.
The RL agent has three actions: Up (add the value of f to ), Down (subtract the value of f to ) and Do Nothing (value of f is set to zero). The actions in the RL agent are invoked depending on the initiator of the particular point in the phase. For our proposed technique, the actions are invoked every week.
Note: When we mention the goal to minimize food surplus, we keep in mind that the surplus is minimized not to threaten food security in that particular phase, however, only to minimize food wastage at that phase. RL agent is implemented locally, meaning that local optimization is performed in each phases of the supply chain to minimize food wastage. As per Equations (
1) and (
7), since, production amount is correlated to the consumption, surplus and wastage amount of other phases in the supply chain, local optimization of wastage using RL agent would also lead to global optimization of wastage throughout all phases as well. The value of
f in local optimization is defined or set by the initiator or manager of the particular point in the particular phase in the supply chain. For example,
f value for a farm could be set by the farmer to minimize wastage in that farm, whereas, the
f value in the retailing phase could be set by the shop owner to minimize wastage in the shop. These
f values for different points in different phases could either be the same or different based on the requirements of consumption, surplus and wastage of that particular point in the respective phase. The
f value after being used by the RL agent to find the minimized value of wastage in that particular phase (based on Equation (
10)), it could be used by the initiator or manager as a guiding amount to reduce waste. For example, if the
f value by RL agent is computed as
x% of the surplus (as shown in
Figure 6), which should be reduced in the shop to achieve
y% of wastage, then the manager should reduce the surplus by
x% in the next production cycle to achieve that reduction in waste goal.
5. Experimental Evaluation: Case Study with Real Food Data
To evaluate the efficacy of our proposed SmartNoshWaste framework we implemented it on real data collected from the nosh app [
20]. The nosh app is a food management app that helps the consumer to reduce food waste in their household by better managing their food consumption. The app comes with the capability to track the food items consumed or wasted in the week such that the user can make a more informed decision on what food to buy or not to buy the next time they go shopping. We focused on the data on “potato” collected worldwide via the nosh app. We chose to focus on data on potato because it is one of the most popular food items that is wasted, especially in the United Kingdom where the research team is located [
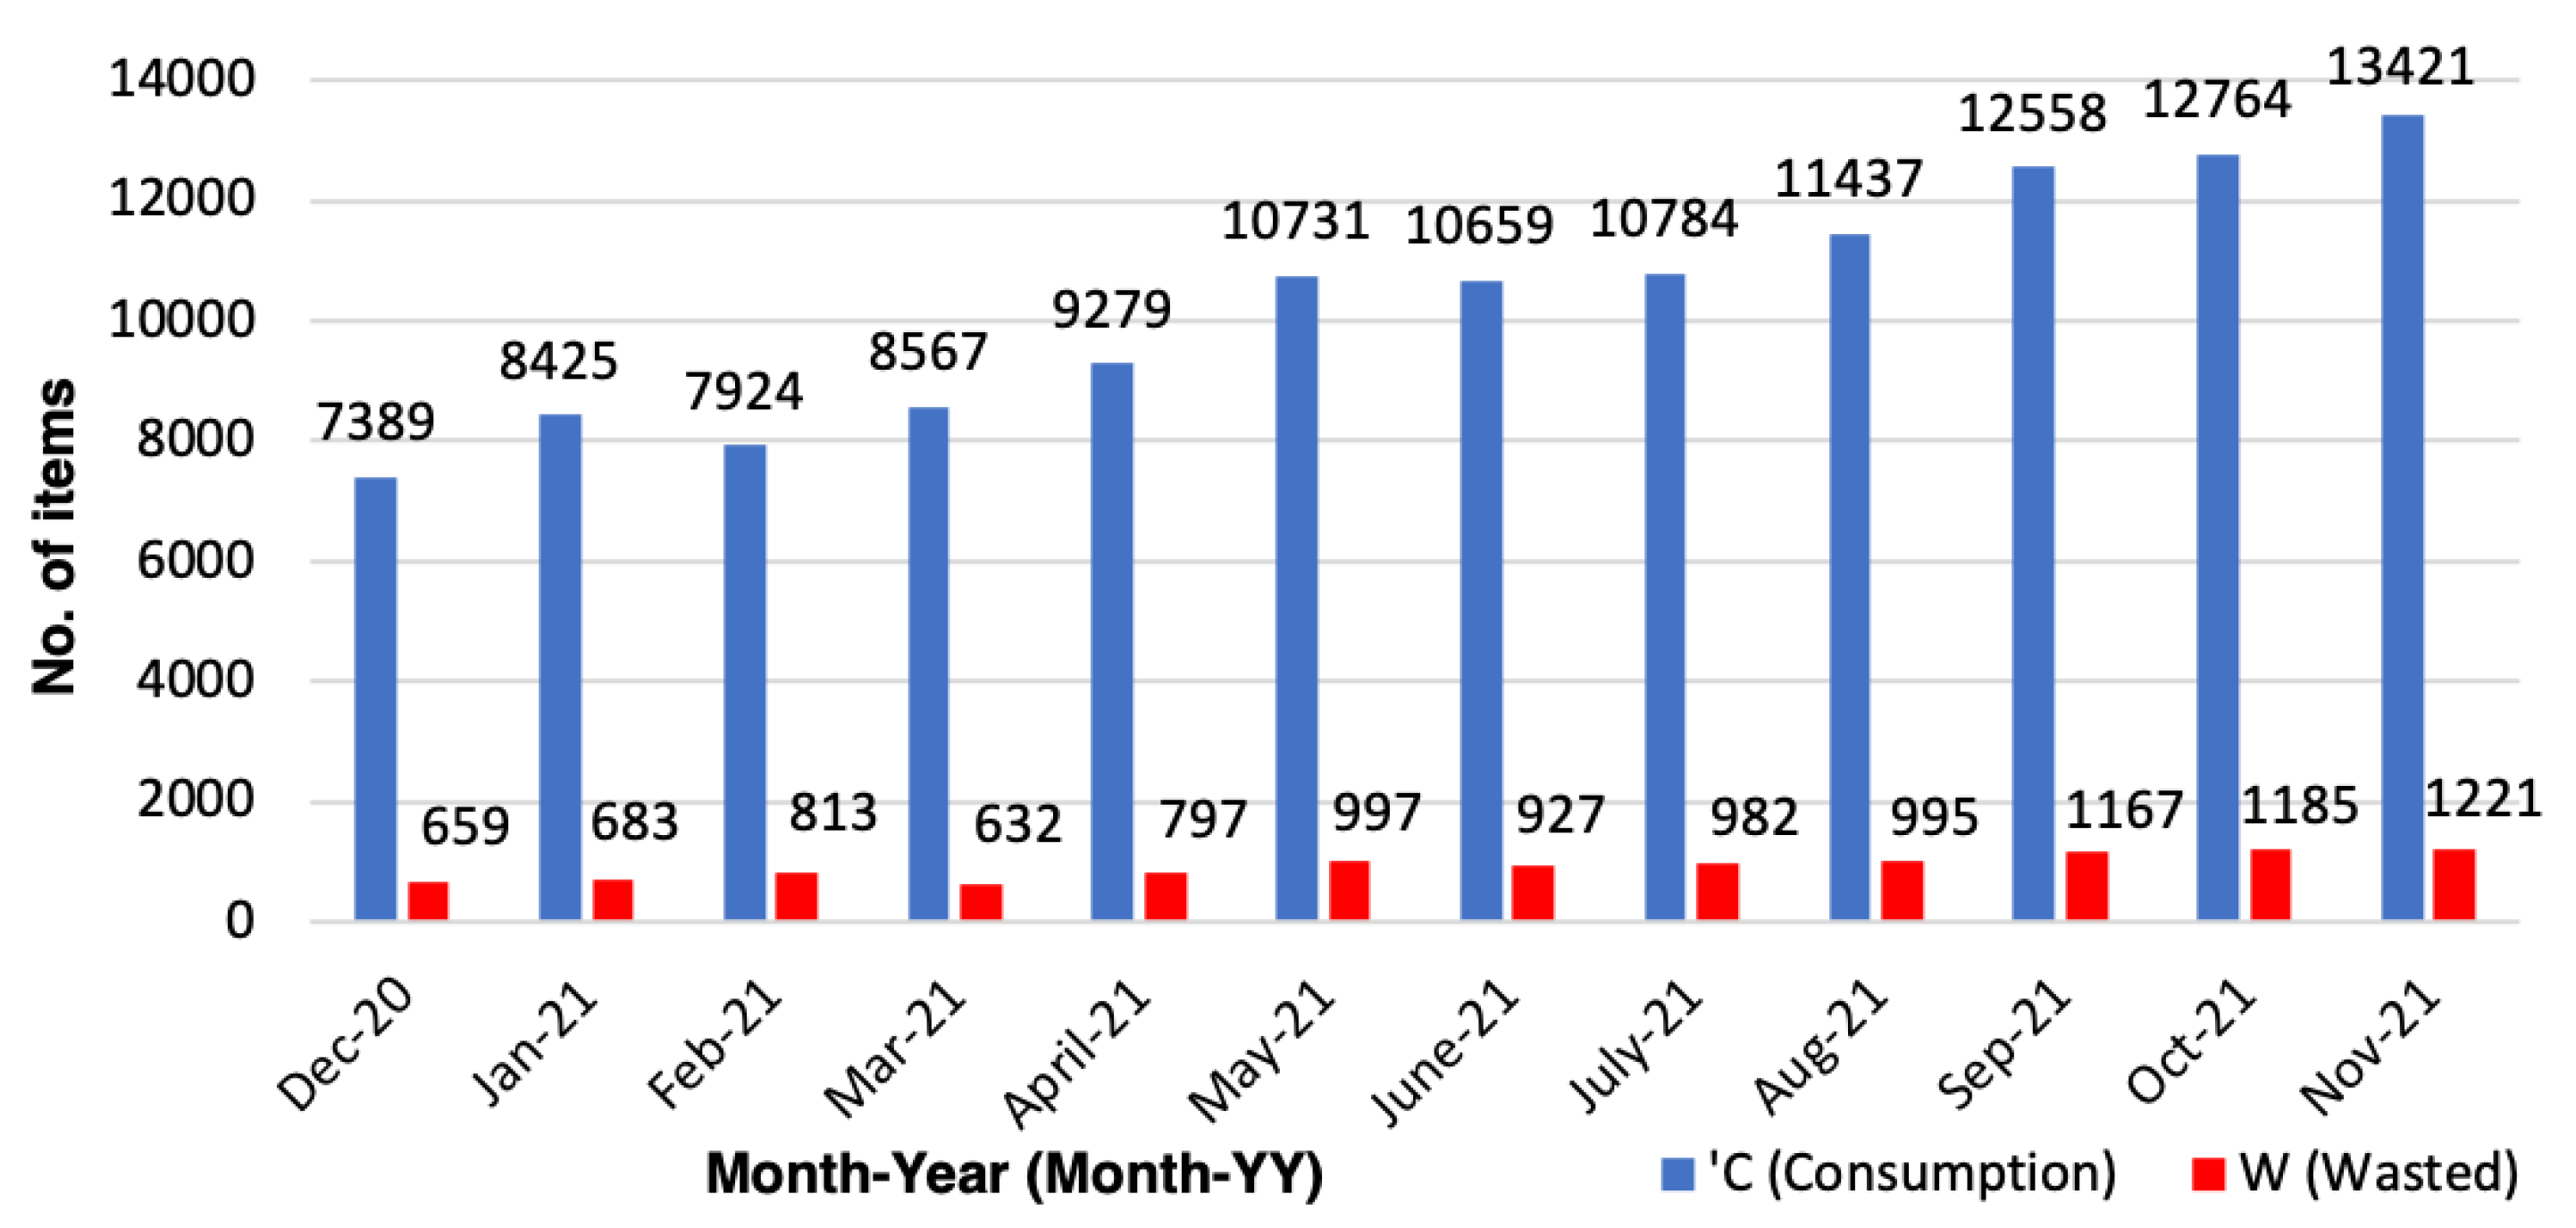
49]. The data collected are completely anonymized such that from the data user/consumer could not be identified, however, each food item datum comes with a geolocation tag such that the consumption or wastage about the item could be tracked in a particular region. (It should be noted that no personal information was included in the dataset meeting the de-identification criteria.) There were 134,996 potato consumption data collected worldwide via the nosh app over a 1 year period (December 2020 to November 2021).
Figure 7 shows the consumption and wastage data on potatoes collected via the nosh app, where the
Y-Axis represents the number of items consumed (
) or wasted (
W) and
X-Axis represents the months of the year when the data was collected. The nosh app was created to help consumer manage their food wastage occurring from overbuying and/or forgetting to consume the food before the “best before date” of the item. For this reason, the app collects data about consumption and wastage. The consumption data (
) from the nosh app already considers the amount of food consumed by the user (
C) and the surplus bought by the user (
S), aiming to reduce waste by reducing the food surplus. Therefore, the consumption data from the nosh app can be denoted using the following equation.
In Equation (
11),
represents the year (
) and the quarter (
, where
,
and
) of the potato being consumed in the consumption phase (level 5) respectively. We evaluated SmartNoshWaste framework in the consumption phase, since, we use the data from the nosh app to find the desirable value of
f that we need to subtract from the food surplus to achieve our minimal wastage goal. Our goal is to find
f from the Machine Learning Module of SmartNoshWaste such that
leads to reduction in waste (
) of potatoes for consumers. It should be noted that we aim to find the value of
f that needs to be subtracted from
.
From
Figure 7 it should be noted that 123,938 amounts of potatoes were consumed whereas, 11,058 amounts of potatoes were wasted over the 12 month period. From the chart (
Figure 7) we can also notice that the average wastage over the months remained around 7% to 9% of the respective consumption for that month. Based on this knowledge we chose
f value from 1 to 9 and evaluated our SmartNoshWaste’s Machine Learning Module. We also predicted the percentage of potatoes that could be saved from being wasted compared to the amount of potatoes wasted over the 12 months period, which is collected from the nosh app.
Table 1 shows the prediction data evaluated by the Machine Learning Module of SmartNoshWaste. In the table,
represents the predicted amount of potatoes wasted based on the
f value;
represents the amount of potatoes wasted, which is collected from the nosh app;
is the percentage of potatoes that could be saved, predicted by the Machine Learning Module of SmartNoshWaste.
is calculated based on
. From the
Table 1 it is evident that we could potentially save 9.46% potatoes more compared to the original amount of potatoes wasted.
6. Discussion and Future Works
There are several standards available related to food safety and traceability such as the General Food Law in the EU [
50] and the Food Safety Modernization Act (FSMA) [
51] in the United States, which focus on standardizing the traceability of the digital food production information in some of the stages of the food supply chain. However, these standards are regional, and currently, there is no holistic standardization approach of the tracking and recording digital data for food traceability and waste purposes in all stages of the food supply chain across the globe. The proposed SmartNoshWaste aims to provide a general framework that can be implemented by academics and industry practitioners to reduce food waste despite geo-political and standardization difference across different regions around the globe.
Given the fact that SmartNoshWaste utilizes blockchain, QR code, cloud computing, and machine learning in conjunction to tackle food waste, each technology involved in the framework comes with its own implementation issues based on the implementation of the framework by targeted software developer(s) in a particular region. As SmartNoshWaste aims to provide a holistic approach to use blockchain, QR code, cloud computing, and machine learning in conjunction to tackle food waste; specific implementation challenges related to each of these associated technologies are not discussed in detail as they would not fall within the scope of this research and framework proposal.
One of the key challenges of using blockchain in a smart city could be to prioritize privacy and data security of the citizens [
52]. If we look closely to some of the implementations of the smart city projects using blockchain in the practice then we could notice that regardless of using blockchain as a technology, the implementation to protect privacy and improve data security of citizens vary based on the available infrastructure of the respective project. Examples of such smart city projects in practice include French City Brain [
53], Smart Dubai [
54] and Limestone Network (Singaporean Startup) [
55]. Keeping this in mind, while implementing SmartNoshWaste as part of the smart city, the stakeholders including software developer(s) might have to modify the blockchain network to improve the privacy and data security of its citizen based on the respective infrastructure of the smart city.
In
Section 4.1, we have used digital QR code to make the food data from each phases of the supply chain accessible and traceable by every stakeholders including the consumer. Though QR code has really good resistance against defacement or error correction in case of wear and tear of the physical print of QR codes, it should be kept in mind that based on the implementation of the QR code, security of protecting the data embedded in the QR code will also vary. For example, physical printouts of QR code could be vulnerable to man-in-the-middle attack, by replacing the legitimate QR code by a fake one. Or the payload in the QR code could also be replaced by misrepresented payload, henceforth, damaging the integrity of the data stored within the QR code to be accessible to the stakeholders [
56]. To avoid these challenges we have implemented our QR code in digital form, which could be verified over a mobile platform including smartphones, tablets, etc. Moreover, to avoid earlier mentioned malpractice the exact implementation of the QR code would depend on the available infrastructure of the smart city and the implementation by the developers.
Another point to keep in mind that we have used Q-learning (Q-table) based reinforcement learning, which is a type of delayed reinforcement learning, where the reward is delayed till a better understanding of the enthronement is gathered through actions by the intelligent agent [
57]. Such type of machine learning algorithm depends on training the agent for a sufficient time to meet convergence. However, there are better machine learning algorithms that could improve this shortcoming and could lead to better rewards with less execution time and memory space. One such model could be Deep Q-Learning [
58], where deep neural network is used with Q-table to map input states to the action and Q-value pair.


