
Soft Assets Consideration in Smart and Resilient City Development


Graduate School of Media and Governance, Keio University, Fujisawa 252-0882, Japan
*
Author to whom correspondence should be addressed.
Smart Cities 2022, 5(1), 108-130; https://0-doi-org.brum.beds.ac.uk/10.3390/smartcities5010007
Submission received: 10 October 2021
/
Revised: 14 January 2022
/
Accepted: 18 January 2022
/
Published: 26 January 2022
(This article belongs to the Special Issue Defining and Debating on Smart Cities or Smart Buildings)
Abstract
:For a smart city, soft or non-physical assets share an important capital component with many impacts in different contexts. They enable a city to deliver and mainstream a people-centered policy in addition to the benefits provided by traditional, hard infrastructure. Soft assets can involve social and human capital, knowledge, participation, and innovative approaches that drive value in the city. However, it is always a challenge for city policy makers to identify and strengthen these soft assets using a systemic approach due to their inherent characteristics. This paper argues that soft assets should be strategically integrated into the development process of smart and resilient cities. Therefore, exploring various approaches to prioritize soft asset consideration would provide helpful guidelines to city policy makers for municipal value creation, and identify where the greatest needs for soft or intangible assets lie. This paper examines how to identify and decide which soft assets should take priority in smart and resilient cities. The findings can assist policy makers in their consideration of an optimal mix and balance of soft assets required in the city to improve living structures for a people-centered approach.
1. Introduction—Smart and Resilient Cities
Each city in developing countries has their own values, approaches, and objectives. Although there is no single definition of a smart city, there are two main dimensions in the evolution of the smart city concept [1]. One is the ICT and technology-oriented approach (hardware) and the second is a people-oriented approach (software). Another perspective focuses on top-down and bottom-up initiatives [2]) and improving relationships between people and government [3]. Angelidou [4] also differentiated between hard versus soft infrastructure-oriented strategies and the interlocking relationships between each. One is insufficient technologies (or ICT-integrated hard infrastructure), as hard infrastructure cannot work without soft assets. Moreover, hard assets alone do not define a city; it is the participation of people that is vital. Second, the importance of human and social capital should be highlighted and emphasized, since smart city development needs a variety of resources, along with innovative and creative approaches to customize a city and build robust social systems for the needs of its citizens. Considering this dichotomy between hardware and software as well as blended options, cities need to be smart, lean, integrated, cost-effective, and resource efficient. In addition, cities must not only strive to be environmentally friendly and sustainable, but also create a positive impact on citizens’ well-being and financial sustainability [2].
On the other hand, using the definition of a resilient city seems to be more appropriate, but it is still an emerging concept. Resiliency covers different domains, such as social and ecological resilience, the socio–ecological system, urban hazard mitigation, community resilience, and other aspects. The main focus is addressing natural disaster management and response capacity, including many man-made disasters originating from natural resources management and climate change. The concept of resilience has been extended beyond natural disaster events. OECD describes it more generally: resilient cities are cities that have the ability to absorb, recover and prepare for future shocks (economic, environmental, social, and institutional) and also promote sustainable development, well-being, and inclusive growth [5]. With more specific focus on natural disaster risk, UNISDR defines a resilient city as a city capable to withstand or absorb the impact of the hazards, shocks and stresses through adaptation or transformation, in order to guarantee long-term sustainability, as well as its basic functions, characteristics and structures [6].
There are several studies identifying the gaps between the two concepts, smart and resilient. For example, one attempts to combine the components and character of a smart city and a resilient city [7]. Another seeks to achieve better integration of the strategies that seem to be widely desirable and pursued. However, the integration has to be based on a robust scientific approach to provide methodologies and tools for promoting cross-sectoral and multi-objective strategies [8].
As such, the integration of smart and resilient cities is a new approach. The important step is the synergy between the two and creating a complementary relationship in dealing with climate change. In short, smart and resilient city approaches are mutually complementary models with two different focuses: reducing environmental load (in the case of a smart city) and strengthening adaptation and transformation (for a resilient city) [9]. In this regard, there is more room for integrating soft assets, not only by looking at traditional ‘smartness’ aspects but also factoring in ‘resilience’ as an integral part of robust city development.
Within this context, this paper examines the following items: (i) why soft assets are a value driver and what assets are involved; (ii) some guidelines to understand the integration of soft assets and creating value; (iii) explanation of the key components of the tool for identifying soft assets; (iv) two case studies from the India Smart City Mission to examine how soft asset consideration and decision making work in actual cases, including network analysis, elements influencing the decision, and the use of analytical tools such as the Cytoscape (https://cytoscape.org (accessed on 4 January 2022).
2. Soft Assets as a Value Driver
2.1. Features
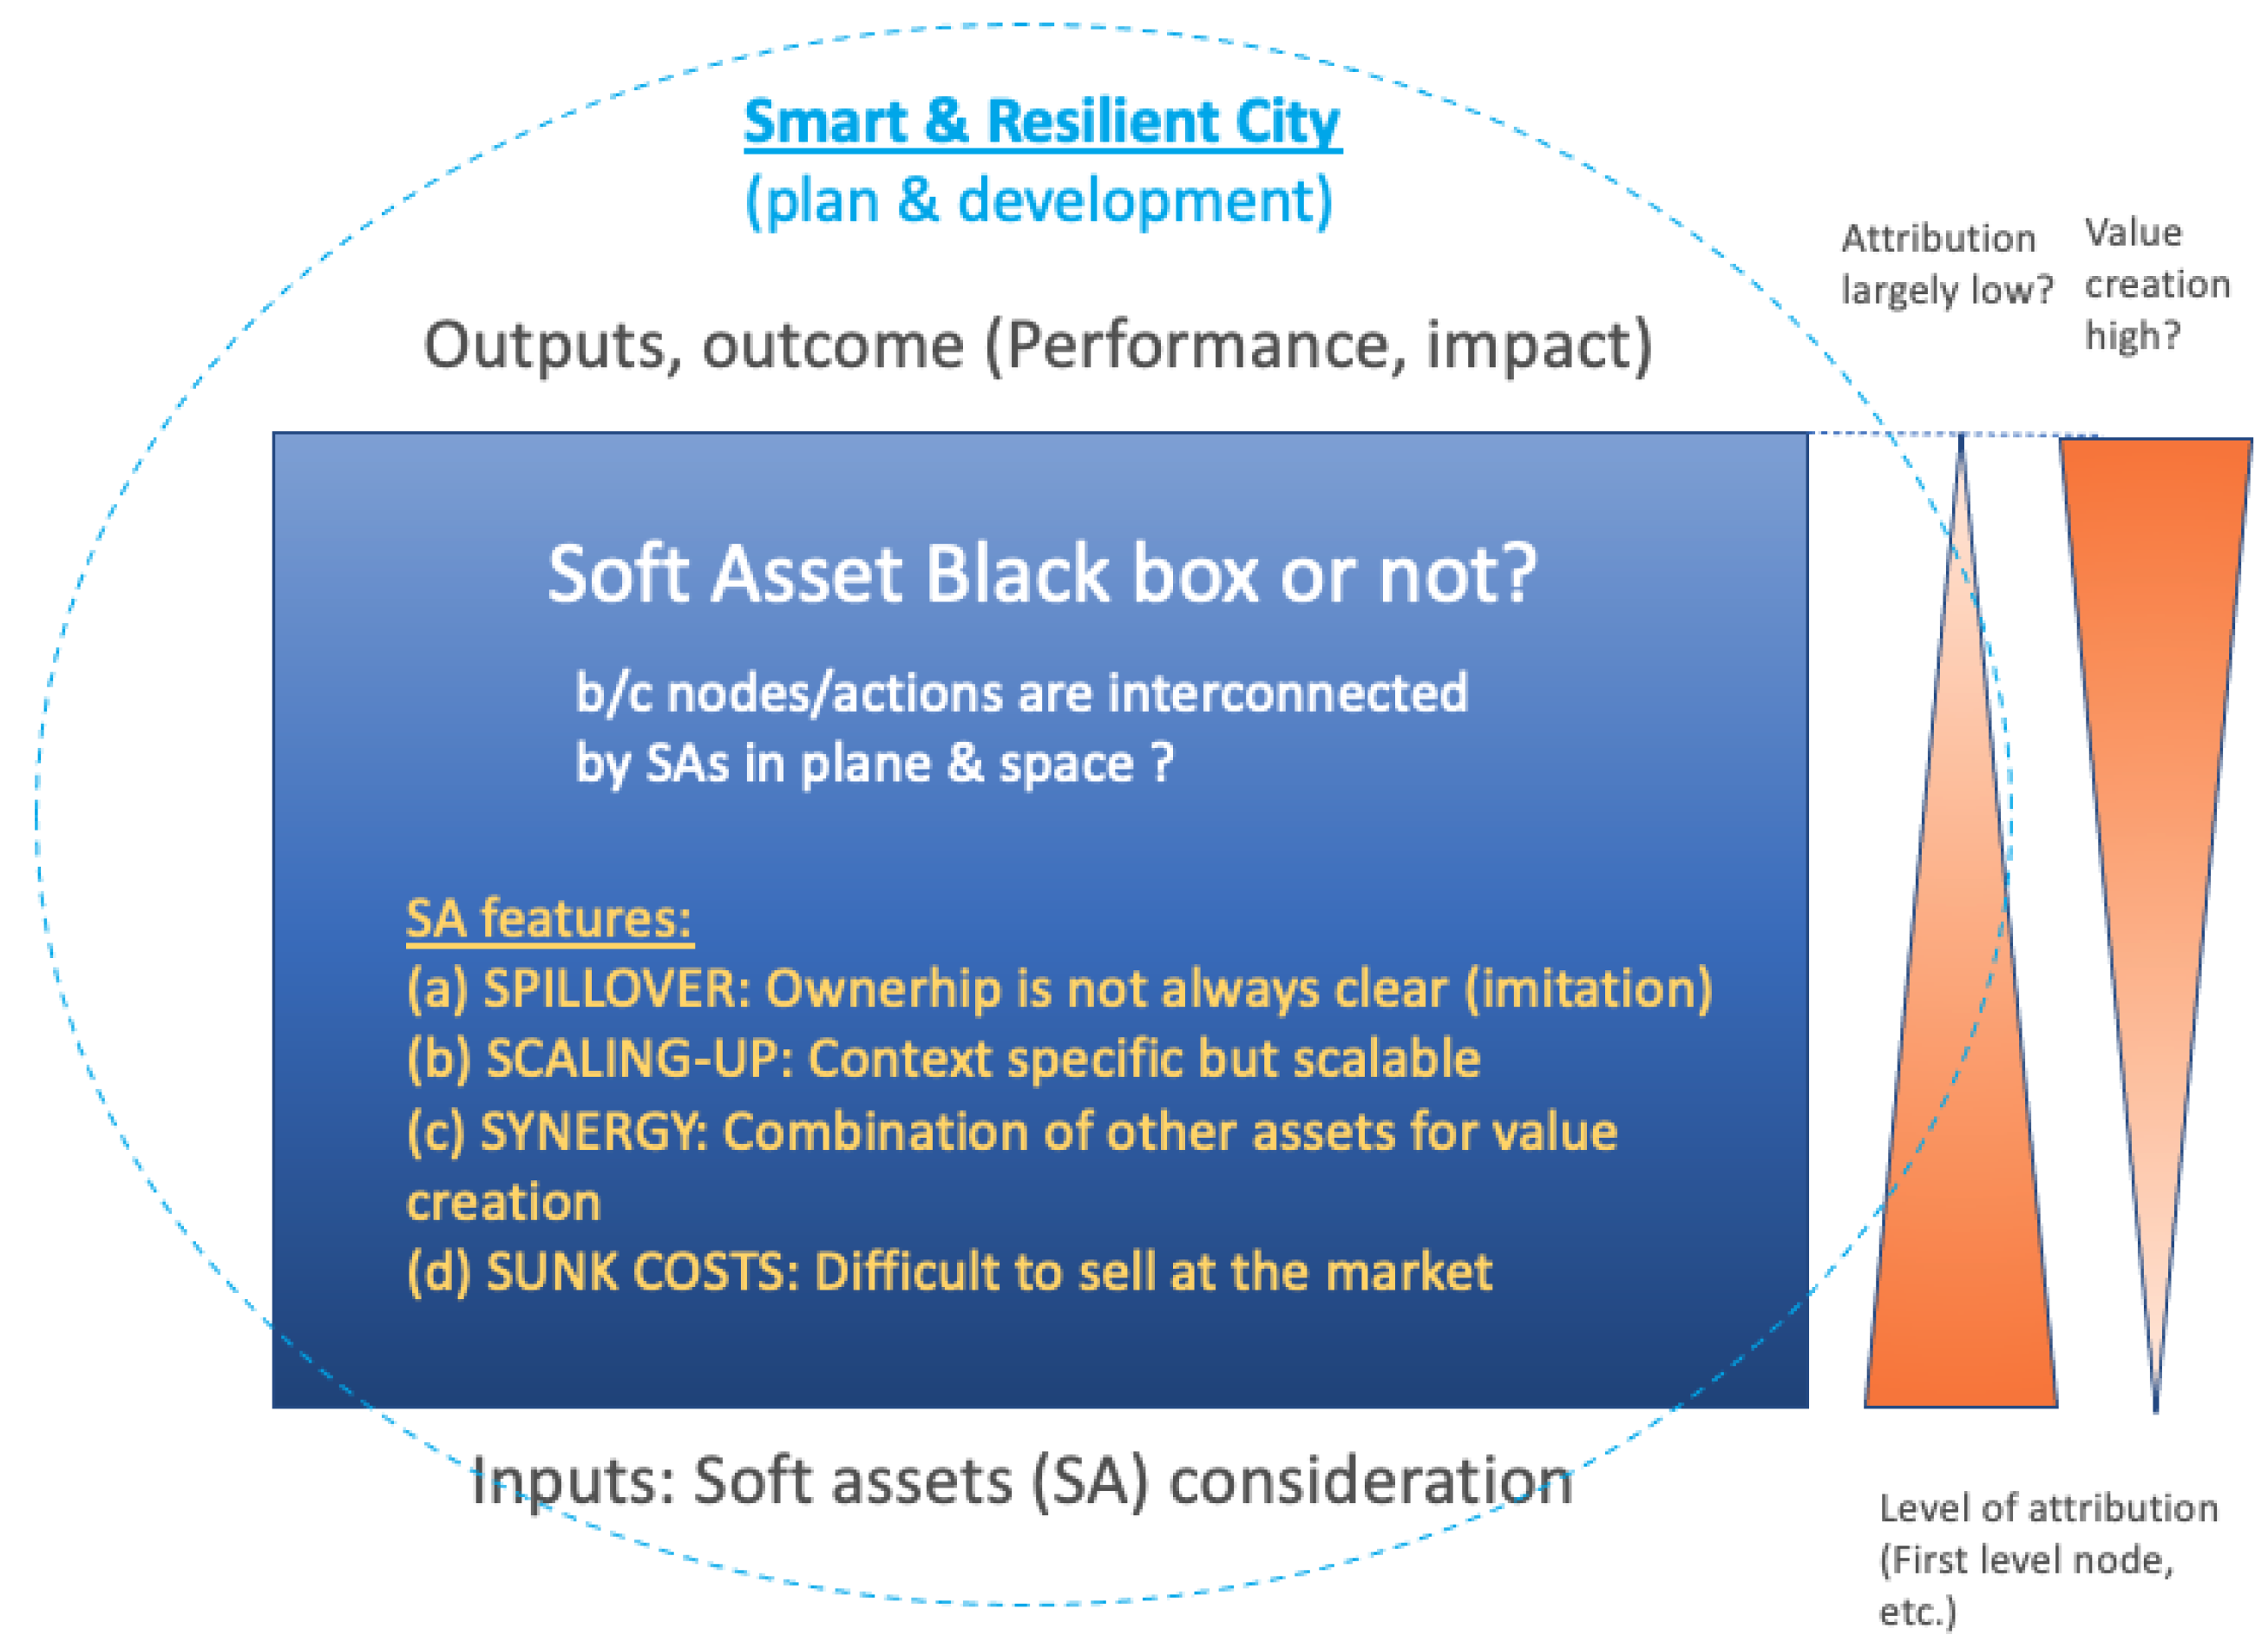
Soft assets (or intangible assets) are powerful assets which create value for cities [10]. Some assets can be identified directly as valuable, but some assets are intricately linked and difficult to distinguish and quantify. Quite often, there is no clear definition and classification, which is why the value aspect depends on specific contexts. Their value is recognized as invisible assets not only in business accounting for firms or related to an entity’s productivity but also in city development as a key to managing its on-going challenges. Thus, the concept of soft assets is much broader than hard infrastructure. The calculation of value added is more complicated because of the following features: (i) not producing outputs by their own; (ii) context is specific but scalable; (iii) difficult to sell in the market (including market availability) where value is not always measured, e.g., manual, system, branding, sunk costs, etc.; (iv) combination of other assets for value creation/for sustainability (synergy); and (v) ownership of assets that is not always clear, referring to a possibility of imitation (spillover).
Value and impact created by these features are basically unpredictable. Therefore, the unpredictability of soft assets creates a sense of ‘risk of the benefit of spillover’ (non-anticipated benefit) for decision makers. As Haskell and Westlake [10] said, an unknown risk of the benefit of spillover or scaling up is an underlying incentive to hold back from consideration or investment in soft assets [10]. This can largely be applied to the public sector and why policy makers resist considering the need for investment in soft assets. Municipal authorities need to demonstrate performance to citizens (taxpayers). Furthermore, authorities may be limited in their ability to leverage the features of soft assets because of strong vertical structures or silo culture in their operations. Introducing innovation and how to break bureaucratic silos to create a new pathway for a holistic approach are often challenges. Of course, because of the value added by soft assets, local authority decision makers need to find ways to explore approaches to highlight their need and to ensure sound and evidence-based policy support for the goals and vision for their cities.
2.2. Types of Soft Assets Reviewed in This Paper
There has been voluminous research in past decades incorporating different perspectives/objectives on the classifications and measurement of intangible assets, mainly by private firms [11]. This paper refers to some leading studies by Kaplan and Norton (strategic readiness), Sveiby (invisible capital), and Edvinsson and Malone (intellectual capital). Kaplan and Norton identified intangible assets from learning and growth objectives and emphasized the values of intangible assets [12]; Sveiby defined intangible assets that were considered in the knowledge organization context and were described as invisible capital [13]; while Edvinsson and Malone [14], thanks to the Skandina Intellectual Capital Navigator measurement framework [15], identified intellectual capital that provides an effective instrument to manage and develop corporate activity. Corporate soft assets are those developed and nurtured by learning for growth; serve as engines of development within a knowledge organization environment; and are able to help strengthen expertise. Corporate practices are reliable precedents for selecting appropriate soft assets.
Table 1 shows the list of potential soft assets which can be utilized for smart and resilient cities. Respective descriptions are set to see city competencies. Several key points should be noted here. First, social capital is often highlighted in the community-based or bottom-up context. Further, there are studies on how to measure them [16]. In this paper, it is used as one of the competencies to make cities smarter and more resilient from a policy maker’s point. Accordingly, the definition is not the same as often used, but it is used for looking at how smart and resilient city development could stimulate and strengthen social capital. Second, some of the soft asset components can be broken down into more specific components. Because types of smart and resilient cities vary, this research refers to the past studies above so that they can be regarded as a manageable capital in a city development context.
2.3. The Added Value of Soft Assets, Value Creation, and the Concept of Wholeness
Evaluating the value of soft assets is challenging due to their different features (see Section 2.1 above). For instance, it is similar to a black box where clear causal relations and attributions between inputs and outputs are not obvious (Figure 1). Soft asset attributions to outcomes become lower towards outcome level (an orange triangle to the left-hand side) but the level of value creation will be higher (an inverted triangle to the right-hand side). Aside from performance indicators, is there any other way to assess soft assets?
There are guiding theories relevant to identifying soft assets and their value creation. Jiang and de Rijke [17] explained the idea of a ‘Living structure’ that was originally promulgated by Christopher Alexander. They explain how notions/images, such as ‘beauty’, are largely judged by subjective view but also explained by objective manner [17]. Jiang also explained concepts, such as wholeness, ‘… which can be defined mathematically. It exists pervasively in our surroundings; in an ornament, in a room, in a building, in a garden, and in a city’. Alexander previously referred to this phenomenon as the ‘quality without a name’ [18]. Beauty and the ideas of living structure and wholeness are very similar to how soft assets can be considered and evaluated.
On living structure, by referring to Jiang’s study, soft assets should also be considered and assessed not by a static structure but also in an organic process where value emerges.
In Table 1, each soft asset has the properties and values that are created in an organic process (in the black box, Figure 1). Such an organic process is similar to what is characterized as living structure because soft assets are context specific values and yield outcomes and impact through being connected and influenced by other assets in the process. There are two fundamental governing laws of living structure. First is a scaling law that groups ‘far more small things than large ones’. The second is Tobler’s law which states that everything is related to everything else, but near things are more related than distant things [18](J Similar to what Jiang explained in his paper, these two laws can also be a useful way to consider and evaluate the value and capital of soft assets. Regarding wholeness, as Jiang clearly explained in his examination of the living structure concept, ‘… the evolution process is not simply about adding new centers, more correctly, centers are induced by the wholeness. In other words, it is incorrect to say: a whole comes from parts, or a whole consist of parts; it is the wholeness that induces centers to generate a coherent whole.’ [18]. This argument can support the assumption that the values of a soft asset should be considered as a wholeness, if they have similar structures to what Jiang and de Rijke explained as living structures.
The theories of ‘living structure’ and ‘wholeness’ can provide a comprehensive framework to analyze the relationship between soft assets consideration and value creation.
3. Tools for Identification of Soft Asset Consideration
The proposed tool for identification of soft asset consideration is shown in Appendix A. It is formed by two factors: one is soft asset value elements in smart and resilient cities (see Section 3.1), and second is five soft asset capital components (Table 1). The tool aims to show which competencies can be considered by cities to deliver smarter quality services. There are many soft indicators, such as a sector-based performance indicator, i.e., ISO 37120 [19], responsible for sustainable development of communities, or a theme-based performance indicator, i.e., UN SDG11 [20], that makes cities and human settlements inclusive, safe, resilient, and sustainable, or city levels that focus on the citizens’ well-being, their quality of life, green cities, etc. Some city level indicators explain more about their efforts to focus on sectors or projects, systems or processes, but the majority of indicators are conventional ones to measure improvement by calculating project-based outputs (action performance).
Unlike other indicators, the proposed tool is not purely for quantitative assessment. It extrapolates soft asset consideration aspects from information in proposals disclosed by cities establishing a smart city. The information selected from the materials will be visualized and examined in terms of level and strengthen of connectivity between selected actions/initiatives.
3.1. Soft Asset Value Elements, Soft Asset Capitals
The soft assets value elements are considered as key elements (or areas) where the value of smart and resilient cities is created and nurtured. A challenging question is how the soft assets should be developed and nurtured in proposals for smart and resilient city development. To identify the elements, a framework for public sector development by Kaplan [21] was used as a reference. The framework addresses three value perspectives critical to public sector management success, namely: (i) cost of providing services representing effective and efficient service provisions to citizens; (ii) value or benefit of services representing quality of services to be provided to citizens, a group that also monitors the fair, transparent, and sound performance of local authorities; and (iii) local authorities treating citizens as both beneficiaries (consuming services) and stakeholders (taxpayers), meaning that the authority has to satisfy the needs to receive continuous citizen support. Wataya and Shaw [11] outlined and analyzed the guiding framework as well as the core soft asset elements in detail. Another set of references is various types of smart and resilient city definitions (Section 2), which are anchored by complementary smart and resilient principles.
3.2. Soft Assets—Nine Value Elements
Based on the framework, nine soft asset value elements are tailored and modified as follows: (i) resource management: (ii) accessibility (mobility); (iii) health well-being; (iv) equal access to services; (v) smarter services; (vi) community engagement; (vii) quality communication; (viii) security; and (ix) resilience. Each element represents the following areas.
Resource management is to optimize limited human and natural resources for building a smart and resilient city. This element is not only the effective use of resources but also the focus of efficient systems. It reflects strategic readiness, planning, competencies in resource management planning, benefits to stakeholders, and use of technology for an efficient gain of outcomes. Accessibility (mobility) is to facilitate reduced automobile dependence, providing alternative modes of transportation. It reflects on the competency of establishing a holistic urban development plan. It also concerns availability of cross-sectoral planning, provision of a citizen-friendly public transport system, implementing an IT-led system and facilitating the engagement of citizens in planning. Health well-being is to build an environmentally sound (green), healthy environment for citizens. It focuses on establishing a shared vision of a healthy community for residents; a better and healthy living space, positive impact on human health by creating public gathering places. improving accessibility to services for a healthy environment, and incentivizing the community to support and participate in improving health-related initiatives. Equal access to services is to maintain social stability. This also secures support from citizens, stakeholders, and beneficiaries. It focuses on satisfying basic community service needs and measures to mitigate risks, create sustainable financial options, strategic readiness, improving citizens tracking process for accessing services, IT literacy improvement, and facilitating levels of citizen engagement and decision-making processes. Smarter services via technology provides access to effective and efficient services that meet the needs of citizens and improve service quality through the use of smart infrastructure. It concentrates on developing a holistic vision/strategy across sectors, readiness, availability of the plan/system to improve citizen’s technical literacy, establishing efficient communication channels, and facilitating levels of citizen engagement and decision making. Community engagement is to improve quality of life by strengthening the community’s capability and nurture the city by citizens’ close involvement over a long time. It focuses on developing effective community engagement plans, including public awareness raising activities, strategic readiness, availability of support for community-based awareness raising efforts, strengthening community engagement in public events, providing feasible technology and IT systems for an inclusive society, facilitating levels of citizen engagement, and contributions to strengthen social values. Quality communications is to improve communications between local government and communities to build a sustainable and resilient smart city. It seeks to establish a citizen–government communications channel, streamlined coordinating mechanisms between LGU and stakeholders, regularly conducting feedback on the provision of city services, a feedback collecting system, a collective/transparent decision-making process, and a method of accountability of leaders. Security is to provide a stable, secure environment in citizens’ daily life and improve smart city resiliency against unexpected external shocks and damage. All nine of these elements are considered as the main pillars of developing soft asset consideration indicators. They attempt to improve a city’s safety plan for better risk management, developing framework for ensuring the welfare of citizens in times of crisis, developing community security services, enabling police departments and law enforcement for a safe and secure city, quality of data management systems, collective/transparent decision-making processes, accountability of leaders, and strengthening social values. Resilience is to make a city stronger against external shocks and risks, prepare it for short-term hazards and mid- to long-term adaptability. The resilience element refers to the Climate Disaster Resilience Index (CDRI) methodology [22], as it has already defined the resilience of communities in an urban system (city) in relation to climate-related disasters. In addition, this research extends resilience aspects beyond natural disaster risk management. It covers effectiveness of a crisis zone management framework, natural resource management, knowledge management and dissemination, mainstreaming of disaster risk reduction and climate-change adaptation, good governance, land use planning, effective transport, clean energy, institutional collaboration with other organizations and stakeholders during a disaster, effectiveness of early warning systems, internet access, community disaster preparedness, education and awareness, and methods of strengthening social capital.
The nine value elements are closely related to each other; thus, there is some overlapping across elements. For example, the smarter services via technology element is closely interlinked to security and resilience, or quality communications and community engagement have similar activities. Together with the five soft asset capitals, the proposed tool has 45 items (9 × 5 = 45) (Appendix A).
4. Soft Asset Consideration: Cases—Bhubaneswar and Nagpur from the India Smart City Mission
Soft asset consideration is made to review and examine the following two aspects. First is to discover subtle relations between core elements (large node), and their connectivity structures with actions/initiatives (small node) by soft asset capitals (edge). This could show which areas the city considered more than others, which elements could be more influential over the whole connectivity, and also potential synergetic effects to create value addition in the future. Second is to identify the level of consideration from soft asset capitals and examine potential gaps in view of smart city development and its vision and objectives.
Two cases from the India Smart City Mission [23] were selected for the pilot application of the tool introduced in Section 3. The India Smart City Mission was launched in 2015 by the Ministry of Housing and Urban Affairs of Government of India to drive economic growth and improve the quality of life for people by enabling local area development and harnessing technology that leads to smart outcomes (http://smartcities.gov.in (accessed on 4 January 2022). The major reasons for selecting the India Smart Mission are its ready application and scaling up to other Indian cities. Second, in terms of smart and resilient cities, India is a disaster-prone country, with a large number of natural disaster incidents involving different types of hazards across different climatic zones. Among many cities in the Mission, Bhubaneswar (in the eastern coastal plains) and Nagpur (in the center of the Indian subcontinent) were selected, being from different geographical locations.
4.1. Methods
The following steps were taken to review soft asset consideration, selection and decision making in smart and resilient city development: (i) for desktop research, the smart city proposal was used for review. The proposal was composed of: (a) City Profile; (b) Area Based Proposal; (c) Pan-City Proposal; (d) Implementation Plan; and (e) Financial Plan. The review was mainly conducted from (a) to (c). The City Profile section includes the past efforts and current states, so the information reviewed was more on the present state and future plan; (ii) the key words from the matrix were used to identify activities or initiatives from the proposal and completed with each item of the tool (Appendix A); (iii) once the review was completed, the dataset has been examined by an application for network visualization. It examined if the living structure and the two fundamental laws, i.e., scaling law and Tobler’s law, could also be observed in soft asset consideration and decision making; and (iv) based on the dataset, a radar chart was prepared for each value element to examine gaps and assumptions for preparing the next research step (interview stage) (Appendix B).
4.2. Bhubaneswar
4.2.1. Smart City Vision and Strategic Focus Areas of Focus
Bhubaneswar’s smart city vision is to be a transit-oriented, livable, child-friendly city with accessibility and safety, and an eco-city plan co-existing in harmony and with a regional economic center. To fulfill the vision, the city has two strategic areas of focus: (i) creating a model of sustainable urbanization based on new urban principles that have the transformative potential to provide citizens with prosperity, safety, and equity; and (ii) an urban planning system, including integrated land use and transport planning, infrastructure planning, and socio-economic planning. To achieve the areas of focus, there are five strategic pillars—responsive governance, transit-oriented development, financial sustainability, infrastructure, and socio-economic development [24].
4.2.2. Initial Findings (Connectivity)
Using the tool (Appendix A), Table 2 shows a number of actions/initiatives categorized under each soft asset capital (the top row) and under each nine-value element (the leftmost column).
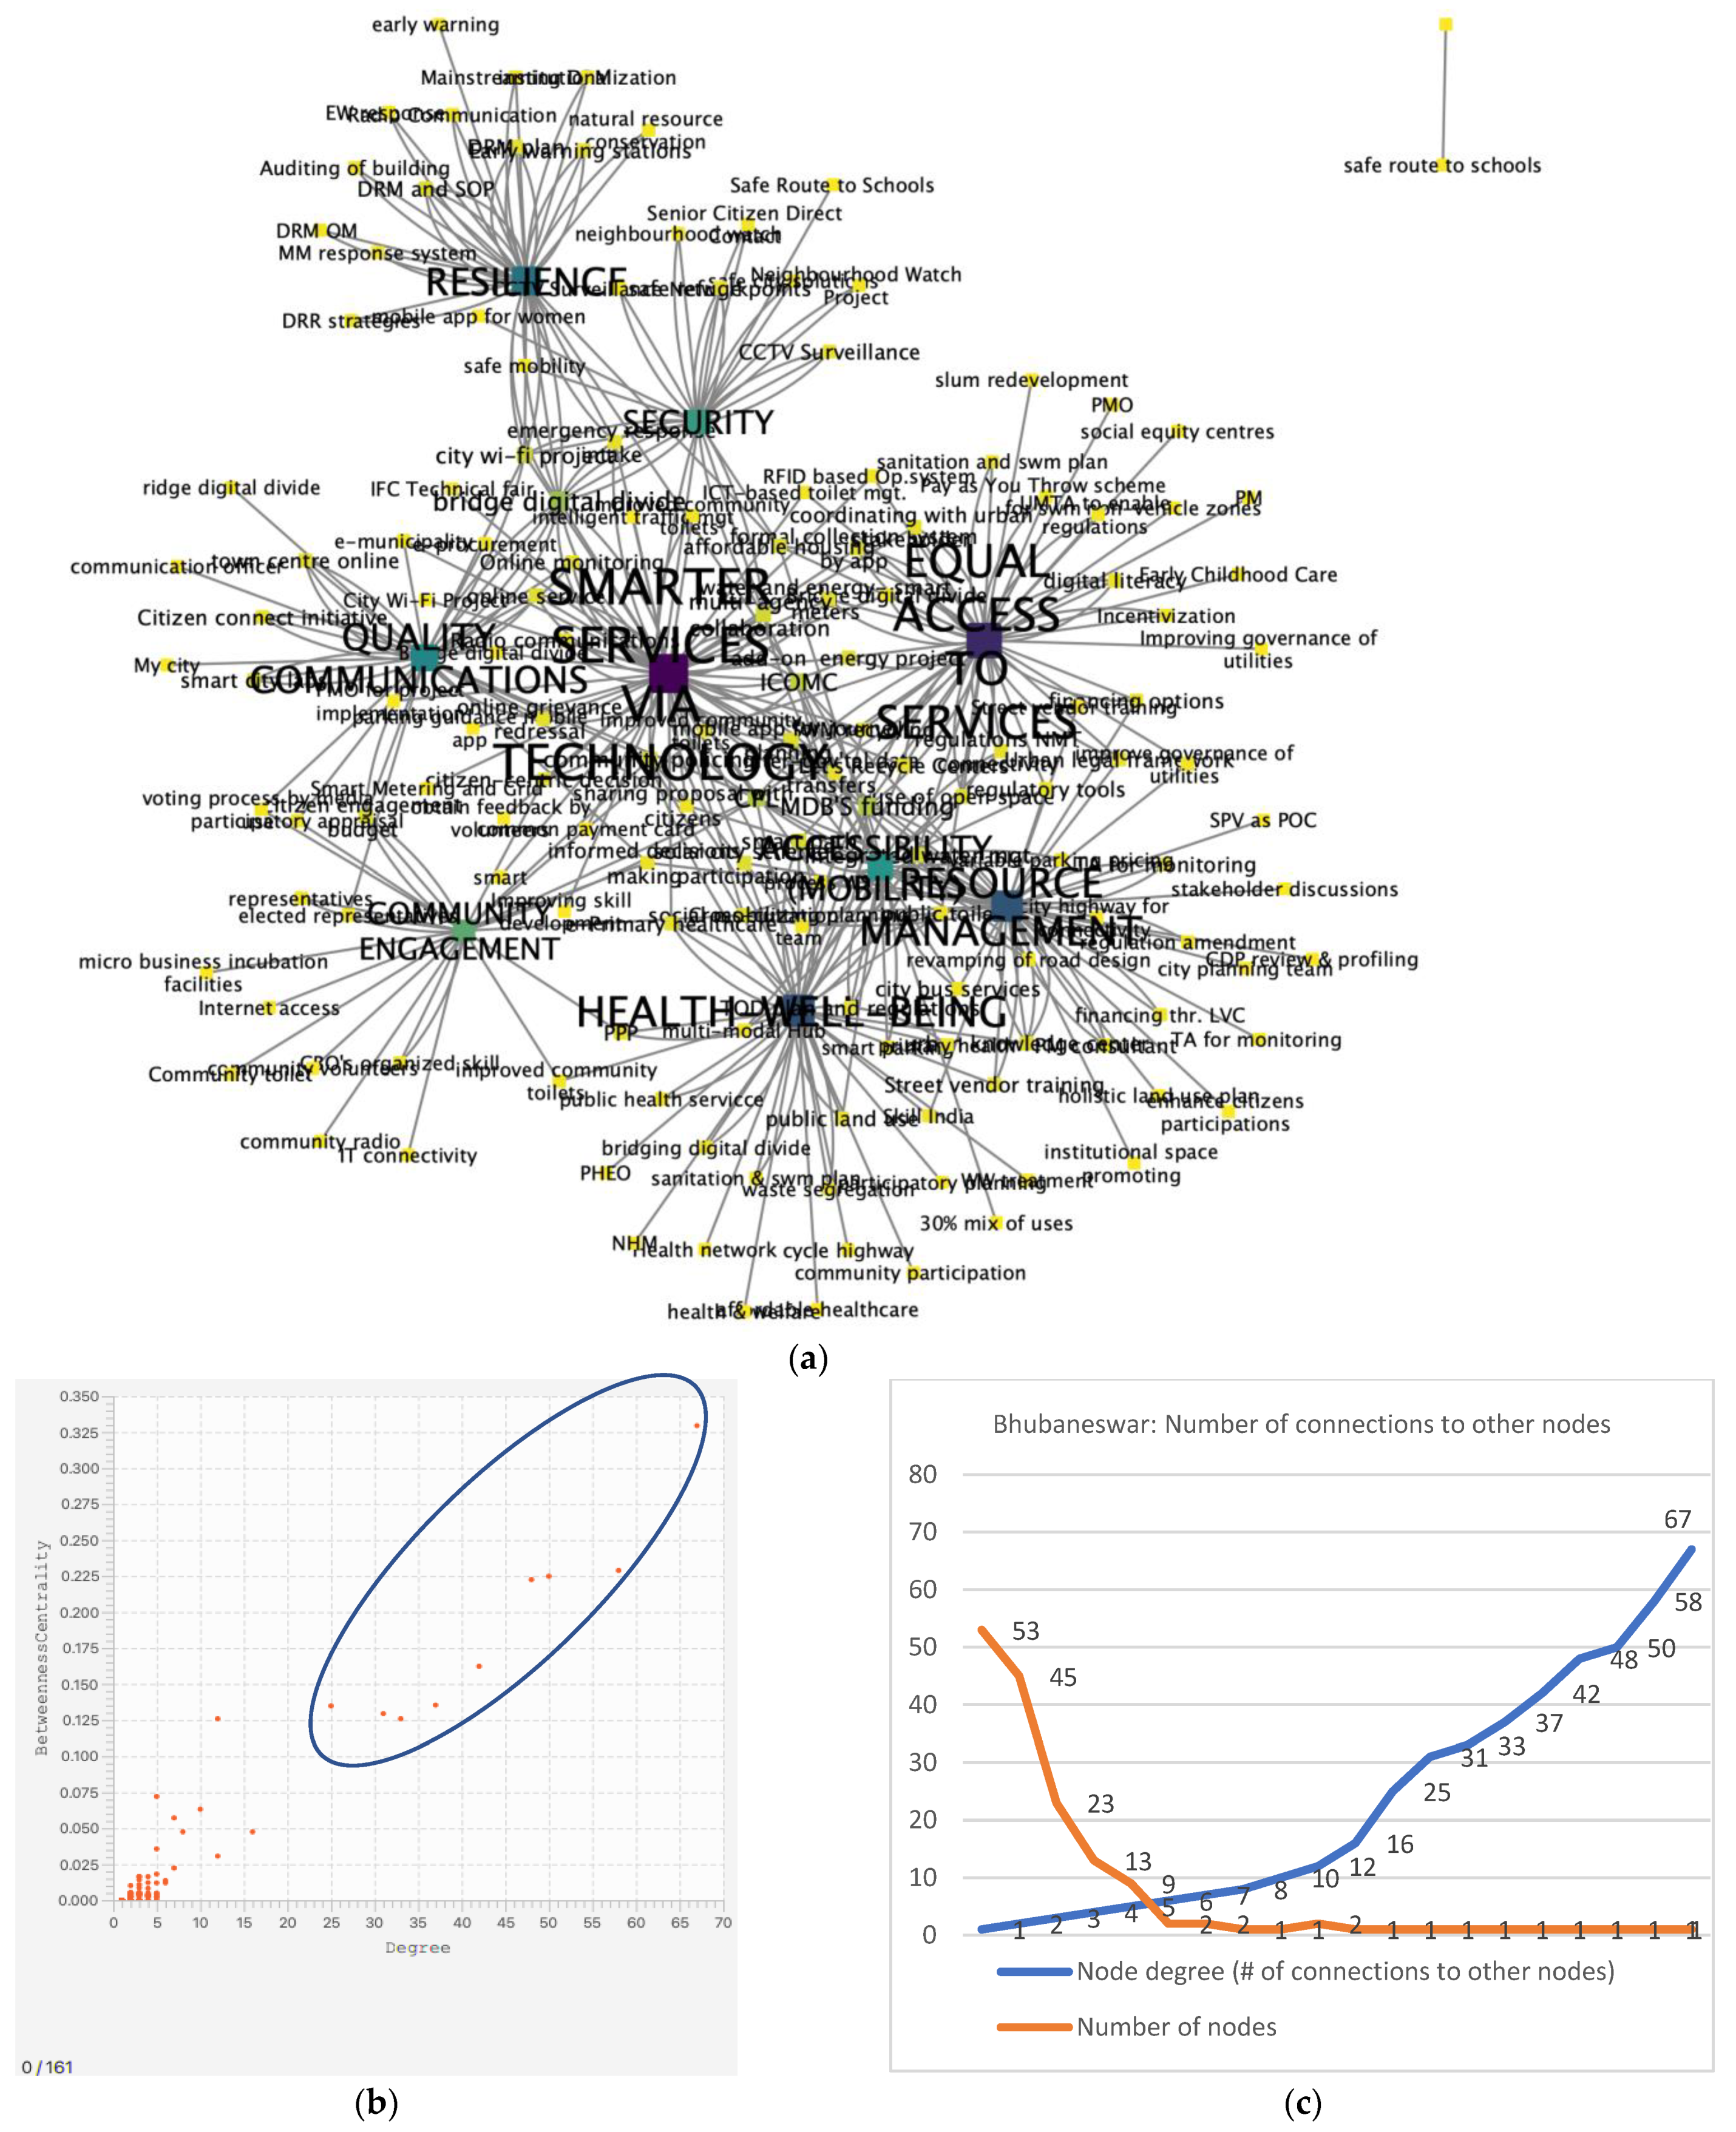
A total of 391 actions/initiatives are identified but many are shared among nine value elements and five soft asset capitals (the final number of nodes is 161). To demonstrate their network, they are visualized in Figure 2a.
Figure 2a shows the interconnection based on each value element (larger nodes in purple and green) and actions/initiatives (in yellow, smaller nodes (The cumulative number of actions/initiatives is 391, the number of nodes is 161 (=a number of nodes)). Each line (edge) represents relevant five soft asset capitals. Smarter service via technology, equal access to services, and health well-being are major areas where soft components are actively considered, and many small nodes are linked. In other words, these larger, center nodes are supported by many yellow nodes. They are more important than the larger nodes as they receive support from each smaller node, as indicated by Scaling law. This also demonstrated in Figure 2b,c by different parameters.
Figure 2b shows the degree of node distribution of the network presented in Figure 2c. The plot is to observe the correlation of two parameters. The degree is the number of connections with other nodes. ‘Betweenness Centrality’ of a node reflects the amount of control that this node exerts over the interactions of other nodes in the network [25]. Here, a larger number represents a hub (large) node. The nine dots inside the blue oval circle represent a hub (large) node, which is each nine-value element. Figure 2c shows similar information but in a different format, highlighted in a number of connections to other nodes. The figure at the extreme right with blue (67) and orange (1) lines represents: ‘1 large node (Smarter services via technology) has 67 small (yellow) node connections’. The figure on the left with blue and orange lines represent ‘53 small (yellow) nodes have only 1 node connection’. Including the 53 nodes, all are related but near nodes are more related than distant ones. In this context, all 53 nodes are under one large node (related), and they can be considered as closer and more related to others as indicated by Tobler’s law.
From these observations, it can be said that the larger nodes are more influencial over other nodes. However, due to the features of soft assets, it can also be said that all nodes regardless of size are directly or indirectly connected to core values in a precess of organic value creation. This echos the theories of wholeness. From Figure 2b, ‘smarter services’ (67), ‘equal access’ (58) ‘health well-being’ (50) and ‘resource management’ (48) are more influential (exert over the interaction of other nodes) than other five elements, namely accessibility (mobility) (33), security (31), quality of communications (37), resilience (42), and community engagement (25), in terms of soft asset consideration. It is anticipated there will be some spillover or scaling up effects but the exact influences of the four nodes can be further examined by interview.
4.3. Nagpur
4.3.1. Smart City Strategic Areas of Focus
Nagpur City’s smart city vision seeks to transform the city into the most livable eco-friendly edu-city, that virtually connects people with the government to create an inclusive ecosystem loop. The city has a transformative agenda with four key features of its action plan, i.e., smart living, smart mobility, smart environment, and smart governance, for enhancing the quality of life in Nagpur. They are supported by 12 areas of focus for action (inclusive living, policy-centric city, safe and walkable streets, economic vitality, TOD, connect places and move people, carbon neutral and sustainable habitat, Swachh Nagpur, urban greening, digital efficiency and good governance, revive Nagpur’s image as regional economic center, and boost job creation) [26].
4.3.2. Initial Findings (Connectivity)
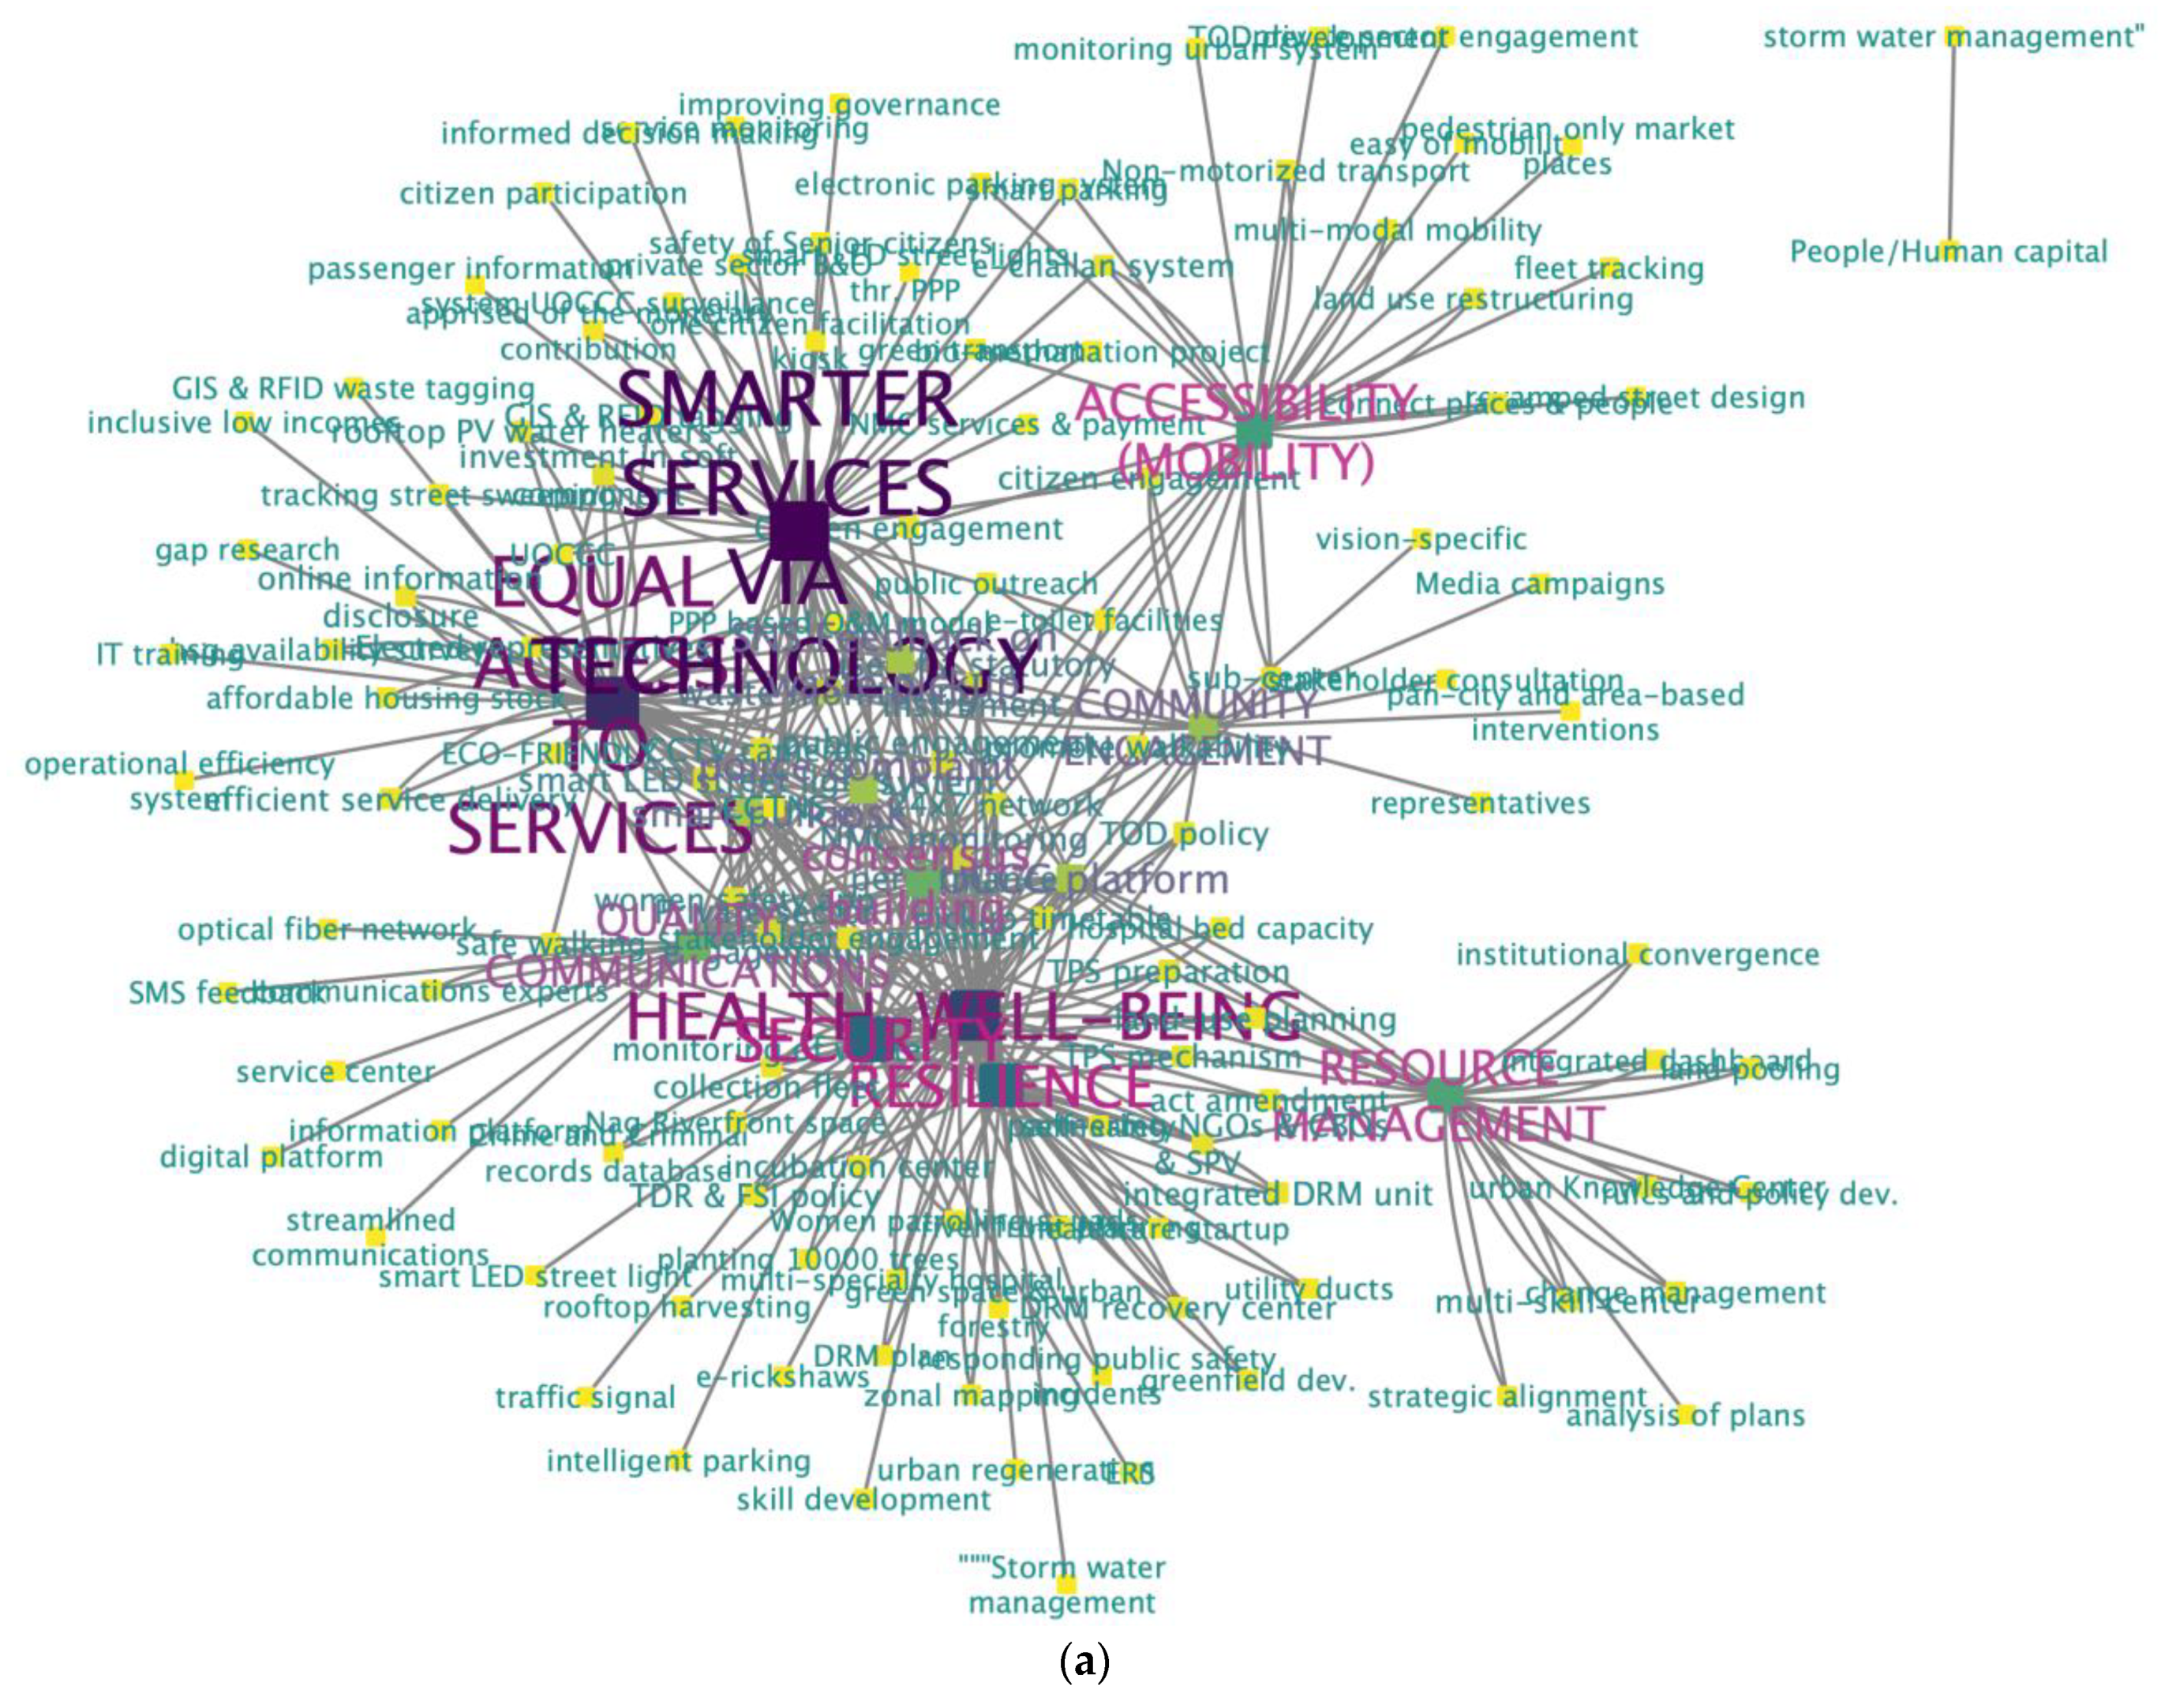
Same as Bhubaneswar, the following is a set of data to examine Nagpur’s connectivity. Table 3 shows that a total 356 actions/initiatives are identified but many are shared among nine value elements and five soft asset capitals (the final number of nodes is 136). To demonstrate their interlinked relationships, they are visualized in Figure 3a.
Nagpur’s network visual image appears denser than that of Bhubaneswar. Based on the data that were used for this network visualization, the Cytoscape analyzer function computed that the network density analysis figures are 0.025 for Nagpur and 0.019 for Bhubaneswar. The figure range is 0 to 1 and 1 is the highest dense node connectivity and the highest level of spreading information in the network. In this context, Nagpur’s case is slightly more influential among connected nodes than Bhubaneswar, but both density analysis figures are very low, thus how much difference there is, is unknown.
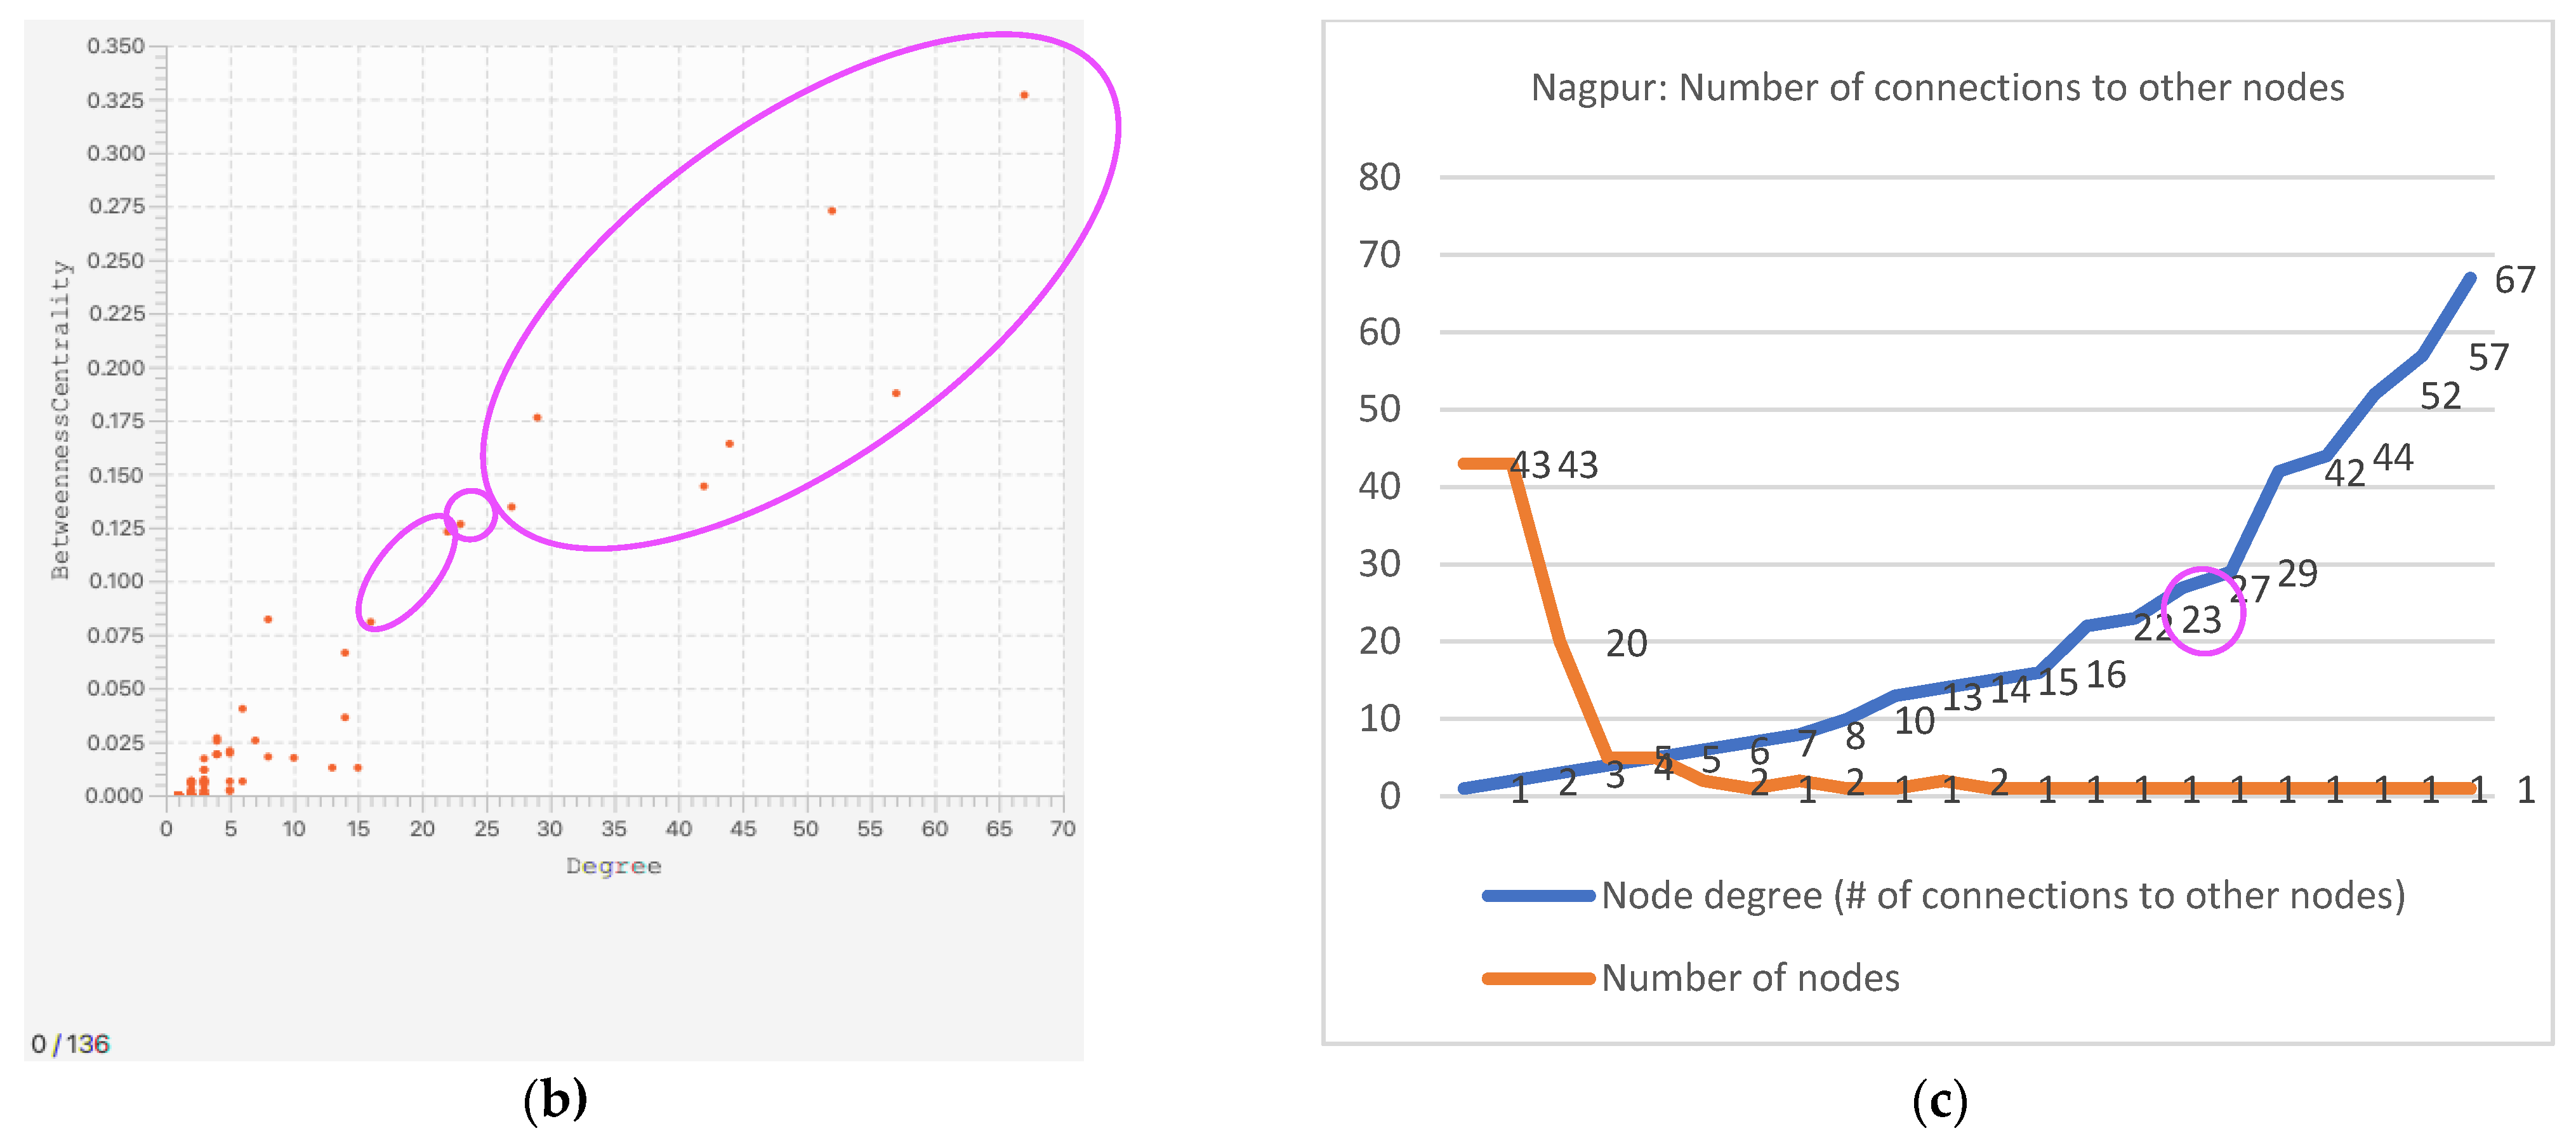
Same as Bhubaneswar, Figure 3b,c shows the top three large nodes of smarter service via technology (67), equal access to services (57), and health well-being (52), followed by security (44) and resilience (42), are influential in the proposal in terms of soft asset consideration. Nagpur also shows consideration in accessibility (29) and resource management (27) that are directly aligned to the city’s visions.
Unlike Bhubaneswar, Figure 3b also shows ‘consensus building’ as a relatively influential node (a dot with degree scale 23 in Figure 3b,c). Its attribution is actions/initiatives, not the nine value elements group. However, ‘consensus building’ was frequently identified across the nine elements and the five soft asset capitals. That makes it a more influential node than other small yellow nodes. It can be used as a good reference to conduct additional research to see changes as a next step.
4.4. Bhubaneswar and Nagpur—Other Findings from Five Soft Asset Capitals
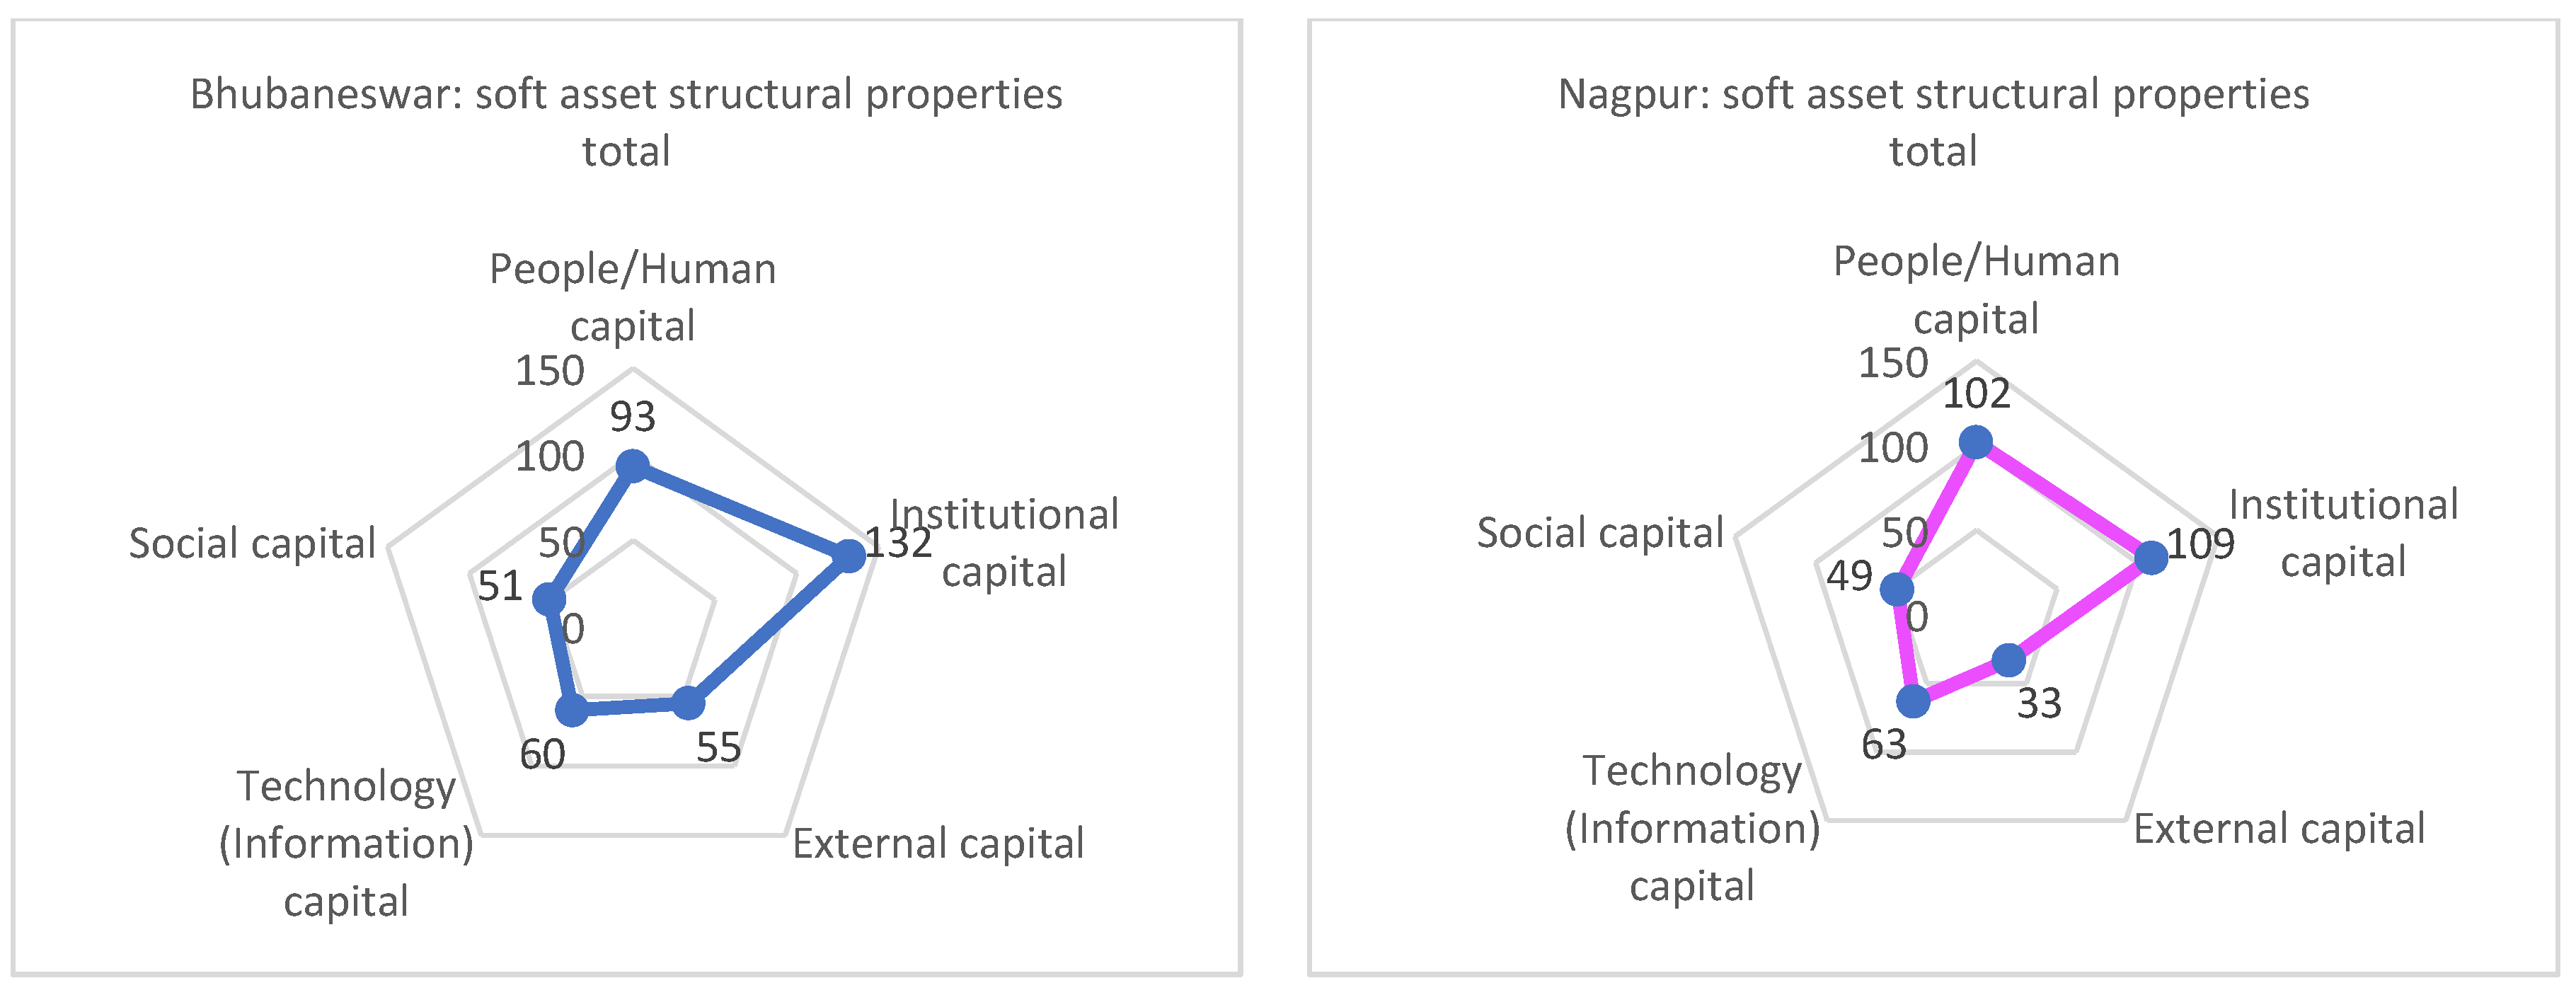
Figure 4 provides preliminary comparisons of the degree of soft asset consideration from the five soft asset capitals (people/human capital, institutional capital, external capital, technology/information capital, and social capital). Two points will be assessed: (i) overall across all elements in two cities; and (ii) resilience, community engagement, and quality communications related. The initial analysis and observations provide the base for comparison of how the proposal-based soft assets consideration is/will be changed in current and future contexts.
- (i)
- Overall
Initial observations of both cities are: (i) overall, among the nine value elements, institutional capital is given more weight than other soft asset capital. Its related considerations were 132 for Bhubaneswar and 109 for Nagpur. This implies that systems, regulations, or other items that can operationalize planned actions/initiatives are indispensable at an early stage of city development. Hence, people/human capital follows as a source of knowledge and technical expertise.
Traditionally, smart cities seek information and technology solutions to optimize limited resources for sustainable city development. It is indispensable in this day and age. Technology/information capital also relates to institutional and people/human capital for better governance and strategic approaches. Thus, it was naturally expected to see higher levels of consideration in relation to service provisions and equal access to services. In relation to technology/information capital, a centralized data/information management center is integrated in across different activities/initiatives. Hence, other capitals may have more consideration, but it was not fully assessed only in the proposals.
External capital is also valued in this current inclusive partnership, or network. Better resource mobilization in terms of funding, ideas, knowledge, and techniques in expert areas are expected to be fully utilized for better smart and resilient city development. In both cities, it is anticipated to be identified at different types and levels of actions/initiatives. Bhubaneswar looks to consider it more than Nagpur, but it cannot be judged only by these data as there are certainly limitations to extracting data from the proposals. This needs additional information to evaluate further.
Social capital (also ‘community engagement’) is a relatively weak consideration. Among many actions/initiatives related to social capital, the notable case is proactive involvement of citizens in decision making processes, feedback collections, and citizen representative systems. Bhubaneswar actively involves citizens by an institutionalized approach, i.e., community participation law; however, in the proposal, it could not be fully captured to the extent of its coverage and actual influence as a soft asset. The lower number may also be attributed to the nature of the tool that is designed from a top-down perspective, not a community-based perspective, due to the complexity of combining both in one tool. This aspect needs to be adjusted by future interview or other supplementary research.
- (ii)
- Resilience, Community Engagement, Quality Communications
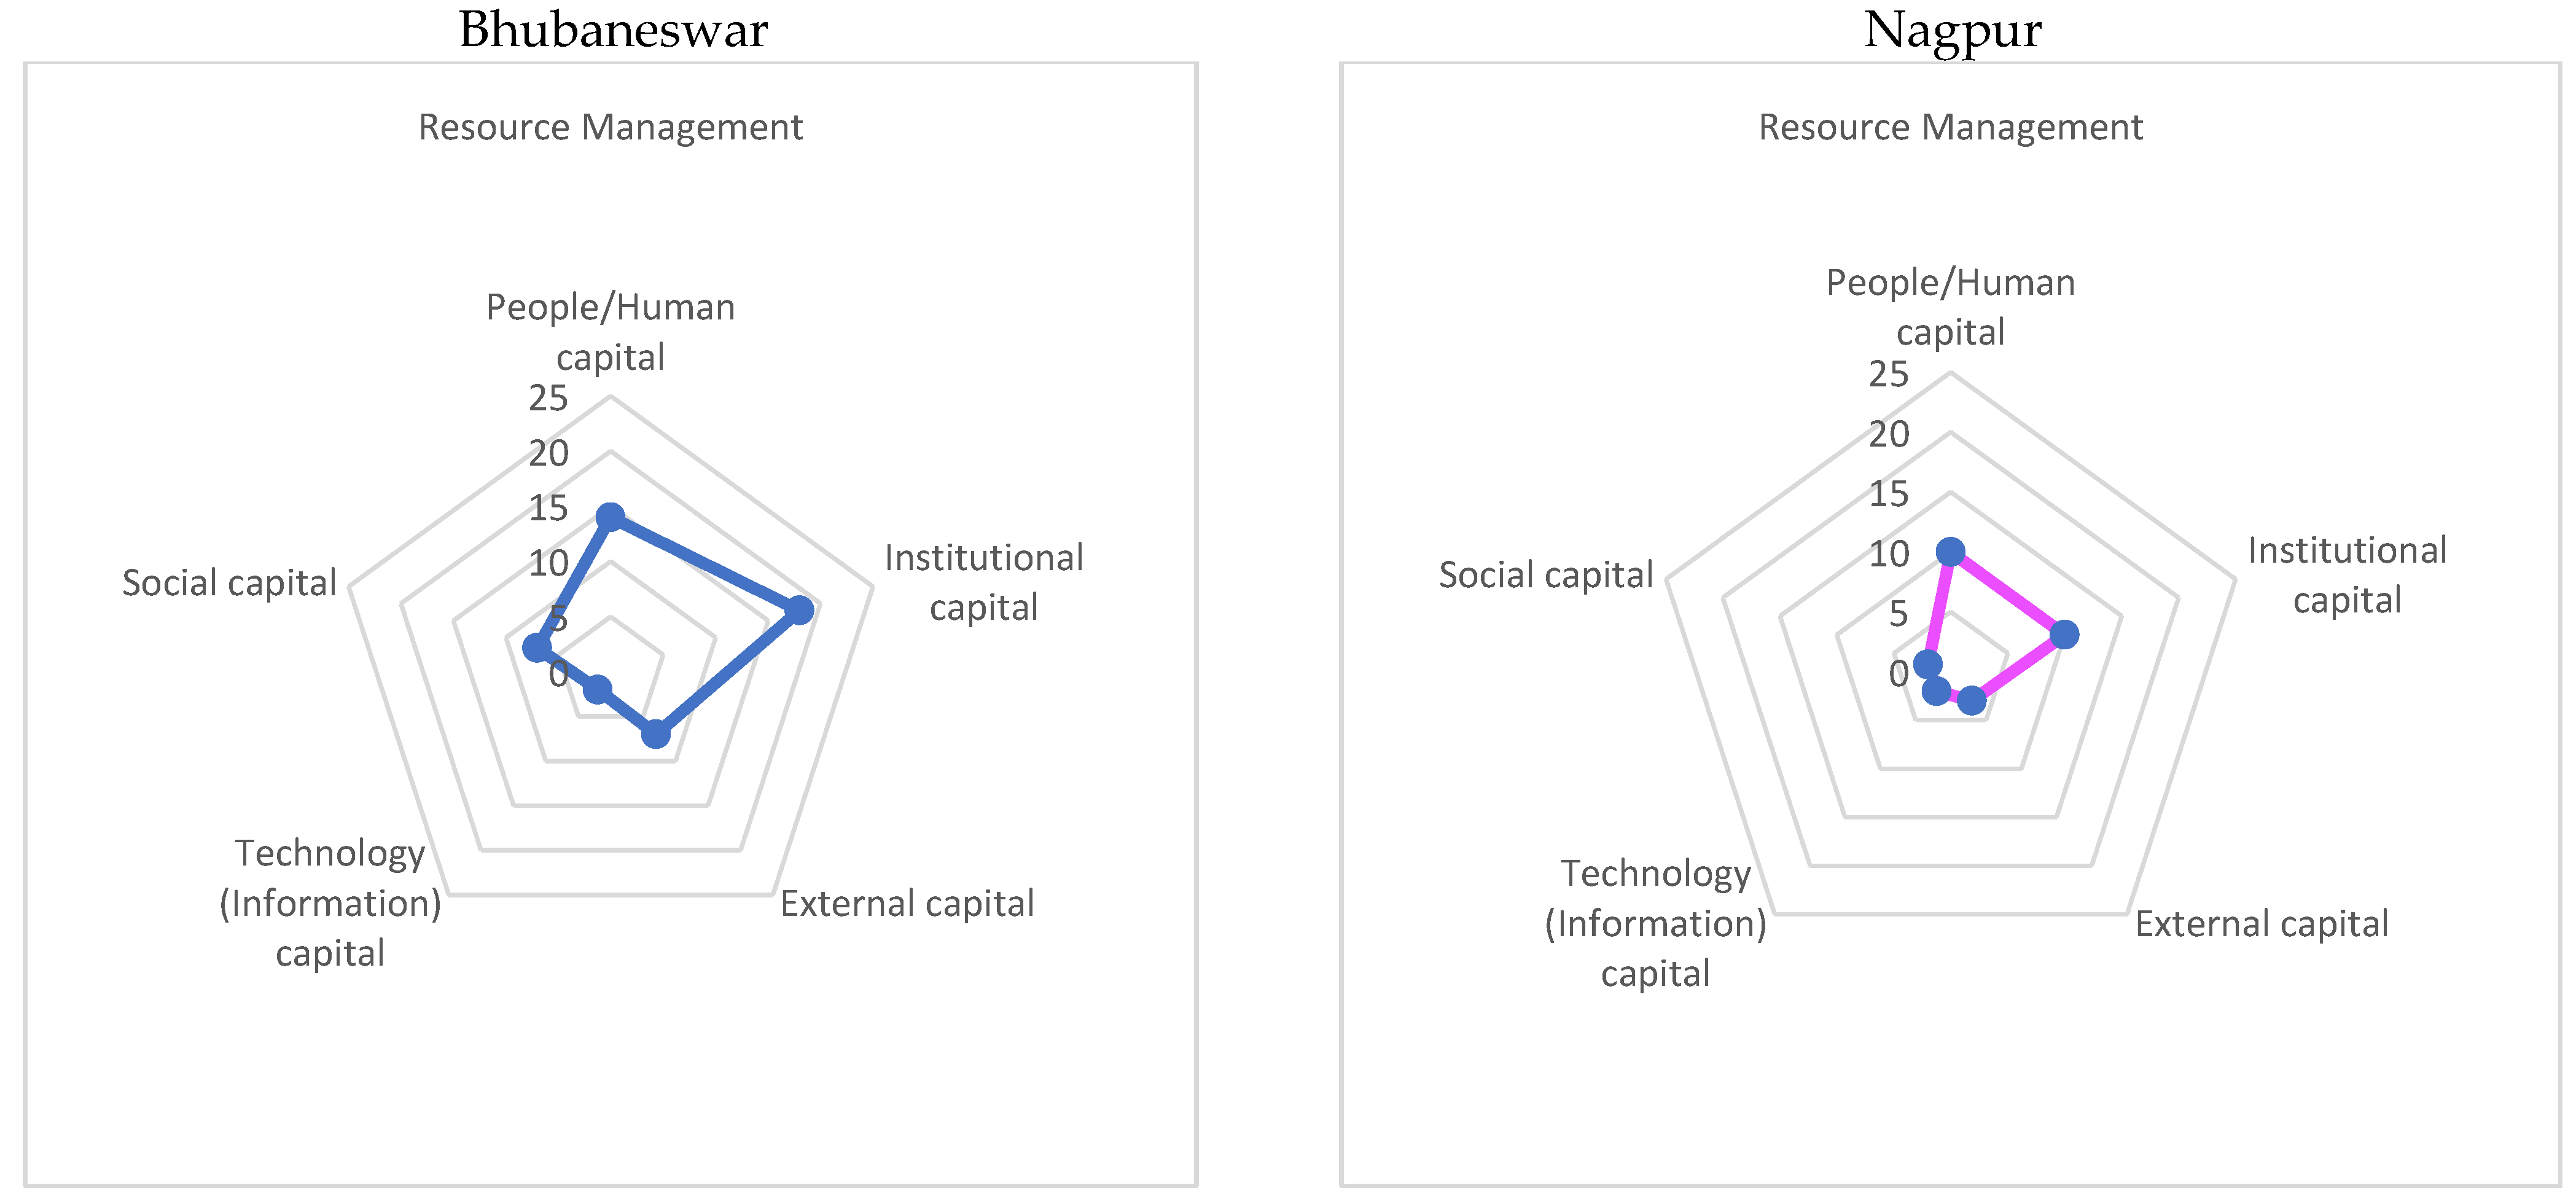
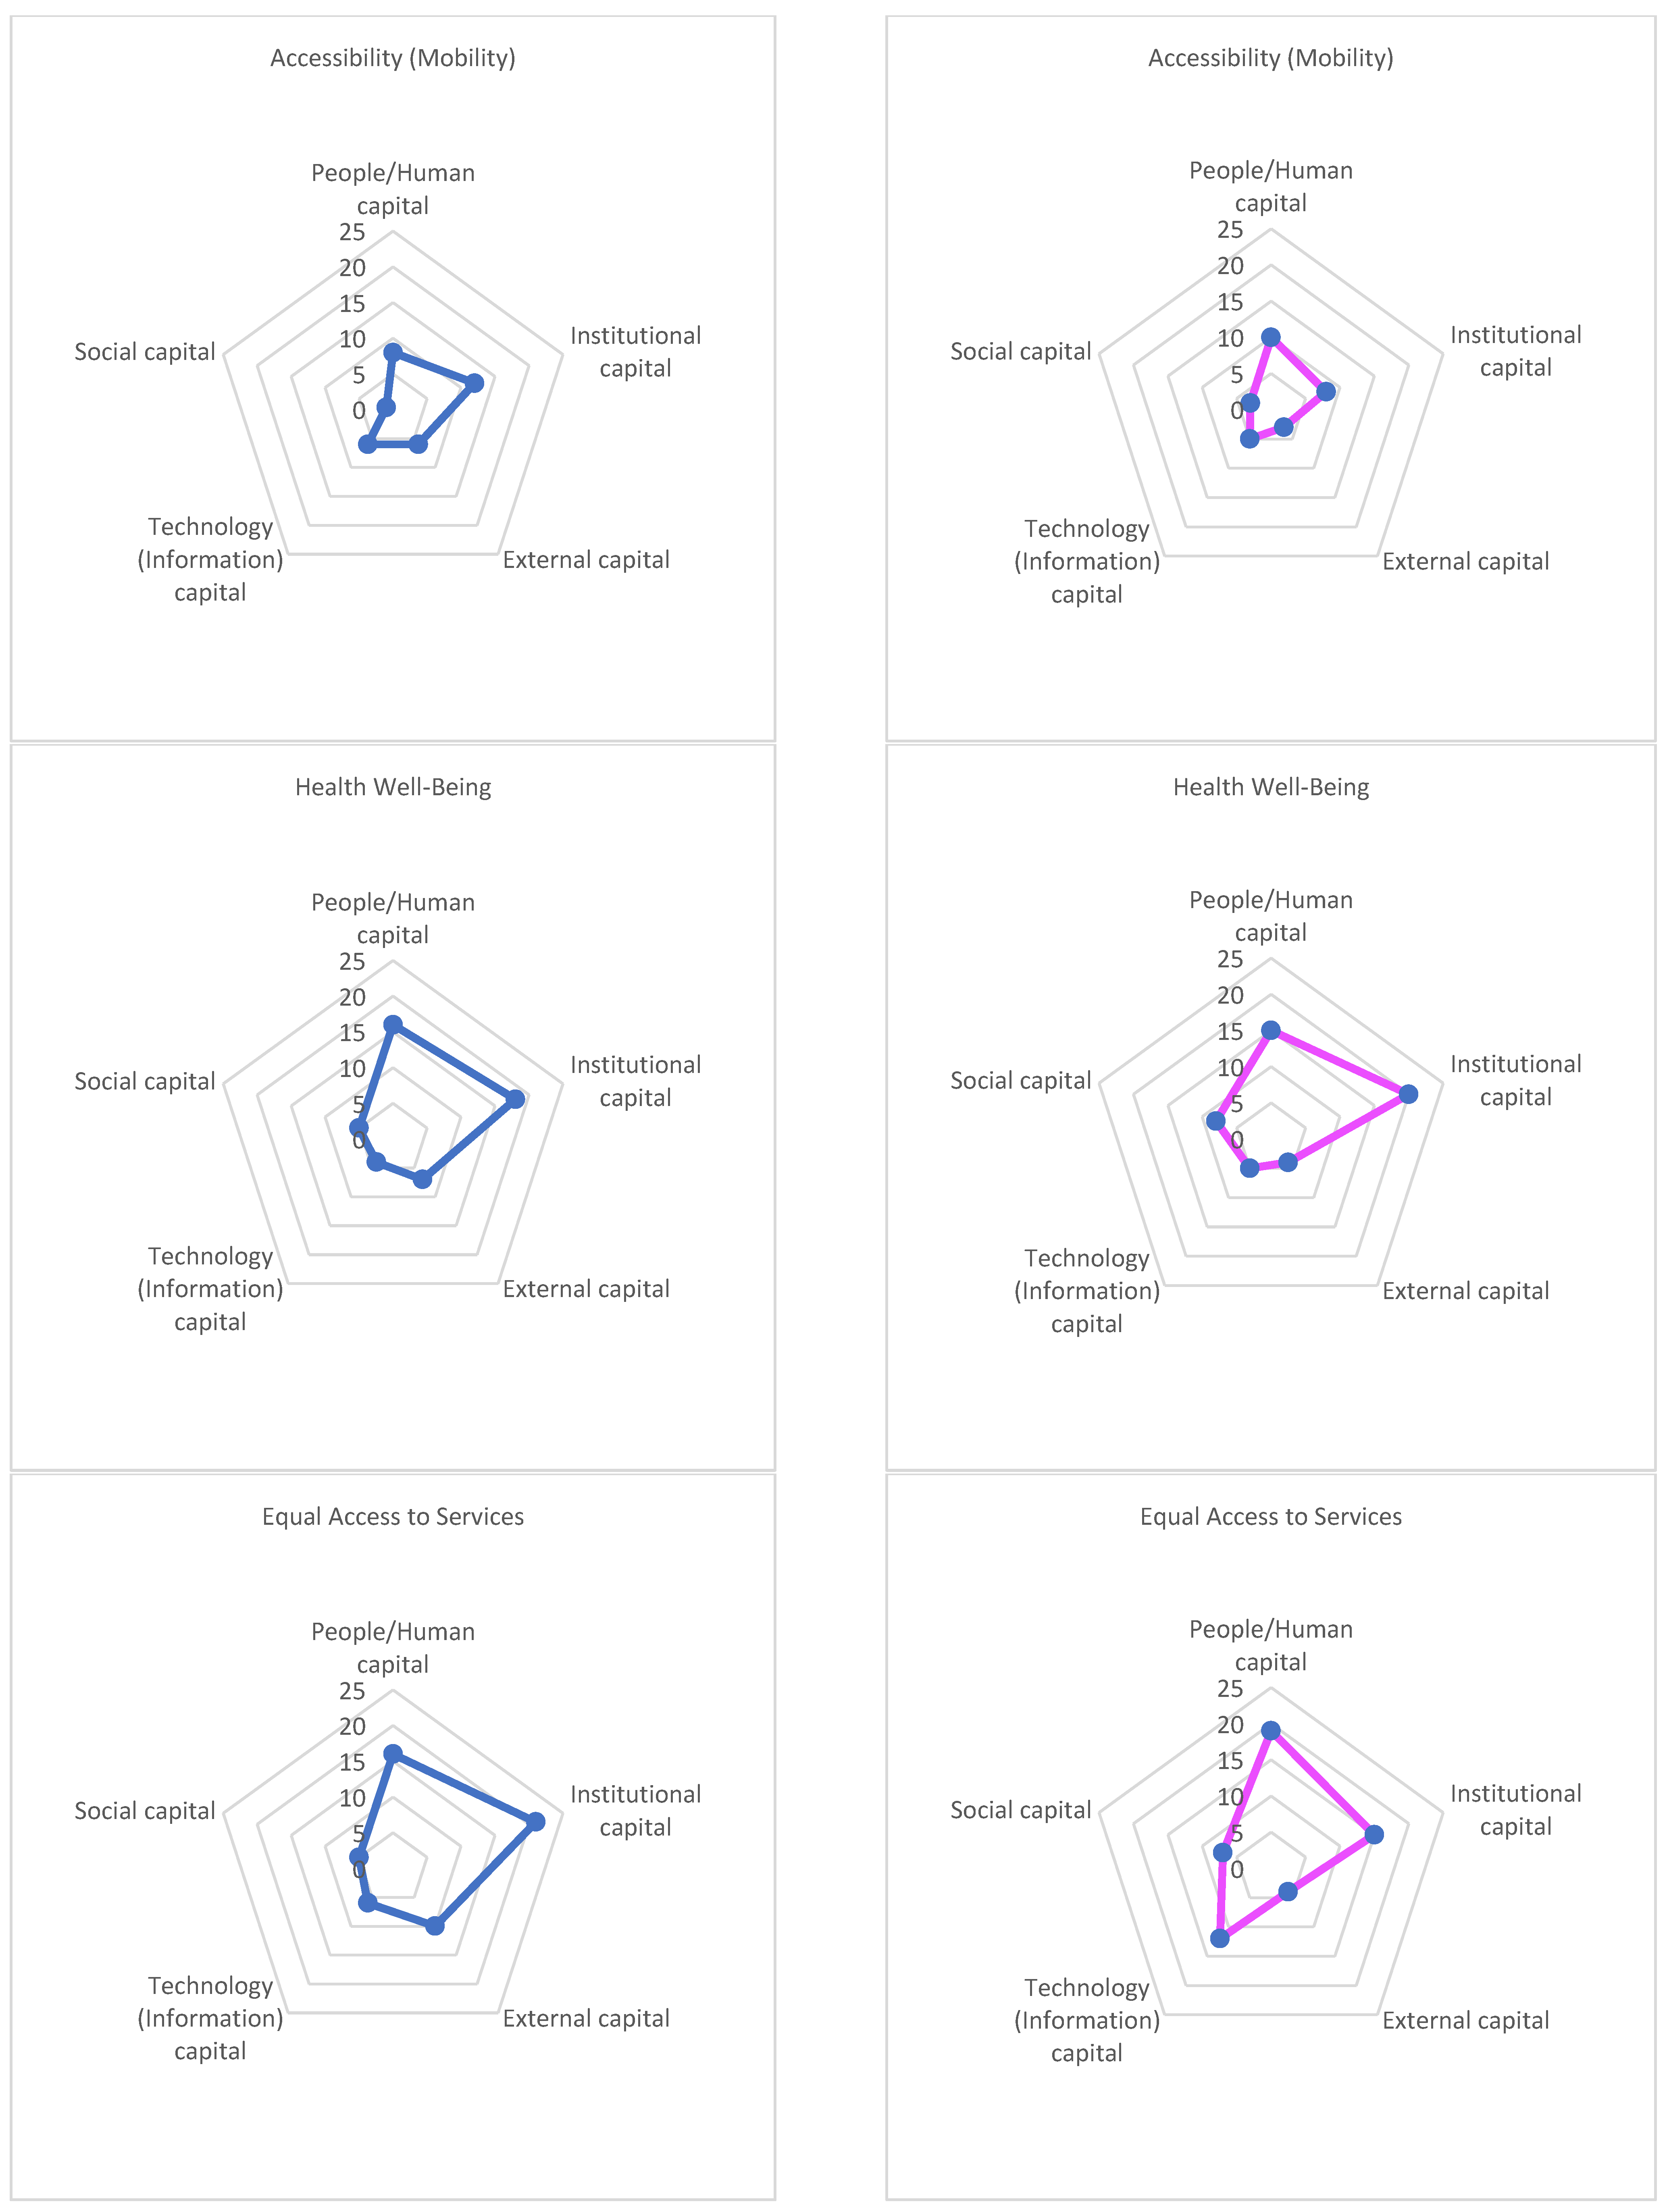
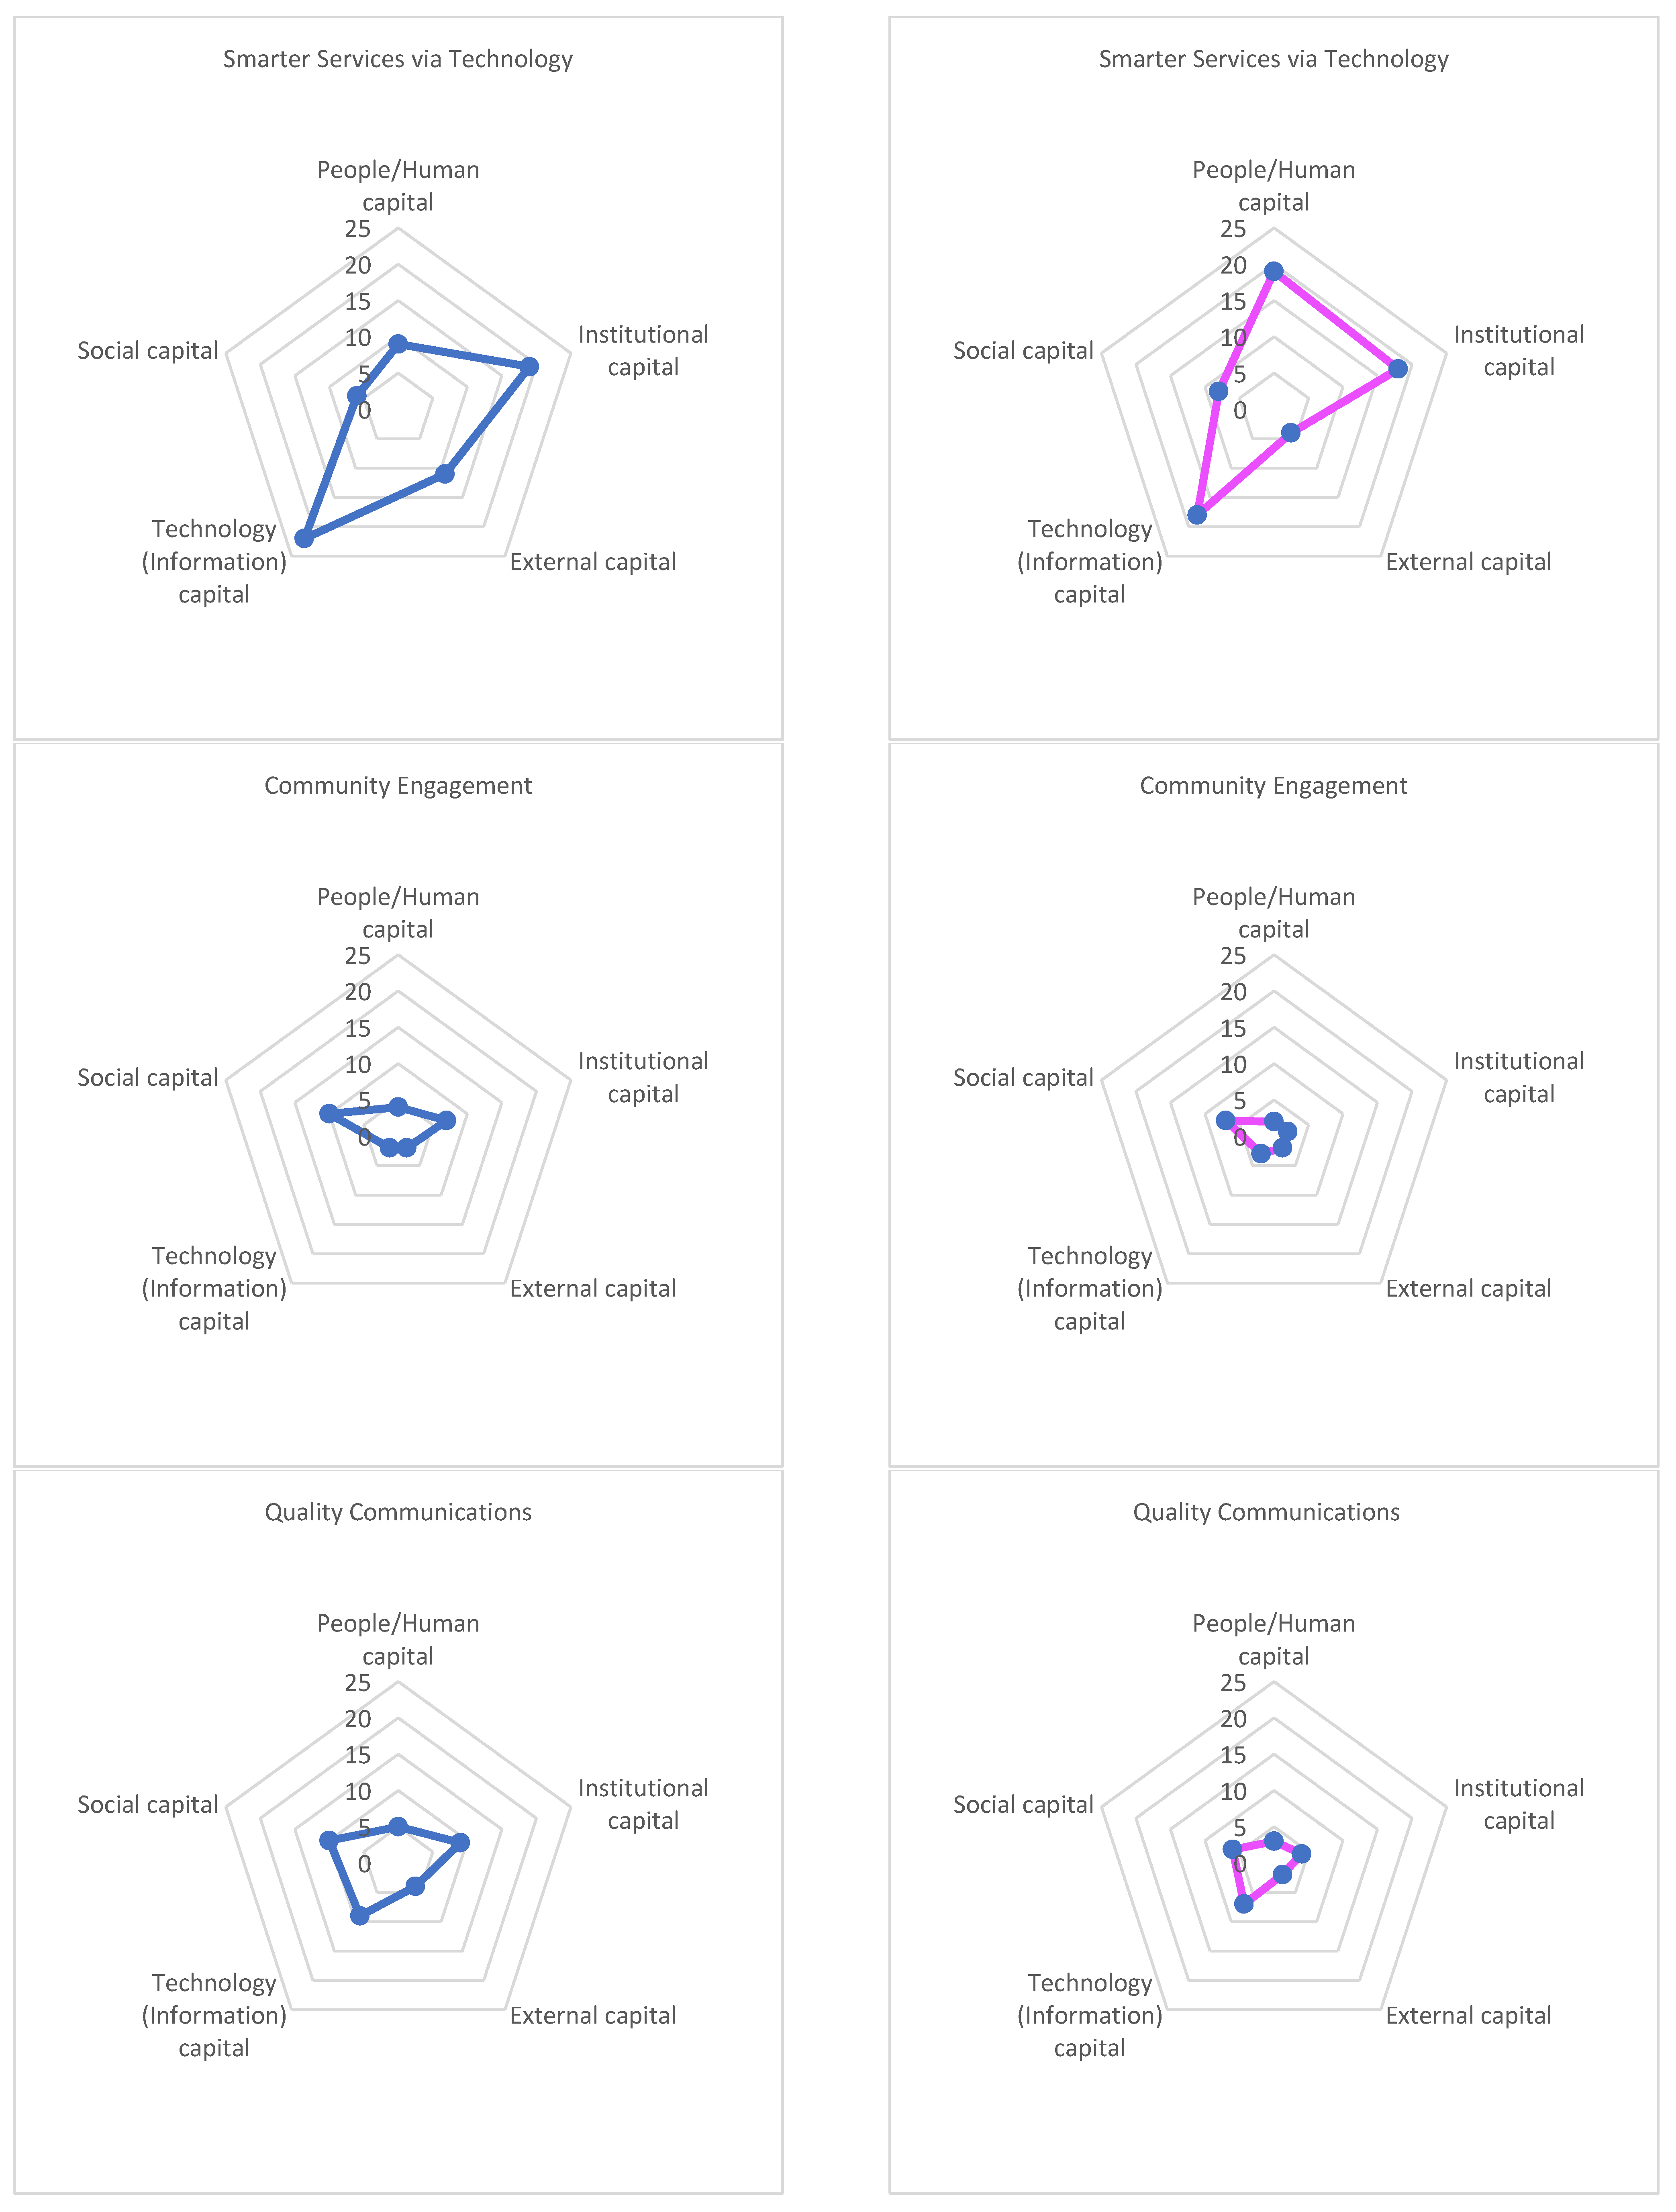
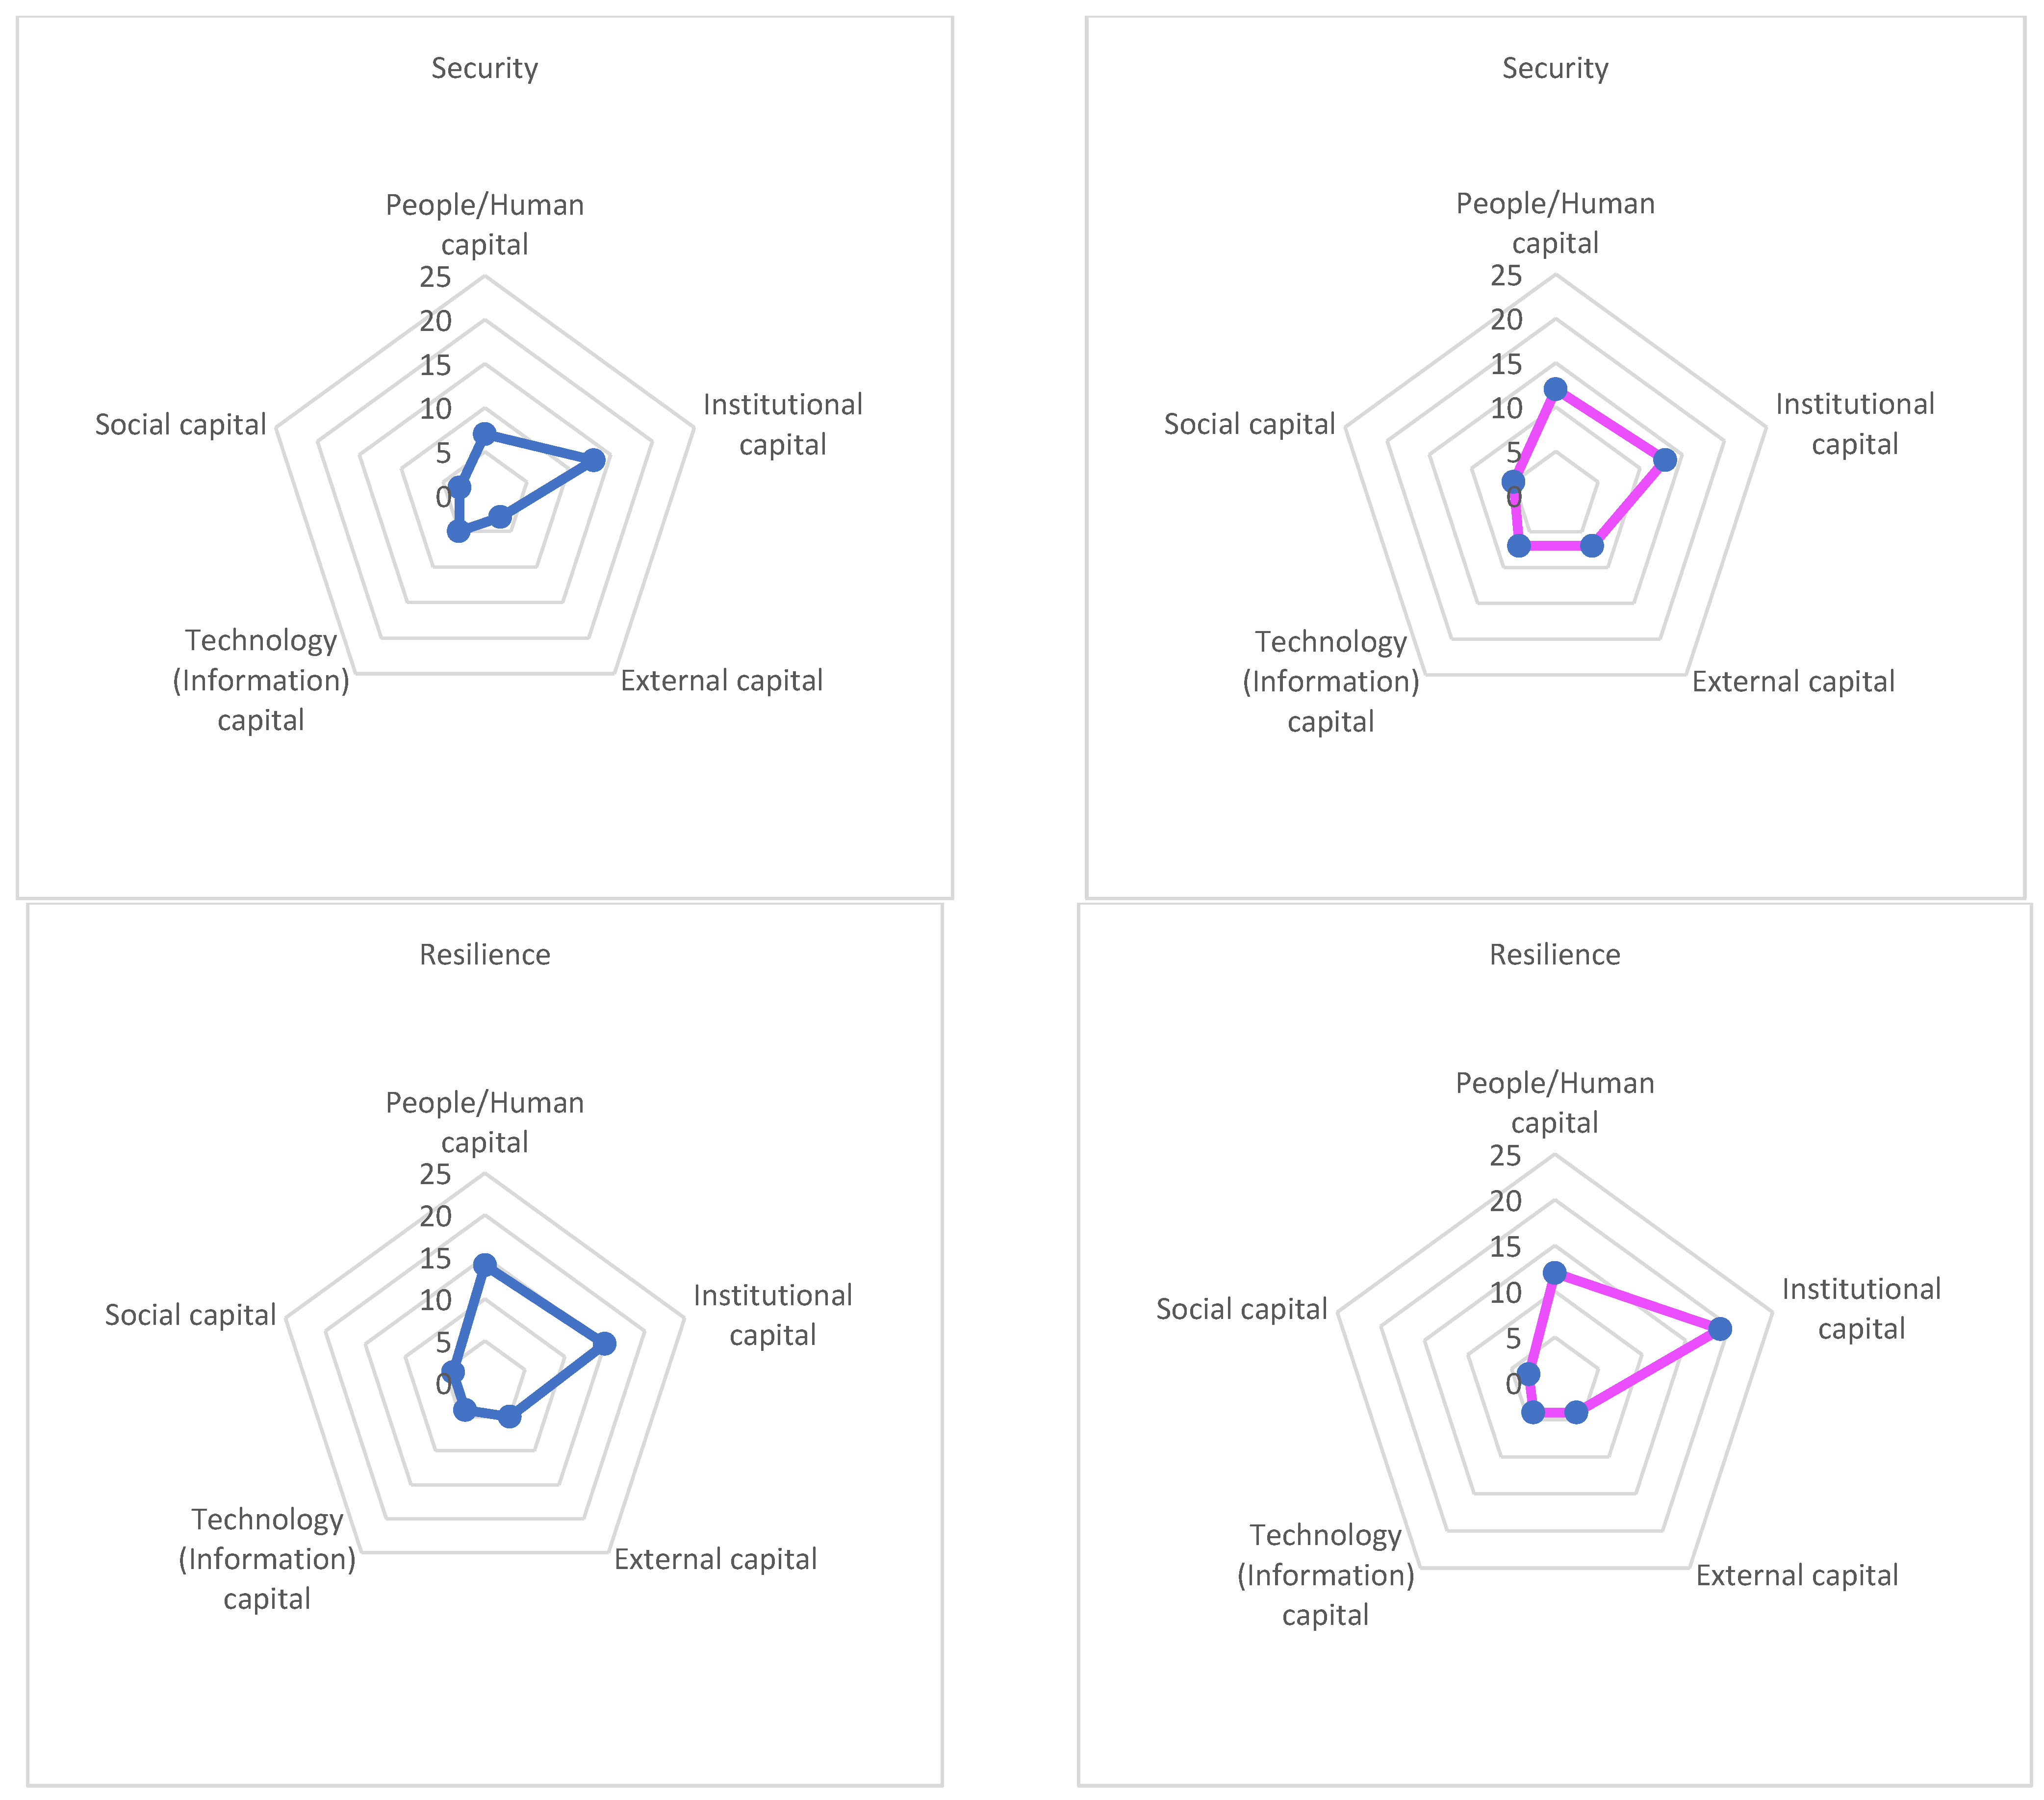
Appendix B shows the city-based breakdown radar charts by soft asset capitals. There is no one-size-fits-all best radar chart shape in terms of soft asset consideration. This is because it is influenced by many factors, such as city vision, objectives, development stage of cities, existing human and material resources, and other unique city specific factors.
On resilience, it is a key element of smart and resilient cities that closely relate community level involvement as a first respondent at the time of disaster occurrence. From the proposals, disaster risk management itself seems to be already integral to the city development proposals as a cross-cutting theme. Thus, it is not often explicitly presented in the proposals. This could be one of the reasons why the ‘resilience’ element is not often included in terms of external capital, and social capital. For example, there are several specific disaster risk plans in the proposals. They continue efforts or initiatives to strengthen risk awareness, information systems, trainings, institutional capacity strengthening and communications with communities/citizens. Given the histories of disaster events in both cities, it is assumed that there will be ongoing efforts to increase resiliency, including community-based efforts.
Community engagement is also mentioned in the proposal within the decision-making process, a feedback provider to local governments’ basic services. However, it was difficult to connect this aspect to disaster mitigation, preparedness, response, and recovery. Social capital which is both structured (rule of law, type of regime, legal framework) and cognitive level (local level organization, behaviors, trust, etc.) should also be strengthened as an important soft asset within the city.
However, they are not explicitly mentioned in the proposal. As a result, social capitals are probably no lower than the other capitals. Regarding the difficulties of selecting information, it is worth pointing out there were no specific sections dedicated to disaster risk management in the proposal template.
It is again too early to analyze two cities of resilience, community engagement, and quality communications aspects, due to the reasons mentioned earlier. Although there is no uniform shape or degree of consideration, the radar chart shape can be much larger than the ones in Appendix B. It is assumed that social capital, external capital for stronger community toward external risks, institutional capital and even technology capital can be strengthened for ensuring provision and improving accessibility of various public services.
Considering disasters, including the current prolonged pandemic, it will be reasonable and useful to compare pre-, during-, or post-disaster occurrence in terms of soft asset consideration. It can also be anticipated to demonstrate the level of a cities’ flexibility and responsiveness towards disaster occurrence.
5. Discussion
With the assumption that soft assets are a value driver in smart and resilient cities, this paper aims to: (i) introduce a potential tool for identifying soft assets; (ii) examine the level of soft asset consideration and decision making; and (iii) show the level of influence and make a comparison between different soft asset value elements and soft asset capital in terms of soft asset consideration for local authorities/decision makers. What is a better balance of soft asset consideration and decision making moving forward?
Guideline: This paper referred to the theories of living structure and wholeness as a guideline for consideration and decision making. Despite the different targets—a feature of objectives and soft assets, both require subjective judgement. These theories provide a framework to objectively explore a complex process with the notion of wholeness capturing soft asset value as an outcome. Thus, the relationship between many small items and large items (in this paper, smaller nodes and larger nodes) is important. It is also important to understand the fact that small items/nodes support large items/nodes.
Given many small items that constitute one ‘beautiful’ image, classifying the inherent scaling hierarchy is useful by thorough (computational) analysis of Jiang and de Rijke’s research [17,18]. This paper adopted this analysis to examine municipal decision-making and the level of consideration, and the balancing between soft asset capitals to draw some common patterns for later research. Of course, there are many other unique internal and external factors applicable to cities, e.g., various stakeholders’ decision making, development status, resource availability, city vision, strategies, external relations, etc. In addition, the current approaches connect two hierarchies by edge (between node) and the five soft asset capitals. Distribution of small items/nodes can be classified by the soft asset capitals and the nine value elements.
For these reasons, the paper used network and radar chart analyses to understand the connection (network), potential influential node, and comparisons between the soft asset nine value elements and five soft asset capitals. The theories of living structure and wholeness are highly relevant. The city case studies in this paper demonstrate that the results and findings are in line with these theories. The following are some findings and items for future research.
Network and level of consideration analysis, and beyond: The level of considerations in terms of the nine value elements are largely aligned with smart city vision and objectives. Robust gap and needs analyses were conducted and integrated into the proposals to operationalize the plan. To examine the city’s most appropriate balance of soft asset consideration (=creating values), further research is needed. It will comprise of interview-based research to compare changes between the original and present levels of soft asset considerations. In order to do so, the outputs and findings presented in this paper can be used. However, there are some challenges and refinements are required:
- Smaller node classifications: Many small nodes (items) were classified by soft asset capitals and value elements (areas). These classifications can be used for preparation of a list of shared nodes (items) for identifying potential impacts in line with a city’s expected outcomes for the proposal.
- Influential larger nodes: Identification of more influential elements from the network analysis was useful. It can be used for examining to what extent influential nodes and small nodes contributed to the city’s expected outcomes of the proposal. This exercise is also anticipated to verify the two fundamental laws of living structure by a qualitative approach, as the computed approach was not applied to the case of soft assets. By doing so, the exercise results are expected to provide a framework for better understanding soft asset consideration and decision making in an organic process.
- Comparisons between original and present: Current radar charts show a weak contribution in social capital and external relations. As for social capital, the tool is designed with a top-down point of view (not bottom up); further, the proposal was prepared by local authorities with a specific format, they may not be able to include sufficient information. However, considering the change of social and economic environments caused by disasters, including the current pandemic, it is assumed that the original level of soft asset consideration and focus areas were changed. Social capital, external capital, and technologies are anticipated to focus more than originally, for better access to social safety nets and services. Further interview-based research is required to compare changes and focused on the city’s needs. It is assumed that the analysis will provide greater lessons for soft asset consideration in future city planning and development.
Limitations
Introduction of the tool: The tool can classify soft asset considerations into five soft asset capital types within the specific value elements. The definitions are still broad and the assessment of selecting soft asset considerations in smart resilient city proposals is conducted by interpretation base. Thus, it is difficult to identify how far it can be shared with other items. In fact, about 60–65% of soft asset considerations were shared with other value elements and soft asset capitals. There is room to refine definitions further. However, it can also be interpreted that such numbers of shared considerations have scaling up and or spillover effects in the city development process. The biggest challenge is to find an appropriate guiding framework to capture such effects (=value creation) based on the idea of wholeness.
Data: It is apparent that the data collected from the proposals were not sufficient to capture a comprehensive picture of a city’s soft asset consideration and decisions at the planning stage. A city proposal is generally presented with vision, analysis of present status, implementation plans, financing plans, and others. Soft asset capitals that were presented in this paper are largely associated with projects, actions, and initiatives. Therefore, it is inevitable that there are areas or information that depend extensively on the author’s subjective judgement. This issue will be addressed by supplementary data in future interviews and additional research.
While the pilot examination was shared in this paper, more research and interviews are needed to examine what additional information and data are needed. The important point is that there are no definite classifications. They will be used as initial classifications for a further examination of the best balance in considering and determining soft assets and the associated value creation. Then, further clarifications are needed, including how the plan and reality differs, and how the situation changes with the dynamics of emergency risk. These issues cannot be examined with the current data set and the tools used. These aspects will be examined in future studies.
6. Conclusions and Further Research
Soft assets are intricately linked to the cycle of improving the quality of services and are a prime source of innovative value creation for smart and resilient cities. The value creation process is therefore hard to trace. As Haskell and Westlake [10] said, an unknown risk of the benefit of spillover or scaling up is an underlying incentive to hold back from consideration or investment in soft assets. This explains why this study was started.
In the smart and resilient city context, the key question is how local authority decision makers or policy makers can decide to factor in use of soft asset approaches. This paper aimed to show one potential way of understanding soft assets consideration and decision-making by visualizing network, analyzing network nodes and links, and identifying potential influential nodes (elements) that are anticipated to lead the form of new value creation in line with the city’s anticipated outcomes. As the cases show, the higher levels of consideration elements (areas) are closely aligned with a city’s vision or goals. A future point of departure will identify the gaps and better factor in use of soft asset approaches.
Five soft asset capitals and nine value elements in smart and resilient cities were selected based on many intangible asset management studies. They were key factors to prepare the identification (evaluation) tool. The selection in the proposals by the tool was conducted manually because some soft assets consideration and decisions could also be applied to other elements, depending on context. It was a time-consuming process, but necessary to better understand the network and its analysis as soft assets depend on ‘context’.
By examining the relations between large and small node relations by node degree distribution, it was understood that the two fundamental laws of living structure were quite relevant to the case of soft assets. This paper did not take a computational approach that was ably undertaken by Jiang and Rijke [17]. However, the idea of living structure is not fully subjective, but still possible to present objectively, and the evolution of an organic process is something in common and very insightful for this paper.
There is no one-size-fits-all model of level of soft asset consideration in the radar chart. Traditionally the smart city focuses on technology and information capital, but on average, institutional and people/human capital were higher as initial data collections. Further, citizen engagement and external relations also need to be reassessed as they are key for a stronger and resilient society, especially as all societies and cities experience the current pandemic.
The next step is to examine what changes are made in terms of the level of consideration and the decision-making process, and how some influential nodes interact with others in the development process. All answers appear to largely depend on how the soft assets are carefully considered and modified at any stage of development, which is also a component of soft asset capital. We hope that ongoing and future research will provide further guidance pointing the way to explore a framework and guidelines to capture soft assets and value creation based on the idea of wholeness.
Author Contributions
Conceptualization, E.W. and R.S.; methodology, E.W.; data curation, E.W.; writing—original draft preparation, E.W.; writing—review and editing, E.W. and R.S. All authors have read and agreed to the published version of the manuscript.
Funding
This research was funded by Keio University Fukusawa Research Funding.
Institutional Review Board Statement
Not applicable.
Informed Consent Statement
Not applicable.
Data Availability Statement
Not applicable.
Conflicts of Interest
The authors declare no conflict of interest.
Appendix A

Table A1.
Identification of Soft Asset Consideration.
| Soft Asset Value Elements | Soft Asset Capitals |
|---|---|
| RESOURCE MANAGEMENT | People/Human capital (competency in resource management related policy, strategy, planning development, air quality, biodiversity, water conservation, energy efficiency, SWM, etc.) Institutional capital (strategy, planning, approach to mainstream resource efficiency in city development policy and strategy) External capital (coordinating mechanisms between LGU and stakeholders to embrace unique local character, benefits to stakeholders (citizens) for promoting resource management) Technology (information capital) (promotion of automation-based smart resource management systems and technology in public service provision) Social (structural) (level of contribution to strengthening collective/transparent decision-making processes) Social (cognitive) (facilitating level of participation in policy/planning processes) |
| ACCESSIBILITY (MOBILITY) | People/Human capital (competency in establishing holistic urban development plans) Institutional capital (availability of cross-sectoral coordinated land-use planning (and readiness for implementation)) External capital (provision of citizen friendly public transport services; benefits to stakeholders (citizens) for promoting accessibility) Technology (information capital) (developing data management tools, digital technology for better resource management) Social (structural) (level of contribution to strengthening collective/transparent decision-making processes) Social (cognitive) (facilitating level of participation in policy/planning processes) |
| HEALTH WELL-BEING | People/Human capital (competency in establishing a shared vision of a healthy community for residents; better and healthy living places, good green spaces; equal and inclusive society) Institutional capital (creating policies and a system for making health choices easy for citizens; better and healthy living places; equal and inclusive society) External capital (making a direct, positive impact on human health by creating public gathering places; benefits to stakeholders (citizens) for improving health/well-being) Technology (information capital) (developing data management tools, digital technology for improving accessibility to healthcare service facilities, healthy living environment) Social (structural) (level of contribution to strengthening collective/transparent decision-making processes) Social (cognitive) (facilitating level of participation in policy/planning process, making values (trust, solidarity, reciprocity) stronger in policy and systems development processes) |
| EQUAL ACCESS TO SERVICES | People/Human capital (competency in basic community service needs identification and making countermeasures for risks) Institutional capital (making sustainable financial strategies available for providing equal access to services) External capital (development or update of systems for monitoring integration to identify key challenges and track progress over time; benefits to stakeholders (citizens) for improving equal access to services) Technology (information capital) (number of citizens without IT systems (internet connectivity) decreases) Social (structural) (level of contribution to strengthening collective/transparent decision-making processes) Social (cognitive) (facilitating level of participation in policy/planning processes (Citizens can easily engage in public service monitoring to give feedback on services provided by LGU)) |
| SMARTER SERVICES VIA TECHNOLOGY | People/Human capital (competency of developing holistic visions/strategies across sectors) Institutional capital (readiness, availability of the plan/system to improve citizens’ technical literacy) External capital (establishing efficient communication channels within an organization; benefits to stakeholders (citizens) for improving smarter services) Technology (information capital) (readiness, availability of system for easy access to LGU services and data, tech-linked services, smarter public services) Social (structural) (level of contribution for strengthening collective/transparent decision-making processes) Social (cognitive) (facilitating levels of participation in policy/planning processes) |
| COMMUNITY ENGAGEMENT | People/Human capital (competency of developing effective community engagement plans, including public awareness raising activities) Institutional capital (readiness, availability of support for community-based awareness raising efforts (for building a better city)) External capital (planning community activities for strengthening community engagement in public events; benefits to stakeholders (citizens) for improving community engagement) Technology (information capital) (readiness of feasible technology and IT systems for elderly and vulnerable citizens for an inclusive society) Social (structural) (level of contribution to strengthening collective/transparent decision-making processes) Social (cognitive) (values (trust, solidarity, reciprocity)) |
| QUALITY COMMUNICATIONS | People/Human capital (competency of capability to establish citizen–government communication channels) Institutional capital (creating streamlined coordinating mechanisms between LGU, the private sector and the community for effective communication) External capital (regularly conducting feedback on city service provision quality from citizens; benefits to stakeholders (citizens) for improving quality communications) Technology (information capital) (availability of feedback collecting systems and tools for citizen) Social (structural) (collective/transparent decision-making process, accountability of leaders, practices of collective action and responsibility) Social (cognitive) (level of decentralization, facilitating level of participation in policy process) |
| SECURITY | People/Human capital (competency of capability to improve city safety plans for better city risk management) Institutional capital (developing a framework for ensuring the welfare of citizens in times of crisis) External capital (developing community security services, availability of enabling police departments and law enforcement for safe cities; benefits to stakeholders (citizens) for improving security) Technology (information capital) (availability of quality of data management systems/frameworks for citizen to access, planning security measures, handling options) Social (structural) (local level organization, collective/transparent decision-making processes, accountability of leaders, practices of collective action and responsibility) Social (cognitive) (support for strengthening local values (trust, solidarity, reciprocity), social norms, behavior for improving local security) |
| RESILIENCE | People/Human capital (effectiveness of a zone’s crisis management framework, knowledge dissemination and management, natural resource management) Institutional capital (mainstreaming of disaster risk reduction and climate change adaptation, good governance, land use plans, green icon-related planning, transport, clean energy) External capital (institutional collaboration with other organizations and stakeholders during a disaster) Technology (information capital) (effectiveness of early warning systems, access to the internet) Social (structural) (community preparedness during a disaster, education and awareness) Social (cognitive) (social capital, localism) |
Appendix B
Figure A1.
Number of Soft Assets Considerations for Five Soft Asset Capitals.


References
- Neirotti, P.; De Marco, A.; Cagliano, A.C.; Mangano, G.; Scorrano, F. Current trends in Smart City initiatives: Some stylised facts, Department of Management and Production Engineering, Politecnico di Torino, Corso Duca degli Abruzzi 24, 10129 Torino (TO), Italy. Int. J. Urban Policy Plan. 2014, 38, 25–36. [Google Scholar]
- Ahvenniemi, H.; Huovila, A.; Pinto-Seppa, I.; Airaksinen, M. What are the differences between sustainable and smart cities? Int. J. Urban Policy Plan. 2017, 60, 234–245. [Google Scholar] [CrossRef]
- World Bank. Smart Cities. 2015. Available online: https://www.worldbank.org/en/topic/digitaldevelopment/brief/smart-cities (accessed on 4 January 2022).
- Angelidou, M. Smart city policies: A spatial approach. Int. J. Urban Policy Plan. 2014, 41, S3–S11. [Google Scholar] [CrossRef]
- OECD. Resilient Cities. Available online: https://www.oecd.org/cfe/regionaldevelopment/resilient-cities.htm (accessed on 4 January 2022).
- UNISDR. Making Cities Resilient Report 2012; UNISDR: Geneva, Switzerland, 2012; p. 11. [Google Scholar]
- Arafah, Y.; Winarso, H.; Suroso, D.S.A. Towards Smart and Resilient City: A Conceptual Model. In IOP Conference Series: Earth and Environmental Science, Proceedings of the 4th Plano Cosmo International Conference, Bandung, Indonesia, 3–5 April 2018; IOP Publishing Ltd.: Bristol, UK, 2018. [Google Scholar]
- Papaa, R.; Galderisia, A.; Majelloa, M.; Cristina, V.; Sarettaa, E. Smart and Resilient cities, A Systemic Approach for Developing Cross-Sectoral Strategies in the Face of Climate Change. TeMA J. Land Use Mobil. Environ. 2015, 8, 19–49. [Google Scholar]
- Baba, K.; Tanaka, M. A Concept of Resilient city and providing assessment indicators. J. City Plan. Inst. Jpn. 2015, 50, 47–49. [Google Scholar] [CrossRef]
- Haskel, J.; Westlake, S. Capitalism without Capital: The Rise of the Intangible Economy; Princeton University Press: Princeton, NJ, USA, 2018; pp. 221–222. [Google Scholar]
- Wataya, E.; Shaw, R. Measuring the value and the role of soft assets in smart city development. Int. J. Urban Policy Plan. 2019, 94, 106–115. [Google Scholar] [CrossRef]
- Kaplan, R.S.; Norton, D.P. Strategy Maps: Converting Intangible Assets into Tangible Outcomes; Harvard Business School Publishing: Boston, MA, USA, 2004; pp. 343–344. [Google Scholar]
- Sveiby, K.E. Methods for Measuring Intangible Assets. 2010. Available online: https://www.sveiby.com/files/pdf/intangiblemethods.pdf (accessed on 4 January 2022).
- Edvinsson, L.; Malone, M. Intellectual Capital: The Proven Way to Establish Your Company’s Real Value by Measuring Its Hidden Brain Power; Piatkus Book: London, UK, 1997; p. 225. [Google Scholar]
- Lonnqvist, A. Measurement of Intangible Success Factors: Case Studies on the Design, Implementation and Use of Measures; Tampere University of Technology: Tampere, Finland, 2004; pp. 61–62. [Google Scholar]
- Krishna, A.; Shrader, E. Social capital assessment tool. In Proceedings of the Conference on Social Capital and Poverty Reduction, Washington, DC, USA, 22–24 June 1999. [Google Scholar]
- Jiang, B.; de Rijke, C. Structural Beauty: A Structure-Based Computational Approach to Quantifying the Beauty of an Image. J. Imaging 2021, 7, 78. [Google Scholar] [CrossRef] [PubMed]
- Jiang, B. Living Structure Down to Earth and up to Heaven: Christopher Alexander. Urban Sci. 2019, 3, 96. [Google Scholar] [CrossRef] [Green Version]
- ISO 37120; Sustainable Development of Communities—Indicators for City Services and Quality of Life. 1st ed. International Organization for Standardization: Geneva, Switzerland, 2014.
- Resiliencecity.org Sustainable Development Goals 11. Available online: https://sustainabledevelopment.un.org/sdg11 (accessed on 4 January 2022).
- Kaplan, R.S. The Balanced Scorecard for Public-Sector Organizations; Balanced Scorecard Report; Harvard Business School Publishing: Boston, MA, USA, 1999; p. 4. [Google Scholar]
- Joerin, J.; Shaw, R.; Takeuchi, Y.; Krishnamurthy, R. The adoption of a Climate Disaster Resilience Index in Chennai, India. Disasters 2014, 38, 540–561. [Google Scholar] [CrossRef] [PubMed]
- Ministry of Housing and Urban Affairs, Government of India, Smart City Mission. Available online: http://smartcities.gov.in (accessed on 4 January 2022).
- India Smart City Mission, The Smart City Challenge Stage 2—Bhubaneswar. 2016. Available online: https://smartnet.niua.org/sites/default/files/resources/BHUBANESWAR_SCP_0.pdf (accessed on 4 January 2022).
- Network Analyzer Online Help (Cytescape). Available online: https://med.bioinf.mpi-inf.mpg.de/netanalyzer/help/2.7/ (accessed on 4 January 2022).
- India Smart City Mission. The Smart City Challenge Stage 2—Nagpur, 2018. Available online: https://smartnet.niua.org/sites/default/files/resources/Nagpur_SCP.pdf (accessed on 4 January 2022).
Figure 1.
Soft assets in smart and resilient city.

Figure 2.
(a): Bhubaneswar—soft asset value elements, soft asset capitals, and activities/initiatives (image via Cytoscape, https://cytoscape.org (accessed on 4 January 2022)); (b): Node degree distribution; (c) Number of connections to other nodes.
Figure 2.
(a): Bhubaneswar—soft asset value elements, soft asset capitals, and activities/initiatives (image via Cytoscape, https://cytoscape.org (accessed on 4 January 2022)); (b): Node degree distribution; (c) Number of connections to other nodes.

Figure 3.
(a): Nagpur—soft asset value elements, soft asset capitals, and activities/initiative (image via Cytoscape); (b): node degree distribution, (c) number of connections to other nodes.
Figure 3.
(a): Nagpur—soft asset value elements, soft asset capitals, and activities/initiative (image via Cytoscape); (b): node degree distribution, (c) number of connections to other nodes.


Figure 4.
Total number of soft assets considerations for five soft asset capitals.

Table 1.
Soft asset capitals.
| Soft Asset Capitals | Description |
|---|---|
| People/Human capital |
|
| Institutional capital |
|
| External capital |
|
| Technology, information capital |
|
| Social |
|
Table 2.
Number of actions/initiatives (soft asset consideration).
| Bubanswer | ||||||
|---|---|---|---|---|---|---|
| People/Human Capital | Institutional Capital | External Capital | Technology (Information) Capital | Social Capital | Total | |
| Resource Management | 14 | 18 | 7 | 2 | 7 | 48 |
| Accessibility (Mobility) | 8 | 12 | 6 | 6 | 1 | 33 |
| Health Well-Being | 16 | 18 | 7 | 4 | 5 | 50 |
| Equal Access to Services | 16 | 21 | 10 | 6 | 5 | 58 |
| Smarter Services via Technology | 9 | 19 | 11 | 22 | 6 | 67 |
| Community Engagement | 4 | 7 | 2 | 2 | 10 | 25 |
| Quality Communications | 5 | 9 | 4 | 9 | 10 | 37 |
| Security | 7 | 13 | 3 | 5 | 3 | 31 |
| Resilience | 14 | 15 | 5 | 4 | 4 | 42 |
| Total | 93 | 132 | 55 | 60 | 51 | 391 |
Table 3.
Nagpur—number of actions/initiatives (soft asset consideration).
| Nagpure | ||||||
|---|---|---|---|---|---|---|
| People/Human Capital | Institutional Capital | External Capital | Technology (Information) Capital | Social Capital | Total | |
| Resource Management | 10 | 10 | 3 | 2 | 2 | 27 |
| Accessibility (Mobility) | 10 | 8 | 3 | 5 | 3 | 29 |
| Health Well-Being | 15 | 20 | 4 | 5 | 8 | 52 |
| Equal Access to Services | 19 | 15 | 4 | 12 | 7 | 57 |
| Smarter Services via Technology | 19 | 18 | 4 | 18 | 8 | 67 |
| Community Engagement | 2 | 2 | 2 | 3 | 7 | 16 |
| Quality Communications | 3 | 4 | 2 | 7 | 6 | 22 |
| Security | 12 | 13 | 7 | 7 | 5 | 44 |
| Resilience | 12 | 19 | 4 | 4 | 3 | 42 |
| Total | 102 | 109 | 33 | 63 | 49 | 356 |
Publisher’s Note: MDPI stays neutral with regard to jurisdictional claims in published maps and institutional affiliations. |
© 2022 by the authors. Licensee MDPI, Basel, Switzerland. This article is an open access article distributed under the terms and conditions of the Creative Commons Attribution (CC BY) license (https://creativecommons.org/licenses/by/4.0/).
Share and Cite
MDPI and ACS Style
Wataya, E.; Shaw, R. Soft Assets Consideration in Smart and Resilient City Development. Smart Cities 2022, 5, 108-130. https://0-doi-org.brum.beds.ac.uk/10.3390/smartcities5010007
AMA Style
Wataya E, Shaw R. Soft Assets Consideration in Smart and Resilient City Development. Smart Cities. 2022; 5(1):108-130. https://0-doi-org.brum.beds.ac.uk/10.3390/smartcities5010007
Chicago/Turabian StyleWataya, Eiko, and Rajib Shaw. 2022. "Soft Assets Consideration in Smart and Resilient City Development" Smart Cities 5, no. 1: 108-130. https://0-doi-org.brum.beds.ac.uk/10.3390/smartcities5010007