
Bauhaus.MobilityLab: A Living Lab for the Development and Evaluation of AI-Assisted Services


1
Fraunhofer Institute of Optronics, System Technologies and Image Exploitation IOSB, Advanced System Technology Branch, Am Vogelherd 90, 98693 Ilmenau, Germany
2
Fraunhofer Institute of Optronics, System Technologies and Image Exploitation IOSB, Fraunhoferstraße 1, 76131 Karlsruhe, Germany
*
Authors to whom correspondence should be addressed.
Smart Cities 2022, 5(1), 133-145; https://0-doi-org.brum.beds.ac.uk/10.3390/smartcities5010009
Submission received: 29 November 2021
/
Revised: 4 January 2022
/
Accepted: 4 February 2022
/
Published: 7 February 2022
(This article belongs to the Special Issue Advanced Geospatial Applications for Smart Cities and Knowledge Discovery from Urban Data)
Abstract
:With the vision “Innovation by experiment” the Bauhaus.MobilityLab started in July 2020 as a living lab in the district Brühl of the city Erfurt, Thuringia, Germany. As a unique project, it is coupling the sectors mobility, logistics and energy into a unified living lab. It allows to design, develop and evaluate innovative services to increase the quality of life in the city. Bauhaus.MobilityLab offers access to live smart city data of different domains and provides a set of powerful artificial intelligence (AI) algorithms for data processing, analytics and forecasting. In contrast to existing platforms, its uniqueness is the available and integrated living lab. It allows directly rolling out new smart city services and to evaluate the impact in the real world. This paper describes the implementation of the technical platform supporting the Bauhaus.MobilityLab, realized according to the DIN SPEC 91357 as an open urban platform. It focuses on data sharing based on the concepts of the International Data Spaces and the integration of AI algorithms. The concepts are presented based on examples in the energy domain.
1. Introduction
Information and communication technologies (ICT) are becoming a more and more integral part of our daily life. Technology is supporting cities in meeting current challenges and transforming them into livable and sustainable areas. Since cities are complex systems, it is not adequate to focus on a single aspect. Combining multiple domains offers real potential on the way to a smart city. Therefore, Bauhaus.MobilityLab (BML) focuses on the intersection of mobility, logistics and energy to contribute to increasing the living conditions in the smart city of the future.
How? BML uses artificial intelligence to support service providers in the design, testing and evaluation of innovative and intelligent services. What? BML offers a secure and easy-to-use platform to develop new services and try them in a living lab without much prior knowledge of data processing and AI.
The Bauhaus.MobilityLab platform supports customers in offering new services with the help of existing data sources and applicable AI algorithms to evaluate them in the living lab. The customer is supported in selecting and parameterizing the appropriate data sources and AI algorithms. The data or the result of the algorithms can be used to create new services, to trigger actions or to make offers to lab users.
In this paper, the ideas behind the living lab, the laboratory platform and an AI-supported experiment are presented.
2. The Living Lab of Bauhaus.MobilityLab
2.1. Living Lab
As early as the 1970s, there were first thoughts about living labs. Cities are mentioned as a social laboratory in various works [1] (p. 65). Groß et al. [1] continue these thoughts and discuss the concept of the real experiment and develops it further into a living lab [2] (p. 2). Liedtke et al. [3] (p. 12) even suggest that products that have a major impact on the environment should always be developed and tested in living labs. The Bauhaus.MobilityLab goes one step further and incorporates the idea that all products that have any impact on society should be implemented in a living lab. This has the advantage that acceptance can be tested directly on-site at the users’ premises, and the product or service to be developed can be adapted before it is launched on the market. The real laboratory developed by BML serves as a platform for testing various cross-sectoral services and not just for a predefined scenario. Various business models can be developed and implemented from this core platform.
With this platform, BML allows lab customers to try out and develop innovative offers. However, it must be kept in mind that the user’s knowledge of being part of an experiment can influence the result of the experiment [2] (p. 2). The acceptance of living in a research environment and participating in the belonging experiments must also be given on the part of the laboratory users [4].
The best AI algorithms are useless without the right data basis to learn from, to make predictions or derive decisions. In the AI world, the most important factor is the data. This is what makes it so important to set up a cross-domain living lab for an AI-assisted smart city. The uniqueness of the Bauhaus.MobilityLab is reflected in the cross-sectoral linking of the domain mobility, logistics and energy. The mobility domain includes everything about mobility within the laboratory. It will provide information about the status of the infrastructure, traffic, pollution and integrate novel mobility services and systems. The logistics domain will provide information, algorithms and new concepts for logistics companies and use cases for last-mile delivery services. In the energy domain the laboratory will provide everything about forecasting and optimization in the energy sector such as electricity, gas or district heating. With direct interactions with the households, new energy services shall be developed.
This enables the laboratory customer to develop and test cross-domain services. Various project partners make it possible to provide an initial level of data, algorithms and services in the platform. The lab customer thus has a simple onboarding process. A main focus in the development of the laboratory platform is on the integration of AI services.
In this publication, the software structure of the laboratory platform is presented and there is a discussion about the needed components. In a living lab in particular, which interacts with users in the aforementioned manner, it is necessary that data sovereignty is the top priority. The data of laboratory users and laboratory customers must not be fully available to all laboratory customers. User administration and a management interface are also required.
2.2. District Brühl
As the Thuringia state capital, Erfurt, with its approx. 214,000 inhabitants, represents a typical large city [5] and was therefore selected for the project. By selecting Erfurt as the laboratory environment, the experiences can be transferred easily to other medium-sized and large cities in a representative manner. The location of branches and transshipment centres of large logisticians such as DHL, UPS, KNV, Funke, Zalando, Noveda, Finke, Rewe etc. makes it possible to develop and test new services in the living lab in the domain of logistics. Within the city of Erfurt, the Brühl district was selected for the living lab. The development of this district by the Landesentwicklungsgesellschaft Thüringen mbH (LEG Thüringen) only began in the 1990s and thus a relatively modern infrastructure is available. The area of Brühl covers 23 hectares, it includes commercial, cultural and service companies, residential buildings and green areas [6]. The modern infrastructure and the not yet fully completed conversion of the district enables the integration of sensory and information technology systems in buildings and streets that are still to be built.
2.3. Stakeholders
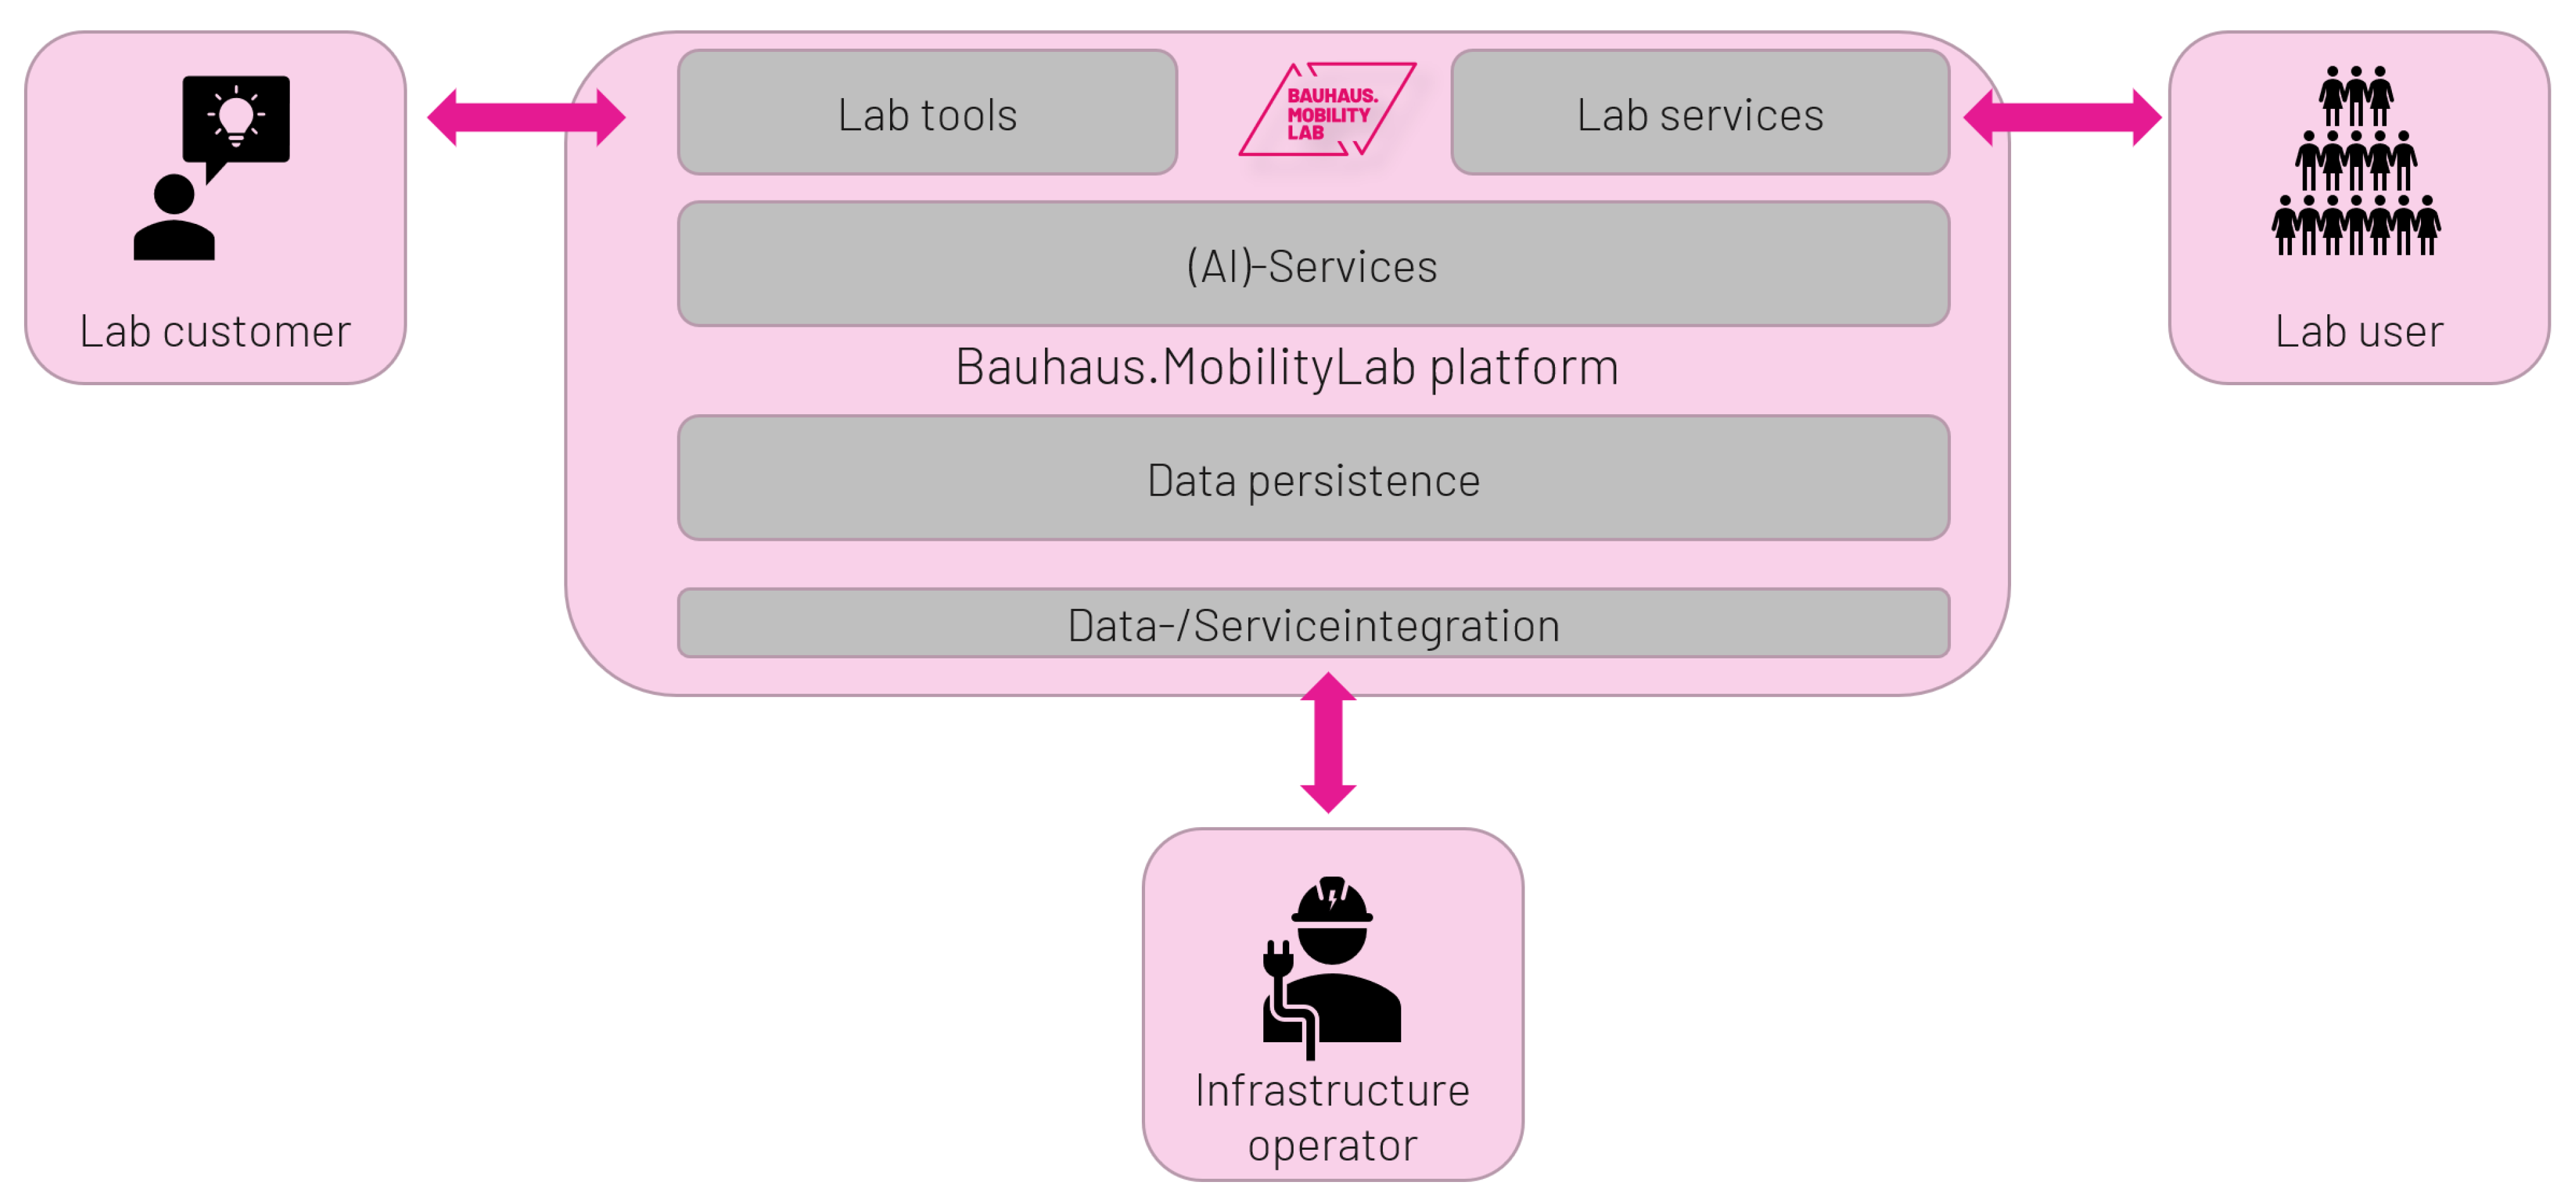
In contrast to existing solutions, Bauhaus.MobilityLab itself does not offer smart city services for the public. It rather offers the needed infrastructure (provision of data sources, technical platform for hosting solutions and most important the living lab to evaluate the acceptance and impact) needed to develop and evaluate smart city solutions. This is reflected in the four different stakeholder groups: (1) lab operator; (2) infrastructure operator; (3) lab customer; (4) lab user.
Infrastructure operators are responsible for operating the physical infrastructure that is relevant to the living lab. Usually, they are companies, already offering services in the area, for example transport companies, bike renters or energy suppliers. Besides the physical infrastructure, data assets concerning the region of the living lab are of interest, for example traffic count or environmental data. The motif of participating in the Bauhaus.MobilityLab can be an offering of one’s own services in other contexts or to offer data for money.
The lab users are the central part of the living lab. They have strong ties to Brühl, the district of interest, either because they are living or are working there. Lab users directly benefit from innovative smart city services offered by lab customers.
The offerings in the living lab are provided by lab customers. They can use the BML living lab and platform either to realize and evaluate new service offerings or to improve their existing products. By using Bauhaus.MobilityLab, they can build upon existing building blocks and expertise. First, several partners of multiple disciplines and domains are present within the living lab. Second, tools and a technical runtime environment are provided to the service of the customer. Third and most important: the service can be directly rolled out to the real world, since the living lab with the lab users is an integral part of Bauhaus.MobilityLab. Therefore, the acceptance and implication of a service offering can be directly evaluated.
The lab operator is responsible for managing and operating the living lab. This contains the further development and maintenance of the IT platform (see Section 3) as well as the operation of the living lab. Therefore, the lab operator is the main contact point for the other stakeholders.
3. Bauhaus.MobilityLab Platform
Bauhaus.MobilityLab provides a holistic offering for creating innovative smart city solutions. The living lab is supported by an IT platform. It allows lab customers to develop, operate and evaluate smart city applications. The goal is to provide an easy usable offering for realizing and testing new ideas. An example of such a smart city offering is the optimization of energy usage. This can be one component on the way to a smart city or a smart district.
3.1. IT Support for the Living Lab
The Bauhaus.MobilityLab platform is a flexible platform for the implementation and evaluation of novel IT services. Next to the technical infrastructure, which is described in the following sections, tools will be provided to support lab customers even more and to lower the initial learning curve.
To support this, the IT platform needs to meet the following basic requirements.
- (1)
- Support for lab customers to design, create, implement, host and evaluate innovative smart city services.
- (2)
- Provide access to data sources that are relevant for the region of the living lab, especially covering the three domains of the project (energy, mobility, logistics). Since it is not possible to store all data sets inside the platform (e.g. due to legal reasons), data access to external platforms should be supported, too.
- (3)
- Protected data sources. Not all data sets can be distributed freely inside the platform. Usage policies must be defined and enforced. Only with this capability, infrastructure operators like the municipal utilities can be gained to participate in Bauhaus.MobilityLab.
- (4)
- Integration of external systems. As it will be shown in the example of the optimization of energy usage, smart city services consist of the interaction between various systems. Therefore, the platform should support the integration of external systems.
- (5)
- Integration of AI algorithms. Innovative, data-driven applications benefit from advances in the field of artificial intelligence. To support this, the platform should allow the easy integration of AI algorithms into the services.
- (6)
- Isolation of different lab customers, infrastructure providers and other users of the platform, by default. Data exchange (for example lab customers accessing data sources provided by an infrastructure provider) is only possible through defined gateways. Those handover points are responsible to apply the stated usage policies.
3.2. Bauhaus.MobilityLab Platform
The IT platform for the Bauhaus.MobilityLab is realized as a cloud platform. The basic architecture is based on the Reference Architecture Model Open Urban Platform [7]. From a high-level point of view, the platform follows a layered architecture, as shown in Figure 1. Infrastructure providers are integrated through a data- and service-integration layer. This layer abstracts different programming interfaces (APIs) and data formats. This allows the data persistence layer to store the data in a unified data model. More details can be found in Section 3.3. The main focus is on time-series data, but other georeferenced data is considered, too. This contains information on the region of the living lab, local event information, weather data etc. Incoming data, often called raw data, needs to be prepossessed and analyzed, to be usable by the lab customer. This is indicated by the (AI)-Services layer. Additional tools are provided for lab customers to simplify the creation and evaluation of smart city services. The actual services offered to lab users or the public are indicated as lab services. They can access and reuse data and services from the layers below.
The presented layered architecture is the logical view of the platform. The technical implementation is realized through dedicated microservices. This allows a flexible combination of the available components. For example, smart data created by AI services can be stored in the data persistence layer, too. In addition, it allows realizing multi-tenancy (separated areas for each lab customer and infrastructure operator). The platform is structured into two areas: commonly used space, which provides data and services and can be used by all lab customers. This space is owned and maintained by the lab operator. The second area includes several spaces, each owned by one lab customer or infrastructure operator. Inside them, all components needed to provide the smart city service can be deployed. In addition, customer-specific external systems can be connected (like the smart home systems in the energy use case). This separation allows operating and evaluating multiple services of different lab customers in parallel. Although those spaces are isolated, data exchange is realized through connector gateways. The Dataspace Connector [8] from the International Data Spaces [9] is used for this. First, this allows to formally describe the metadata of the data sources. Second, usage policies can be attached, which are controlled by the Dataspace Connector.
3.3. Provision of Data
Data is the foundation for nearly all innovative smart city solutions. Today’s challenge is access to those data sources. Usually they are, if available at all, provided by different organizations. This requires time-consuming bilateral negotiations. In addition, there is no unified data model. Combining multiple data sources requires substantial effort. These challenges complicate the realization of innovative data-driven smart city applications. To overcome this, Bauhaus.MobilityLab provides data from different data sources through a unified data model and access interface. Currently, two categories of data are considered. First, geospatial point and coverage data. Second, time-series data. For the first mentioned, standardized protocols like Web Map Service (WMS) [10] and Web Feature Service (WFS) [11] are used. The focus in the described energy use case is on time series data. For this, the SensorThings API [12] is used inside the Bauhaus.MobilityLab platform to provide and access data. Every infrastructure operator providing data, has its own space on the platform. Inside this, data connections can be implemented, which import data from external systems into the platform (see data and service integration, Section 3.2). Inside the BML platform, the data is provided through the stated, standardized interfaces. For example, in the energy use case, FROST® [13] is used as implementation for the SensorThings API. Authentication, authorization or usage policies are not part of the WMS, WFS or SensorThings API standards. For data providers, it is crucial to control the data usage. To realize this, Bauhaus.MobilityLab uses the concepts of the International Data Spaces (IDS) [9]. Each data source is provided through a dedicated instance of FROST® in the space of the data provider. This instance is only accessible inside the space of the customer. To make it available for other lab customers, each space contains an IDS Connector (implemented by the Dataspace Connector). Those connectors are accessible for all participants of the Bauhaus.MobilityLab platform, acting as a gateway to the space of the data providers. Data sources (internal links to FROST® instances) with additional metadata like usage licence and policies are registered in those connectors. Each lab customer can access, with the help of its own Dataspace Connector, data sources from the connector of infrastructure operators. With this approach, IDS concepts for access control and policy enforcement can be reused.
4. Optimizing Energy Usage in an AI-Assisted Smart City
Energy consumption and especially the flexible control of electrical energy usage is one of the crucial factors to overcome the move to renewable energy sources. A large study by DENA [14] shows that smart grids and controllable storage and load control can result in a relief of the power grid and thus a reduction in the need for power grid expansion. Therefore, improved predictions of energy usage and smart reactions to the fluctuating amount of available electrical energy are one component of a smart city. Since the needed adjustments affect daily life, not only technical challenges need to be met. Rather, public acceptance is needed. The available living lab in the district of Brühl is a predestined chance for developing and evaluating smart services for optimizing the energy usage.
In the following, the realization of an AI-assisted forecast is presented, which supports the transformation of the district of Brühl into a smarter district. This can be used as a blueprint for an AI-assisted smart city. The following section describes the idea of bringing the energy optimization as a use case into the living lab (Section 4.1). It shall be evaluated if lab users (inhabitants of the Brühl district) can be supported in planning and optimizing their energy usage. The required input data is provided by the Bauhaus.MobilityLab platform and described in Section 4.2. This raw data is then processed by AI algorithms described in Section 4.3 and Section 4.4.
4.1. Experiment in the Living Lab: Optimization of Energy Usage
With the help of “smart meters” (intelligent measuring systems), it is possible for lab users to monitor and plan their electricity consumption more precisely [15]. In addition, they enable the offer of new and more flexible rates, for example, an exchange-dependent current electricity price every 15 min [16]. There are already some energy companies that offer their customers flexible energy rates. The consumer can thus decide when to consume electricity and switch on devices. Based on an electricity price forecast and even 24 h in advance, he/she will know how the price will develop in the next 24 h and can decide accordingly. The electricity price forecast is dependent on other forecasts, such as the photovoltaic forecast and the wind power forecast. The corresponding forecasts for the next day are regularly reported to the European Energy Exchange (EEX) and are publicly available [17]. In the products currently provided, it is not possible for the customer to plan the energy usage according to the energy mix (sun, wind, fossil). There is no support for users to store their assets like storage devices or controllable devices, no optimization takes place and no additional information for planning the energy consumption (exogenous influencing factors) is available.
In the Bauhaus.MobilityLab, the decision-making process should be supported by enriching the forecast with additional information about the origin of the electricity. This means that the user can plan his consumption not only based on the electricity price, but also based on the origin. A lab user may prefer to consume cheap electricity produced in a coal-fired power plant, but an environmentally conscious lab user would prefer to pay a little more and use green electricity from a local photovoltaic (PV) system or a wind turbine. To support this within the Bauhaus.MobilityLab, a close cooperation with the Erfurt municipal utility (Stadtwerke Erfurt) has been established. By this, an infrastructure provider is involved to realize and evaluate this service in the district of Brühl. The implementation is split into multiple expansion stages. In the first step, the electricity composition and the costs for the next 24 h are presented to the user. With the help of an installed smart meter, the billing and the display of the actual consumption for the user takes place. Via the Bauhaus.MobilityLab mobile application, users can enter their existing technical devices, which they would like to control depending on the electricity price and the composition of the electricity, with planned usage times. These assets are stored in the laboratory platform. So the app can then notify the user when he/she should switch a specific device on or off. With having the assets of the lab user already in the platform, in a further step it is planned to carry out optimizations. This means that based on parameters specified by the user, such as electricity mix, electricity price, devices and device consumption, optimizations are calculated and displayed to the user. The lab user will be able to enter various preferences with their weighting, on how he/she would like the assets to be optimized. This will depend on the personal attitude of the lab user. The user thus sees the optimal control options for the devices registered in the BML platform, depending on his specifications.
In the next expansion stage, it is planned to integrate smart home systems of lab users into the Bauhaus.MobilityLab. This allows not only a recommended use of devices, but also automatically executes this suggestion. According to Brandt [18], the spread of smart home systems for networking and control will increase by over 400% in the next four years. This growth of controllable devices allows bringing the automated and optimized usage of electronic devices into practice. With Loxone and KNX, such systems are already available on the market [19]. This enables the BML platform to control the devices directly at the customer site. So the calculated optimization can be executed automatically. With this level of automation, it is even conceivable to integrate additional devices such as electricity storage or heat pumps into the control of the platform. In phases of low electricity prices, storage units could e.g., be charged which will later supply a device with electricity that has to run in a high price phase.
4.2. Required Data Sources for the Optimization
As indicated in the previous chapter, several data sources need to be available in the BML platform to realize the optimization of consumption. Next to publicly available data like the current energy price or energy mix, highly sensitive data concerning the private lifestyle of lab users needs to be collected. This includes the electricity consumption of the whole household or even of individual devices. This data is very sensitive and must be protected, as it may allow further conclusions to be drawn about the users and their habits. The data flow must therefore be designed in such a way that only the most necessary sensitive data is stored. Anonymization techniques must be applied, wherever possible. The technological basis to realize this was described in the previous Section 3.
As already mentioned, there are mainly two parties involved in providing the data basis for the realization. First, the municipal utilities must offer the following continuously:
- Power mix in 15 min resolution (default resolution in the German energy market for pricing and energy accounting) for the next 24 h.
- Electricity price in 15 min resolution for the next 24 h (day-ahead-market time frame).
- Power consumption of the individual lab users, collected by their smart meters.
Second, the lab user needs to provide information about the available devices and the planned usage. In detail, these are:
- The energy consumption of all the considered devices.
- Switching time specifications (at which time the device must/must not be switched on), e.g., charging time for electric vehicles (full-charge upon departure), finished laundry upon arrival.
- Preferences regarding the electricity mix.
- Parameters for the optimization model (weighting between energy price and energy mix).
4.3. AI-Assisted Data Transformation
The data sources discussed in the previous paragraph are either simple time series or asset descriptions that are not directly usable. For the use case described, the corresponding linking of the data from the electricity supplier with that from the lab customer is probably sufficient. Since the lab customer should also be offered further experiments, it is important to make the data “smart” to build the “smart city”. This can be done with further processing steps to enrich the data with further information. Even special AI algorithms will be needed for this transformation.
It can and will be necessary to enrich the recorded or measured data with additional information. The enrichment can take place through various forecasting methods, such as a photovoltaic forecast, which uses the forecasted global radiation of the German Weather Service in the background. A calendar service provides information on vacations, public holidays and school vacations on the BML platform, which can also be included in the optimization. Incomplete or partially incorrect time series can be recognized and corrected through error detection and the creation of substitute values. Various AI-based forecasting algorithms for renewable energy generation systems are needed and will be further developed within the BML project.
4.4. Further Developments
The use case described above should now be thought further to the fact that the laboratory user has a photovoltaic system on his house roof and the electricity provider operates a wind farm. Controllable resources include, for example, a battery storage device, an electric vehicle, a heat pump, a washing machine and a dishwasher. With this information plus the electricity price and electricity mix for the next 24 h alone, it is difficult to plan the devices mentioned in a meaningful way. For example, if the sun shines tomorrow, it might make more sense to wash the laundry when self-generated electricity from an own photovoltaic system is available. However, if it snows tomorrow, it will probably not be possible to wait to operate the heat pump until the electricity is cheap, because by then the house may have cooled down too much. If tomorrow is a public holiday, the laboratory user probably does not want to do the laundry.
The enrichment transforms raw data into smart data, the application of which is much more extensive than that of the original data. At this point, it also makes sense to include the other domains of mobility and logistics in the considerations. As described above, the user can also own an electric vehicle, which means that there is already a link to the mobility sector. Here too, the link can be drawn accordingly: If tomorrow is a Sunday, the trip to work will probably be omitted, no electricity will be required for charging and the vehicle will probably not be on the road at a certain time. The data enriched in this way is of great value for a traffic forecast.
5. Energy Optimization with the Bauhaus.MobilityLab Platform
5.1. Energy Management System
The basic functions of an extensive energy management system are required to manage the energy data for the use case described above, to carry out forecasts and optimizations and save the laboratory users’ assets. In the following, the requirements for such a system that needs to be brought to the laboratory platform are described.
The time series management needs to be designed and audit proven, to meet the requirements of the energy industry. The revision security needs to include the archiving and versioning of data. This will enable the user to track data changes and their causes at any time. Earlier versions of a time series should be recoverable. With the ability to have several independent clients, time series need to be saved separately and securely from one another. In the use case shown here, it is for example possible to map several districts in one database instance. The time series management function should enable various unit conversions to be carried out and can save values with a resolution of up to 1 min. In the case of the use case considered here, storage takes place in a 15 min grid, as is common in the energy industry.
For the described use case, we will also need various proven and tested functions for time series forecasting, especially in the energy domain. The needed functions for the time series forecast should be made available on the laboratory platform as part of the Bauhaus.MobilityLab. The forecast of energy data is not trivial as it depends on a large number of different parameters. These can be weather, calendar, production plans from local companies, events or public holidays. All of this information flows together in the time series forecast and is considered in it. Here comes the benefit of the Bauhaus.MobilityLab platform into place. It will contain all the mentioned, required information of the district of Brühl for the forecasting.
Another module needed for the shown use case is the optimization, which should also be available in the Bauhaus.MobilityLab laboratory platform. As part of the optimization, simple or complex systems need to be modelled, which are then optimized for specific parameters. In the case of the shown use case, the systems would be the individual controllable resources that are available at the laboratory customer and the parameters that need to be optimized are the electricity consumption or the electricity price, depending on the user’s preference. To be able to map the devices in the optimization model, the assets must be known accordingly. The asset management function in the Bauhaus.MobilityLab laboratory platform is provided via an API, thus enabling lab users to manage their devices and optimize the optimization module according to the parameters set by the laboratory user.
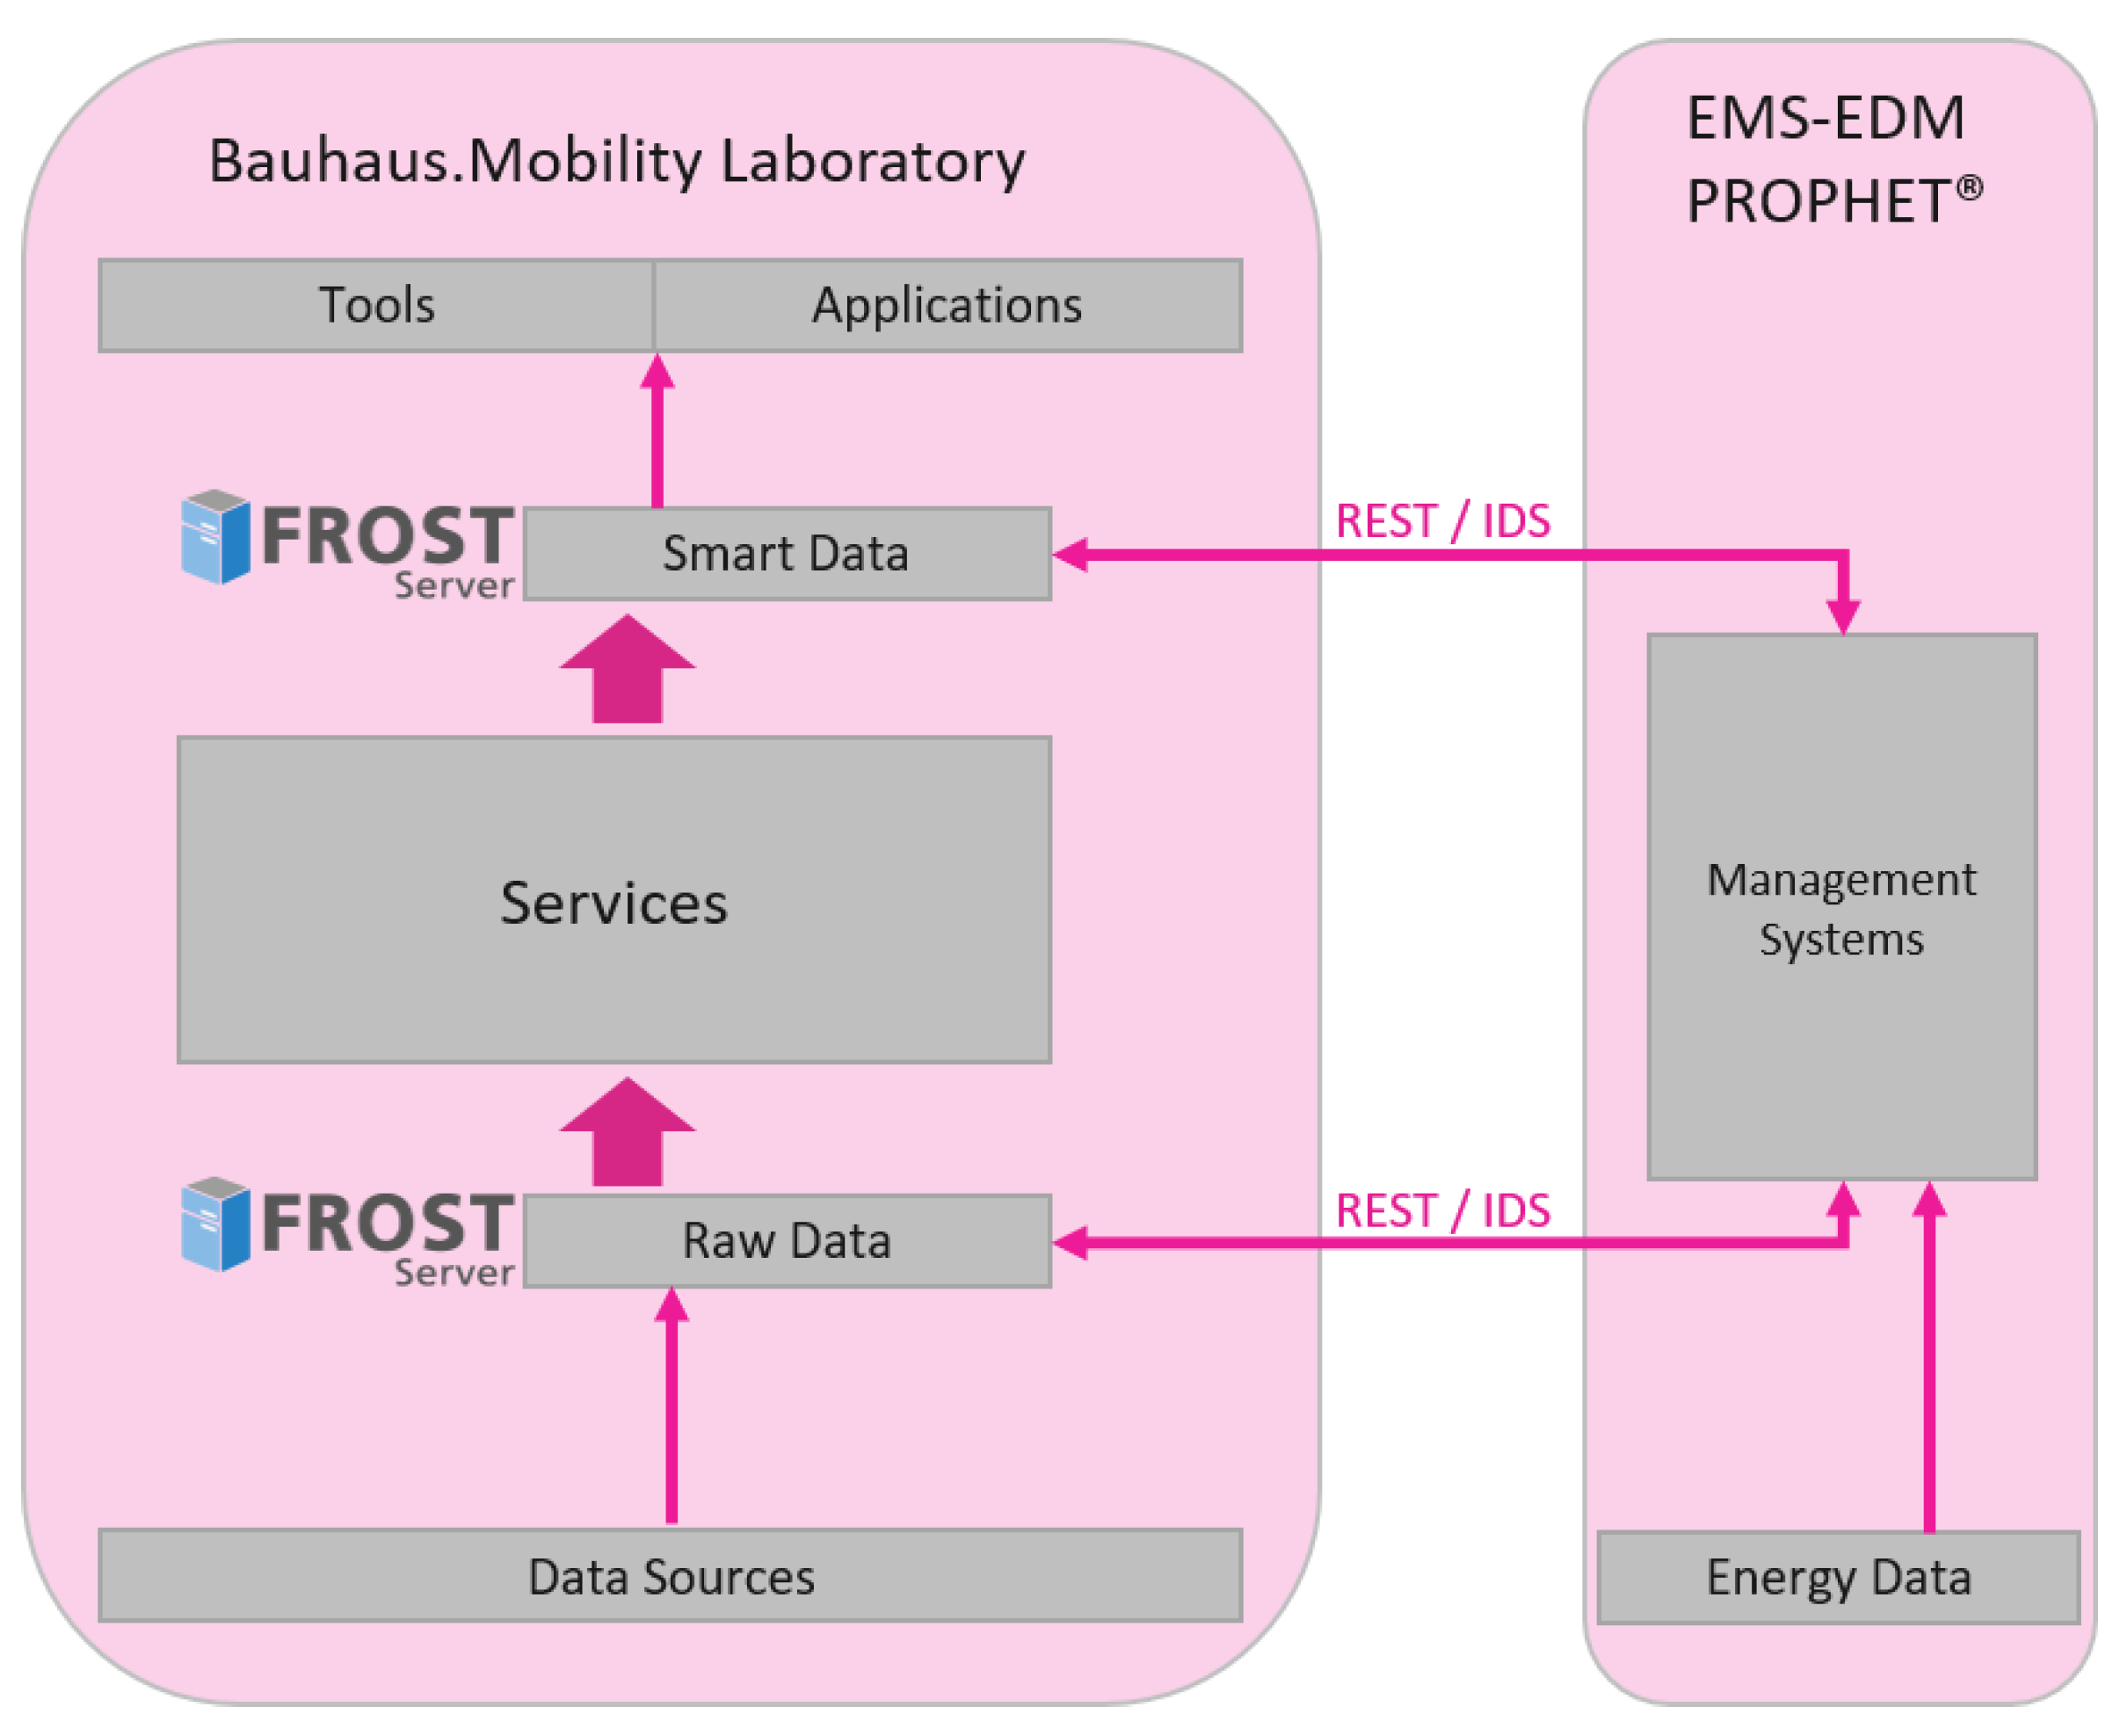
Such an energy management system is available with the EMS-EDM PROPHET® solution, that fulfils all the above-described requirements for the usage in the laboratory platform. Since it is an established system that is used by various energy companies, the inhibition threshold is low to provide sensitive data for the use case. Forecasts of electricity, gas and district heating time series are possible, including various AI-based forecasts, which are also being further developed within the framework of the Bauhaus.MobilityLab. In EMS-EDM PROPHET®, both the training and the tuning of the forecasts are possible. Besides the established forecast algorithms provided by the energy management system, new algorithms, such as self-optimizing and self-learning forecast, will also be incorporated into the Bauhaus.MobilityLab laboratory platform and currently being investigated in various research projects. Bringing the forecast algorithms directly onto the platform enables them to use the district-specific data, that is stored and/or calculated in the platform. Figure 2 shows the principle of the integration into the Bauhaus.MobilityLab.
The devices of the lab user can be managed in the asset management module of EMS-EDM PROPHET®. The asset management makes it possible to manage controllable and technical resources. Corresponding parameters such as minimum and maximum output and various time series can be stored for the assets. A quality monitoring function is used to constantly monitor the forecasts made for an asset by comparing the measured value time series with the forecast time series. In this way, appropriate forecast settings can be tried out and optimized.
5.2. Energy Management Services as Microservices
The EMS-EDM PROPHET® system is currently implemented as a tightly coupled software system like most other energy management systems that are currently on the market. To offer the functions shown in the previous chapter to the BML platform, a new architecture concept is necessary. There are various design patterns to convert a tightly coupled application into microservices, as required in the laboratory platform. For example, Behara [20] and Yanaga [21] describe the use of the “strangler pattern”. This pattern is advisable to conceptually divide the existing application into business processes that can be modelled individually. With the help of this pattern, it is possible to gradually develop the microservices until the actual monolithic application has been replaced. Yanaga [21] (p. 8) mentions the “Domain Driven Design” as a method to identify the business processes in the monolith and then to model and implement them as a service. Vernon [22] (p. 110ff) describes the “event storming” process is particularly suitable for this purpose.
With the help of the event storming pattern, we identified the borders and interfaces for the various services that are to be offered in the Bauhaus.MobilityLab platform and that need to be implemented as microservices. As a result, the forecast service, optimization service, time series management, calendar service, weather data service and asset management will be added to the Bauhaus.MobilityLab platform and are available for the lab customers. These Bauhaus.MobilityLab services will then support the shown use case but can also be used within other use cases of different lab customers.
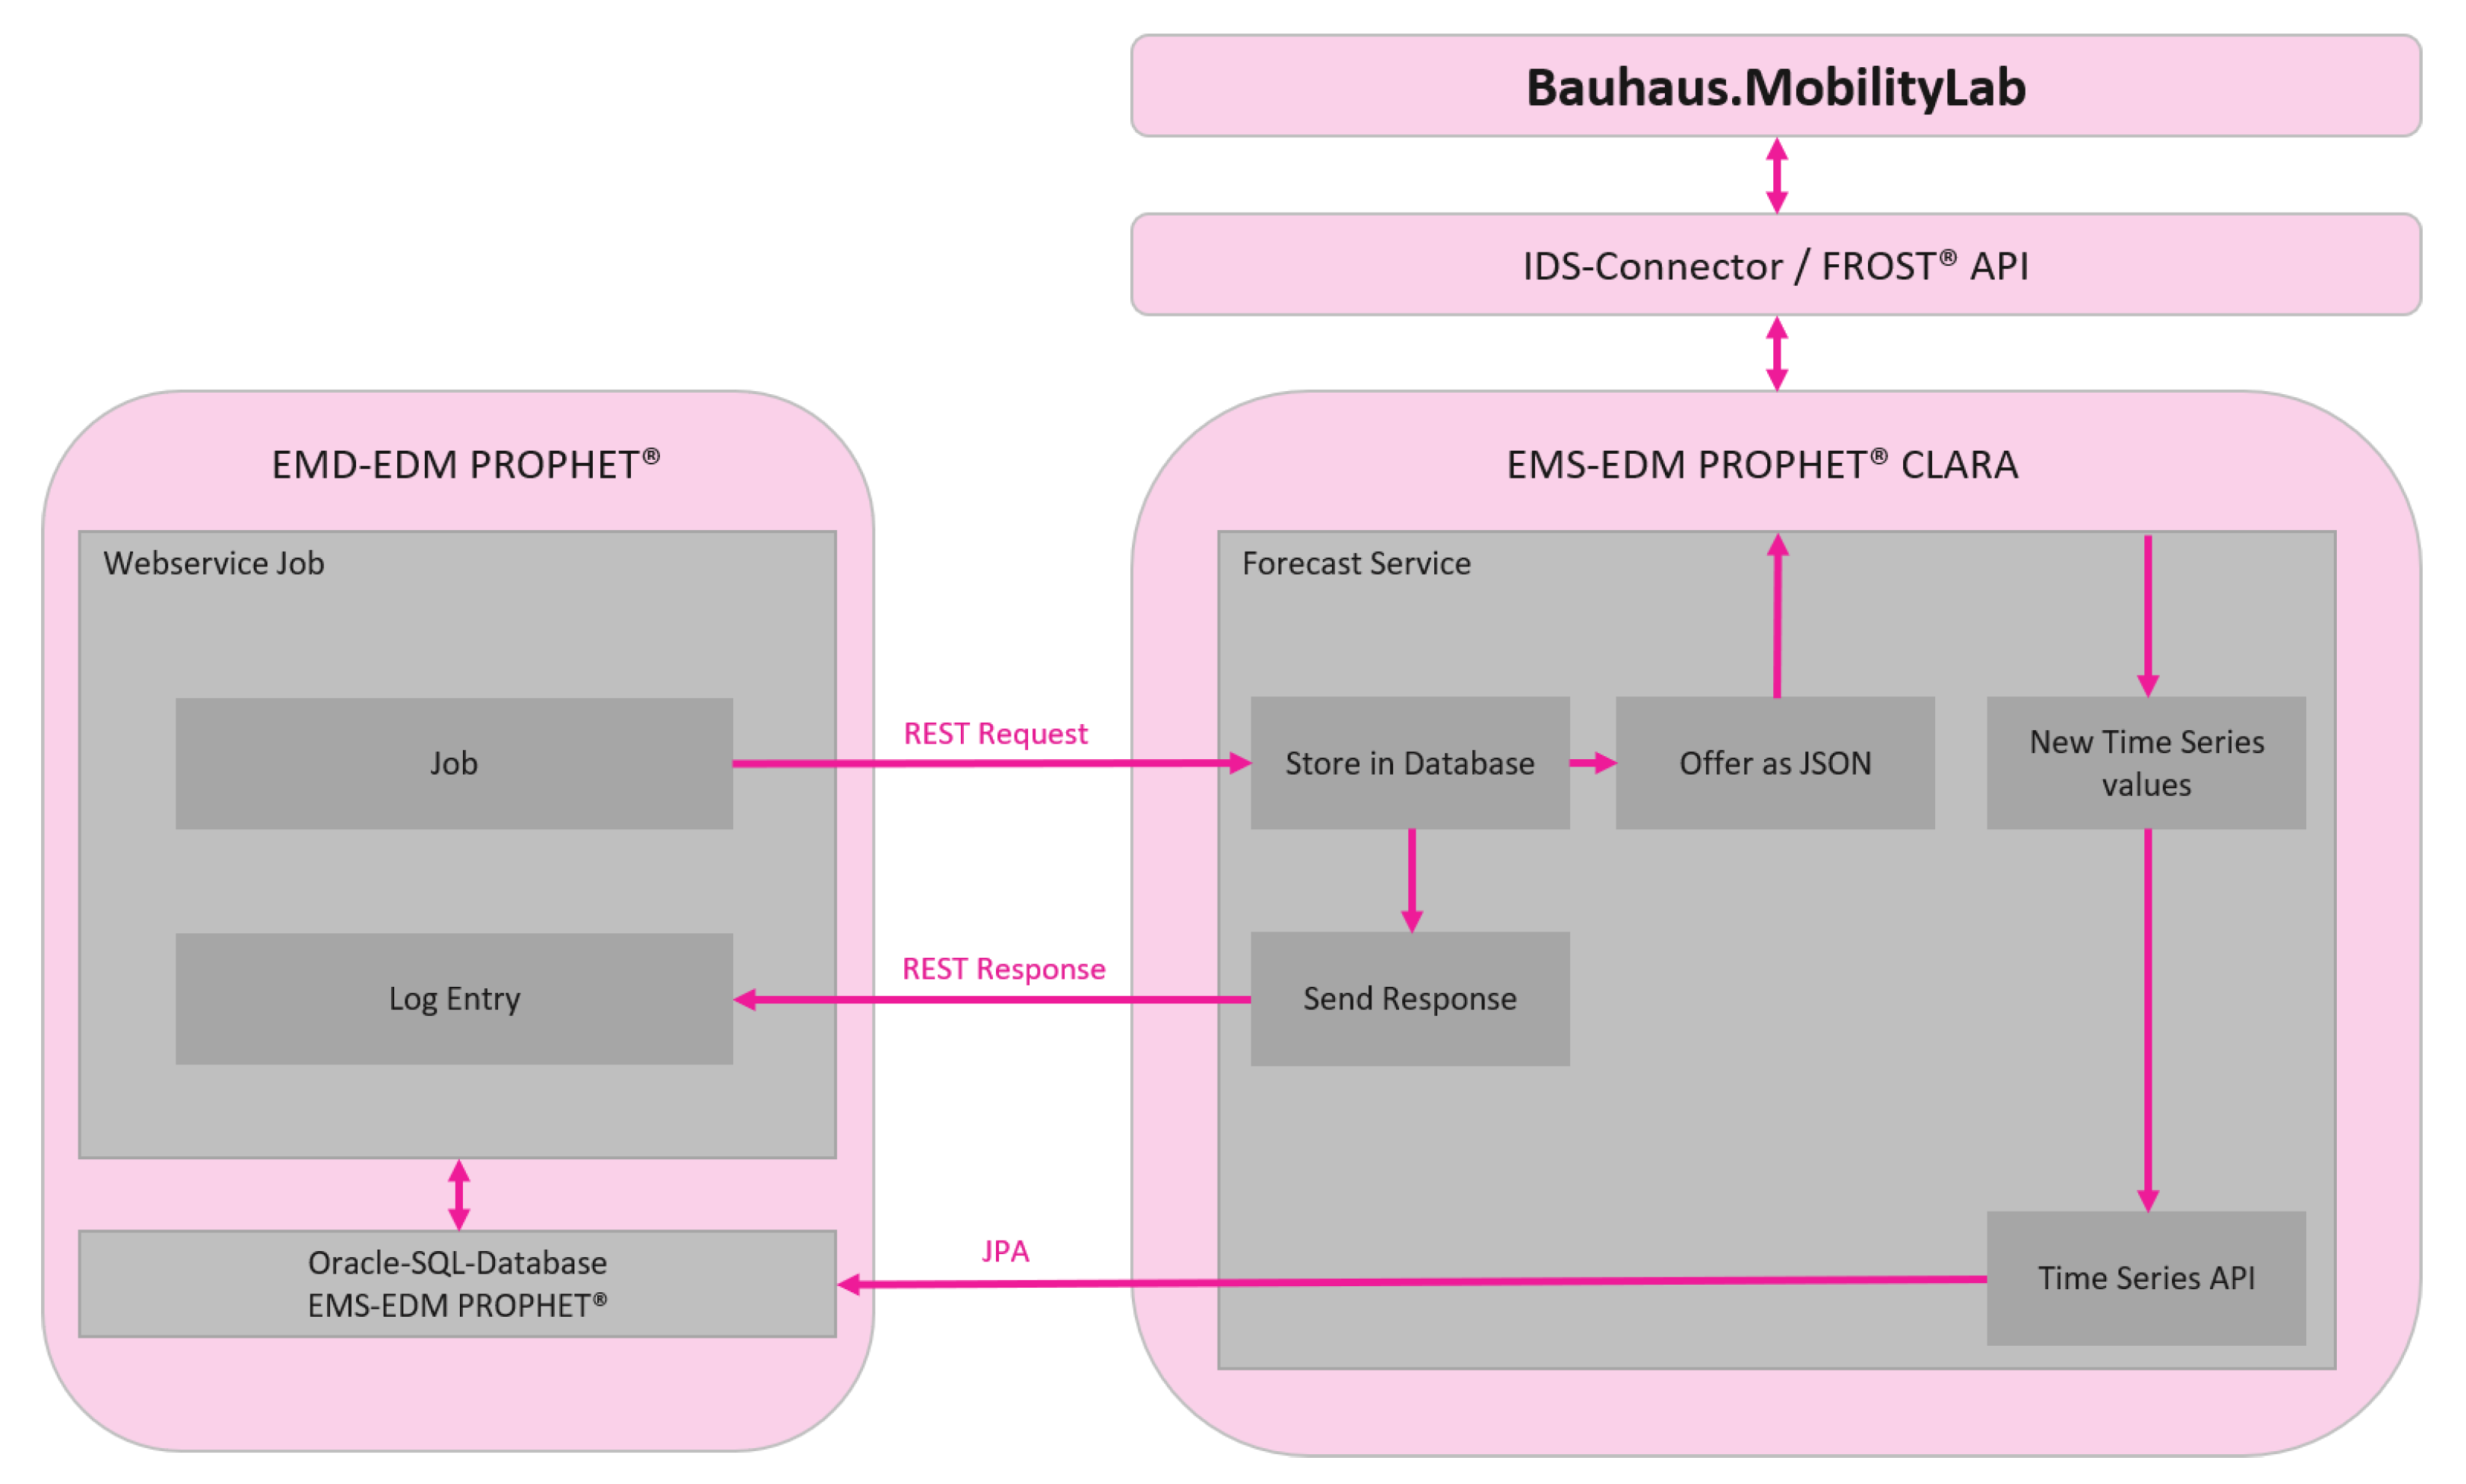
The EMS-EDM PROPHET® system has the option of setting up jobs via a scheduler in order to automatically generate forecasts at certain time intervals. These jobs can preprocess time series, carry out forecasts and use the results in various ways. Based on the scheduler, a new job was developed within the Bauhaus.MobilityLab that enables the time series to be transferred to a microservice via a REST API after executing the forecast. This enables the established forecasting methods and time series management functions from the Fraunhofer Energy Management Platform to be offered to the outside world via a REST interface. To achieve the loose coupling, the web service temporarily stores the data in its own database and then makes it available to external systems.
To provide all data in the laboratory platform in a standardized format, the FROST® server is used to store data in the OGC SensorThings API [12]. The data collected by the municipal utilities on the EMS-EDM PROPHET® and the forecasted time series will then be transferred via a downstream microservice into the FROST® server.
A corresponding API was also created to import the exogenous values for the time series to be forecast into the forecast module. It receives time series data from the outside via a REST interface and saves it via a downstream service in a database. For the most generic possible approach, this database can be the Oracle database or any other DBMS. The FROST® Java API was used to import the data from the Bauhaus.MobilityLab platform, and the associated FROST® server. So, the data were then sent to the corresponding microservice. Figure 3 illustrates the described process.
As can be seen in Figure 3, the forecasts made by the Energy Management system are linked to the laboratory platform through the FROST® server, to which the time series values are transferred. Another method is to query the time series of our own time series API via the IDS connector. The IDS was also connected to the Energy Management System as part of the Bauhaus.MobilityLab, which enables secure and confident, bidirectional data communication. For the next releases of the microservices, it is also planned to trigger actions in our system via the IDS Connector to be able to initiate a forecast from an external service, e.g., from the laboratory platform.
To manage the devices of the laboratory users in the use case described above, it is necessary that these assets are managed in the laboratory platform. The functions of the asset management are already tailored to the energy market and can map corresponding time series, manage forecasts and also calculate the forecast quality. Currently, the exchange of master data and time series values takes place via XML files. To make the connection to the BML platform as generic and effective as possible, these XML data structures are also used for data exchange with the laboratory platform. The interfaces yet to be implemented have to map the JSON data structure originating from the BML platform, to the XML data structures and vice versa. This service will not be discussed any further in this publication.
5.3. AI
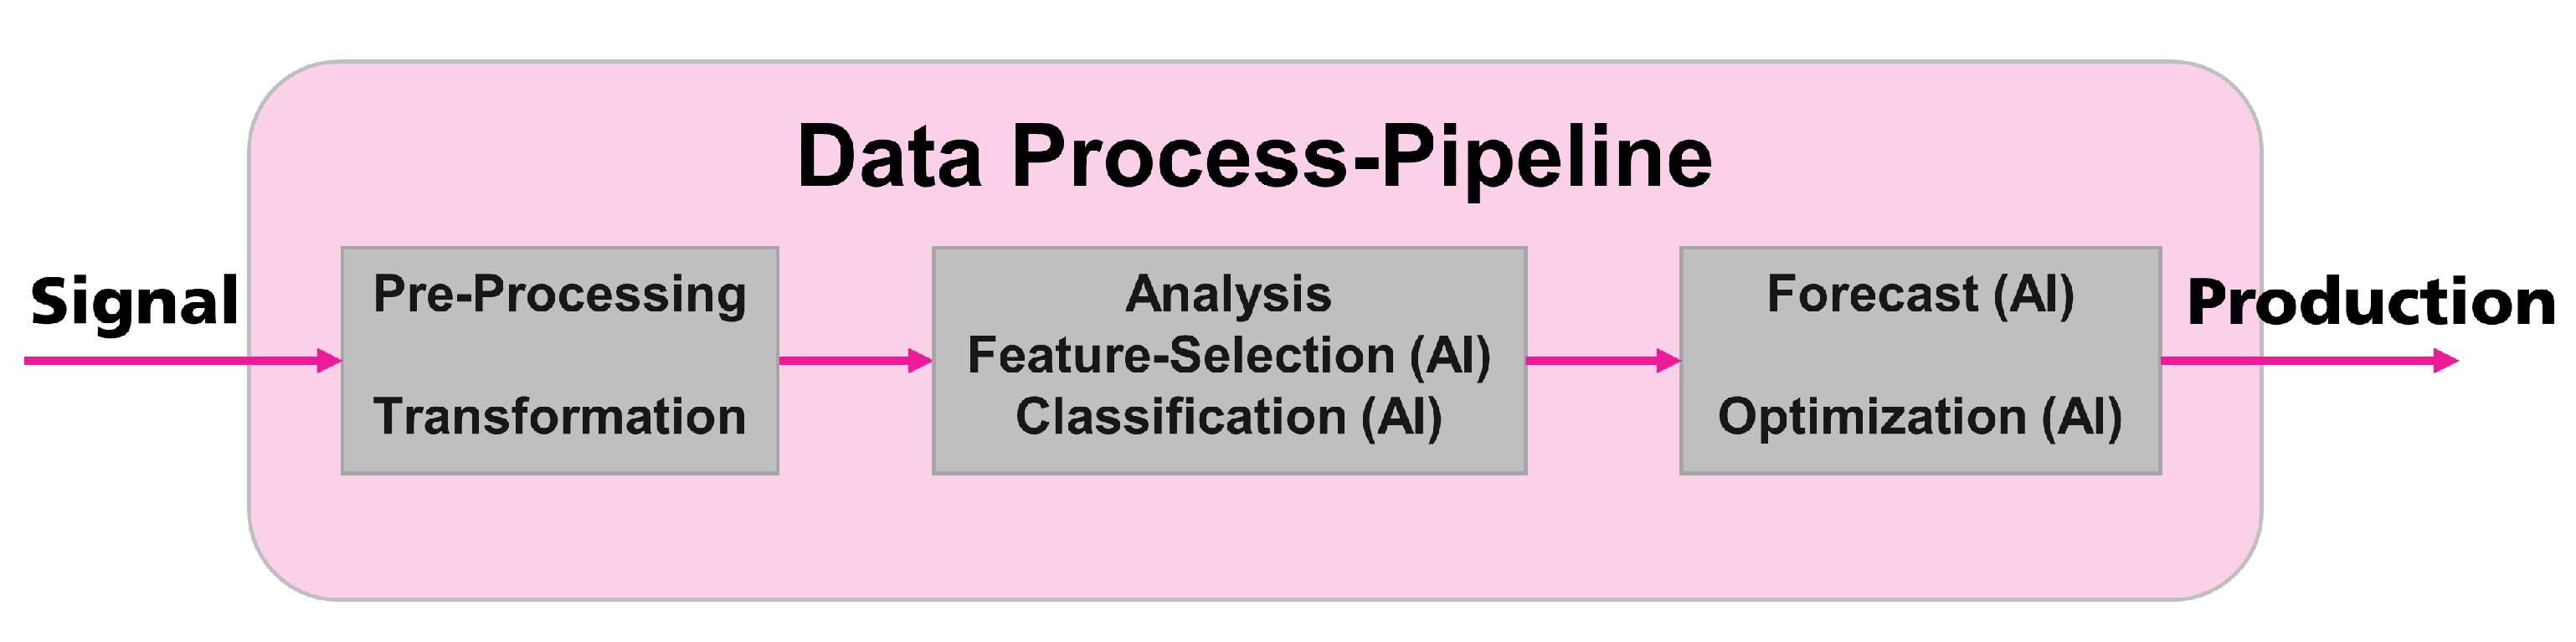
AI is used inside the entire data process-pipeline (Figure 4) of the Bauhaus.MobilityLab platform to solve different data-driven tasks. Starting with pre-processing [23,24,25,26,27,28] and transformations [29], the data are examined for anomalies as well as missing-values and is normalized or standardized for further processes.
The cleaned data-set can then be analyzed on its characteristics like auto-correlation, periodicity and cross-correlation, helping to set up a proper AI model which describes the dependencies between endogenous and exogenous variables. Assuming a very big initial data-set, it becomes very hard to choose these dependent variables. This problem can be solved by various feature-selection algorithms using intelligent approaches [30]. An existing knowledge base including various data-sets and their associated AI models can help to automatize the AI-model choice by using an intelligent classification algorithm that maps similar data-sets to each other [31].
In the next step, the pre-processed data-sets and chosen variables are used inside the AI-models to solve a certain forecast or optimization task. There are classical forecast models like autoregressive (AR), moving average (MA) and their combination. These models can be extended with exogenous variables (X) and with integration in time (I). New forecast algorithms based on different concepts of artificial intelligence are used to model complex and non-linear dependencies between different variables [32].
As the Bauhaus.MobilityLab project considers a small city district, there probably exist significant dependencies between the different participants like residents, offices and shops. Their behaviour can also be triggered by exogenous variables like weather and local events. This circumstance can be modelled by swarm intelligence algorithms [33] to extract the general behaviour. Otherwise, the concept of federated learning helps to learn such a model over different data sources considering data sovereignty of each participant [34].
6. Discussion
As part of this research project, a unique and novel laboratory platform was designed and implemented. The use case shown is currently under development so that it can also be actively used by the lab users at the end of the project and its acceptance can be tested. The AI algorithms mentioned are to be further developed by the end of the project. One focus will be a federated learning approach in connection with smart meters. Based on the IDS integration, further research projects will investigate to what extent such a laboratory platform can benefit from the developments in GAIA-X. A GAIA-X integration of the energy management services shown is being pursued.
Author Contributions
Conceptualization, O.W.; methodology, C.F. and P.H.; software, C.F. and P.H.; validation, C.F., P.H. and L.R.; investigation, C.F., P.H. and O.W.; resources, P.H. and C.F.; data curation, L.R., P.H. and C.F.; writing—original draft preparation, C.F. and P.H.; writing—review and editing, C.F., P.H. and O.W.; visualization, C.F., P.H. and L.R.; supervision, O.W.; project administration, C.F., O.W. and P.H.; funding acquisition, O.W. All authors have read and agreed to the published version of the manuscript.
Funding
This research was funded by the Bundesministerium für Wirtschaft und Energie (BMWi) grant number 01MK20013A.
Data Availability Statement
Data sharing not applicable.
Conflicts of Interest
The authors declare no conflict of interest. The funders had no role in the design of the study; in the collection, analyses, or interpretation of data; in the writing of the manuscript, or in the decision to publish the results.
Abbreviations
The following abbreviations are used in this manuscript:
| BML | Bauhaus.MobilityLab |
| EEX | European Energy Exchange |
| AR | Autoregressive |
| MA | Moving Average |
| OUP | Open Urban Platform |
| IoT | Internet of Things |
| IDS | International Data Space |
| AI | Artificial Intelligence |
References
- Groß, M.; Hoffmann-Riem, H.; Krohn, W. Realexperimente; Transcript Verlag: Bielefeld, Germany, 2005. [Google Scholar] [CrossRef]
- Schneidewind, U. Urbane Reallabore: Ein Blick in die aktuelle Forschungswerkstatt; Wuppertal Institut für Klima, Umwelt, Energie: Wuppertal, Germany, 2014. [Google Scholar]
- Liedtke, C.; Jolanta Welfens, M.; Rohn, H.; Nordmann, J. LIVING LAB: User–driven innovation for sustainability. Int. J. Sustain. High. Educ. 2012, 13, 106–118. [Google Scholar] [CrossRef]
- de Flander, K.; Hahne, U.; Kegler, H.; Lang, D.; Lucas, R.; Schneidewind, U.; Simon, K.H.; Singer-Brodowski, M.; Wanner, M.; Wiek, A. Resilience and Real-life Laboratories as Key Concepts for Urban Transition Research Resilienz und Reallabore als Schlüsselkonzepte urbaner Transformationsforschung. Zwölf Thesen. GAIA-Ecol. Perspect. Sci. Soc. 2014, 23, 284–286. [Google Scholar] [CrossRef]
- BBSR. Raumbeobachtung—Laufende Stadtbeobachtung—Raumabgrenzungen. 29 June 2020. Available online: https://www.bbsr.bund.de/BBSR/DE/forschung/raumbeobachtung/Raumabgrenzungen/deutschland/gemeinden/StadtGemeindetyp/StadtGemeindetyp.html (accessed on 26 October 2021).
- Thüringen, L.E. Erfurt-Brühl—Erfurts neue Mitte, 2021. Available online: https://www.leg-thueringen.de/immobilien/erfurt-bruehl/ (accessed on 26 October 2021).
- DIN SPEC. Referenzarchitekturmodell Offene Urbane Plattform (OUP), German Pre-Norm; Beuth: Berlin, Germany, 2017. [Google Scholar] [CrossRef]
- GitHub-International-Data-Spaces-Association/DataspaceConnector. Available online: https://github.com/International-Data-Spaces-Association/DataspaceConnector (accessed on 26 October 2021).
- Otto, B.; ten Hompel, M.; Wrobel, S. International data spaces. In Digital Transformation; Springer: Berlin/Heidelberg, Germany, 2019; pp. 109–128. [Google Scholar]
- Open Geospatial Consortium. OpenGIS Web Map Service (WMS) Implementation Specification. 2006. Available online: https://www.ogc.org/standards/wms (accessed on 8 November 2021).
- Open Geospatial Consortium. Web Feature Service, 2010. Available online: https://www.ogc.org/standards/wfs (accessed on 28 November 2021).
- Liang, S.; Khalafbeigi, T.; van der Schaaf, H. OGC SensorThings API Part 1: Sensing Version 1.1. 4 August 2021. Available online: https://docs.ogc.org/is/18-088/18-088.html (accessed on 8 November 2021).
- Hertweck, P.; Hellmund, T.; van der Schaaf, H.; Moßgraber, J.; Blume, J.W. Management of Sensor Data with Open Standards. In Proceedings of the 6th ISCRAM Conference, València, Spain, 19–22 May 2019. [Google Scholar]
- dena-Verteilnetzstudie. Ausbau-und Innovationsbedarf der Strom-Verteilnetze in Deutschland Bis 2030; Deutsche Energie-Agentur GmbH (Dena): Berlin, Germany, 2012. [Google Scholar]
- Wirtschaft und Energie, Bundesministerium für. Smart Meter: Intelligente Messsysteme für die Energiewende. Available online: https://www.bmwi.de/Redaktion/DE/Textsammlungen/Energie/smart-meter.html (accessed on 8 November 2021).
- Santiago, P. Variable Stromtarife dank Smart Metern—Discovergy GmbH. Available online: https://discovergy.com/blog/boersenstrompreise-ansicht (accessed on 8 November 2021).
- EEX. EEX Transparency Platform. Available online: https://www.eex-transparency.com/renewables (accessed on 8 November 2021).
- Brandt, M. So Smart Sind Deutschlands Haushalte. 6 July 2021. Available online: https://de.statista.com/infografik/3105/anzahl-der-smart-home-haushalte-in-deutschland/ (accessed on 8 November 2021).
- Fenzl, C. Anbinden der aWATTar hourly API. LoxWiki. Available online: https://www.loxwiki.eu/display/LOX/Anbinden+der+aWATTar+hourly+API (accessed on 8 November 2021).
- Behara, S. Monolith to Microservices Using the Strangler Pattern. 13 September 2018. Available online: https://dzone.com/articles/monolith-to-microservices-using-the-strangler-patt (accessed on 8 November 2021).
- Yanaga, E. Migrating to Microservice Databases: From Relational Monolith to Distributed Data, 1st ed.; O’Reilly Media: Sebastopol, CA, USA, 2017. [Google Scholar]
- Vernon, V. Domain-Driven Design Kompakt, 1st ed.; dpunkt: Heidelberg, Germany, 2017. [Google Scholar]
- Hodge, V.J.; Austin, J. A Survey of Outlier Detection Methodologies. Artif. Intell. Rev. 2004, 22, 85. [Google Scholar] [CrossRef] [Green Version]
- Chen, W.; Zhou, K.; Yang, S.; Wu, C. Data quality of electricity consumption data in a smart grid environment. Ren. Sust. Energy Rev. 2017, 75, 98. [Google Scholar] [CrossRef]
- Sun, L.; Zhou, K.; Zhang, X.; Yang, S. Outlier Data Treatment Methods Toward Smart Grid Applications. IEEE Access 2018, 6, 39849. [Google Scholar] [CrossRef]
- Hawkins, D.M. Identification of Outliers; Springer-Science+Business Media B.V.: Berlin, Germany, 1980. [Google Scholar] [CrossRef]
- Pratama, I.; Permanasari, A.E.; Ardiyanto, I.; Indrayani, R. A review of missing values handling methods on time-series data. In Proceedings of the 2016 International Conference on Information Technology Systems and Innovation (ICITSI), Bandung, Indonesia, 24–27 October 2016; p. 1. [Google Scholar] [CrossRef]
- Grigoras, G.; Cartina, G.; Bobric, E.C.; Barbulescu, C. Missing data treatment of the load profiles in distribution networks. In Proceedings of the 2009 IEEE Bucharest PowerTech, Bucharest, Romania, 28 June–2 July 2009; pp. 1–5. [Google Scholar] [CrossRef]
- Tang, L.; Wang, C.; Wang, S. Energy Time Series Data Analysis based on a Novel Integrated Data Characteristic Testing Approach. Procedia Comput. Sci. 2013, 17, 759–769. [Google Scholar] [CrossRef] [Green Version]
- Miao, J.; Niu, L. A Survey on Feature Selection. Procedia Comput. Sci. 2016, 91, 919–926. [Google Scholar] [CrossRef] [Green Version]
- Fawaz, H.I.; Forestier, G.; Weber, J.; Idoumghar, L.; Muller, P. Deep learning for time series classification: A review. Data Min. Knowl. Discov. 2019, 33, 917–963. [Google Scholar] [CrossRef] [Green Version]
- Lim, B.; Zohren, S. Time-series forecasting with deep learning: A survey. Philos. Trans. R. Soc. A Math. Phys. Eng. Sci. 2021, 379, 20200209. [Google Scholar] [CrossRef] [PubMed]
- Jumani, T.; Mustafa, M.; Alghamdi, A.; Rasid, M.M.; Alamgir, A.; Awan, A. Swarm Intelligence-Based Optimization Techniques for Dynamic Response and Power Quality Enhancement of AC Microgrids: A Comprehensive Review. IEEE Access 2020, 8, 75986–76001. [Google Scholar] [CrossRef]
- Konečný, J.; McMahan, H.B.; Yu, F.X.; Richtárik, P.; Suresh, A.T.; Bacon, D. Federated Learning: Strategies for Improving Communication Efficiency. arXiv 2017, arXiv:1610.05492. [Google Scholar]
Figure 1.
High-level platform architecture.

Figure 2.
Integration of the Fraunhofer Energy Management System in the Bauhaus.MobilityLab.

Figure 3.
Architecture of the forecast service.

Figure 4.
Data process pipeline.

Publisher’s Note: MDPI stays neutral with regard to jurisdictional claims in published maps and institutional affiliations. |
© 2022 by the authors. Licensee MDPI, Basel, Switzerland. This article is an open access article distributed under the terms and conditions of the Creative Commons Attribution (CC BY) license (https://creativecommons.org/licenses/by/4.0/).
Share and Cite
MDPI and ACS Style
Frey, C.; Hertweck, P.; Richter, L.; Warweg, O. Bauhaus.MobilityLab: A Living Lab for the Development and Evaluation of AI-Assisted Services. Smart Cities 2022, 5, 133-145. https://0-doi-org.brum.beds.ac.uk/10.3390/smartcities5010009
AMA Style
Frey C, Hertweck P, Richter L, Warweg O. Bauhaus.MobilityLab: A Living Lab for the Development and Evaluation of AI-Assisted Services. Smart Cities. 2022; 5(1):133-145. https://0-doi-org.brum.beds.ac.uk/10.3390/smartcities5010009
Chicago/Turabian StyleFrey, Carsten, Philipp Hertweck, Lucas Richter, and Oliver Warweg. 2022. "Bauhaus.MobilityLab: A Living Lab for the Development and Evaluation of AI-Assisted Services" Smart Cities 5, no. 1: 133-145. https://0-doi-org.brum.beds.ac.uk/10.3390/smartcities5010009