Outline and Impact of Firms Related to the Third Industrial Revolution: Investigation through Big Data

Anthropo-Lab—ETHICS EA7446, Université Catholique De Lille, 59800 Lille, France
Smart Cities 2022, 5(2), 522-538; https://0-doi-org.brum.beds.ac.uk/10.3390/smartcities5020028
Submission received: 16 February 2022
/
Revised: 28 March 2022
/
Accepted: 1 April 2022
/
Published: 9 April 2022
(This article belongs to the Special Issue Economy and Finance in Smart-Cities)
Abstract
:This article is focusing on the dynamism of the Third Industrial Revolution (TIR) in the region Hauts-de-France between 2013 and 2018. Region Hauts-de-France has been a forerunner in setting up a proactive policy in favour of the TIR. It provides a relevant and suitable context for the identification of TIR activities. We assess the job dynamism of the TIR through the implementation of big data methods for the identification of the firms involved in the TIR activities and the collection of firm microlevel data. We provide evidence of the strong dynamism of the TIR activities in a context of weak regional dynamics. We show that the growth in employment arises mainly from renewable energies, positive energy buildings, circular economy and energy efficiency. Future researches are encouraged to investigate the quality of employment and to question the distinctive characteristics of the firms involved in TIR.
1. Introduction
Employment growth, or more generally value creation, derived from activities related to the TIR is a sine qua non condition for its strong sustainability. Besides, sustained economic growth and the creation of decent jobs for all make one of the key Sustainable Development Goals (SDG) set out in the United Nations 2030 Agenda for Sustainable Development. In the short term, demonstrating that activities related to the TIR contribute to creating jobs will lead to societal acceptance of the destruction involved in substituting carbon-based technologies, and will foster the investment of innovative firms in these sectors [1]. It is considered by some authors as an effective strategy to revitalise the economy of developed countries and it materialises strong expectations from public policymakers [2,3,4,5,6,7]. Insofar as the shift toward TRI inevitably comes with job destructions as activities that emit carbon disappear, the question of whether the TIR can lead to net job creation is non-trivial [8]. Despite the importance of job creation related to the TIR, there is some debate about the assessment of its positive impact on net growth in employment. Ref. [8] (Table 1, p. 759) report that empirical studies are not unanimous. Although a majority of studies show positive effects [9,10,11,12,13], others show either a negative [14] or absence of [15] effect on growth in employment. However, recent empirical literature has highlighted more positive effects [2,8]. It should be noted that these studies concern the green economy, which scope goes beyond that of the TIR.
Surprisingly, France has very hardly been studied. Most fall under grey literature and originate from public organisations charged with the transition [16,17,18,19] (pp. 21–22 and pp. 81–82). Their results are oftentimes extremely optimistic and based on strong assumptions, such as that of full sectorial and geographical mobility of workers [4,20]. These assumptions, even though they hold little realism, are essential to overcome the difficulty of identifying green organisations and jobs, owing to the mismatch between existing sectoral benchmarks and sustainable activities definitions. The difficulty of identification results from the technophile definition of TIR activities, which does not easily adapt to existing sectoral codifications [21]. Furthermore, these studies are very rarely specific to the TIR activities. Our methodological approach partially solves this issue in combining big data and legal expertise with a view to gradually identified the firms involved in the TIR activities. From the data collected with businesses, we estimate job creation in a similar fashion as INSEE (Institut National de la Statistique et des Etudes Economiques is the French national office of statistics.) and use the end-sizing method to simplify the comparison of our results with local and national censuses. As [3] advocate, we gradually refined the list of firms from a broad census to those with a core business related to the TIR. From the methodology employed in our research, a precise census of firms involved in the TIR has emerged. This facilitates the way their evolution is to be monitored, the way in which their transition is better supported, and the assessment of its economic performance. It is also still important to better estimate the number of green jobs on the territory to foster the implementation of efficient local strategies—for instance, to adapt regional policies and plans regarding skills [22] (p. 1056). The originality of our paper also lies in our focus on the dynamics of employment growth in firms based on their level of involvement in the TIR fields. To our knowledge, no previous research has led to the microeconomic evaluation of the positive impact of TIR activities on the evolution of job opportunities in France.
Our results confirm that firms focused on TIR saw their dynamics increase between 2013 and 2018 with an average employment growth rate of +17.38 percent in a context of weak regional dynamism (+1.34 percent). This trend is amplified for the firms strongly focused on transitioning with an increase of +21.09 percent. Our analyses are broken down by field of activity and show that the growth is mainly supported by the transition to renewable energies, the development of positive energy buildings and circular economy. Firms focused on the fields of production of energy storage systems, energy internet and function-based product-service systems are harder to identify either because they are at an embryonic stage, or because of the lack of information to qualify their business model (e.g., function-based product-service systems). Finally, the analysis of the situation in the five districts shows that the development of TIR in the Hauts-de-France is homogenous insomuch as no regional specificities can be noticed regarding the various fields. We present the literature review and the research context in Section 2 and Section 3, respectively. In Section 4, we explain the methodological approach used to identify firms involved in the TIR activities. Section 5 shows and discusses the regional and national findings, as well as findings for each field. Section 6 discusses the contribution of our method but also its limitations and avenues for future research.
2. Literature Review
The fight against climate change and the transition to a sustainable economy require actions from regions and countries, and international cooperation [6,7,23]. In this perspective, the European Commission is implementing its Green Deal policy with the help of the public authorities and local private actors to come to carbon neutrality by 2050 and to the creation of sustainable economic growth and subsequent job creation. The interest of policy makers for the TIR is enhanced by the fact that the related jobs are expected to be higher skilled [24,25] and not easily relocated [26]. As the growth and composition of employment related to the TIR is intrinsically intertwined with the policy makers’ investment, innovation and normalization strategies in green economy [2,8,27,28] probing how the TIR can be a driver of growth and job creation is thus crucial to provide the public policymaker with guidance for these actions.
Numerous studies have supported the idea of positive dynamics that the TIR—and green economy more largely—has on job opportunities in several political and technological contexts. Reference [12] show that the transition towards a zero-carbon energy production in China resulted in 472,000 net jobs gains. Reference [2] assert that the Scottish policy in favour of green economy led to an increase of more than 72,000 jobs between 2011 and 2014. Following [8,21] report that policies in favour of green economy boost innovation and employment in the EU, the US and Japan. In the same geographical area [29,30] the development of wind power technology has fostered job creation. Conversely, older studies cautiously point to some neutral or negative effects [14,15,31,32].
Even though most of the recent contributions state that the TIR related activities are prone to growth in employment, it is of importance to note that differences in metrics, methods and contexts limit the generalization of the results. First, the estimation of the growth in employment related to the TIR depends on the scope: direct, indirect or induced employment. Direct employment refers to jobs observed in organization in targeted industries, indirect employment concerns subsequent jobs resulting from changing in the targeted industries/organisations and induced employment results from the jobs generated by the activity of both direct and indirect jobs [12]. Secondly, the range of TRI jobs may differ. As in green economy, some authors adopt a purist approach considering the jobs that restoring or preserving environment, while others refer to broader definitions including wider impacts [2,33]. Thirdly, the technological context of implementation of TIR activities and its interaction with regional/national policies is inherently linked with the growth of jobs [2,34,35]. Given the context, the proportion of employment related to conversion, to new or emerging fields or greening of existing skills may differ and may have different impacts on the indirect or induced jobs.
Regarding the specificity of the French technological context—characterized by small renewable but strong nuclear attachments resulting in low carbon emission in energy production [36,37] (France reaches the highest proportion of electricity production from nuclear sources in the world with 77.63%, while it is ranked 60th for the production from the renewable energies excluding hydroelectricity account for 6.2% (Source: WorldBank).)—France provides a relevant context for the analysis of the development of TIR activities. Whereas many contributions focus on the growth associated with the transition in the field of production of energy, the importance of nuclear power plants limit growth potential and implies to consider other aspects of the TIR. Furthermore, France invested of 3.5 € billions between 2013 and 2017 for the transition in the perspective of the creation of 470,000 jobs. Surprisingly, the French dynamic of the TIR has remained relatively unexplored. Most of the analysis of the dynamism of the French job market related to the TIR fall under grey literature and are released organisations in charge of the transition [16,17,18,19] (pp. 21–22 and pp. 81–82). Then, the results must be cautiously considered. As ([4], p. 24 in [2]) note Uncritical acceptance of optimistic estimates of green job growth is especially ill-advised, given that these are typically produced by organizations and groups with a “vested interest in the outcomes”. Besides, results of these studies are generally extremely optimistic and based on strong assumptions, such as that of full sectorial and geographical mobility of workers [4,20]. The PPEC (“Plan de programmation des emplois et des compétences”) report on the jobs and skills programming plan (PPEC, 2018 pp. 21–22 and pp.81–82) lists 22 studies published between 2010 and 2017. With the exception of the National Treasury (Direction Générale du Trésor) (2010), they all underline the jobs creations. This lack of research arises mainly from the difficulty of identifying firms involved in the TIR activities. Contrasting with Scotland or the US, France did not adopt O*NET classification of green occupations and as the [20] confirms: “it is proven impossible to identify jobs related to energy transition by mining directly from official classifications based on PCS (jobs and socio-professional categories) or ROME (Operational Directory of Occupations and Jobs), respectively used by INSEE and Pôle Emploi, the French employment agency. The classification of “Familles Professionnelles” (FAP) (professional “families” or groups), built by DARES to bridge the gap between PCS and ROME, is equally unhelpful”. Hence, the investigation of the TIR dynamism in France requires to produce ad-hoc identification criteria. We contribute to the literature on the impact of TIR activities on economic development by both focusing on the specific context of Hauts-de-France and proposing a general method of identification of businesses related to TIR activities.
3. Context of the Research: The Voluntarist Policy of Hauts-De-France Region
We apply the method of identification of TIR-related businesses in Hauts-de-France, that is ranked 12th among 13 regions in terms of GDP per capital, but 5th in number of inhabitants. Hauts-de-France is the second poorest French region and TIR has been involved in development of entrepreneurship and innovation programs to promote economic growth. Hauts-de-France has been a forerunner in setting up a proactive policy in favour of the TIR. The region, inspired by [38]’s vision, was committed to revitalisation to pursue its industry conversion by favouring “technological and social biodiversity”. The objective of the TIR project, launched in 2013 and renamed rev3 in 2015, is to help the transition of economic actors through its support to public, private and citizens’ initiatives. The various projects aim to promote connected cities and regions, smart transport, renewable energies, circular economy, the creation of social capital and education to the challenges this societal transformation. This policy translates in the support to and promotion of 5 strategic fields, called “pillars”: transitioning to renewable energies, such as wind, solar, geothermal or hydro, developing positive energy buildings, producing energy storage systems, deploying an energy internet and sustainable mobility of people and goods. In addition to these fields, business models are being strengthened: circular economy, function-based product-service systems and energy efficiency [39]. This policy relies also on financial supports to the actor of the TIR and is the most intense in France. For instance, the Region has invested 650 million euros in TIR activities in 2021 to accelerate their development.
Focusing on this regional scale is also relevant with regards to the significance of the role of the territory in the development of sustainable economy [40,41,42,43,44,45], particularly regarding sustainable mobility of people and goods [46], function-based product-service systems [47] and circular economy [48]. Indeed, their developments rely on the cooperation between a sector or a market’s stakeholders and on the intervention of a third party, particularly local public authorities [45].
4. Materials and Methods
The methodological approach relies on massive data collection in order to establish distinctive characteristics of the firms involved in the TIR. The data collection is then recursive and iterative. The data generating process encompasses 3 stages. The first stage aims at delimiting the set of firms involved in the TIR activities. We combine internet webscraping and text-mining on data bases of the Regional Council Hauts-de-France in order to capture these specific firms in a large and non-discriminatory sample. The second stage focuses on the collection of legal information from the firms related to the TIR. This information is the input of the third stage. This latter stage focuses on the estimation of the yearly employment of the firms selected to assess the regional trend of the TIR. The interest of this approach relies on the traceability of the firms, since a detailed list of business units results from the data collection. By contrast with macroeconomic and sectorial simulations, our approach is more prudential because it focuses only on the direct and observable employment. Indirect and induced employment are excluded.
4.1. Stage 1: Limiting the Set of TIR Activities and Identification of the Firms
Most of the data results from internet webscraping and text mining on Regional Council data bases. We also survey professional associations and business clusters to obtain firms lists for each TIR activity. The method of webscraping consists in massive data collection from the internet. Our purpose is to collect specific lists of firms involved in TIR activities in Hauts-de-France. We collect data from 53 sources ranked and categorized given their TIR activity and their relevance (cf. Appendix A-Table A1). The sources are selected with the support of the Mission rev3, the Regional Department of TIR, the Chamber of Commerce and Industry, Ademe, Hauts-de-France Innovation Development and the “Chaire des Explorateurs de la Transition”. We surveyed 40,788 observations including 5546 strongly specialized in TIR activities.
Thanks to the support of the Centre d’Etude d’Aide à la Décision (CEAD) de Hauts-de-France Innovation Développement (HDFID), we perform identification of the firms based on text-mining on the firms’ descriptions in the Applications et Services de Travail en Réseau pour l’Innovation et le Développement Economique (ASTRIDE) data base. We select the keywords listed in Appendix A-Table A2 in collaboration with the stakeholders involved in the selection of the sources for the webscraping data collection, Fonds Régional d’Amplification de la Troisième Révolution Industrielle (FRATRI) 2020 and Ademe services. As with the webscraping approach, the interest of the text-mining is to identify and propose criteria for the classification of the firms in TIR activities. We have collected 8803 firms on ASTRIDE including 4723 strongly specialized in the TIR.
4.2. Stage 2: Collection of Legal Information
Legal information is required to obtain the number of employees and the financial statements of the firms in financial data bases Diane+ Bureau Van Dijk. At the end of the first stage, 10,159 firms (20 percent of the sample) are not documented. We perform automatic requests on [49,50,51]. Requests are based on the name of the firms and additional information such as city, phone number and national industry sector classification. At the end of this second stage, 5709 observations over the 49,591, that is to say 11.51 percent of the sample, remain without legal information and cannot be included in the third stage. Nonetheless, it is likely that many of them already taken into account since 34.51 percent of the observations have multiple occurrences. These multiple occurrences in the selected sources are a desirable outcome insofar as it informs on the exhaustiveness of the sample and the strength of the link of the firm with the TIR activities. Since Diane+ provides information on the parent business units of the firm, the number of observations increases to 152,351, but results are only analysed for the “mother house” for which the information is the most complete.
4.3. Stage 3: Data Collection and Estimation of Employment
Two kinds of data are downloaded from the financial databases Diane+ and Astrée provided by Bureau van Dijk: data on the number of employees and standardized accounting statements from 2013 to 2018. When the number of employees is not available, we refer to OLS estimates. We predict the number of employees of the firm with the following regressors: the (i) total salaries in euros and the related (ii) benefits paid by the firm. (iii) The total value of assets reflects the size of the firm likely to modify the distribution of the wages. The (iv) industry sector and (v) period fixed effects are captured by categorical variables. Estimations are performed over 28,309 observations for which the number of employees is documented. We infer the predicted number of employees with accounting data for the rest of the sample. Following INSEE analyses, we assess the average growth in employment relative to 2013 with the end-sizing approach after controlling for modification in the structure of the sample [52]. Results are classified given the TIR activities, the department and for the samples of large and specialized firms.
5. Results
5.1. Employment Growth Related to the TIR in Hauts-De-France
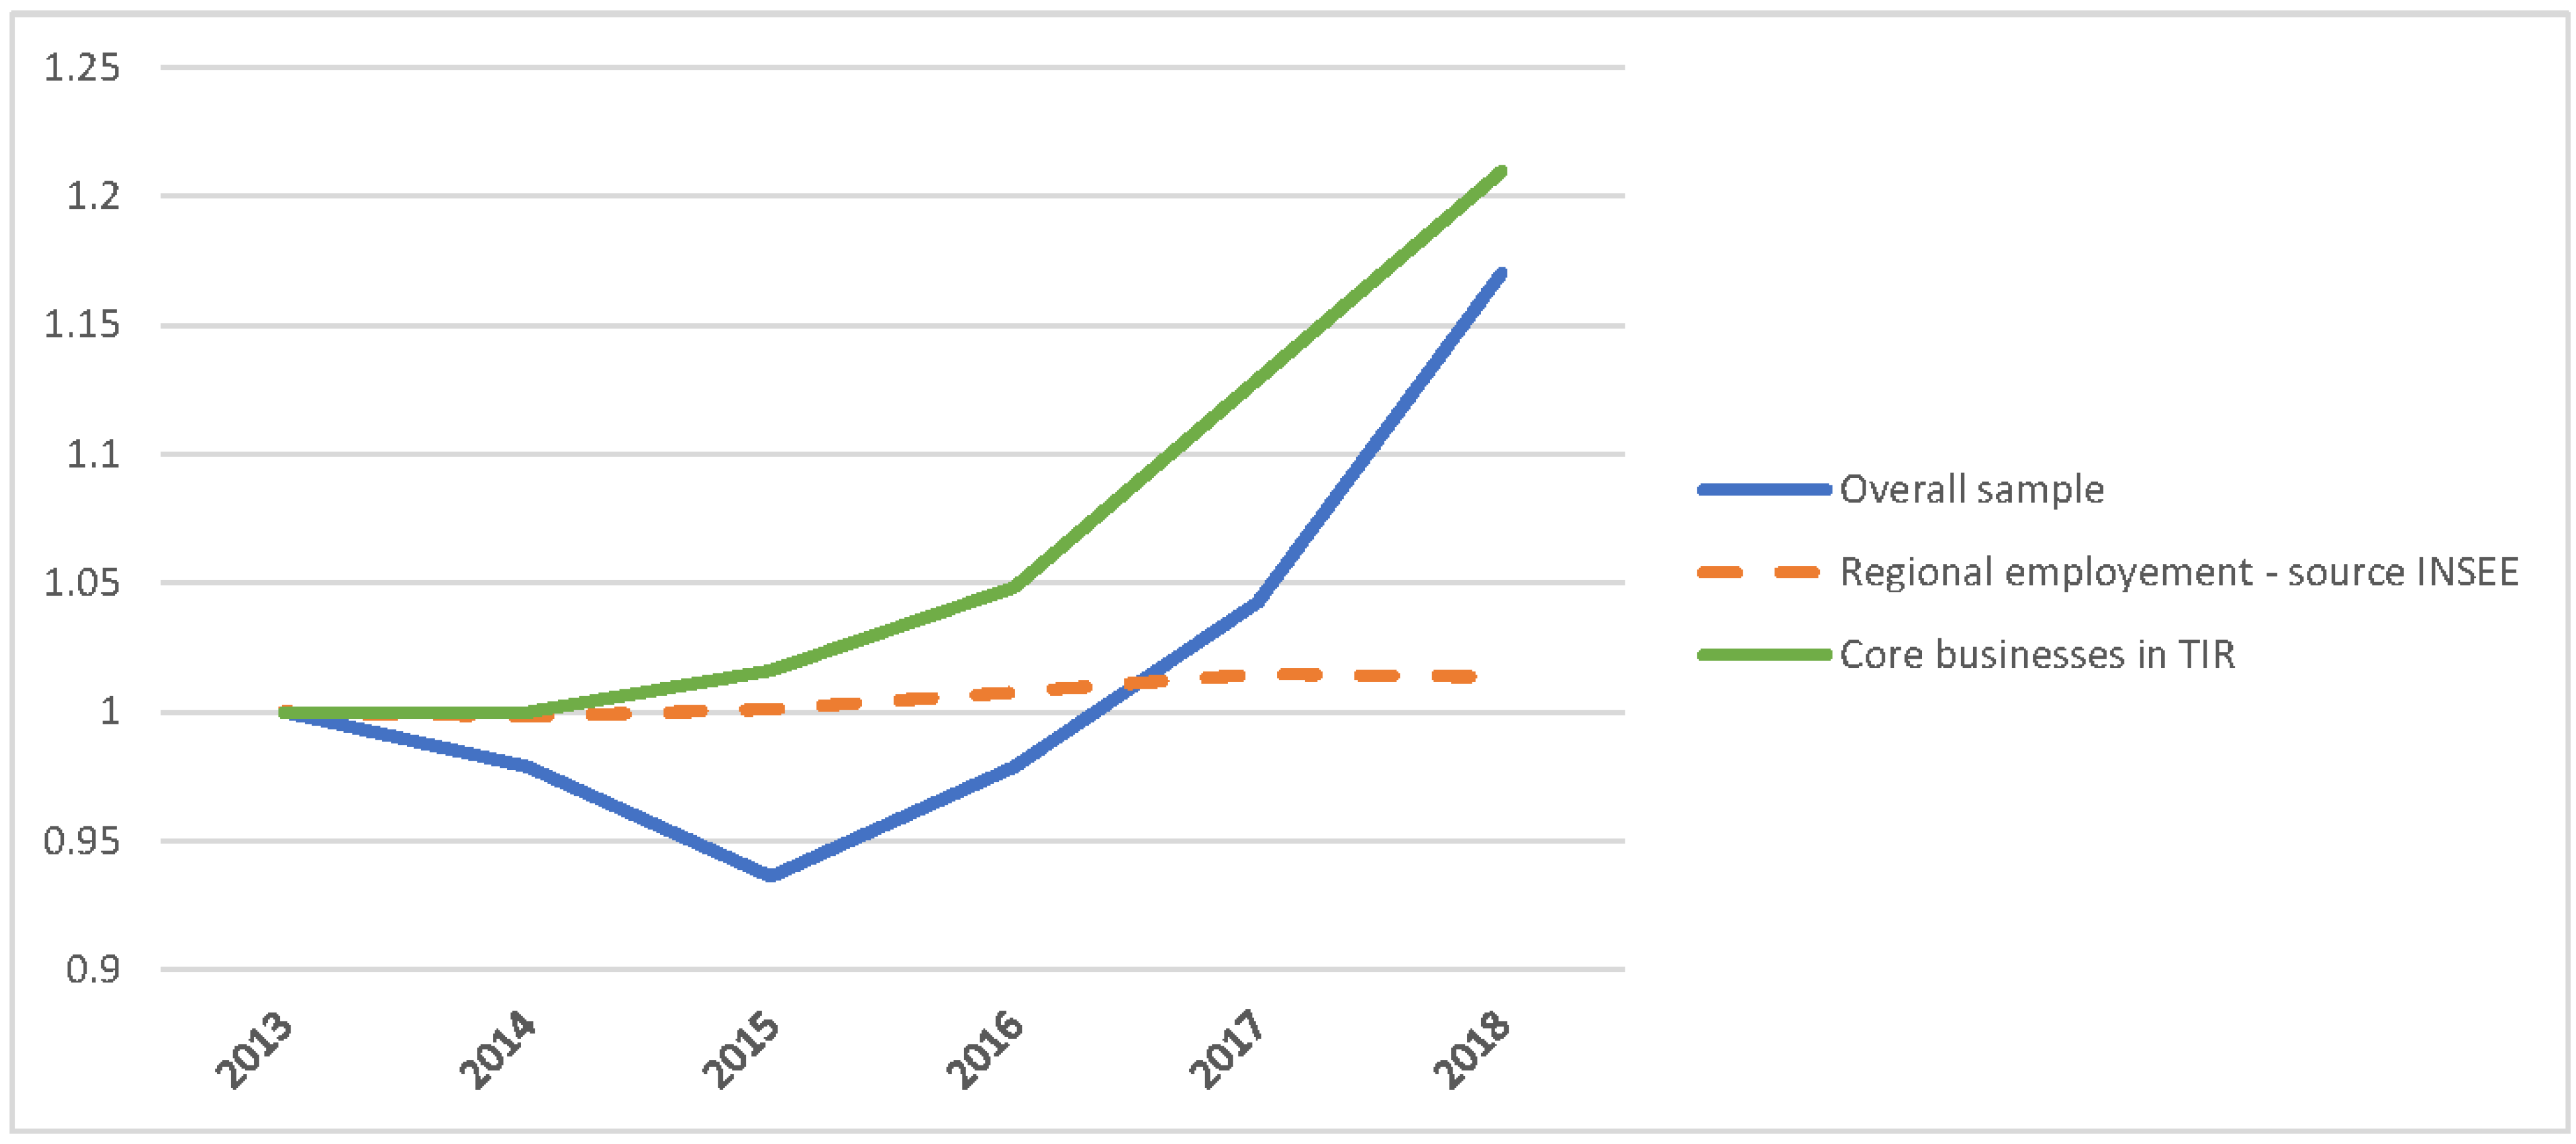
Figure 1 shows the evolution of employment growth in Hauts-de-France in index with fixed base 2013 adjusted to sample attrition. The green and blue lines respectively reflect the evolution of employment in firms with a core business related to the TIR and in our overall sample. These values should be seen in the context of the general employment situation in Hauts-de-France over the same period, shown in the orange dashed line. We find that firms involved in the TIR strongly favour employment dynamics; this result is even more acute for firms with a core business related to the TIR. It is noteworthy that the slowdown observed between 2013 and 2015 in the overall sample can be attributed to the decline in the building and construction industries. As we can observe, employment raised from 2016 partly due to the change in the sample composition. Despite this end-of-period overestimation inherent to this approach, it is worth reminding that our estimation of employment growth is prudential, as only direct job creation is included. Direct employment in firms who did not file their accounts, indirect employment and induced employment are excluded.
Table 1 shows the evolution of employment growth in firms with a core business related to the TIR and in our overall sample in volume and percent variation compared to the regional situation. We can observe a creation of +26,783 jobs in Hauts-de-France between 2013 and 2018, i.e., a growth of 1.34 percent for all sectors combined. Over the same period, organisations related to the TIR seems to have provided for up to 52,173 new jobs, of which 27,838 were created by firms strongly focused on the TIR activities.
5.2. Dynamics by Pillar and across Districts
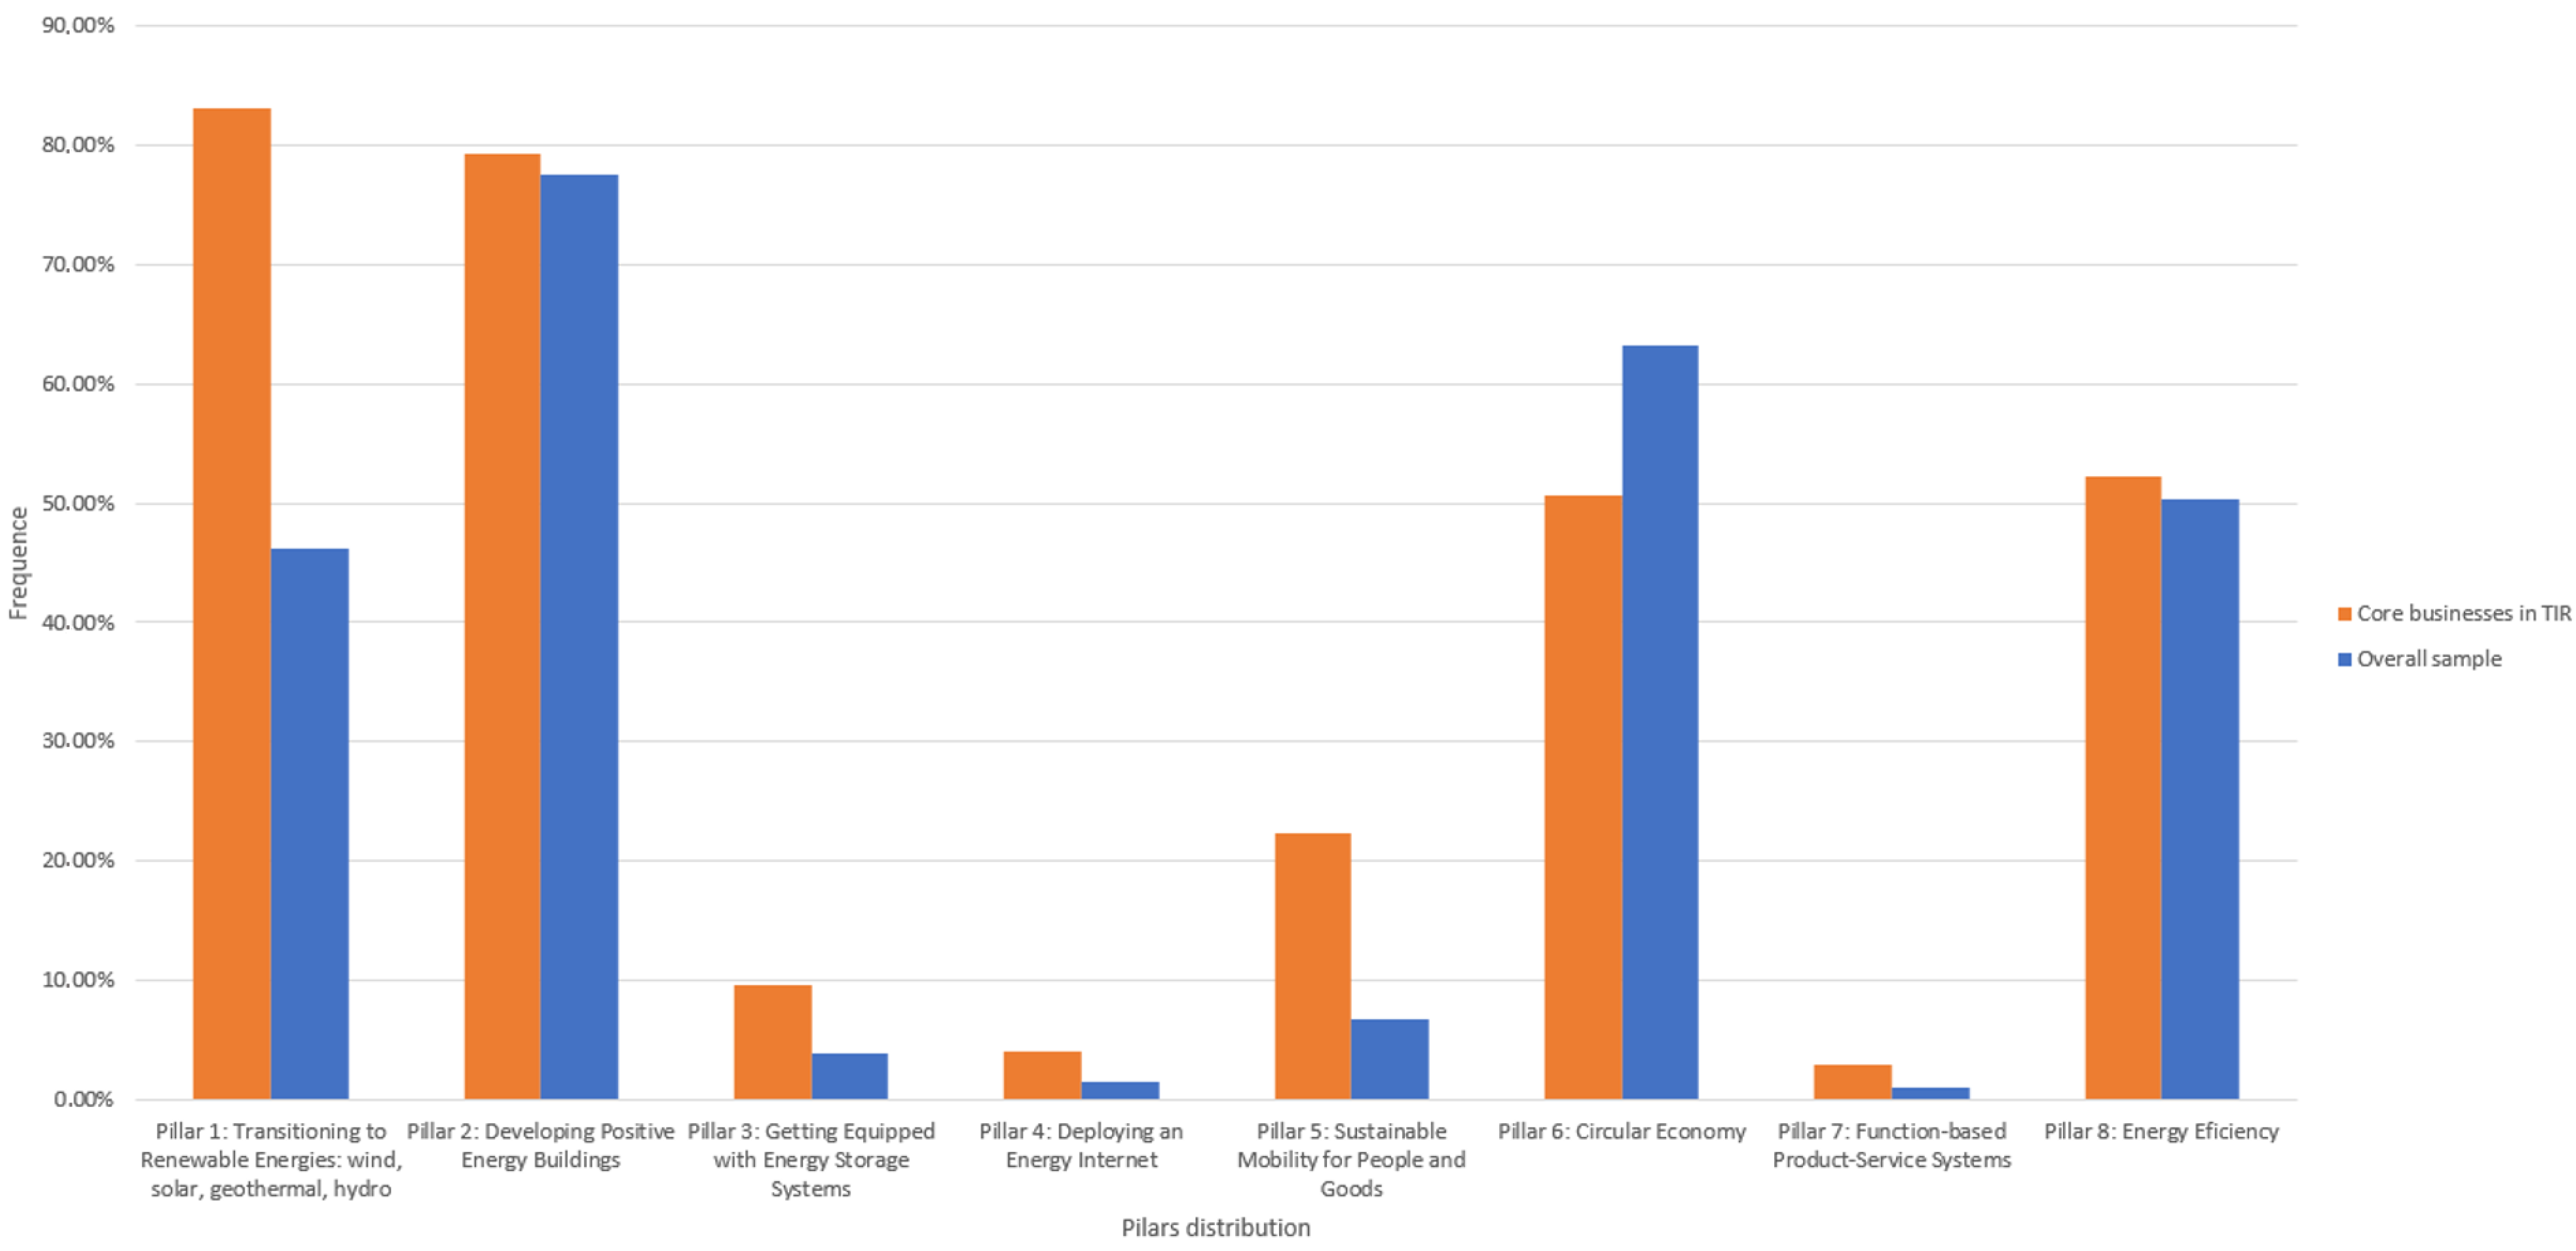
In Table 2, we present the distribution of firms by pillar and districts. The distribution of pillars is illustrated in Figure 2 and Table 3. The distribution of pillars across districts is homogenous. Data collected with our census is in line with the business demographics complied by the INSEE over the same period. Nord concentrates 42 percent of businesses, Pas-de-Calais 23.8 percent, Oise 13.4 percent, Somme 11 percent and Aisne 9.9 percent. The firms listed fall for the most part into the strategic fields of the transition to renewable energies and the development of positive energy buildings that respectively account for 17.9 percent and 29.36 percent of firms listed. Table 4 shows that, on average, Pillar 1 firms are active in 2825 pillars and that only 2.59 percent of them are exclusively focused on Pillar 1 activities. It is surprising that 69 percent of Pillar 1 firms are also active in Pillar 2 activities, which indicates that these technologies are interrelated. A third of these firms are also active in Pillars 6 and 8. Pillars 1 and 5 are also better represented in the sample of specialised firms than in the overall sample.
The cross-sectoral fields that are defined as economic models in rev3 benchmark rate similarly well. Businesses involved in circular economy account for 26.15 percent of the companies listed and the field of energy efficiency accounts for 18.96 percent of the sample. The other fields are conversely largely under-represented, either because they are at an embryonic stage, as for the deployment of an energy internet, or because of the difficulty of identifying which businesses develop operations in some branches of activity, particularly function-based product-service systems.
5.2.1. Analysis of the Dynamics for Each Pillar
For each pillar, employment growth is derived in terms of volume over 2013 to 2018 and in terms of initial job quantity in 2013. Table 4 shows that employment dynamics differ from one pillar to the next. Activities related to transitioning to renewable energies (Pillar 1) and to developing positive energy buildings (Pillar 2) are largely represented in the sample. They generated a creation of +16.48 percent and +7.29 percent jobs respectively. Fields that are under-represented, and particularly “getting equipped with energy storage systems” (Pillar 3), are also growing strongly (+8.66 percent). Pillar 5 (sustainable mobility for people and goods) shows a similar growth rate but is abnormally under-represented with regards to the importance of the transportation industry in Hauts-de-France [54]. This under-representation results from the difficulty of identifying sustainable businesses in the transportation industry. Among the cross-sectoral pillars, circular economy (Pillar 6) and energy efficiency (Pillar 8) are particularly dynamic with growth rates of 11.30 percent and 2.86 percent observed in the overall sample. However, these dynamics are stronger for companies with a core business directly related to the TIR. In that regard, energy efficiency (Pillar 8) is marked by a growth rate of 16.38 percent. The trend showed for companies with a core business related to the TIR is twice as strong as for the overall sample in the fields linked to Pillars 2, 6 and 8.
5.2.2. Analysis of the Dynamics across Districts
In Table 5, we reported employment dynamics related to the TIR across districts. Regarding job creation, Nord and Pas-de-Calais display stronger dynamics than the South of the region, because of their initial job quantity in 2013 and of the scale of their growth rates.
We can observe that information related to firms in Somme lacks sufficient data to provide reliable identification of job opportunities in this district. This lack results from voluntary failure from firms to disclose information. The ASTRIDE data base of the Regional Council Hauts-de-France, devoted only to firms located in the former Nord-Pas de Calais territory until 2018, also reports a small number of firms for this district.
6. Discussion
The purpose of this article is to report on job creation generated by the TIR in Hauts-de-France. Our methodological approach enables the listing of firms related to the TIR in view of their analysis. To our knowledge, no previous research has examined the employment dynamics linked to the TIR through microeconomic modelling. We estimate net first job creation linked to the TIR from 2013 to 2018 at +52,173 for a growth of +17.38 percent, while the region counted a mere +26,783 jobs created for a growth of +1.34 percent. The proportion of TIR-related employment in Hauts-de-France would amount to 6.7 percent, i.e., 159,000 jobs. We can observe that this positive trend is stronger for firms classified as “specialised firms”, i.e., as having a core business related to the TIR, with a growth rate of +21.09 percent or 0.805 job created per business per year. The ANOVA test confirms the difference between the two groups (F-value = 2.295 **; p-value= 0.0076). This result confirms the link between the development of the TIR and job creation established by academic [8,12,21,29,30] and grey literature [16,17,55].
The study of the dynamics by pillar shows that this strong growth is essentially supported by the transition to renewable energies, the development of positive energy buildings, circular economy and energy efficiency. The dynamism of the field of renewable energy is materialized also by the change in energetic mix. The production of renewable energy was 21.2% in 2019 whereas it was 4.2% in 2013. It substituted partly nuclear production which drop from 80% to 60% in the same period (See [56]). This suggests that these job concerns the emergence of new skills [33]. In the field of circular economy, there is a particularly significant difference between specialized firms (+16.39 percent) and the overall sample (+2.86 percent). Only firms focused on the fields of energy internet and function-based product-service systems register job destruction. However, these fields are ill-represented in our sample. Surprisingly, the field of sustainable mobility is also under-represented, as Hauts-de-France is considered the third leading region for logistics in France [54]. The main difficulty lies in the absence of criteria differentiating sustainable logistics companies from traditional ones. Examining the distinguishing features of firms involved in sustainable mobility is required to better target censuses, as, following [57], representations of sustainability remain absent or fragmentary among the actors of the sector, all the more so as they cover different realities, depending on the nature of goods and actors concerned [40].
Results also reveal the importance of the local context [40,41,58]. This growth in employment is intrinsically related to the voluntarism of the regional authorities in supporting TIR. Remaining that the Hauts-de-France owns the second biggest nuclear power plant in Europe, the development of renewable energies especially wind energy has only been possible by the public investment and active cooperation with the firm in charge of the production and distribution of electricity. Another evidence of the importance of the local context is observed in the territorial differences. The dynamics by district shows that job creation is stronger in Nord and Pas-de-Calais, which constitute the historical region until 2015. They have benefited to the TIR policy in the early 2010, while the other districts Somme, Oise and Aisne were involved during 2015. These latter districts less exposed to TIR policy exhibit lower rate of growth. The dynamics is uneven in Oise: specialised firms increased employment by +10.89 percent while the overall sample shows sluggish growth (−0.25 percent). We advocate for more contextual analysis of the growth triggered by the TIR. Political and technological contexts set the economic growth potential of the TIR and the sources and the composition of new jobs (conversion, entirely new skills or expansion of existing jobs).
This research provides also a general method of identification of firms related to TIR activities. As many countries, France do not provide green or transition related classification of jobs contrasting with US or Scotland [2]. The bigdata based approach permit to both identify a large number of organizations involved in the TIR, but also to focus on specific subset of more dynamic business unit. It fosters the analysis of alternative metrics of the development of the TIR as well as the growth in fundraising, economic value added or turnover. It is also appropriate to understand the determinants of the success of these organization. Nonetheless, at this stage the method cannot capture precisely the nature and quality of the jobs without combining complementary data collection.
If employment growth is a sign of economic performance, it cannot account for the employment dynamics of the TIR on its own. Further research to investigate the quality of employment [52,59] is needed in order to foster a fair shift to a greener economy [60]. Some questions, such as “Are these jobs new occupations, changing occupations or occupations developing from pre-existing jobs already linked to the TIR? Is the dynamics inclusive?” require consideration [2,33,41] to promote understanding and support of the TIR activities. Although there is no unanimously accepted definition of green jobs or TIR today, the identification of skills required by the firms and the quality of jobs created is a question to address to better direct support and to improve the characterisation of the dynamics [33]. A more detailed description of the employment dynamics related to the TIR would require a comparison of the dynamics of shifting actors to that of their competitors who are not involved in sustainable activities. The outcomes of this detailed comparison would contribute to singling out the dynamics specifically related to the TIR in Hauts-de-France, to understanding which business models are attached to these organisations, and to providing local public authorities with decision-making tools. There is a need to mobilize multiple research designs, in particular those based on the collection of primary data, in order to reference this dimension of TIR-related employment. In addition, job creation cannot account for all economic dimensions of the TIR. Other dimensions would require further analysis to measure the success of these firms. Their survival rate, their profitability, the amount of funds raised, or their innovation potential would provide a more acute view of the economic development of the TIR [44].
7. Conclusions
The purpose of this research is to report on job creation related to the TIR in Hauts-de-France from 2013 to 2018. The proactive policy of Hauts-de-France Regional Council in favour of the TIR since 2013 has fostered a unique context where networks and organisations in charge of the shift are prominent, facilitating the identification of the firms focused on the TIR activities. The originality of our approach is its use of the firms’ individual data to facilitate monitoring of the dynamics over time and help targeted interventions from researchers wishing to further explore the profile of these organisations as well as from public authorities involved in supporting and guiding firms in shifting.
We collected a sample of 49,591 entities with their headquarters in Hauts-de-France and established distinctive characteristics of the firms involved in the TIR to create two groups: a large sample of 26,771 firms and a sub-sample of 6403 firms with a core business related to the TIR. Our results show the strong and positive employment dynamics in firms focused on the TIR with an average employment growth rate of +17.38 percent in a context of weak regional growth (+1.34 percent). This trend is amplified for the specialised firms with an increase of +21.09 percent. This growth in employment arises mainly from the fields of the production of renewable energies, positive energy buildings, circular economy and energy efficiency. These results support recent literature on the ability of the TIR at generating economic growth and confirm the importance of the political context in its development even we do not find differences in the composition TIR-related activities among districts.
While it is impossible to study the dimensions of spillover of the TIR entirely at this stage, our research forms a basis for broader and more critical research, particularly regarding the quality of employment created [2,33,59], in oder to foster a fair shift to a greener economy [59,60]. Creating new criteria of recognition of firms focused on the TIR and accounting for other dimensions than created value, survival of firms and their degree of innovation in comparison to firms in more traditional sectors are but a few possible avenues for future research. Theses studies would contribute to better understand the factors fostering economic success of firms focused on the TIR in view of providing better support to their development without supplanting the aim of sustainability.
Funding
This research was funded by the Regional Council Hauts-de-France and the Mission rev3 of the Chamber of Commerce and Industry of Lille (France).
Institutional Review Board Statement
Not applicable.
Informed Consent Statement
Not applicable.
Data Availability Statement
Not applicable.
Acknowledgments
We gratefully thank the Mission rev3, the Chamber of Commerce and Industry Hauts-de-France, the Regional Council of Hauts-de-France TIR Department, Ademe, the cluster FEDEREC, the cluster Polénergie, the cluster FIBOIS, C2DE, CERD, and HDFID for their advice, administrative and technical supports.
Conflicts of Interest
The funder has been involved in the collection of data only.
Appendix A

Table A1.
Breakdown of sources by Pillar.
| Pillar 1: Transitioning to Renewable Energies: Wind, Solar, Geothermal, Hydro | Pillar 2: Developing Positive Energy Buildings | Pillar 3: Getting Equipped with Energy Storage Systems | Pillar 4: Deploying an Energy Internet | Pillar 5: Sustainable Mobility for People and Goods | Pillar 6: Circular Economy | Pillar 7: Function-Based Product-Service Systems | Pillar 8: Energy Eficiency |
|---|---|---|---|---|---|---|---|
| Ademe Club International | Ademe Club International | Ademe Club International | Ademe Club International | Ademe Club International | Ademe Club International | Ademe Club International | Ademe Club International |
| Ademe-Projets Verts | Ademe-Projets Verts | Ademe-Projets Verts | Ademe-Projets Verts | Ademe-Projets Verts | Ademe-Projets Verts | Ademe-Projets Verts | Ademe-Projets Verts |
| Ademe-Repair Café | Ademe-Repair Café | ||||||
| Allice Alliance | Allice Alliance | Allice Alliance | Allice Alliance | Aquavaley | Club Noé | Allice Alliance | |
| Annuaire Des Diagnostiqueurs Immobiliers | Cd2e | Aphypac | Cncres | Cncres | Eco-Circulaire.Org—Organisations Adhérentes | Cncres | Aquavaley |
| Aphypac | Enedis | Biogaz Valley | Enedis projets | Pexe | Fibois | Pexe | Biogaz Valley |
| Aquavaley | Fibois | Cd2e | Gimelec | Projets Rev3 | Hydreos | Projets Rev3 | Enedis |
| Biogaz Valley | Afcobois | Enedis projets | Greentech | Reseau Scic | Pexe | Reseau Scic | Fibois |
| Cd2e | Fédération Nationale Du Bois | Gimelec | Pexe | Projets Rev3 | Gimelec | ||
| Cerrd | Greentech | Greentech | Pôle Energie Hdf | Rep-Gf—Liste Des Opérateurs Attestés | Greentech | ||
| Enedis | Pexe | Pexe | Pole Medee | Reseau Scic | Pôle Energie Hdf | ||
| Fimea | Pôle Energie Hdf | Pôle Energie Hdf | Projets Rev3 | Sinoe | Pole Medee | ||
| Fédération Nationale Du Bois | Projets Rev3 | Pole Medee | Reseau Scic | Syderep—Dbps | Projets Rev3 | ||
| Gimelec | Qualibat | Projets Rev3 | Pôlenergie-Adherents | Syderep—Dea | Qualibat | ||
| Greentech | Rge | Rs2e | Syderep—Emb | Unités De Méthanisation | |||
| Pexe | Reseau Scic | Reseau Scic | Syderep—Piles Et Accumulateurs | Atee Club Biogaz | |||
| Pole Dream | Team2 | Ufe | Syderep—Pu | Energie2020 | |||
| Pôle Energie Hdf | Cd2e Acteurs Eco-Construction | Unités De Méthanisation | Syderep—Rep-Deee | Pôlenergie-Methanisation | |||
| Pole Medee | Cd2e Entreprises | Cd2e Acteurs Eco-Construction | Syderep—Vhu | Pôlenergie-Adherents | |||
| Projets Rev3 | Cd2e Laboratoires | Cd2e Entreprises | Team2 | Pefc | |||
| Rge | Pôlenergie-Adherents | Cd2e Laboratoires | Ufe | ||||
| Rs2e | Pefc | Energie2020 | Upds | ||||
| Reseau Scic | Pôlenergie-Methanisation | Atee Club Biogaz | |||||
| Syndicat Energie Renouvelable | Pôlenergie-Adherents | Pefc | |||||
| Transition Ecologique Territoires Emplois | |||||||
| Ufe | |||||||
| Unités De Méthanisation | |||||||
| Atee Club Biogaz | |||||||
| Cd2e Acteurs Eco-Construction | |||||||
| Cd2e Entreprises | |||||||
| Cd2e Laboratoires | |||||||
| Energie2020 | |||||||
| Pôlenergie-Methanisation | |||||||
| Pôlenergie-Adherents | |||||||
Table A2.
Key words used in the search on ASTRIDE—Hauts-de-France Innovation Développement.
| Pillar 1: Transitioning to Renewable Energies: Wind, Solar, Geothermal, Hydro | Pillar 2: Developing Positive Energy Buildings | Pillar 3: Getting Equipped with Energy Storage Systems | Pillar 4: Deploying an Energy Internet | Pillar 5: Sustainable Mobility for People and Goods | Pillar 6: Circular Economy | Pillar 7: Function-Based Product-Service Systems | Pillar 8: Energy Eficiency |
|---|---|---|---|---|---|---|---|
| Renewal energies | Positive energy buildings | Energy storage | Energy Internet | Mobility of people and goods | Circular economy | Product-service system | Energy efficiency |
| Energy efficiency | Energy consumption | excessive spare capacity | SMART NETWORK | Multimodal transport | “zero emissions” | Energy transition | Direct energy efficiency |
| Hydroelectricity | Thermal renovation | Production irregularity | Smart grids | “zero emissions” | “Adaptating to climate change” | Service Economy | Indirect energy efficiency |
| Energy system | Energy and enivronmental quality | “zero emissions” | Smart cities | “Adaptating to climate change” | “Alleviating climate change” | Ecodesign | |
| Decarbonated | Passive house | “Adaptating to climate change” | Smart grid | “Alleviating climate change” | recycling | Rebound effect | |
| Wind energy | Energy producing buildings | “Alleviating climate change” | Smart city | Carpooling | Ecodesign | Heating | |
| Photovoltaic | Own energy consumption | Energy transition | Load management | Swift mobility | Energy transition | Lighting | |
| Geothermal | Revegetation | Energy control | “zero emissions” | Intermodality | Waste | Compressed air | |
| Hydraulic | Brownfield redevelopment | Green energies | “Adaptating to climate change” | E-mobility | Sustainable consumption | Energy transition | |
| Renewable marine energy | Innovative waste management | “Atténuation du changement climatique” | “Alleviating climate change” | Sustainable production | Green activities | ||
| Biomass | Ecodistrict | Energy transition | Bike | Salvage | |||
| Methanation | Bio-based materials | Green activities | Electric vehicles | Green activities | |||
| Geothermal energy | EV charging infrastructure | EV charging infrastructure | Rejects | ||||
| Hydrogen | EVSE | EVSE | Sustainable supply | ||||
| Energy conservancy | Hydraulic storage | Connector terminals | life cycle assessment | ||||
| Green energies | Compressed air storage | Energy transition | LCA | ||||
| “zero emissions” | méthanation | Air pollution | Bio-based | ||||
| “Adaptating to climate change” | “zero emissions” | Noise | Industrial ecology | ||||
| “Alleviating climate change” | “Adaptating to climate change” | Green activities | Bioeconomy | ||||
| Heating | “Alleviating climate change” | biocarburants | |||||
| Lighting | Heating | bioéthanol | |||||
| Compressed air | Lighting | Mobility management | |||||
| Energy transition | Compressed air | ||||||
| Green activities | Energy transition | ||||||
| Heat pump | Energy control | ||||||
| Solar | Green activities | ||||||
| Waste heat | Energy saving retrofit | ||||||
| Heat recycling | Wood | ||||||
| Biogas | |||||||
| Firedamp | |||||||
| Wood | |||||||
| Steel production gas | |||||||
| Low carbon | |||||||
References
- Zaoual, A.-R. Pour une contribution du management stratégique à l’écologie industrielle. Développement Durable Territ. 2014, 5. [Google Scholar] [CrossRef]
- Sofroniou, N.; Anderson, P. The green factor: Unpacking green job growth. Int. Labour Rev. 2021, 160, 21–41. [Google Scholar] [CrossRef]
- Poschen, P.; Renner, M. Green Jobs: Protecting the Environment Can Go Hand in Hand with Economic Prosperity and Job Opportunities. Financ. Dev. 2015, 52, 14–17. [Google Scholar]
- Morriss, A.P.; Bogart, W.T.; Dorchak, A.; Meiners, R.E. Green Jobs Myths; University of Illinois Law and Economics Research Paper Series; n° LE09-001; University of Illinois College of Law: Champaign, IL, USA, 2009. [Google Scholar]
- Tantau, A.; Santa, A.-M.I. New Energy Policy Directions in the European Union Developing the Concept of Smart Cities. Smart Cities 2021, 4, 241–252. [Google Scholar] [CrossRef]
- International Labour Organization. World Employment and Social Outlook 2015: The Changing Nature of Jobs; ILO Research Department: Geneva, Switzerland, 2015.
- European Commission. Communication De La Commission Au Parlement Européen, Au Conseil, Au Comité Economique Et Social Européen Et Au Comité Des Régions Responsabilité Sociale Des Entreprises; Une Nouvelle Stratégie De L’UE Pour La Période 2011–2014; European Commission: Brussels, Belgium, 2011.
- Aldieri, L.; Carlucci, F.; Cirà, A.; Ioppolo, G.; Vinci, C.P. Is green innovation an opportunity or a threat to employment? An empirical analysis of three main industrialized areas: The USA, Japan and Europe. J. Clean. Prod. 2019, 214, 758–766. [Google Scholar] [CrossRef]
- Gagliardi, L.; Marin, G.; Miriello, C. The greener the better? Job creation effects of environmentally-friendly technological change. Ind. Corp. Chang. 2016, 25, 779–807. [Google Scholar] [CrossRef] [Green Version]
- Horbach, J.; Rennings, K. Environmental innovation and employment dynamics in different technology fields—An analysis based on the German Community Innovation Survey. J. Clean. Prod. 2013, 57, 158–165. [Google Scholar] [CrossRef] [Green Version]
- Licht, G.; Peters, B. The Impact of Green Innovation on Employment Growth in Europe; European Commision: Brussels, Belgium, 2013.
- Cai, W.; Wang, C.; Chen, J.; Wang, S. Green economy and green jobs: Myth or reality? The case of China’s power generation sector. Energy 2011, 36, 5994–6003. [Google Scholar] [CrossRef]
- Pfeiffer, F.; Rennings, K. Employment Impacts of Cleaner Production—Evidence from a German Study Using Case Studies and Surveys. Bus. Strategy Environ. 2001, 10, 161–175. [Google Scholar] [CrossRef] [Green Version]
- Cainelli, G.; Mazzanti, M.; Zoboli, R. Environmentally oriented innovative strategies and firm performance in services. Micro-evidence from Italy. Int. Rev. Appl. Econonm. 2011, 25, 61–85. [Google Scholar] [CrossRef]
- Rennings, K.; Zwick, T. Employment Impact Of Cleaner Production on The Firm Level: Empirical Evidence From A Survey In Five European Countries. Int. J. Innov. Manag. 2003, 6, 319–342. [Google Scholar] [CrossRef]
- ADEME. Ministère de la Transition Ecologique et Solidaire, rev3. In Enjeux Energétiques et Emplois en Hauts-de-France: Scénarios Pour la Troisième Révolution Industrielle/rev3; ADEME: Angers, France, 2018. [Google Scholar]
- ADEME. Économie Circulaire et Emplois en Hauts-de-France, Synthèse de L’étude Prospective; Réalisée Pour l’ADEME par le Groupement I-Care; Amnyos, Technopolis: Paris, France, 2020. [Google Scholar]
- Observatoire National Des Emplois Et Métiers De L’économie Verte. Les Eco-Activités et L’emploi Environnemental en 2018; Nauroy, F., Ed.; Commissariat Général au Développement Durable, Sous-Direction de L’information Environnementale: Paris, France, 2020.
- Commissariat Général au Développement Durable. Les Eco-Activités et L’emploi Environnemental en 2017: Premiers Résultats; Nauroy, F., Ed.; Commissariat Général au Développement Durable: Paris, France, 2019.
- Ministère du Travail; de L’emploi et de L’insertion. Plan de Programmation des Emplois et des Compétences; Ministère du Travail: Paris, France, 2019.
- Shapira, P.; Gok, A.; Sensier, M. Probing “green” industry enterprises in the UK: A new identification approach. Technol. Forecast. Soc. Chang. 2014, 85, 93–104. [Google Scholar] [CrossRef]
- Consoli, D.; Marin, G.; Marzucchi, A.; Vona, F. Do green jobs differ from non-green jobs in terms of skills and human capital? Res. Policy 2016, 45, 1046–1060. [Google Scholar] [CrossRef] [Green Version]
- United Nations Environment Programme. Green Jobs: Towards decent work in a sustainable, low-carbon world. In Report Is Commissioned and Funded by UNEP, ILO, IOE and ITUC; United Nations Environment Programme: Nairobi, Kenya, 2008. [Google Scholar]
- Muro, M.; Rothwell, J.; Saha, D. Sizing the Clean Economy: A National and Regional Green Jobs Assessment, Metropolitan Policy Program, 1775 Massachusetts Avenue, NW Washington, DC United States 20036-2188; UNEP: Nairobi, Kenya, 2011.
- Acemoglu, D.; Autor, D. Skills, Tasks and Technologies: Implications for Employment and Earnings. In Handbook of Labor Economics; Elsevier: Amsterdam, The Netherlands, 2011; Volume 4, pp. 1043–1171. [Google Scholar]
- Bowen, A.; Duffy, C.; Fankhauser, S. ‘Green Growth’ and the New Industrial Revolution. Grantham Research Institute on Climate Change and the Environment at London School of Economics and Political Science. Policy Brief January; Grantham Research Institute on Climate Change and the Environment and Global Green Growth Institute: London, UK, 2016. [Google Scholar]
- AIEA. Impact on Employment and Activity-Industry Approaches of the Update Scenarios of the Third Industrial Revolution/Rev3 Master Plan in Hauts-de-France Region: Final Report; 50 Refs.; Available from the INIS Liaison Officer for France, Report Number: INIS-FR-18-1340; INIS Liaison Officer for France: Paris, France, 2018; 129p. [Google Scholar]
- Bowen, A.; Kuralbayeva, K.; Tipoe, E.L. Characterising green employment: The impacts of ‘greening’ on workforce composition. Energy Econ. 2018, 72, 263–275. [Google Scholar] [CrossRef]
- Aldieri, L.; Garofalo, A.; Vinci, C.P. R&D Spillovers and Employment: A Micro-Econometric Analysis; MPRA Paper 67269; University Library of Munich: Munich, Germany, 2015. [Google Scholar]
- Aldieri, L.; Grafström, J.; Vinci, C.P. Job Creation in the Wind Power Sector through Marshallian and Jacobian Knowledge Spillovers; Ratio Working Papers 340; The Ratio Institute: Stockholm, Sweden, 2020. [Google Scholar]
- Böhringer, C.; Keller, A.; van der Werf, E. Are Green Hopes too Rosy? Employ. Welf. Impacts Renew. Energy Promot. Energy Econ. 2013, 36, 277–285. [Google Scholar]
- Ge, Y.; Zhi, Q. Literature Review: The Green Economy, Clean Energy Policy and Employment. Energy Procedia 2016, 88, 257–264. [Google Scholar] [CrossRef] [Green Version]
- Dierdorff, E.C.; Norton, J.J.; Drewes, D.W.; Kroustalis, C.M.; Rivkin, D.; Lewis, P. Greening of the World of Work: Implications for ONET-SOC and New and Emerging Occupations; Report Prepared for U.S. Department of Labor, Employment and Training Administration; Office of Workforce Investment, Division of Workforce System Support: Washington, DC, USA, 2009.
- Marin, G.; Vona, F. Climate policies and skill-biased employment dynamics: Evidence from EU countries. J. Environ. Econ. Manag. 2019, 98, 102253. [Google Scholar] [CrossRef] [Green Version]
- Rodrik, D. Green industrial policy. Oxf. Rev. Econ. Policy 2014, 30, 469–491. [Google Scholar] [CrossRef]
- Sovacool, K.B.; Schmid, O.; Stirling, A.; Walter, G.; MacKerron, G. Differences in carbon emissions reduction between countries pursuing renewable electricity versus nuclear power. Nat. Energy 2020, 5, 928–935. [Google Scholar] [CrossRef]
- Poumadère, M.; Bertoldo, R.; Samadi, J. Public perceptions and governance of controversial technologies to tackle climate change: Nuclear power, carbon capture and storage, wind, and geoengineering. WIREs Clim. Chang. 2011, 2, 712–727. [Google Scholar] [CrossRef]
- Rifkin, J. The Third Industrial Revolution: How Lateral Power Is Transforming Energy, the Economy, and the World; Palgrave Macmillan: London, UK, 2011. [Google Scholar]
- CCI Hauts-de-France; Conseil Régional Hauts-de-France. Mission Troisième Révolution Industrielle; Référentiel de la Troisième Révolution Industrielle en Hauts-de-France: Paris, France, 2017. [Google Scholar]
- Maillefert, M.; Robert, I. Écologie industrielle, économie de la fonctionnalité, entreprises et territoires: Vers de nouveaux modèles productifs et organisationnels? Développement Durable Territ. 2020, 11. [Google Scholar] [CrossRef]
- Barbieri, N.; Consoli, D. Regional diversification and green employment in US metropolitan areas. Res. Policy 2019, 48, 693–705. [Google Scholar] [CrossRef] [Green Version]
- Bouleau, G.; Carter, C.; Sergent, A.; Fournis, Y. Quels territoires pertinents pour écologiser les industries qui misent sur le renouvelable? Développement Durable Territ. 2020, 11. [Google Scholar] [CrossRef]
- Battaglia, M.; Cerrini, E.; Annesi, N. Can environmental agreements represent an opportunity for green jobs? Evidence from two Italian experiences. J. Clean. Prod. 2018, 175, 257–266. [Google Scholar] [CrossRef]
- Li, W.; Jue, W.; Rongxiao, C.; Yongqin, X.; Shi, Q.L.; Feimei, W.; Mahmoud, M.; Xueping, W. Innovation-driven industrial green development: The moderating role of regional factors. J. Clean. Prod. 2019, 222, 344–354. [Google Scholar] [CrossRef]
- Nahrath, S.; Gerber, J.-D. Pour une approche ressourcielle du développement durable. Développement Durable Territ. 2014, 5. [Google Scholar] [CrossRef] [Green Version]
- Raimbert, C.; Raton, G. Collectifs logistiques et territoires dans les circuits courts alimentaires de proximité: La robustesse de la coopération analysée au prisme des communs. Développement Durable Territ. 2021, 12. [Google Scholar] [CrossRef]
- Roman, P.; Muylaert, C.; Ruwet, C.; Thiry, G.; Maréchal, K. Intégrer la territorialité pour une économie de la fonctionnalité plus soutenable. Développement Durable Territ. 2020, 11. [Google Scholar] [CrossRef]
- Doré, G. Économie circulaire et écologie industrielle. Approche empirique à partir d’expériences de clusters et de territoires. Développement Durable Territ. 2021, 12. [Google Scholar] [CrossRef]
- Bulletin Officiel des Annonces Civiles et Commerciales (Bodacc). Available online: https://www.bodacc.fr/ (accessed on 8 February 2022).
- Société.com. Available online: https://www.societe.com/ (accessed on 8 February 2022).
- Infogreffe—Registre du Commerce et des Sociétés. Available online: https://www.infogreffe.fr/ (accessed on 8 February 2022).
- Bacheré, H.; Mirouse, B. Décomposition de L’évolution de L’emploi par Catégorie D’entreprise: Comparaison des Méthodes et Application à L’économie Française; Document de Travail Insee, H2021-02; Institut National de la Statistique et des Etudes Economiques: Paris, France, 2021. [Google Scholar]
- Institut National de la Statistique et des Etudes Economiques (INSEE). Available online: https://www.insee.fr/fr/statistiques/serie/010567992 (accessed on 8 February 2022).
- Lejeune, F.; Terra, S. La troisième région logistique française. Atouts et défis des Hauts-de-France; Insee: Paris, France, 2017.
- ADEME. Marchés et Emplois Dans le Domaine des Energies Renouvelables, Situation 2013–2015; ADEME: Angers, France, 2017. [Google Scholar]
- Regional Climate Obervatoire. Available online: http://www.observatoireclimat-hautsdefrance.org/Les-grandes-questions/Quelle-est-la-production-d-energie-renouvelable-en-Nord-Pas-de-Calais (accessed on 8 February 2022).
- Schiebel, J. Quelle place pour la durabilité dans les représentations sociales de la mobilité ? Vers une meilleure compréhension des actions mises en œuvre. Développement Durable Territ. 2018, 9. [Google Scholar] [CrossRef] [Green Version]
- Gonçalves, A. Les organisations logistiques à promouvoir dans le cadre des Politiques de Transport Durable de Marchandises: La question des circuits de proximité. Développement Durable Territ. 2013, 4. [Google Scholar] [CrossRef] [Green Version]
- Masterman-Smith, H. Green Collaring a Capital Crisis? Labour Ind. 2010, 20, 317–330. [Google Scholar] [CrossRef]
- Pettinger, L. Green Collar Work: Conceptualizing and Exploring an Emerging Field of Work. Sociol. Compass 2017, 11, e12443. [Google Scholar] [CrossRef] [Green Version]
Figure 1.
Evolution of employment growth related to TIR in Hauts-de-France between 2013 and 2018 (in base 100 in 2013).
Figure 1.
Evolution of employment growth related to TIR in Hauts-de-France between 2013 and 2018 (in base 100 in 2013).

Figure 2.
Distribution of activities and employment growth rates from 2013 to 2018.

Table 1.
Estimation of direct employment growth from 2013 to 2018.
| Firms with Core Business Related to the TIR | Overall Sample | INSEE Hauts-De-France—All Sectors 1 | |||
|---|---|---|---|---|---|
| Jobs | % Var | Jobs | % Var | Jobs | % Var |
| +27,838 | +21.09% | +52,173 | +17.38% | +26,783 | +1.34% |
1 Net of job destruction. Source: [53].
Table 2.
Distribution of firms by pillar and districts.
| Districts | Pillar 1: Transitioning to Renewable Energies: Wind, Solar, Geothermal, Hydro | Pillar 2: Developing Positive Energy Buildings | Pillar 3: Getting Equipped with Energy Storage Systems | Pillar 4: Deploying an Energy Internet | Pillar 5: Sustainable Mobility for People and Goods |
| Nord | 17.99% | 28.33% | 2.71% | 1.67% | 5.14% |
| Pas-de-Calais | 19.67% | 29.54% | 2.05% | 0.93% | 3.26% |
| Oise | 16.62% | 30.12% | 0.53% | 0.53% | 1.71% |
| Aisne | 16.19% | 31.11% | 0.79% | 0.73% | 2.02% |
| Somme | 16.82% | 30.26% | 0.91% | 0.96% | 2.58% |
| Region | 17.90% | 29.36% | 1.86% | 1.16% | 3.62% |
| Districts | Pillar 6: Circular Economy | Pillar 7: Function-based Product-Service Systems | Pillar 8: Energy Eficiency | Total—Authors’ Calculation | Distribution of Firms—INSEE |
| Nord | 25.22% | 1.44% | 17.51% | 42% | 45% |
| Pas-de-Calais | 25.54% | 0.83% | 18.19% | 23.8% | 21.4% |
| Oise | 28.53% | 0.42% | 21.53% | 13.4% | 14% |
| Aisne | 27.24% | 0.64% | 21.28% | 9.9% | 9.1% |
| Somme | 27.04% | 0.75% | 20.67% | 11% | 10.5% |
| Région | 26.15% | 1.00% | 18.96% | 100% | 100% |
Table 3.
Table of contingency of number of firms by pillar.
| Pillar 1: Transitioning to Renewable Energies: Wind, Solar, Geothermal, Hydro | Pillar 2: Developing Positive Energy Buildings | Pillar 3: Getting Equipped with Energy Storage Systems | Pillar 4: Deploying an Energy Internet | Pillar 5: Sustainable Mobility for People and Goods | Pillar 6: Circular Economy | Pillar 7: Function-Based Product-Service Systems | Pillar 8: Energy Eficiency | Average Annual Number of Firms 2013–2018 | |
|---|---|---|---|---|---|---|---|---|---|
| Pillar 1 | 100% | 96% | 9% | 1% | 3% | 36% | 1% | 38% | 3,601 |
| Pillar 2 | 100% | 5% | 1% | 1% | 64% | 1% | 64% | 4,735 | |
| Pillar 3 | 100% | 16% | 17% | 36% | 11% | 25% | 458 | ||
| Pillar 4 | 100% | 86% | 31% | 75% | 38% | 131 | |||
| Pillar 5 | 100% | 18% | 16% | 10% | 702 | ||||
| Pillar 6 | 100% | 1% | 75% | 4,217 | |||||
| Pillar 7 | 100% | 33% | 104 | ||||||
| Pillar 8 | 100% | 2,618 |
Table 4.
Pillar distribution of direct job creation from 2013 to 2018.
| Pillars | Firms with Core Business Related to the TIR | Overall Sample | ||
|---|---|---|---|---|
| Jobs | % Var. | Jobs | % Var. | |
| Pillar 1 | +15,894 | 25.65% | +21,944 | 16.48% |
| Pillar 2 | +8357 | 14.78% | +10,362 | 7.29% |
| Pillar 3 | +2618 | 8.97% | +2556 | 8.66% |
| Pillar 4 | −243 | −1.43% | +88 | 0.51% |
| Pillar 5 | +7167 | 8.55% | +7277 | 8.68% |
| Pillar 6 | +17,208 | 21.17% | +25,048 | 11.30% |
| Pillar 7 | −1376 | −8.97% | −1073 | −7.04% |
| Pillar 8 | +6179 | 16.39% | +1579 | 2.86% |
| Total without duplicates | +27,838 | +21.09% | +52,173 | +17.38% |
Table 5.
Direct job creation by district in Hauts-de-France from 2013 to 2018 1.
| Districts | Firms with Core Business Related to the TIR | Overall Sample | ||
|---|---|---|---|---|
| Jobs | % Var. | Jobs | % Var. | |
| Nord | 40,196 | 24.57% | 54,864 | 8.27% |
| Pas-de-Calais | 31,935 | 24.18% | 45,637 | 11.01% |
| Oise | 7900 | 10.89% | −589 | −0.25% |
| Aisne | 6542 | 13.95% | 12,014 | 9.23% |
| Somme | -- | -- | -- | -- |
1 Depending on the number and distribution of firms on the territory, the same business can be listed in several districts. It is impossible to derive regional employment from the sum of employment in each of the region’s districts.
Publisher’s Note: MDPI stays neutral with regard to jurisdictional claims in published maps and institutional affiliations. |
© 2022 by the author. Licensee MDPI, Basel, Switzerland. This article is an open access article distributed under the terms and conditions of the Creative Commons Attribution (CC BY) license (https://creativecommons.org/licenses/by/4.0/).
Share and Cite
MDPI and ACS Style
Belarouci, M. Outline and Impact of Firms Related to the Third Industrial Revolution: Investigation through Big Data. Smart Cities 2022, 5, 522-538. https://0-doi-org.brum.beds.ac.uk/10.3390/smartcities5020028
AMA Style
Belarouci M. Outline and Impact of Firms Related to the Third Industrial Revolution: Investigation through Big Data. Smart Cities. 2022; 5(2):522-538. https://0-doi-org.brum.beds.ac.uk/10.3390/smartcities5020028
Chicago/Turabian StyleBelarouci, Matthieu. 2022. "Outline and Impact of Firms Related to the Third Industrial Revolution: Investigation through Big Data" Smart Cities 5, no. 2: 522-538. https://0-doi-org.brum.beds.ac.uk/10.3390/smartcities5020028