1. Introduction
The globalization of the last few years has made organizations increasingly dependent on their ability and speed to innovate, and improve their processes, thereby, always looking for continuous improvements. The increased use of management tools gives rise to the need for better quality and productivity indexes that lead to greater competitiveness of organization products, processes and services. On the other hand, quantifying the drivers and implications of globalization is crucial to understanding how to sustainably meet growing global food demands [
1]. The desire for competitiveness made the companies search for solutions that represent a way to achieve the status of excellence [
2].
Maintenance has become one of the strategic functions and is responsible for the direct availability of assets. These assets can be described as the wealth that represents the elements that make up the monetary policy of an organization, such as: equipment, processes, procedures, human resources, investment capital, and raw materials. The aim for excellence and better results through maintenance is seen as an important resource of the organizations, whose results will improve and achieve a more effective Maintenance Management (MM) [
3]. In the agriculture environment, the MM of tractors and machineries [
4] have gained a lot of attention due to advantages, e.g., reduction cost.
Due to low labor demand, agricultural activities require the use of machines and implements (e.g., cassava harvesters, harrows, roller crimpers, ploughs, threshers, axes, powrahs, chaff cutter machine, cultivators, transplanters, and seed drills) to supply the field activities, as well as qualification for operators to carry out activities with quality and safety. The production sector of agricultural machinery and implements has been inserting technological products, much of it due to the development and use of precision agriculture, and embedded technologies [
5]. The use of precision technologies may have other benefits, such as: less farm machinery maneuvers on the field, higher working speed, and less soil contamination due to excessive use of plant protection products [
6,
7].
Technological devices and services, such as electronics and mobile environments, increased frequency for research in precision agriculture [
8,
9], including navigation and guidance [
10,
11], geographic information system functions [
12], protection system for data acquisition in tractors [
13], agriculture wireless sensors technologies [
14,
15], and predictive maintenance [
16,
17,
18,
19].
Preventive maintenance (PM) is a reduced failure probability of equipment and extension of equipment life. According Spinelli et al. [
20], PM is also defined as scheduled, periodic, time-based or ordinary maintenance, which can include a sophisticated form of PM based on careful diagnostics. The issue of PM is the need to interrupt production at scheduled intervals to perform the work. On the other hand, predictive maintenance is often referred to as condition-based maintenance [
21], and allow the operator to identify in advance the probability occurrence of failures. Through predictive techniques, condition of failures are monitored, and the corrective action when necessary is performed through a planned corrective maintenance [
22]. The use of predictive maintenance with technologies is presented as an alternative to guaranteeing and improving the levels of reliability, and availability of the agricultural machinery, e.g., tractors [
23]. Thus, based on the monitoring of mechanical components, it is possible to diagnose failures before occurrence of further damage to the machinery or paralyze an activity. According to Rohani et al. [
16], the prediction of repairs and maintenance costs can be made from artificial neural networks, however, sufficient history of fault data is necessary. However, Sorensen et al. [
24] suggested the use of conceptual models for maintenance management, but no prediction failures, and Bekana et al. [
25] analyze the lubricating oil in motors of tractors for the prediction of necessary maintenance.
The objective of this study was to apply the concept of predictive maintenance using software that allowed the analysis of pressure parameters in the clutch system of a medium-power agricultural tractor in order to map and identify differences in its operation. From this identification, a preventive maintenance is carried out on the possible components in the transmission system, avoiding the future issues.
2. Materials and Methods
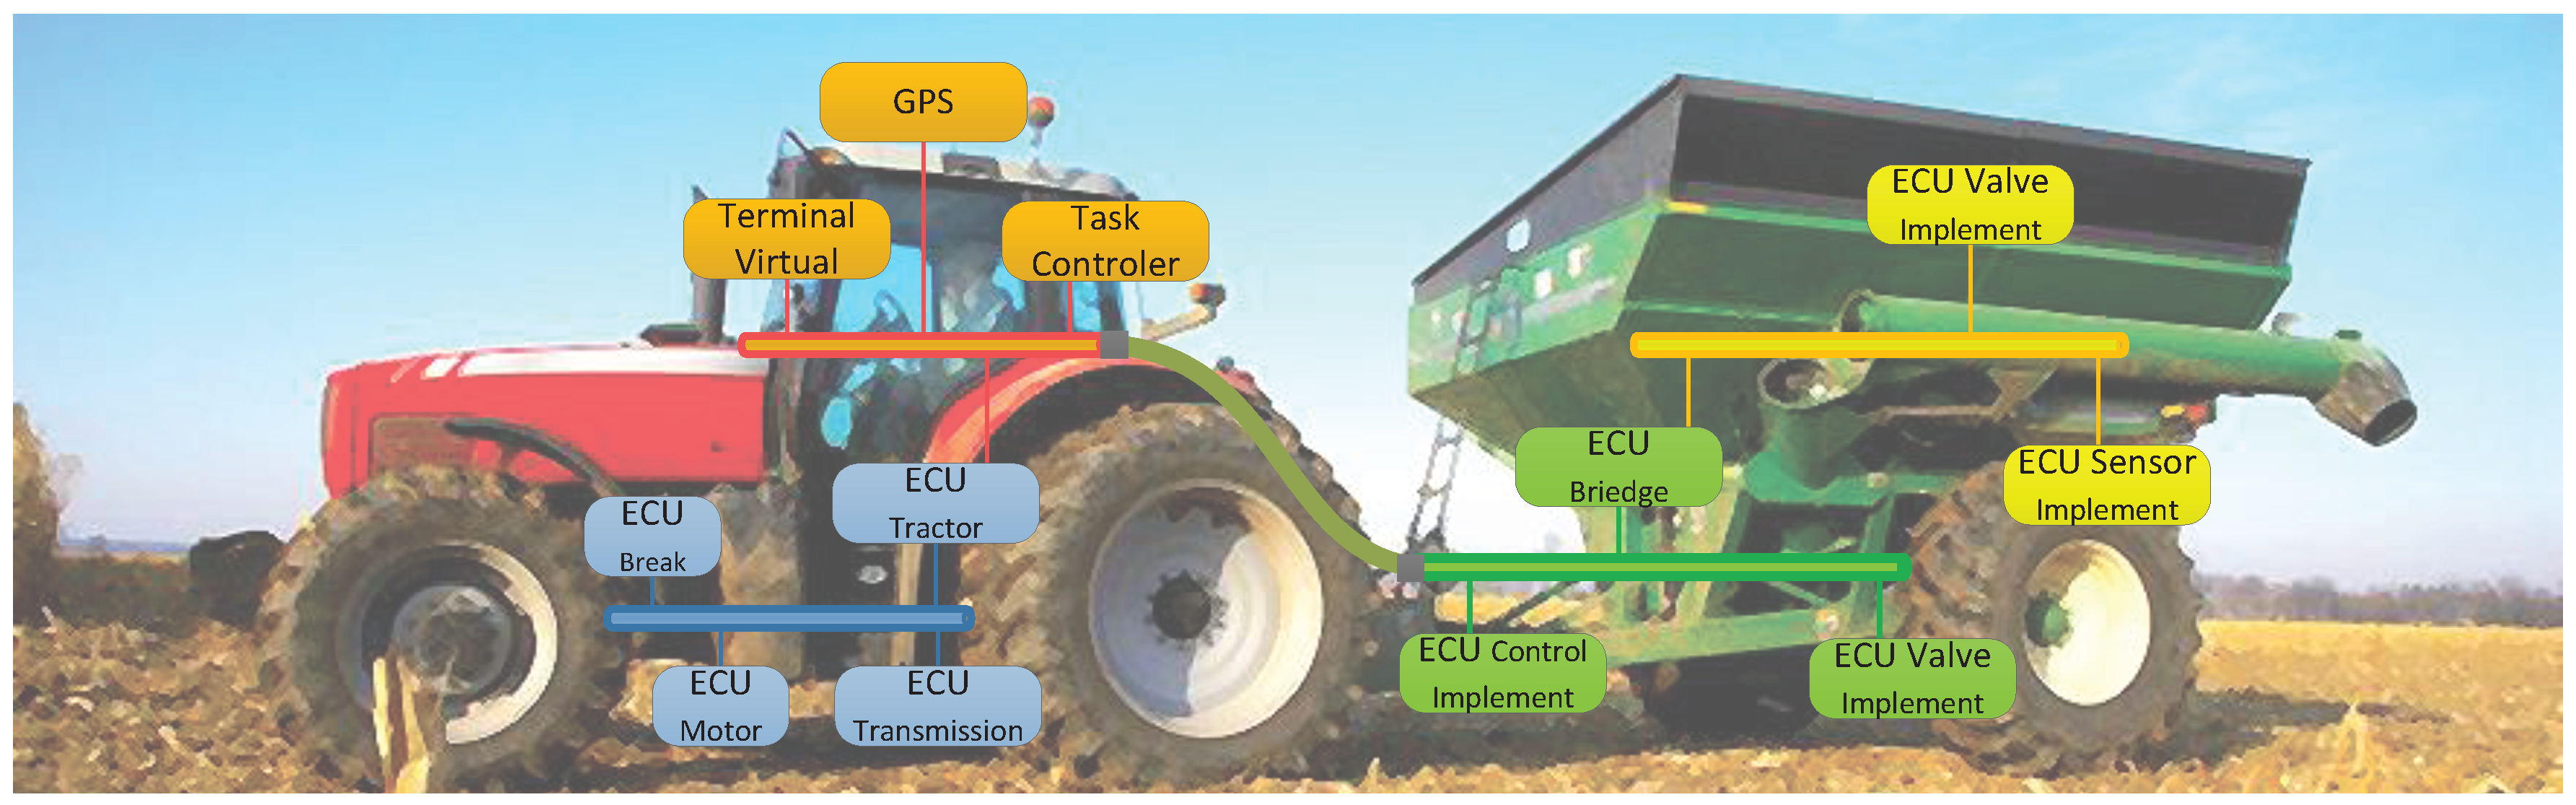
This work focused on the clutch system of a tractor T8.270 model of the average power of the manufacturer New Holland (Curitiba, PR Brazil). This model was used because of the embedded technology based on two ECUs (Electronic Control Units) that control its primary functions as: brakes, transmission, and motor. Tractors are widely characterized by few large load oscillations, especially in clutch systems due to clutch exchanges caused by driving events, defined as any major change in vehicle speed, attitude or operating condition, and these are of most interest in the evaluation of the fatigue damage accumulated by the structural elements [
26].
Figure 1 shows an example of ECU distribution on tractors and implements on based International Organization for Standardization (ISO) 11783 (Tractors and machinery for agriculture and forestry—serial control and communications data network).
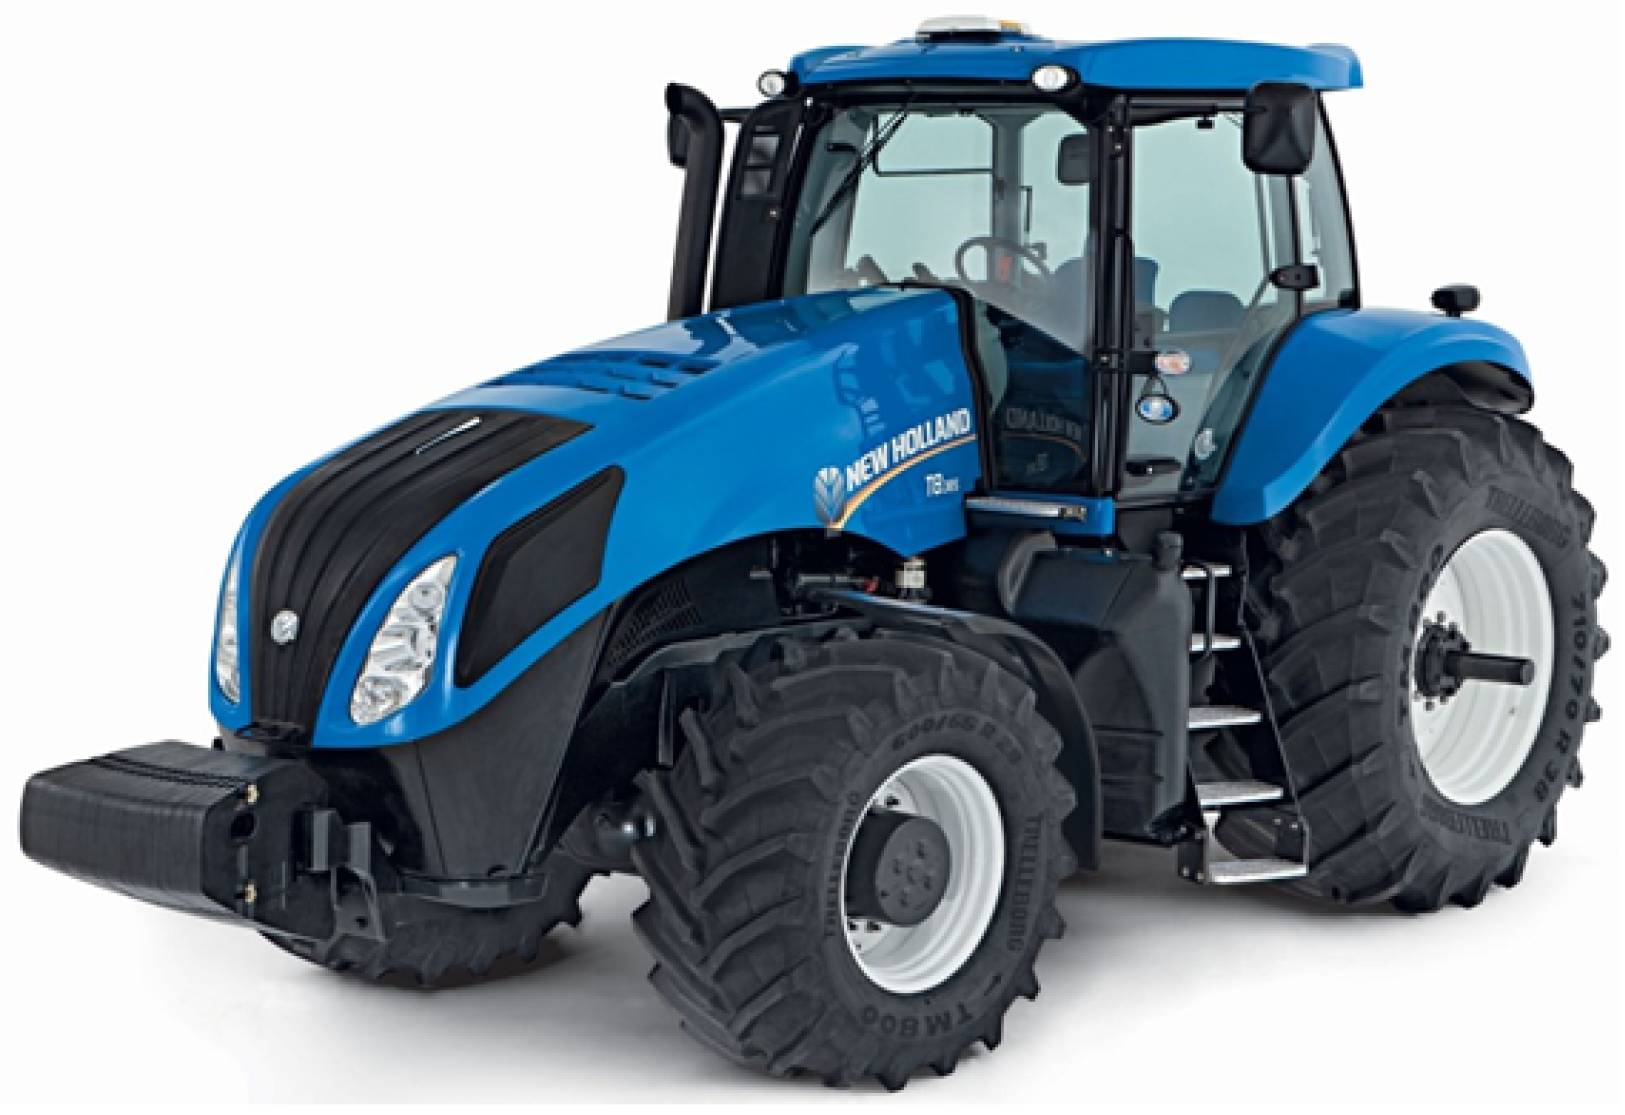
The T8 tractor (
Figure 2) has been developed to meet modern agriculture and demanding producers, and is developed in Brazil. According to the manufacturer, the T8.270 features easy-access maintenance points and longer maintenance intervals [
27], which clearly demonstrates that it is a line of tractors for large-scale productivity, and pressure data of the clutch system used in this work.
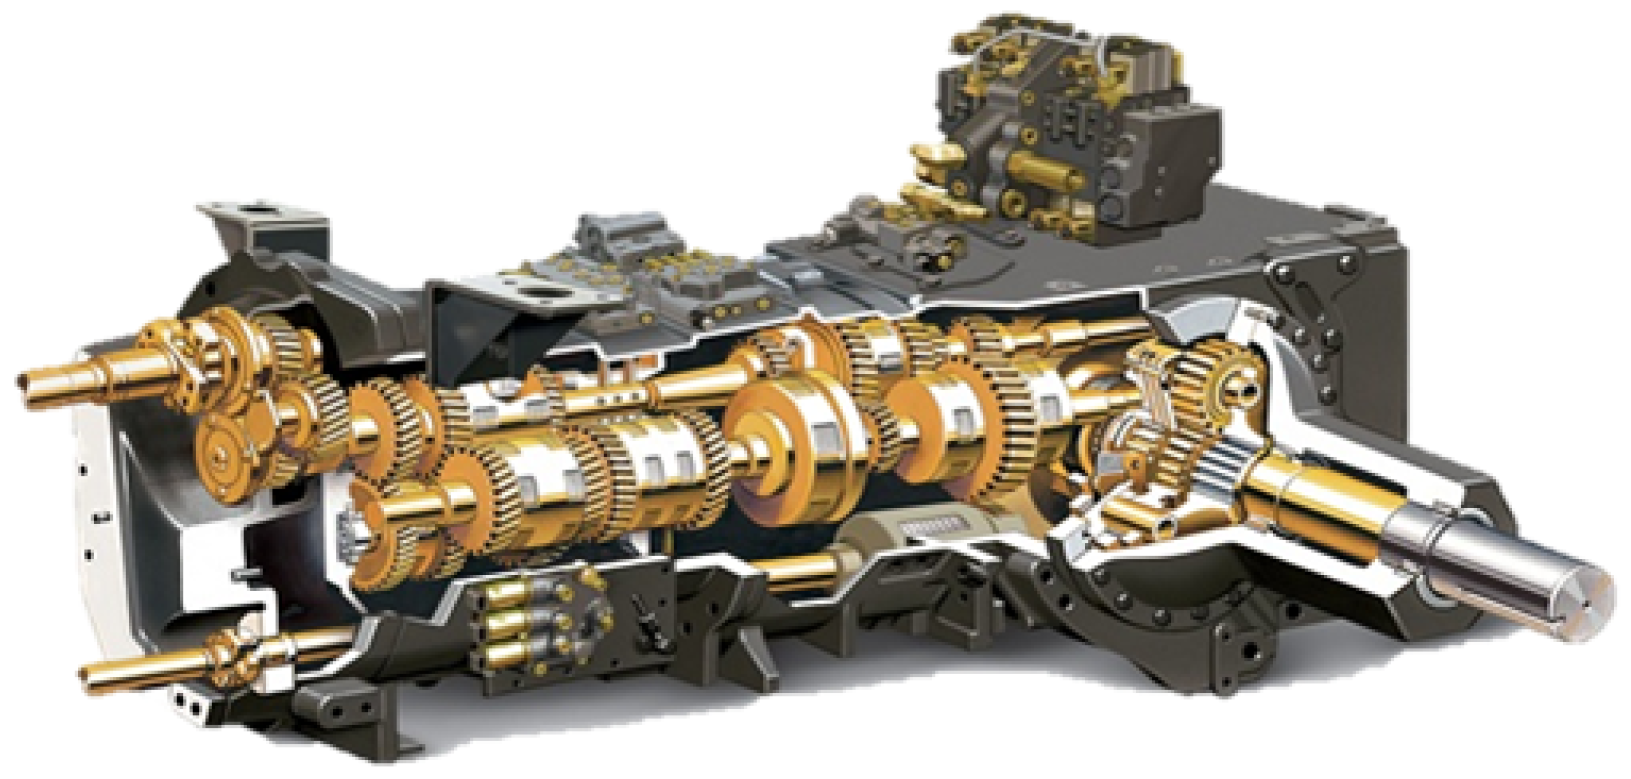
The transmission system (Full Powershift (18 × 4)) of the T8.270 is fully automatic and hydraulic (illustrated in
Figure 3). The Full Powershift (18 × 4) transmission combines its proven efficiency with the ease of operation [
28]. This electronic system is controlled by modules, electro-hydraulic valves, and internal mechanical components.
In
Table 1, the transmission system of the speeds is shown, being eighteen speeds ahead and four speeds aft (18 × 4) (where, C1—1st clutch package, C3—2nd clutch package, C5—3rd clutch package, R1—1st reverse package, R2—2nd reverse package, R3—3rd reverse package and R4—4th back pack). The configuration of this transmission was chosen to meet the requirements of this work and, by having an embedded structure, it allows the reading of important data, such as the pressure generated in the change of gears, management of the combined speed between the engine speed, and the speed in relation to the speed desired.
The clutch has the function of transmitting the power generated in the motor to the gearbox. This clutch allows the gearing of the various gears in a staggered way for the speed and torque distribution. The hydraulic operating pressure of the transmission for each clutch must be between 21 bars and 25 bars. Therefore, it was established during the analysis that measures outside this limit can cause internal transmission failures such as: excessive heating of the discs, drying of the shaft sealing rings and loss of pressure in the clutch packages. These issues can accelerate the rapid wear of the assembly and, in extreme cases, can cause breakage of components of the clutch generating high maintenance costs and excessive interrupt time of tractors.
The data acquisition was carried out from a technical visit to an agricultural property for information acquisition using the software PicoScope6 (version PicoSDK 10.6.12 (64-bit), Manufacturer Pico Technology, Cambridgeshire, UK) on a T8 tractor. The PicoScope hardware in conjunction with PicoScope6 software is capable of recording numerical data and graphically in an internal database, offering greater quality, and precision during the diagnosis of the collected pressure data.
In order to acquire the data a technical assistance team used indispensable tools in this activity such as: PicoScope hardware and software, hydraulic jack to suspend the tractor, wrenches to access pressure gauges (electrical terminals for fitting test cables hardware PicoScope) transmission and other assistance tools to perform the maintenance intervention.
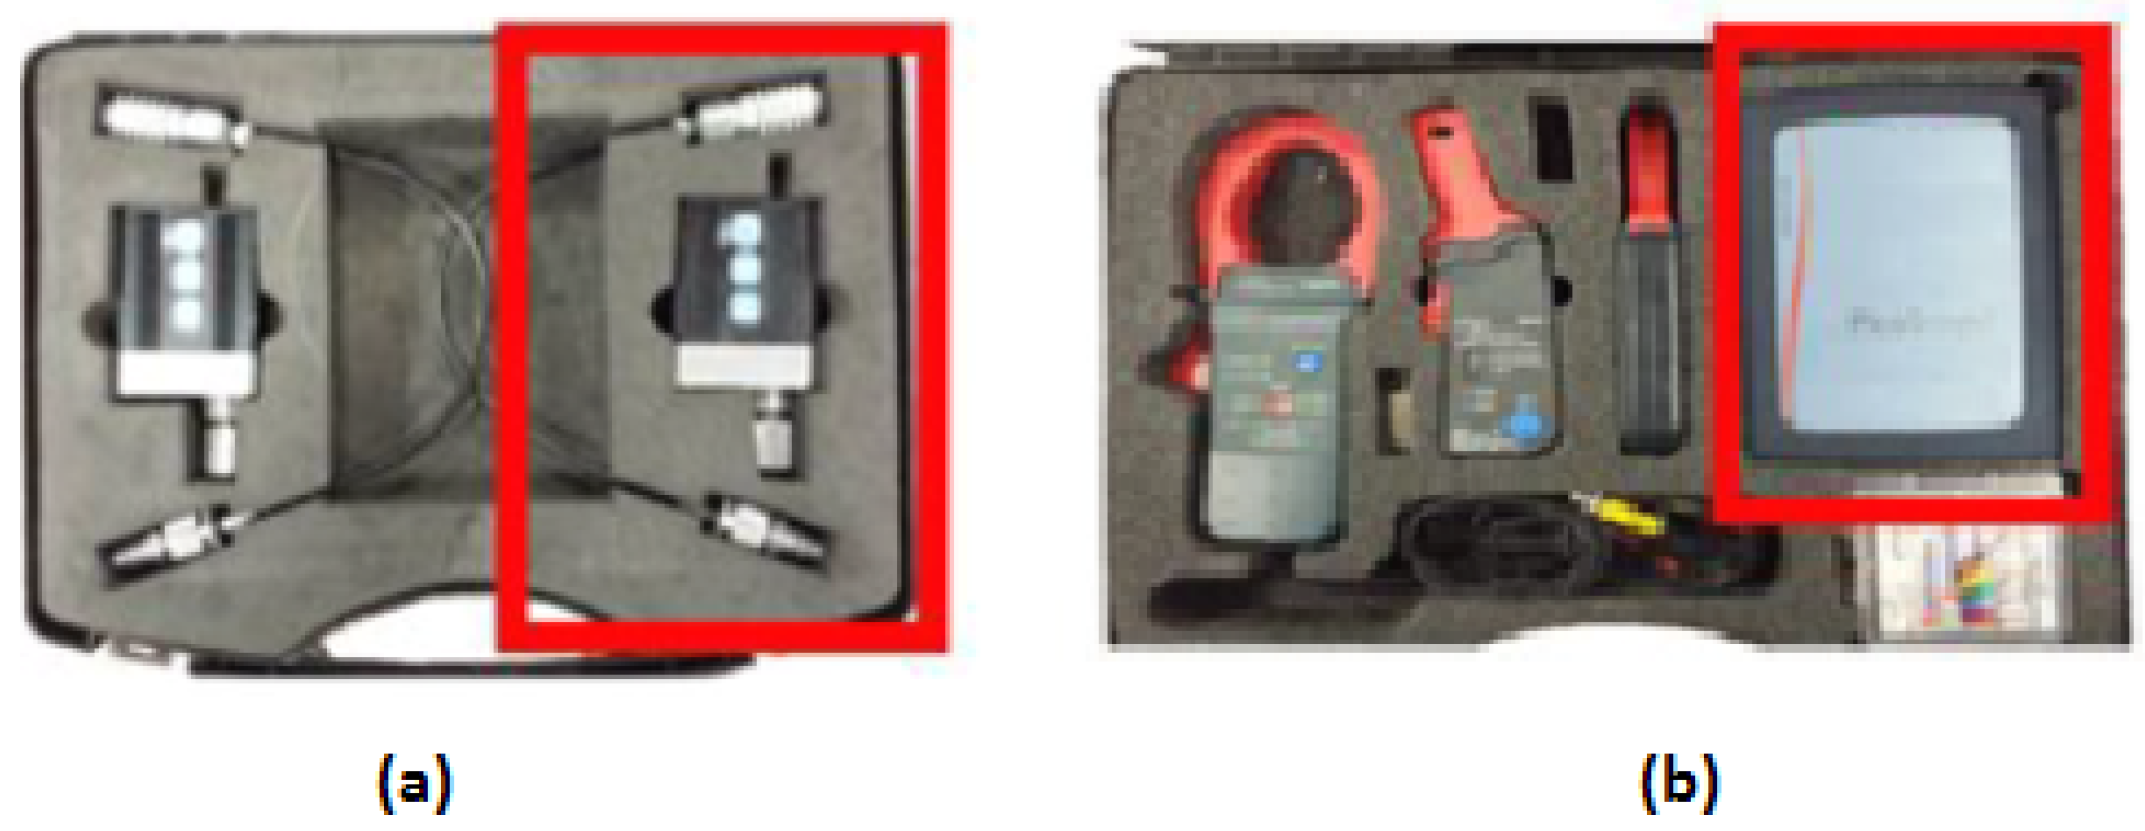
Figure 4 presents the (a) pressosts which act as a digital pressure gauge responsible for collecting the hydraulic pressure, which is connected in with the four pressure gates, and allows the simultaneous readings of pressure points, and (b) hardware PicoScope. PicoScope is compatible with several types of tractor, since correct plug-in coupling plug (flat sealing) being coupled in the clutch system, and then connect with pressosts.
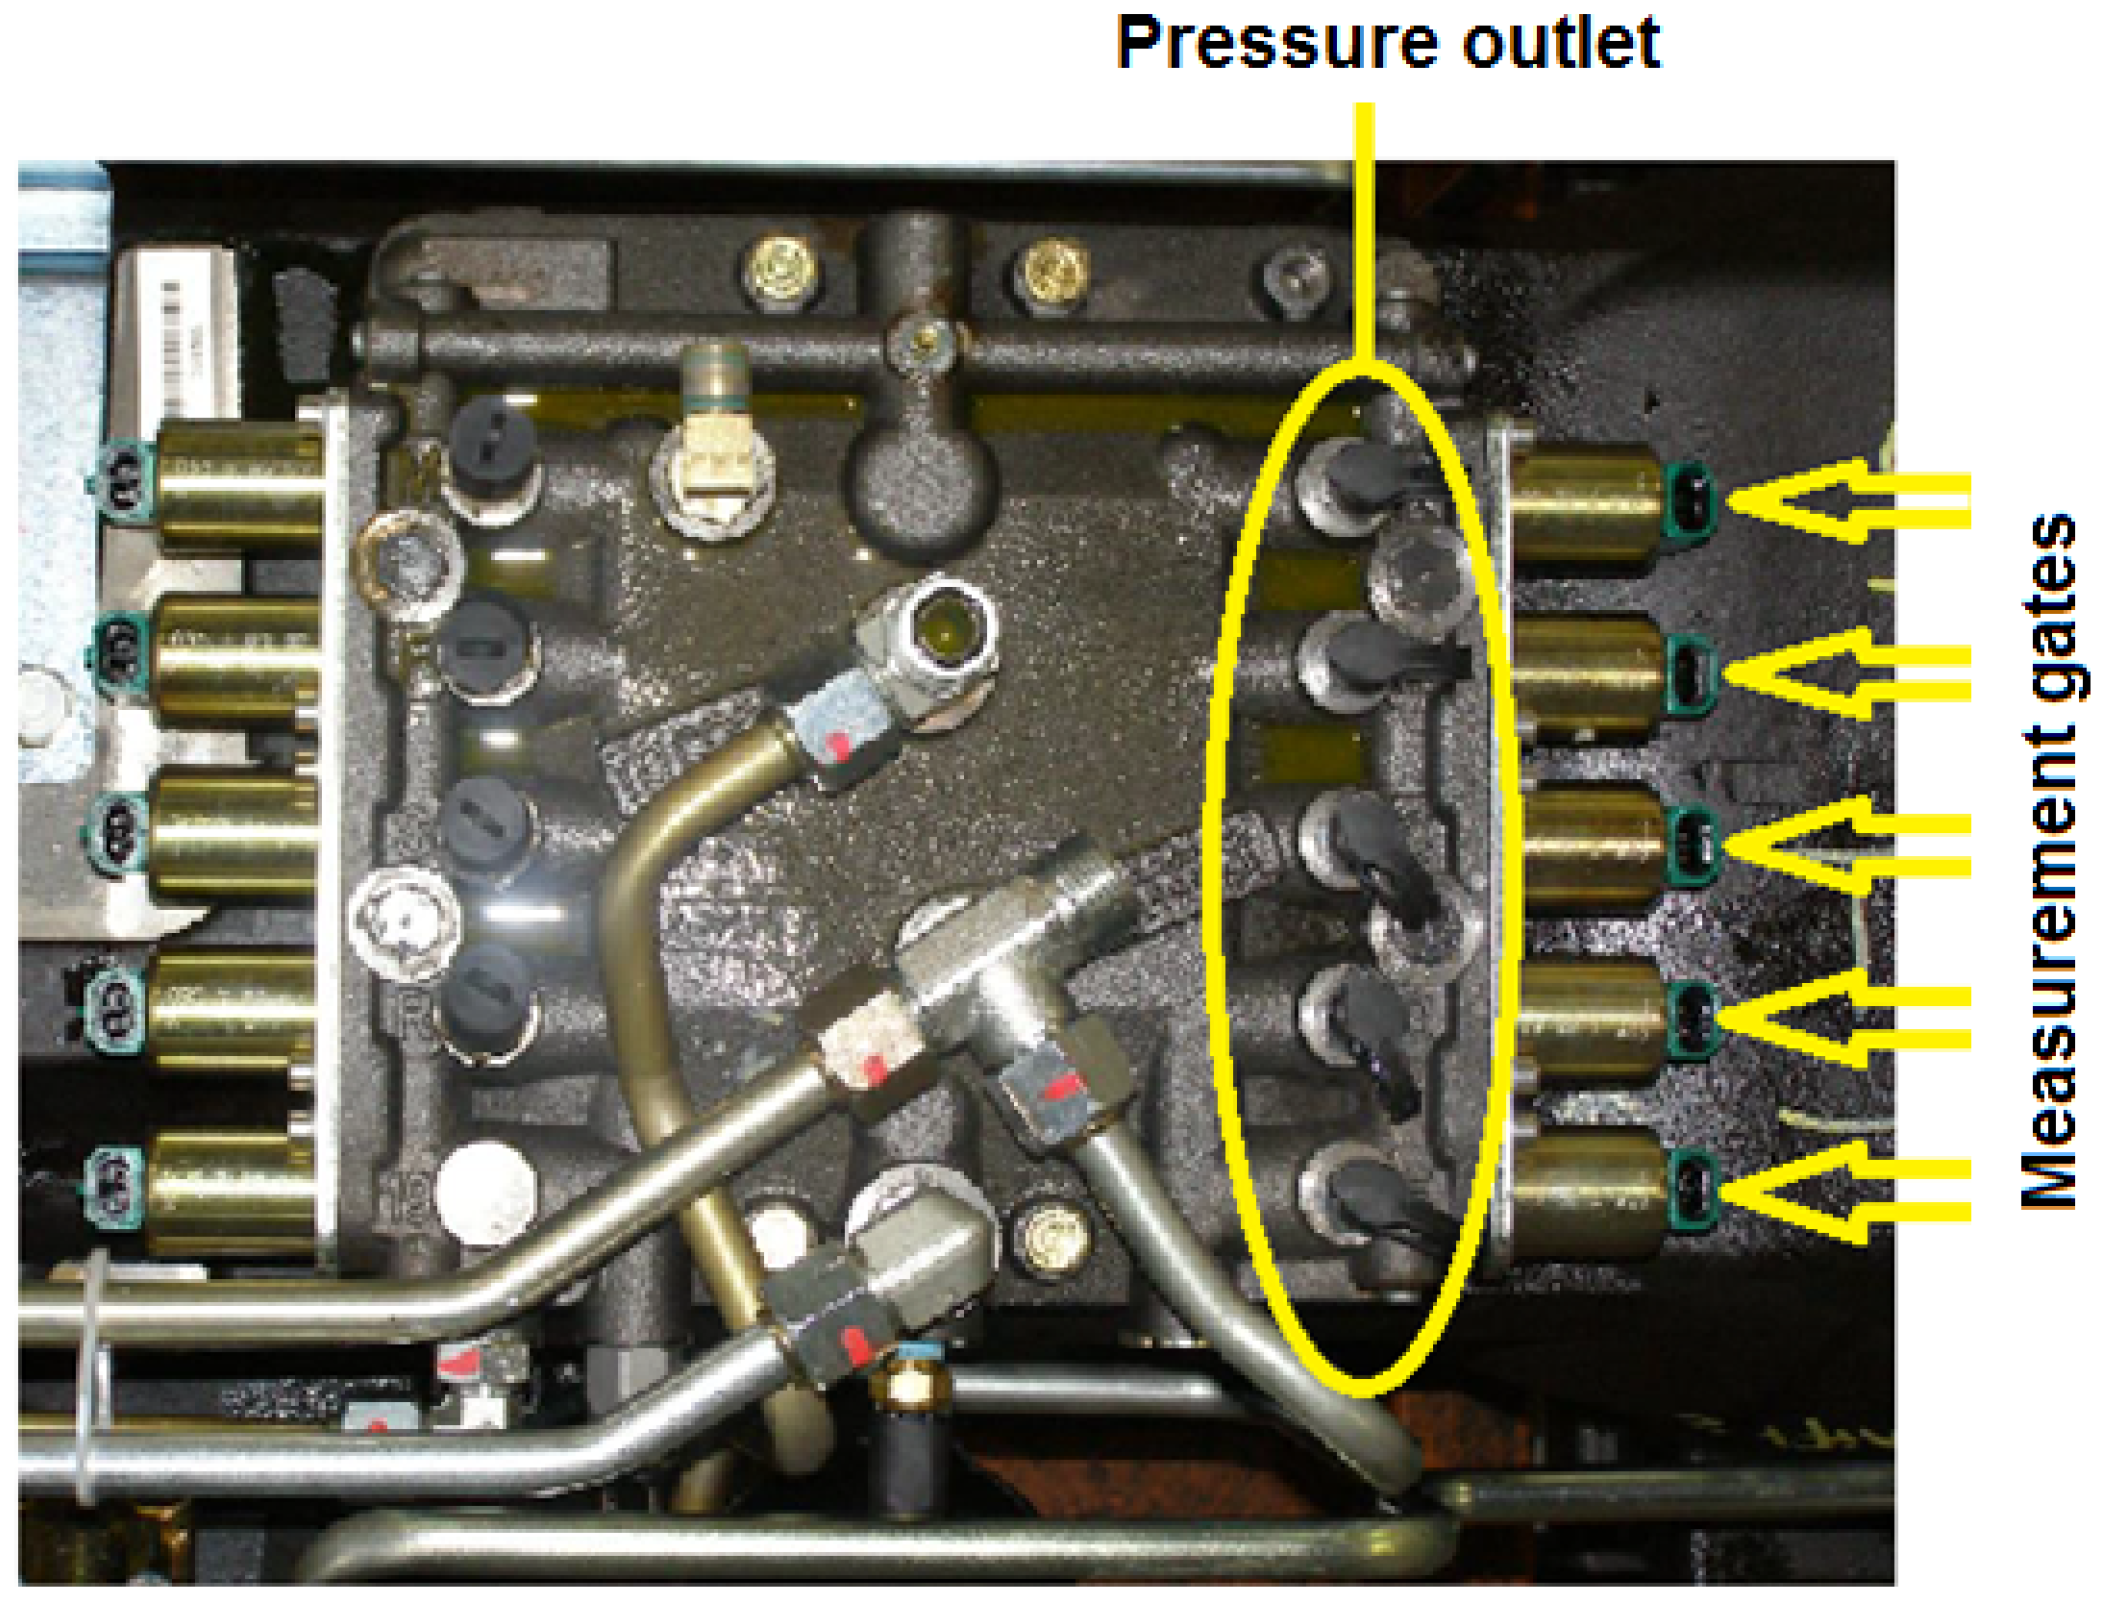
At first, all the useful information of the tractor was obtained as: chassis, hourmeter, transmission specifications and engine specifications that are used to present in the final technical report. For data collection, it was necessary to access the pressure gates (
Figure 5) on the speed valves located next to the main fuel tank and on the speed range valve located between the transmission and the tractor cab. On the pressure gates, a quick-fit coupling was required.
After the quick couplings (nine clutches for measurement) were installed, one of the rear sides of the tractor was suspended to perform the work simulation by physically shifting the gears. The gearshift took place individually because the tractor has independent brakes for each wheel. It was possible to brake on one side and transfer all power to only one side. As the tractors have an auxiliary front wheel drive, it was switched off during the test.
Using four pressure switches that act as a digital pressure gauge, the pressure readings were taken simultaneously to determine the hydraulic pressure. The PicoScope has four independent signal inputs for each switch, connecting the PicoScope hardware via the USB cable to the notebook with the Picoscope software6.
After collecting the pressure switches on the tractor, data collection of C1, C3, and C5 were referred to as transmission test 1. The transmission test 2 corresponded to the tests of the Low Gama clutches, Medium Gama, High Gama, and Main Clutch (1st to 18th gear). Transmission test 3 corresponded to the evens and odd clutches.
From the results diagnosed by the PicoScope6 software, a technical report was issued with the final result of the pressurizing behavior of the transmission clutch packages in relation to the pressurizing, compared with the ideal engineering parameters of the plant. The results were analyzed according to the operation of the transmission, according to: high and low peaks of pressure, low pressure and oscillations in the system. The results were interpreted, analyzed and compared to those described in the manufacturer’s manual [
28].
The value in Reals (Brazilian currency, BRL), and the reappearance time were estimated from the values tabulated and practiced by the manufacturer of the tractor. In addition, it included respective values in Euro (EUR) and Dollar (USD) in order to allow an easy comparison with other nations. In addition to the parts, the value of the labor service was also added to perform the necessary repairs. As a comparison, a study was carried out based on the exchange of all components of the clutch system where the origin of the problem is not known (without the use of software), compared to the specific exchange of the components that affected and gave rise to the problem. In this case, it is expected that the specific identification of the source of the problem will reduce the cost in Reals from the reduction of parts and also in the time of repair.
In the end, the availability (A) corresponding to the fraction of time in hours that the system is available to run obtained through Equation (
1) was calculated [
29]:
where A is availability, MTBF is mean time between failures and MTTR is mean time to repair.
The MTTR value was obtained through the repair times for the scenario with and without the use of the diagnostic tool and the MTTR was varied for different times between failures defined in 10, 50, 100, 150, 200, 400, 700 and 1000 h of operation until failure occurs.
3. Results
Pressure parameters are presented in graph format generated in the software itself, which allows a better interpretation of the behavior of the gearshifts existing in the operation of the tractor and how this behavior affects the transmission system as a whole.
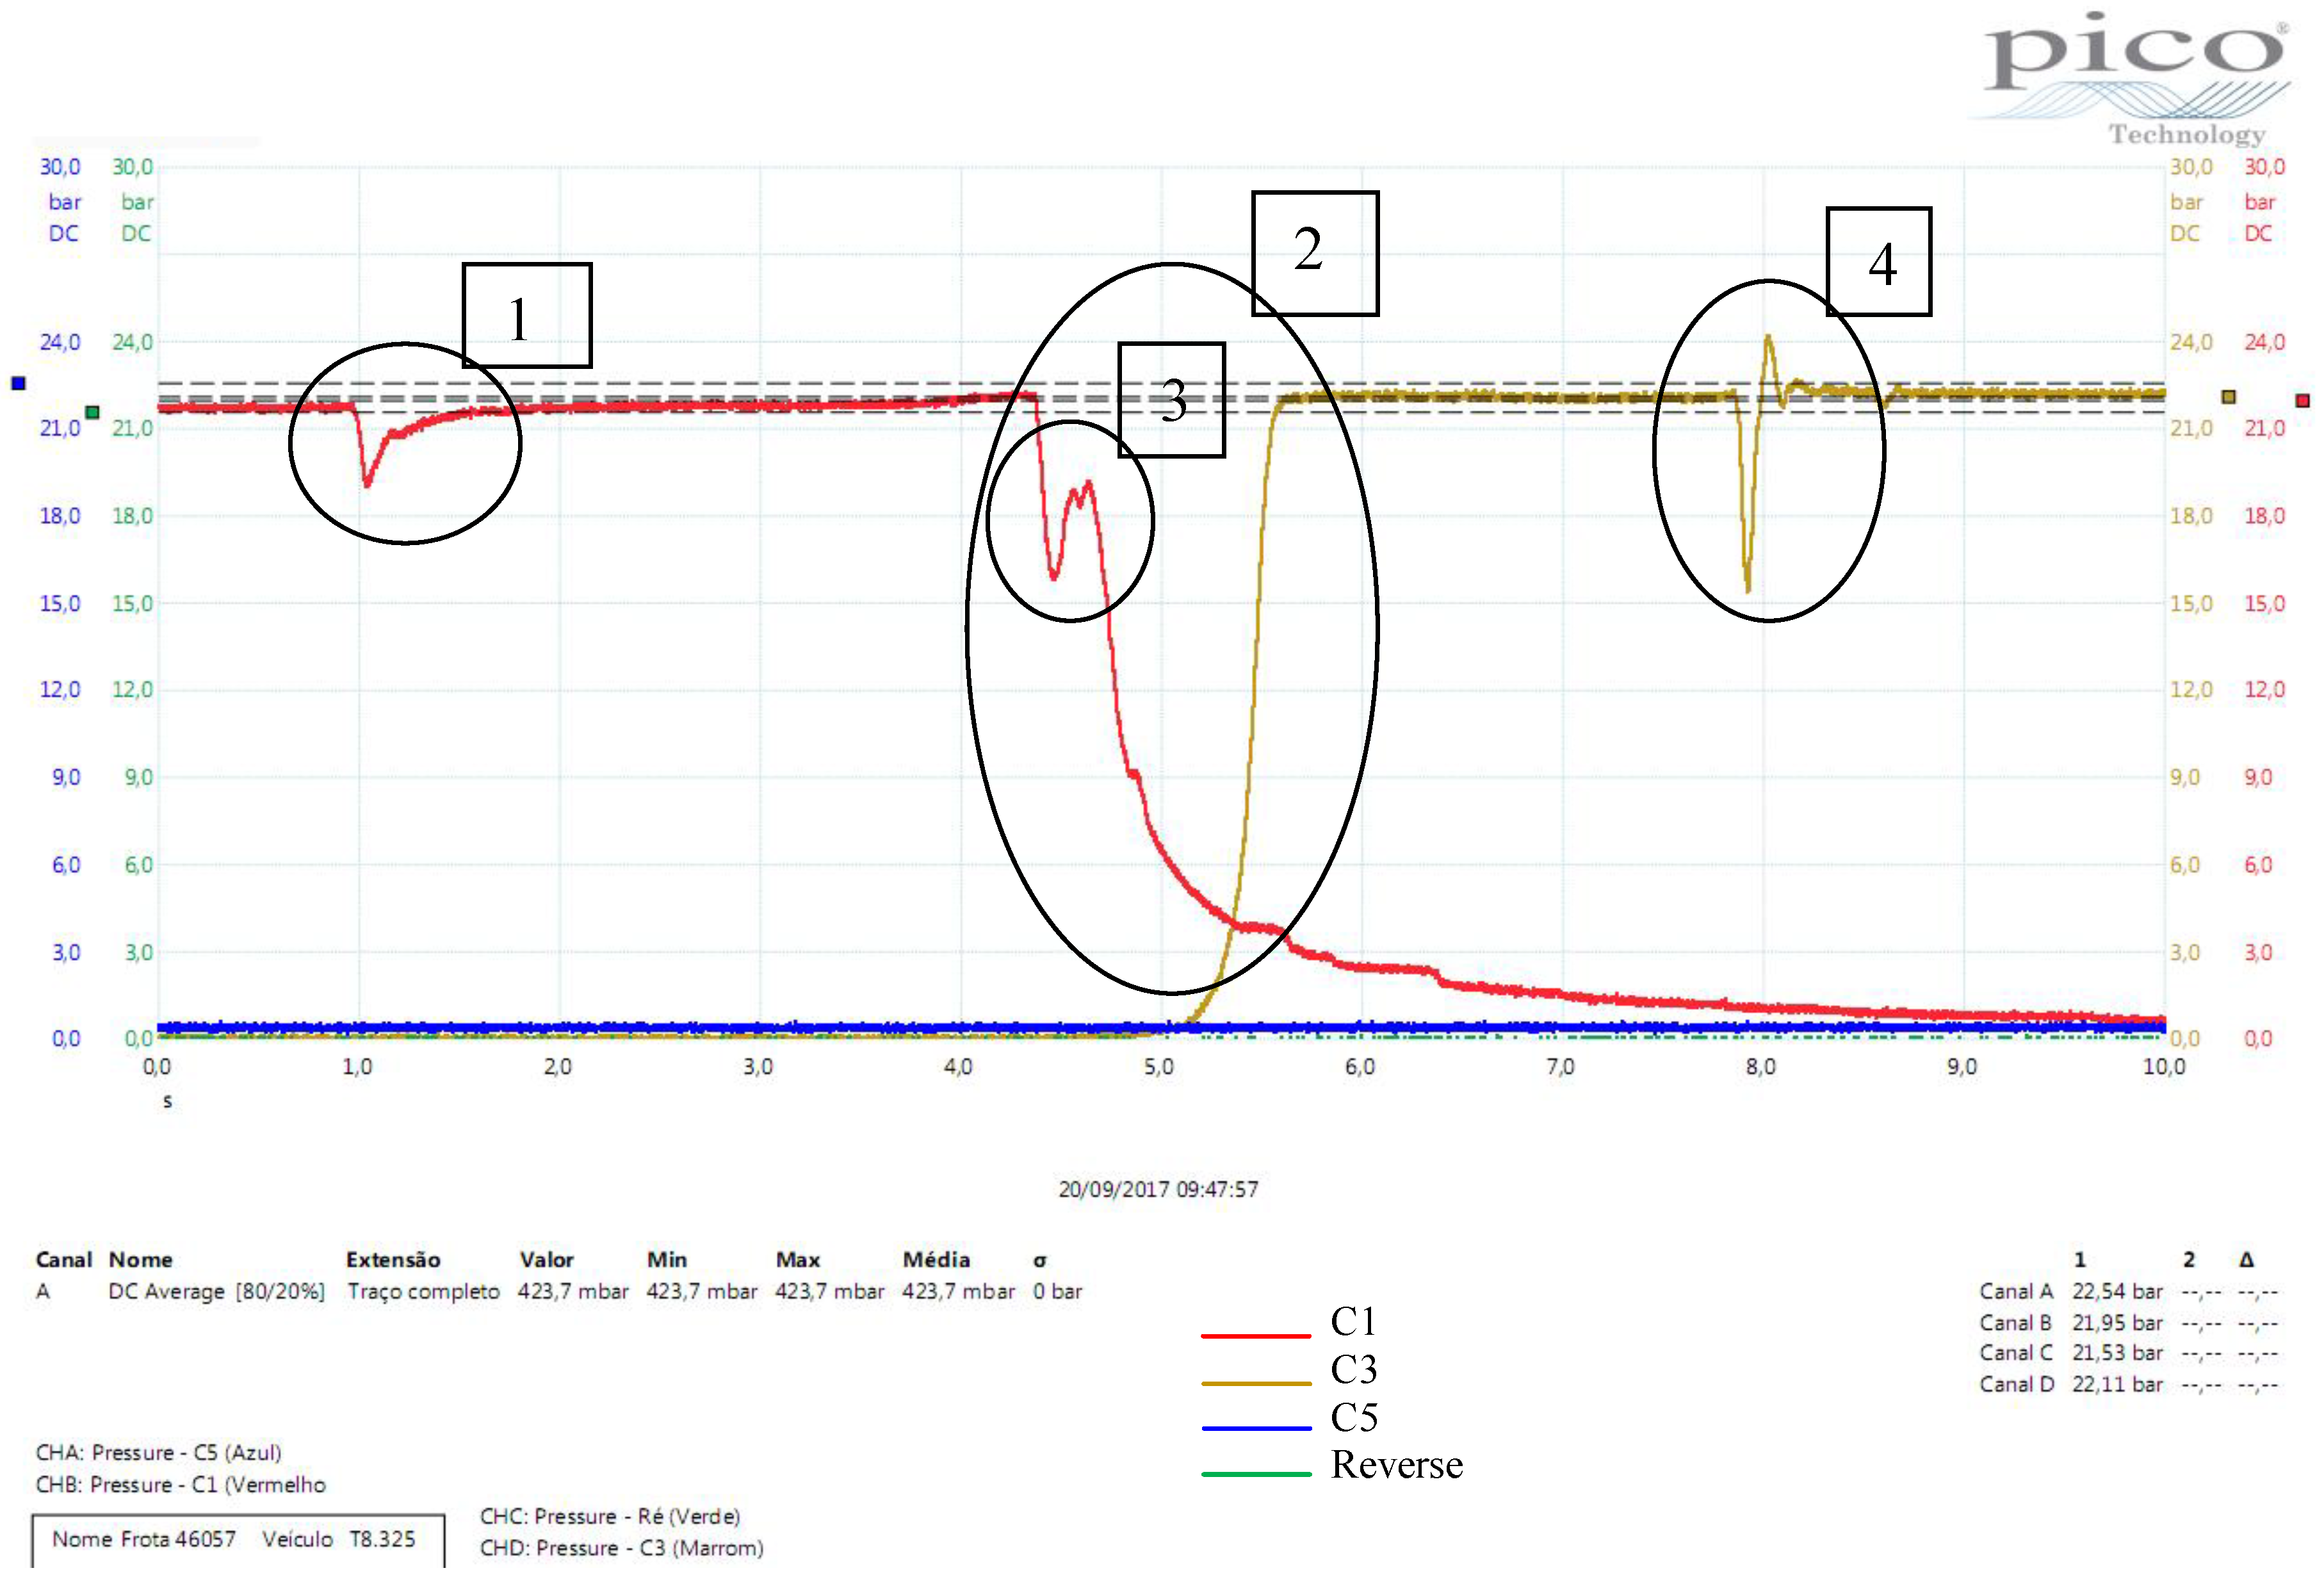
The graph of
Figure 6 shows the measurements performed for the exchanges of packages C1 and C3 of the clutch system. The numeral 1 represents a gear change (red line) of clutch pack C1 from Odd but not a clutch exchange of the already pressurized package. Number 2 represents the clutch exchange from C1 to C3 (brown line), which will make the next transmission speeds; in this case, C1 is depressurised and the package C3 is pressurized. The number 3 shows a small variation due to the pressure compensation that the transmission module performs so that there is no change in gear due to an internal pressure leakage. This leakage is the internal leakage of pressure in the pressure line of the hydraulic system that is not reaching the ideal pressure, between 21 and 25 bars. The blue and green lines represent, respectively, C5 and R6 packets that were not fired in this test.
The numbers 1 and 4 represent a gear change within each package and indicate that this variation is expected due to other packages emptying and filling soon thereafter. The pressure variation should always be less than 10 bars of deviation; otherwise, leaps would occur during the gear changes causing long-term problems. The variation was greater for the C3 package, between 15.5 and 24.5 bars, than for the C1 package, with a variation between 18.7 and 21.95 bars, due to the existence of a small internal leak of the package of C3. It was observed that the gear change time occurs in milliseconds, which justifies the use of the PicoScope6 software, since a conventional analog pressure gauge would not be able to measure the gear shift time or the peak pressure.
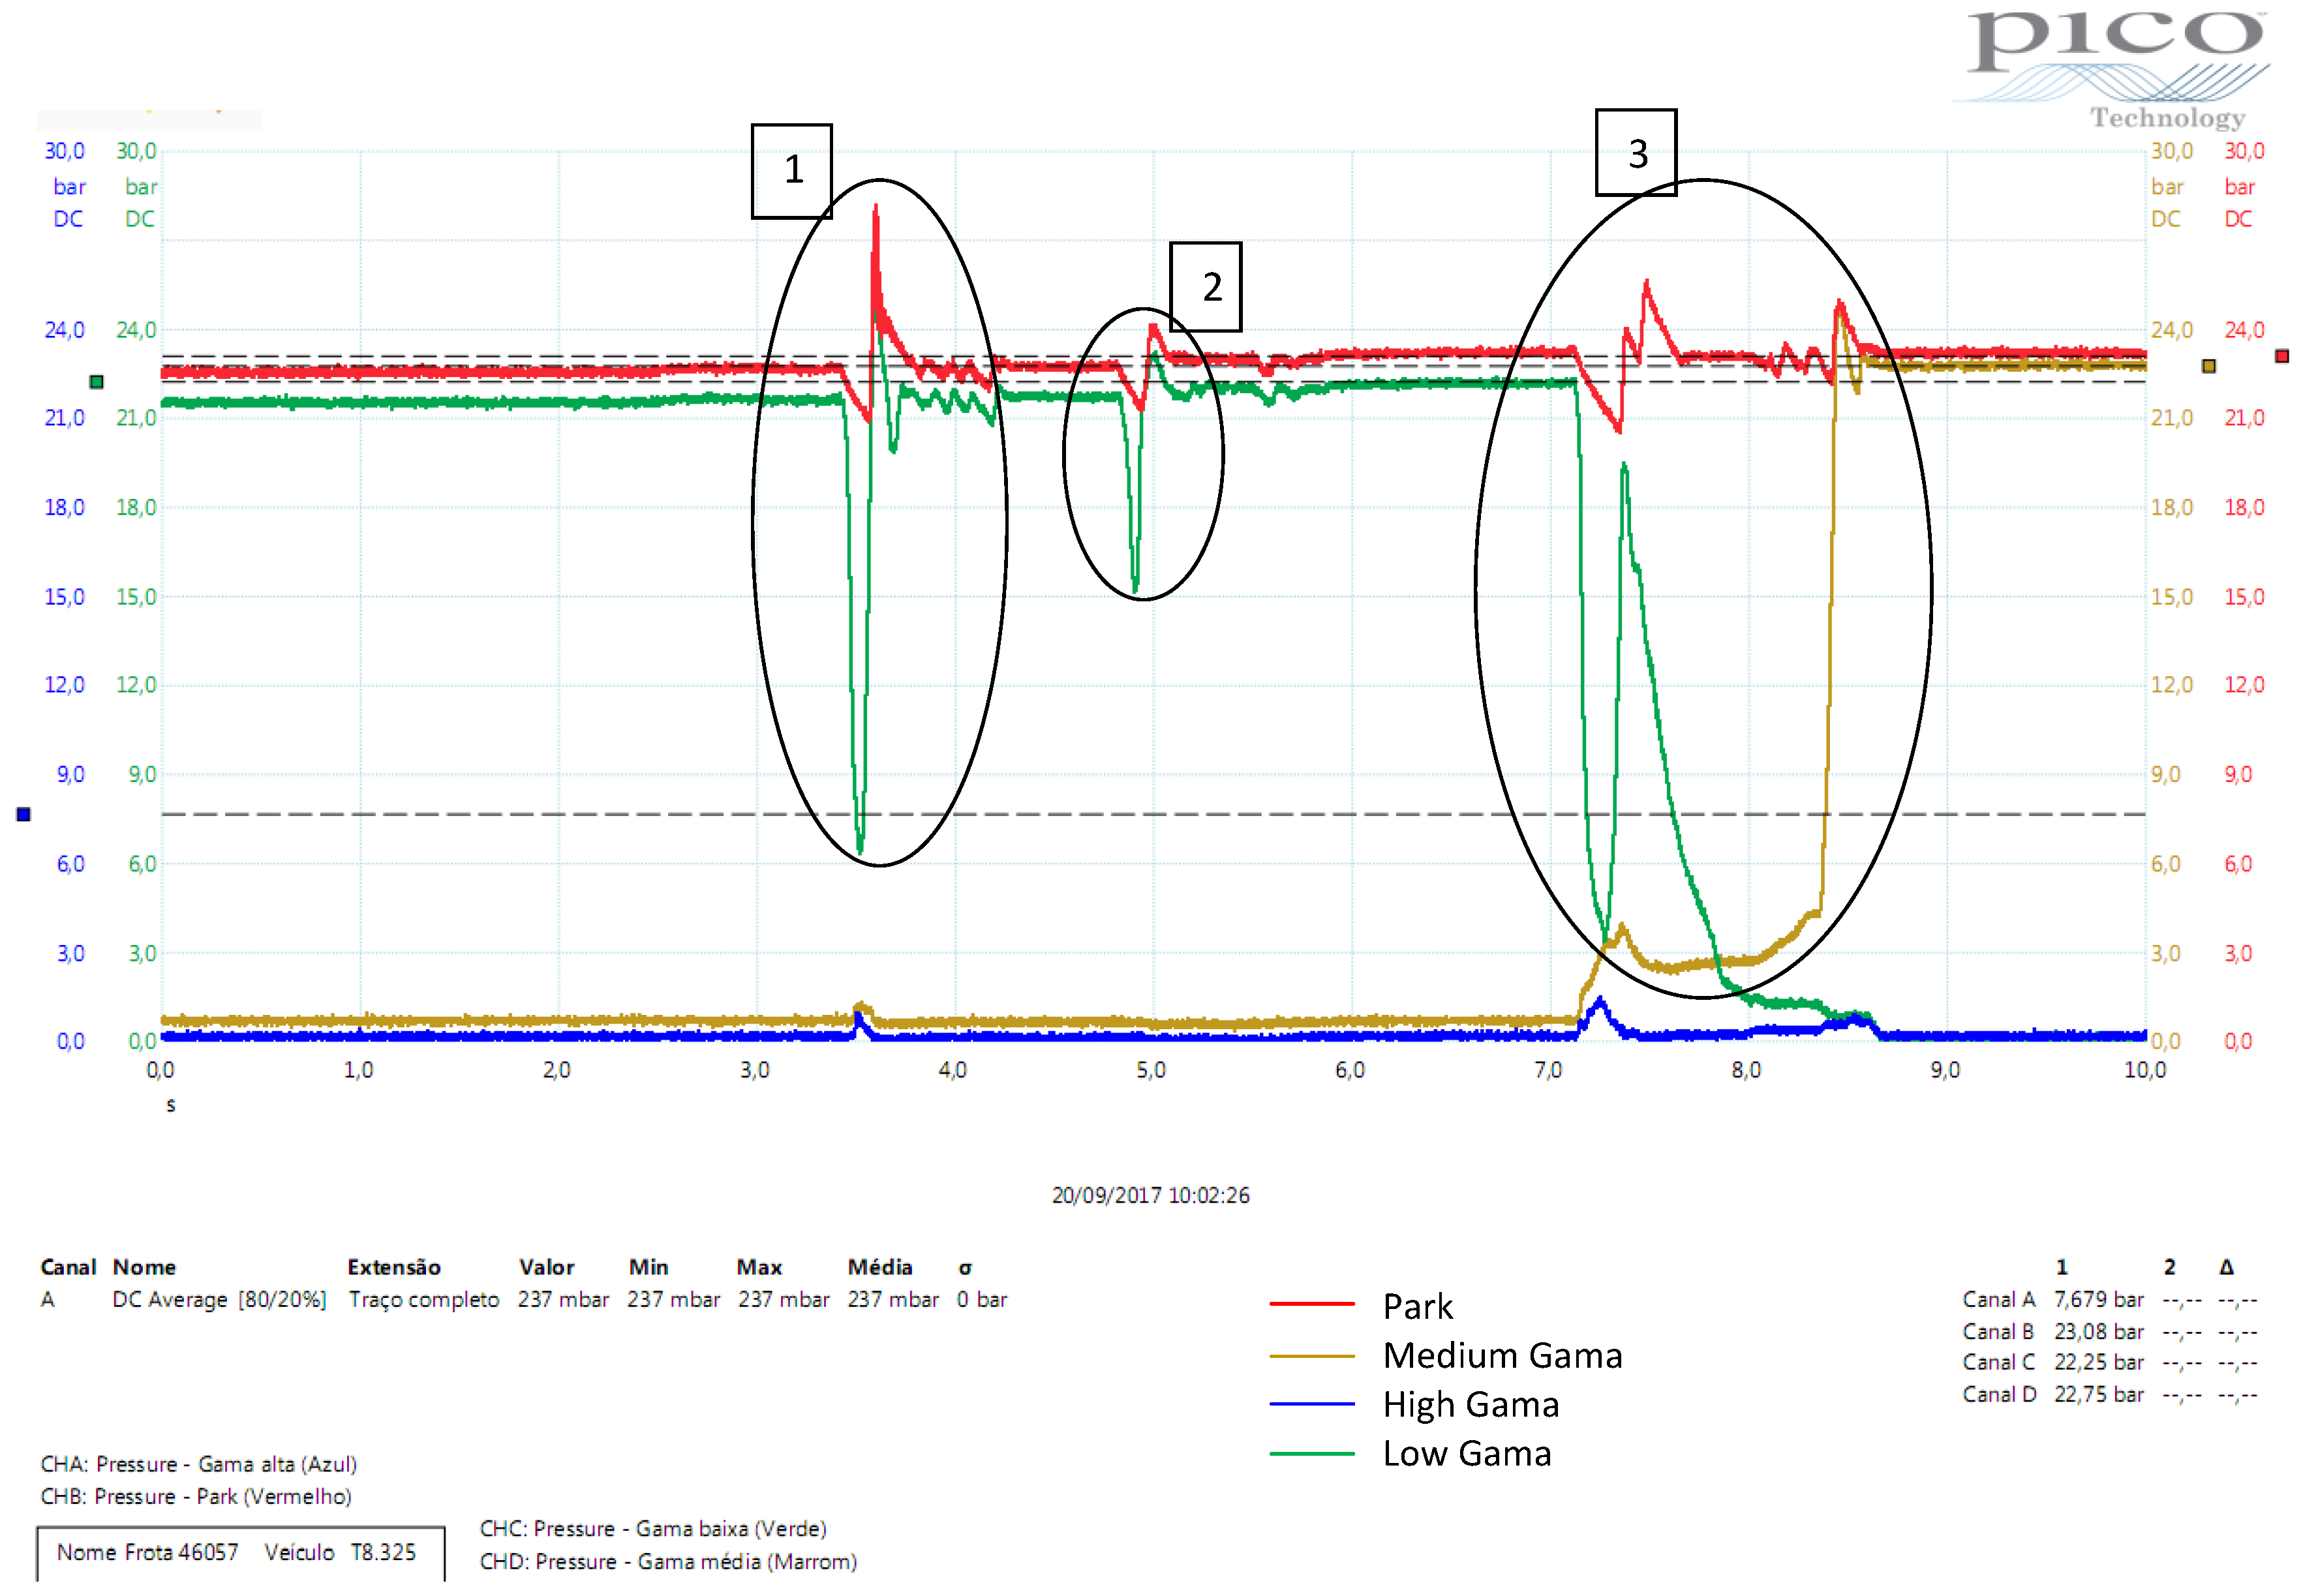
In the graph shown in
Figure 7, the low Gama clutch represented by the green line corresponds to the 1st to the 7th gears. The number 1 represents a gear shift from 4th to 5th, or clutches C3 to C5, and a variation of more than 10 bars is also noted, which is critical since it should have a linearity of pressure even during the shift of 4th gear for 5th. The number 2 represents the change of gears from odd to even, which is a small acceptable variation. The most critical number 3 shows that there is a malfunction that may be an internal pressure leak since the module has made a pressure compensation because the gear shift is not synchronized due to pressure leakage that, when switching from low Gama to medium Gama, tends to normalize.
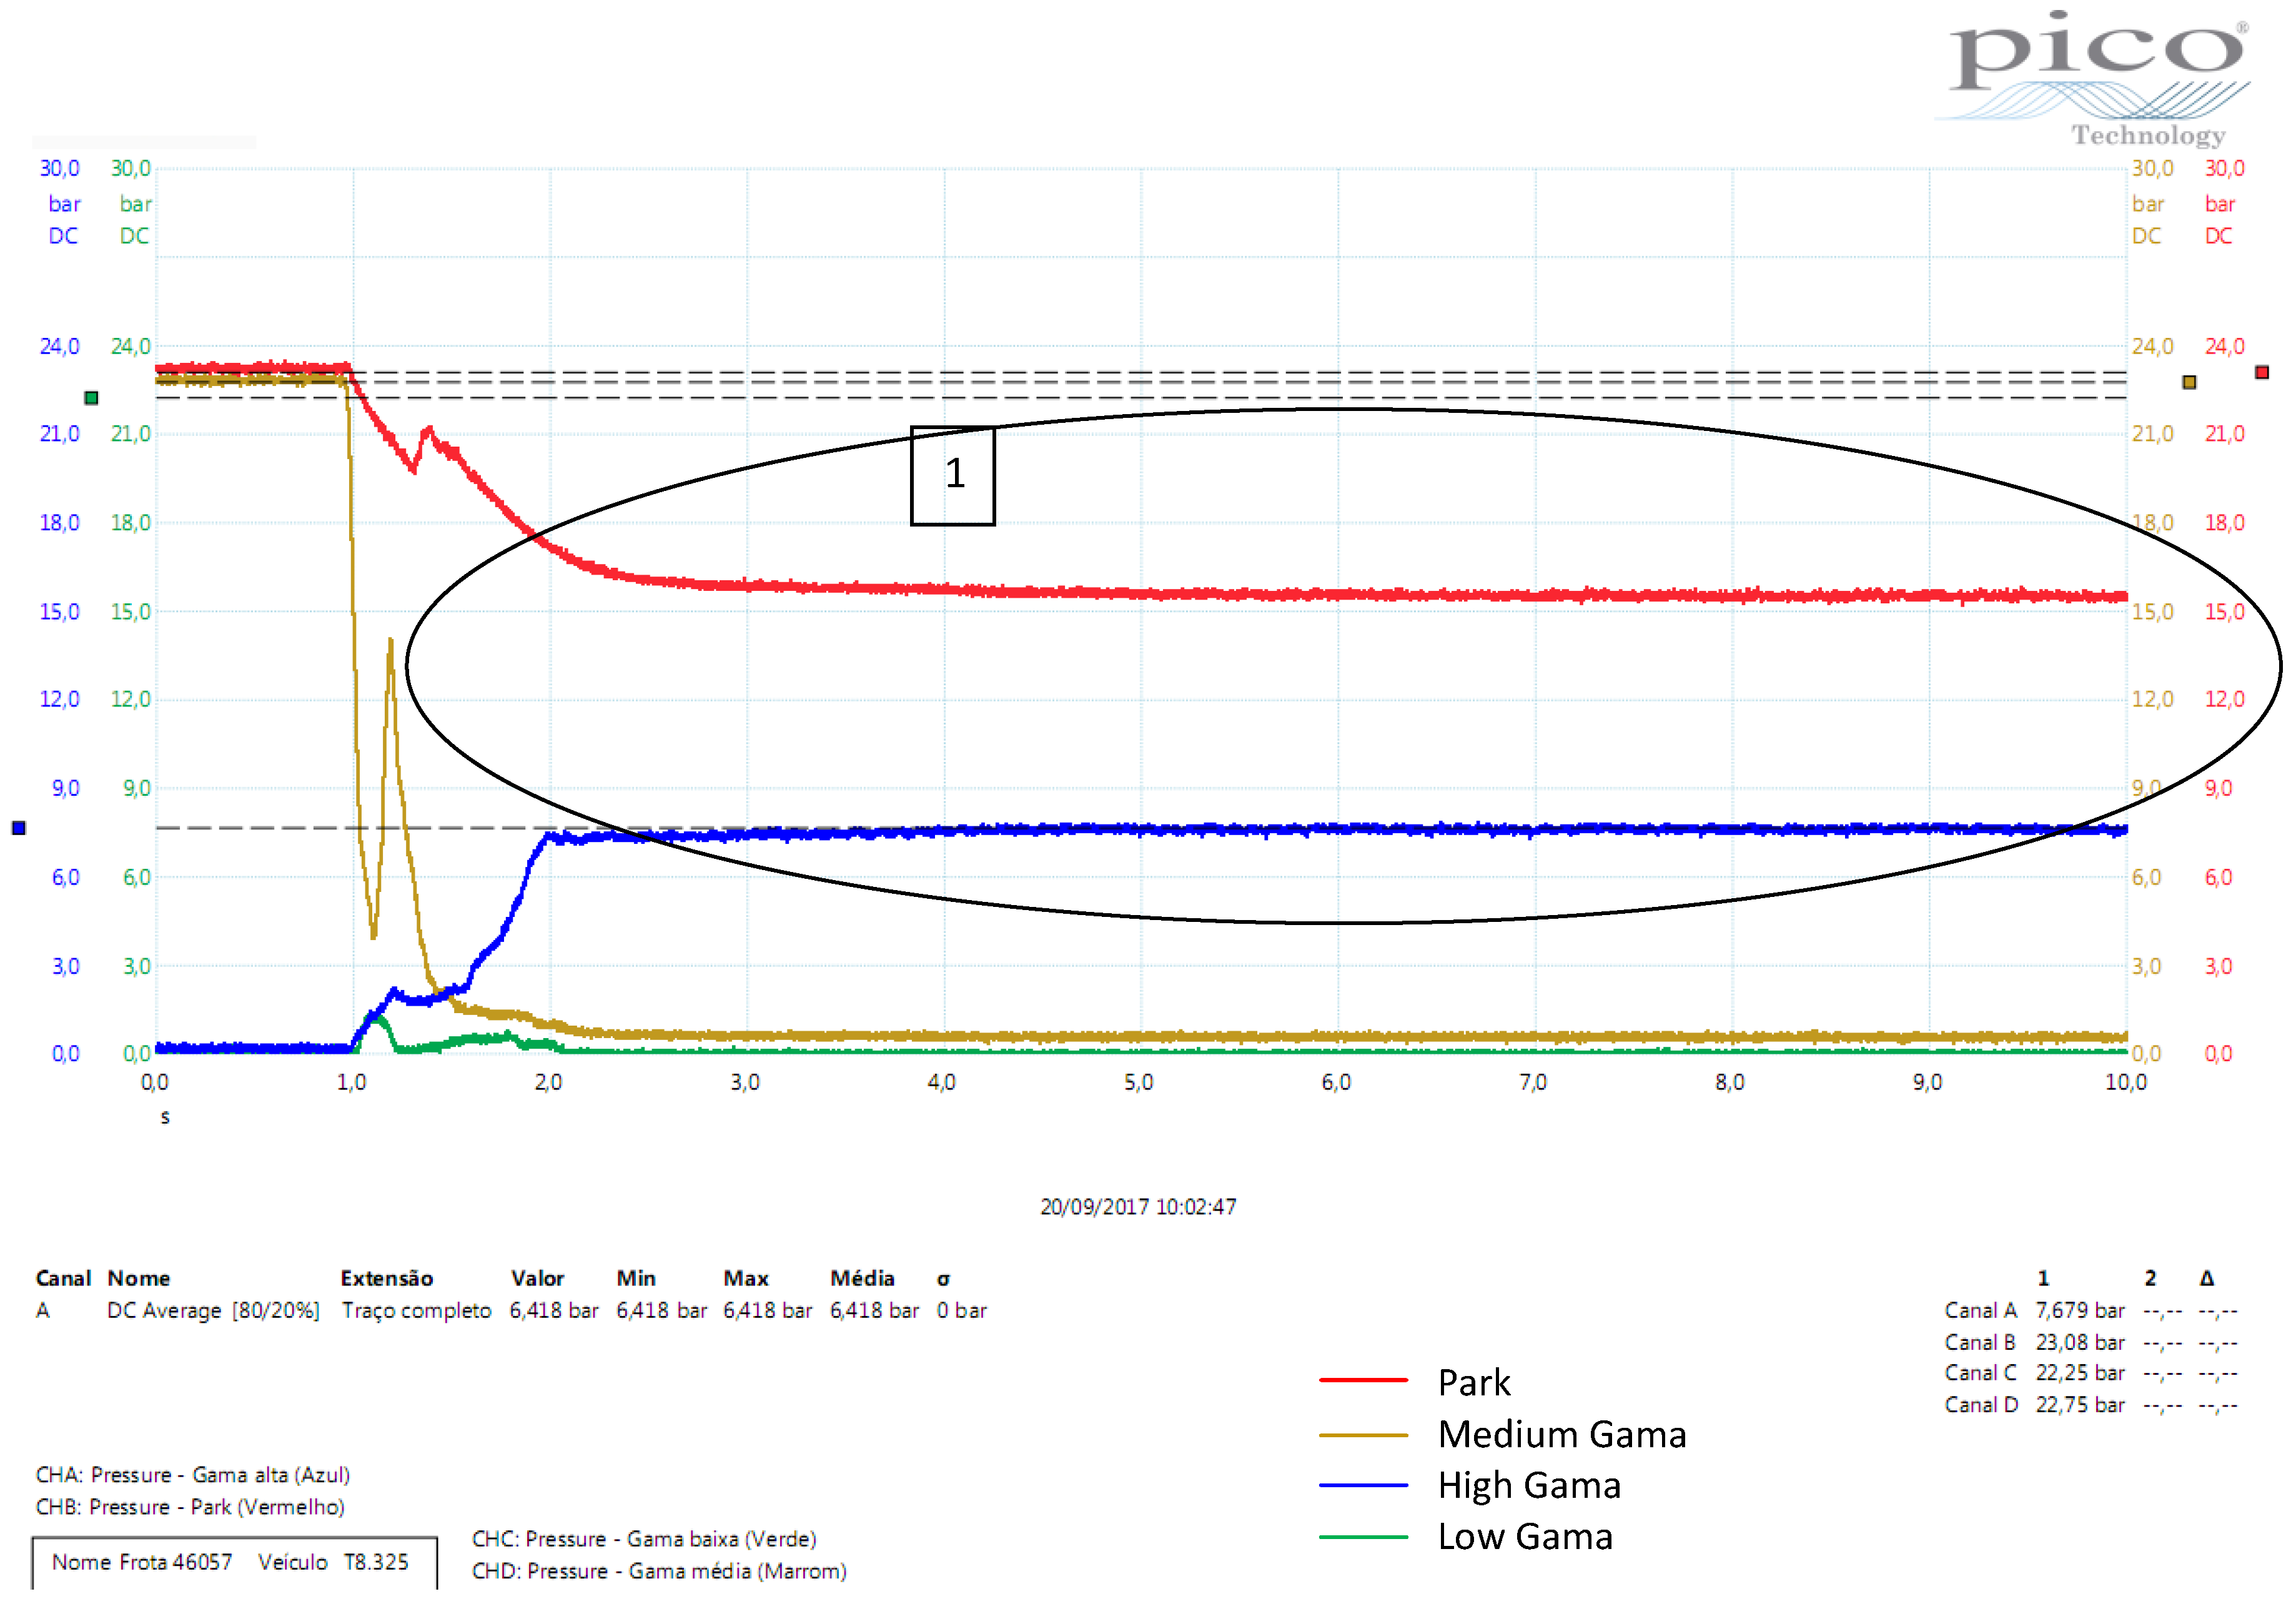
Finally, in
Figure 8, the high Gama is represented by the blue line. In addition, because it does not reach the optimum pressure, there is an indication of an internal fault in the teflon ring located on the main clutch axis at number 1. This is because the pressure of 7.679 bars does not allow the 13th to 18th gear to be engaged, the parking system is represented by the red line, depressurising the system so that there is no more serious damage inside the transmission. The low Gama (green line) and medium Gama (brown line) were not pressurized due to the logic of the tractor software, as these only engage the 1st to 12th gears.
In order to highlight the advantages of the PicoScope6 software, a comparative study was carried out between the maintenance costs of the T8 model with and without the diagnostic tool. Under conditions where diagnostic computer tools are generally not used and references are available from the manufacturer’s service manuals, the required quantity of components to be changed is approximately 31 parts. When analyzing the number of parts exchanged when using the PicoScope6 diagnostic tool, the number reduces to five pieces. Based on this analysis, the parts identified through the diagnostic software were exchanged by the responsible team. This reduction in the number of pieces generated a considerable savings in time of the exchange of each piece and in the specialized workmanship necessary to perform the maintenance. The time needed to change the 31 pieces would be approximately 67.6 h, in exchange for the exchange of the five pieces identified it took only 8 h.
The analysis of the use of the software PicoScope6 allowed for identifying the problem in one of the remote electro-hydraulic valves of the clutch systems C1, C3, C5 and Reverse. In the scenario using the diagnostic software, the need to replace the five parts resulted in a total value of R
$45.52 (EUR €10.60 or USD
$12.06), requiring 8 h of labor to replace them, equivalent to one day’s work or R
$984.00 (EUR €229.10 or USD
$260.72), totaling between pieces and labor the value of R
$1029.52 (EUR €239.70 or USD
$272.78) for maintenance of the tractor model T8 as presented in
Table 2.
In the analysis of maintenance data without the use of PicoScope6 software, a total of 31 tractor pieces was identified, which added up to a total of R$7208.37 (EUR €1678.31 or USD $1909.89) that would have to be exchanged using 67.6 h of labor equivalent to 8.45 daily at cost of R$8314.80 (EUR €1935.92 or USD $2203.05), totaling R$15,523.17 (EUR €3614.24 or USD $4112.94) for maintenance of the machine.
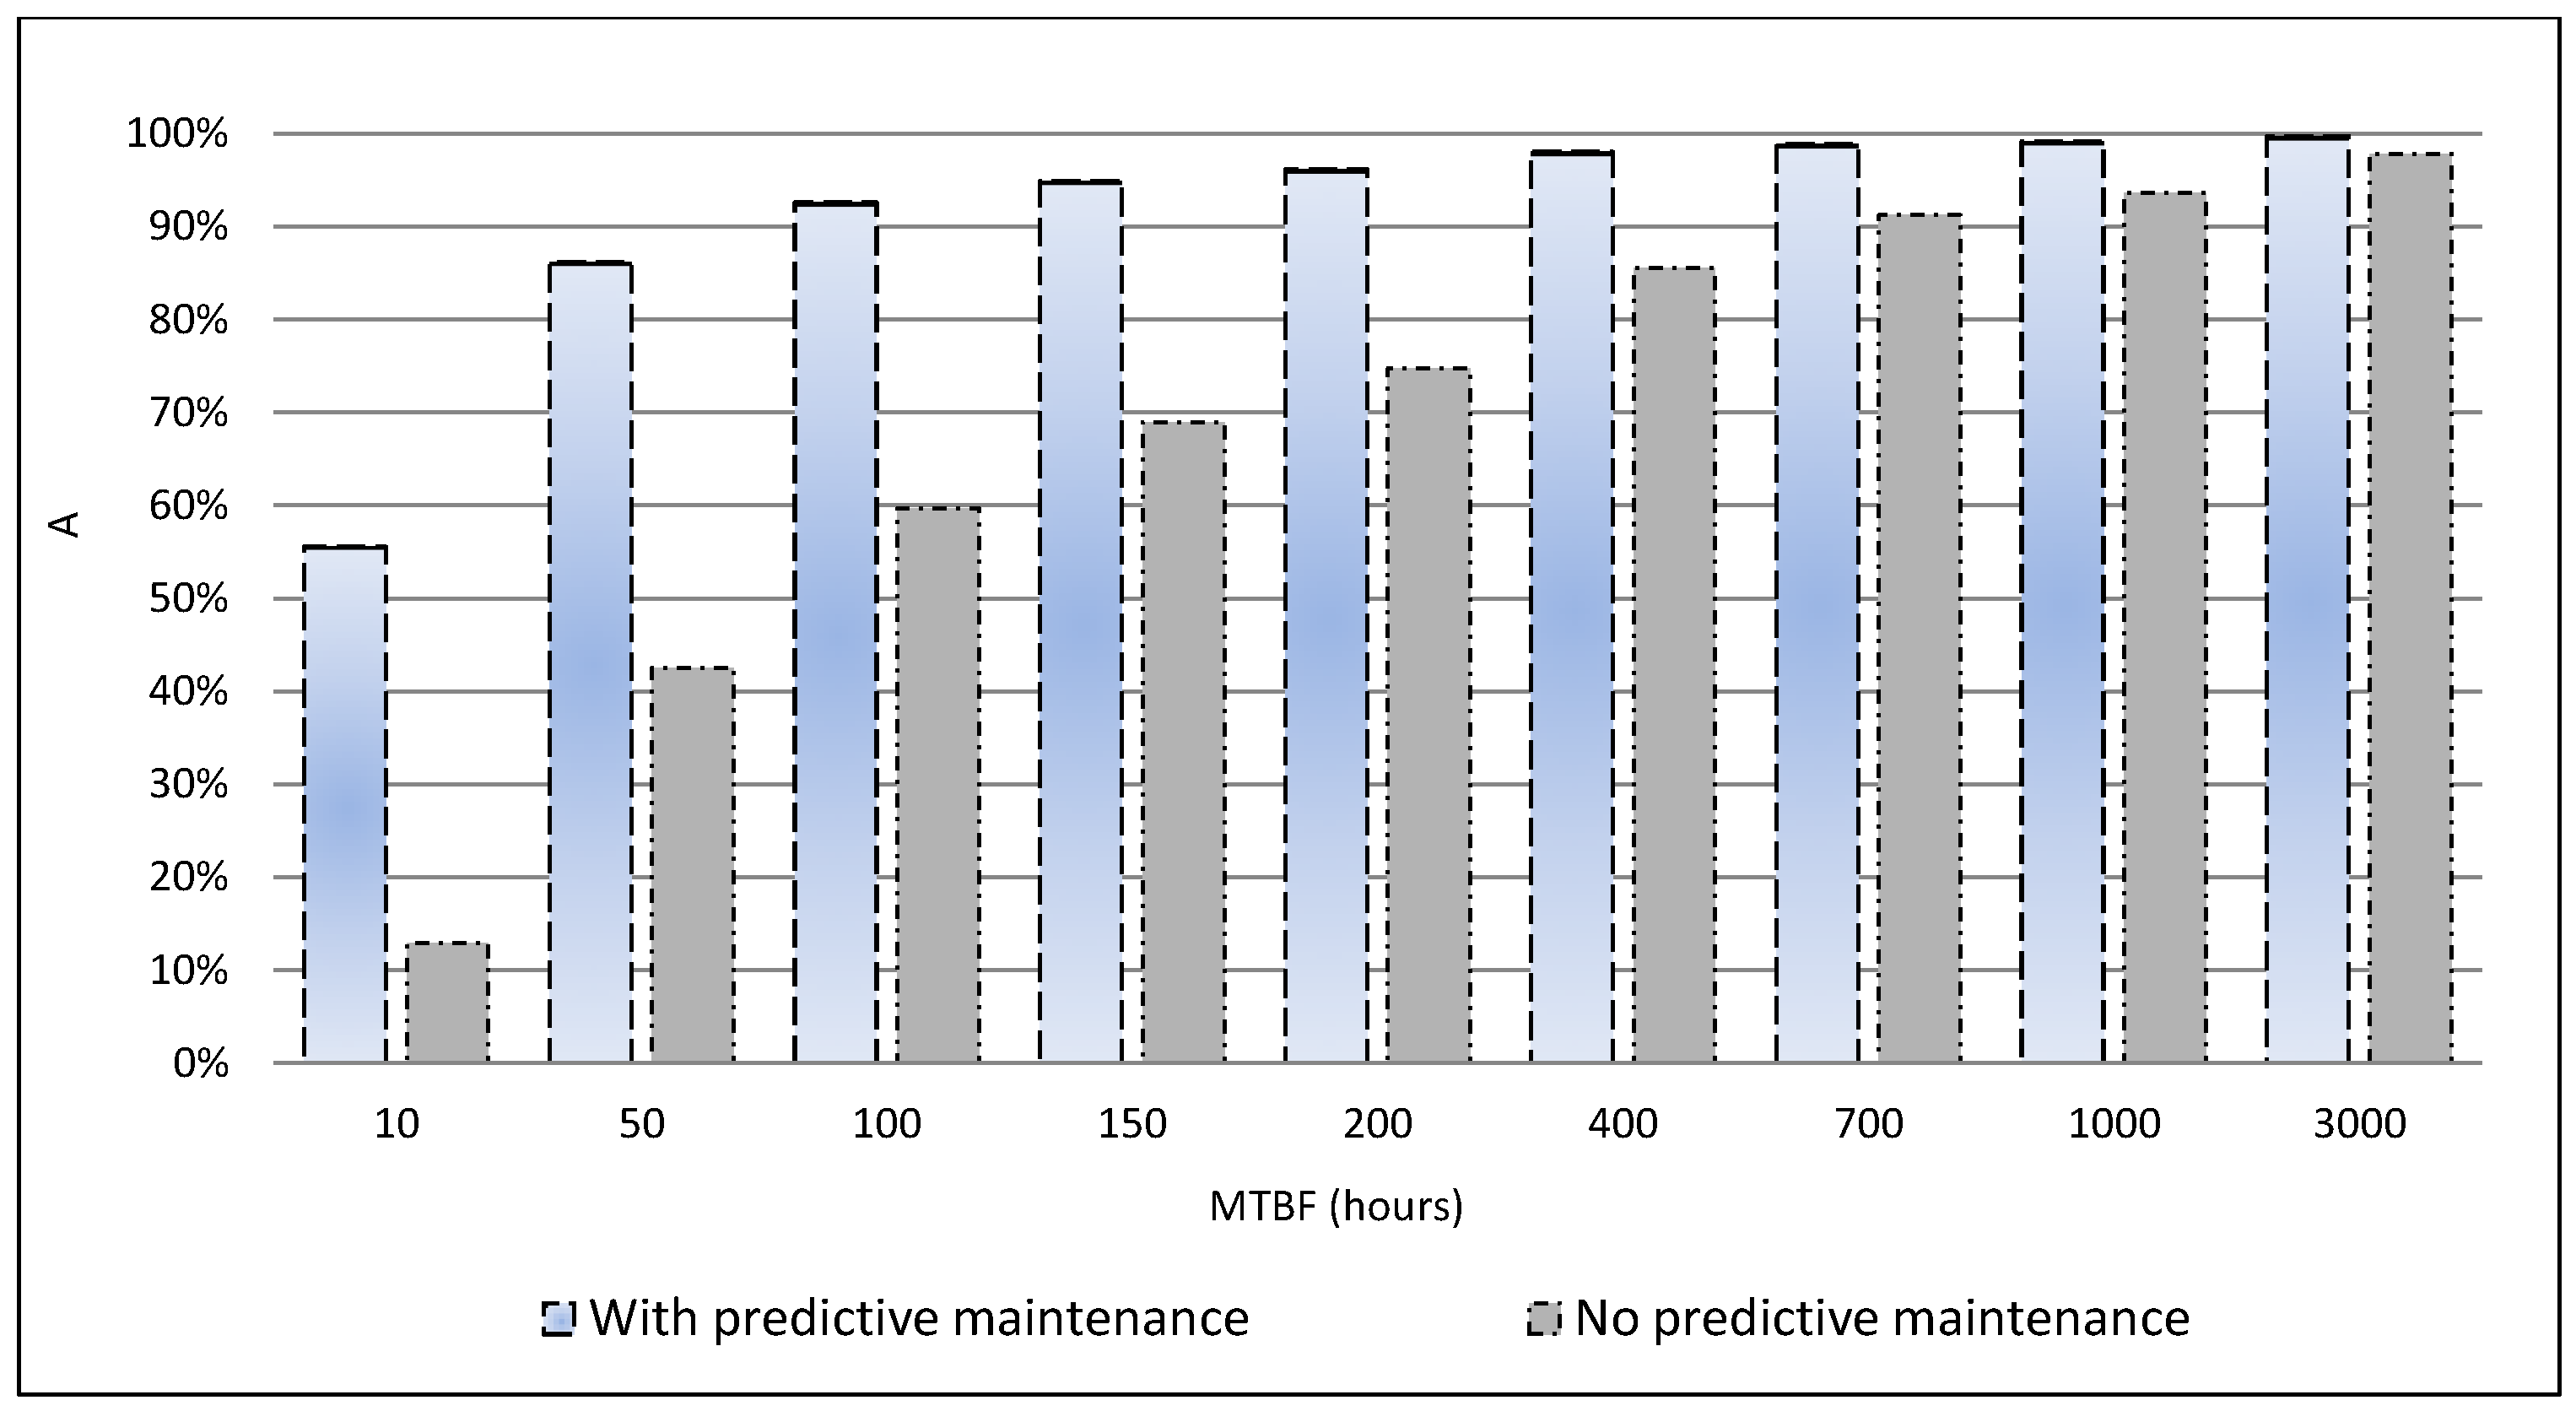
Obtaining the repair times (MTTR) between the two maintenance approaches, the system availability for the different MTBF values is shown in
Figure 9. It is observed that, for a time between 10-h failures, even in a scenario in which the probability of occurrence is very close to zero, the proposal of predictive maintenance using diagnostic software presented a 56% availability against only 13% without its use. When increasing the MTBF values both availabilities increase progressively, but the diagnosis method still showed better. It has also been observed that the higher MTBF times the availability tends to be 100%.
Based on the results as shown in
Table 3 and comparing the characteristics of the proposed paper with related works, the first and second columns present the work reference and country of study. The type of the tractor is presented in three, where, in a few cases, the authors did not provide information (not inf.), and the number of tractors used to implement each study. We focus on all related works in which studies were based on the cost of maintenance, where only two works were used as software or computational techniques to predict tractor maintenance. After that, we did not find within related works any comparative study about the measurement of classical maintenance (e.g., preventive or corrective) versus predictive maintenance.


