Assessment of Gaseous Emissions from Cattle Abattoir Wastes in Cameroon


1
Department of Agricultural and Environmental Engineering, College of Technology, The University of Bamenda, Bambili Box 39, Cameroon
2
Science and Technology Branch, Agriculture and Agri-food Canada, Ottawa, ON K1A 0C, Canada
*
Author to whom correspondence should be addressed.
AgriEngineering 2019, 1(2), 145-152; https://0-doi-org.brum.beds.ac.uk/10.3390/agriengineering1020011
Submission received: 4 March 2019
/
Revised: 27 March 2019
/
Accepted: 28 March 2019
/
Published: 2 April 2019
Abstract
:Abattoirs are potentially a significant source of greenhouse gas (GHG) methane (CH4) and nitrous oxide (N2O) emissions. Measurements were conducted in a beef cattle abattoir located in Bamenda, Cameroon, to characterise waste production and quantify GHG emissions. A male and female cattle were randomly selected on each day for waste measurement over a period of two weeks. Waste from each cattle was quantified by collecting all the intestinal/stomach contents after slaughtering and determining the mass of dry matter (DM) and volatile solids (VS). Emissions from the outdoor solid waste storage heap was measured using flux chambers. The average cattle weight was 420 kg and the average intestinal/stomach waste was 37 ± 6 kg cattle−1, half of which was dumped outdoor in a heap, while the rest was discarded with wastewater into a stream. The DM produced was 4.19 ± 0.85 kg cattle−1, representing 11% of the wastes, and the VS produced was 3.42 ± 0.82 kg cattle−1. The average ratio of waste DM to cattle weight was 1.0%, while the ratio of waste VS to cattle weight was 0.8%. Modelled CH4 emissions from the total waste was estimated at 37.84 ± 8 g CH4 cattle−1 with a range of 27.57–56.03 g CH4 cattle−1. Measured GHG emission from the outdoor heap was 5.89 ± 4.78 mg CH4 m−2 min−1, 0.137 ± 0.151 mg N2O m−2 min−1, and 95 ± 83 mg CO2 m−2 min−1. The total GHG (CH4 + N2O) emission rate was 229 mg CO2e m−2 min−1, indicating that CH4 contributes 82% of the total GHG. Improved waste management strategies, such as anaerobic digestion for biogas production or using covers over waste heaps, would help abattoirs mitigate GHG emissions.
1. Introduction
Abattoirs produce and manage manure and other wastes which are potentially significant sources of air and water pollution [1]. As such, greenhouse gases (GHGs), including methane (CH4) and nitrous oxide (N2O), are expected to be emitted from waste management in abattoirs [2,3]. This is particularly important as abattoirs are often located in peri-urban areas, especially in developing countries like Cameroon. The growing demand for livestock produce and the subsequent intensification of livestock production systems in Africa [4] is going to increase GHG emissions from abattoirs if appropriate management systems are not developed and used. While studies have been conducted to assess the impact of abattoirs on water quality in sub-Saharan Africa, [5,6], very limited information is available in the literature on GHG emission rates from abattoirs in Africa, where beef cattle are commonly raised. Differences in waste management systems and climatic conditions during waste storage imply that emission factors of GHGs cannot be transferred directly from one region to another, highlighting the need for data that reflects local production and climatic systems. As such, this project was carried out in a beef cattle abattoir located in Bamenda, Cameroon, with the aim of:
- Quantifying and characterising intestinal and stomach waste production;
- Modeling CH4 production factor from the storage of abattoir wastes;
- Measuring CH4, N2O, and CO2 emission rates from the storage of abattoir wastes.
2. Materials and Methods
2.1. Abbatoir Management
The abattoir where measurements were carried out in the wet season is owned by the Bamenda City Council, with daily activities managed by a butchers’ association. It has a slaughtering capacity of about 24 cattle simultaneously, which are predominantly West African Zebu raised on pasture. It is made up of a temporary holding overnight pen, a slaughter area including an inspection section used by veterinarians, and an outdoor open waste dumpsite.
The slaughtering area has a concrete floor and a side wall with 4 openings to channel waste out of the building. Three of the openings channel mostly blood, some intestinal and stomach wastes, and fats into a nearby stream. The last opening channels mostly stomach and intestinal wastes onto a concreted slab outside the building, from where it is later carried manually and dumped on bare earth in a nearby heap. At the time of measurement, the heap was about 4 months old and had a surface area of about 8 m2 and a height of about 0.9 m at the centre. The accumulated wastes in the heap is sold to farmers for use as organic fertilizer for crop cultivation. Slaughtering starts daily at about 6 a.m. and lasts for about 1.5 h. When all the beef has been taken out of the abattoir, the slaughtering surface is cleaned with high pressure water which is discarded together with additional intestinal/stomach waste, fat, and blood into a nearby stream.
2.2. Intestinal and Stomach Wastes Measurement and Characterization
Two cattle (male and female) were randomly selected from different butchers for intestinal and stomach wastes characterization on each measurement day. It was ensured that the same set of butchers were not used for two consecutive days. The live weight of the cattle was estimated just before slaughter using the body dimension method [7]. After slaughtering, the entire stomach and intestinal wastes, which were extracted manually by the butchers, were collected from each cattle and weighed using an electronic scale (XY200st, Zhejiang, China). The wastes from each cattle were mixed homogenously and sub-sampled in duplicates into vials. The vails were stored at −18 °C for subsequent laboratory analysis. Measurements of intestinal and stomach wastes in the abattoir lasted for 2 weeks in April and May, with a total of 28 cattle sampled.
Method 1648 of the U.S. Environmental Protection Agency [8] was used as the basis for the measurement of the dry matter (DM) and volatile solids (VS) in the waste [9]. A portion of the manure in each vial was sub-sampled and weighed with an electronic mass balance (Kern and Sohn GmbH, Balingen, Germany) to obtain its wet mass (Mw). It was oven dried for 12 h at 105 °C in a Universal Oven UN30 (Memmert GmbH, Schwabach, Germany), after which it was weighed to obtain the dry mass (Md). The percentage DM as well as the total DM was calculated using Equation (1) and Equation (2), where Mcattle is the mass of the intestinal and stomach wastes produced by each cattle.
The oven dried waste was further sub-sampled and weighed in a crucible of known mass Mc to obtain its mass (M1). The sample and crucible were then placed in a muffle furnace (Carbolite Gero Limited Hope Valley, UK) for 4 h at a temperature of 450–500 °C. The resulting ash and crucible were later weighed to obtain the mass, M2. The VS as a percentage of the DM was calculated as shown in Equation (3), while the total VS in the waste of each cattle was calculated using Equation (4).
2.3. Modelling Methane Production Factor
The Intergovernmental Panel on Climate Change Tier 2 approach [10], as simplified in other studies [9,11,12] was used to model a CH4 production factor from the solid manure of slaughtered cattle if 100% of the VS was stored in the heap as shown in Equation (5).
where EF is the CH4 production factor (kg CH4 cattle−1), VS is all the volatile solid in the cattle waste after slaughtering (kg VS cattle−1), B0 is the maximum CH4 producing capacity of cattle and stomach content and waste (0.23–0.65 m3 CH4 kg−1 of VS for cattle stomach and intestinal wastes) [2], MCF is the CH4 conversion factor based on the waste manure management system, and 0.67 is the conversion factor from m3 CH4 to kg CH4. An average B0 of 0.33 m3 CH4 kg−1 of VS was used in the current measurement since the content was a mixture of stomach and intestinal waste. An MCF value of 5% was used to represent solid manure storage in a warm climatic zone, as indicated by IPCC 2006.
2.4. Measurement of Methane, Nitrous Oxide, and Carbon Dioxide Emission Rates from Outdoor Storage of Intestinal and Stomach Wastes
Gas emission rates were quantified from the outdoor solid waste heap using 2 non-steady state flux chambers [13] for a duration of 2 weeks. Each chamber had a collar surface area of 0.108 m2 with a headspace volume of 0.03 m3. Chamber collars were inserted into the waste a day prior to gas sampling, with chamber locations varied during the measurement period to cover different surfaces of the heap. One chamber was varied along the central axis and the other chamber varied along the edge of the manure heap while ensuring equidistance between chamber locations. Gas was sampled from the chamber airspace twice a day in the mornings (9:00, 9:10, 9:20) and in the evenings (15:00, 15:10, 15:20) during the measurement period. The gas samples were injected into labelled vials and stored in a refrigerator for concentration measurements using a gas chromatograph (Varian 3800, Varian, Inc. Walnut Creek, CA, USA). The gas chromatograph column was operated at 75 °C, while the system used an elector capture detector to detect N2O, at a temperature of 390 °C, and a flame ionization detector was used to detect CO2 and CH4 at a temperature of 250 °C. The calibration range was 361.6–19812 ppm for CO2, 0.319–15.35 ppm for N2O, and 1.03–200.1 ppm for CH4.
Gas fluxes were calculated using the linear regression approach with regressed slopes and hence measurement points rejected for the few cases (<5%) where the coefficient of determination (R2) was less than 0.80. The slope was used together with the chamber surface area and headspace volume to calculate the flux as presented in Equation (6).
2.5. Measurement of Air Temperature and Relative Humidity
Air temperature and relative humidity around the abattoir (under the shade of a farm building) were measured using a Tinytag data logger (Gemini Data loggers, Chichester, UK) at 5 min intervals.
3. Results and Discussion
3.1. Variations in Outdoor Air Temperature and Relative Humidity
Diel patterns in average hourly outdoor air temperature and relative humidity under a shade around the slaughter house are shown in Figure 1. The average hourly air temperature and relative humidity were 23 °C and 82%, with ranges from 17 °C to 30 °C and 54% to 98%, respectively. The air temperature was close to the annual average of 21.5 °C in this region. Although not directly measured, the heap was warm and high in moisture, as it rained for 3 days and 2 nights for short periods during the measurements.
3.2. Intestinal and Stomach Waste Production, Characterisation, and Modeled Methane Production Factors
Table 1 shows the average mass of stomach and intestinal wastes produced after slaughtering a cattle. The total waste is further partitioned into the DM and VS contents, as shown in Table 1. Averagely, 22 cattle, with a range of 12 to 40 cattle, were slaughtered daily during the measurement period with an average stomach and intestinal waste production of 37.14 ± 6.04 kg cattle−1 (Table 1). It was therefore estimated that the total daily waste production was about 817 ± 132 kg. Estimates of total waste added to the concreted slab outside the building was 414 ± 186 kg, indicating that close to 50% of the waste produced per day from this abattoir was discharged into the stream, with serious environmental consequences. With an average cattle live weight of 420 kg, the average ratio of waste DM to cattle weight was 1.0%, while the ratio of waste VS to cattle weight was 0.8%.
Estimates of modeled CH4 emissions from the waste of slaughtered cattle was 37.84 ± 8 g CH4 cattle−1, with a range of 27.57–56.03 g CH4 cattle−1 (Table 1). Some variations could be expected in the modeled CH4 emission factors based on the input parameters, such as the B0, which was not directly measured in this research. The focus was to provide estimates using literature values, while highlighting the importance of determining these parameters at the local level.
3.3. Measured Methane, Nitrous Oxide, and Carbon Dioxide Emission Rates from Outdoor Storage of Intestinal and Stomach Wastes
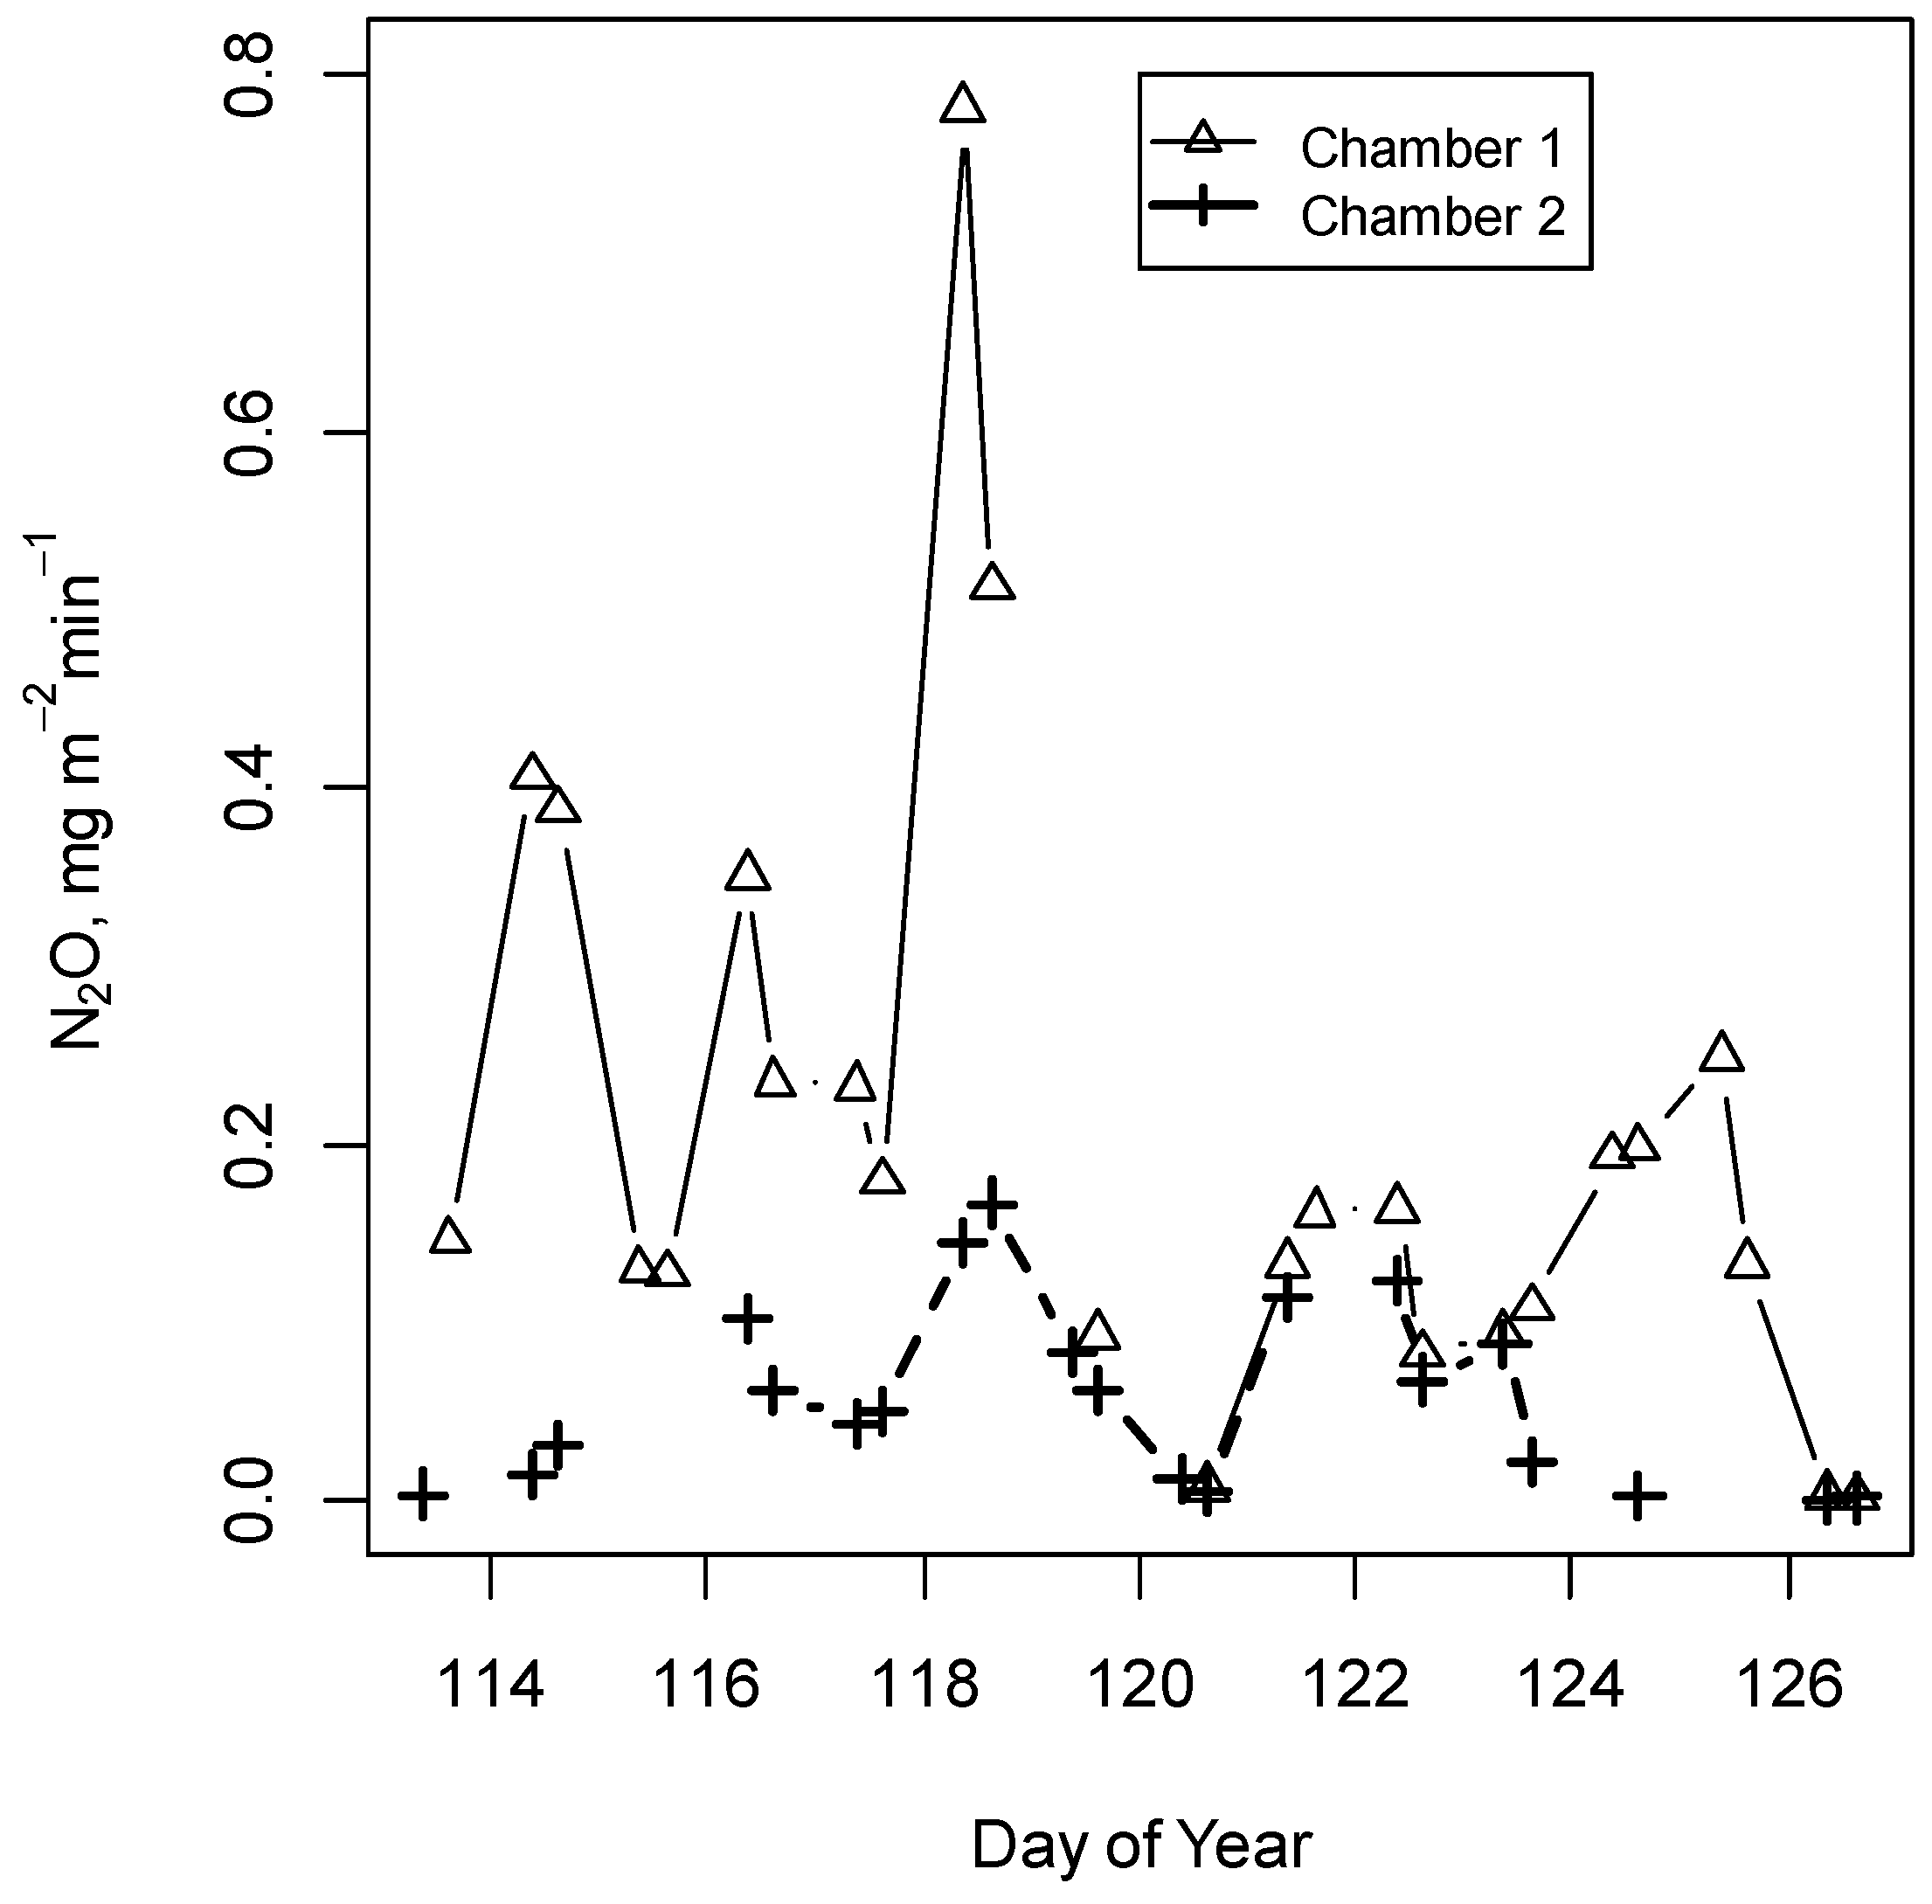
The measured emission rates for CH4, N2O, and C2O are presented in Table 2. Most data in the literature on emissions from cattle manure are associated with barn or outdoor storage facilities, with hardly any data for comparison in sub-Saharan Africa. Temporal and spatial variations in emission rates are shown in Figure 2, Figure 3 and Figure 4 for CH4, N2O, and C2O, respectively. It can be seen from Figure 2, Figure 3 and Figure 4 that, on average, chamber 1 has high N2O and low CH4 and CO2 emission, while the reverse holds true for chamber 2. This could be associated with age of the manure/waste heap since chamber 1 was placed around the edges having older manure/waste, while chamber 2 was mostly placed around the centre of the heap that received fresh manure daily.
The CO2:CH4 emission ratio from Table 2 is high (~16), which indicates more aerobic conditions that is consistent with the solid manure emission factor [14,15]. When expressed in CO2e, the CH4 emissions is 188.1 mg CO2e m−2 min−1, while N2O emissions is 40.8 mg CO2e m−2 min−1 based on global warming potentials of 25 for CH4 and 298 for N2O [16]. This gives a total non-CO2 GHG (CH4 + N2O) emission rate of 229 mg CO2e m−2 min−1 and indicates that CH4 contributes 82% of the total, even though it is stored in a pile.
With an emitting manure heap surface area of 8 m2, the mean measured emission rate of 5.89 mg CH4 m−2 min−1 in Table 2 is equivalent to 24.77 kg CH4 year−1. Given that the emissions resulted from averagely 22 cattle slaughtered per day, it could be estimated that the emission factor from manure storage could be approximated to 1.13 kg head−1 CH4 year−1. Manure CH4 emission factors from IPCC, Table 10. A5, Other Cattle in Africa, warm climate, is 1 kg CH4 head−1 year−1 [10]. However, it should be noted that the measured emission factor in this study does not consider the fraction of VS (~50%) that entered the stream, as well as emissions associated with the field application of the stored manure.
4. Conclusions
Measurements were carried out in a beef cattle abattoir to characterise waste production, model CH4 emissions from the waste, and measure CH4, N2O, and CO2 GHG emissions resulting from its storage. The average cattle weight was 420 kg and the average intestinal and stomach waste produced was 37 ± 6 kg cattle−1, half of which was dumped on an outdoor pile, while the other half was discarded with wastewater into a stream. The DM content was 4.19 ± 0.85 kg cattle−1, representing 11.28% ± 1.32% of the total waste produced. The VS content was 3.42 ± 0.82 kg cattle−1. Modelled CH4 emissions from the total waste produced by each cattle was estimated at 37.84 ± 8 g CH4 cattle−1 with a range of 27.57–56.03 g CH4 cattle−1. Measured GHG emission rates from the outdoor storage were 5.89 ± 4.78 mg CH4 m−2 min−1, 0.137 ± 0.151 mg N2O m−2 min−1, and 95 ± 83 mg CO2 m−2 min−1. When expressed in CO2e, the CH4 emissions is 200.3 mg CO2e m−2 min−1, while N2O emissions is 40.8 mg CO2e m−2 min−1. This gives a GHG (CH4 + N2O) emission rate of 241 mg CO2e m−2 min−1 and indicates that CH4 contributes 83% of the total, even though it is stored in a pile. Stringent waste management strategies such as anaerobic digestion for biogas production or the use of covers over waste heaps are needed in abattoirs to mitigate GHG emissions. In addition, long-term measurements are needed to cover seasonal variations in outdoor waste storages in different abattoirs.
Author Contributions
Conceptualization, M.N.; formal analysis, M.N., A.V., P.N., G.T., and T.C.; investigation, M.M., P.N., G.T., and T.C.; writing—original draft preparation, M.N. and A.V.
Funding
This research received no external funding.
Acknowledgments
The authors acknowledge cooperation from the butchers and slaughter house management team. Special thanks to Atanga Merrius and Solomon Ebane for facilitating access to the abattoir.
Conflicts of Interest
The authors declare no conflict of interest.
References
- Adeyemi, I.G.; Adeyemo, O.K. Waste management practices at the Bodija abattoir, Nigeria. Int. J. Environ. Stud. 2007, 64, 71–82. [Google Scholar] [CrossRef]
- Ware, A.; Power, N. Biogas from cattle slaughterhouse waste: Energy recovery towards an energy self-sufficient industry in Ireland. Renew. Energy 2016, 97, 541–549. [Google Scholar] [CrossRef]
- aan den Toorn, S.I.; van den Broek, M.A.; Worrell, E. Decarbonising meat: Exploring greenhouse gas emissions in the meat sector. Energy Procedia 2017, 123, 353–360. [Google Scholar] [CrossRef]
- Herrero, M.; Havlik, P.; McIntire, J.; Palazzo, A.; Valin, H. African Livestock Futures: Realizing the Potential of Livestock for Food Security, Poverty Reduction and the Environment in Sub-Saharan Africa; Office of the Special Representative of the UN Secretary General for Food Security and Nutrition and the United Nations System Influenza Coordination (UNSIC): Geneva, Switzerland, 2014; 118 p. [Google Scholar]
- Bello, Y.O.; Oyedemi, D.T.A. The Impact of Abattoir Activities and Management in Residential Neighbourhoods: A Case Study of Ogbomoso, Nigeria. J. Soc. Sci. 2009, 19, 121–127. [Google Scholar] [CrossRef]
- Aniebo, A.O.; Wekhe, S.N.; Okoli, I.C. Abattoir blood waste generation in Rivers State and its environmental implications in the Niger Delta. Toxicol. Environ. Chem. 2009, 91, 619–625. [Google Scholar] [CrossRef]
- Wangchuk, K.; Wangdi, J.; Mindu, M. Comparison and reliability of techniques to estimate live cattle body weight. J. Appl. Anim. Res. 2018, 46, 349–352. [Google Scholar] [CrossRef]
- Telliard, W.A. METHOD 1684: Total, Fixed, and Volatile Solids in Water, Solids, and Biosolids; U.S. Environmental Protection Agency: Washington, DC, USA, 2001.
- Ngwabie, N.M.; Chungong, B.N.; Yengong, F.L. Characterisation of pig manure for methane emission modelling in Sub-Saharan Africa. Biosyst. Eng. 2018, 170, 31–38. [Google Scholar] [CrossRef]
- IPCC. Emissions from Livestock and Manure Management. In Guidelines for National Greenhouse Gas Inventories; Dong, M.J., McAllister, T.A., Hatfield, J.L., Johnson, D.E., Lassey, K.R., Lima, M.A., Romanovskaya, A., Eds.; Intergovernmental Panel on Climate Change (IPCC): Geneva, Switzerland, 2006. [Google Scholar]
- Du Toit, L.; Niekerk, W.; Meissner, H.H. Direct methane and nitrous oxide emissions of monogastric livestock in South Africa. S. Afr. J. Anim. Sci. 2013, 43, 362–375. [Google Scholar] [CrossRef]
- Fillingham, M.A.; VanderZaag, A.C.; Burtt, S.; Baldé, H.; Ngwabie, N.M.; Smith, W.; Hakami, A.; Wagner-Riddle, C.; Bittman, S.; MacDonald, D. Greenhouse gas and ammonia emissions from production of compost bedding on a dairy farm. Waste Manag. 2017, 70, 45–52. [Google Scholar] [CrossRef] [PubMed]
- Ngwabie, N.M.; Wirlen, Y.L.; Yinda, G.S.; VanderZaag, A.C. Quantifying greenhouse gas emissions from municipal solid waste dumpsites in Cameroon. Waste Manag. 2018. [Google Scholar] [CrossRef] [PubMed]
- Ding, L.; Lu, Q.; Xie, L.; Liu, J.; Cao, W.; Shi, Z.; Li, B.; Wang, C.; Zhang, G.; Ren, S. Greenhouse gas emissions from dairy open lot and manure stockpile in northern China: A case study. J. Air Waste Manag. Assoc. 2016, 66, 267–279. [Google Scholar] [CrossRef] [PubMed]
- Leytem, A.B.; Dungan, R.S.; Bjorneberg, D.L.; Koehn, A.C. Emissions of ammonia, methane, carbon dioxide, and nitrous oxide from dairy cattle housing and manure management systems. J. Environ. Qual. 2011, 40, 1383–1394. [Google Scholar] [CrossRef] [PubMed]
- IPCC. Fourth Assessment Report: Synthesis Report; Intergovernmental Panel on Climate Change: Geneva, Switzerland, 2007. [Google Scholar]
Figure 1.
Outdoor air temperature and relative humidity around the slaughter house. Each data point represents an hourly average for the 14-day measurement period. Error bars show the standard deviation within each hourly bin.
Figure 1.
Outdoor air temperature and relative humidity around the slaughter house. Each data point represents an hourly average for the 14-day measurement period. Error bars show the standard deviation within each hourly bin.

Figure 2.
Spatial and temporal variations in CH4 emission rates from the storage of cattle stomach and intestinal wastes from a slaughter house.
Figure 2.
Spatial and temporal variations in CH4 emission rates from the storage of cattle stomach and intestinal wastes from a slaughter house.

Figure 3.
Spatial and temporal variations in N2O emission rates from the storage of cattle stomach and intestinal wastes from a slaughter house.
Figure 3.
Spatial and temporal variations in N2O emission rates from the storage of cattle stomach and intestinal wastes from a slaughter house.

Figure 4.
Spatial and temporal variations in CO2 emission rates from the storage of cattle stomach and intestinal wastes from a slaughter house.
Figure 4.
Spatial and temporal variations in CO2 emission rates from the storage of cattle stomach and intestinal wastes from a slaughter house.


Table 1.
Characterisation of stomach and intestinal waste production and the corresponding modeled of CH4 production factors.
Table 1.
Characterisation of stomach and intestinal waste production and the corresponding modeled of CH4 production factors.
| Day | * Estimated Cattle Live Weight (kg cattle−1) | Stomach and Intestinal Wastes (kg cattle−1) | DM (%) | DM (kg cattle−1) | VS (% DM) | VS (kg cattle−1) | ** Modeled EF (g CH4 cattle−1) |
|---|---|---|---|---|---|---|---|
| 1 | 233 | 35 | 12.9 | 4.5 | 88.7 | 4.0 | 44.17 |
| 413 | 49 | 12.0 | 5.9 | 78.7 | 4.6 | 50.67 | |
| 2 | 707 | 33 | 11.9 | 3.9 | 82.0 | 3.2 | 35.75 |
| 548 | 38 | 12.9 | 4.9 | 88.3 | 4.3 | 47.70 | |
| 3 | 615 | 34 | 10.9 | 3.7 | 82.3 | 3.0 | 33.60 |
| 625 | 43.5 | 10.9 | 4.7 | 82.9 | 3.9 | 43.40 | |
| 4 | 461 | 50 | 11.2 | 5.6 | 85.3 | 4.8 | 52.86 |
| 295 | 40 | 11.5 | 4.6 | 79.3 | 3.6 | 40.20 | |
| 5 | 523 | 45 | 10.4 | 4.7 | 89.8 | 4.2 | 46.74 |
| 349 | 32 | 11.0 | 3.5 | 83.8 | 2.9 | 32.54 | |
| 6 | 349 | 31 | 10.5 | 3.2 | 89.3 | 2.9 | 31.97 |
| 399 | 32 | 10.8 | 3.4 | 72.4 | 2.5 | 27.57 | |
| 7 | 461 | 33.5 | 10.6 | 3.5 | 89.8 | 3.2 | 35.12 |
| 295 | 36 | 10.3 | 3.7 | 81.8 | 3.0 | 33.50 | |
| 8 | 276 | 36 | 11.0 | 4.0 | 79.3 | 3.1 | 34.70 |
| 374 | 37 | 10.9 | 4.0 | 83.4 | 3.4 | 37.06 | |
| 9 | 177 | 30 | 11.7 | 3.5 | 83.0 | 2.9 | 32.16 |
| 374 | 39 | 10.1 | 3.9 | 87.6 | 3.5 | 38.18 | |
| 10 | 419 | 37 | 10.9 | 4.0 | 92.1 | 3.7 | 41.07 |
| 523 | 32 | 12.1 | 3.9 | 69.1 | 2.8 | 30.87 | |
| 11 | 374 | 33.5 | 10.5 | 3.5 | 87.3 | 3.1 | 34.08 |
| 492 | 31 | 10.2 | 3.2 | 80.0 | 2.5 | 27.89 | |
| 12 | 584 | 41 | 10.4 | 4.3 | 71.4 | 3.0 | 33.64 |
| 424 | 40.5 | 11.8 | 4.8 | 62.9 | 2.9 | 32.16 | |
| 13 | 315 | 33.5 | 13.7 | 4.6 | 80.6 | 3.7 | 41.20 |
| 424 | 27.5 | 12.0 | 3.3 | 77.6 | 2.6 | 28.29 | |
| 14 | 315 | 39.5 | 11.3 | 4.5 | 73.7 | 3.3 | 36.47 |
| 424 | 50.5 | 11.7 | 5.9 | 85.9 | 5.1 | 56.03 | |
| Mean ± standard deviation | 420 ± 125 | 37.14 ± 6.04 | 11.28 ± 1.32 | 4.19 ± 0.85 | 81.72 ± 10.33 | 3.42 ± 0.82 | 37.84 ± 8 |
| Range | 177–707 | 27.50–50.50 | 9.44–15.00 | 3.00–7.00 | 40.00–94.74 | 1.61–5.52 | 27.57–56.03 |
* Estimated using body dimensions. DM: Dry matter; VS: Volatile solids; EF: Emission factor. ** Modeled value if 100% of the VS was stored in a pile.
Table 2.
Measured CH4, N2O, and CO2 emission rates from the storage of cattle stomach and intestinal wastes from a slaughter house.
Table 2.
Measured CH4, N2O, and CO2 emission rates from the storage of cattle stomach and intestinal wastes from a slaughter house.
| CH4 (mg m−2 min−1) | N2O (mg m−2 min−1) | CO2 (mg m−2 min−1) | |
|---|---|---|---|
| Mean ± standard deviation | 5.89 ± 4.78 | 0.137 ± 0.151 | 95 ± 83 |
| Range | 0.73–20.48 | 0.001–0.781 | 19–430 |
© 2019 by the authors. Licensee MDPI, Basel, Switzerland. This article is an open access article distributed under the terms and conditions of the Creative Commons Attribution (CC BY) license (http://creativecommons.org/licenses/by/4.0/).
Share and Cite
MDPI and ACS Style
Ngwabie, M.; VanderZaag, A.; Nji, P.; Tembong, G.; Chenwi, T. Assessment of Gaseous Emissions from Cattle Abattoir Wastes in Cameroon. AgriEngineering 2019, 1, 145-152. https://0-doi-org.brum.beds.ac.uk/10.3390/agriengineering1020011
AMA Style
Ngwabie M, VanderZaag A, Nji P, Tembong G, Chenwi T. Assessment of Gaseous Emissions from Cattle Abattoir Wastes in Cameroon. AgriEngineering. 2019; 1(2):145-152. https://0-doi-org.brum.beds.ac.uk/10.3390/agriengineering1020011
Chicago/Turabian StyleNgwabie, Martin, Andrew VanderZaag, Paulicle Nji, Gerald Tembong, and Theodore Chenwi. 2019. "Assessment of Gaseous Emissions from Cattle Abattoir Wastes in Cameroon" AgriEngineering 1, no. 2: 145-152. https://0-doi-org.brum.beds.ac.uk/10.3390/agriengineering1020011