Applying Remote Sensing Technologies in Urban Landscapes of the Mediterranean
by
 , , and
Celestina M. G. Pedras
1,2 ,
,
Helena Maria Fernandez
3,*,
Rui Lança
4 and
Fernando Granja-Martins
3 1
Linking Landscape, Environment, Agriculture and Food (LEAF), Instituto Superior de Agronomia, Universidade de Lisboa, Tapada da Ajuda, 1349-017 Lisboa, Portugal
2
Departamento de Ciências da Terra, do Mar e do Ambiente, Universidade do Algarve, Campus de Gambelas, 8005-139 Faro, Portugal
3
Research Centre for Spatial and Organizational Dynamics (CIEO), Universidade Algarve, Campus de Gambelas, 8005-139 Faro, Portugal
4
Departamento de Engenharia Civil, Instituto Superior de Engenharia, Universidade Algarve, Campus da Penha, 8005-139 Faro, Portugal
*
Author to whom correspondence should be addressed.
AgriEngineering 2020, 2(1), 27-36; https://0-doi-org.brum.beds.ac.uk/10.3390/agriengineering2010002
Submission received: 2 December 2019
/
Revised: 24 December 2019
/
Accepted: 30 December 2019
/
Published: 5 January 2020
(This article belongs to the Special Issue Selected Papers from 10th Iberian Agroengineering Congress)
Abstract
:There has been increasing pressure on water resources in cities due to the proliferation of urban green areas. In the Mediterranean climate, only a small part of the plants’ water needs is supplied by rainfall during the winter months. Thus, in Algarve (Portugal) irrigation of the urban landscapes is required almost all year round. The aims of this study were to evaluate the maintenance of the urban landscapes of São Brás de Alportel (Algarve) during a year, based on the characterization of the vegetation of the urban gardens, the climate data, the analysis of the irrigation systems, the calculation of the plants water requirements and the normalized difference vegetation index (NDVI). By crossing all this information, it was possible to understand if the current maintenance level is the most suitable for sustainable irrigated urban landscapes. In most of the gardens, it was possible to establish a relationship between the gross irrigation water requirements and NDVI. In general, the NDVI allowed us to study the urban landscape, through the monthly observation of the differences in the appearance and development of the vegetation.
1. Introduction
The growing trend of urbanization combined with population growth associated with healthy living has changed urban landscapes. The urban green areas provide functions and services very important for the quality of life. The most relevant services and functions are rainwater infiltration, mitigation of the atmospheric pollution, improved city acoustics, aesthetics and habitats.
The existence of urban green areas has positive aspects but on the other hand, constitute a challenge as the water demand for irrigation increases [1]. The irrigation of urban green areas has been increasing in the region of the Mediterranean and nowadays constitutes an important part of the total water consumption in urban areas. In this region, irrigation is requited almost all year and, in most cases, the water used for irrigation is potable water from the domestic water supply network. The urban green areas are characterized by the heterogeneity of plant species with different plant water requirements [2]. This justifies the necessity of knowing in detail the hydric demands from the plants in order to understand if the irrigation system satisfies the design requirements or if it is being applied excess or deficit of water.
Taking as reference the visual quality of the urban green areas, studies in the field of Geographic Information Systems (GIS) and Remote Sensing (RS) open new possibilities to interact with the environment. The acquisition of aerial photography in the past had a high cost, but the paradigm has changed with the use of Unnamed Air Vehicles (UAV). The UAV can transport different sensors that collect data related to biophysical and vegetation factors [3]. For this reason, the UAV are being chosen to collect indicators to describe the environmental quality. Healthy vegetation presents a high contrast between the visible reflected light and the Near Infra-Red (NIR) [4]. The relation between the Normalized Difference Vegetation Index (NDVI) and the crop coefficient (Kc) [5] may be used for the analysis of the geographic distribution of the evapotranspiration and irrigation water management in large areas with vegetation.
This study aims to characterize the current maintenance of the urban green areas of São Brás de Alportel and define strategies to improve water use efficiency in order to minimize environmental impact while maintaining the visual quality of the landscape. To achieve these objectives, the gross irrigation water requirements, the applied water for irrigation by the municipality of São Brás de Alportel, the performance of the irrigation systems and the NDVI vegetation index were simultaneously analyzed.
2. Materials and Methods
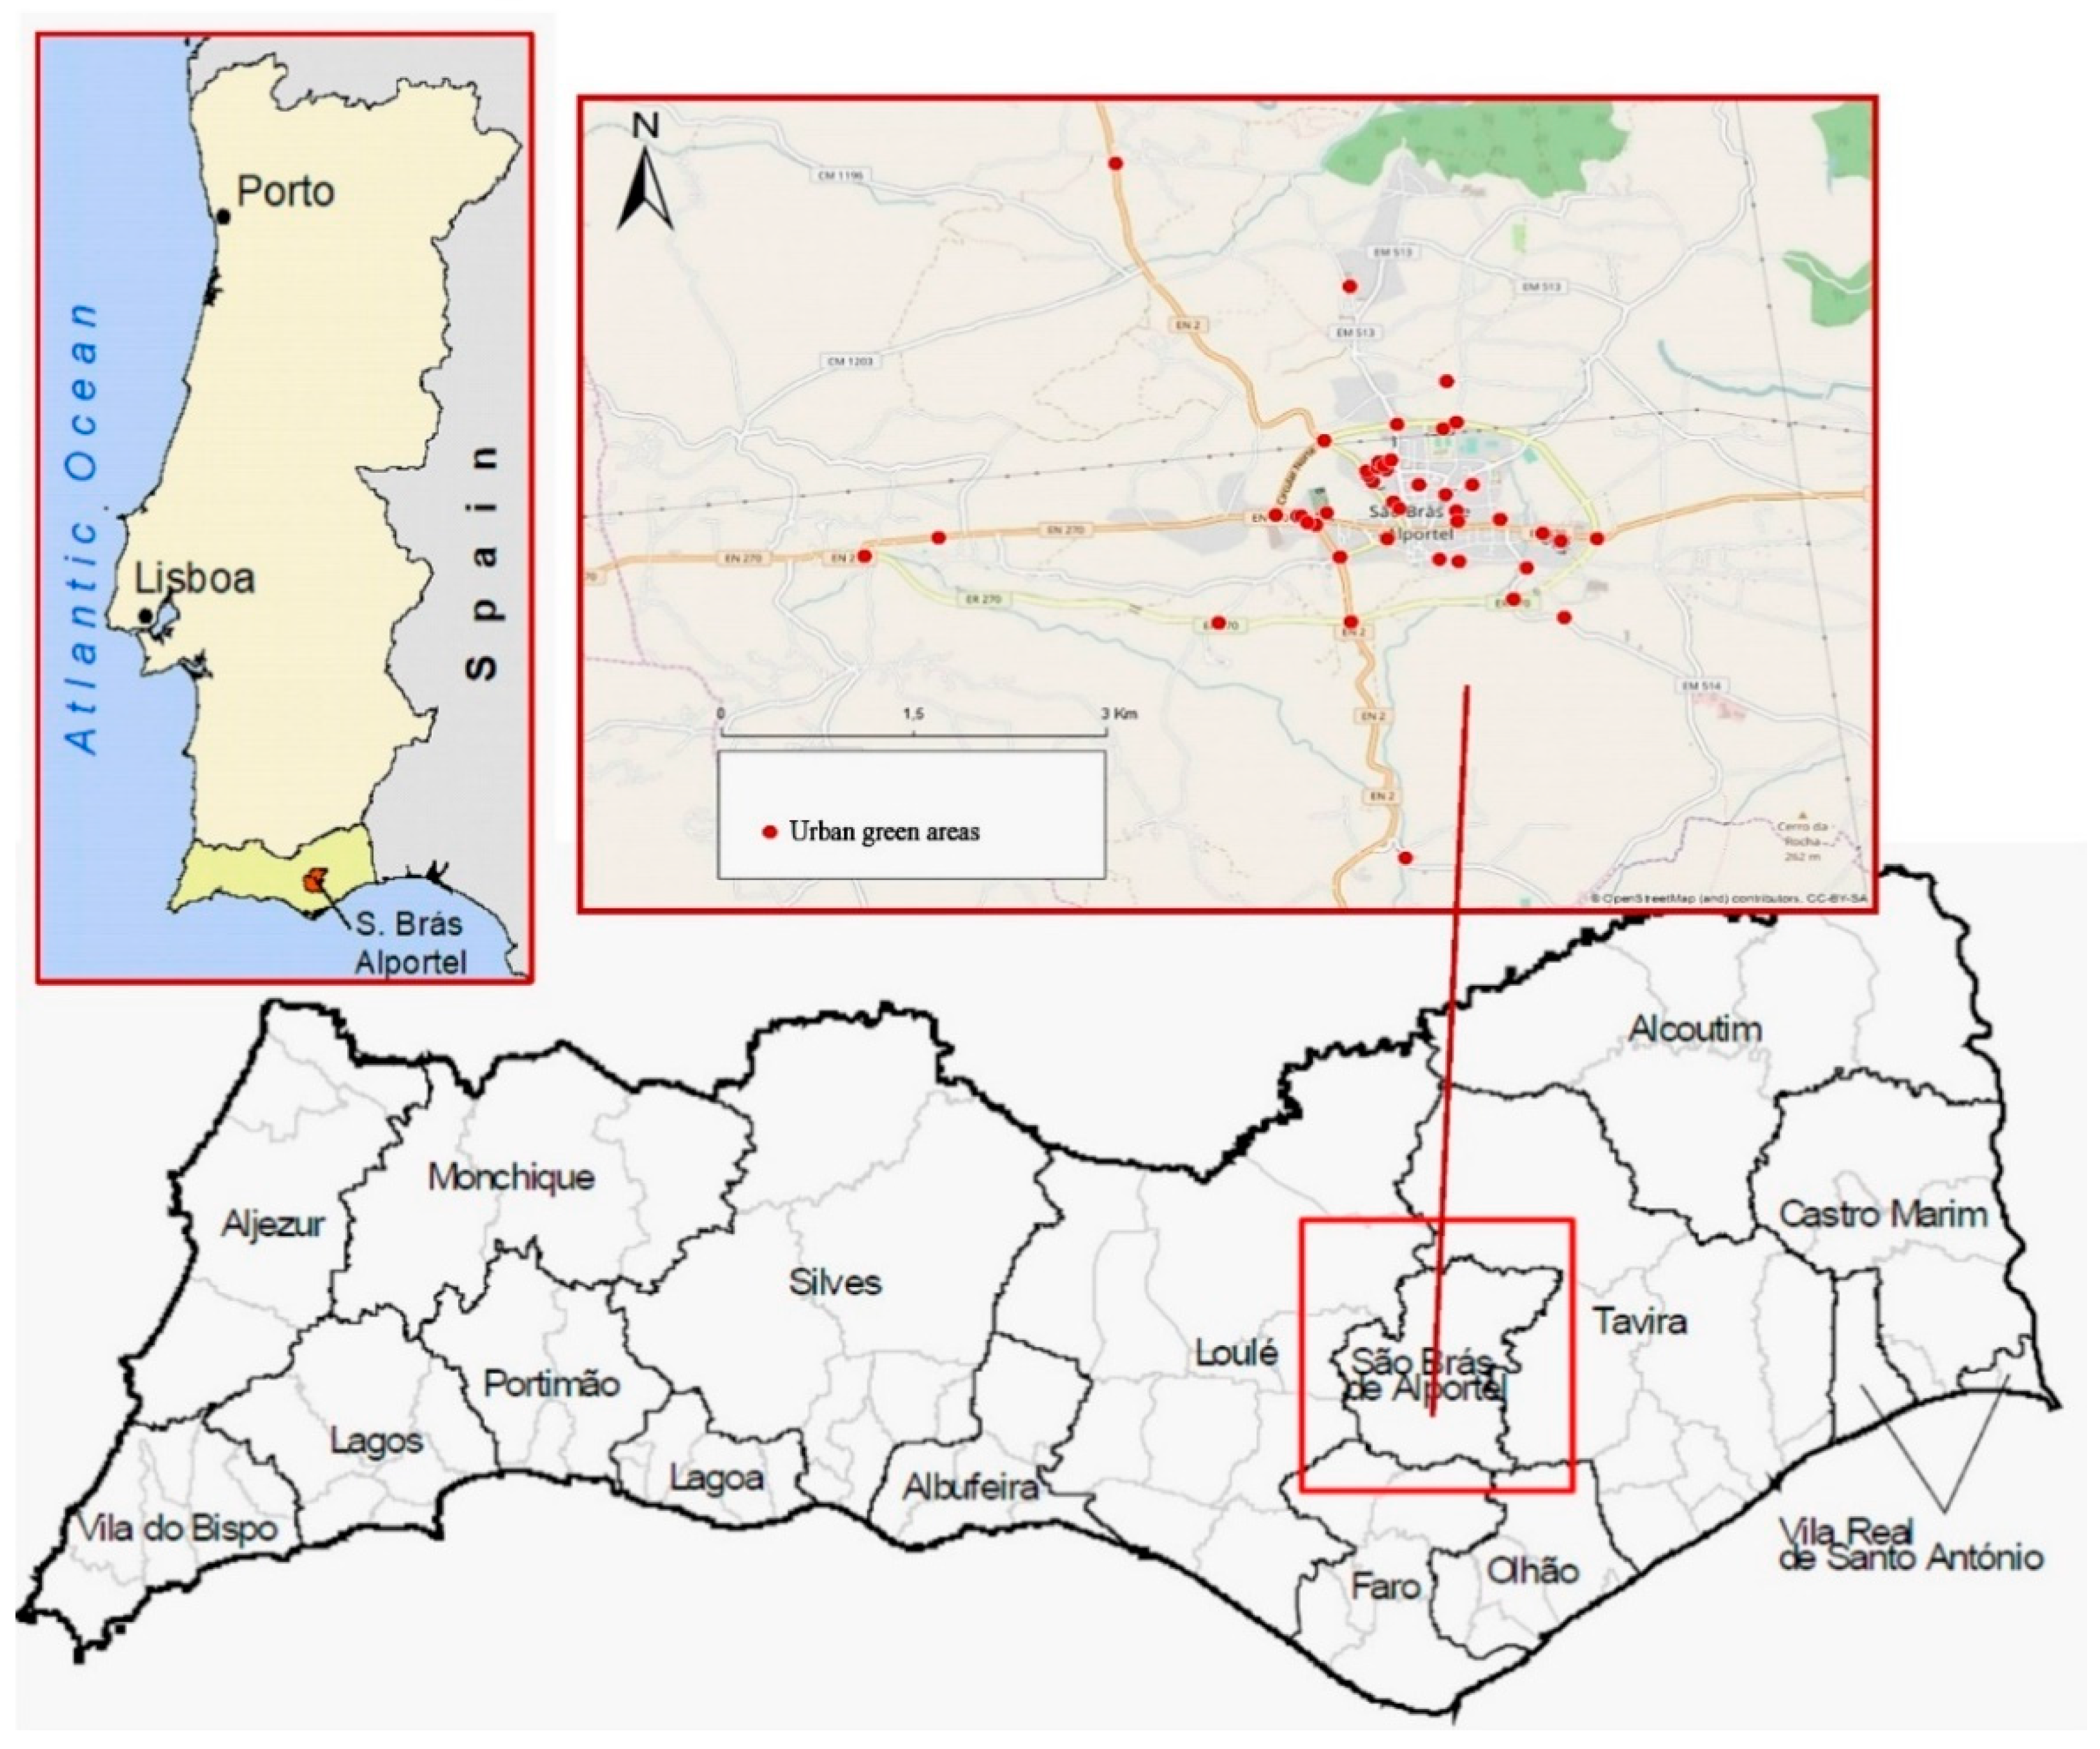
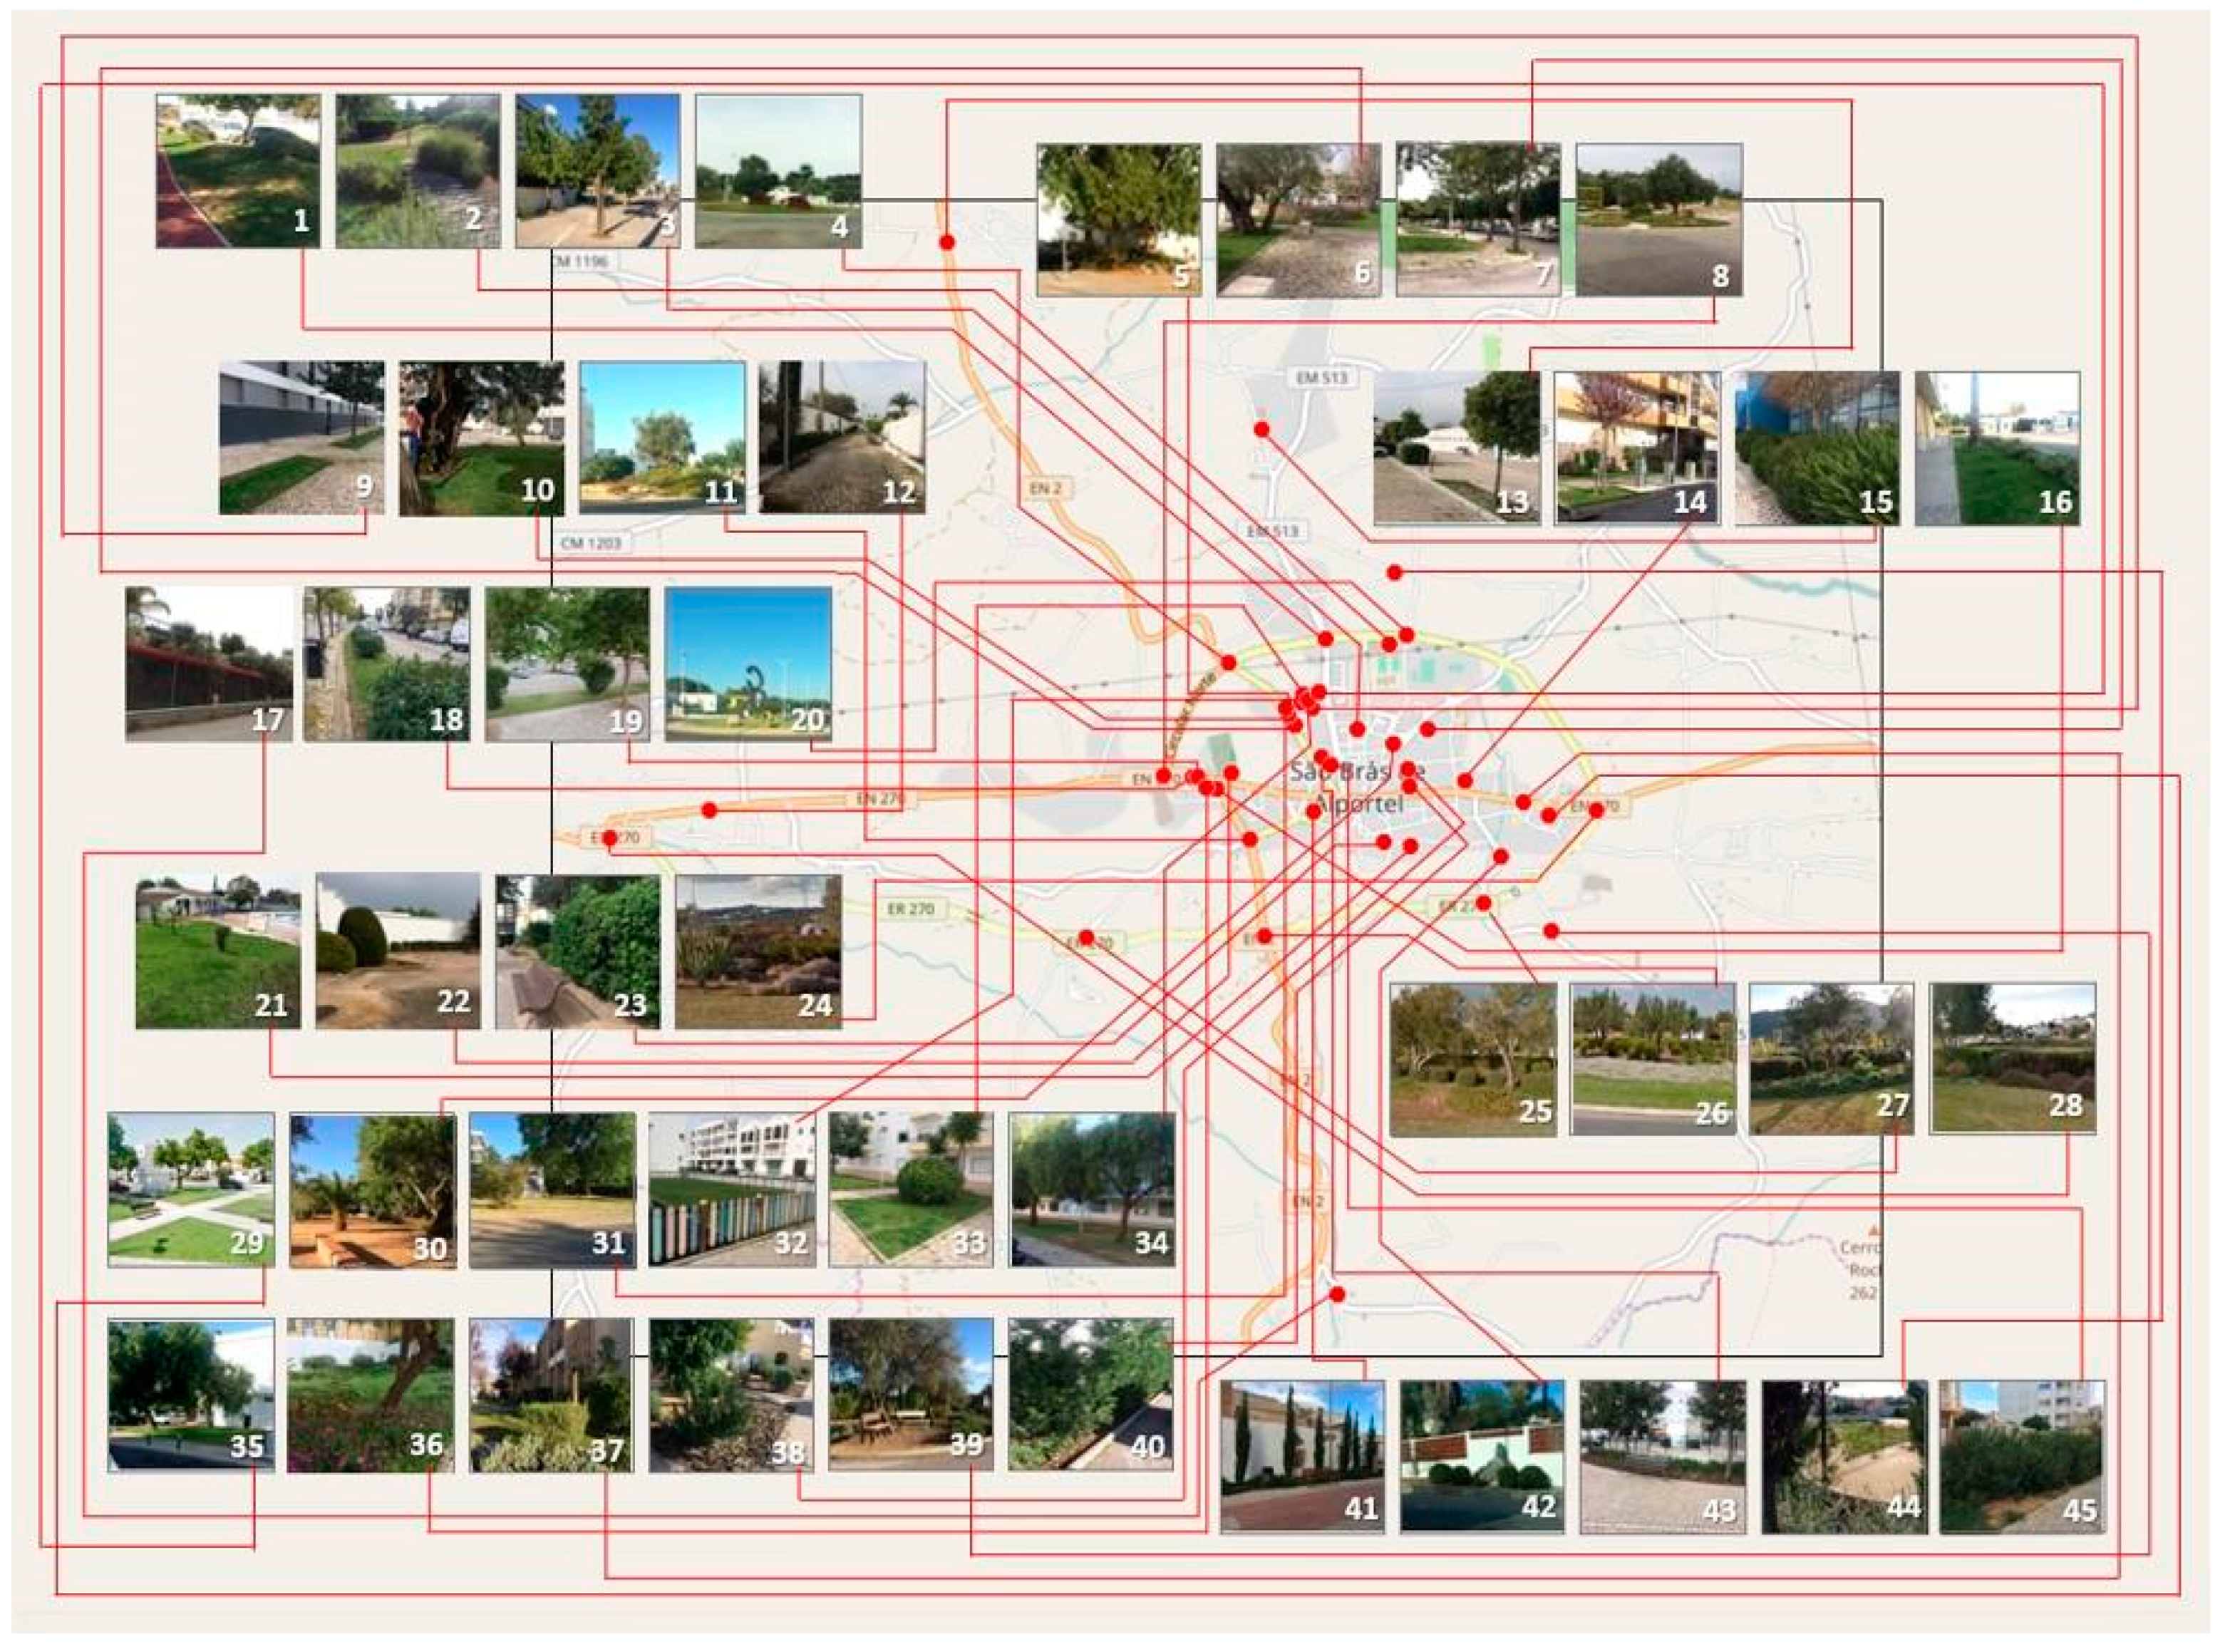
The study was carried out in the urban landscapes of São Brás de Alportel (Algarve, south of Portugal) in 2016 (Figure 1). This village is located in the transition between the littoral and the mountains and has a total of 45 urban green areas (Figure 2) with a total area of 3.6 ha. The climate is moderate with smooth winters and dry and warm summers (classification Köppen: Csa). The average monthly temperature varies between 10.3 °C and 24.2 °C in January and August, respectively ([6]: 31J/01C, series 1942–2018). The rainfall is concentrated in the months from November to February with 59% of the annual rainfall (797 mm) ([6]: 31J/01C, series 2010–2018).
The irrigation systems of the urban green areas use domestic potable water from the public supply network. The systems more common are the sprinkler and micro-irrigation systems. However, there are urban gardens irrigated manually. Some gardens have simultaneously two irrigation systems, for example, sprinkler and micro-irrigation (Table 1).
The most usual plant cover is grass (Stenotaphrum secundatum and Zoysia sp.) with other kinds of vegetation such as olive trees (Olea europaea), rosemary (Rosmarinus officinalis), rosemary (Lavandula spp.), oleander (Nerium oleander) and cypress (Cupressus sempervirens).
The evapotranspiration of the urban green area or landscape [7], ETL (mm/day) was obtained by the equation:
where ETO is the reference evapotranspiration (mm/day), KL is the non-dimensional landscape coefficient. The KL [7] is obtained by the equation:
where the landscape coefficient (KL) equals the product of the microclimate coefficient (Kmc), the plant species coefficient (Kv), which accounts for plant type, Kd, which accounts for plant canopy density, and Kms which accounts for managed water stress.
The gross irrigation water requirements (GIWR) are defined by the equation:
where P is the effective rainfall (mm) and UD is the distribution uniformity (%).
The evaluation of the irrigation systems was carried out according to the procedure described in [8,9], where UD is given by the equation:
where Zlq is the water collected in the lower quartile (mm) e Zla is the average of the collected water (mm).
The vegetation index Normalized Difference Vegetation Index (NDVI) is defined by [3] and is the ratio of the difference of the maximum and minimum reflectance of the vegetation, by the sum of the same reflectance’s, allowing to distinguish the healthy vegetation (values of NDVI near 1) from the vegetation that has some kind of stress (values of NDVI approaching 0). The NDVI is defined by the equation:
where ρNIR represents the near-infrared reflectance and ρRed the red reflectance.
In the present study, images were collected with the camera Canon SX260 HS (sourced by Canon, Tokyo, Japan) coupled with the UAV (Phantom2 DJI). The camera has 6.16 × 4.62 mm, weighs 231 g and is equipped with Global Positioning System (GPS) technology to automatically record the locations in WGS84 coordinates. The focal length is 4.5–90 mm, and the resolution is 12.1 megapixels (4000 × 3000 pixels). This camera records images NIR-green-blue (bands: NIR, green and blue), for this reason in Equation (5) the red reflectance was replaced by the blue reflectance, being obtained the modified NDVI [10].
3. Results and Discussion
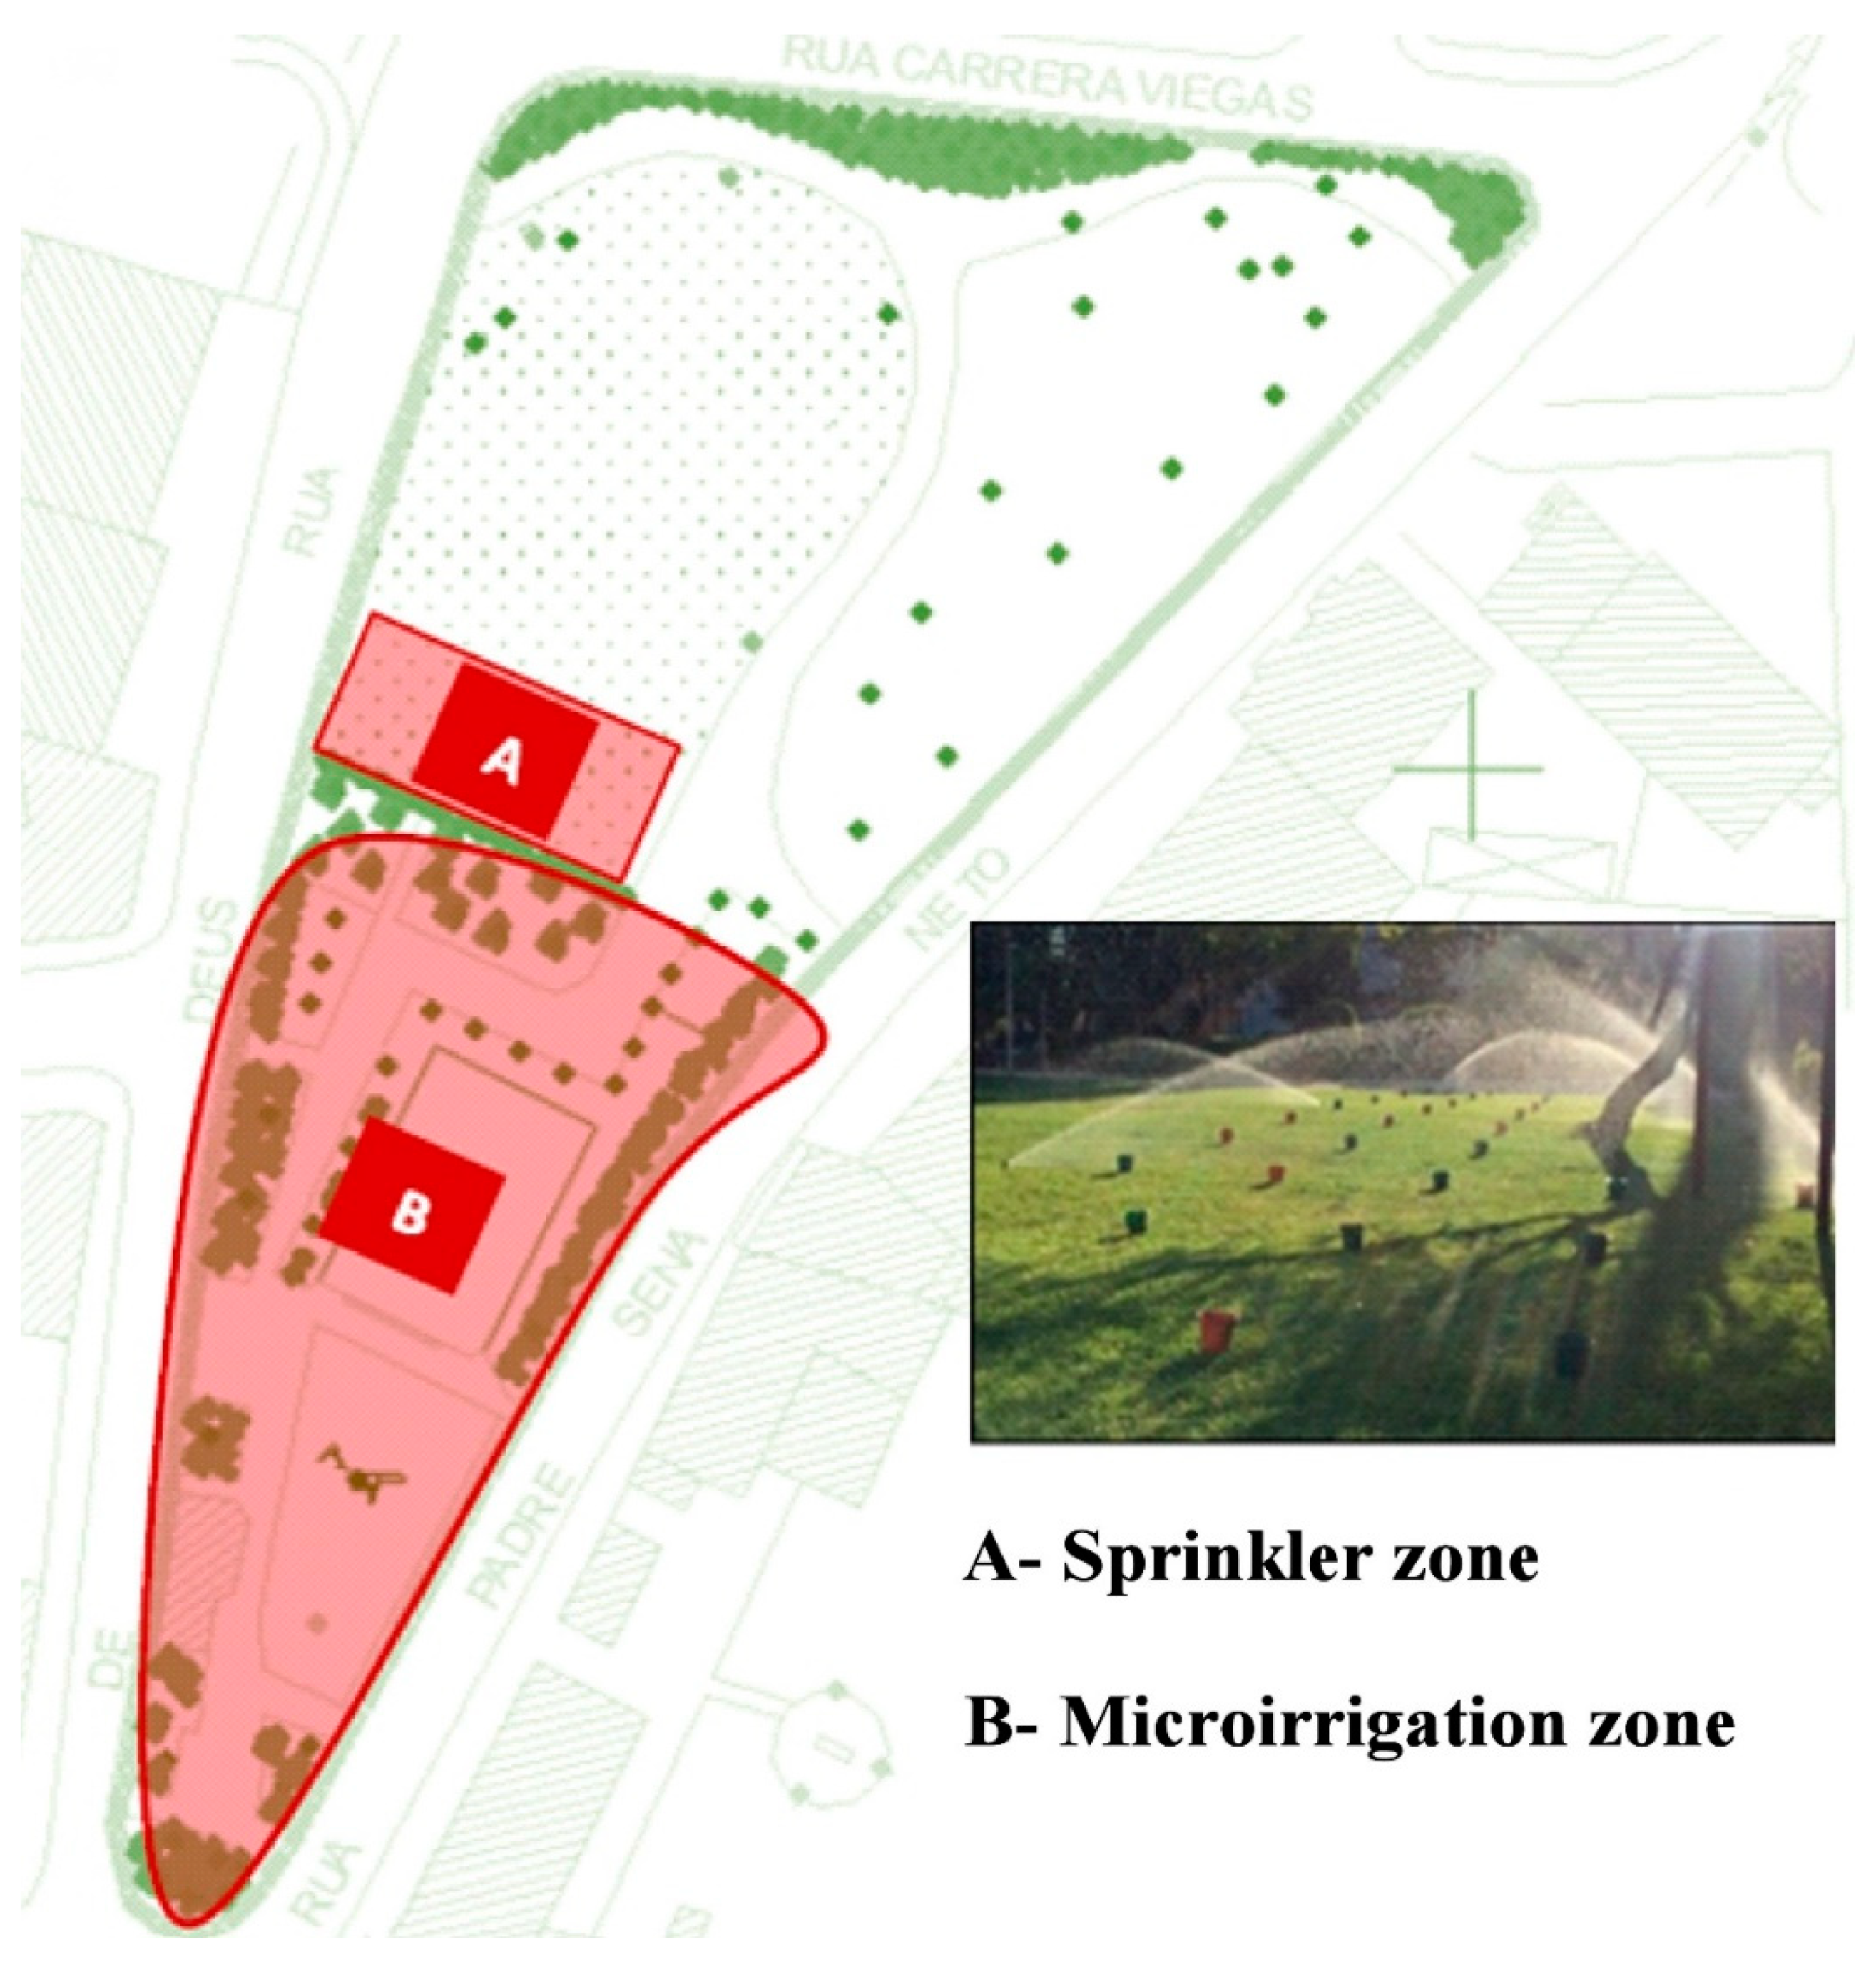
The location of the evaluated irrigation systems is shown in Figure 3: (A) sprinkler irrigation and (B) micro-irrigation. In the sprinkler irrigation, UD values of 40% were obtained from 50 collectors distributed in the irrigated plot and in the micro-irrigation system, UD values of 60% were obtained from 32 drippers. These results are considered low [8,9,10]. Water and soil conservation requires the implementation of good practices that decrease water loss and thus improve irrigation systems performance.
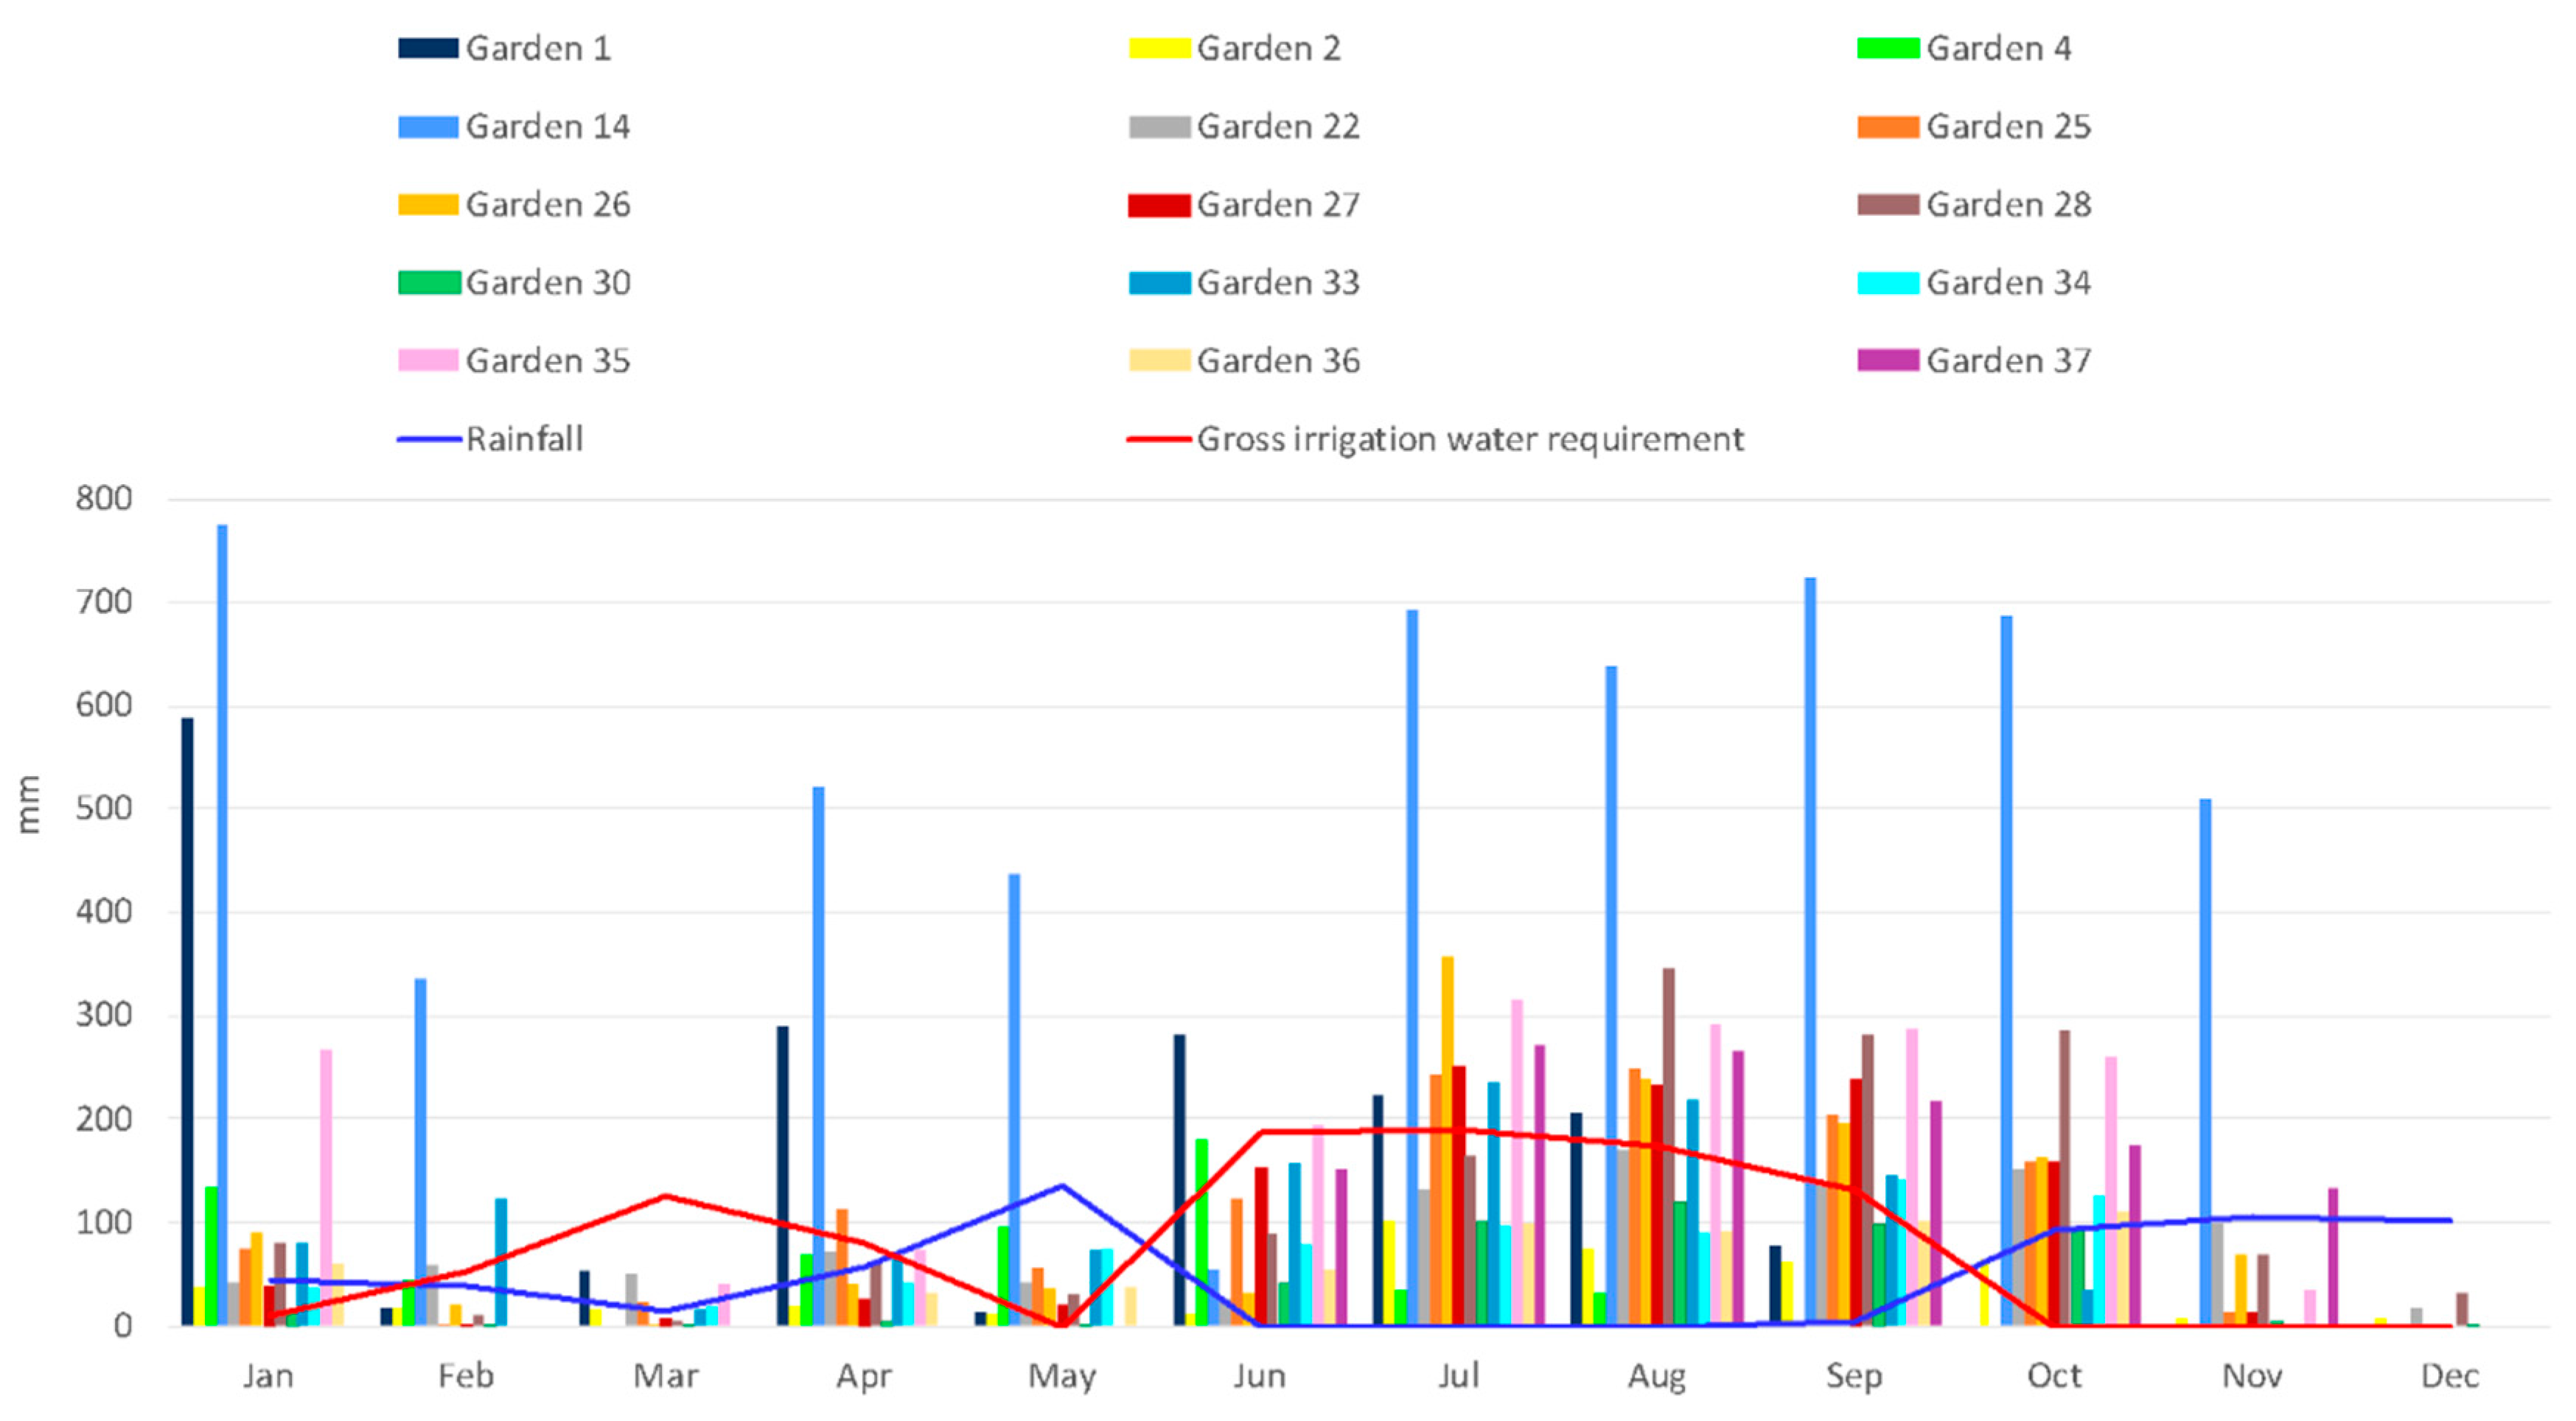
The analysis focused on the urban green areas irrigated by sprinkler irrigation: 1, 2, 14, 22, 25, 26, 27, 28, 30, 33, 34, 35, 36 and 37. In those areas, the ETL was obtained considering the plants’ species that were more water demanding. Figure 4 reveals, for the year 2016, the rainfall values (blue line), the water applied by the municipality (green bar) and the gross water irrigation requirement (black line). In the summer months, the rainfall was practically zero, however, in May 2016 it was observed high precipitation (135 mm), which is not usual. In most of the months in the same year, the irrigation water volume was higher than the GIWR. Thus, there is a potential for water-saving (approximately 19,800 mm/year) that could bring economic and environmental benefits to the municipality of São Brás de Alportel.
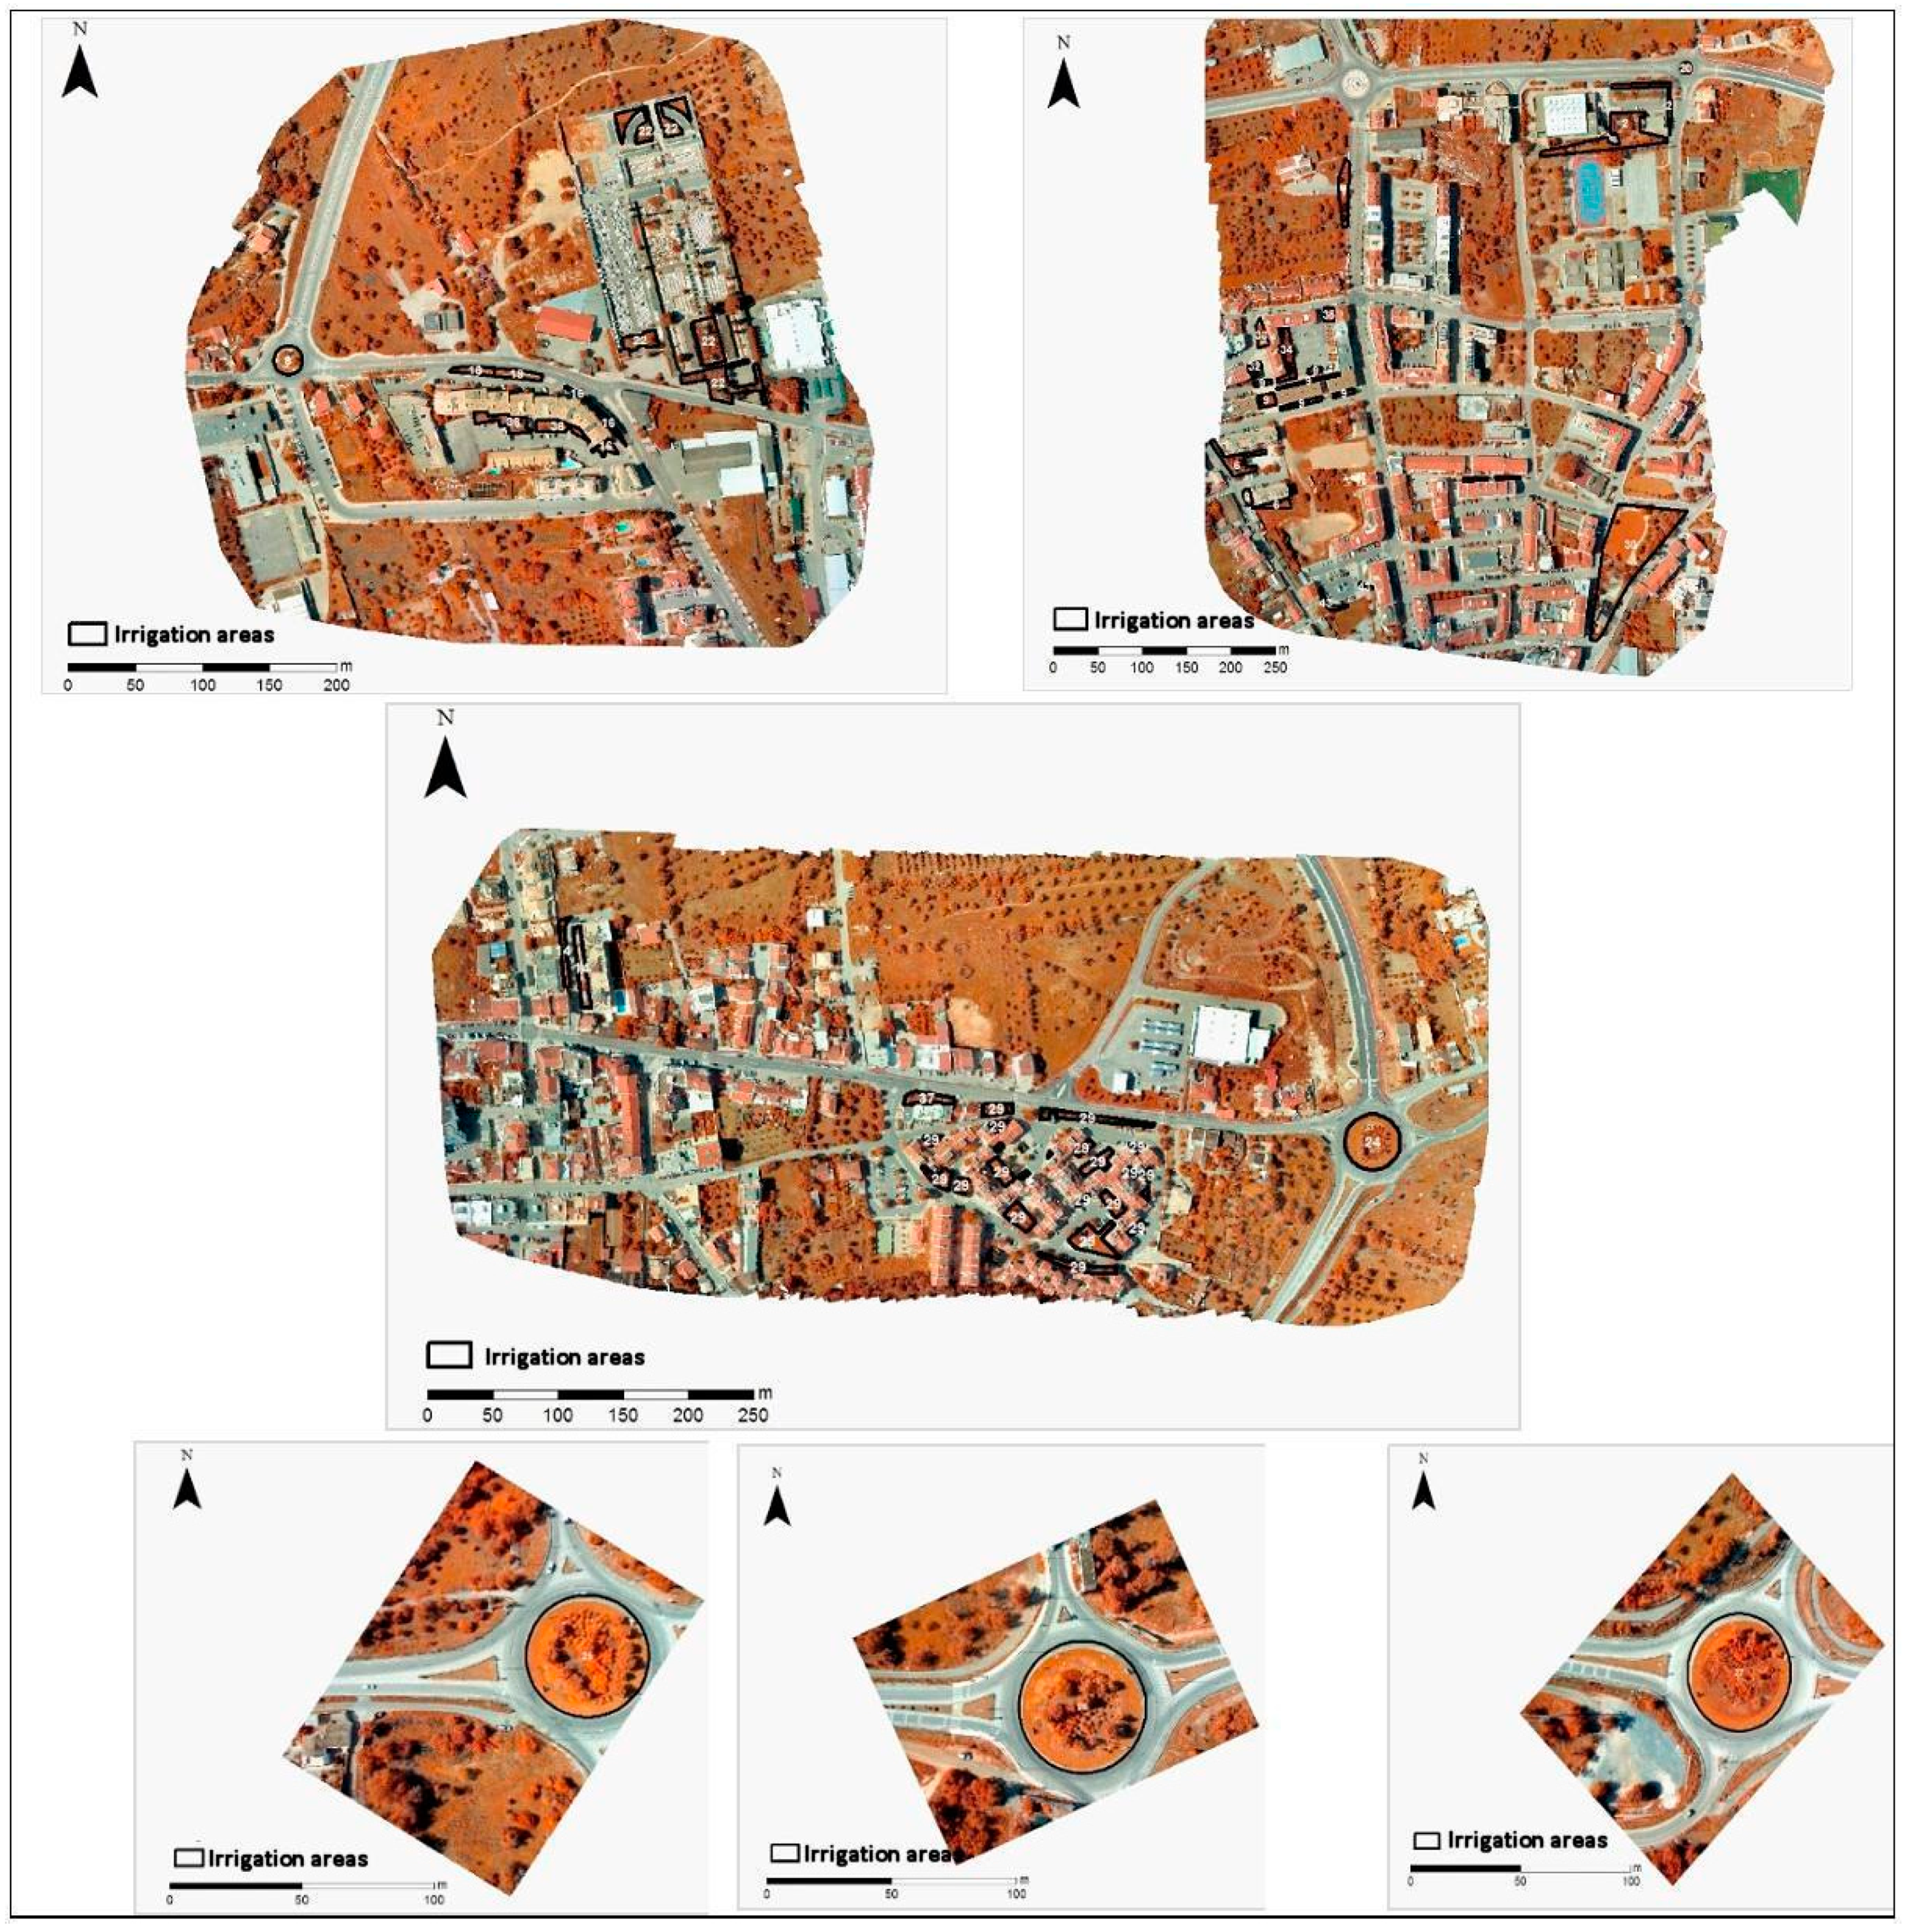
Figure 5 represents the orthomosaics located in the 45 urban green areas from São Brás de Alportel. The production of the orthomosaic was carried out with aerial photos NIR-Green-Blue taken from 100 m altitudes. The orthomosaic is represented in a false-color, where the vegetation is represented in orange.
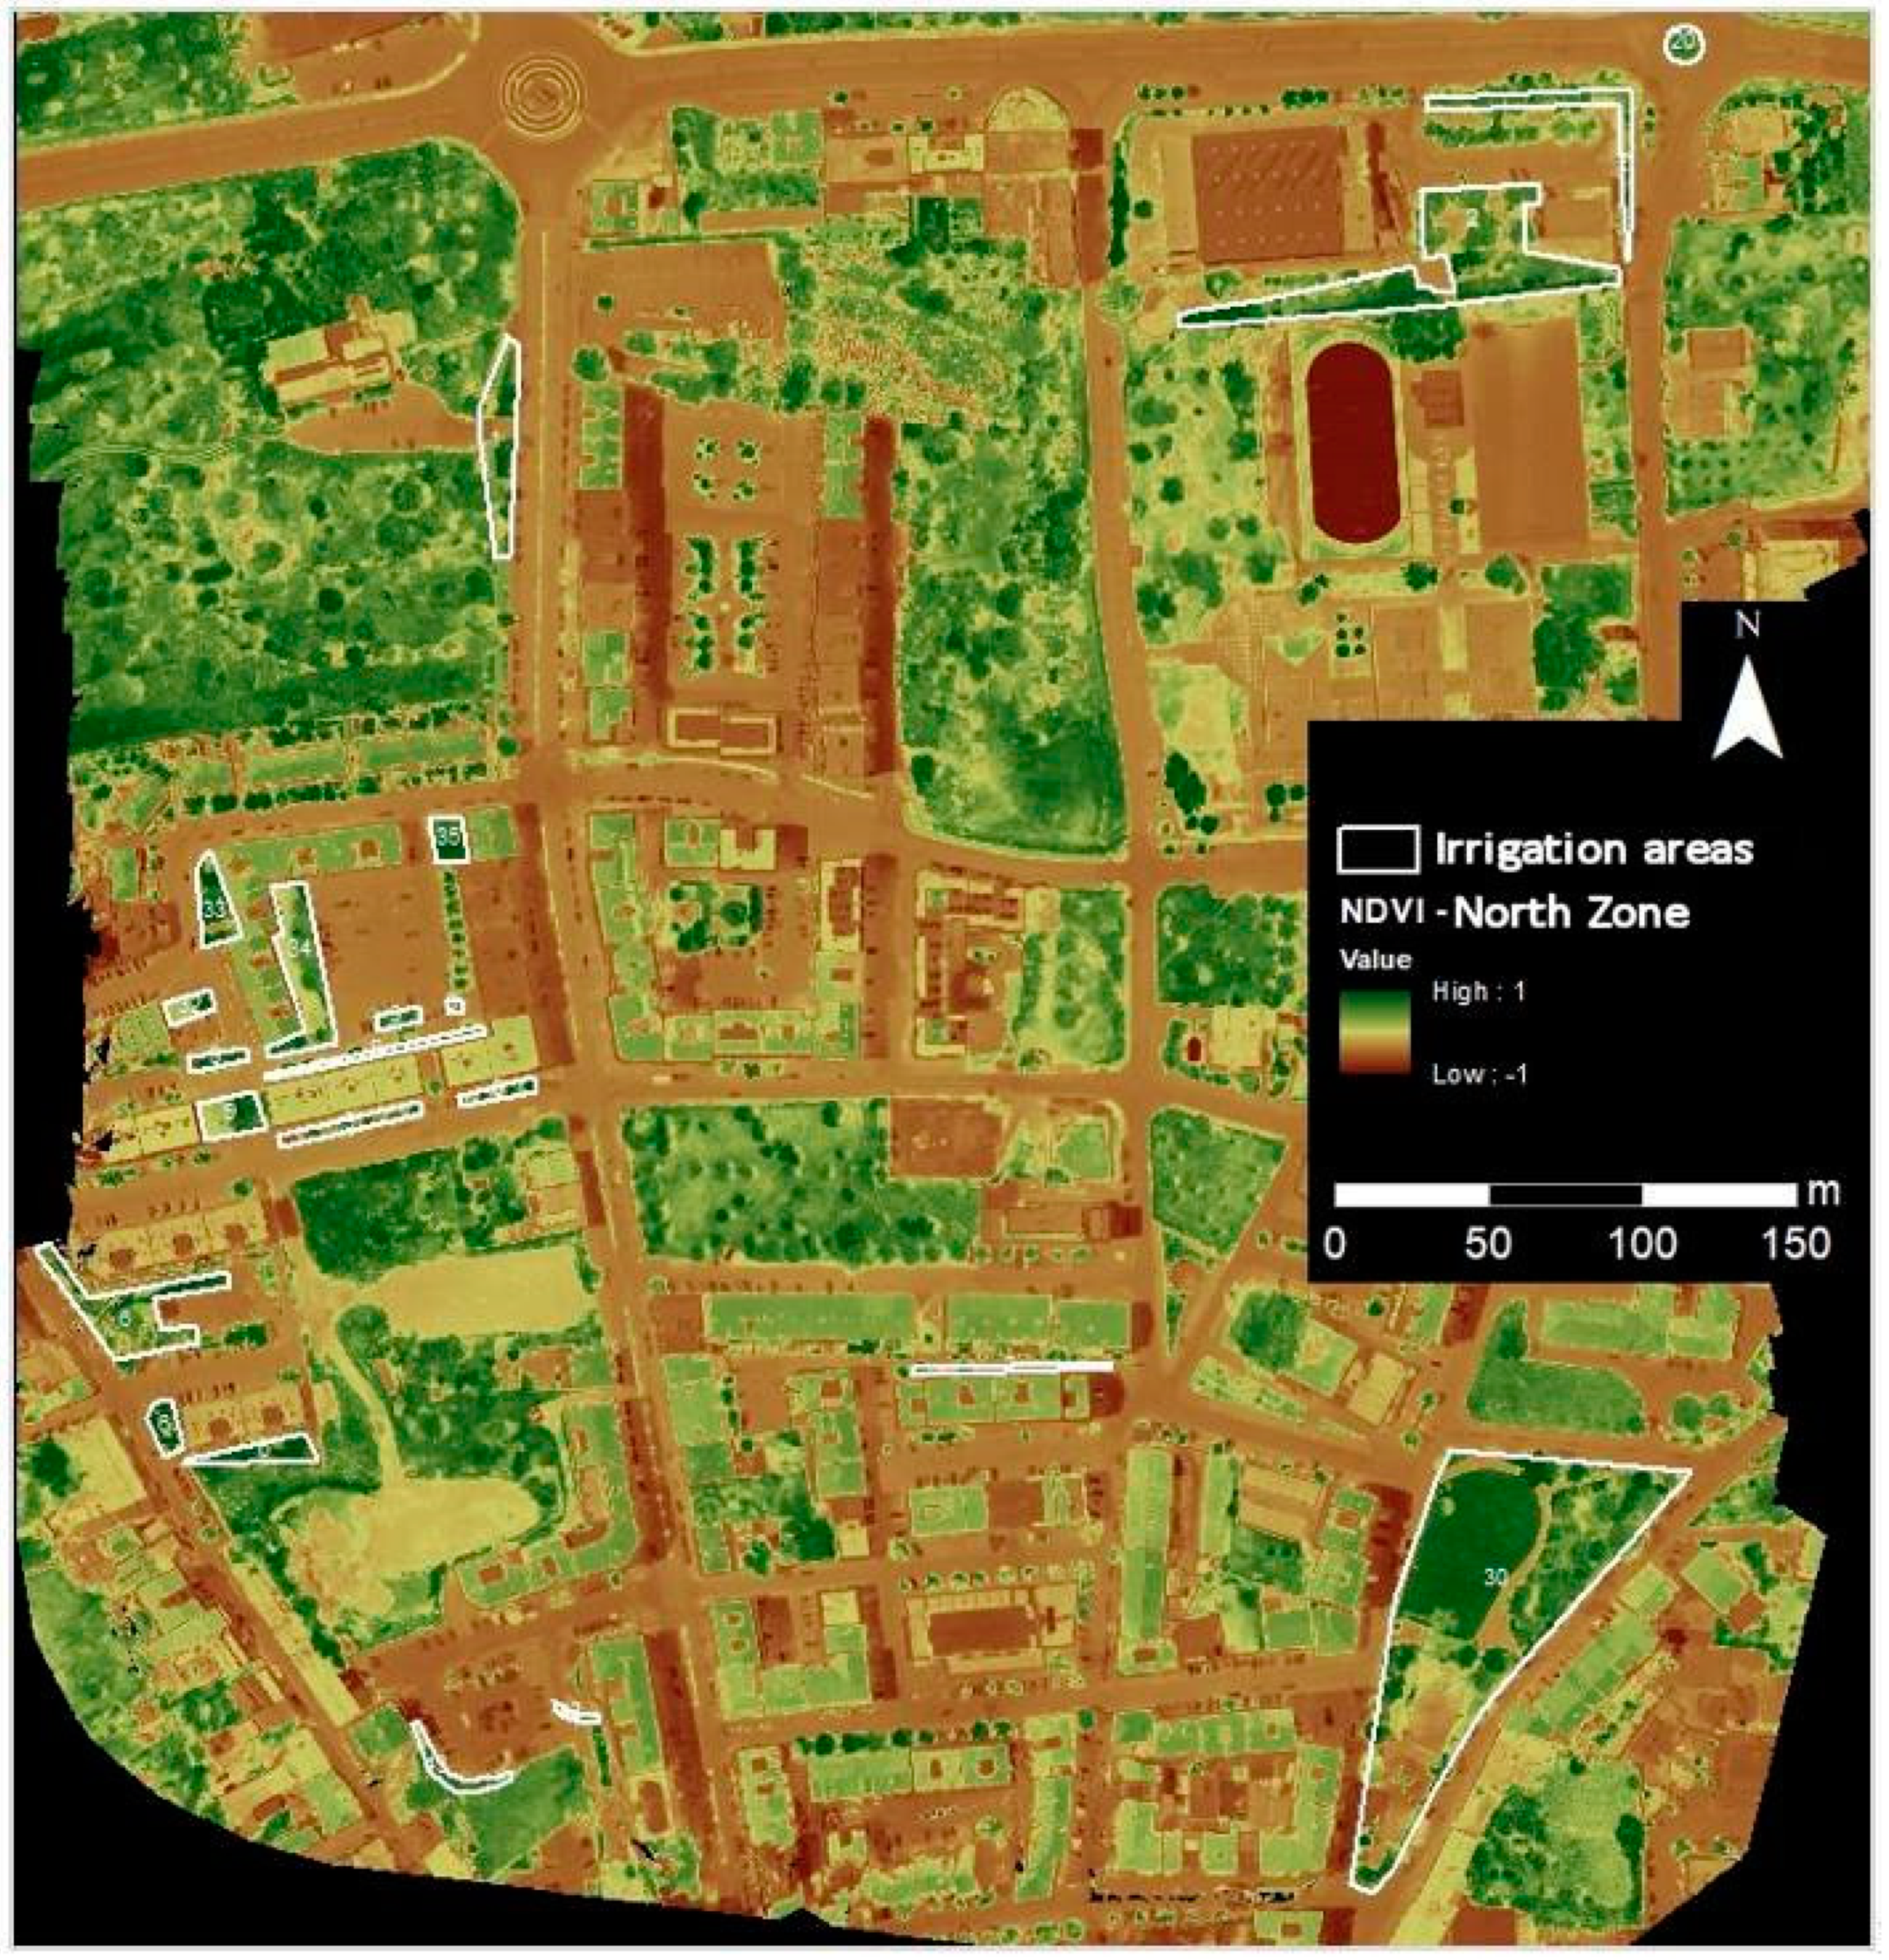
The modified NDVI map of the urban green areas of São Brás de Alportel (1, 2, 3, 6, 8, 9, 20, 30, 32, 33, 34, 35, 36 and 40) is shown in Figure 6. The anthropic elements and the water bodies are represented in orange (negative values), the bare soil and the vegetation with hydric stress in yellow (values near zero) and the healthy vegetation in green (values near 1).
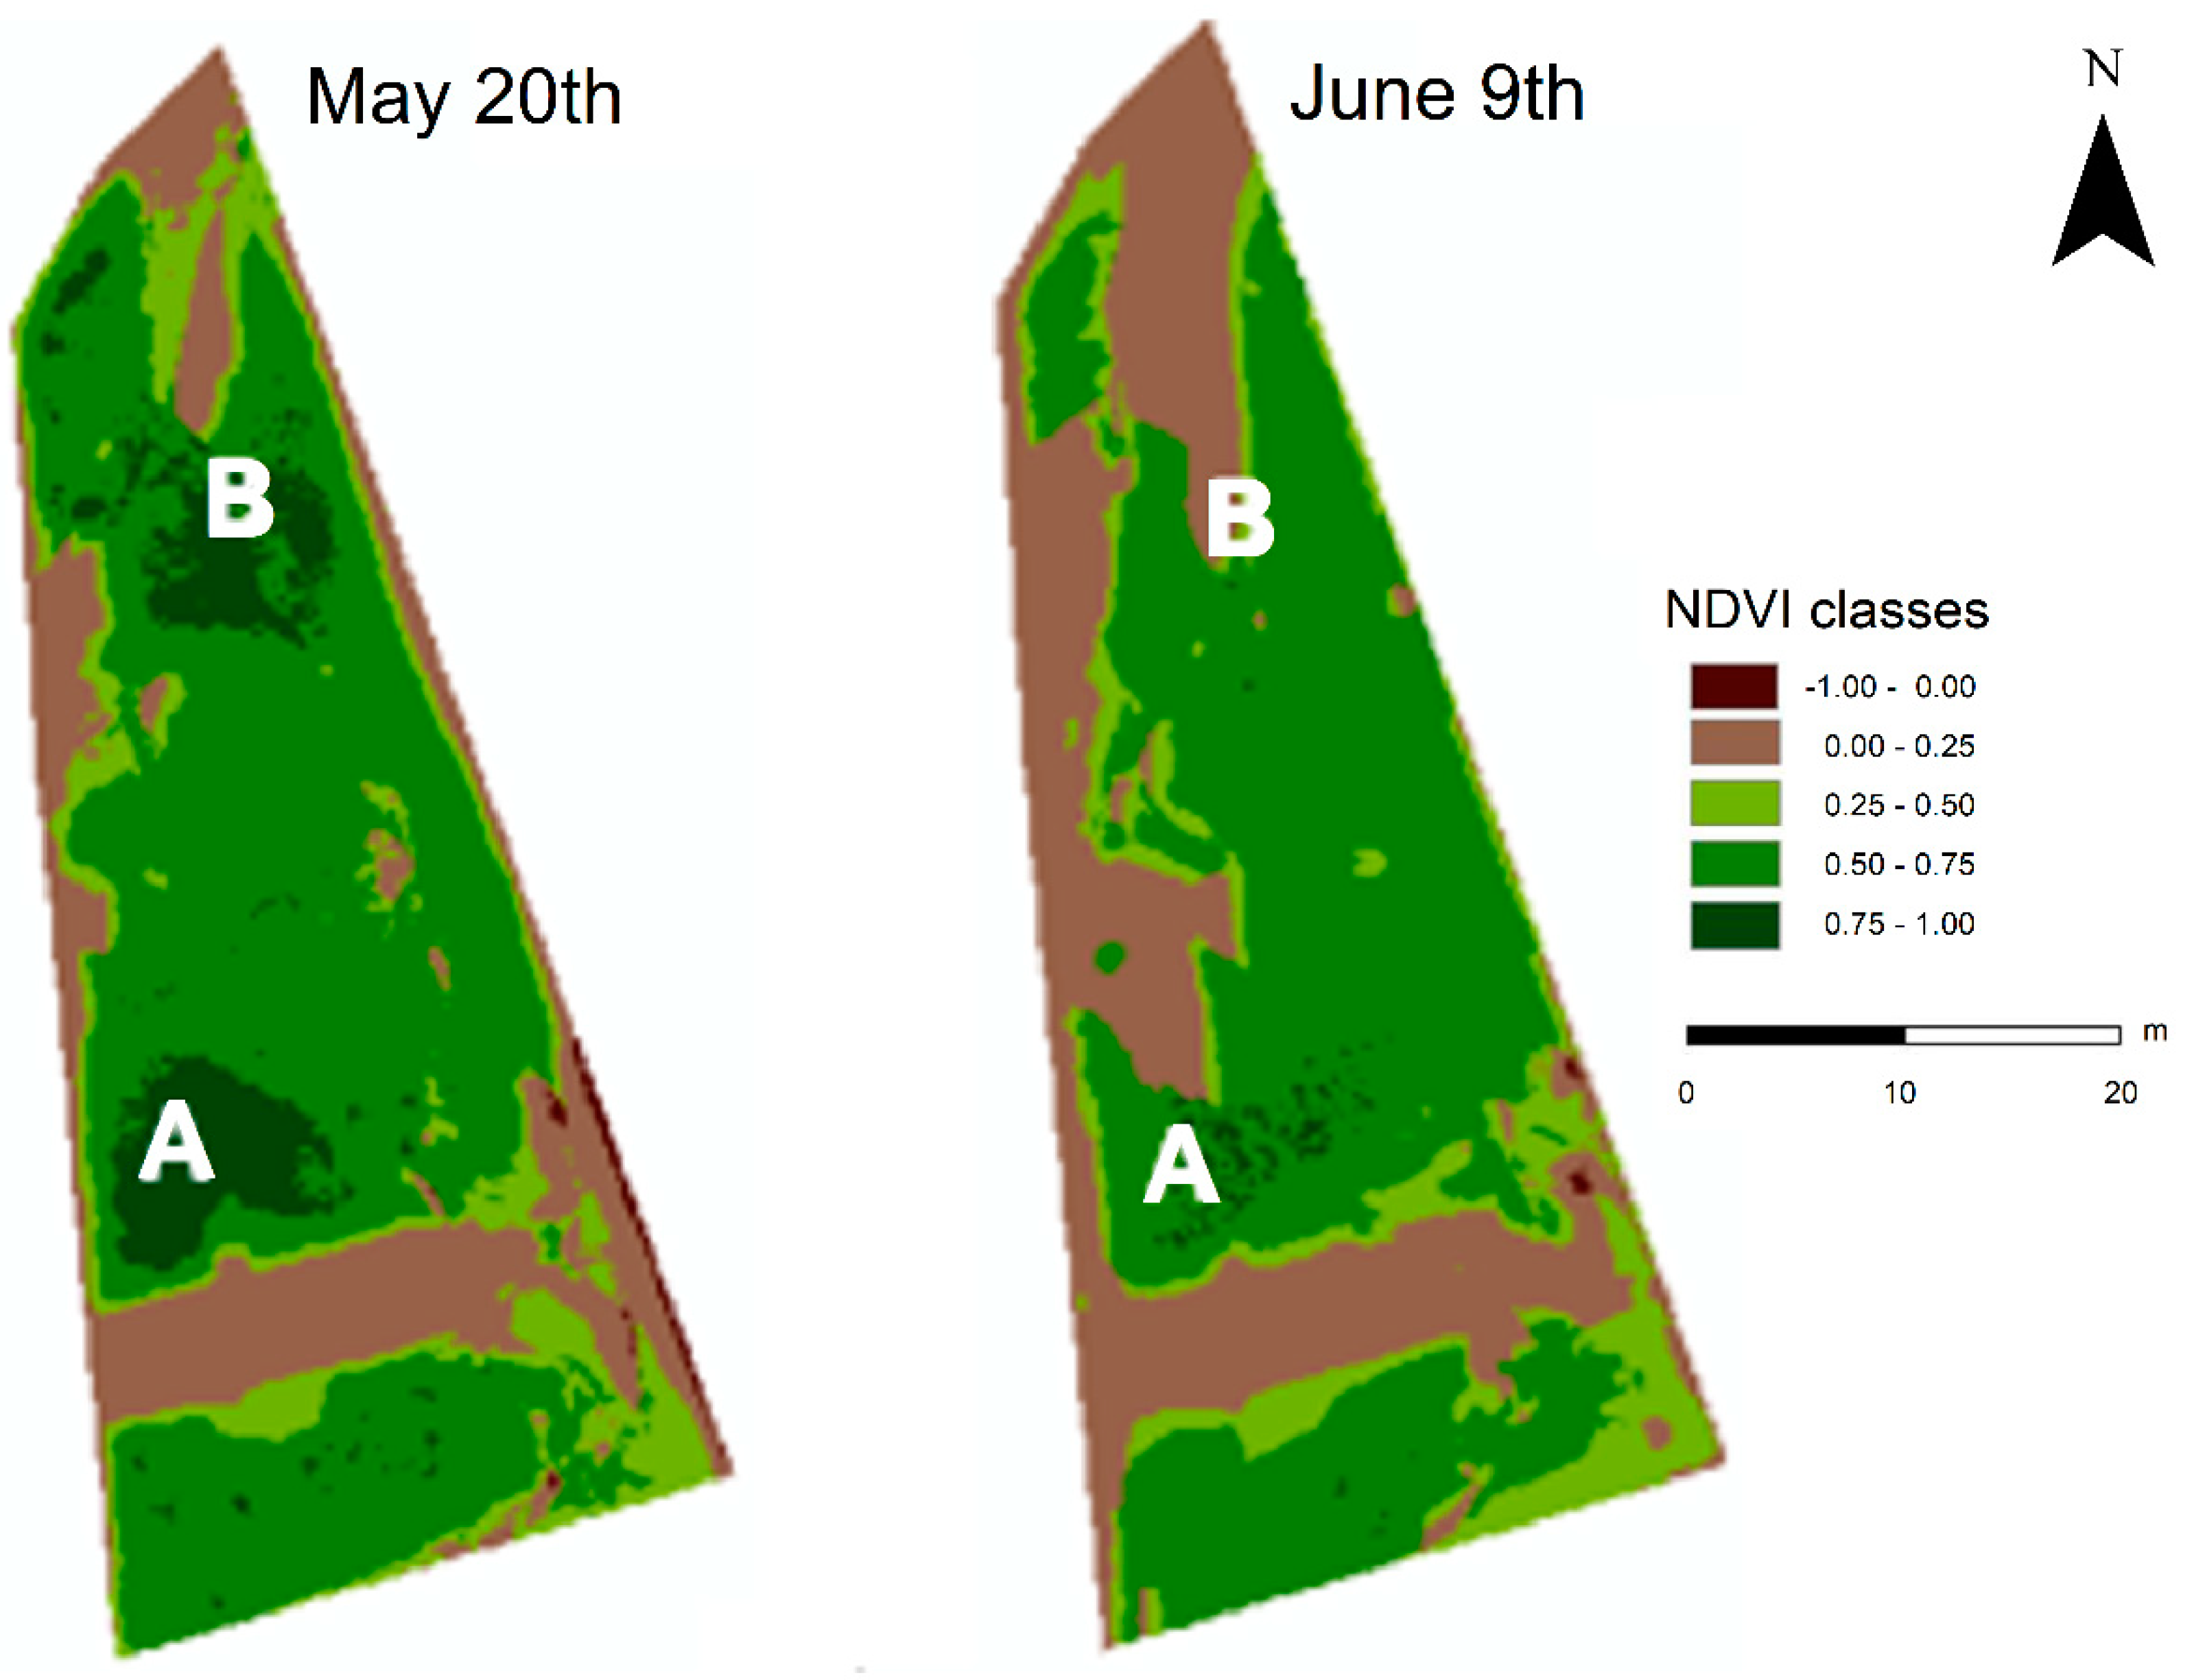
Figure 7 shows the modified NDVI maps of the green area number 33 at two distinct dates: 20 May (left) and 9 June (right). The 20 May image has the highest NDVI values (areas: A and B), suggesting greater photosynthetic activity (i.e., more biomass) in this area. It is also in May that rainfall is more intense (135 mm) and at the same time the urban green area is irrigated (73 mm). The 9 June image shows a decrease in the NDVI values in zone B, where rainfall is approximately zero and although the amount of water applied by irrigation reaches 158 mm is not enough to fill GIWR (187 mm). Overall, good visual appearance is observed in all urban green areas throughout the year (NDVI > 0.5), even in months when no rainfall has occurred, and irrigation has been used to meet the plant water demand. These results are in agreement with those obtained by [11,12,13], where NDVI has allowed a better understanding and improvement of the estimation of crop water requirements of urban landscapes.
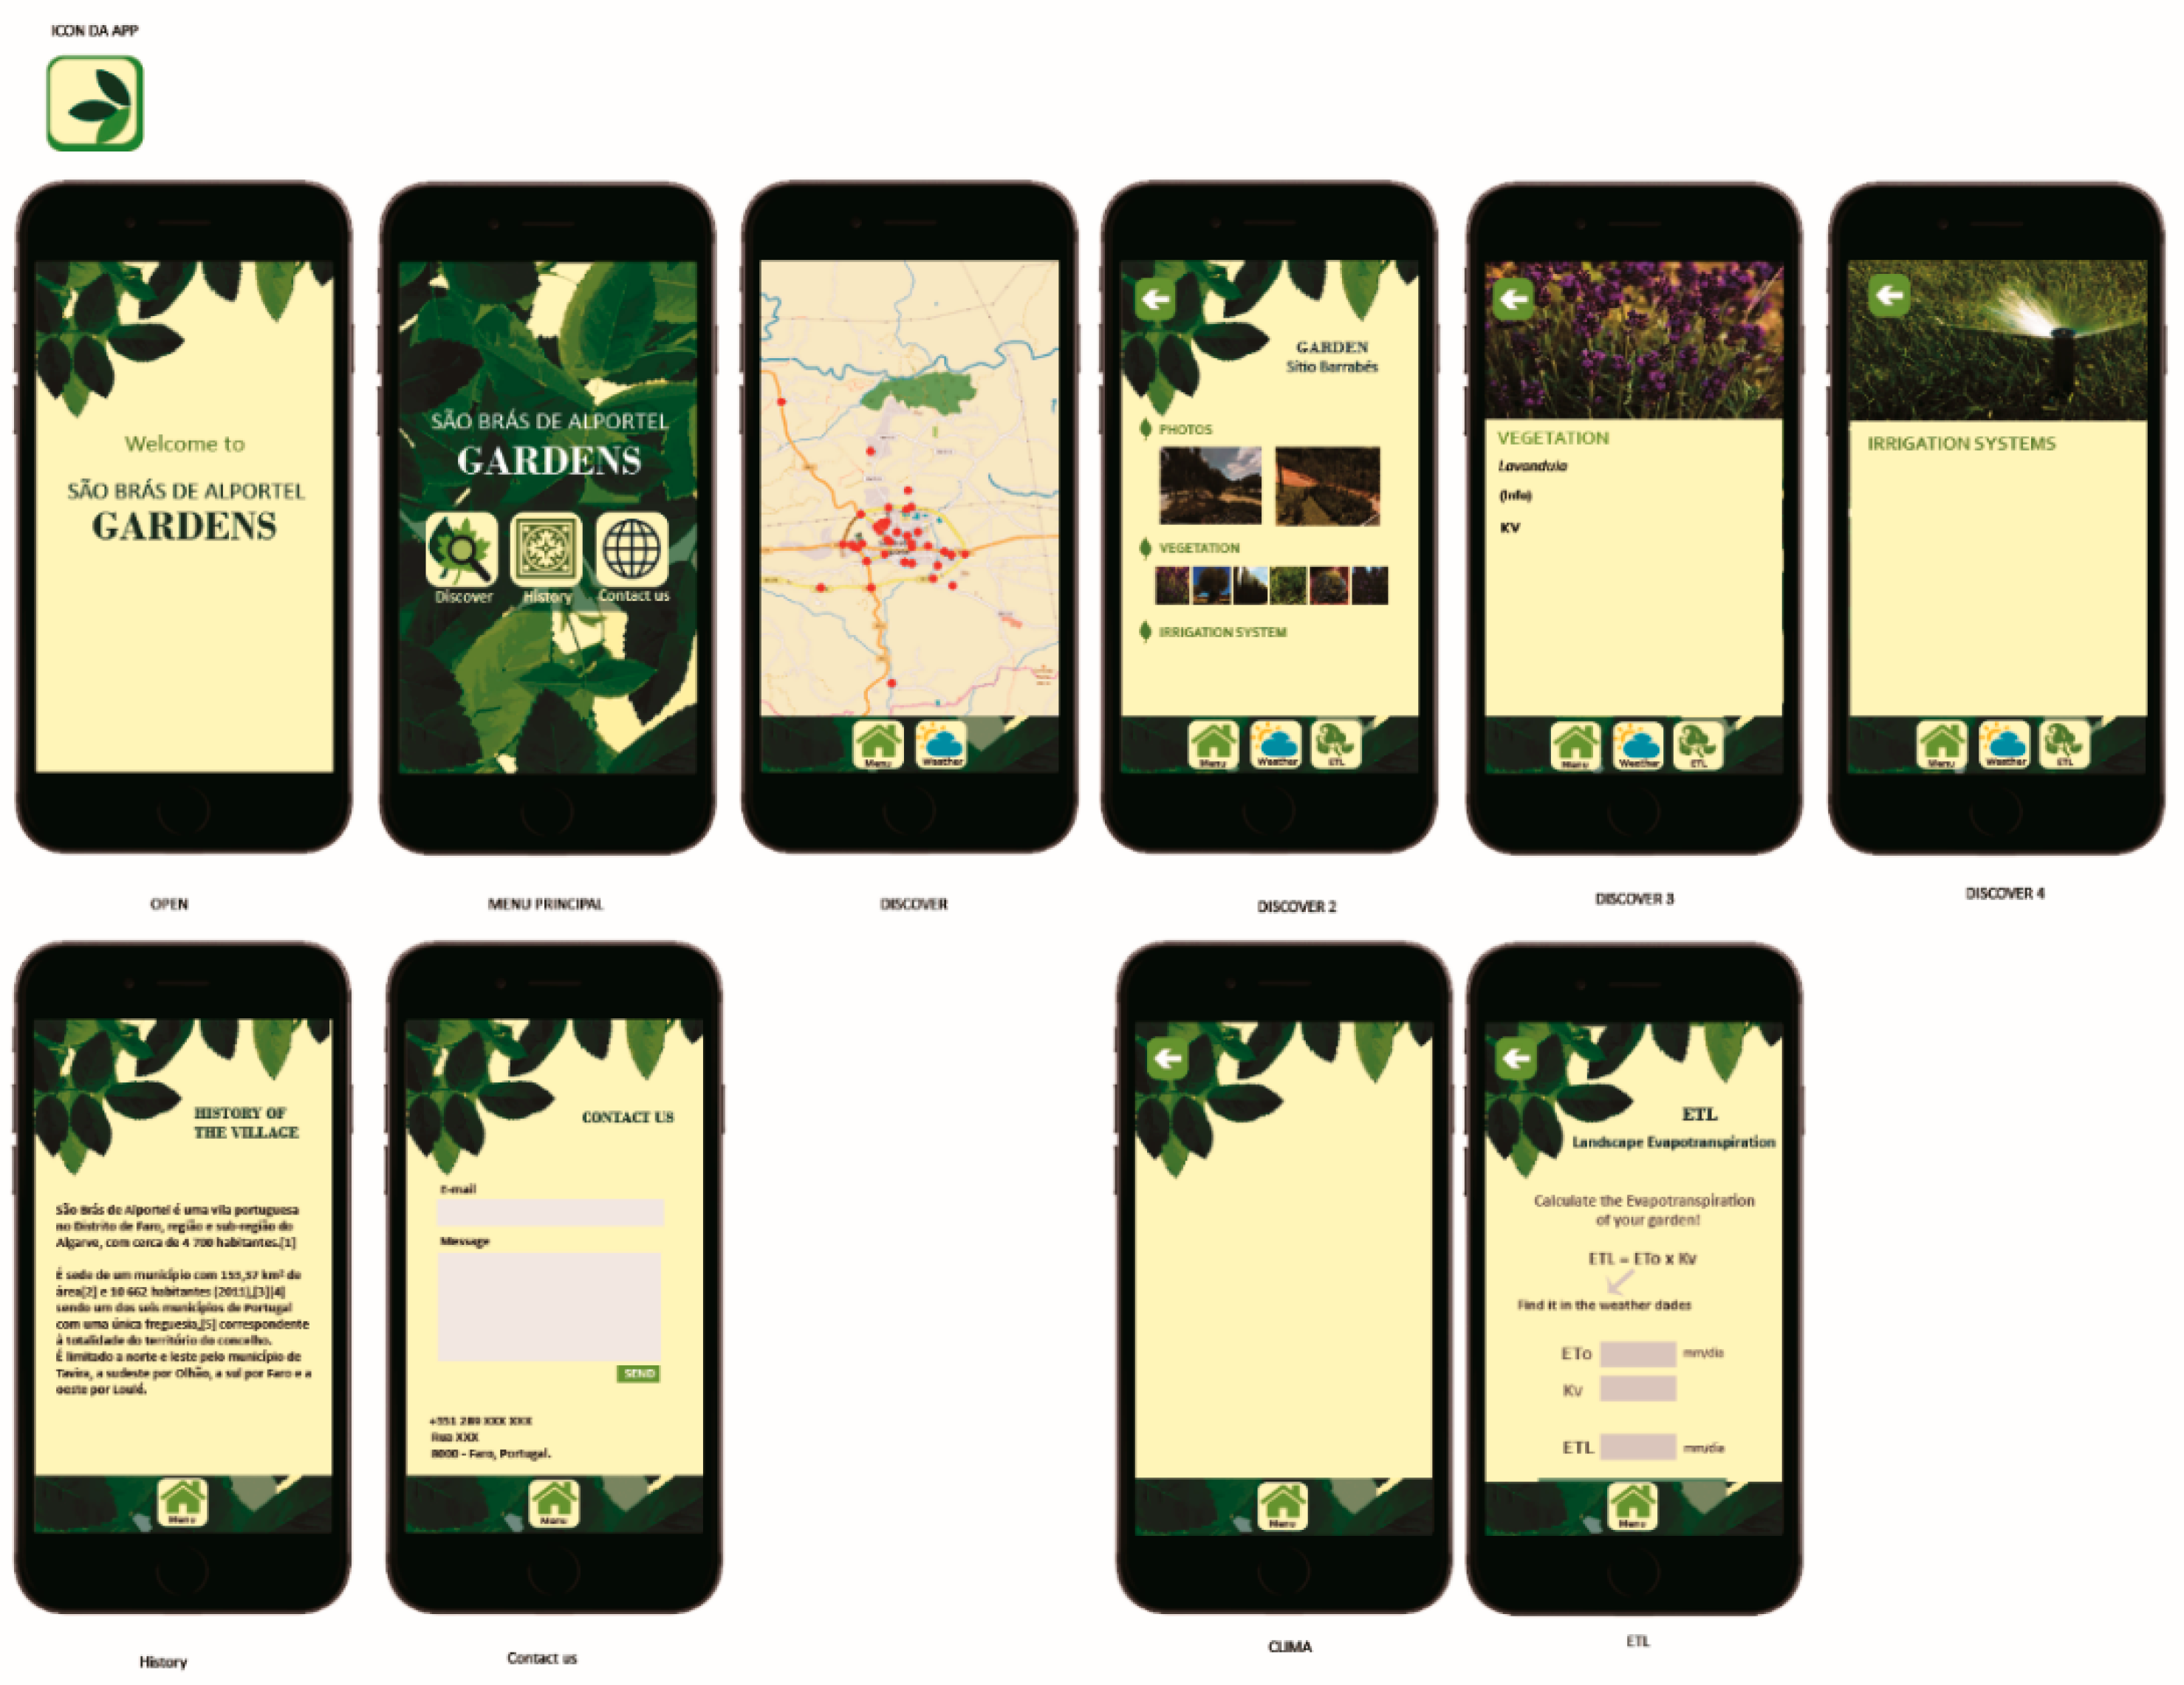
The municipality intended to promote the sustainability of the urban green areas involving the population and promoting strategies for the efficient use of water in the Mediterranean region. A smartphone application was developed with the named: São Brás de Alportel GARDENS (Figure 8). In the application, it is possible to select the urban green area from the map and observe the related data, namely the evapotranspiration, the vegetation, the characteristics of the irrigation system and the sustainable practices in use.
4. Conclusions
Remote sensing methodologies applied to urban green areas, together with the microscale study of the gardens, allowed to evaluate the Mediterranean landscapes of São Brás de Alportel, Portugal. Thus, it was possible to identify the gardens that had higher water consumption values than the required irrigation water requirements and to determine the water saving potential (of about 19,800 mm/year) that could bring economic and environmental benefits to the municipality. The NDVI also allowed to map biomass production levels which shows that the vegetation can be subject to a slight water deficit maintaining its visual quality.
Author Contributions
H.M.F. and F.G.-M. carried out the UAV flight, collected the aerial images, computed the vegetation indexes and contributed in the writing and revision of the manuscript. C.M.G.P. conceived the study and reviewed the manuscript. R.L. configured and collected data from the weather stations sensors and data logger, applied the algorithm for the ETO and ETL and also contributed in the revision of the manuscript. All authors have read and agreed to the published version of the manuscript.
Funding
This research received no external funding.
Acknowledgments
The authors which the acknowledge the municipality of São Brás de Alportel that made this study possible.
Conflicts of Interest
The authors declare no conflict of interest.
References
- Pérez-Urrestarazu, L.; Egea, G.; Ruiz-Alcalá, C.; Roldán-Olmo, F.; Fernández-Cañero, R. Water management assessment in a historic garden: the case study of the Real Alcazar (Seville, Spain). Urban For. Urban Green. 2018, 29, 192–199. [Google Scholar] [CrossRef]
- Costello, L.R.; Matheny, N.P.; Clark, J. A Guidetoestimating Irrigation Waterneeds of Landscape Plantings in California; The Landscape Coefficient Method and WUCOLS III; University of California: Sacramento, CA, USA, 2000. [Google Scholar]
- Rouse, J.W.; Haas, R.H.; Schell, J.A.; Deering, D.W. Monitoring vegetation systems in the great plains with ETRS. In 3º ERTS-1 Symposium; Nasa SP-351; NASA: Washington, DC, USA, 1974; pp. 309–317. [Google Scholar]
- Chuvieco, S.E. Teledetección Ambiental: La Observación de la Tierra Desde el Espacio; Editorial Ariel: Madrid, Spain, 2002. [Google Scholar]
- Tasumi, M.; Allen, R.G.; Trezza, R.; Wright, J. Satellite-Based Energy Balance to Assess Within-Population variance of crop coefficient curves. J. Irrig. Drain. Eng. 2005, 131, 94–109. [Google Scholar] [CrossRef]
- SNIRH Dados da Estação Meteorológica de São Brás de Alportel. Autoridade Nacional da Água, Sistema Nacional de Informação de Recursos Hídricos, 2001. Available online: http://snirh.apambiente.pt/snirh/_dadosbase/site/simplex.php?OBJINFO=DADOS&FILTRA_BACIA=992&FILTRA_COVER=920123704&FILTRA_SITE=920685676 (accessed on 26 July 2018).
- Allen, R.G.; Wright, J.L.; Pruitt, W.O.; Pereira, L.S.; Jensen, M.E. Water Requirements. In Design and Operation of Farm Irrigation Systems, 2nd ed.; American Society of Agricultural and Biological Engineers: St. Joseph, MI, USA, 2007; pp. 208–288. [Google Scholar]
- Merriam, J.L.; Keller, J. Farm Irrigation System Evaluation. In A Guide for Management, 3rd ed.; Utah State University: Logan, UT, USA, 1978. [Google Scholar]
- ASAE-EP458. Design and installation of microirrigation systems. In ASAE Standards 2004; Standards Engineering Practices Data; ASAE: St Joseph, MI, USA, 2004; pp. 928–992. [Google Scholar]
- Hartin, J.; Oki, L.; Fujino, D.; Reid, K.; Ingels, C.; Haver, D.; Baker, W. UC ANR-research and education influences landscape water conservation and public policy. Calif. Agric. 2019, 73, 25–32. [Google Scholar] [CrossRef]
- Zhao, T.; Stark, B.; Chen, Y.; Ray, A.L.; Doll, D. A detailed field study of direct correlations between ground truth crop water stress and normalized difference vegetation index (NDVI) from small unmanned aerial system. In Proceedings of the 2015 International Conference on Unmanned Aircraft Systems (ICUAS), Denver, CO, USA, 9–12 June 2015; pp. 520–525. [Google Scholar]
- Canales-Ide, F.; Zubelzu, S.; Rodríguez-Sinobas, L. Irrigation systems in smart cities coping with water scarcity: The case of valdebebas, Madrid (Spain). J. Environ. Manag. 2019, 247, 187–195. [Google Scholar] [CrossRef] [PubMed]
- Chiesi, M.; Battista, P.; Fibbi, L.; Gardin, L.; Pieri, M.; Rapi, B.; Romani, M.; Sabatini, F.; Maselli, F. Spatio-temporal fusion of NDVI data for simulating soil water content in heterogeneous Mediterranean areas. Eur. J. Remote Sens. 2019, 52, 88–95. [Google Scholar] [CrossRef] [Green Version]
Figure 1.
Localization of São Brás de Alportel, Portugal.

Figure 2.
Localization of the 45 urban green areas in São Brás de Alportel.

Figure 3.
Urban green area number 30 and its irrigation systems.

Figure 4.
Rainfall, evapotranspiration and gross irrigation water Requirements (GIWR) of the urban green areas from São Brás de Alportel in 2016.
Figure 4.
Rainfall, evapotranspiration and gross irrigation water Requirements (GIWR) of the urban green areas from São Brás de Alportel in 2016.

Figure 5.
Near Infra-Red (NIR)-green-blue orthomosaics of six urban green areas from São Brás de Alportel.
Figure 5.
Near Infra-Red (NIR)-green-blue orthomosaics of six urban green areas from São Brás de Alportel.

Figure 6.
Modified normalized difference vegetation index (NDVI) from the urban green areas (white contours) maintained by the municipality of São Brás de Alportel.
Figure 6.
Modified normalized difference vegetation index (NDVI) from the urban green areas (white contours) maintained by the municipality of São Brás de Alportel.

Figure 7.
NDVI from the urban green area number 33 observed in: 20 May and 9 June.

Figure 8.
Application: São Bras de Alportel GARDENS.


Table 1.
Irrigation systems of the São Brás de Alportel urban gardens.
| GARDEN | IRRIGATION SYSTEM | GARDEN | IRRIGATION SYSTEM | GARDEN | IRRIGATION SYSTEM |
|---|---|---|---|---|---|
| 1 | AMR | 16 | A | 31 | AMRM |
| 2 | A | 17 | MR | 32 | A |
| 3 | MR | 18 | A | 33 | A |
| 4 | A | 19 | A | 34 | A |
| 5 | A | 20 | A | 35 | A |
| 6 | A | 21 | A | 36 | AMR |
| 7 | A | 22 | AM | 37 | A |
| 8 | A | 23 | AMRM | 38 | A |
| 9 | A | 24 | A | 39 | AMR |
| 10 | A | 25 | A | 40 | MR |
| 11 | A | 26 | A | 41 | MR |
| 12 | MR | 27 | A | 42 | MR |
| 13 | MR | 28 | A | 43 | MR |
| 14 | AMR | 29 | A | 44 | AMR |
| 15 | AMR | 30 | AMR | 45 | MR |
Legend: A = sprinkler; AM = sprinkler and manual; AMRM = sprinkler, micro irrigation and manual; MR = micro irrigation; AMR = sprinkler and micro irrigation.
© 2020 by the authors. Licensee MDPI, Basel, Switzerland. This article is an open access article distributed under the terms and conditions of the Creative Commons Attribution (CC BY) license (http://creativecommons.org/licenses/by/4.0/).
Share and Cite
MDPI and ACS Style
Pedras, C.M.G.; Fernandez, H.M.; Lança, R.; Granja-Martins, F. Applying Remote Sensing Technologies in Urban Landscapes of the Mediterranean. AgriEngineering 2020, 2, 27-36. https://0-doi-org.brum.beds.ac.uk/10.3390/agriengineering2010002
AMA Style
Pedras CMG, Fernandez HM, Lança R, Granja-Martins F. Applying Remote Sensing Technologies in Urban Landscapes of the Mediterranean. AgriEngineering. 2020; 2(1):27-36. https://0-doi-org.brum.beds.ac.uk/10.3390/agriengineering2010002
Chicago/Turabian StylePedras, Celestina M. G., Helena Maria Fernandez, Rui Lança, and Fernando Granja-Martins. 2020. "Applying Remote Sensing Technologies in Urban Landscapes of the Mediterranean" AgriEngineering 2, no. 1: 27-36. https://0-doi-org.brum.beds.ac.uk/10.3390/agriengineering2010002