Article

Comparative Assessment of Thermo-Syngas Fermentative and Liquefaction Technologies as Waste Plastics Repurposing Strategies

by
Oseweuba Valentine Okoro
* and
Funmilayo D. Faloye
Department of Process Engineering, Stellenbosch University, Private Bag X1, Matieland 7602, South Africa
*
Author to whom correspondence should be addressed.
Submission received: 30 May 2020 / Revised: 6 July 2020 / Accepted: 6 July 2020 / Published: 8 July 2020

Abstract

:
The present study comparatively investigates the potential of waste plastic utilization as a feedstock for the production of liquid fuels to satisfy the rising liquid fuel demands of the transportation industry while simultaneously resolving the global plastic waste pollution challenge. For the first time, therefore, conceptual models simulating the production of transportation fuels of ethanol and gasoline from waste plastics via the technologies of thermo-syngas fermentation and hydrothermal liquefaction were assessed using classic technoeconomic assessment methods. The conceptual models were developed based on existing experimental data as obtained from the literature and simulated using ASPEN Plus as the preferred process simulation tool. This study demonstrated the technical viability of both conversion pathways with the hydrothermal liquefaction (HTL) of waste plastics for gasoline production shown to constitute a more economically preferable pathway. This was because the HTL of waste plastics presented a higher internal rate of return (IRR) value and a lower unit processing cost of 51.3% and USD 0.38 per kg compared to the thermo-syngas fermentation pathway that presented an IRR value and a unit processing cost value of 22.2% and USD 0.42 per kg, respectively. Payback periods of 5 years and 2 years were also determined as vital to recoup initial capital invested in the thermo-syngas fermentation project and the HTL project, respectively. Therefore, this study provides a basis for further work regarding waste plastic management strategies while offering a useful guide for policy makers in determining the most cost-effective way to utilize waste plastic and thus promote favorable environmental outcomes.

Graphical Abstract

1. Introduction

It is now well acknowledged that anthropogenic activities exacerbate global warming and climate change challenges while simultaneously depleting global fossil resources. Notably, the transport sector constitutes the major generator of greenhouse gases which are responsible for the aforementioned environmental issues [1]. This is because the transport sector is highly energy intensive and constitutes a corner stone of all sectors of the global economy, notably the agricultural sectors which is characterized by an overwhelming dependence on fossil fuels [1,2]. Despite the development of electric vehicles gaining momentum globally, about 85% of transport fuel is projected to still rely on fossil fuels by the year 2035 [3,4]. Clearly the development of decarbonization strategies oriented towards sustainable transportation of agricultural products and people is crucial [1].
Notably also, the recent trends show an escalation of plastic waste generation with annual waste plastic generated projected to reach 150 million tons by the year 2050 [5,6,7]. Plastic waste consists of an array of polymers which include polyethylene (PE), polypropylene (PP), polyethylene tetraphthalate (PET), polyvinyl chloride (PVC), polystyrene (PS), and polycarbonate (PC) [8]. Although these plastic polymers exhibit different chemical compositions, they present common features of high volatile content, high viscosity, high energy density, low melting point, and low degradation [9,10,11]. The low degradability of waste plastic often poses many challenges to its management; a robust management option must, therefore, include an opportunity for upcycling and energy recovery [12,13]. It is, therefore, imperative to consider sustainable management options for these waste products into valuable resources such as alternative fuels, energy, and chemicals [14,15]. Some waste plastic management techniques may include landfilling, incineration, mechanical recycling, and thermochemical recycling [16,17]. However, the commonly employed incineration approach leads to the emission of toxic substances into the environment resulting in environmental pollution from the release of poisonous gases such as dioxins, furans, and polychlorinated biphenyls [18,19], with thermochemical recycling usually preferred. This is because thermochemical recycling of waste plastic is a sustainable option since the approach facilitates the depolymerization of the plastic polymers to produce high-value products and lower waste residue [17]. Recently, the production of liquid fuels from waste plastic via thermochemical recycling has generated significant interest. Such thermochemical recycling methods involves the thermochemical depolymerization of plastic wastes to monomers or syngas, followed by fermentation [20] or mixed alcohol synthesis [21] to generate useful liquid fuels or the direct conversion of plastics to liquid fuels via hydrothermal liquefaction [22]. Hydrothermal liquefaction is a technology with the capability to treat wet and dry materials into renewable crude like oil which may require further processing into a liquid fuel [23,24]. Hydrothermal liquefaction of waste plastic consists of the transformation of heavy molecules to lower monomers leading to the production of liquid fuels, unsaturated hydrocarbon, olefins and aromatic compounds. Typically, hydrothermal liquefaction processes occur in the presence of water at temperatures ranging from 250 to 450 °C, pressures ranging from 70 to 350 bar pressure and residence times ranging from 5 to 60 min [25]. The technology offers considerable benefits of simple operational design, high carbon efficiency, with the resulting crude containing 10 to 20 percent of oxygen and a heating value (35 MJ/kg) similar to petroleum crude oil [26]. Interestingly, since the waste plastics contain mainly H and C elements with negligible quantities of ash and oxygen, it suggests the possibility of generating a high-grade hydrocarbon oil mixture with reduced possibility of oxygenated compound formation. This, therefore, also implies that the need for additional hydrogenation steps will be redundant [27].
Consequently, recognising the potential of converting waste plastics to liquid fuels via thermochemical processes as discussed above, the current study seeks to comparatively investigate two possible pathways of waste plastics to liquid fuel conversion, namely, thermos-syngas fermentation and hydrothermal liquefaction for ethanol and gasoline transportation fuel generation. To the best of our knowledge such a comparative assessment is yet to be undertaken in the literature. The thermo-syngas fermentation strategy has been employed as the preferred strategy for liquid fuel production compared to the mixed alcohol synthesis approach due to limitations in the robustness, flexibility and higher production cost when compared with thermo-syngas fermentation strategy [28]. The novelty of the present study is therefore highlighted by not only its comprehensive comparative study of performances of possible transportation fuel production strategies but by also the utilization of an unconventional waste stream of plastics as a useful resource.
For clarity it must be emphasized that the models presented in this manuscript are conceptual models which are developed based on publicly available reaction conditions, conversions and product yields with generic processes for producing specific projects, simulated. In other words the models do not replicate data from any existing commercial plants which may incorporate proprietary processes to enhance production of the target products.

2. Methodology

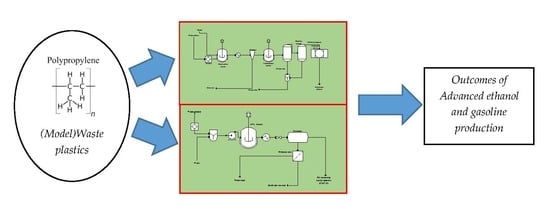
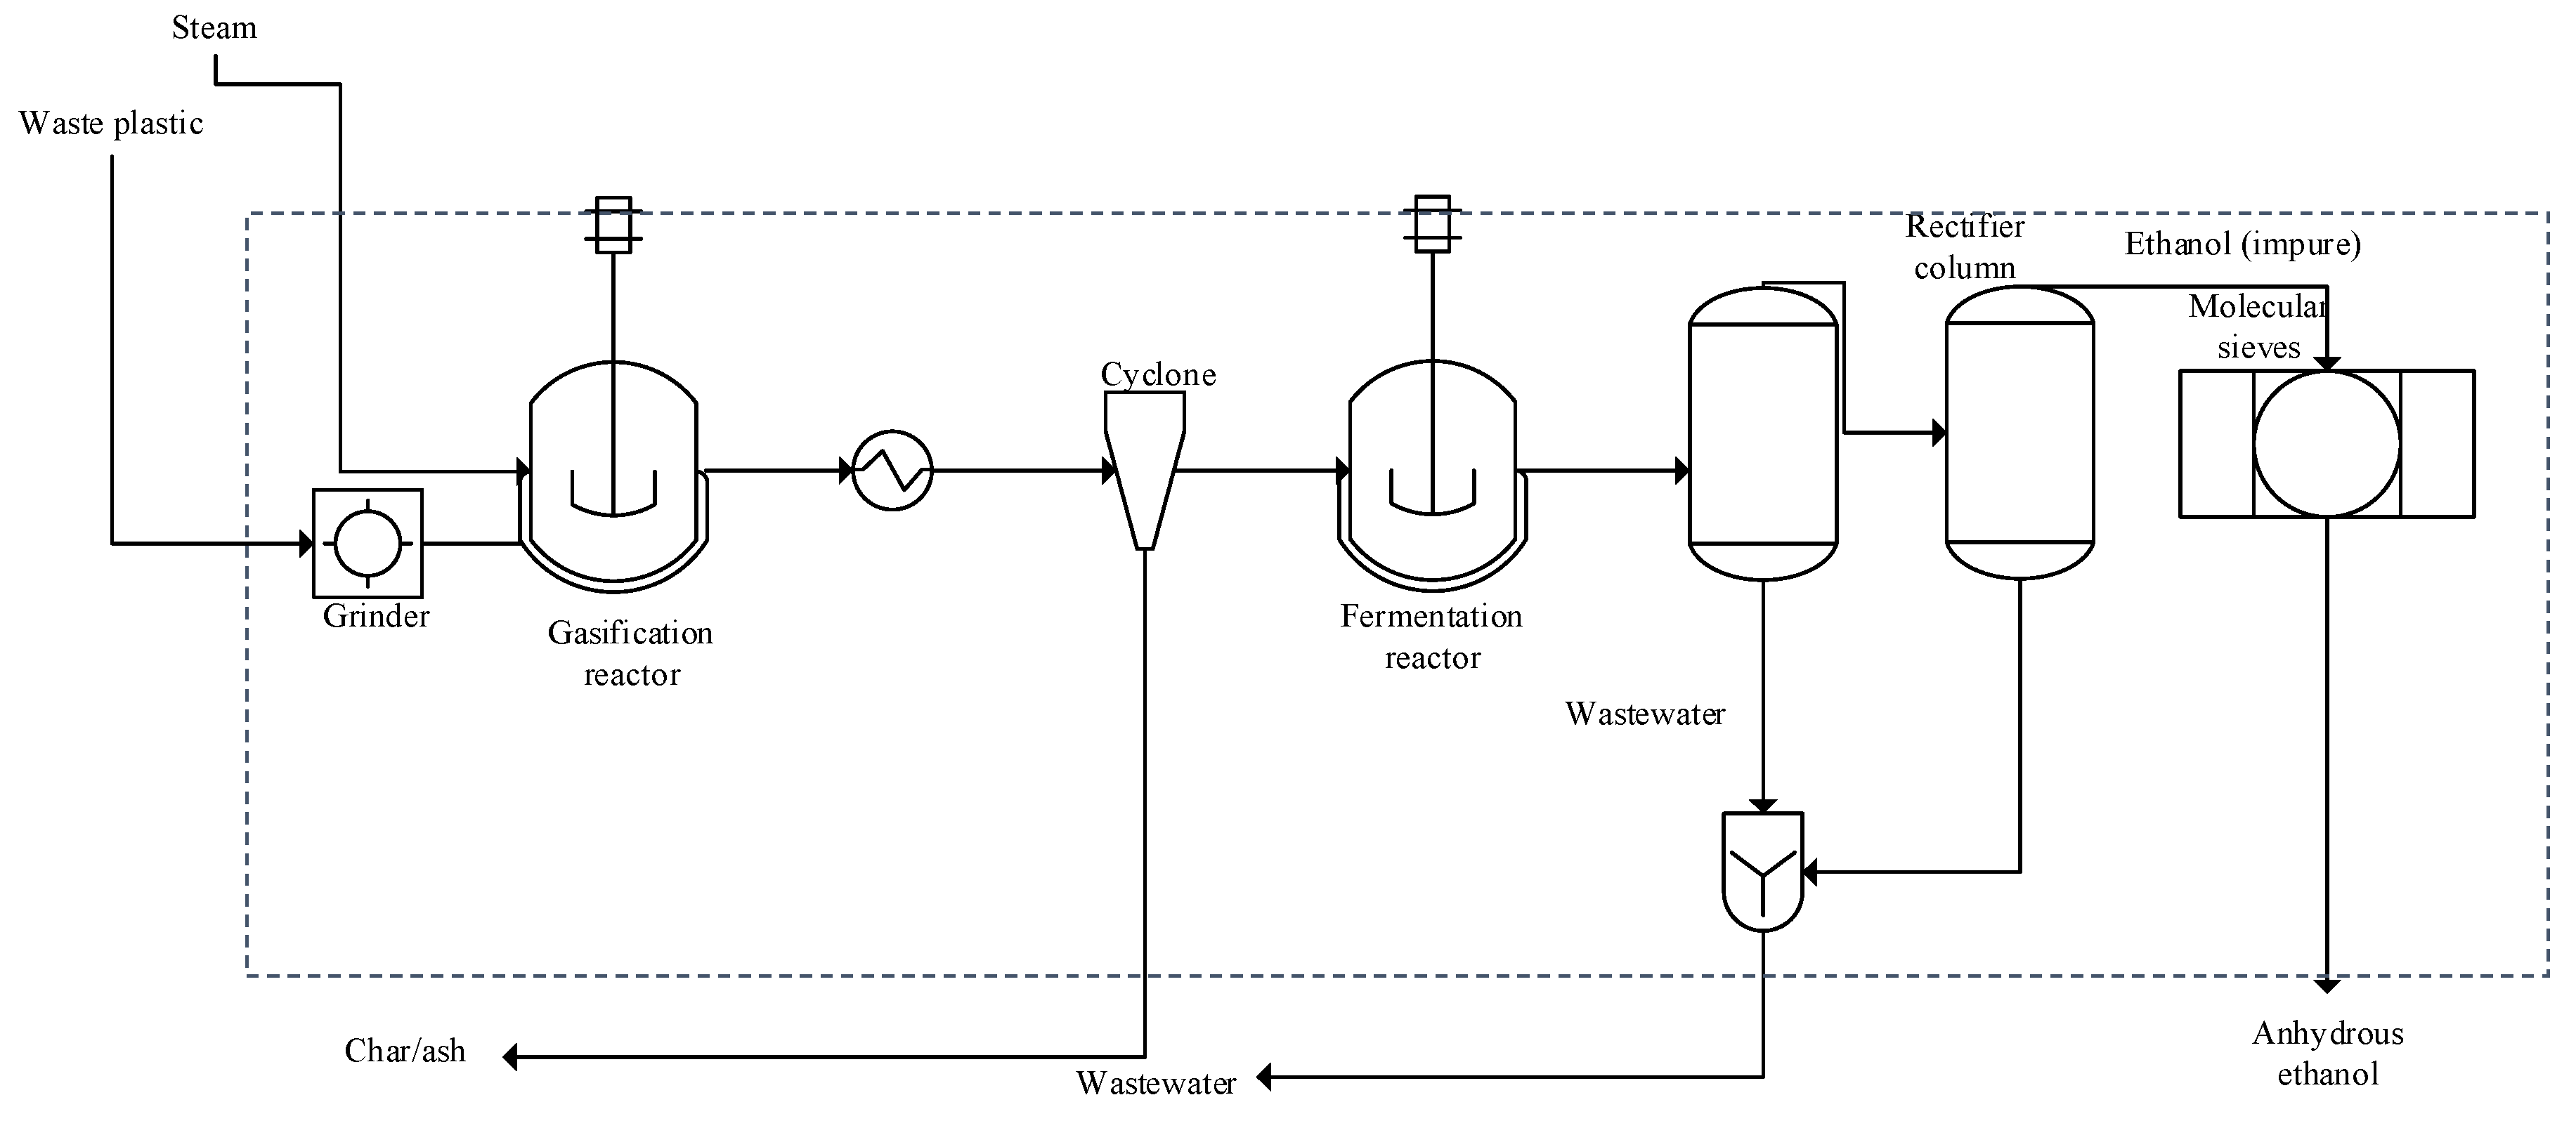
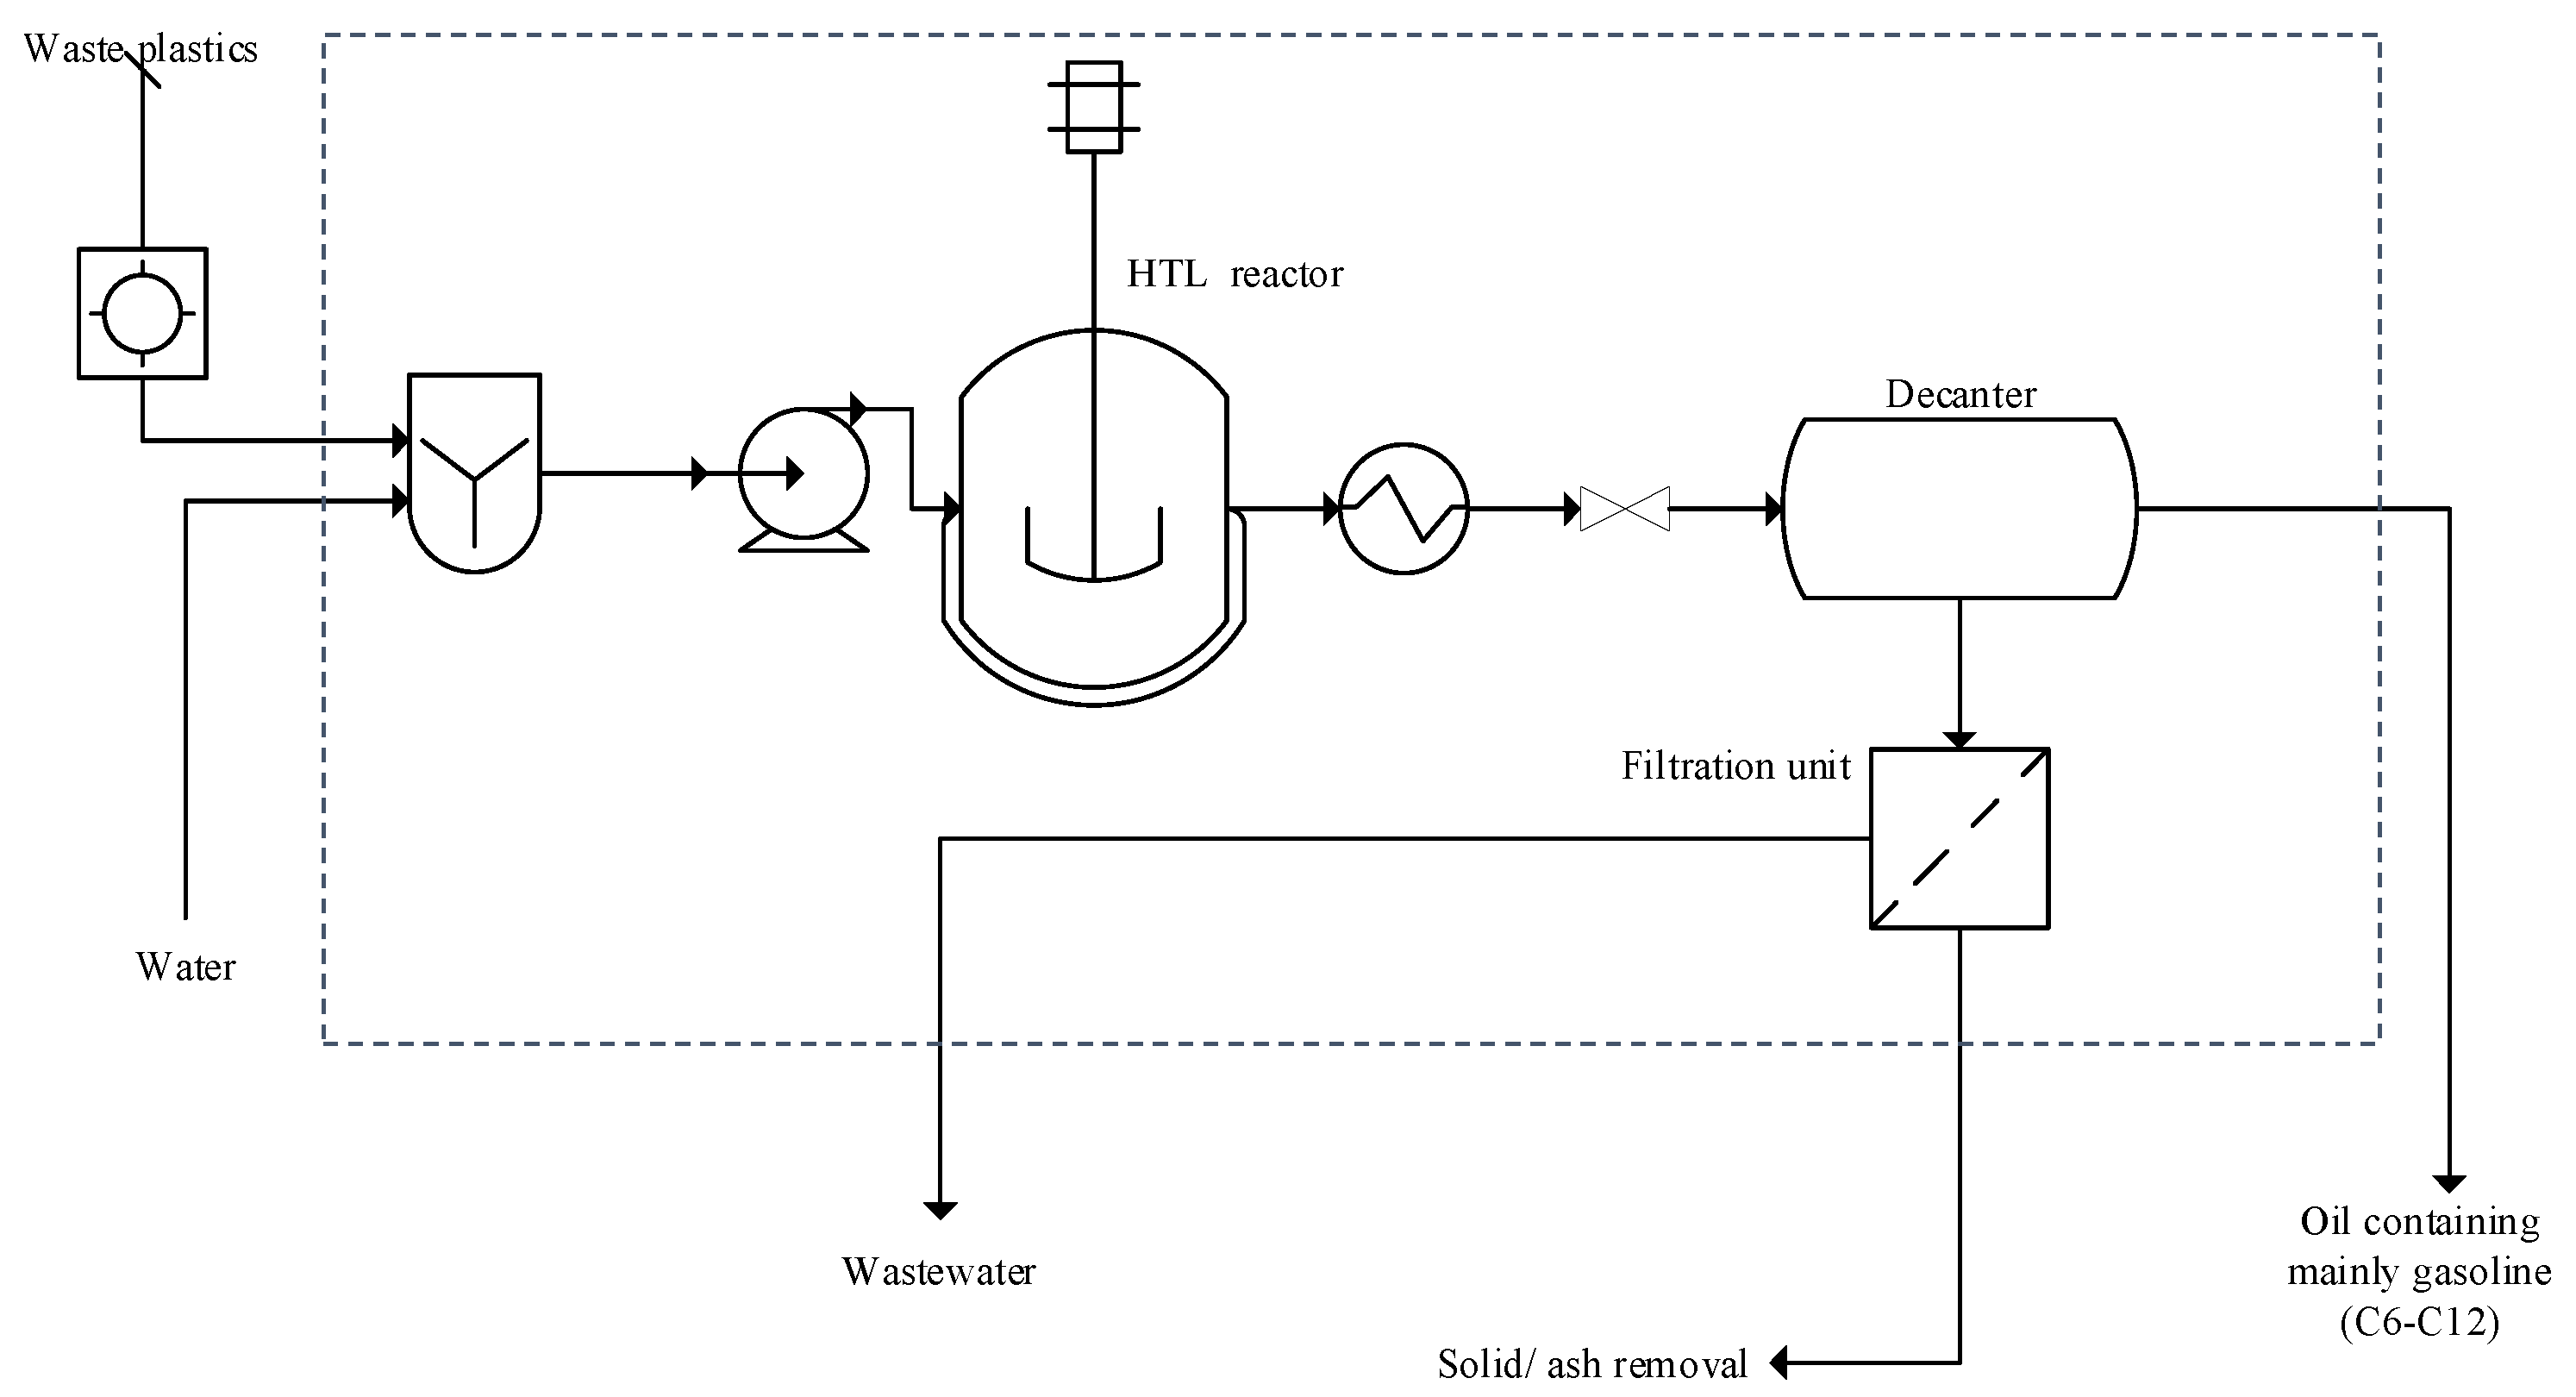
2.1. Model and Process Description

In this study, waste plastic was employed as a sustainable feedstock for the production of liquid fuels via two different scenarios assumed to be capable of processing 1 ton of waste plastics per hour. In this study, polypropylene was employed as the model plastic since it accounts for ~23% of all plastic waste [29]. Polypropylene plastics can be sourced from common packaging, textiles, healthcare and pipe waste. In the present study, the processing systems have been specified as the control volumes, with possible difficulties associated with waste plastic acquisition ignored. For simplicity possible challenges associated with contamination (by dirt) of the waste plastics will not be considered in the current study. This is because the level of contamination will vary significantly (and continuously) for different locations.
The composition of the representative waste plastic employed in the current study is presented in Table 1.
The proximate and ultimate composition of waste plastic in Table 1 were employed in simulating the waste plastic feedstock using the inbuilt HCOALGEN and DCOALIGT models. HCOALGEN and DCOALIGT models were also employed in estimating enthalpy and density parameters for ash, carbon and char components. Other components such as steam, ethanol, and hydrocarbons in the resulting hydrothermal liquefaction (HTL) oil mixture were simulated using compounds in the ASPEN chemical library. The thermodynamic properties of streams in the waste plastic to liquid fuel conversion system were predicted using UNIQUAC property method. This is because the property method has been shown to be suitable in modelling complex non-ideal polar and nonpolar systems at low and high pressure [31,32].
In the present study, possible liquid fuels that may be employed in the transportation industry are assessed. In scenario i, the utilization of waste plastics as a feedstock for ethanol production is considered as shown in the simplified conceptual process flow diagram in Figure 1.
Figure 1 shows that waste plastics are initially finely ground using an industrial grade grinder and the power requirement is 700 kWh per ton of plastics [33] to enhance the reaction kinetics, heat and mass transfer properties in the subsequent gasification step. Modelling of the grinding operation is achieved using calculator blocks with the FORTRAN command in ASPEN plus. The finely ground plastics at a temperature of 25 °C under atmospheric pressures of 1 atm are transferred to a gasification reactor unit with (assumed) steam temperature of 850 °C and pressure of 1 bar employed as the gasifying media at a steam to feed ratio of 5 (assumed) [34]. The gasification reaction, is undertaken at temperature of 1200 °C for enhanced formation of only (light) hydrocarbons, CO2, CO and H2 molecules [35,36]. A high yield of H2 gas is anticipated due to the water-gas shift reaction that occurs during steam gasification [37]. The assumed gasification temperature of 1200 °C is also within the gasification temperature employed in steam gasification of plastics which ranges from 500 °C to 1300 °C.
Recognizing the complexity of gasification reaction as a process consisting of parallel-consecutive chemical reactions, it has been assumed that the gasification process attains thermodynamic equilibrium for simplicity. This assumption is justified since the gasification reaction rates of associated chemical and physical-chemical reactions is infinitely high implying that the gasification system remains in thermodynamic equilibrium [38]. The gasification reaction is therefore modelled using the two RGIBBS reactors with the concentration of species determined by minimizing the Gibbs free energy (G) of the system (∆Gtotal = 0) without compromising mass and energy balance requirements. Further discussions regarding the minimization of the G in the determination of equilibrium states of reacting species are presented elsewhere [39,40]. The resulting syngas is then initially cooled to the mesophilic temperature of 37 °C and the fermentation of syngas subsequently undertaken at the preferred temperature of 37 °C and pressure of 1 atm, under the action of acetogenic microorganisms such as Clostridium ljungdahlii and Clostridium carboxidivorans [41,42] as follows:
4 CO + 2 H 2 O CH 3 COOH + 2 CO 2
2 CO 2 + 4 H 2 CH 3 COOH + 2 H 2 O
6 CO + 3 H 2 O C 2 H 5 OH + 4 CO 2
2 CO 2 + 6 H 2 C 2 H 5 OH + 3 H 2 O
During the fermentation process, conversion efficiencies of 90% for CO and 70% H2 are specified as attainable in the presence of 0.8 g of acetogenic microbes per litre of fermentation broth in accordance with the experimental work of Klasson et al. [43]. Air-tight reactors must be installed to avoid possible atmospheric oxygen contamination of the microbial atmosphere. Since the fermentation reactions and their associated conversions are known, the RSTOIC reactor model is employed in simulating the fermentation process. At the conclusion of the fermentation process, the fermentation broth containing the ethanol is purified via a stage- wise distillation process to enable the production of a product containing ethanol with some water impurities [44]. Distillation processes are simulated using rigorous RADFRAC models in ASPEN Plus. Further concentration of the ethanol is subsequently achieved using molecular sieves and modelled using the separator (SEP) block to attain an anhydrous ethanol product characterized by the ethanol content of greater than 99.7% [45]. In scenario ii, the conversion of waste (polypropylene) plastics to hydrocarbons was modelled and simulated according to the experimental conditions described in a previous work [29]. In the work by Chen et al. [29], waste plastics were converted to gasoline (specified as carbon chains of C6-C12) via hydrothermal/supercritical water treatment with an oil product generated. According to the work of Chen et al. [29], the oil products contains about 80–90 wt.% of the gasoline/naphtha product fraction. The resulting HTL oil has the potential to be used as gasoline blend-stocks, without upgrading processes such as cracking or distillation [29]. The overall process is summarized in Figure 2 using a simplified conceptual process flow diagram. Briefly, the finely ground waste plastics is initially mixed with water to enable the formation of a slurry containing 15 wt.% moisture content. The mixture is then fed to a hydrothermal liquefaction (HTL) reactor operating at the temperature of 425 °C and pressure of 23 MPa. These conditions were specified since the conditions facilitated an enhanced production of liquid oils and fuels from the HTL processing [29]. Due to the inherent complexity of the HTL reaction, two RGIBBS reactor blocks were employed in simulating the HTL process since the HTL process is typically rapid and has been reported to be characterized by the presence of equilibrium states [46,47]. At the conclusion of the HTL reaction, the product mixture is cooled to a temperature of 25 °C, then de-pressured to 1 atm. A decanter, which is modelled using a separator (SEP) block for simplicity is then employed in separating the oil fraction from the product mix. Further separation of the HTL-water and ash fractions are achieved using a filtration unit.
Having simulated the scenarios described above and determined the useful product yields, the heating and cooling duty requirements are also calculated. In this study, energetic calculations are undertaken using the Aspen Energy Analyzer® (Aspen Technology Inc., Cambridge, MA, USA) as a viable tool to enable enhanced heat integration for reduced energy requirements based on classic pinch analysis methods. In the present study the temperature levels of exchanging streams were adjusted to achieve a minimum approach temperature of 10 °C. A full description of the pinch analysis method is outside the scope of the present work and is therefore presented elsewhere [48,49]. In this study, both processing systems were designed and modelled based on the following assumptions, namely, the feed rate of waste is maintained at 1000 kg/h, plant availability is fixed at 7200 h/y and the pressure drop in all of the equipment is neglected.

2.2. Economic Assessment Methods

In the present study, the economics of both scenarios were assessed assuming both plants are sited in the USA with all costs reported in terms of the USD. To enable a comparison of economic performances of both scenarios described earlier above, the internal rate of return and the unit processing cost of waste plastic have been employed as suitable economic performance indicators.
The economic indicator of the internal rate of return (IRR) has been employed as the initial economic performance indicator [50]. This is because it is now well established that for mutually exclusive and independent projects the utilization of the calculated IRR value constitutes the most reliable screening/ranking tool [51]. Thus, in the present study, the project characterized by the higher IRR value will be considered as the more primary economic screening parameter. The IRR value which is defined as the discount rate i of a project when the net present value (NPV) in USD is equal to zero and is calculated as follows [50,51]:
0 = NPV = n = 1 t A ( 1 + i ) n TCI
where A is the cash flow generated per year, and represents the net revenue generated from product sales, TCI denotes total capital investment cost, and n denotes the life time of the project.
To facilitate the calculation of the IRR value a discounted cash flow table was generated with respect to the production of ethanol and gasoline at selling prices of USD 0.735 per kg and of USD 0.967 per kg [52] (average selling prices before COVID-19 pandemic) specified as the sellable products in scenario i and scenario ii, respectively. The avoided waste plastic disposal cost average of USD 135 per ton [53] was included in the cash flow table in both scenarios. To enable the calculation of the total capital cost (TCI), purchase costs of common equipment such as pumps, decanters and heat exchangers were initially obtained using ASPEN process economic analyzer V11 which presents cost based on the year 2016 data. The purchase cost of specialized equipment such as the gasifier [54], cyclone [55] and plastic grinder [56] were obtained from previous studies and the Alibaba commercial site, respectively. The purchase cost of the ith equipment pi in USD was subsequently adjusted for the desired capacity (or characteristic factor) as follows [57]:
p i = p i , v r e f ( v v r e f ) s
where v is the characteristic factor (i.e., power demand, volume etc.) of the equipment in the present study, is the purchase cost for the equipment at the reference characteristic factor, vref, and s is the scaling factor specified as 0.6 [57].
The HTL reactor purchase cost (CostHT) was estimated as follows for the reference year of 2006 [58]:
Cos t H T L = 1.5 ( 13,000 + 34,000 V R 0.5 )
where the constant numbers of 13,000, 34,000 and 0.5 are Towler and Sinnot correlation cost constants, VR denotes the volume of the HTL reactor in m3 and the constant value of 1.5 is the factor used to account for a reactor made using high pressure resistant (321) stainless steel.
Since these costs are reported for different reference years, it is necessary that some modifications are introduced. For consistency, therefore, all purchased equipment was corrected to account for possible inflationary effects in different years using Chemical Engineering Plant Cost Index (CEPCI) values. Crucially however, the absence of final CEPCI values for 2020 meant that the CEPCI for 2019 was employed as follows [57,59]:
p i , 2019 = p i , r e f ( C E P C I 2019 C E P C I r e f )
where pi,ref and pi,2019 are the purchase costs for the ith equipment in the reference year and the year 2019. CEPCI2019 was specified as 607.5 [60], with CEPCI of earlier years obtained from the literature [39,61].
Having estimated the equipment purchase costs, the installed cost was determined by multiplying the purchase cost with equipment installation conversion factors reported elsewhere [62]. The summation of the resulting installation cost (IC) was employed in TCI estimation using relations shown in Table S1 in the Supplementary File.
The total operating cost (TOC) was also determined. The TOC includes fixed production costs which are costs incurred irrespective of the plant productivity, and the variable production costs are costs that are proportional to the plant output [57]. The TOC includes cost components of labor cost, labor burden, maintenance cost, property insurance, cost of raw materials, cost of utilities and cost of waste disposal. The relations employed in estimating these cost components are presented in Table S2 of the Supplementary File.
In addition to the IRR determination, the unit processing cost of waste plastic to useful products was also estimated for both scenarios to further reinforce discussions as stated above. The unit processing cost of waste plastic in (Pp), USD per kg is calculated as follows [57]:
P p = TOC + ( ACCR × TCI ) m p
where the annual capital charge (dimensionless) is denoted by ACCR and mp is the mass of the waste plastics processed per year in kg/y. The ACCR×TCI value denotes the annual capital charge (ACC) in USD.
The ACCR was calculated as follows [57]:
ACCR = i ( 1 + i ) n [ ( 1 + i ) n 1 ]
where i denotes the acceptable discount rate assumed to be 10% in the present study.
Based on the discounted cash flow table, the associated payback periods of both scenarios, which refers to the time necessary to recover the project cost of the investment, were also determined for completeness.
In the present study, economic assessments have been determined for an assumed plant salvage value of USD zero, lifespan of 30 y and tax rate of 30% [63]. The plant depreciation has also been determined using the straight line method. Due to the assumptions employed in estimating IRR and Pp, sensitivities of these performance indicators to variations in economic parameters of TCI, TOC, i, factor employed in working capital (WC) estimation as a function of the FCI (supplementary information document) and project lifespan were assessed. Although it is clear that the aforementioned economic parameters will influence the economic outcomes, the investigation of sensitivities will facilitate the identification of which parameters are most important and therefore require ‘significant’ care when acquiring estimates. The effects of 50% to 100% variations of the base values of the aforementioned factors were assessed to determine the sensitivity of the Pp to these variations. Effects of changes in economic parameters on Pp have been investigated preferentially to effects of changes in economic parameters on IRR since it was observed that unfeasible and negative IRR values were obtained in some cases when the aforementioned changes in the parameters were imposed. Such unfeasible IRR values lead to interpretational issues.

3. Results and Discussion

3.1. ASPEN Plus Simulation

Mass balance calculations were undertaken using the Aspen Plus process modelling tool. Table 2 shows that 0.6215 kg of ethanol may be generated from 1 kg of waste plastics. Table 2 also shows that the ethanol yield on the CO input basis (i.e., mol product-C/mol CO-C) is 51.5%. This calculated yield on the CO basis is consistent with reports from the literature with the yield ranging from 51% to 60% [64,65]. The associated char generated after the gasification process may be employed as a biomaterial for several uses such as an adsorbent for water treatment, for soil remediation [66] water and sewage treatment [67]. Although this study acknowledges that the exhaust stream contains some unconverted H2 and CO molecules that may be used as a feed for onsite energy generation via the installation of a boiler system to minimize external energy demand, such an approach has not been explored in the current study to ensure that the results generated remain conservative.
Furthermore, as shown in Table 3, 0.685 kg of oil product may be generated from 1 kg of waste plastics. The oil product is shown to contain ~88% of hydrocarbons in the C6-C12 carbon range which is consistent with gasoline petroleum crude oil fraction. The simulation result also agrees with the experimental results given that that the gasoline content of the oil product in the simulation study is within the experimentally determined range of 80–90% stated earlier above. The gas yield (<C5) in the post-HTL product of 15.7% was also in agreement with the experimental result since it was demonstrated that the gaseous product content in the post-HTL product stream may range from 10 to 17% when the HTL process is undertaken at the temperature of 425 °C. Although Chen et al. [29] stated that the oil product may be used in generating gasoline blends directly, it is expected that the presence of the pentane ‘impurity’ may lead to a reduction in its oil product value and selling price. The selling price of the oil product was therefore adjusted by multiplying the mass fraction of the actual gasoline fraction by the selling price of pure gasoline and the resulting value employed in the IRR calculations.
The minimum heating, cooling and electrical utilities required from external sources after (assumed) full heat integration are determined using the ASPEN energy analyzer® V.10 and are presented in Table 4.
Table 4 shows that the electricity demand and the external cooling utility requirement of scenario ii is greater than the electricity demand and the external cooling utility requirement of scenario i. This observation is consistent with expectations as the higher electricity demand in scenario ii is due to the additional work required to pressurize the feed water prior to the HTL process. In addition, due to the highly exothermic nature of HTL process at reaction temperatures greater than 270 °C [68,69,70], external cooling utilities will be necessary to cool the resulting product streams. Interestingly, ASPEN energy analyzer also established that scenario ii will not require an additional external heating source with the heat generated from the high-temperature existing stream of exothermic HTL process considered to be sufficient to satisfy all the heating duty needs of the system, if external heat flows are fully recovered via effective heat integration.
Although the present study has employed polypropylene as the model plastic feed in both processes, it may be speculated that a similar result may be obtained when other strict hydrocarbon plastics such as polyethylene (C2H4)n and polystyrene (C8H8)n are employed as feedstocks. This is because the higher yields of the energy dense oil products in scenario ii (HTL process), relative to the ethanol yield in scenario i, is anticipated to be maintained as reaction completion of the highly efficient HTL process in scenario ii should remain unchanged. Such a complete conversion of the syngas generated in scenario ii may not be technically feasible. However, it is possible that the yields of the gasoline fraction in the oil product may vary with the carbon and hydrogen contents of the feedstock; significant changes in the energy density of the oil product is unexpected more so as the oil product will remain oxygen free. For plastic forms such as polyethylene terephthalate (C10H8O4)n and polycarbonate (C15H16O2)n, although a higher yield of the oil product remains anticipated, the energy content of the oil product is likely to be diminished as it is possible for unfavorable oxygenated compounds to be retained in the energy-dense oil product [27]. If the decline in the energy content is significant enough, then there is a possibility of a reduction in the economic performance of the HTL process relative to the thermos-syngas fermentation process. The utilization of other plastics such polyvinyl chloride (C2H3Cl)n may, however, lead to the associated unfavorable environmental outcomes due to the potential release of chlorinated volatiles to the environment [71].
Furthermore, it is acknowledged that waste plastic may be sourced from numerous locations such that several costing and logistical constraints may influence overall process feasibilities. The current study, however, seeks to provide an ‘initial-level’ comparison of two possible strategies for waste plastic management via plastic conversion to liquid fuels. Future studies may seek to explore waste plastic supply chain optimization opportunities, while considering specific waste plastic sources as well as logistical/ transportation constraints.

3.2. Economic Assessments

The results of the economic assessments are presented in Table 5. Table 5 shows that scenario ii presents a better economic outcome compared to scenario i. This is because scenario ii presents an IRR value of 51.3% while scenario i presents an IRR value of 22.2%. Further calculations using discounted cash flow analysis shows that the IRR of scenario ii will be less than the IRR of scenario i only if the selling price of the oil product drops to below USD 0.59 per kg or the selling price of pure gasoline declines to below USD 0.67 per kg.
Crucially, however, a consideration of pre-COVID 19 historical gasoline prices suggests that such a situation will be unlikely with such low gasoline values last recorded in the years before year 2004 as show in Figure 3. The results presented above therefore suggest that waste plastic conversion to a HTL oil containing mainly gasoline will constitute the most economically favorable waste plastic utilization approach when both scenarios are considered.
Furthermore, the economic assessments also show that scenario i will require 2.5 times the number of years required by scenario ii to recover the project investment cost. Another significant result highlighted in Table 5 is the higher processing cost of waste plastics in scenario i (USD 0.42 per kg) relative to the processing cost of waste plastics in scenario ii (USD 0.38 per kg). This observation is in agreement with the results presented so far and support the overall preference of scenario ii as the preferred pathway. The higher processing cost of waste plastics in scenario i is a reflection of the higher TCI associated with scenario i due to the higher number of processing units required to convert waste plastics to ethanol.
Further considerations of the effects of changes in the selected economic parameters on the unit processing cost as the indicative economic performance measure is presented in Figure 4.
Figure 4 shows that the Pp is mostly influenced by TOC in scenario i and scenario ii since a 100% increase TOC leads to the highest effects on the Pp as illustrated by the ~80% and a ~84% increase in Pp in scenario i and scenario ii, respectively. Similarly a 50% decrease in the TOC was observed to present a ~39% and a 42% reduction in Pp in scenario i and scenario ii, respectively. The careful estimation of the TOC cost inputs i.e., cost of raw materials, utilities etc., prior to actual plant execution is, therefore, crucial. Figure 4 also shows that although the effect of changes in TCI are less significant than the effect of changes in TOC, changes in high TCI constitutes the second most impactful economic parameter when increased. This is because a 100% increase in TCI leads to the highest unfavorable effects on the Pp as illustrated by the ~21.7% and a ~15.3% increase in Pp in scenario i and scenario ii, respectively. Similarly a 50% decrease in the TCI was observed to present a ~10% and 8% reduction in Pp for scenario i and scenario ii, respectively. The magnitude of the effect of changes on the discount rate and life span parameters on Pp is less than the magnitude of the effect of changes in TOC in both scenarios (Figure 4). This is because increasing the discount rate and life span by 100% presented a 19.4% increase and a 0.6% decrease in the Pp in scenario i and a 13.7% increase and a 0.9% decrease in the Pp in scenario ii. Additionally, decreasing the discount rate and life span by 50% presented a 7.6% decrease and 5.5% increase in the Pp in scenario i and 6.1% decrease and 3.7% increase in the Pp in scenario ii. The effects of variations in the % employed in estimating the WC from the FCI were shown to be least significant in both scenarios, with negligible changes in the economic performance observed. This suggests that ‘too much’ attention may not be placed on the % parameter for WC estimation.

4. Conclusions

This paper highlights the energetic, productivity and economic aspects of two conversion scenarios for waste plastic conversion to liquid fuels of ethanol and gasoline. Scenario i describes the conversion of waste plastics to ethanol via an integrated gasification and syngas fermentation process and in scenario ii, conversion to a mainly gasoline oil product was achieved via hydrothermal liquefaction. The results established that it was technically possible to generate up to 4475 tons/y of ethanol and 4934.4 tons/y of mainly gasoline via the different scenarios stated above, when waste plastic at a feed-rate of 1 ton per h is supplied. This comparative study was able to establish the economical preference of scenario ii when the economic indicators of internal rate of return, unit processing cost and payback period were considered. It may, therefore, be concluded that the utilization of the hydrothermal liquefaction technology offers a strategy with the potential for global application more so given that the adverse environmental outcomes associated with poor waste plastic disposal and management constitute a major global concern.

Supplementary Materials

The following are available online at https://0-www-mdpi-com.brum.beds.ac.uk/2624-7402/2/3/26/s1, Table S1: Capital cost components employed in TCI (CAPEX) determination, Table S2: Operating cost components employed in TOC (OPEX) determination.

Author Contributions

Conceptualization, O.V.O.; methodology, O.V.O.; software, O.V.O.; validation, F.D.F., draft preparation, O.V.O and F.D.F.; writing—review and editing, O.V.O. and F.D.F. All authors have read and agreed to the published version of the manuscript.

Funding

This research received no external funding.

Conflicts of Interest

The authors declare no conflict of interest.

References

  1. Navas-Anguita, Z.; García-Gusano, D.; Iribarren, D. A review of techno-economic data for road transportation fuels. Renew. Sustain. Energy Rev. 2019, 112, 11–26. [Google Scholar] [CrossRef]
  2. International Energy Agency. Railway Handbook. Energy Consumption and CO2 Emissions; OECD/International Energy Agency: Paris, France, 2016. [Google Scholar]
  3. BP. Statistical Review of World Energy; BP PLC: London, UK, 2016. [Google Scholar]
  4. Jensen, C.U.; Guerrero, J.K.R.; Karatzos, S.; Olofsson, G.; Iversen, S.B. Hydrofaction of forestry residues to drop-in renewable transportation fuels. Direct Thermochem. Liq. Energy Appl. 2018, 319–345. [Google Scholar] [CrossRef]
  5. Phanisankar, B.S.S.; Vasudeva, R.N.; Manikanta, J.E. Conversion of waste plastics to fuel products. Mater. Today Proc. 2020. [Google Scholar] [CrossRef]
  6. Fineberg, H. Reinveinting Plastics; Veolia Institute: Paris, France, 2019. [Google Scholar]
  7. Plastics-Euro. Plastics the Facts; Plastics Europe: Brussels, Belgium, 2018. [Google Scholar]
  8. Lopez, G.; Artetxe, M.; Amutio, M.; Bilbao, J.; Olazar, M. Thermochemical routes for the valorisation of waste polyolefinic plastics to produce fuels and chemicals. Areview. Renew. Sustain. Energy Rev. 2017, 73, 346–368. [Google Scholar] [CrossRef]
  9. Al-Salem, S.M.; Lettieri, P.; Baeyens, J. Recycling and recovery routes of plastic solid awste (PSW): A review. Waste Manag. 2009, 29, 2625–2643. [Google Scholar] [CrossRef]
  10. Zhao, X.; Zhan, L.; Xie, B.; Gao, B. Products derived from waste plastics (PC, HIPS, ABS, PP and PA6) via hydrothermal treatment: Charcaterisation and potential applications. Chemosphere 2018, 207, 112–119. [Google Scholar] [CrossRef] [PubMed]
  11. Lopez, G.; Artexe, M.; Amutio, M.; Alvarez, J.; Bilbao, J.; Olazar, M. Recent adavances in the gasification of wasteplastics. Acritical overview. Renew. Sustain. Energy Rev. 2018, 82, 576–596. [Google Scholar] [CrossRef]
  12. Huang, J. Polymer waste management -biodegradation, incineration, and recycling. J. Macromol. Sci. 1995, 32, 593–597. [Google Scholar] [CrossRef]
  13. Hamad, K.; Kaseem, M.; Deri, F. Recycling of waste from polymer materials: An overview of the recent works. Polym. Degard. Stabil. 2013, 98, 2801–2812. [Google Scholar] [CrossRef]
  14. Zhang, K.; Shi, H.; Peng, J.; Wange, Y.; Xiong, X.; Wu, C.; Lam, P.K.S. Microplastics pollution in China’s inland water systems: A review of findings, methods, characteristics, effects and management. Sci. Total Env. 2018, 630, 1641–1653. [Google Scholar] [CrossRef]
  15. Munir, M.T.; Mansouri, I.A.; Udugama, S.; Baroutian, K.V.; Gernaey, B.; Young, B.R. Resource recovery from organic solid waste using hydrothermal processing: Opportunities and challemges. Renew. Sustain. Energy Rev. 2018, 96, 64–75. [Google Scholar] [CrossRef]
  16. Bai, B.; Jin, H.; Fan, C.; Cao, C.; Cao, W. Experimental investigation on liquefaction of plastic waste to oil in supercritical water. Waste Manag. 2019, 89, 247–253. [Google Scholar] [CrossRef] [PubMed]
  17. Banu, R.J.; Shaarmila, G.V.; Urshani, U.; Amhdha, V.; Kumar, G. Impervious and Influence in the liquid fuel production from municipal plastic waste through thermochemical biomass conversion technologies-A review. Sci. Total Environ. Sci. 2020, 718, 137287. [Google Scholar] [CrossRef] [PubMed]
  18. Verma, R.; Vinoda, K.S.; Papireddy, M.; Gowda, A.N.S. Toxic Pollutants from Plastic Waste-A Review. Procedia Environ. Sci. 2016, 35, 701–708. [Google Scholar] [CrossRef]
  19. Burra, K.G.; Gupta, A.K. Synergistic effects insteam gasification of combined biomass and plastic waste mixtures. Appl. Energy 2018, 211, 230–236. [Google Scholar] [CrossRef]
  20. Wierckx, N.; Prieto, M.A.; Pomposiello, P.; de Lorenzo, V.; O’Connor, K.; Blank, L.M. Plastic waste as a novel substrate for industrial biotechnology. Microb. Biotechnol. 2015, 8, 900–903. [Google Scholar] [CrossRef]
  21. Bian, G.-Z.; Fan, L.; Fu, Y.-L.; Fujimoto, K. Mixed Alcohol Synthesis from Syngas on Sulfided K–Mo-Based Catalysts: Influence of Support Acidity. Ind. Eng. Chem. Res. 1998, 37, 1736–1743. [Google Scholar] [CrossRef]
  22. Awasthi, A.K.; Shivashankar, M.; Majumder, S. Plastic solid waste utilization technologies: A Review. IOP Conf. Ser. Mater. Sci. Eng. 2017, 263, 022024. [Google Scholar] [CrossRef]
  23. Li, H.; Lu, J.; Zhang, Y.; Liu, Z. Hydrothermal liquefaction of typical livestock manures in China: Biocrudeoil production and migration of heavy metals. J. Anal. Appl. Pyrol. 2018, 135, 133–140. [Google Scholar] [CrossRef]
  24. Tian, C.; Li, B.; Liu, Z.; Zhang, Y.; Lu, H. Hydrothermal liquefaction for algal biorefinery: A critical review. Renew. Sust. Energy Rev. 2014, 38, 933–950. [Google Scholar] [CrossRef]
  25. Castello, D.; Pedersen, T.; Rosendahl, L. Continuous hydrothermal liquefaction of biomass: A critical review. Energies 2018, 11, 3165. [Google Scholar] [CrossRef] [Green Version]
  26. Li, H.; Liu, Z.; Zhang, Y.; Li, B.; Lu, H.; Duan, N. Conversion efficiency and oil quality of low lipid low protein microalgae via hydrothermal liquefacttion. Bioresour. Technol. 2014, 154, 322–329. [Google Scholar] [CrossRef] [PubMed]
  27. Okoro, O.V.; Sun, Z. The characterisation of biochar and biocrude products of the hydrothermal liquefaction of raw digestate biomass. Biomass Convers. Biorefin. 2020. [Google Scholar] [CrossRef]
  28. Daniell, J.; Köpke, M.; Simpson, D.S. Commercial Biomass Syngas Fermentation. Energies 2012, 5, 5372–5417. [Google Scholar] [CrossRef] [Green Version]
  29. Chen, W.-T.; Jin, K.; Linda Wang, N.-H. Use of Supercritical Water for the Liquefaction of Polypropylene into Oil. ACS Sustain. Chem. Eng. 2019, 7, 3749–3758. [Google Scholar] [CrossRef]
  30. Li, D.-T.; Li, W.; Li, B.-Q. CO-Carbonization of Coking-Coal with Different Waste Plastics. J. Fuel Chem. Technol. 2001, 29, 19–23. [Google Scholar]
  31. Nakayama, T.; Sagara, H.; Arai, K.; Saito, S. High pressure liquid-liquid equilibria for the system of water, ethanol and 1,1-difluoroethane at 323.2 K. Fluid Ph. Equilib. 1987, 38, 109–127. [Google Scholar] [CrossRef]
  32. Geanã, D.; Feroiu, V. Prediction of Vapor–Liquid Equilibria at Low and High Pressures from UNIFAC Activity Coefficients at Infinite Dilution. Ind. Eng. Chem. Res. 1998, 37, 1173–1180. [Google Scholar] [CrossRef]
  33. Totsch, W.; Gaensslen, H. Polyvinylchloride: Environmental Aspects of a Common Plastic; Elsevier: London, UK, 2012. [Google Scholar]
  34. Bhaskar, T.; Balagurumurthy, B.; Singh, R.; Poddar, M.K. Thermochemical route for biohydrogen production. In Biohydrogen; Pandey, A., Chang, J.-S., Hallenbecka, P.C., Larroche, C., Eds.; Elsevier: Amsterdam, The Netherlands, 2013; Chapter 12; pp. 285–316. [Google Scholar] [CrossRef]
  35. Bermudez, J.M.; Fidalgo, B. 15—Production of bio-syngas and bio-hydrogen via gasification. In Handbook of Biofuels Production, 2nd ed.; Luque, R., Lin, C.S.K., Wilson, K., Clark, J., Eds.; Woodhead Publishing: Cambridge, MA, USA, 2016; pp. 431–494. [Google Scholar] [CrossRef]
  36. Basu, P. (Ed.) Production of synthetic fuels and chemicals from biomass. In Biomass Gasification, Pyrolysis and Torrefaction, 3rd ed.; Academic Press: Cambridge, MA, USA, 2018; Chapter 12; pp. 415–443. [Google Scholar] [CrossRef]
  37. Erkiaga, A.; Lopez, G.; Amutio, M.; Bilbao, J.; Olazar, M. Syngas from steam gasification of polyethylene in a conical spouted bed reactor. Fuel 2013, 109, 461–469. [Google Scholar] [CrossRef]
  38. Cempa-Balewicz, M.; Jacek Łączny, M.; Smoliński, A.; Iwaszenko, S. Equilibrium Model of Steam Gasification of Coal. J. Sustain. Min. 2013, 12, 21–28. [Google Scholar] [CrossRef] [Green Version]
  39. Okoro, O.V.; Sun, Z.; Birch, J. Techno-Economic Assessment of a Scaled-Up Meat Waste Biorefinery System: A Simulation Study. Materials 2019, 12, 1030. [Google Scholar] [CrossRef] [PubMed] [Green Version]
  40. Sreejith, C.C.; Muraleedharan, C.; Arun, P. Thermo-Chemical Analysis of Biomass Gasification by Gibbs Free Energy Minimization Model-Part: II (Optimization of Biomass Feed and Steam to Biomass Ratio). Int. J. Green Energy 2013, 10, 610–639. [Google Scholar] [CrossRef]
  41. Ukpong, M.N.; Atiyeh, H.K.; De Lorme, M.J.; Liu, K.; Zhu, X.; Tanner, R.S.; Wilkins, M.R.; Stevenson, B.S. Physiological response of Clostridium carboxidivorans during conversion of synthesis gas to solvents in a gas-fed bioreactor. Biotechnol. Bioeng. 2012, 109, 2720–2728. [Google Scholar] [CrossRef] [PubMed]
  42. Tanner, R.S.; Miller, L.M.; Yang, D. Clostridium ljungdahlii sp. nov., an acetogenic species in clostridial rRNA homology group I. Int. J. Syst. Evol. Microbiol. 1993, 43, 232–236. [Google Scholar] [CrossRef] [PubMed] [Green Version]
  43. Phillips, J.R.; Klasson, K.T.; Clausen, E.C.; Gaddy, J.L. Biological production of ethanol from coal synthesis gas. Appl. Biochem. Biotechnol. 1993, 39, 559–571. [Google Scholar] [CrossRef]
  44. Petersen, A.M.; Haigh, K.; Görgens, J.F. Techno-economics of Integrating Bio-Ethanol Production from Spent Sulphite Liquor for Reduction of Greenhouse Gas Emissions from Sulphite Pulping Mills. Biotechnol. Biofuels 2014, 7, 169. [Google Scholar] [CrossRef] [PubMed] [Green Version]
  45. Amigun, B.; Petrie, D.; Görgens, J. Feedstock and Technology Options for Bioethanol Production in South Africa: Technoeconomic Prefeasibility Study. Energy Fuels 2012, 26, 5887–5896. [Google Scholar] [CrossRef]
  46. Valdez, P.J.; Tocco, V.J.; Savage, P.E. A general kinetic model for the hydrothermal liquefaction of microalgae. Bioresour. Technol. 2014, 163, 123–127. [Google Scholar] [CrossRef]
  47. Okoro, O.V.; Sun, Z.; Birch, J. Meat processing waste as a potential feedstock for biochemicals and biofuels—A review of possible conversion technologies. J. Clean. Prod. 2017, 142, 1583–1608. [Google Scholar] [CrossRef]
  48. Sinnot, R.; Towler, G. Chemical Engineering Design, 5th ed.; Elsevier: Burlington, NJ, USA, 2009. [Google Scholar]
  49. Okoro, O.V.; Sun, Z.; Birch, J. Catalyst-Free Biodiesel Production Methods: A Comparative Technical and Environmental Evaluation. Sustainability 2018, 10, 127. [Google Scholar] [CrossRef] [Green Version]
  50. Násner, A.M.L.; Lora, E.E.S.; Palacio, J.C.E.; Rocha, M.H.; Restrepo, J.C.; Venturini, O.J.; Ratner, A. Refuse Derived Fuel (RDF) production and gasification in a pilot plant integrated with an Otto cycle ICE through Aspen plus™ modelling: Thermodynamic and economic viability. Waste Manag. 2017, 69, 187–201. [Google Scholar] [CrossRef] [PubMed]
  51. Arjunan, K. IRR Performs Better than NPV: A Critical Analysis of Cases of Multiple IRR and Mutually Exclusive and Independent Investments. Soc. Sci. Res. Netw. 2017, 23, 31. [Google Scholar] [CrossRef]
  52. Global Petrol Prices. Retail Energy Price Data. 2020. Available online: https://www.globalpetrolprices.com/USA/ (accessed on 20 February 2020).
  53. Environment. The Potential of Recycled Plastics; Plastics Industry Association: Washington, DC, USA, 2020. [Google Scholar]
  54. Dutta, A.; Talmadge, M.; Hensley, J.; Worley, M.; Dudgeon, D.; Barton, D.; Groendijk, P.; Ferrari, D.; Stears, B.; Searcy, E.M. Process. Design and Economics for Conversion of Lignocellulosic Biomass to Ethanol: Thermochemical Pathway by Indirect Gasification and Mixed Alcohol Synthesis; National Renewable Energy Lab.: Golden, CO, USA, 2011. [Google Scholar]
  55. Rickman, W.S. Handbook of Incineration of Hazardous Wastes (1991); CRC Press: Boca Raton, FL, USA, 2017. [Google Scholar]
  56. Alibaba. Plastic Machinery Hdpe Polycarbonate. 2020. Available online: https://www.alibaba.com/product-detail/Plastic-Machinery-hdpe-polycarbonate-7-5_62538362812.html?spm=a2700.galleryofferlist.0.0.48fd258aHoj76o (accessed on 20 February 2020).
  57. Towler, G.; Sinnott, R. Chemical Engineering Design: Principles, Practice and Economics of Plant and Process Design; Elsevier: Amsterdam, The Netherlands, 2008. [Google Scholar]
  58. Okoro, O.V.; Sun, Z.; Birch, J. Thermal depolymerization of biogas digestate as a viable digestate processing and resource recovery strategy. In Advances in Eco-Fuels for a Sustainable Environment; Elsevier: Amsterdam, The Netherlands, 2019; pp. 277–308. [Google Scholar]
  59. Okoro, V.O.; Sun, Z. Desulphurisation of Biogas: A Systematic Qualitative and Economic-Based Quantitative Review of Alternative Strategies. Chem. Eng. 2019, 3, 76. [Google Scholar] [CrossRef] [Green Version]
  60. Chemengonline. 2019 Chemical Engineering Plant Cost Index Annual Average. 2020. Available online: https://www.chemengonline.com/2019-chemical-engineering-plant-cost-index-annual-average/ (accessed on 2 July 2020).
  61. Magnehi. Chemical Engineering Plant Cost Index (Averaged over Year). 2011. Available online: http://folk.ntnu.no/magnehi/cepci_2011_py.pdf (accessed on 12 February 2020).
  62. Peters, M.; Timmerhaus, K.; West, R. Plant Design and Economics for Chemical Engineers; McGraw-Hill Education: New York, NY, USA, 2003. [Google Scholar]
  63. Deloitte. Corporate Tax Rates 2019; Deloitte: London, UK, 2019. [Google Scholar]
  64. Shen, Y.; Brown, R.; Wen, Z. Enhancing mass transfer and ethanol production in syngas fermentation of Clostridium carboxidivorans P7 through a monolithic biofilm reactor. Appl. Energy 2014, 136, 68–76. [Google Scholar] [CrossRef]
  65. Maddipati, P.; Atiyeh, H.K.; Bellmer, D.D.; Huhnke, R.L. Ethanol production from syngas by Clostridium strain P11 using corn steep liquor as a nutrient replacement to yeast extract. Bioresour. Technol. 2011, 102, 6494–6501. [Google Scholar] [CrossRef]
  66. Chen, B.; Yuan, M.; Qian, L. Enhanced bioremediation of PAH-contaminated soil by immobilized bacteria with plant residue and biochar as carriers. J. Soils Sediments 2012, 12, 1350–1359. [Google Scholar] [CrossRef]
  67. Oleszczuk, P.; Hale, S.E.; Lehmann, J.; Cornelissen, G. Activated carbon and biochar amendments decrease pore-water concentrations of polycyclic aromatic hydrocarbons (PAHs) in sewage sludge. Bioresour. Technol. 2012, 111, 84–91. [Google Scholar] [CrossRef]
  68. Akhtar, J.; Amin, N.A.S. A review on process conditions for optimum bio-oil yield in hydrothermal liquefaction of biomass. Renew. Sustain. Energy Rev. 2011, 15, 1615–1624. [Google Scholar] [CrossRef]
  69. Midgett, J.S. Assessing a Hydrothermal Liquefaction Process Using Biomass Feedstocks; Louisiana State University: Baton Rouge, LA, USA, 2008. [Google Scholar]
  70. Remón, J.; Randall, J.; Budarin, V.L.; Clark, J.H. Production of bio-fuels and chemicals by microwave-assisted, catalytic, hydrothermal liquefaction (MAC-HTL) of a mixture of pine and spruce biomass. Green Chem. 2019, 21, 284–299. [Google Scholar] [CrossRef]
  71. Huang, B.; Lei, C.; Wei, C.; Zeng, G. Chlorinated volatile organic compounds (Cl-VOCs) in environment—Sources, potential human health impacts, and current remediation technologies. Environ. Int. 2014, 71, 118–138. [Google Scholar] [CrossRef] [PubMed]
  72. EIA. Petroleum & Other Liquids; USA Energy Information Administration: Washington, DC, USA, 2020.
Figure 1. Waste plastic conversion to the liquid fuel of ethanol (control volume indicated with dashed lines).
Agriengineering 02 00026 g001
Figure 2. Waste plastic conversion to the liquid fuel of hydrocarbons (control volume indicated with dashed lines).
Agriengineering 02 00026 g002
Figure 3. Historical gasoline prices [72].
Agriengineering 02 00026 g003
Figure 4. Sensitivity assessment for unit processing cost of waste plastic (USD/kg) in scenario i (a) and scenario ii (b).
Agriengineering 02 00026 g004
Table 1. Composition of representative waste plastic employed in the present study [30].
Proximate AnalysisUltimate Analysis
Ash a
(wt.%)
Volatiles a
(wt.%)
FC a
(wt.%)
Carbon b
(wt.%)
Hydrogen b
(wt.%)
Oxygen b
(wt.%)
Nitrogen b
(wt.%)
Sulphur b
(wt.%)
0.8299.18083.7513.982.2700
a dry mass basis, b ash free basis, FC denotes fixed carbon.
Table 2. Mass balance results for major streams in scenario i.
Stream PropertyWaste PlasticsSyngasFermentation BrothWastewaterAnhydrous Ethanol
Temperature (°C)25373729.325
Pressure (atm)11111
Mass Fractions (x)
Water000.2890.4800
Waste plastics10000
Hydrogen00.1170.03500
Carbon monoxide00.2670.02700
Carbon (iv) oxide00.6160.12800
Ethanol000.2260.0311
Acetic acid000.2950.4890
Mass Flows (kg/h)10002992.62997.41808.7621.5
Table 3. Mass balance results for major streams in scenario ii.
Stream PropertyWaste PlasticsGas-ProductPost-HTL ProductCharOil Product
Temperature (°C)2525252525
Pressure (atm)1122711
Mass Fractions (x)
Water00TraceTrace0
Waste plastic10000
CO000.22900
CO2000.02700
Char000.00610
C5H12000.07200.123
C6-C12000.51100.877
C13-C2300000
CH4000.05100
C2H600.1720.01800
C3H800.3180.04300
C4H1000.5100.04500
Mass Flows (kg/h)1000123.11175.47.4685.3
Table 4. External utility requirements of the conversion processes, assuming full heat integration.
Process ResultScenario iScenario ii
Externally required cooling utility (kW)784.41836.4
Externally required heating utility (kW)392.2-
Externally required electricity demand (kW)700704
Table 5. Outcome of the economic assessment.
Economic ParameterScenario iScenario ii
Fixed capital investment (MUSD)5.803.79
Working capital investment (MUSD)0.290.19
Total capital investment (MUSD)6.093.98
Fixed operating cost (MUSD)1.641.47
Variable operating cost (MUSD)0.760.84
Total operating cost (MUSD)2.402.31
Unit processing (USD/kg)0.420.38
Payback period (y) a52
IRR22.2%51.3%
MUSD denotes million US dollars, a Nearest whole year.

