Investigation of Pig Activity Based on Video Data and Semi-Supervised Neural Networks


1
Breeding Informatics Group, Department of Animal Sciences, Georg-August University, Margarethe von Wrangell-Weg 7, 37075 Göttingen, Germany
2
Center for Integrated Breeding Research (CiBreed), Georg-August University, Albrecht-Thaer-Weg 3, 37075 Göttingen, Germany
3
Livestock Systems, Department of Animal Sciences, Georg-August University, Albrecht-Thaer-Weg 3, 37075 Göttingen, Germany
*
Author to whom correspondence should be addressed.
AgriEngineering 2020, 2(4), 581-595; https://0-doi-org.brum.beds.ac.uk/10.3390/agriengineering2040039
Submission received: 2 November 2020
/
Revised: 27 November 2020
/
Accepted: 1 December 2020
/
Published: 4 December 2020
(This article belongs to the Special Issue Recent Advancement in Technology and Management Systems in Precision Livestock Farming)
Abstract
:The activity level of pigs is an important stress indicator which can be associated to tail-biting, a major issue for animal welfare of domestic pigs in conventional housing systems. Although the consideration of the animal activity could be essential to detect tail-biting before an outbreak occurs, it is often manually assessed and therefore labor intense, cost intensive and impracticable on a commercial scale. Recent advances of semi- and unsupervised convolutional neural networks (CNNs) have made them to the state of art technology for detecting anomalous behavior patterns in a variety of complex scene environments. In this study we apply such a CNN for anomaly detection to identify varying levels of activity in a multi-pen problem setup. By applying a two-stage approach we first trained the CNN to detect anomalies in the form of extreme activity behavior. Second, we trained a classifier to categorize the detected anomaly scores by learning the potential activity range of each pen. We evaluated our framework by analyzing 82 manually rated videos and achieved a success rate of 91%. Furthermore, we compared our model with a motion history image (MHI) approach and a binary image approach using two benchmark data sets, i.e., the well established pedestrian data sets published by the University of California, San Diego (UCSD) and our pig data set. The results show the effectiveness of our framework, which can be applied without the need of a labor intense manual annotation process and can be utilized for the assessment of the pig activity in a variety of applications like early warning systems to detect changes in the state of health.
1. Introduction
The investigation of pig behavior is still challenging since specific activities like aggressive behavior of animals are highly complex and hard to predict [1]. A deviation from regular patterns may indicate stressful events like changes in the state of health, which could manifest themselves in form of behavior disorders [2,3,4]. One of those major disorders is tail-biting, which reduces animal welfare [4,5] and simultaneously leads to an economic loss [5,6]. Due to the multifactorial origin of this abnormal behavior [7,8,9], tail-biting has so far been considered as unpredictable automatically [10] and therefore difficult to detect by a single indicator. To deal with this issue, several environmental and animal individual variables are used in early warning systems to detect tail-biting before an outbreak occurs [11]. Among these variables the activity level of the pigs has been identified as one of the most promising ones [12,13]. Here, previous studies indicate that the activity level of pigs prior to a tail-biting outbreak is increased [14,15]. Therefore, the early detection of shifting points in the animal activity could provide crucial hints to further differentiate between e.g., aggressive and non-aggressive events.
Until now, several methods for the investigation of animal behavior have been established mainly focusing on the identification of pig specific activity patterns. In most studies camera recordings are preferred to monitor the animals due to their non-intrusive nature [16,17]. The evaluation of the corresponding video data to analyze the behavior is mainly done manually [14,18,19,20,21]. However, for the reduction of the subjective bias caused by a single human observation, several experts are needed for the video evaluation and to increase the interobserver reliability these observers are trained in advance. Hence, the manual evaluation approach is time consuming, labor-intense and therefore impracticable on a commercial scale [11]. In addition, more sophisticated methods are applied to automate the evaluation process. In the majority of these studies machine learning methods are used for supervised object detection with the aim of detecting individual animals within a video [22,23,24,25,26]. While some of these algorithms achieve remarkable detection results, their performance strongly depends on the availability and quality of a manually annotated training data set [27]. These data sets are commonly created by manually labeling (annotating) a large number of images prior to the model training. Therefore, the elaborate annotation process represents a main weakness of supervised approaches [28]. To deal with the time consuming annotation process unsupervised methods like motion history image (MHI) and binary image approaches [29], have been applied to describe motion behavior in a sequence of images by encoding the temporal differences between consecutive frames [30,31]. Although MHI- and binary image-based methods have been successfully applied in various applications [32,33,34,35,36], recent advantages in deep learning led to an increased popularity of alternative approaches like unsupervised convolutional neural networks (CNN). These CNNs achieved state of the art results for numerous computer vision tasks like action recognition [37] or image denoising [38,39] and outperformed existing methods. Their success led to new network structures like temporal autoencoder or variational autoencoder, which are able to learn the spatial movement patterns of objects in a sequence of frames [40]. Inspired by the success of established CNN models, our aim in this study is to implement a predictive CNN for anomaly detection to assess the animal activity by computing a comparable activity score for different pig pens.
2. Materials and Methods
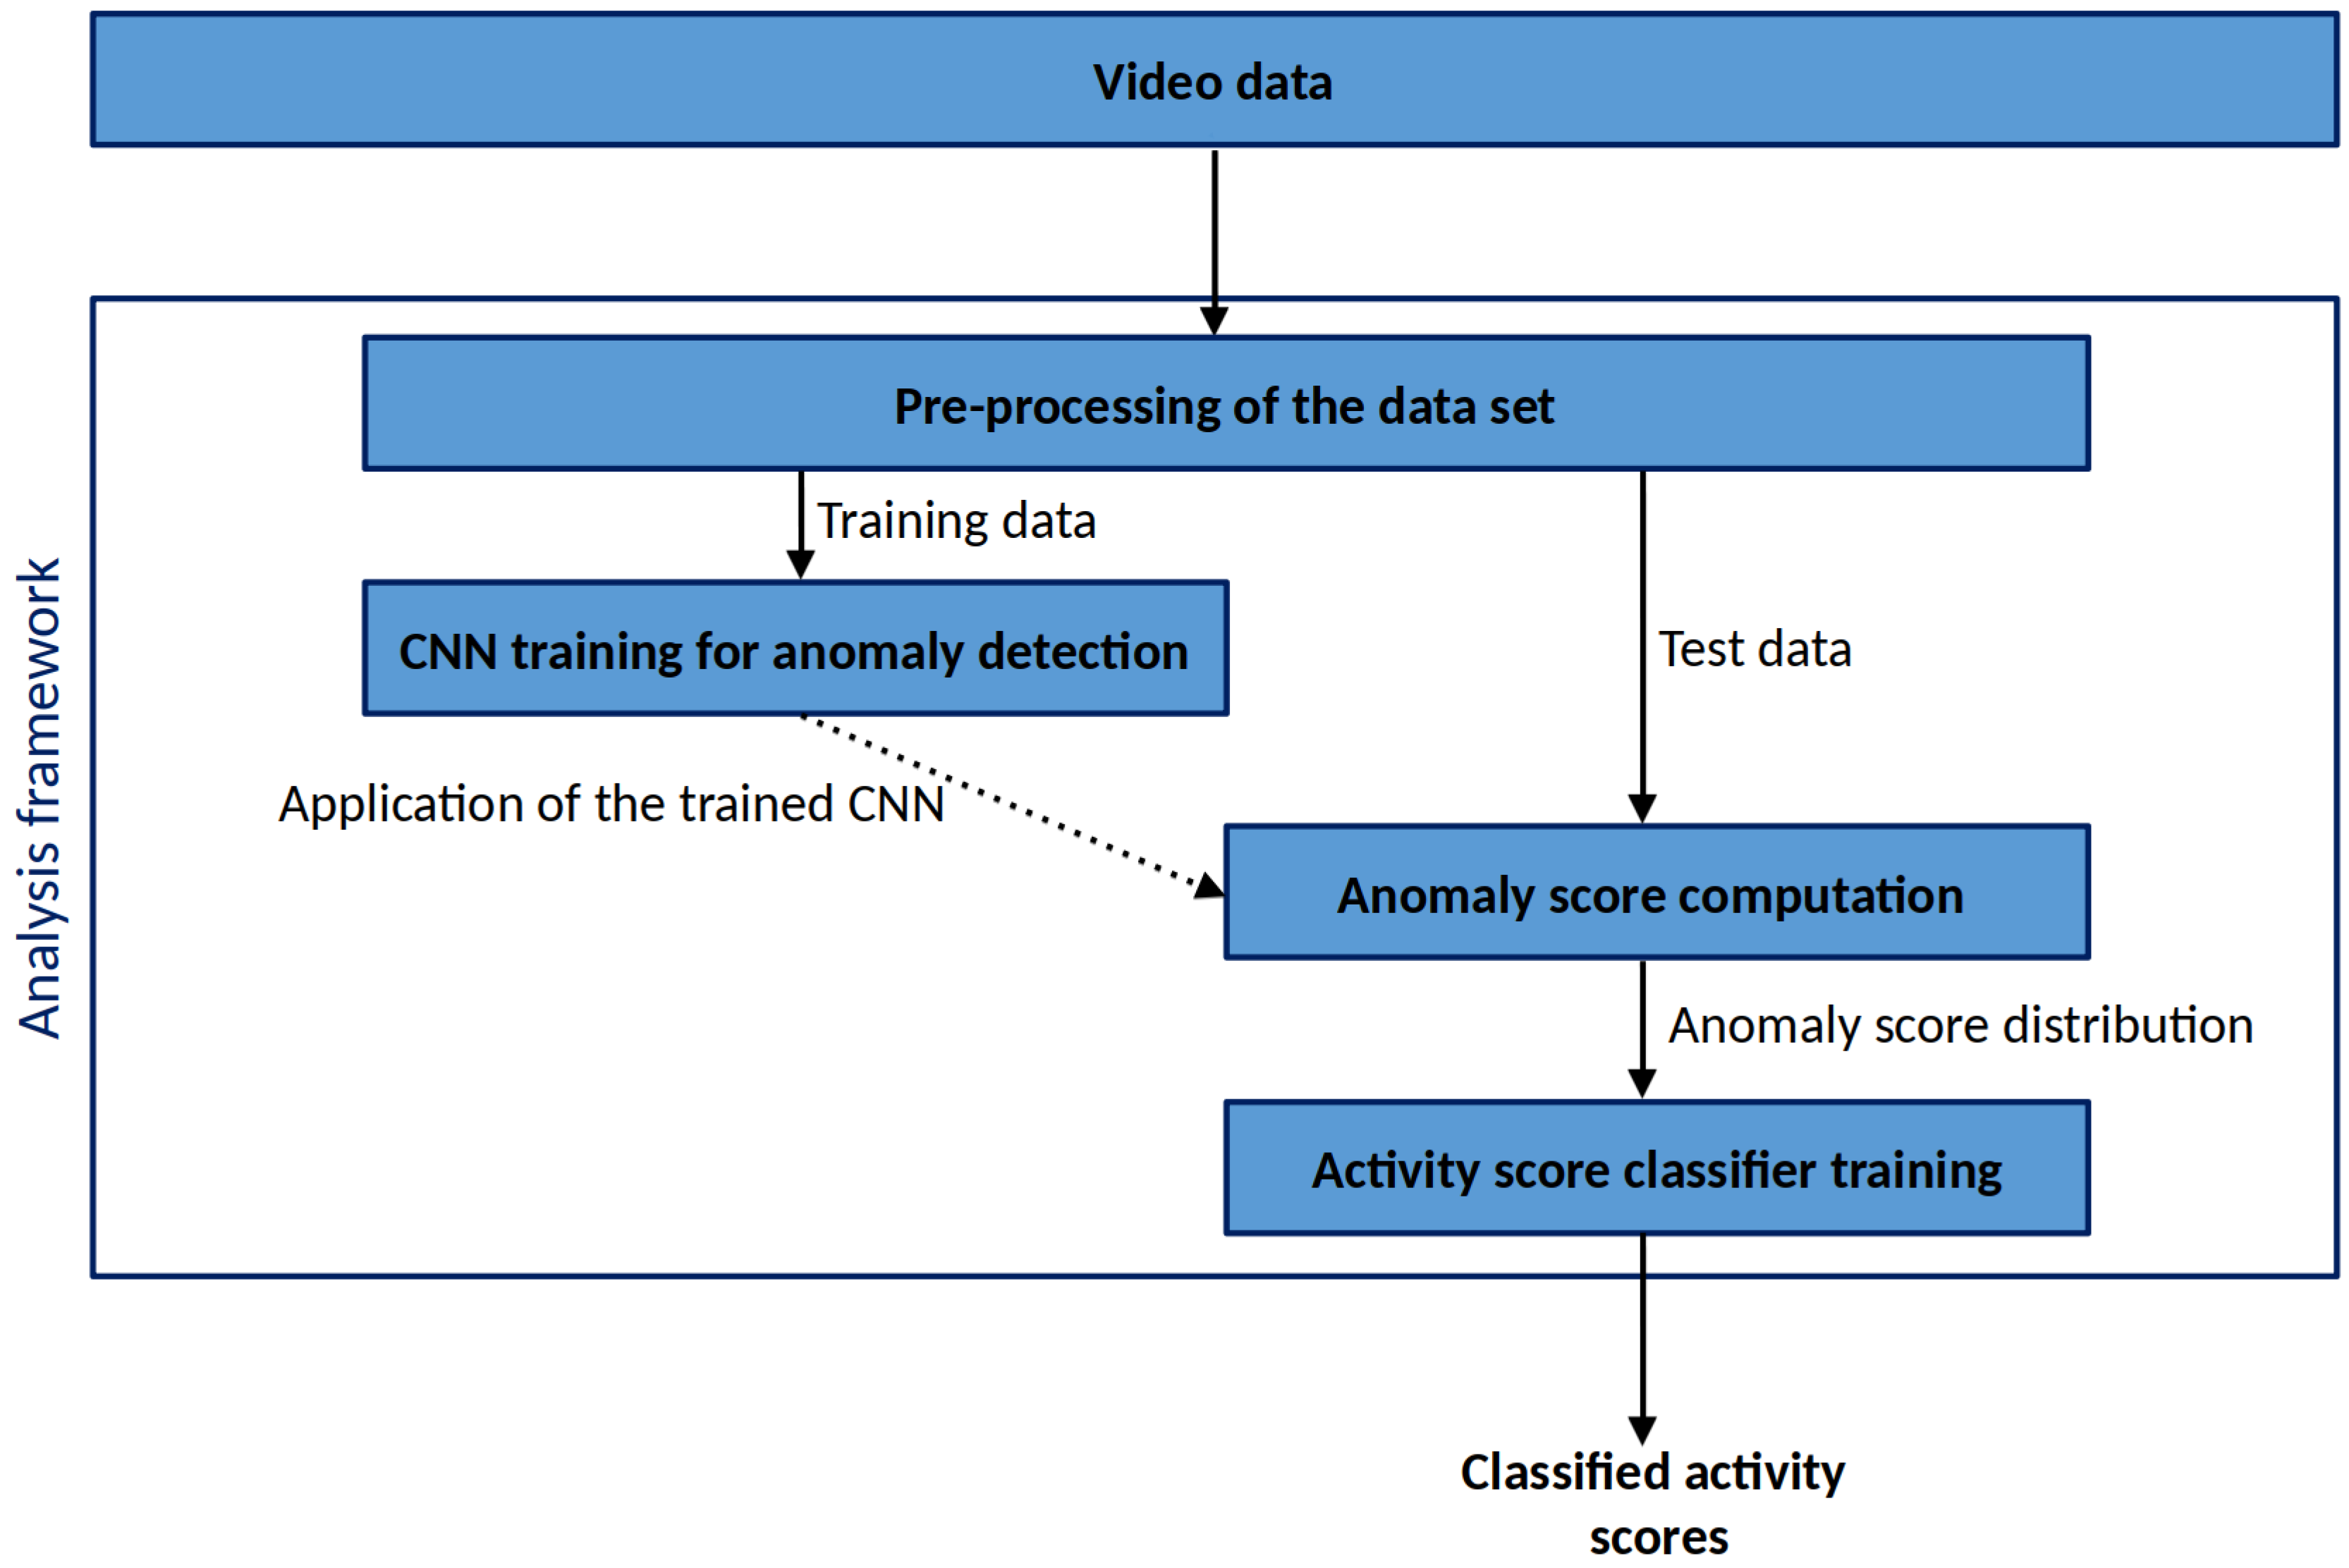
In this section we describe the video data used for the model development as well as the implemented model structure. After this, the downstream threshold-based classification algorithm and the model validation is explained in detail. Our analysis follows the structure of Figure 1.
2.1. Video Data
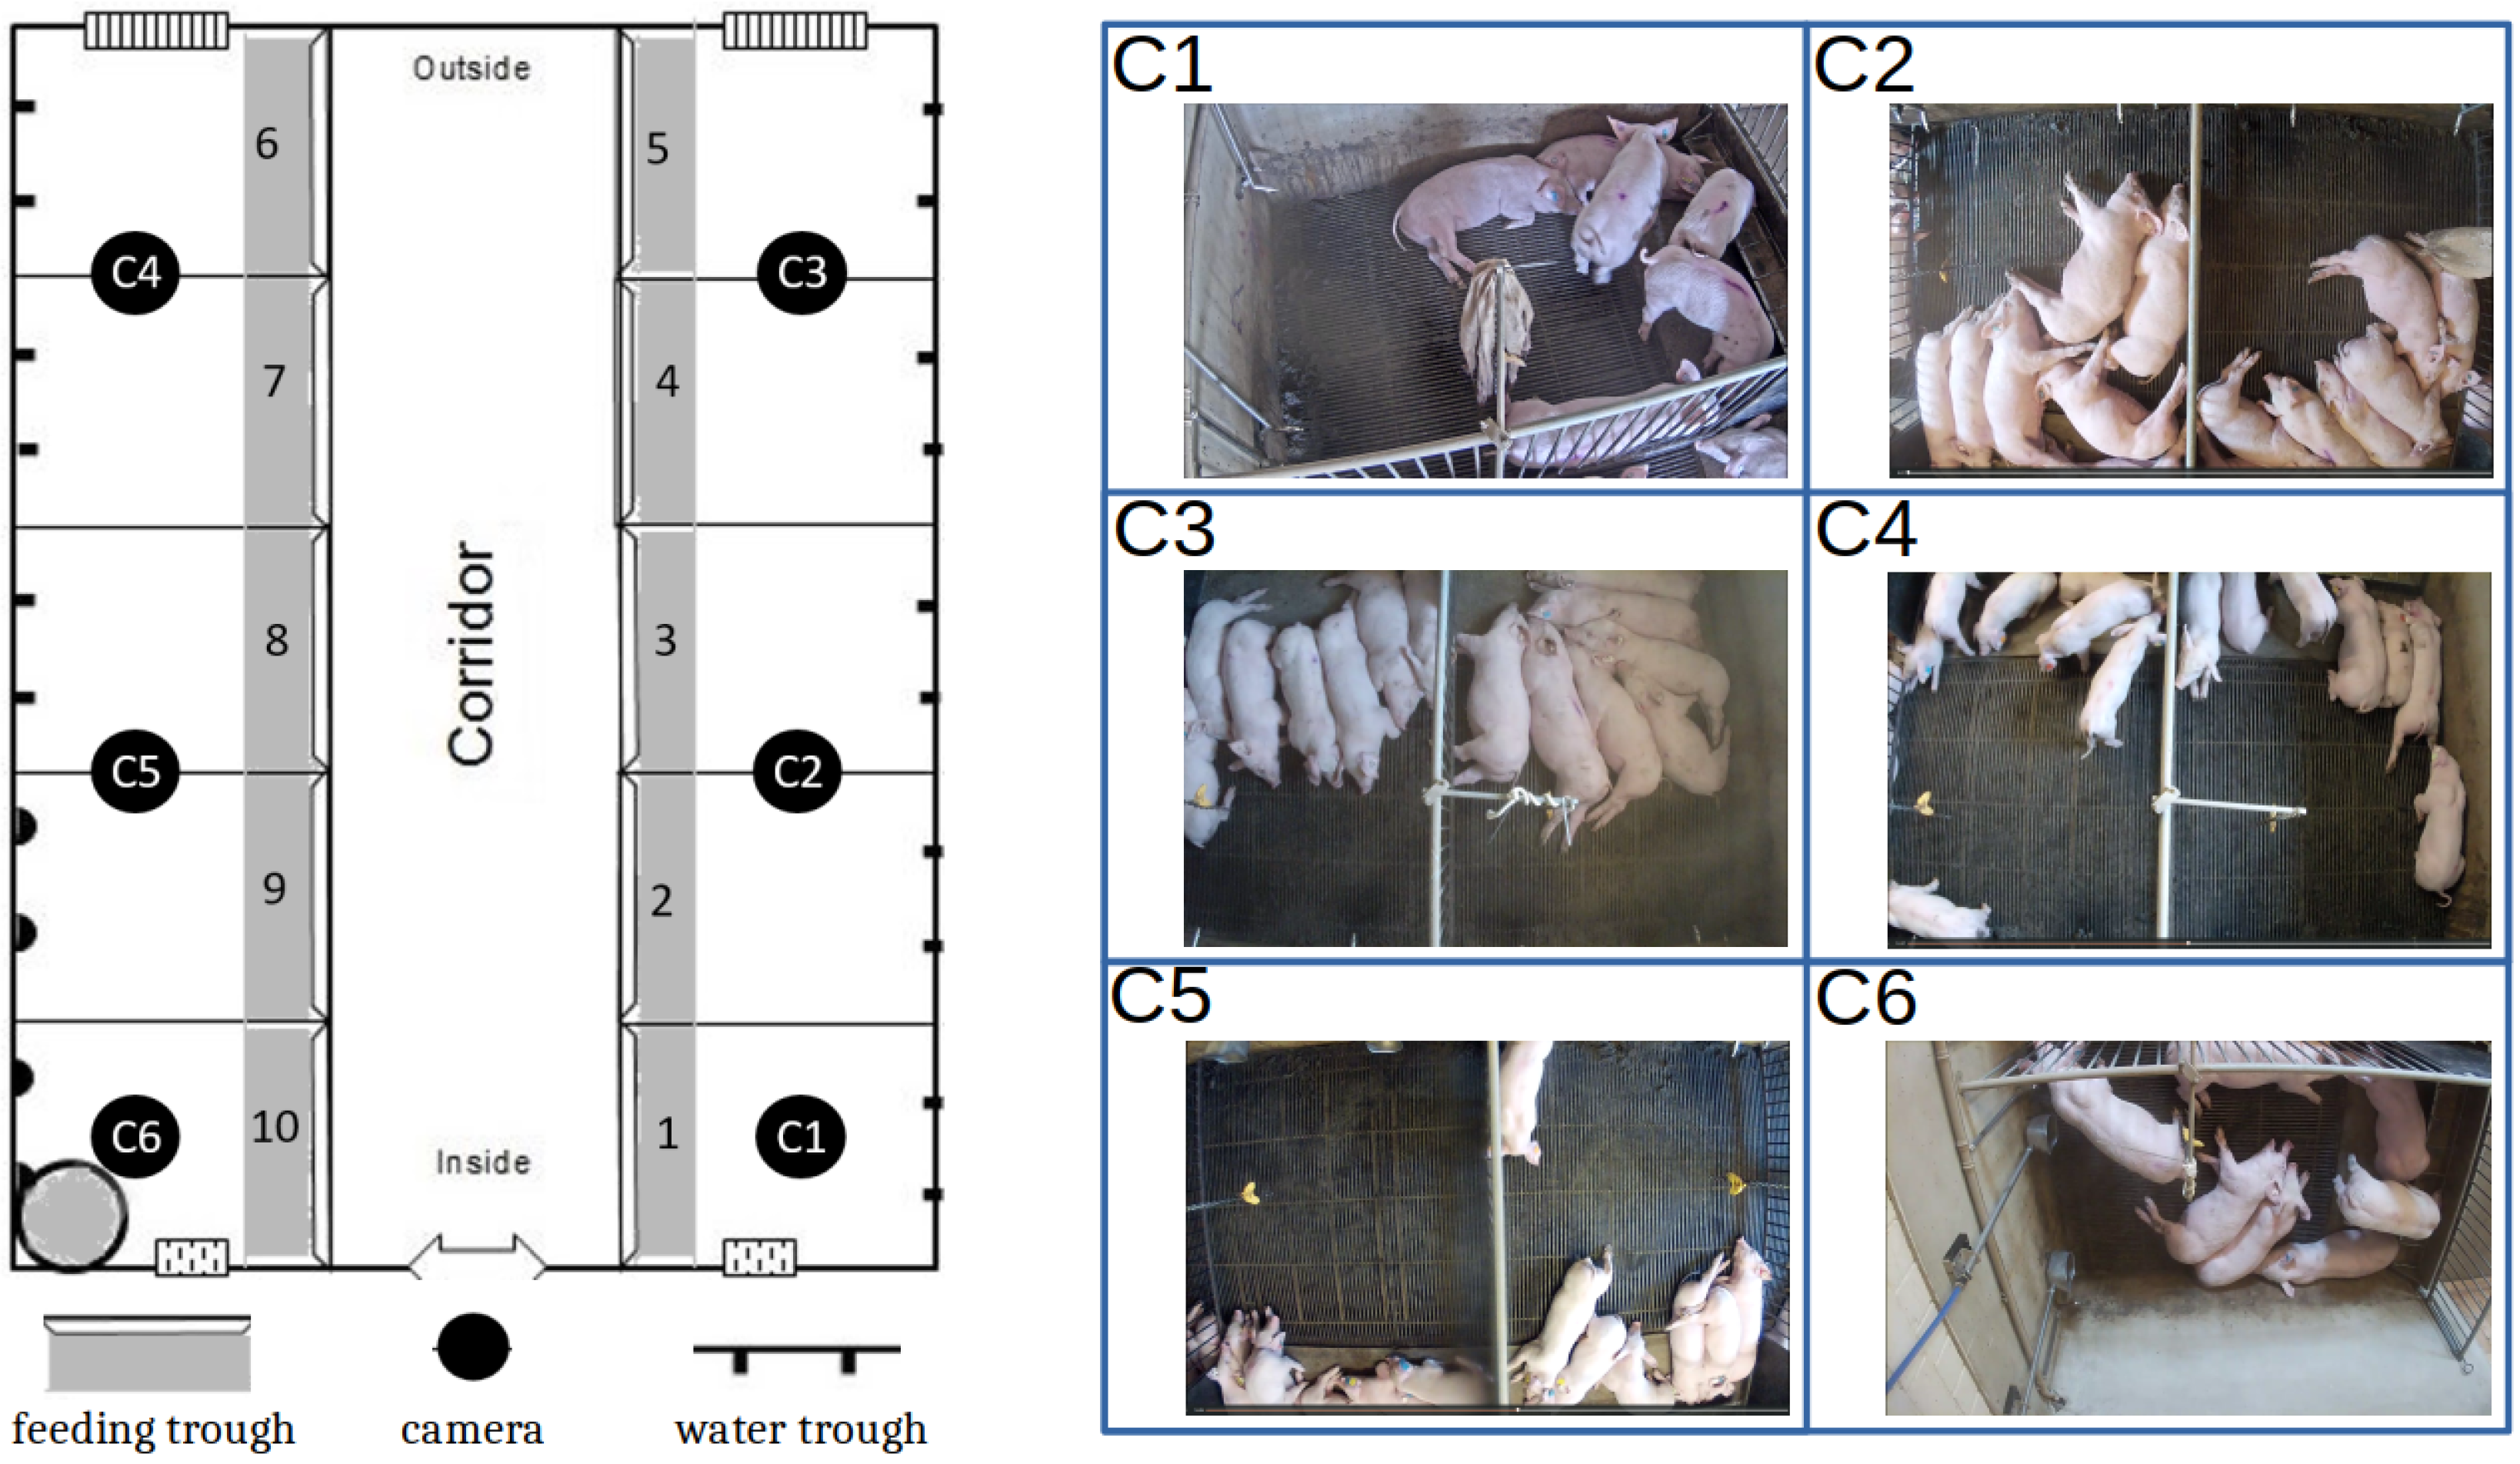
Video recordings from six cameras monitoring ten pig pens were taken in a research trial between March 2017 and March 2018 at a research facility of the Christian-Albrechts-University in Kiel, Germany. For the recordings, each camera of the type AXIS M30-VE was assembled 2 m above the pig pens. An overview of the pen arrangement, the camera placement and an example image of each camera are presented in Figure 2.
The number of monitored pens differs between cameras: while cameras 1 and 6 recorded a single pig pen each, the remaining four cameras recorded two pens. Despite the heterogeneous environments (arrangement of water troughs, structural design) and camera angles, the varying number of recorded pigs complicates the comparability between different cameras. We explicitly included video footage with varying environments to demonstrate the flexibility and robustness of our approach to work with different scenarios. Due to structural reasons of the pig compartments some areas within the pens could not be entirely captured by the cameras. Because our framework is based on observable pixel changes without identifying specific objects, this limitation does not affect the results and the applicability of this study. All videos used for this analysis have a length of 30 min, a frame rate of 15 frames per second (FPS) and a pixel dimension of . To increase the computational efficiency, only one frame per second was used and the videos have been gray-scaled in order to avoid a potential bias between videos with different color modes (day and night recordings).
2.2. Convolutional Autoencoder Network
Our proposed model follows a convolutional autoencoder structure, which is intensively used for unsupervised and semi-supervised anomaly detection tasks [40,41,42]. Anomaly detection itself is a well known area in machine learning and video motion analysis is becoming more and more important due to the increased use of video surveillance systems [40,43]. In general, anomaly detection aims to find atypical patterns that do not match the expected normal patterns, which constitute the majority of the data [44]. By defining an expected behavior pattern as the normal behavior, the detection of an anomaly corresponds to the detection of atypical patterns and can be used, for example, for activity recognition and classification [43]. For images and videos, the task of finding an anomaly is challenging due to the high dimensional structure and the non-local temporal variations [40]. In line with earlier studies [45,46,47,48], we implemented a predictive CNN network, by approximating the next video frame Xt given a series of the past q frames [Xt−1, Xt−2, …, Xt−q], in which it learns the visual activity patterns included in video sequences [49]. For our analysis, the CNN is trained entirely on normal behavior patterns in the form of low activity sequences that correspond to resting behavior at night. For each camera, five videos with a length of 30 min each were used for training. This step enables the model to accurately forecast the next video frame. However, the prediction accuracy of future frames with high activity patterns is decreased, as the model lacks the necessary information to predict these patterns [50]. As a result, those frames are categorized as anomalous events based on the corresponding Mean Squared Error (MSE) score (Equation (1)) between the predicted video frame and the true frame as the model loss function [48].
where is the predicted output pixel value, the true pixel value and p the number of pixels per frame. Consequently, the CNN output is used as an activity score which indicates the intensity of anomalous behavior patterns.
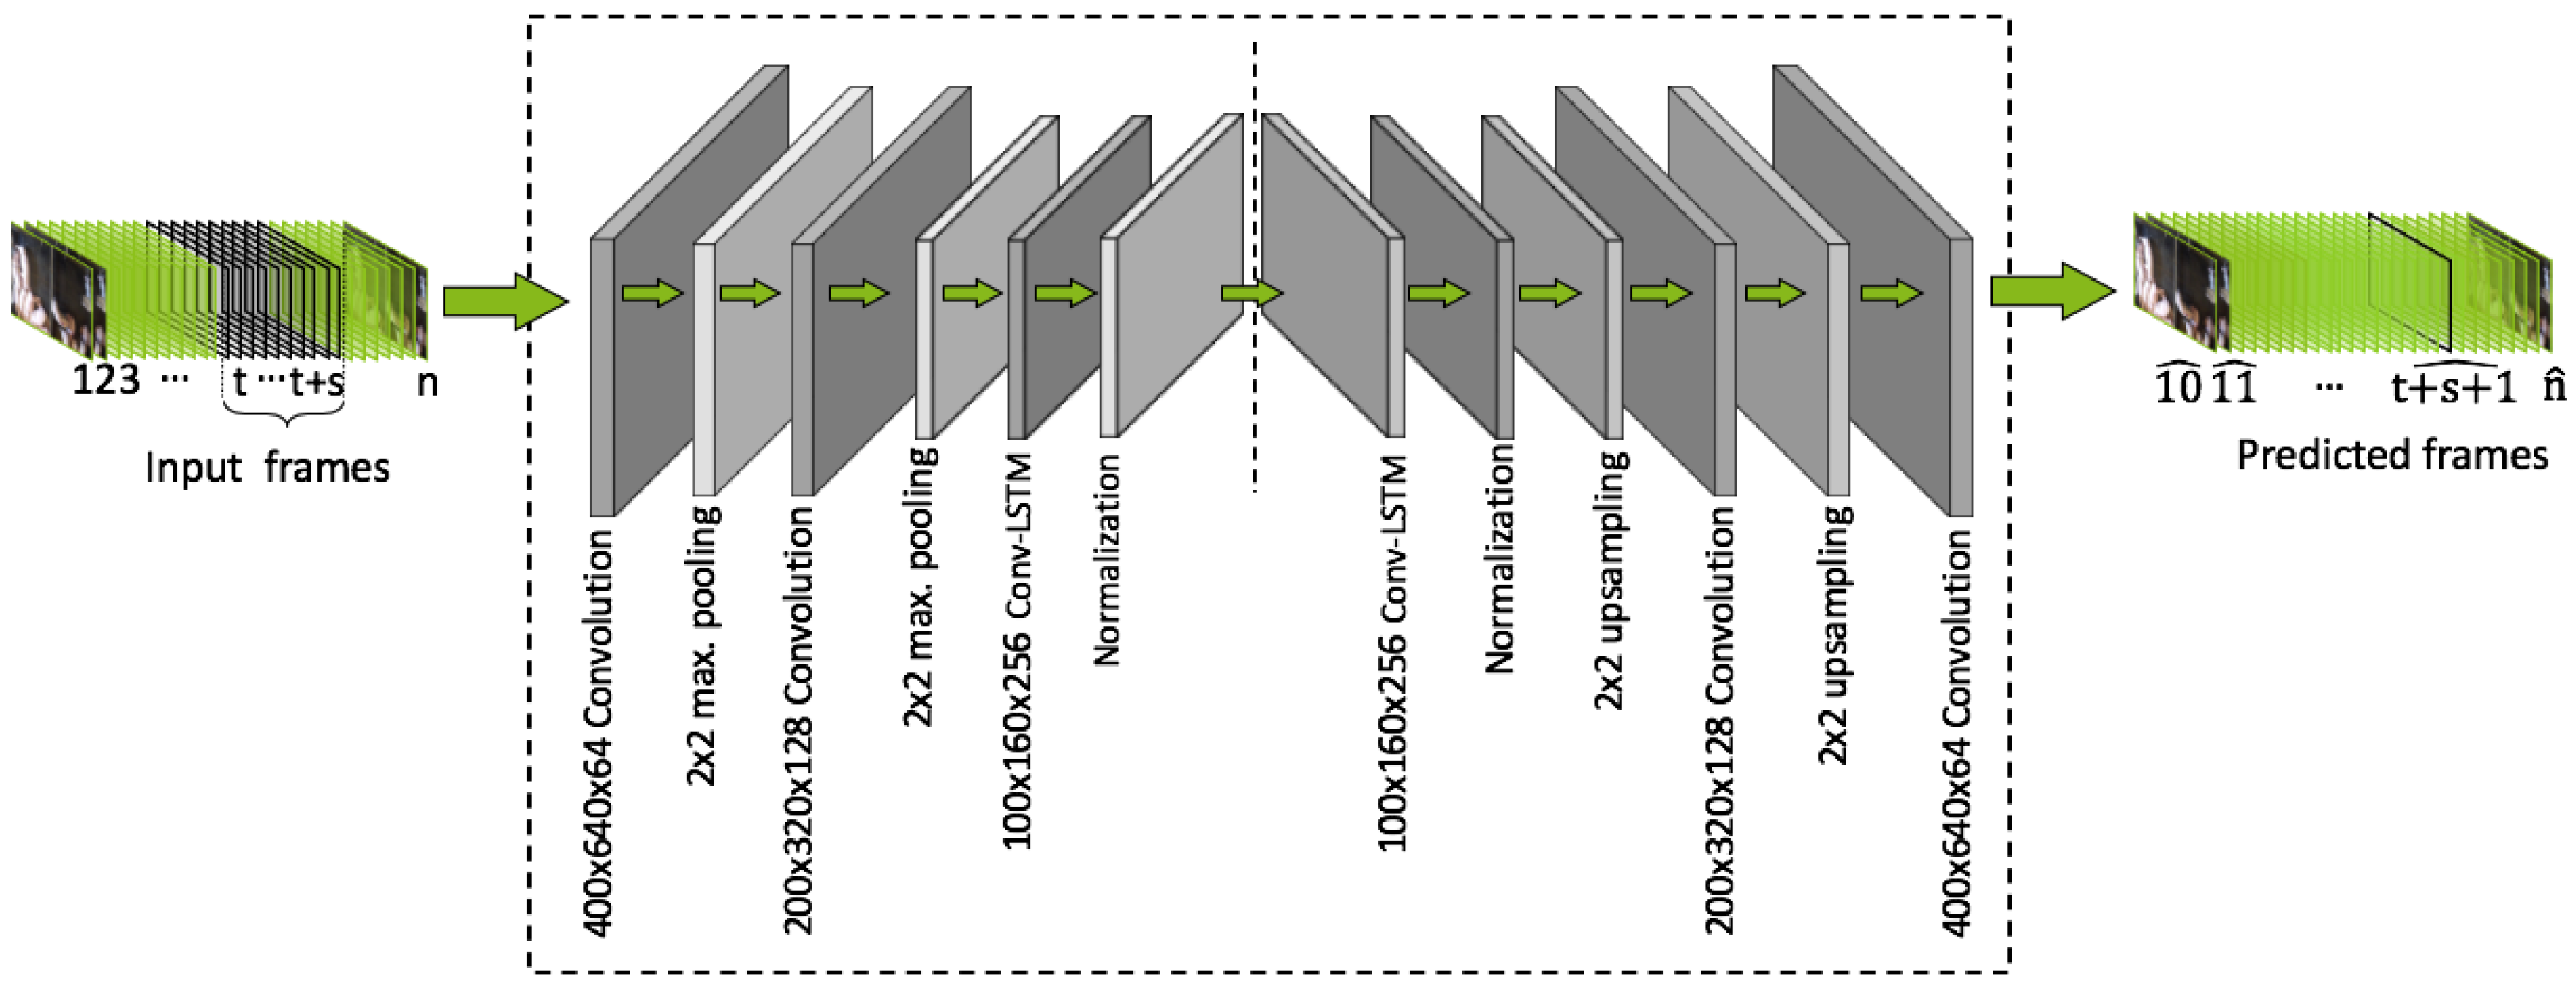
In our study we deal with highly complex activity patterns of pigs in a crowded environment. The spatio-temporal architecture is the model of our choice, since such architectures have already been successfully applied for anomaly detection for human data sets in crowded scenes [51]. As depicted in Figure 3, our proposed CNN network consists of two parts: a spatial encoder-decoder for learning the spatial patterns and a temporal encoder-decoder that receives the encoded spatial representations and takes the temporal correlation of consecutive video frames into account. The spatial autoencoder consists of two 2D-convolutional layers for the encoder and decoder each. Max-pooling-layers for the encoder and upsampling-layers for the decoder are used after each convolution to adjust the image dimension while being processed by the network [52]. At the bottleneck of the spatial autoencoder two convolutional long short term memory (LSTM) layers are used for the temporal encoder-decoder part. At the end of the temporal autoencoder a prediction of the future frame based on the given input sequence is computed and reconstructed to the original input dimension by the spatial decoder part. Prior to the model training, we downsampled all video frames so that the target dimension was pixels. The convolutional neural network was implemented in R (version 3.6.3) using the deep learning framework Keras (version 2.2.4) [53] with TensorFlow (version 2.0) [54] as a backend. The model was trained using the Adadelta optimizer [55] and a workstation equipped with two Intel Xeon Gold 6138 CPUs, 512 GB RAM and a NVIDIA Quadro P5000 GPU.
2.3. Threshold-Based Activity Score Classification
In order to increase the comparability and interpretation of the activity scores computed by the CNN, the scaling of these scores is necessary. For this purpose, we have used a threshold-based activity score classification approach by analyzing a total of 288 videos with our CNN model. For this classifier 48 videos containing 24 consecutive hours of observation time were selected for each camera. To ensure the comparability between pens all samples were taken over an equal period of time. Since theses videos contain both day and night recordings, a broad variety of activity patterns is included. By analyzing each video with a frame rate of one frame per second, we determined a total number of 515,196 activity scores (85,866 scores per camera) from which the classifier can deduce the intensity range of each camera.
For the implementation of the classification algorithm the activity scores are discretized into 100 evenly distributed intervals. The interval thresholds are calculated for each camera individually, based on the distribution of the activity scores. Equation (2) shows the general classification process, where the activity score x is classified conditioned on the specific level.
Here, the lower and upper bounds and correspond to the and the -quantiles of the camera specific activity scores. By systematically analyzing different values for and , we established that using the -quantile and the -quantile are the most convenient bounds to account for potential outlier effects caused by distorted and overexposed video frames.
2.4. Model Validation
2.4.1. Comparison with Manual Observations
To evaluate the prediction quality of our framework we tested it on manually rated videos. Thus, a set of 82 videos of ten seconds containing a broad variety of activity patterns were selected and manually annotated by human visual observation. Consequently, the manual ratings are used as a baseline against which the CNN results are compared. Here, we followed the idea of previous studies [35,56] and rated the animal activity based on their locomotion behavior type like running, walking or lying as well as the number of animals moving and defined three activity regions namely low activity, medium activity and high activity. To ensure the objectivity of the manual classification process each video was evaluated without taking the CNN classification results into account. A trained observer categorized each video independently into one of the three activity regions. In cases where no movement occurred or in which all animals took in a lying position, the corresponding video was rated as low activity. If up to four animals (~50% of pen occupancy) showed a standing posture without movement or were showing a walking behavior with less activity intensities, the video was manually marked as medium activity. Consequently, the video was marked as high activity if more than four animals were walking or at least one animal was running with a strong locomotion intensity. In total, we annotated 18 videos as low activity, 33 videos as medium activity and 31 videos as high activity.
This consolidation of the observable activity into three classes was necessary to allow the comparison of our framework with human visual observations. Our model was designed to classify the animal activity into a larger category space ranging from class 1 to class 100. Therefore, for the comparison with the manual ratings and the sake of simplicity, we differentiated the activity class obtained from our model into low, medium and high activity categories. Similar to the manual rating, we classified a video as low activity if the highest activity class obtained from the model was below an activity class score of 25 for that video. If the highest activity class was between 25 and 75, we categorized the video as medium activity. Finally, if the activity class of at least one video frame was above 75, the video was marked as high activity. In order to measure the association strength between the manual ratings and the consolidated CNN predictions we applied Kendall’s rank-order correlation coefficient (Kendall’s ) [57], as a non-parametric association metric especially designed for measuring the association of ordinally scaled variables.
2.4.2. Performance Assessment on Benchmark Data Sets
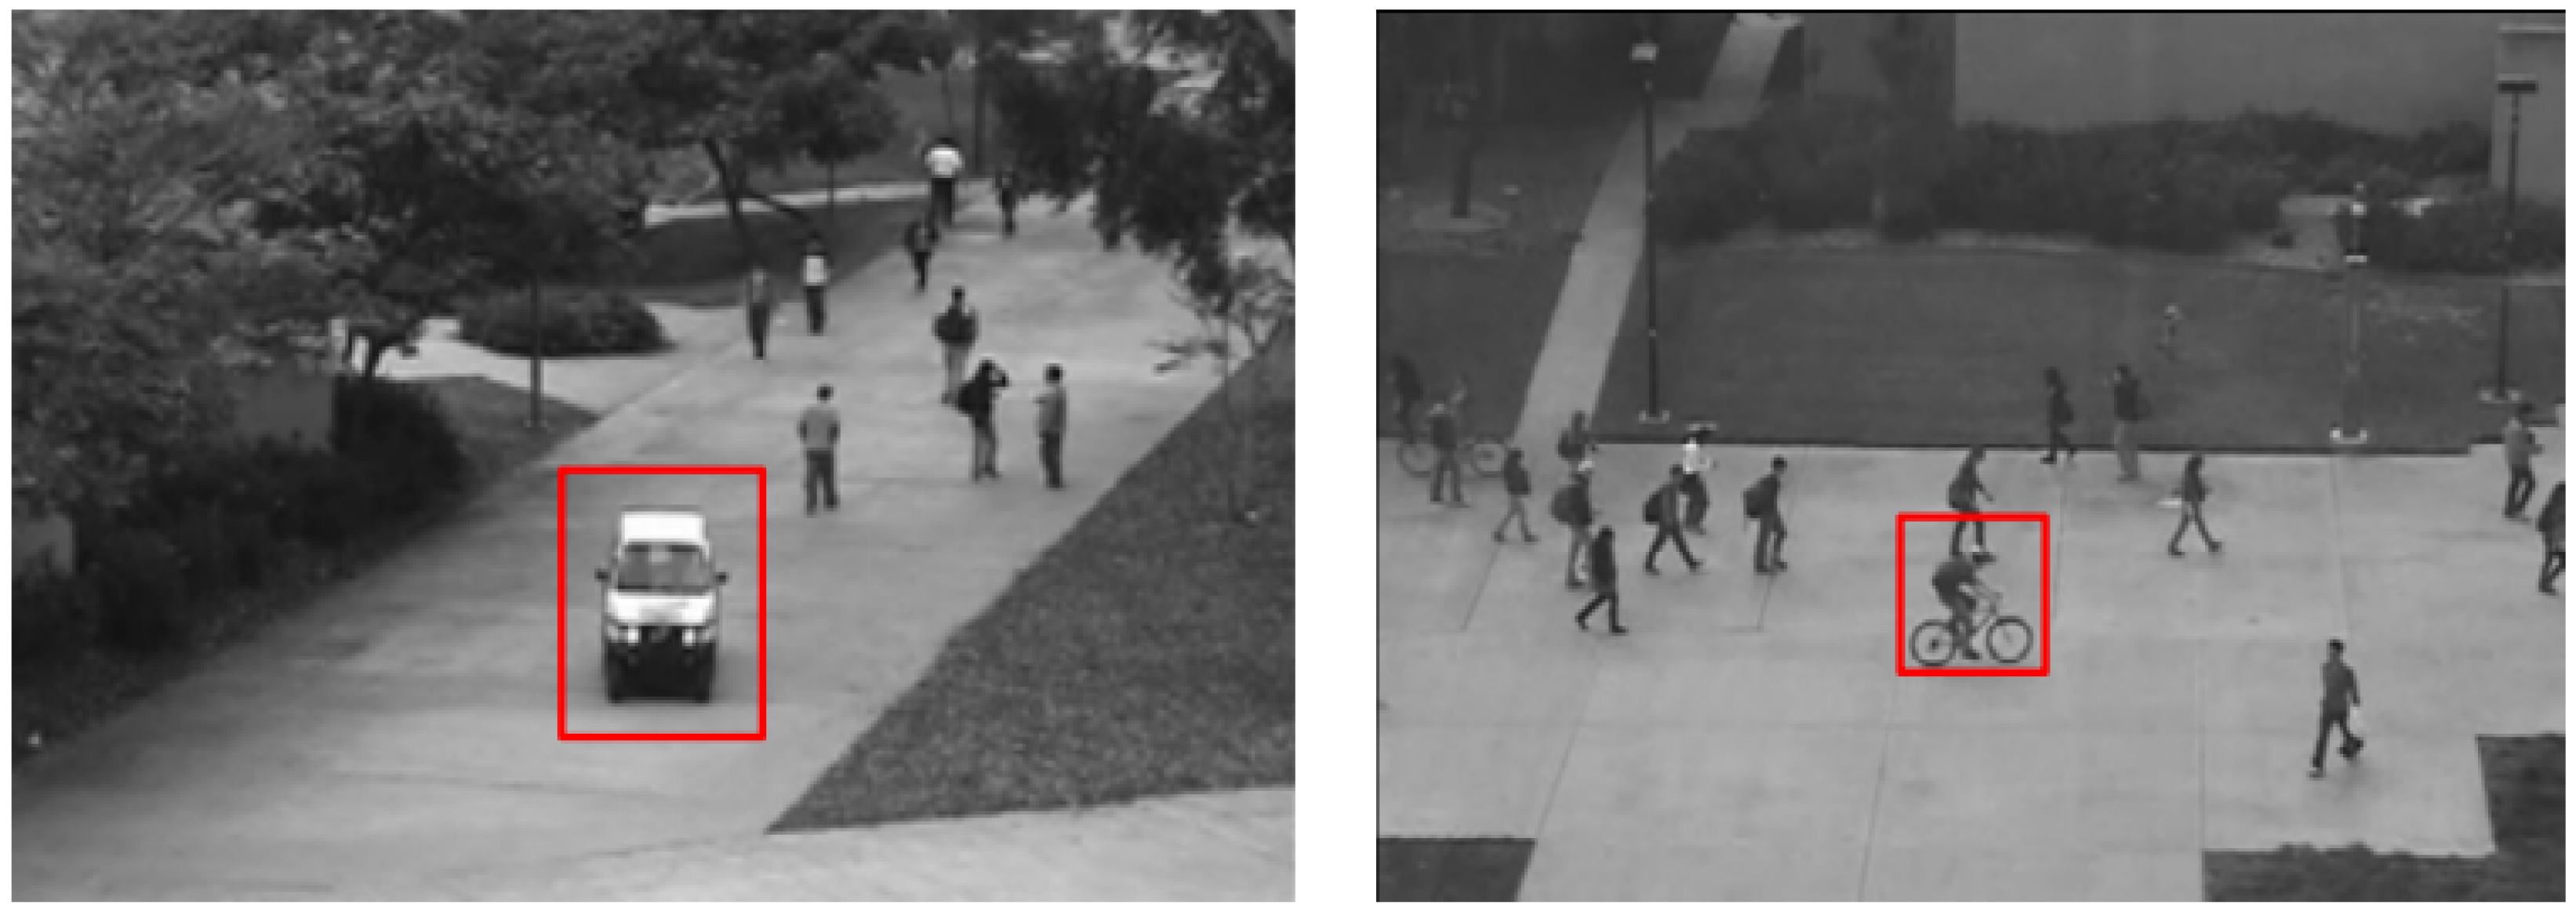
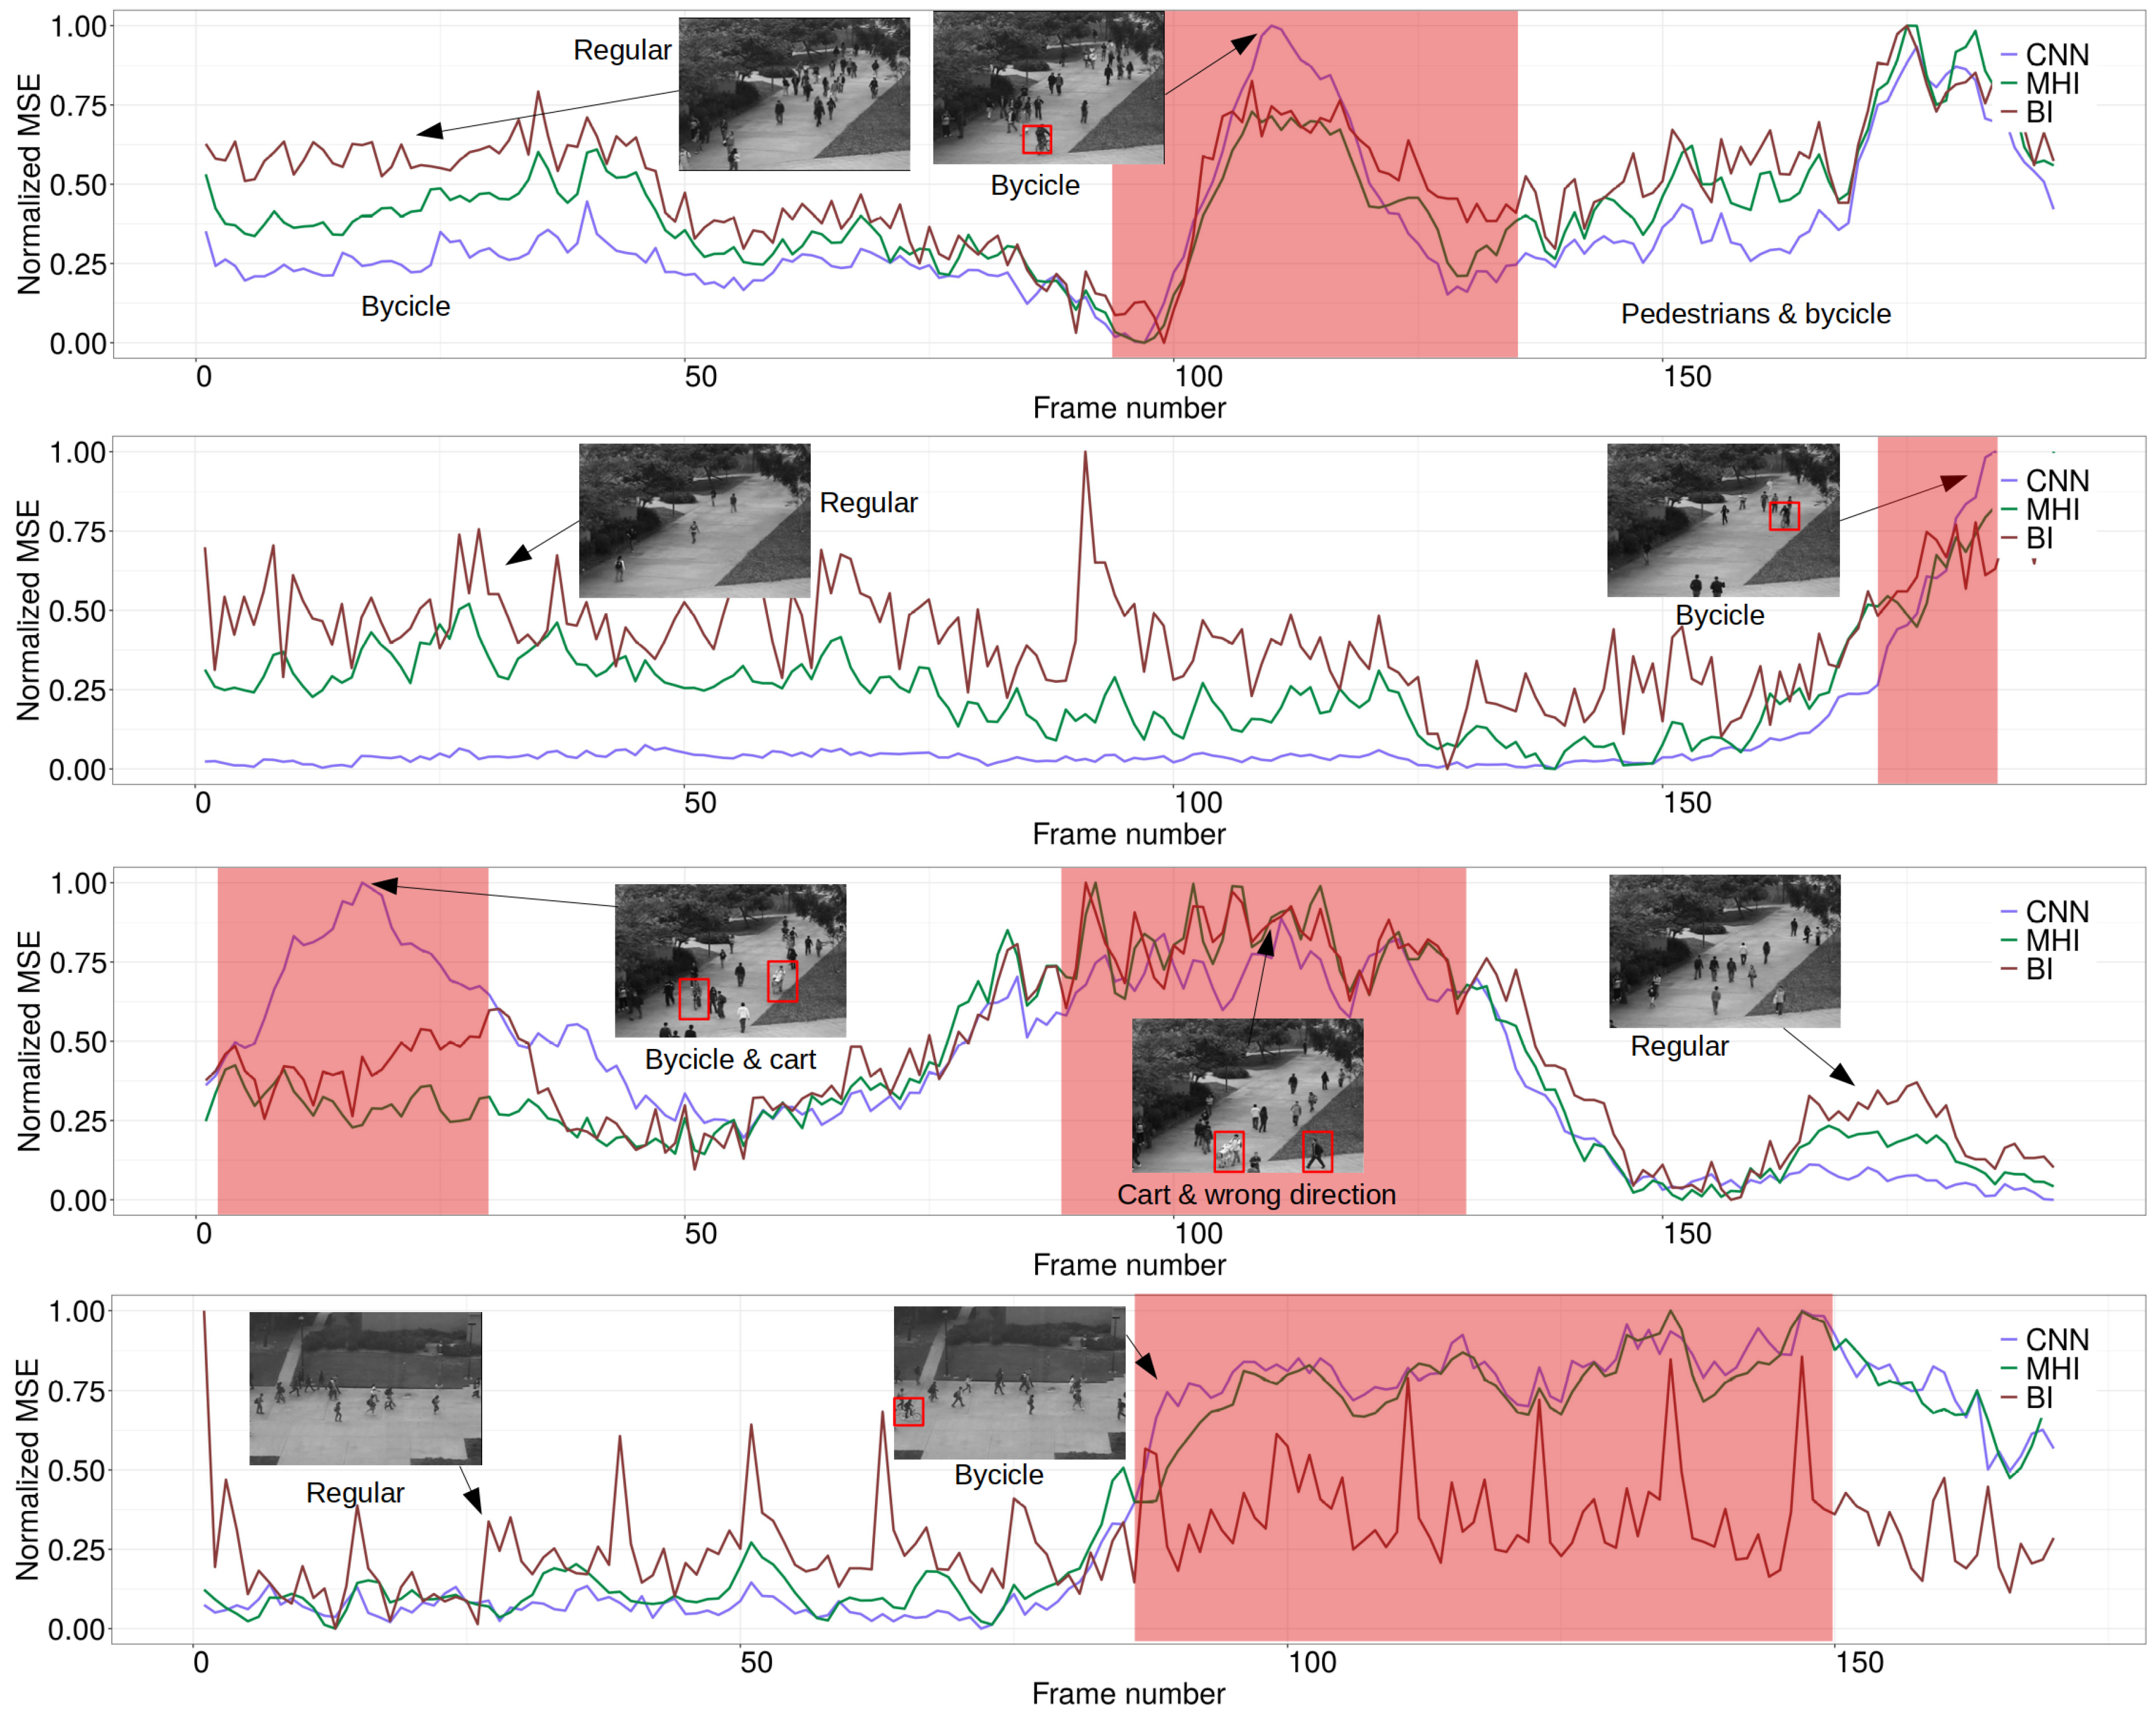
To additionally assess the performance of our approach, we performed a comparison study between our framework, a MHI-based approach and a binary image-based approach. Here, we used three benchmark data sets, i.e., two Pedestrian data sets published by the University of California, San Diego (UCSD) [58,59] and our pig data set. The UCSD Pedestrian data sets are well known in the machine learning community and are frequently used to evaluate the model performance for the detection of abnormal events in the form of unusual motion patterns [50,60]. The data sets contain two scenarios of pedestrians walking on a sidewalk, which is defined as the normal motion pattern. Anomalies occur in the form of cyclists, skateboarders, carts and small vehicles. While UCSD 1 consists of 34 train sequences (6800 frames) and 36 test sequences (7200 frames), UCSD 2 contains 16 training sequences (2551 frames) and 12 test sequences (2019 frames). Figure 4 shows an example of two frames from the UCSD 1 and the UCSD 2 data set.
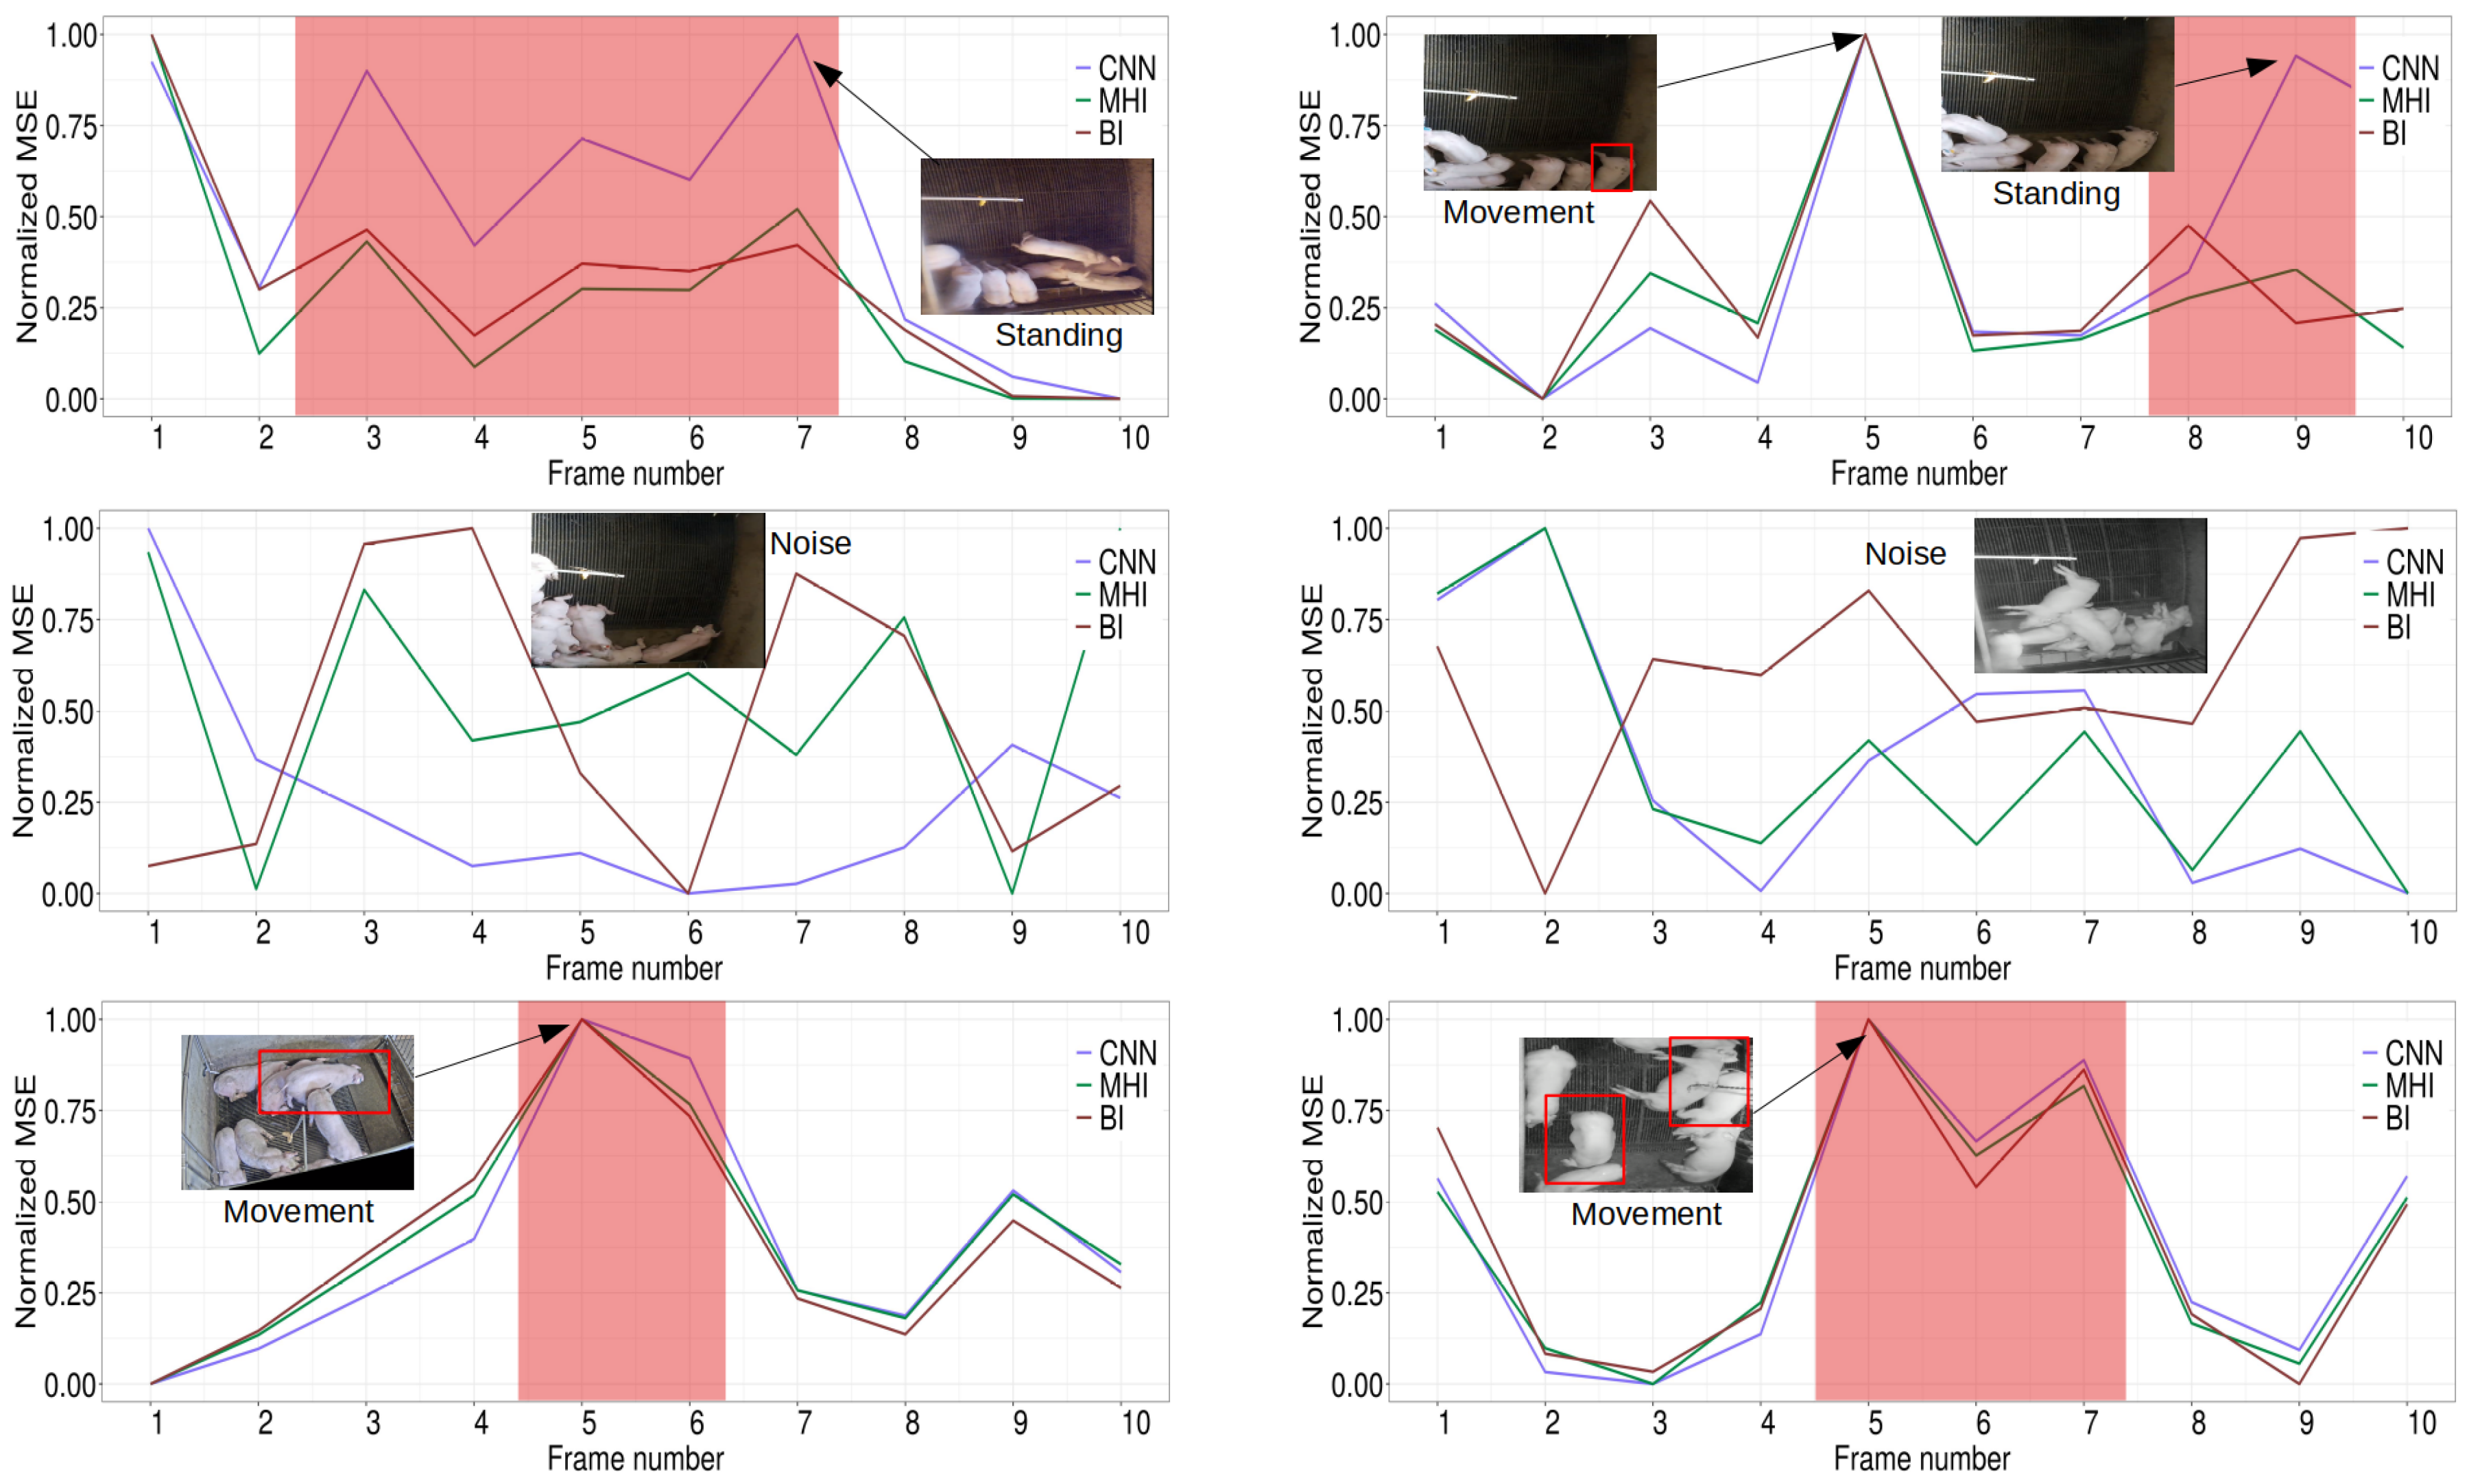
To compute the MHI, we applied a sliding window on each test sequence and compared two consecutive frames extracted in time t and based on their MSE values (Equation (1)). Similarly, for the binary image approach we followed the study of Ott et al. [35] and Tsai et al. [36]. First, we performed background subtraction and created a binary image for each video frame in the test set. After that the squared differences between consecutive binary images in time t and were calculated. Subsequently, we applied our CNN on the same sequences after learning the regular movement behavior from the training set and compared the results.
3. Results
The following section is comprised of two parts. First, to demonstrate the performance and functionality of our approach, we analyzed several videos which contain various types of activity of the pigs. Second, the results for the model validation using the manual video classifications as well as the comparison study between our model, the MHI and the binary image approach are presented.
3.1. Anomaly Detection and Classification
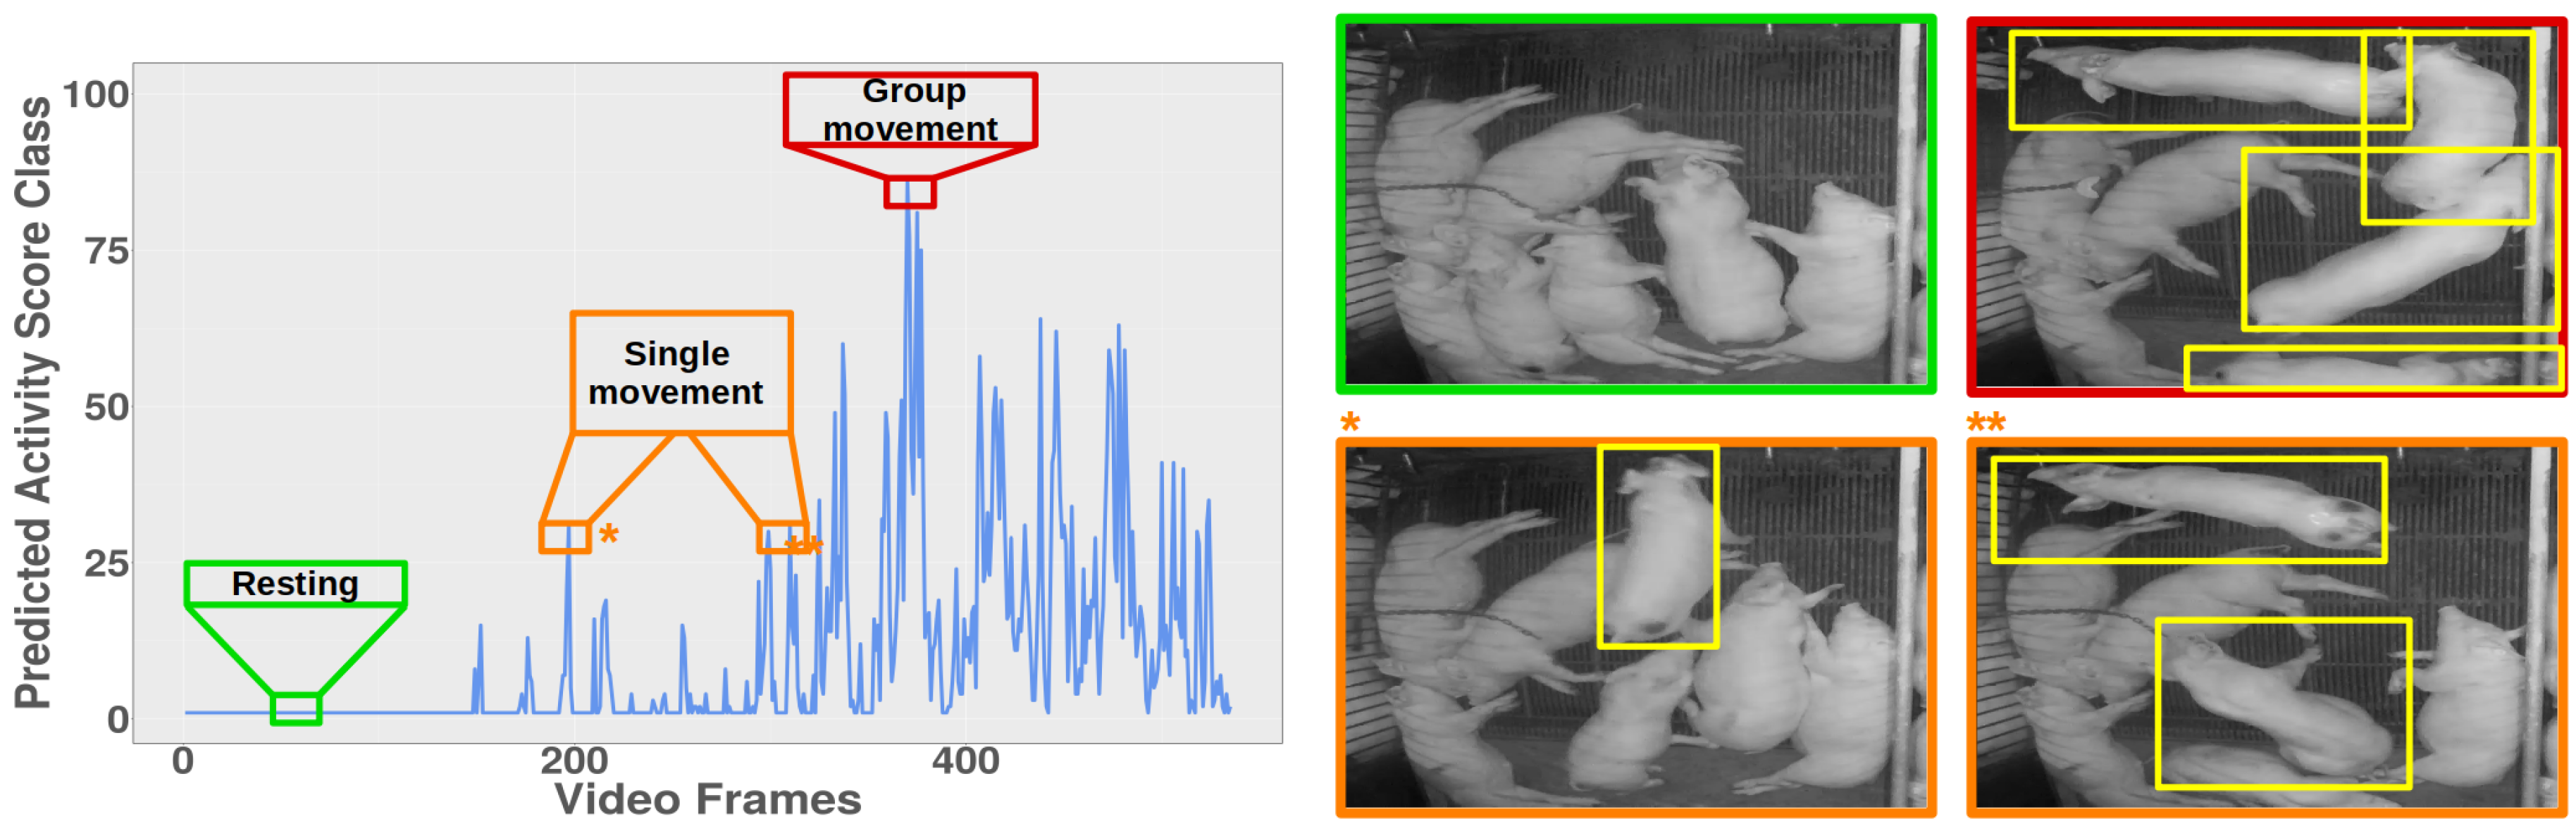
By analyzing multiple videos and predicting an activity class for each frame we found that our framework is able to detect varying types of behavior like lying, standing, walking or running. Figure 5 shows an example video analyzed by our model. Our analysis showed that the range of the predicted activity score class for the corresponding frames was low during a resting phase in which no activities occurred. In contrast, the more the animal activity increased and the more pigs became active, the higher was the predicted class. In particular, a maximum score of 100 was reached for situations, in which all pigs showed strong interactions with intense activity levels.
By manually comparing the results of our framework and the corresponding time points in the videos, we observed that lower activity periods (activity class score 25) are related to resting behavior of the animals while mid-range class scores between approximately 25 and 75 correspond to less intense movement activities mainly caused by a single animal walking or by two animals changing their body posture, respectively. Class scores 75 are only reached if several animals are interacting with each other strongly or unexpected events occur near the pens (see Figure 5).
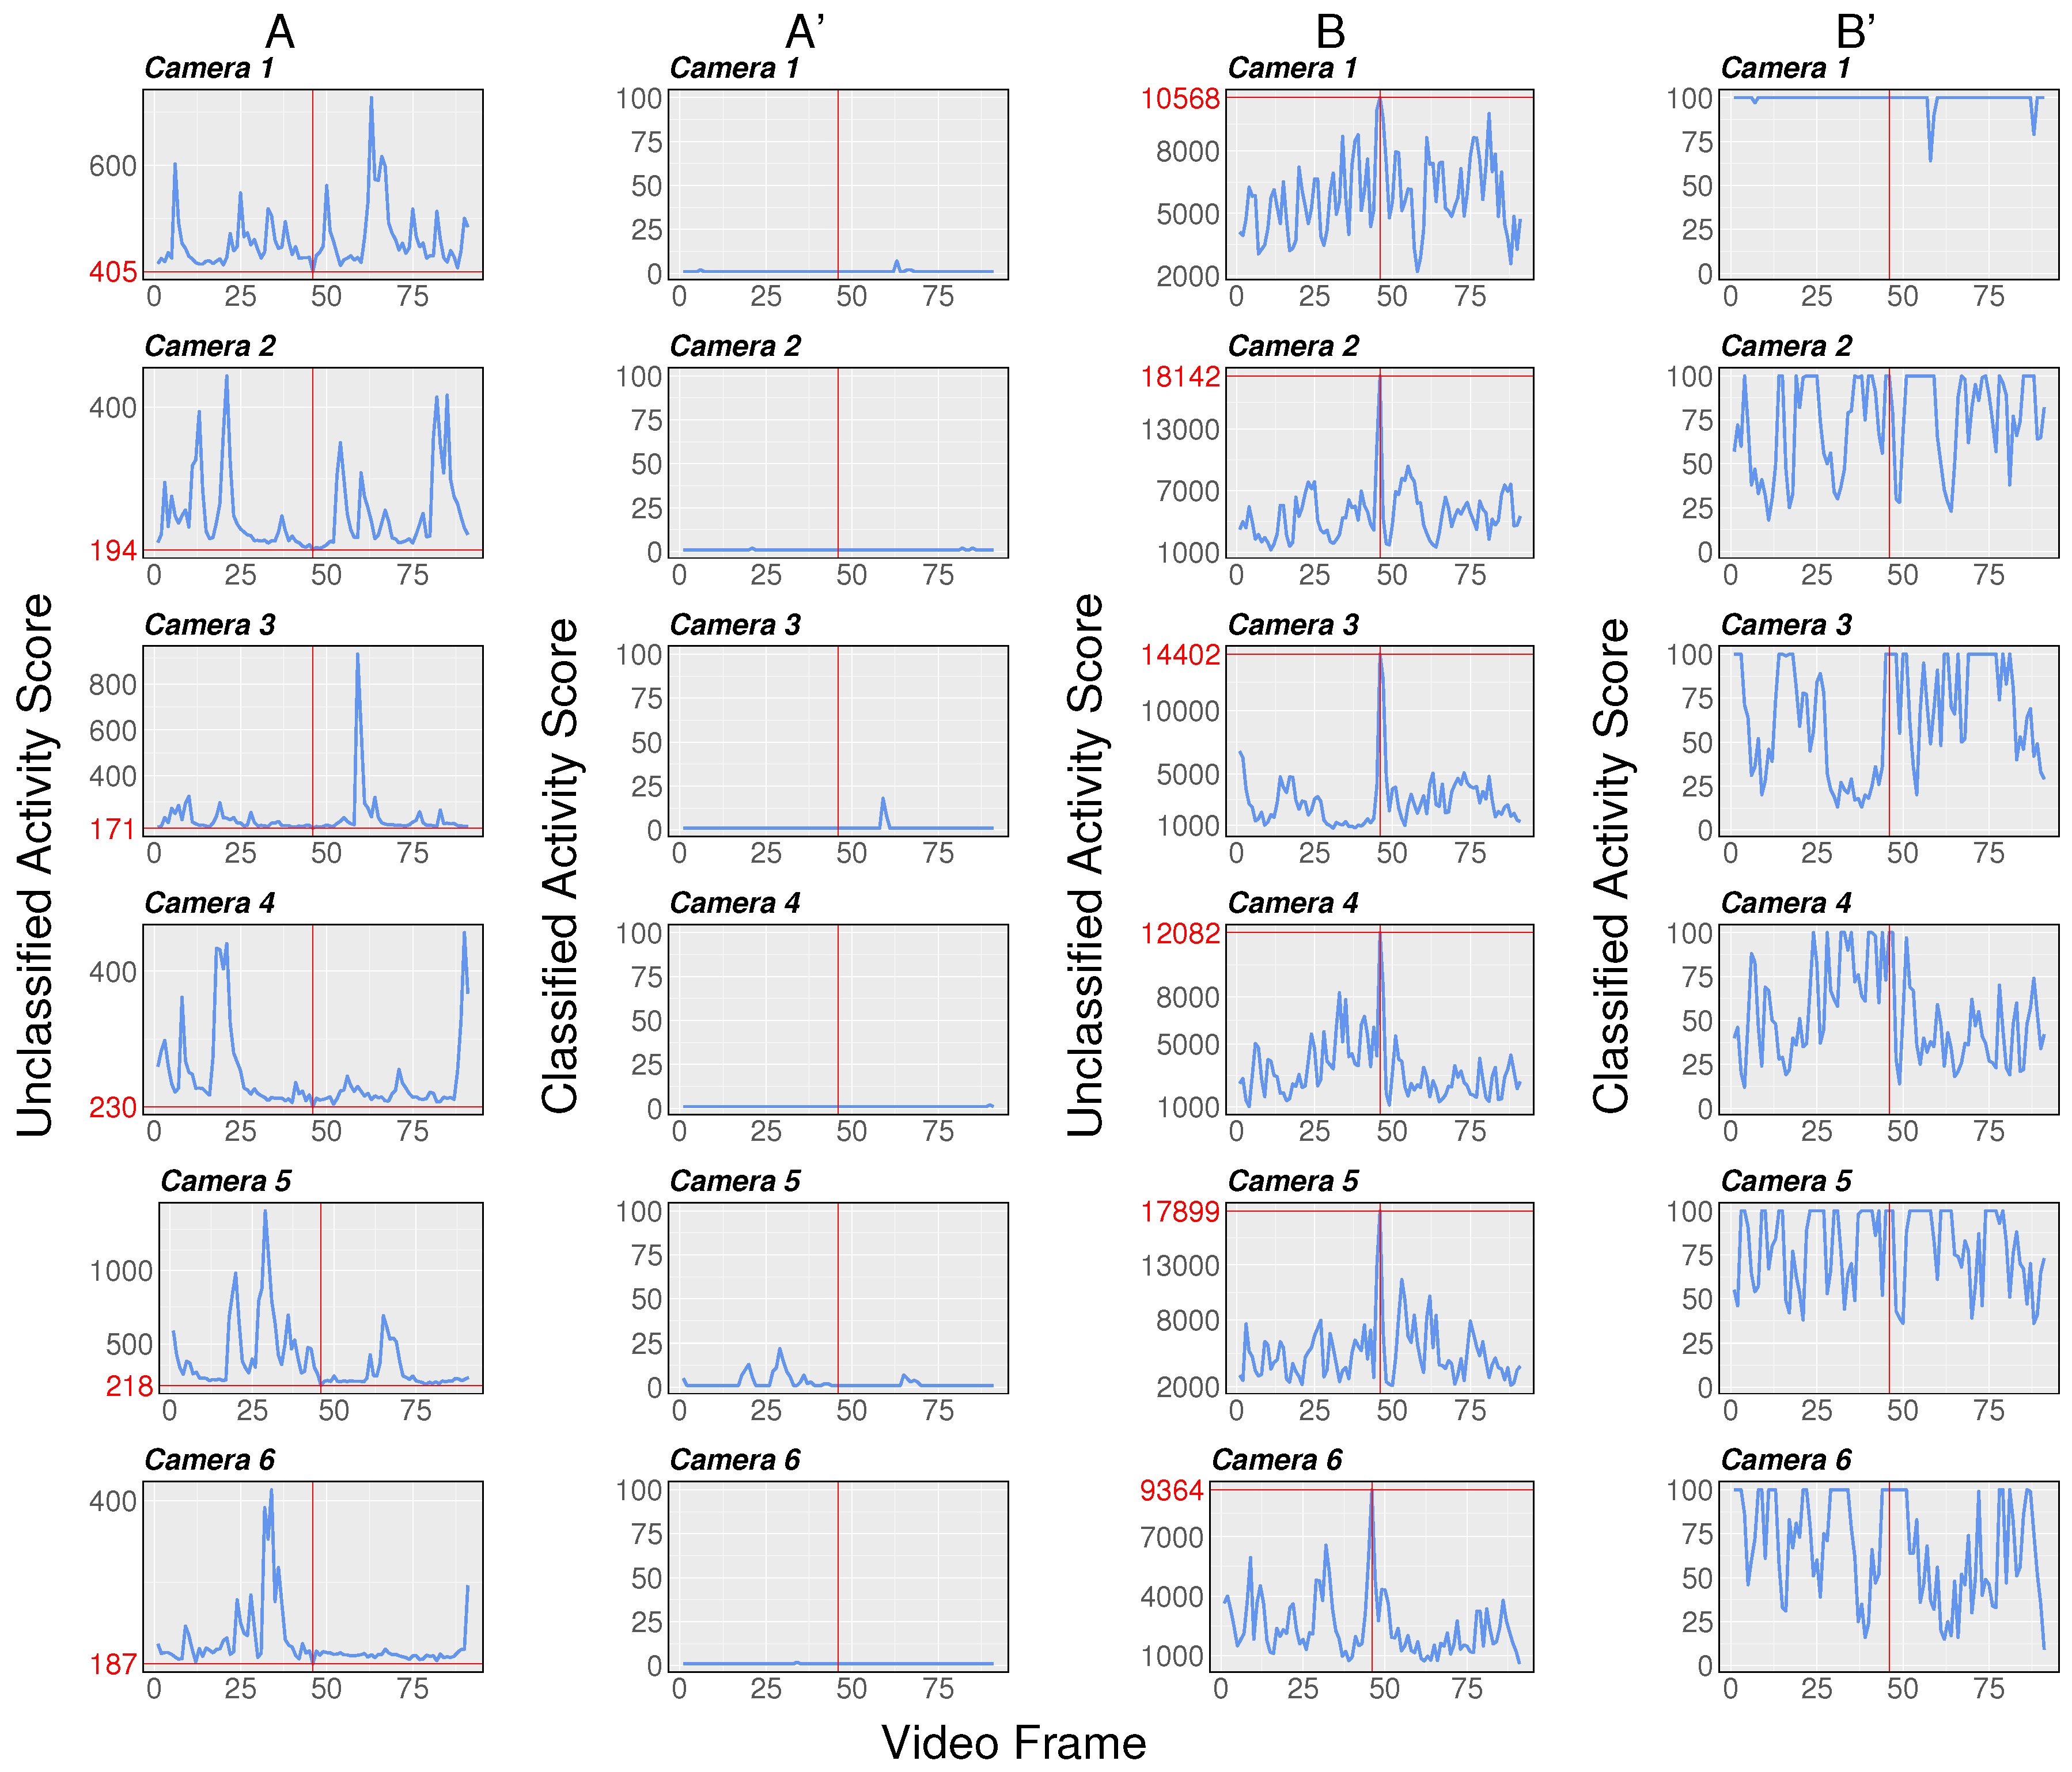
To gain more insight in the working processes of our approach, we compared the classified sequences computed by the activity classifier with the observed activity scores without classification directly taken from the CNN. Although the observed activity scores already indicated phases of different motion activities, prior knowledge is required for a meaningful interpretation. Furthermore, the usage of the observed scores is only advisable for videos from the same camera due to camera specific score ranges that result in a different activity score intensity for the same motion behavior (for example, a single animal is moving within the pig pen). Figure 6 presents the results for the video comparison and illustrates the necessity of the activity score classification.
In Figure 6, low activity videos (Figure 6A) as well as high activity videos (Figure 6B) were used to demonstrate the necessity of the anomaly score classification. While the videos in Figure 6A,B show the activity score computed by the CNN, a direct comparison of multiple videos is critical due to a non-constant activity score range computed for each pen. Therefore, to increase the comparability between sequences of different cameras, a correction of the pen specific bias is required. The varying score range can be explained by the learning behavior of the CNN to extract camera specific characteristics during training as well as the negative effect of natural noise inherent in the video files which lead to lower boundaries even for situations in which no activity occurred [16]. The videos in Figure 6A’,B’ show the corresponding classification results of the activity scores. Since the classifier has learned the potential range of the observed activity scores for each camera, it classifies periods without activity as class one. However, very high activity intensities, which lie above the 0.9-quantile of all observed activity values, were classified into the maximum class of 100. Therefore, situations in which the animals are interacting intensively with each other can be identified due to the characteristic progression of the predicted activity score class (Figure 6B’).
3.2. Model Validation
To further investigate the prediction quality of our two-stage framework proposed in this work, we were interested in testing it on manually rated videos that have been randomly sampled from the pool of videos which have not been used for training
As can be seen in Table 1, our approach is in line with a large majority of the manual findings and is able to identify phases of different activity patterns. Of the 18 videos that were manually classified as low, 17 were classified correctly by our framework while one video was falsely classified as medium activity. In 33 cases, the human observer rated the behavior intensity as medium activity of which our classifier was able to identify 27 sequences correctly. For the misclassifications, one video was marked as low while the remaining five videos were marked as containing high activity patterns. For the high activity cases, 31 videos were manually categorized of which all were assigned correctly. In total, out of 82 cases 75 videos were classified correctly by our approach which corresponds to a success rate of 91%. The majority of the misclassifications belonged to the medium category, while our CNN classified them as high category. Here, applying Kendalls rank correlation coefficient on the results presented in Table 1 we achieved a -value of 0.91.
After assessing the performance of our framework by matching it with human visual classifications, we have further compared our model with a MHI-based approach and a binary image-based approach. Samples from the output of this comparison study for the UCSD data sets and our pig data set are depicted in Figure 7 and Figure 8, respectively.
Although all three approaches were able to detect varying types of anomalies based on regular movement patterns, a closer look at Figure 7 shows that the MHI approach as well as the binary image approach are likely to underestimate the MSE score in the presence of an anomaly due to slower object movements and therefore less intense pixel changes. In contrast, the CNN learns the characteristic movement patterns during training by simultaneously considering the objects velocity and the pure existence of an anomaly which leads to higher MSE values of the predicted frame. Moreover, the MHI approach and the binary image method tend to overestimate scenarios in which only regular pedestrian activities without the existence of an anomaly occur while the CNN computes a lower MSE score because it has learned the tendency of those patterns during training. In cases in which the observable behavior differs from the learned behavior of the CNN during training but no higher motion activity occurs (e.g., Figure 8 standing posture of pigs), the CNN outputs a higher MSE in contrast to the MHI or the binary image approach. Similarly, as can be seen in Figure 8, the effect of neglectable noise, e.g., insects, dirt or a chain inside the pen, leads to higher MSE values for the MHI and the binary image. The difference to the CNN can be explained by the training behavior of the CNN which included noisy training videos and enables the model to learn the effect of noise to some extend.
4. Discussion
In this study, by employing our two-stage approach we show the applicability of semi-supervised machine learning techniques for the automatic determination of the activity level of piglets. The findings of this study are of use to increase the applicability of video recordings of pigs without annotating the data and to improve the usage of the animal activity level in early warning system.
Previous studies successfully demonstrated the applicability of predictive CNNs for the unsupervised and semi-supervised detection of anomalous behavior patterns for human data sets. Chon et al. (2017) analyzed two scenarios focusing on surveillance videos of crowded scenes to identify anomalous objects and changes in motion behavior [51]. Further, Zhao et al. (2017) additionally evaluated a CNN on real-life traffic videos to automatically detect irregular traffic flow in form of traffic jams, irregular trajectories or different motion states of vehicles [60]. These two articles have motivated us to apply the methodology of anomaly detection in the field of livestock farming systems to address the potential of automated video evaluation algorithms. To date, the investigation of animal activity using video recordings is dominated by manual evaluation methods (see e.g., [61]) or supervised approaches by annotating the data in advance (see e.g., [16]).
By training the CNN on low activity videos and the usage of the prediction quality of future frames as an indicator for anomalous frames we were able to identify varying activity levels. The comparison study with a MHI-based approach showed that although MHI approaches are computationally less expensive, CNNs are more suitable to analyze the complex nature of crowded scene environments and captures anomalous events more reliably. Furthermore, the analysis of 82 manually rated videos supports the findings of the comparison study. While the majority of the manually rated sequences have been categorized correctly, seven sequences where mapped to a different behavioral category. Because our framework was not designed to map videos to a low category space, the differences between the manual ratings and the CNN results can be explained by the difficulty to find a suitable discriminant line that separates higher activity patterns in the low category space. Nevertheless, from a practical perspective modern camera technologies are used frequently nowadays to monitor pigs in modern housing systems. The large amount of data as well as influential factors like varying occupancy densities, different pen surroundings and the complex behavioral nature lead to a need for an efficient filtering method. Consequently, the validation results (Table 1) demonstrate the suitability of our framework to approximate the behavior intensity for heterogenous pen environments. Therefore, our framework would be able to assist the farmer to perform a pre-selection of unseen video files and detect suspicious scenes that contain intense interactions and anomalies.
Another fundamental step of our approach is the classification of the activity scores obtained from the CNN into an activity class. A closer look at similar scenarios from different pens revealed the limited comparability of analyzed sequences due to the varying lower bound of the activity scores and the open upper bound (see Figure 6A,B). Due to the effect of the inherent video noise, the minimum activity scores changed even when no motion activity took place. In the literature, multiple approaches have been suggested to address the issue of noisy images [62,63,64,65,66]. Inspired by Fernández-Carrión et al. [16], who applied a moving average filter on optical flow values to correct for the noisy video frames and then classified motion sequences into one of three classes, we trained a classification algorithm to classify new activity scores obtained from the CNN. Unlike Fernández-Carrión et al. [16], we implemented our classifier based on the activity scores of 288 30-min videos to learn the potential range of activity scores for each camera and to overcome the limitation of the varying boundaries (see Figure 6A’,B’).
While CNNs are successfully applied for the detection of anomalous events in video data of crowded scenes [67], a simple MHI or binary image approach is highly sensitive to even minor motion changes in videos, which leads to high numbers of false negatives due to the complex dynamics of the scene. Therefore, we implemented a predictive network to learn the distinctive activity patterns of pigs with the goal of computing a comparable activity score. For this purpose, we first trained a CNN on low activity videos to identify sequences of high activities. In a second step, we applied smoothing by using a threshold-based classification algorithm to correct for the bias introduced by the heterogenous environments of the pens. In order to demonstrate the functionality of our framework we analyzed multiple videos with and without activity classification. Our results show that we are able to detect varying types of anomalies in videos and to assign them to distinct activity classes. Further, we compared the performance of our model with a MHI-based approach and a binary image approach using two distinct data sets. This comparison shows that CNNs are more suitable for anomaly detection of complex activities in videos of pigs (see Figure 5). Therefore, our findings can be of use for the implementation of activity-based warning systems in a multi-pen environment. Here, by increasing the comparability between different camera recordings, heterogeneous surroundings and varying levels of pen utilization can be taken into account. Furthermore, our study contributes to the problem of insufficiently labeled training data. Earlier studies already demonstrated the possibility of a semi-supervised annotation method, in which CNN results have been used to create pseudo-labels and from which a supervised model can be trained (see e.g., [68]). By applying our semi-supervised approach to unlabeled video sequences, artificial annotations in the form of activity score classes can be computed, which allow a more efficient filtering and selection of video sequences of interest.
5. Conclusions
In this study, we applied a two stage approach to evaluate specific motion patterns in surveillance videos of pigs. Therefore, we combined the methodical framework of anomaly detection with a threshold-based classifier that learned the potential range of activity patterns. Our findings show that the activity intensity from an automatic analysis at the pen level is a sufficient indicator for low and high activity behaviors and that specific behaviors can be mapped to an activity score class range. To the best of our knowledge, this is the first study in the field of livestock farming, which applies a semi-supervised model without the need for annotated data sets to gain deeper insight into the underlying behavior patterns of pigs. Our results could be of use for future research analyzing behavior activities like agonistic interactions that occur with high activity intensities. Furthermore, our framework can be utilized to detect activity shifts in daily routines of the animals and deviations from the normal behavior which can serve as an indicator for changes in the state of health and could provide implicit hints for a more in-depth study of agonistic behaviors.
Author Contributions
M.G. designed and supervised the research. I.T. and A.O.S. supervised the research together with M.G., M.W. participated in the design of the study and conducted computational analyses together with M.G. and performed the literature survey. A.O.S. and I.T. interpreted the results with M.W. and M.G., M.W. and M.G. wrote the final version of the manuscript. M.G. conceived and managed the project. All authors have read and agreed to the published version of the manuscript.
Funding
This work was financially supported by the German Federal Ministry of Food, Agriculture and Consumer Protection (BMEL) through the Federal Agency for Agriculture and Nutrition (BLE), grant number 2817902315.
Acknowledgments
We acknowledge the support by the German Research Foundation and the Open Access Publication Funds of the Göttingen University.
Conflicts of Interest
The authors declare no conflict of interest. The funders had no role in the design of the study; in the collection, analyses, or interpretation of data; in the writing of the manuscript, or in the decision to publish the results.
Abbreviations
The following abbreviations are used in this manuscript:
| CNN | Convolutional Neural Network |
| FPS | Frames per Second |
| MHI | Motion History Image |
| MSE | Mean Squared Error |
References
- McGlone, J.J. A quantitative ethogram of aggressive and submissive behaviors in recently regrouped pigs. J. Anim. Sci. 1985, 61, 556–566. [Google Scholar] [CrossRef]
- Cross, A.J.; Rohrer, G.A.; Brown-Brandl, T.M.; Cassady, J.P.; Keel, B.N. Feed-forward and generalised regression neural networks in modelling feeding behaviour of pigs in the grow-finish phase. Biosyst. Eng. 2018, 173, 124–133. [Google Scholar] [CrossRef]
- Matthews, S.G.; Miller, A.L.; PlÖtz, T.; Kyriazakis, I. Automated tracking to measure behavioural changes in pigs for health and welfare monitoring. Sci. Rep. 2017, 7, 17582. [Google Scholar] [CrossRef] [PubMed]
- Zonderland, J.; Schepers, F.; Bracke, M.; Den Hartog, L.; Kemp, B.; Spoolder, H. Characteristics of biter and victim piglets apparent before a tail-biting outbreak. Animal 2011, 5, 767–775. [Google Scholar] [CrossRef] [PubMed] [Green Version]
- Bracke, M.B.; Hulsegge, B.; Keeling, L.; Blokhuis, H.J. Decision support system with semantic model to assess the risk of tail biting in pigs: 1. Modelling. Appl. Anim. Behav. Sci. 2004, 87, 31–44. [Google Scholar] [CrossRef]
- Moinard, C.; Mendl, M.; Nicol, C.; Green, L. A case control study of on-farm risk factors for tail biting in pigs. Appl. Anim. Behav. Sci. 2003, 81, 333–355. [Google Scholar] [CrossRef]
- Van Putten, G. An investigation into tail-biting among fattening pigs. Br. Vet. J. 1969, 125, 511–517. [Google Scholar] [CrossRef]
- Ewbank, R. Abnormal behaviour and pig nutrition. An unsuccessful attempt to induce tail biting by feeding a high energy, low fibre vegetable protein ration. Br. Vet. J. 1973, 129, 366–369. [Google Scholar] [CrossRef]
- Wedin, M.; Baxter, E.M.; Jack, M.; Futro, A.; D’Eath, R.B. Early indicators of tail biting outbreaks in pigs. Appl. Anim. Behav. Sci. 2018, 208, 7–13. [Google Scholar] [CrossRef]
- D’Eath, R.B.; Jack, M.; Futro, A.; Talbot, D.; Zhu, Q.; Barclay, D.; Baxter, E.M. Automatic early warning of tail biting in pigs: 3D cameras can detect lowered tail posture before an outbreak. PLoS ONE 2018, 13, e0194524. [Google Scholar] [CrossRef] [Green Version]
- Matthews, S.G.; Miller, A.L.; Clapp, J.; Plötz, T.; Kyriazakis, I. Early detection of health and welfare compromises through automated detection of behavioural changes in pigs. Vet. J. 2016, 217, 43–51. [Google Scholar] [CrossRef] [PubMed] [Green Version]
- Schrøder-Petersen, D.L.; Simonsen, H. Tail biting in pigs. Vet. J. 2001, 162, 196–210. [Google Scholar] [CrossRef] [PubMed]
- Brunberg, E.; Wallenbeck, A.; Keeling, L.J. Tail biting in fattening pigs: Associations between frequency of tail biting and other abnormal behaviours. Appl. Anim. Behav. Sci. 2011, 133, 18–25. [Google Scholar] [CrossRef]
- Statham, P.; Green, L.; Bichard, M.; Mendl, M. Predicting tail-biting from behaviour of pigs prior to outbreaks. Appl. Anim. Behav. Sci. 2009, 121, 157–164. [Google Scholar] [CrossRef] [Green Version]
- Larsen, M.L.V.; Andersen, H.M.L.; Pedersen, L.J. Can tail damage outbreaks in the pig be predicted by behavioural change? Vet. J. 2016, 209, 50–56. [Google Scholar] [CrossRef]
- Fernández-Carrión, E.; Martínez-Avilés, M.; Ivorra, B.; Martínez-López, B.; Ramos, Á.M.; Sánchez-Vizcaíno, J.M. Motion-based video monitoring for early detection of livestock diseases: The case of African swine fever. PLoS ONE 2017, 12, e0183793. [Google Scholar] [CrossRef] [PubMed] [Green Version]
- Nasirahmadi, A.; Hensel, O.; Edwards, S.; Sturm, B. A new approach for categorizing pig lying behaviour based on a Delaunay triangulation method. Animal 2017, 11, 131–139. [Google Scholar] [CrossRef] [Green Version]
- Angarita, B.K.; Cantet, R.J.; Wurtz, K.E.; O’Malley, C.I.; Siegford, J.M.; Ernst, C.W.; Turner, S.P.; Steibel, J.P. Estimation of indirect social genetic effects for skin lesion count in group-housed pigs by quantifying behavioral interactions. J. Anim. Sci. 2019, 97, 3658–3668. [Google Scholar] [CrossRef]
- Büttner, K.; Czycholl, I.; Mees, K.; Krieter, J. Temporal development of agonistic interactions as well as dominance indices and centrality parameters in pigs after mixing. Appl. Anim. Behav. Sci. 2020, 222, 104913. [Google Scholar] [CrossRef]
- Büttner, K.; Czycholl, I.; Mees, K.; Krieter, J. Social network analysis in pigs: Impacts of significant dyads on general network and centrality parameters. Animal 2020, 14, 368–378. [Google Scholar] [CrossRef] [Green Version]
- Veit, C.; Traulsen, I.; Hasler, M.; Tölle, K.H.; Burfeind, O.; Grosse Beilage, E.; Krieter, J. Influence of raw material on the occurrence of tail-biting in undocked pigs. Livest. Sci. 2016, 191, 125–131. [Google Scholar] [CrossRef]
- Seo, J.; Ahn, H.; Kim, D.; Lee, S.; Chung, Y.; Park, D. EmbeddedPigDet—Fast and Accurate Pig Detection for Embedded Board Implementations. Appl. Sci. 2020, 10, 2878. [Google Scholar] [CrossRef]
- Psota, E.T.; Mittek, M.; Pérez, L.C.; Schmidt, T.; Mote, B. Multi-pig part detection and association with a fully-convolutional network. Sensors 2019, 19, 852. [Google Scholar] [CrossRef] [PubMed] [Green Version]
- Nasirahmadi, A.; Sturm, B.; Edwards, S.; Jeppsson, K.H.; Olsson, A.C.; Müller, S.; Hensel, O. Deep Learning and Machine Vision Approaches for Posture Detection of Individual Pigs. Sensors 2019, 19, 3738. [Google Scholar] [CrossRef] [PubMed] [Green Version]
- Li, D.; Zhang, K.; Li, Z.; Chen, Y. A Spatiotemporal Convolutional Network for Multi-Behavior Recognition of Pigs. Sensors 2020, 20, 2381. [Google Scholar] [CrossRef] [Green Version]
- Zhang, K.; Li, D.; Huang, J.; Chen, Y. Automated Video Behavior Recognition of Pigs Using Two-Stream Convolutional Networks. Sensors 2020, 20, 1085. [Google Scholar] [CrossRef] [Green Version]
- Khetan, A.; Lipton, Z.C.; Anandkumar, A. Learning from noisy singly-labeled data. arXiv 2017, arXiv:1712.04577. [Google Scholar]
- Bengio, Y.; Courville, A.C.; Vincent, P. Unsupervised feature learning and deep learning: A review and new perspectives. CoRR 2012, 1, 2012. [Google Scholar]
- Bobick, A.F.; Davis, J.W. The recognition of human movement using temporal templates. IEEE Trans. Pattern Anal. Mach. Intell. 2001, 23, 257–267. [Google Scholar] [CrossRef] [Green Version]
- Ahad, M.A.R.; Ogata, T.; Tan, J.; Kim, H.; Ishikawa, S. Comparative analysis between two view-based methods: MHI and DMHI. In Proceedings of the 2007 10th International Conference on Computer and Information Technology, Roukela, India, 27–29 December 2007; IEEE: Piscataway, NJ, USA, 2007; pp. 1–6. [Google Scholar]
- Alp, E.C.; Keles, H.Y. A comparative study of HMMs and LSTMs on action classification with limited training data. In Proceedings of the SAI Intelligent Systems Conference, London, UK, 6–7 September 2018; Springer: Cham, Switzerland, 2018; pp. 1102–1115. [Google Scholar]
- Thummala, J.; Pumrin, S. Fall Detection using Motion History Image and Shape Deformation. In Proceedings of the 2020 8th International Electrical Engineering Congress (iEECON), Chiang Mai, Thailand, 4–6 March 2020; IEEE: Piscataway, NJ, USA, 2020; pp. 1–4. [Google Scholar]
- Pampouchidou, A.; Pediaditis, M.; Maridaki, A.; Awais, M.; Vazakopoulou, C.M.; Sfakianakis, S.; Tsiknakis, M.; Simos, P.; Marias, K.; Yang, F.; et al. Quantitative comparison of motion history image variants for video-based depression assessment. EURASIP J. Image Video Process. 2017, 2017, 64. [Google Scholar] [CrossRef] [Green Version]
- Ahad, M.A.R.; Tan, J.K.; Kim, H.; Ishikawa, S. Motion history image: Its variants and applications. Mach. Vis. Appl. 2012, 23, 255–281. [Google Scholar] [CrossRef]
- Ott, S.; Moons, C.; Kashiha, M.A.; Bahr, C.; Tuyttens, F.; Berckmans, D.; Niewold, T.A. Automated video analysis of pig activity at pen level highly correlates to human observations of behavioural activities. Livest. Sci. 2014, 160, 132–137. [Google Scholar] [CrossRef]
- Tsai, D.M.; Huang, C.Y. A motion and image analysis method for automatic detection of estrus and mating behavior in cattle. Comput. Electron. Agric. 2014, 104, 25–31. [Google Scholar] [CrossRef]
- Su, K.; Liu, X.; Shlizerman, E. Predict & cluster: Unsupervised skeleton based action recognition. In Proceedings of the IEEE/CVF Conference on Computer Vision and Pattern Recognition, Seattle, WA, USA, 13–19 June 2020; pp. 9631–9640. [Google Scholar]
- Cui, J.; Gong, K.; Guo, N.; Wu, C.; Meng, X.; Kim, K.; Zheng, K.; Wu, Z.; Fu, L.; Xu, B.; et al. PET image denoising using unsupervised deep learning. Eur. J. Nucl. Med. Mol. Imaging 2019, 46, 2780–2789. [Google Scholar] [CrossRef]
- Xu, J.; Huang, Y.; Liu, L.; Zhu, F.; Hou, X.; Shao, L. Noisy-As-Clean: Learning unsupervised denoising from the corrupted image. arXiv 2019, arXiv:1906.06878. [Google Scholar]
- Kiran, B.; Thomas, D.; Parakkal, R. An overview of deep learning based methods for unsupervised and semi-supervised anomaly detection in videos. J. Imaging 2018, 4, 36. [Google Scholar] [CrossRef] [Green Version]
- Al-Ajlan, A.; El Allali, A. CNN-MGP: Convolutional neural networks for metagenomics gene prediction. Interdiscip. Sci. Comput. Life Sci. 2019, 11, 628–635. [Google Scholar] [CrossRef] [Green Version]
- An, J.; Cho, S. Variational autoencoder based anomaly detection using reconstruction probability. Spec. Lect. IE 2015, 2, 1–18. [Google Scholar]
- Khalid, S. Activity classification and anomaly detection using m-mediods based modelling of motion patterns. Pattern Recognit. 2010, 43, 3636–3647. [Google Scholar] [CrossRef]
- Chandola, V.; Banerjee, A.; Kumar, V. Anomaly detection: A survey. ACM Comput. Surv. (CSUR) 2009, 41, 15. [Google Scholar] [CrossRef]
- Finn, C.; Goodfellow, I.; Levine, S. Unsupervised learning for physical interaction through video prediction. In Proceedings of the Annual Conference on Neural Information Processing Systems 2016, Barcelona, Spain, 5–10 December 2016; pp. 64–72. [Google Scholar]
- Srivastava, N.; Mansimov, E.; Salakhudinov, R. Unsupervised learning of video representations using lstms. In Proceedings of the International Conference on Machine Learning, Lille, France, 6–11 July 2015; pp. 843–852. [Google Scholar]
- Denton, E.L. Unsupervised learning of disentangled representations from video. In Proceedings of the Annual Conference on Neural Information Processing Systems 2017, Long Beach, CA, USA, 4–9 December 2017; pp. 4414–4423. [Google Scholar]
- Lotter, W.; Kreiman, G.; Cox, D. Deep predictive coding networks for video prediction and unsupervised learning. arXiv 2016, arXiv:1605.08104. [Google Scholar]
- Wang, X.; Gupta, A. Unsupervised learning of visual representations using videos. In Proceedings of the IEEE International Conference on Computer Vision, Santiago, Chile, 11–18 December 2015; pp. 2794–2802. [Google Scholar]
- Medel, J.R.; Savakis, A. Anomaly detection in video using predictive convolutional long short-term memory networks. arXiv 2016, arXiv:1612.00390. [Google Scholar]
- Chong, Y.S.; Tay, Y.H. Abnormal event detection in videos using spatiotemporal autoencoder. In Proceedings of the International Symposium on Neural Networks, Hokkaido, Japan, 16–21 June 2017; Springer: Berlin/Heidelberg, Germany, 2017; pp. 189–196. [Google Scholar]
- Rao, Y.; Ni, J. A deep learning approach to detection of splicing and copy-move forgeries in images. In Proceedings of the 2016 IEEE International Workshop on Information Forensics and Security (WIFS), Abu Dhabi, UAE, 4–7 December 2016; IEEE: Piscataway, NJ, USA, 2016; pp. 1–6. [Google Scholar]
- Chollet, F. Keras. 2015. Available online: https://keras.io (accessed on 22 October 2020).
- Abadi, M.; Agarwal, A.; Barham, P.; Brevdo, E.; Chen, Z.; Citro, C.; Corrado, G.S.; Davis, A.; Dean, J.; Devin, M.; et al. TensorFlow: Large-Scale Machine Learning on Heterogeneous Systems. 2015. Available online: tensorflow.org (accessed on 22 October 2020).
- Zeiler, M.D. Adadelta: An adaptive learning rate method. arXiv 2012, arXiv:1212.5701. [Google Scholar]
- Kashiha, M.A.; Bahr, C.; Ott, S.; Moons, C.P.; Niewold, T.A.; Tuyttens, F.; Berckmans, D. Automatic monitoring of pig locomotion using image analysis. Livest. Sci. 2014, 159, 141–148. [Google Scholar] [CrossRef]
- Kendall, M.G. A new measure of rank correlation. Biometrika 1938, 30, 81–93. [Google Scholar] [CrossRef]
- Chan, A.; Vasconcelos, N. Ucsd pedestrian dataset. IEEE Trans. Pattern Anal. Mach. Intell. (TPAMI) 2008, 30, 909–926. [Google Scholar] [CrossRef] [Green Version]
- Chan, A.B.; Vasconcelos, N. Modeling, clustering, and segmenting video with mixtures of dynamic textures. IEEE Trans. Pattern Anal. Mach. Intell. 2008, 30, 909–926. [Google Scholar] [CrossRef] [Green Version]
- Zhao, Y.; Deng, B.; Shen, C.; Liu, Y.; Lu, H.; Hua, X.S. Spatio-temporal autoencoder for video anomaly detection. In Proceedings of the 25th ACM International Conference on Multimedia, Mountain View, CA, USA, 23–27 October 2017; pp. 1933–1941. [Google Scholar]
- Ursinus, W.W.; Van Reenen, C.G.; Kemp, B.; Bolhuis, J.E. Tail biting behaviour and tail damage in pigs and the relationship with general behaviour: Predicting the inevitable? Appl. Anim. Behav. Sci. 2014, 156, 22–36. [Google Scholar] [CrossRef]
- Arias, P.; Morel, J.M. Video denoising via empirical Bayesian estimation of space-time patches. J. Math. Imaging Vis. 2018, 60, 70–93. [Google Scholar] [CrossRef]
- Buades, A.; Lisani, J.L.; Miladinović, M. Patch-based video denoising with optical flow estimation. IEEE Trans. Image Process. 2016, 25, 2573–2586. [Google Scholar] [CrossRef]
- Chen, X.; Song, L.; Yang, X. Deep rnns for video denoising. In Proceedings of the Applications of Digital Image Processing XXXIX—International Society for Optics and Photonics, San Diego, CA, USA, 28 August–1 September 2016; Volume 9971, p. 99711T. [Google Scholar]
- Rahman, S.M.; Ahmad, M.O.; Swamy, M. Video denoising based on inter-frame statistical modeling of wavelet coefficients. IEEE Trans. Circuits Syst. Video Technol. 2007, 17, 187–198. [Google Scholar] [CrossRef]
- Ali, R.A.; Hardie, R.C. Recursive non-local means filter for video denoising. EURASIP J. Image Video Process. 2017, 2017, 29. [Google Scholar] [CrossRef] [Green Version]
- Singh, K.; Rajora, S.; Vishwakarma, D.K.; Tripathi, G.; Kumar, S.; Walia, G.S. Crowd anomaly detection using aggregation of ensembles of fine-tuned ConvNets. Neurocomputing 2020, 371, 188–198. [Google Scholar] [CrossRef]
- Iscen, A.; Tolias, G.; Avrithis, Y.; Chum, O. Label propagation for deep semi-supervised learning. In Proceedings of the IEEE Conference on Computer Vision and Pattern Recognition, Long Beach, CA, USA, 16–20 June 2019; pp. 5070–5079. [Google Scholar]
Figure 1.
Flowchart of the analysis applied in this study.

Figure 2.
The data set consists of video recordings from six cameras and ten pens of pigs, with camera 1 (C1) and camera 6 (C6) recording a single box with six and seven piglets, respectively, and the remaining cameras (C2–C5) recorded two pens with seven piglets each. The left side shows the camera arrangement within the pig compartment.

Figure 3.
The proposed method uses an hourglass-shaped network to first encode the sequence of input frames to a latent representation of reduced dimension and to predict the next frame. The prediction is then decoded to the input dimension by the spatial decoder and compared to the ground truth images. For each layer, the current dimension of the input frame is indicated by the number in front of the layer name.

Figure 4.
Sample from the UCSD 1 (left) and the UCSD 2 (right) data set. The red rectangle highlights an anomaly in the form of a small vehicle and a cyclist, respectively.
Figure 4.
Sample from the UCSD 1 (left) and the UCSD 2 (right) data set. The red rectangle highlights an anomaly in the form of a small vehicle and a cyclist, respectively.

Figure 5.
Progression of the predicted activity score classes for a randomly selected nine-minute video. The images on the right side correspond to the highlighted score classes marked with their frame color. Green frame: very low activity score classes correspond to situations like resting behavior in which no movement activities occur. Orange frame: an increase in the score classes correspond to an activity increase of individual animals, e.g., a single animal walking (*) or two animals changing their body posture (**). Red frame: the occurrence of high score classes are in line with strong behavior activities caused e.g., by the simultaneous interaction of several pigs.

Figure 6.
Comparison of unclassified activity scores (A,B) and their assignment into activity score classes (A’,B’) for videos of lower (A) and higher (B) activity intensities. The 90-second sequences are centered around the minimum activity score value for the sequences in (A) and maximum activity score value for the sequences in (B) indicated by the vertical red line.

Figure 7.
Detection of anomalous events (red area) for four example videos from the UCSD 1 (#1, #2 and #3) and UCSD 2 (#4) pedestrian data set.
Figure 7.
Detection of anomalous events (red area) for four example videos from the UCSD 1 (#1, #2 and #3) and UCSD 2 (#4) pedestrian data set.

Figure 8.
Detection of varying activity levels for six ten-second videos from the pig data set. The first rows shows two figures in which the pigs showed a standing posture. The second row shows two example figures of neglectable noise. The third row shows the detection of regular movement patterns.


Table 1.
Confusion matrix for the comparison between our method and manually evaluated videos. The entries on the main diagonal indicate the number of correctly classified sequences, whereas the entries above and below the main diagonal indicate predictions that deviate from the manual rating.
Table 1.
Confusion matrix for the comparison between our method and manually evaluated videos. The entries on the main diagonal indicate the number of correctly classified sequences, whereas the entries above and below the main diagonal indicate predictions that deviate from the manual rating.
| Manual Rating | Low Activity (n = 18) | Medium Activity (n = 33) | High Activity (n = 31) | |
|---|---|---|---|---|
| CNN Prediction | ||||
| Low activity | 17 | 1 | 0 | |
| Medium activity | 1 | 27 | 0 | |
| High activity | 0 | 5 | 31 | |
Publisher’s Note: MDPI stays neutral with regard to jurisdictional claims in published maps and institutional affiliations. |
© 2020 by the authors. Licensee MDPI, Basel, Switzerland. This article is an open access article distributed under the terms and conditions of the Creative Commons Attribution (CC BY) license (http://creativecommons.org/licenses/by/4.0/).
Share and Cite
MDPI and ACS Style
Wutke, M.; Schmitt, A.O.; Traulsen, I.; Gültas, M. Investigation of Pig Activity Based on Video Data and Semi-Supervised Neural Networks. AgriEngineering 2020, 2, 581-595. https://0-doi-org.brum.beds.ac.uk/10.3390/agriengineering2040039
AMA Style
Wutke M, Schmitt AO, Traulsen I, Gültas M. Investigation of Pig Activity Based on Video Data and Semi-Supervised Neural Networks. AgriEngineering. 2020; 2(4):581-595. https://0-doi-org.brum.beds.ac.uk/10.3390/agriengineering2040039
Chicago/Turabian StyleWutke, Martin, Armin Otto Schmitt, Imke Traulsen, and Mehmet Gültas. 2020. "Investigation of Pig Activity Based on Video Data and Semi-Supervised Neural Networks" AgriEngineering 2, no. 4: 581-595. https://0-doi-org.brum.beds.ac.uk/10.3390/agriengineering2040039