Article

Simulation and Evaluation of Heat Transfer Inside a Diseased Citrus Tree during Heat Treatment

by
Shirin Ghatrehsamani
1,2,*,
Yiannis Ampatzidis
2,3,
John K. Schueller
4 and
Reza Ehsani
5
1
Agriculture Systems and Natural Resources, University of Missouri-Extension, Columbia, MO 65211, USA
2
Department of Agricultural and Biological Engineering, University of Florida, Gainesville, FL 32611, USA
3
Southwest Florida Research and Education Center, University of Florida, Immokalee, FL 34142, USA
4
Department of Mechanical and Aerospace Engineering, University of Florida, Gainesville, FL 32611, USA
5
Department of Mechanical Engineering, University of California, Merced, CA 95343, USA
*
Author to whom correspondence should be addressed.
Submission received: 4 December 2020 / Revised: 6 January 2021 / Accepted: 8 January 2021 / Published: 13 January 2021
(This article belongs to the Special Issue Evaluation of New Technological Solutions in Agriculture)

Abstract

:
Heat treatment has been applied in previous studies to treat diseased plants and trees affected by heat-sensitive pathogens. Huanglongbing (HLB) is a heat-sensitive pathogen and the optimal temperature–time for treating HLB-affected citrus trees was estimated to be 54 °C for 60 to 120 s from indoor experimental studies. However, utilizing this method in orchards is difficult due to technical difficulties to effectively apply heat. Recently, a mobile thermotherapy system (MTS) was developed to in-field treat HLB-affected trees. This mobile device includes a canopy cover that covers the diseased tree and a system to supply steam under the cover to treat the tree. It was proven that the temperature inside the canopy cover can reach the desired one (i.e., 54 °C) to kill bacteria. However, for HLB, the heat should penetrate the tree’s phloem where the bacteria live. Therefore, measuring the heat penetration inside the tree is very critical to evaluate the performance of the MTS. In this study, a heat transfer model was developed to simulate the heat penetration inside the tree and predict the temperature in the phloem of the diseased tree during the in-field heat treatment. The simulation results were compared with in-field experimental measurements. The heat transfer model was developed by a comparative analysis of the experimental data using the ANSYS software. Results showed that the temperature in the phloem was 10–40% lower than the temperature near the surface of the bark. Simulation results were consistent with experimental results, with an average relative error of less than 5%.

1. Introduction

Chemical, biological, or physical treatments may be used to treat pests and plant diseases. Heat treatment is a type of physical treatment [1]. Heat can be used to treat some diseased plants by an optimal combination of time–temperature treatment [2]. When dealing with propagation materials or other perishable plant parts, thermotherapy can show a range of effectiveness depending on the pathogen, the method of delivery, and the part of the plant being treated [3]. The citrus industry has been devastated by a disease originally named citrus greening but now referred to as Huanglongbing (HLB) disease. It is caused by Candidatus Liberibacter asiaticus (CLas), which is a phloem-limited and fastidious bacterium [4]. Evidence that thermotherapy can control Huanglongbing was first documented in China, where phenotypic symptoms of HLB were eliminated in budwood and seedlings after the material was exposed to moist, hot air of 49–50 °C for 50–60 min [5,6]. HLB-affected citrus trees treated with heat displayed significantly improved vigorous growth [3]. Drastic decreases in survivability were observed under various conditions of elevated temperature–time combinations of treatment and after analyzing the results, the optimal temperature–time combination was found for trees being heat-treated between one and four times at 54 °C for 90 s [7].
However, research has not focused on the heat distribution inside the diseased tree and under the bark (where most of the bacteria live) during the heat treatment process [8]. Heat treatment has long been applied to the harvested wood of many tree species. The main reason for applying heat is to kill pests that might exist inside the tree stump, as well as reducing moisture content and improving dimensional stability [9]. It has been shown that the fungal resistance of the heat-treated wood increases significantly [10] and the mechanical strength decreases [11]. Recent efforts on the thermotherapy of wood resulted in the development of various treatment processes [12,13,14]. The time and temperature combination of the heat treatments varies depending upon the sample size, species, the desired mechanical properties, the moisture content of the sample, dimensional stability of the final product, and resistance to biological attack [15,16]. Various temperatures were investigated to evaluate the possibility of utilizing heat therapy to eradicate bacterial infections in potted plants that can be maintained as disease-free plants for years [17], in addition to other factors: time, virus type level of infection, plant ages and species, as well as the virus–host combination [18,19,20]. It has been proven that heat treatment can be used effectively to remove several pathogenic organisms if the pathogen area temperature reaches the desired temperature to kill the pathogen [21]. The benefits of uniform distribution of airflow in a crop production system have been illustrated in different studies [22,23].
Because the HLB bacteria live inside the tree, knowledge is needed of how heat distributes inside a live tree and what factors influence the efficiency of heat distribution [8]. Previous researchers have solved the 3D equations for both coupled heat and mass conservation equations for heartwood, which has made the study of transient heat and mass transfer during the high thermotherapy of wood easier [24], but there have not been any simulations to evaluate the heat and mass conservation in the live tree. The work reported here develops a computational model to simulate the heat transfer inside the tree to predict the temperature in the phloem where the HLB bacteria live. The model was validated by in-field experiments and was used to evaluate the performance of a mobile thermotherapy system.

2. Materials and Methods

A mobile thermotherapy system (MTS) for treating HLB-affected trees was developed and utilized in the Southwest Research and Education Center of the University of Florida [4]. The performance of the MTS has been evaluated in citrus orchards using thermocouples and by measuring the survival ratio of surrogate bacteria [4,8]. The MTS covers the targeted tree with a retractable canopy cover and steam generated by a steamer (Sioux Corporation, Model #SF-11-3800 Beresford, SD, USA) is injected to the canopy cover. The schematic diagram of the MTS is shown in Figure 1. Eight nozzles for injecting steam were positioned to control the fluid flow direction and velocity, thereby evenly distributing the heat inside the canopy cover. The steam nozzles on the closed cover are near the soil surface as the steam flows upward. Steam injection was stopped when the temperature inside the canopy cover reached the targeted temperature of 54 °C, and the canopy cover stayed closed for another 90 s to complete the treatment process (Figure 2). This optimal combination of temperature–time as 54 °C for 90 s was found by Czarnecka et al. (2018) for treating the bacterial pathogen L. asiaticus which causes citrus greening [7].

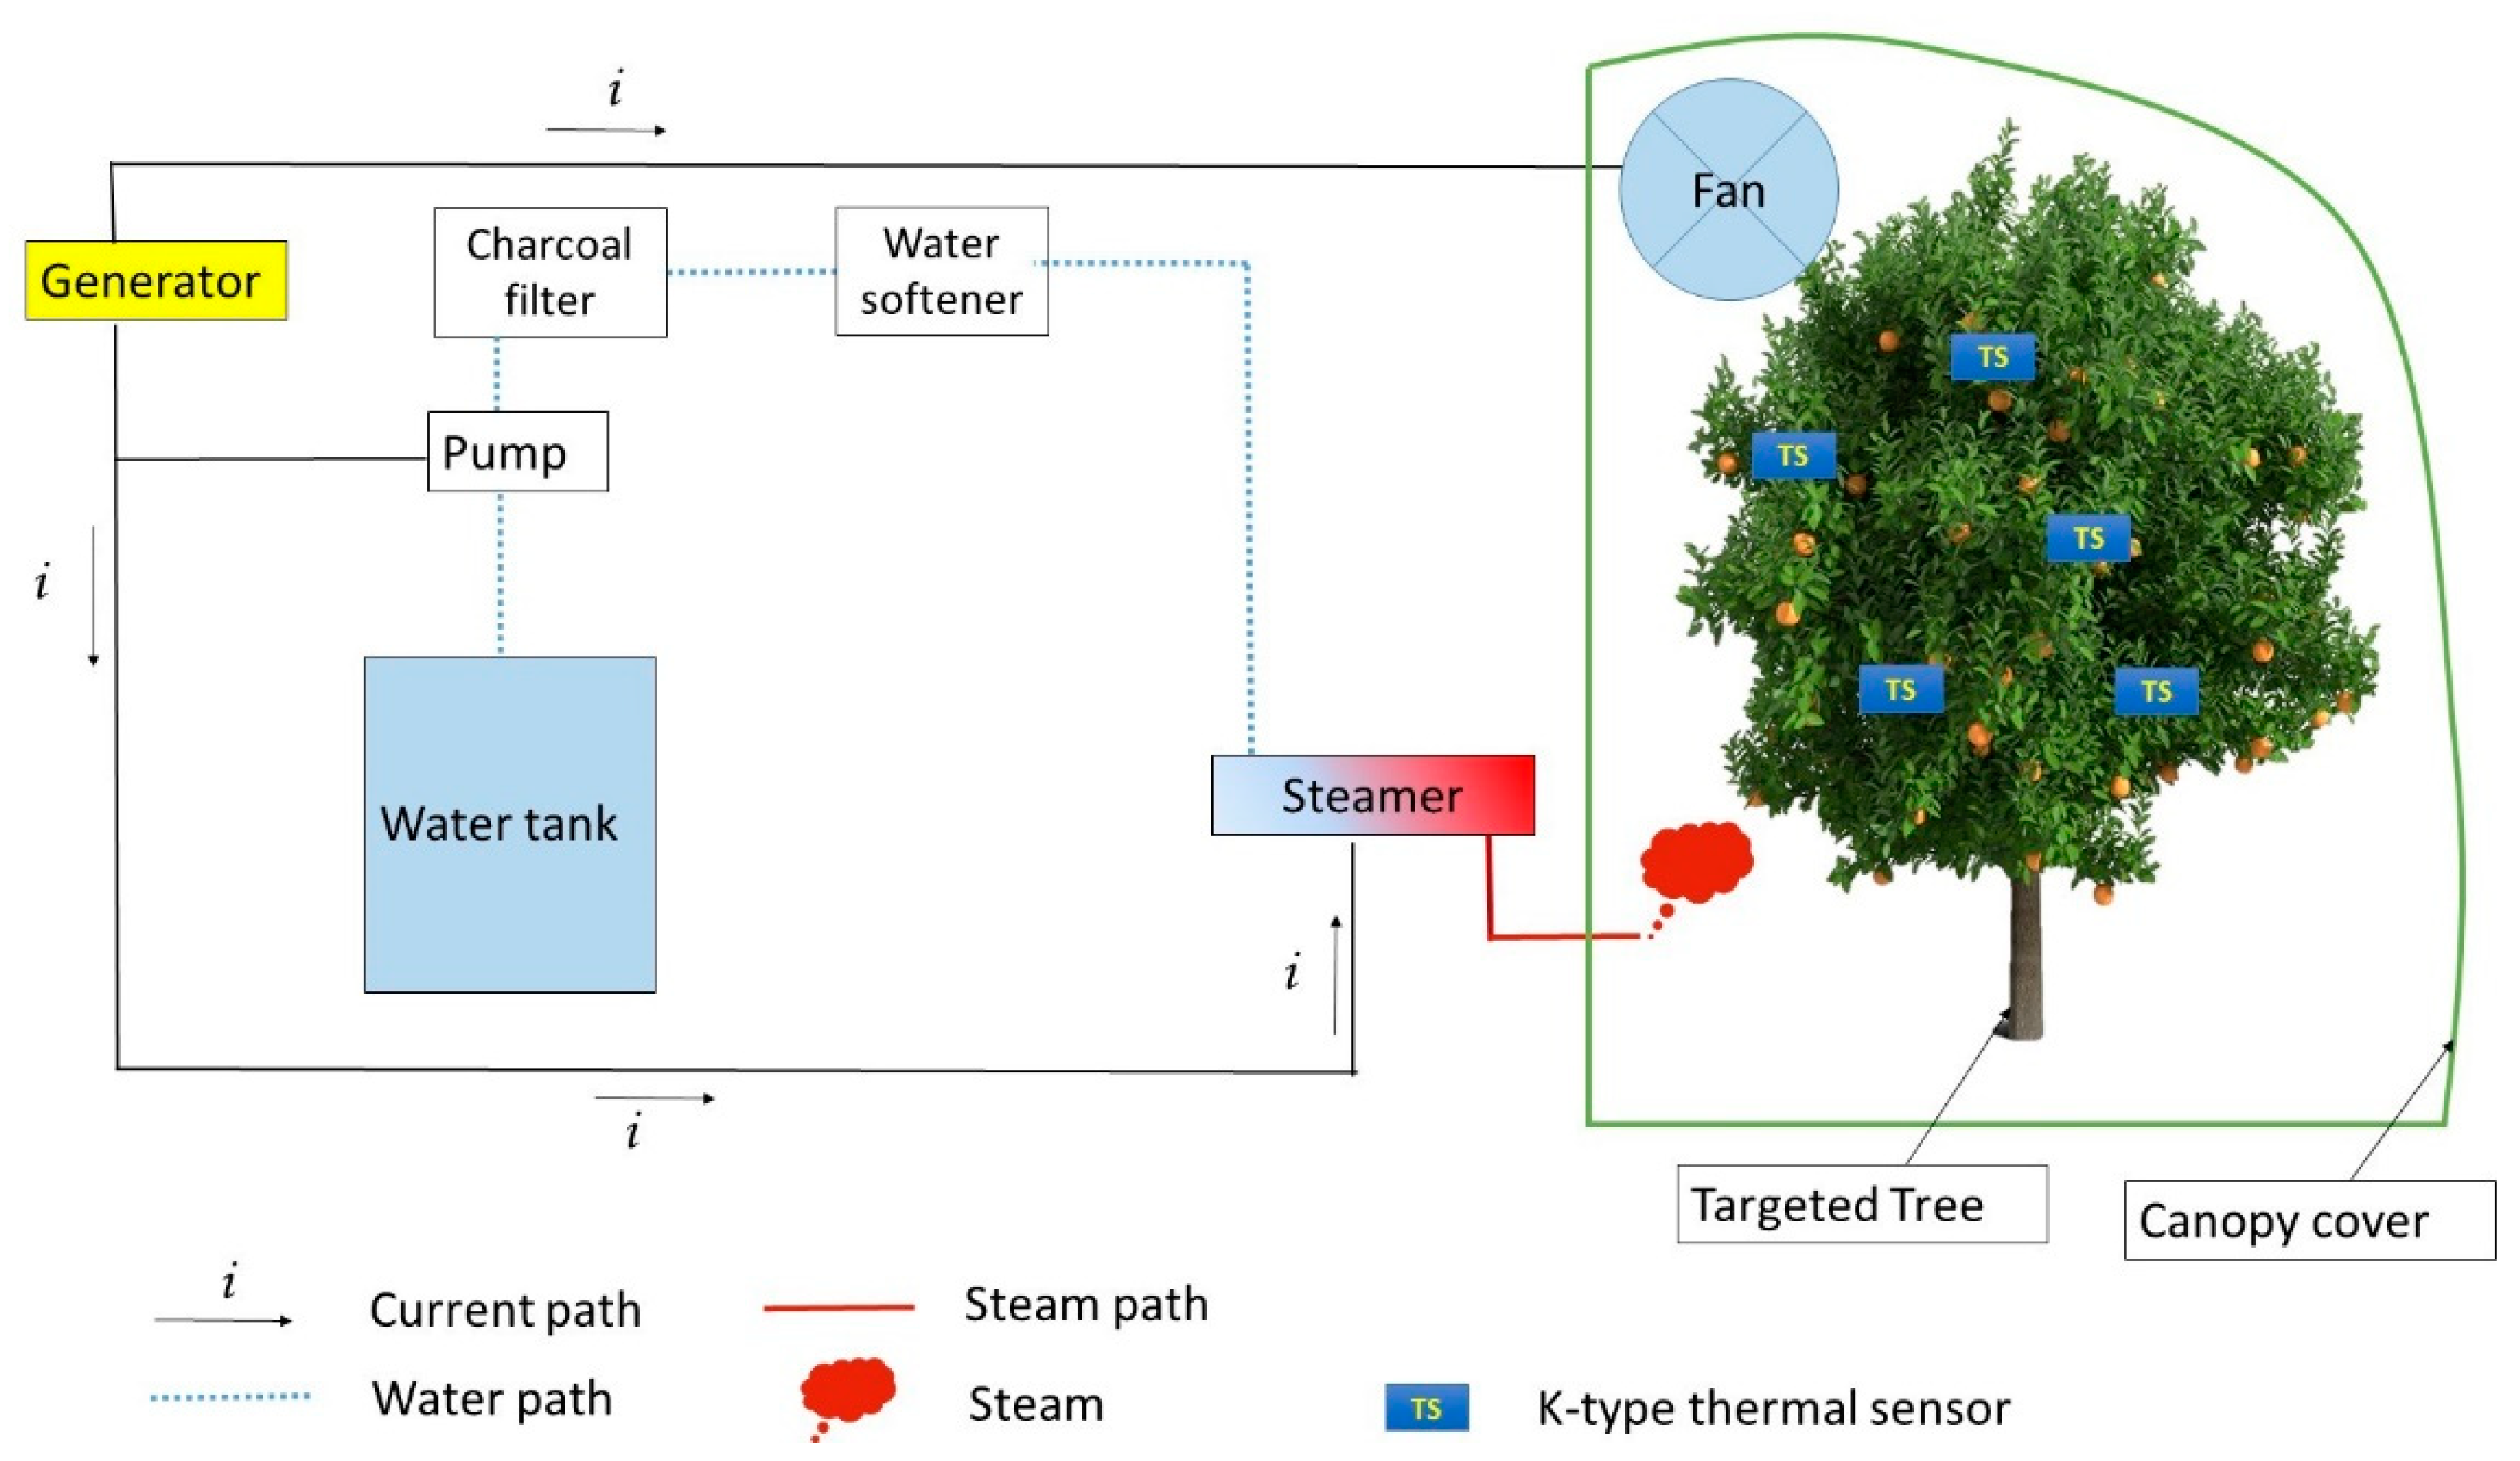
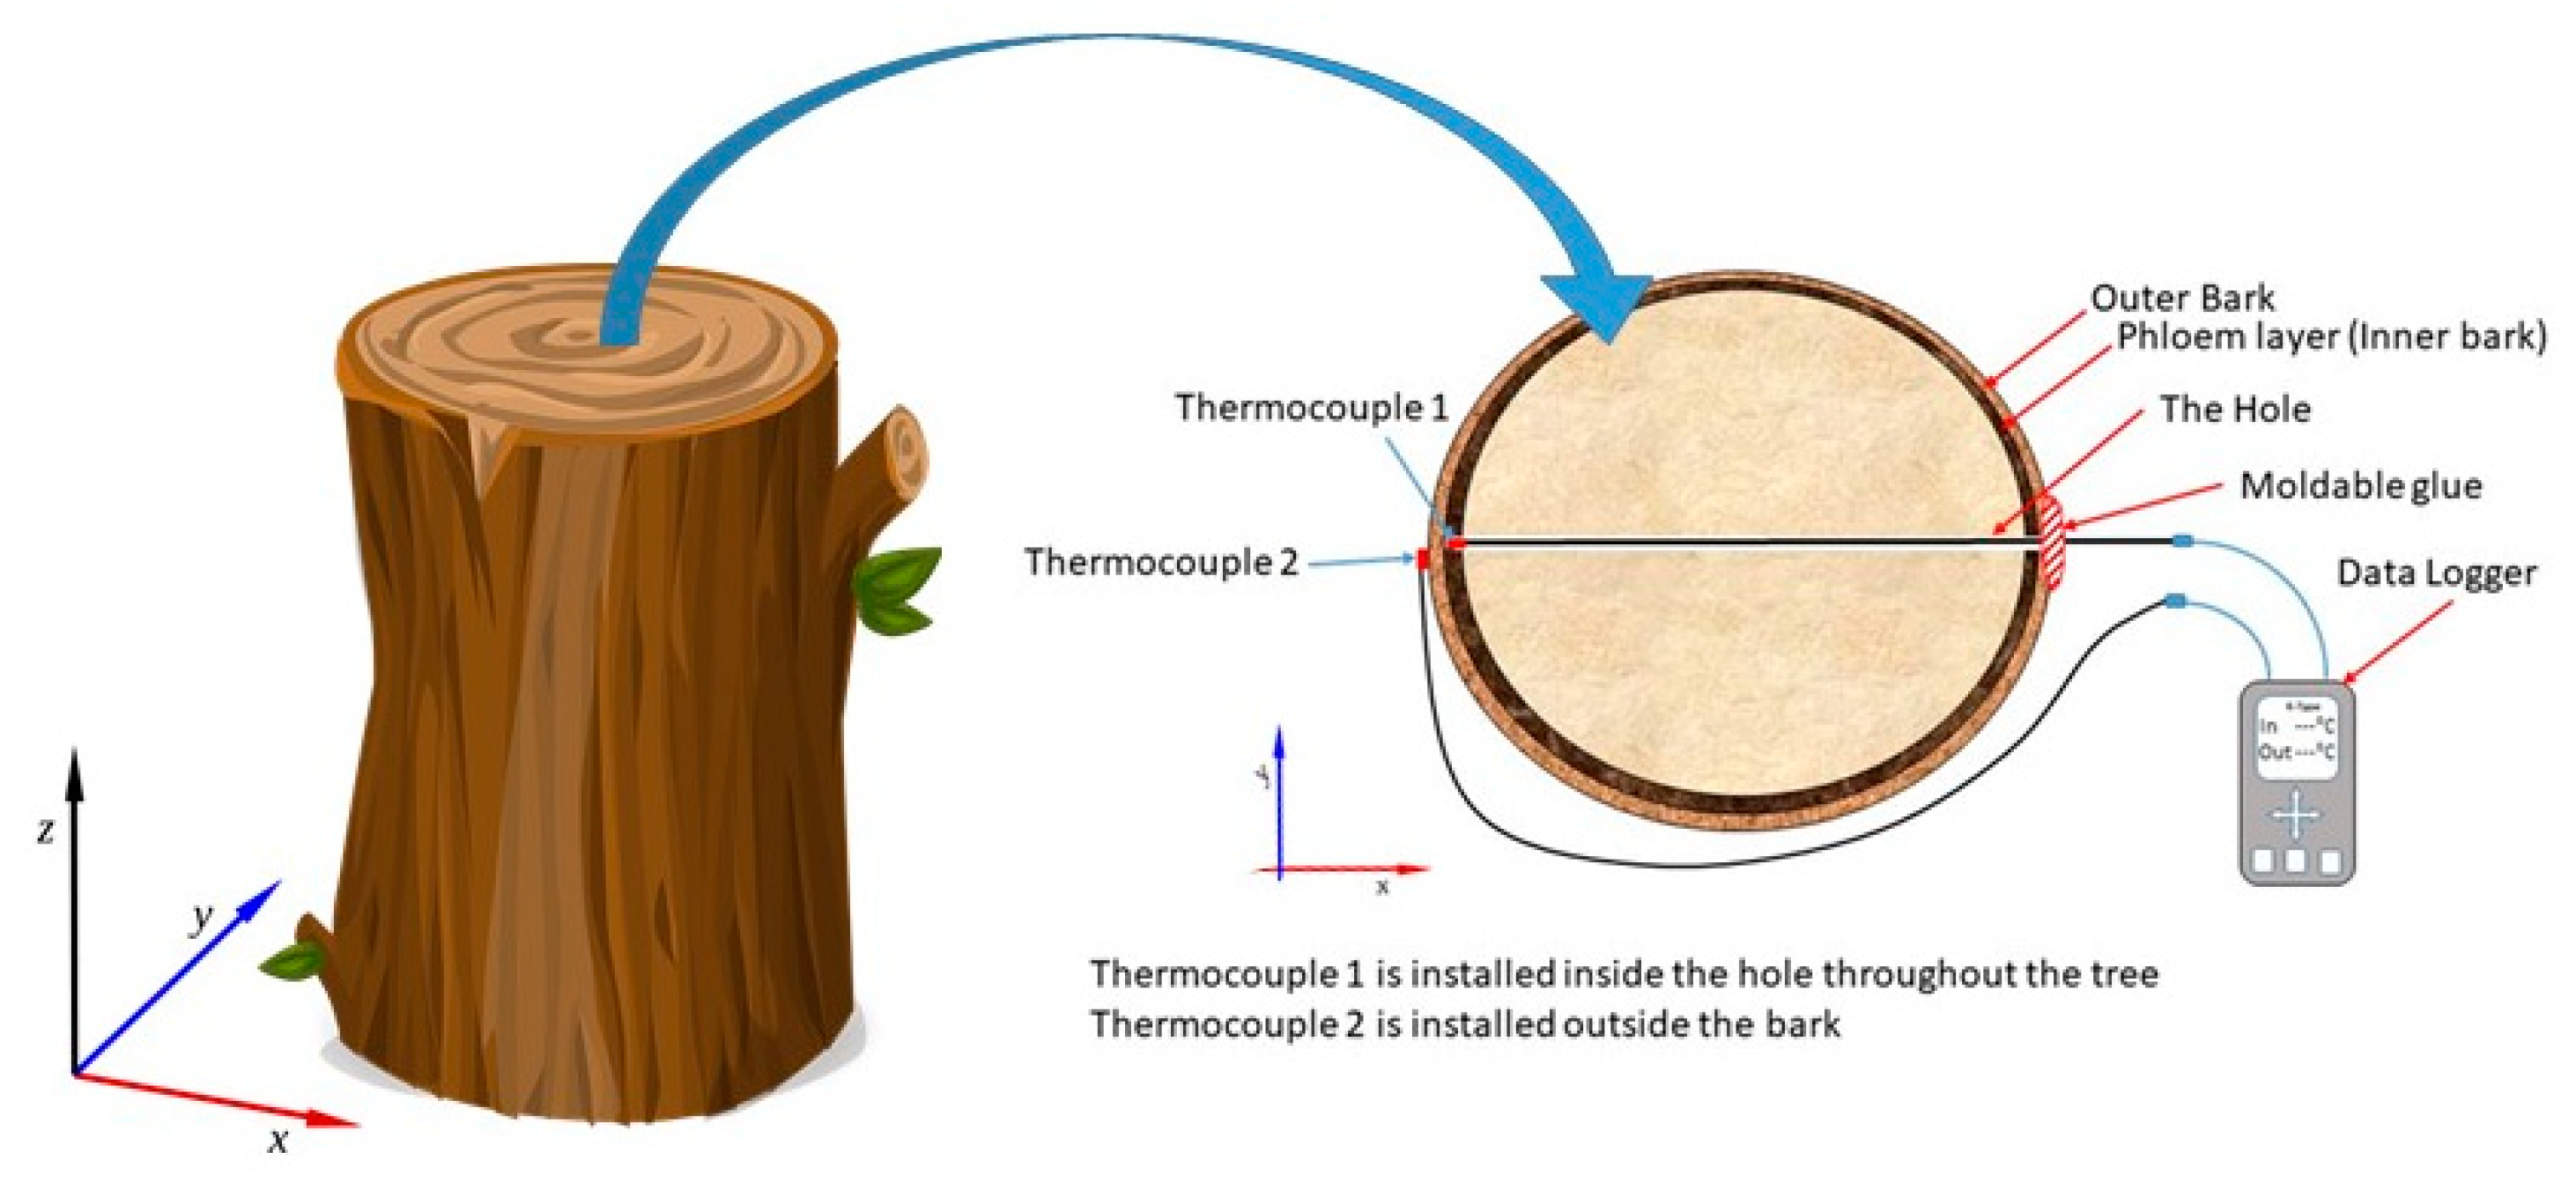
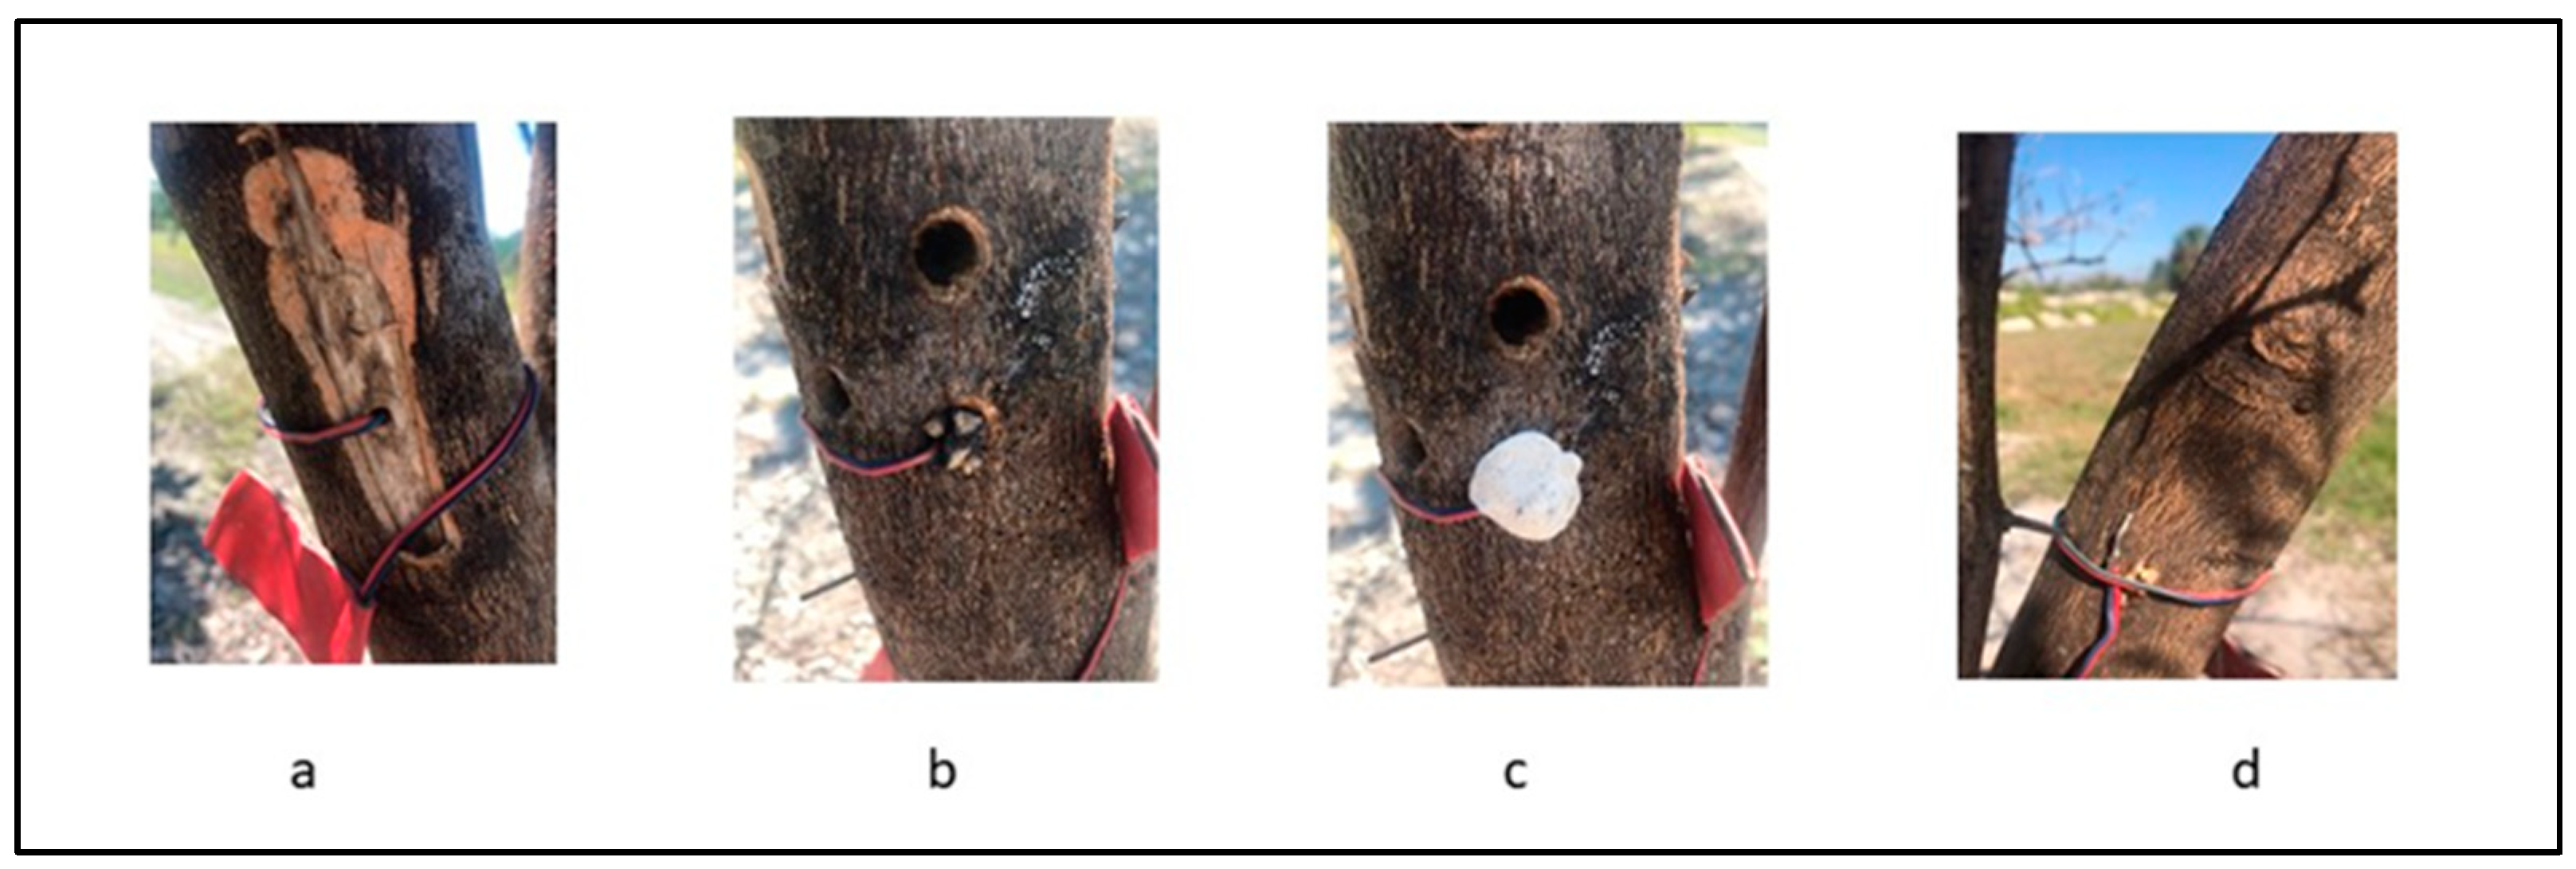
2.1. Experimental Procedure

To evaluate the efficiency of the MTS for in-field treatment of HLB-affected trees, a six-year-old HLB-affected Hamlin sweet orange tree was selected randomly in Immokalee, Florida, USA (26.4608° N, 81.4359° W). The tree trunk and branches with different diameters (Table 1) were considered as the heat transfer samples to measure the heat penetration inside them. The diameters of the tree trunk and branches were measured with a digital caliper (NEIKO, Grace Marketing, Kaneohe, HI, USA). The tree was subjected to heat treatment four times. To take measurements of heat penetration, five categories of diameter (Very small, Small, Medium, Large, and Very large) were chosen between the smallest and largest diameters in five different places of the targeted tree as experimental samples (Table 1).
The average bark thickness of a branch around each cross-section was measured. A hole was created through the tree texture and the depth of the hole was measured by the depth-measuring blade of the caliper. The depth of the hole was equal to the difference of each cross-section diameter and bark thickness (e.g., according to Table 1, the depth of the hole for medium diameter was 24.15 mm because 25.19 − 1.04 = 24.15 mm). For measuring the temperature during in-field treatments, the temperature of each experimental sample was measured with two K-type thermocouples (±0.2 °C). One thermocouple was placed inside the hole, under the bark (in the phloem), and the other was attached outside of the tree, as shown in Figure 3 and Figure 4. When the hole was large, the gap was filled by pieces of branches to create a similar texture and prevent air filling the gap and affecting thermal properties (Figure 4a,b). The hole was sealed with moldable glue (Figure 4c). The second thermocouple was installed outside the bark, close to the thermocouple inside the hole (Figure 4d). Thermocouples were connected to an Omega RXL12SD 12-channel temperature recorder (Omega Engineering, Stamford, CT, USA) that stored data from each thermocouple into an SD card at a logging frequency of 1 Hz.

2.2. Numerical Model and Simulation

ANSYS 19.2 software (ANSYS Inc., Canonsburg, PA, USA) was used to develop a computational model for heat transfer. It was assumed that the tree anatomy was symmetrical, the central ply of each experimental sample was insulated equally from heat and moisture, the dimensional changes are infinitesimally small, and chemical reactions associated with water loss in the samples were not taken into account. Moreover, it was assumed there was no degradation or heat generation inside the sample during the heat treatment process. The sample properties were considered as the heartwood of the tree and are listed in Table 2.
Heat diffusion equations were used to simulate the heat penetration throughout the cross-section of a tree to estimate the temperature inside the phloem under the bark during the heat treatment. The general equation of heat flux was written according to Fourier’s law; Equation (1):
q = λ T n n
where q is the heat flux vector (W), λ is the thermal conductivity (W/(m·K)), T is the temperature (°C), and n is the normal direction of the isotherm level at one point in the direction of the temperature gradient.
In addition, the 3D heat conduction differential equation was considered based on energy conservation and Fourier’s laws; Equation (2):
ρ c T t = x ( λ x T x ) + y ( λ y T y ) + z ( λ z T z )
where ρ is the density (kg/m3), c is the special heat capacity (J/(kg·K)), and t is time (s). The initial temperature of the sample wall was considered as the environment temperature on the day that the experiments were conducted. An initial uniform temperature of 28 °C was used for the simulations. Representative equations considered as follows for the definition of boundary conditions; Equations (3) and (4):
T ( x , t ) x | x = 0 = 0
h [ T ( x , t ) T f ] = λ T ( x , t ) x | x = 1 2 δ
where h is the convective heat transfer coefficient (W/(m2·K)), Tf is the environmental temperature, and is the diameter of the sample (m).

3. Results and Discussion

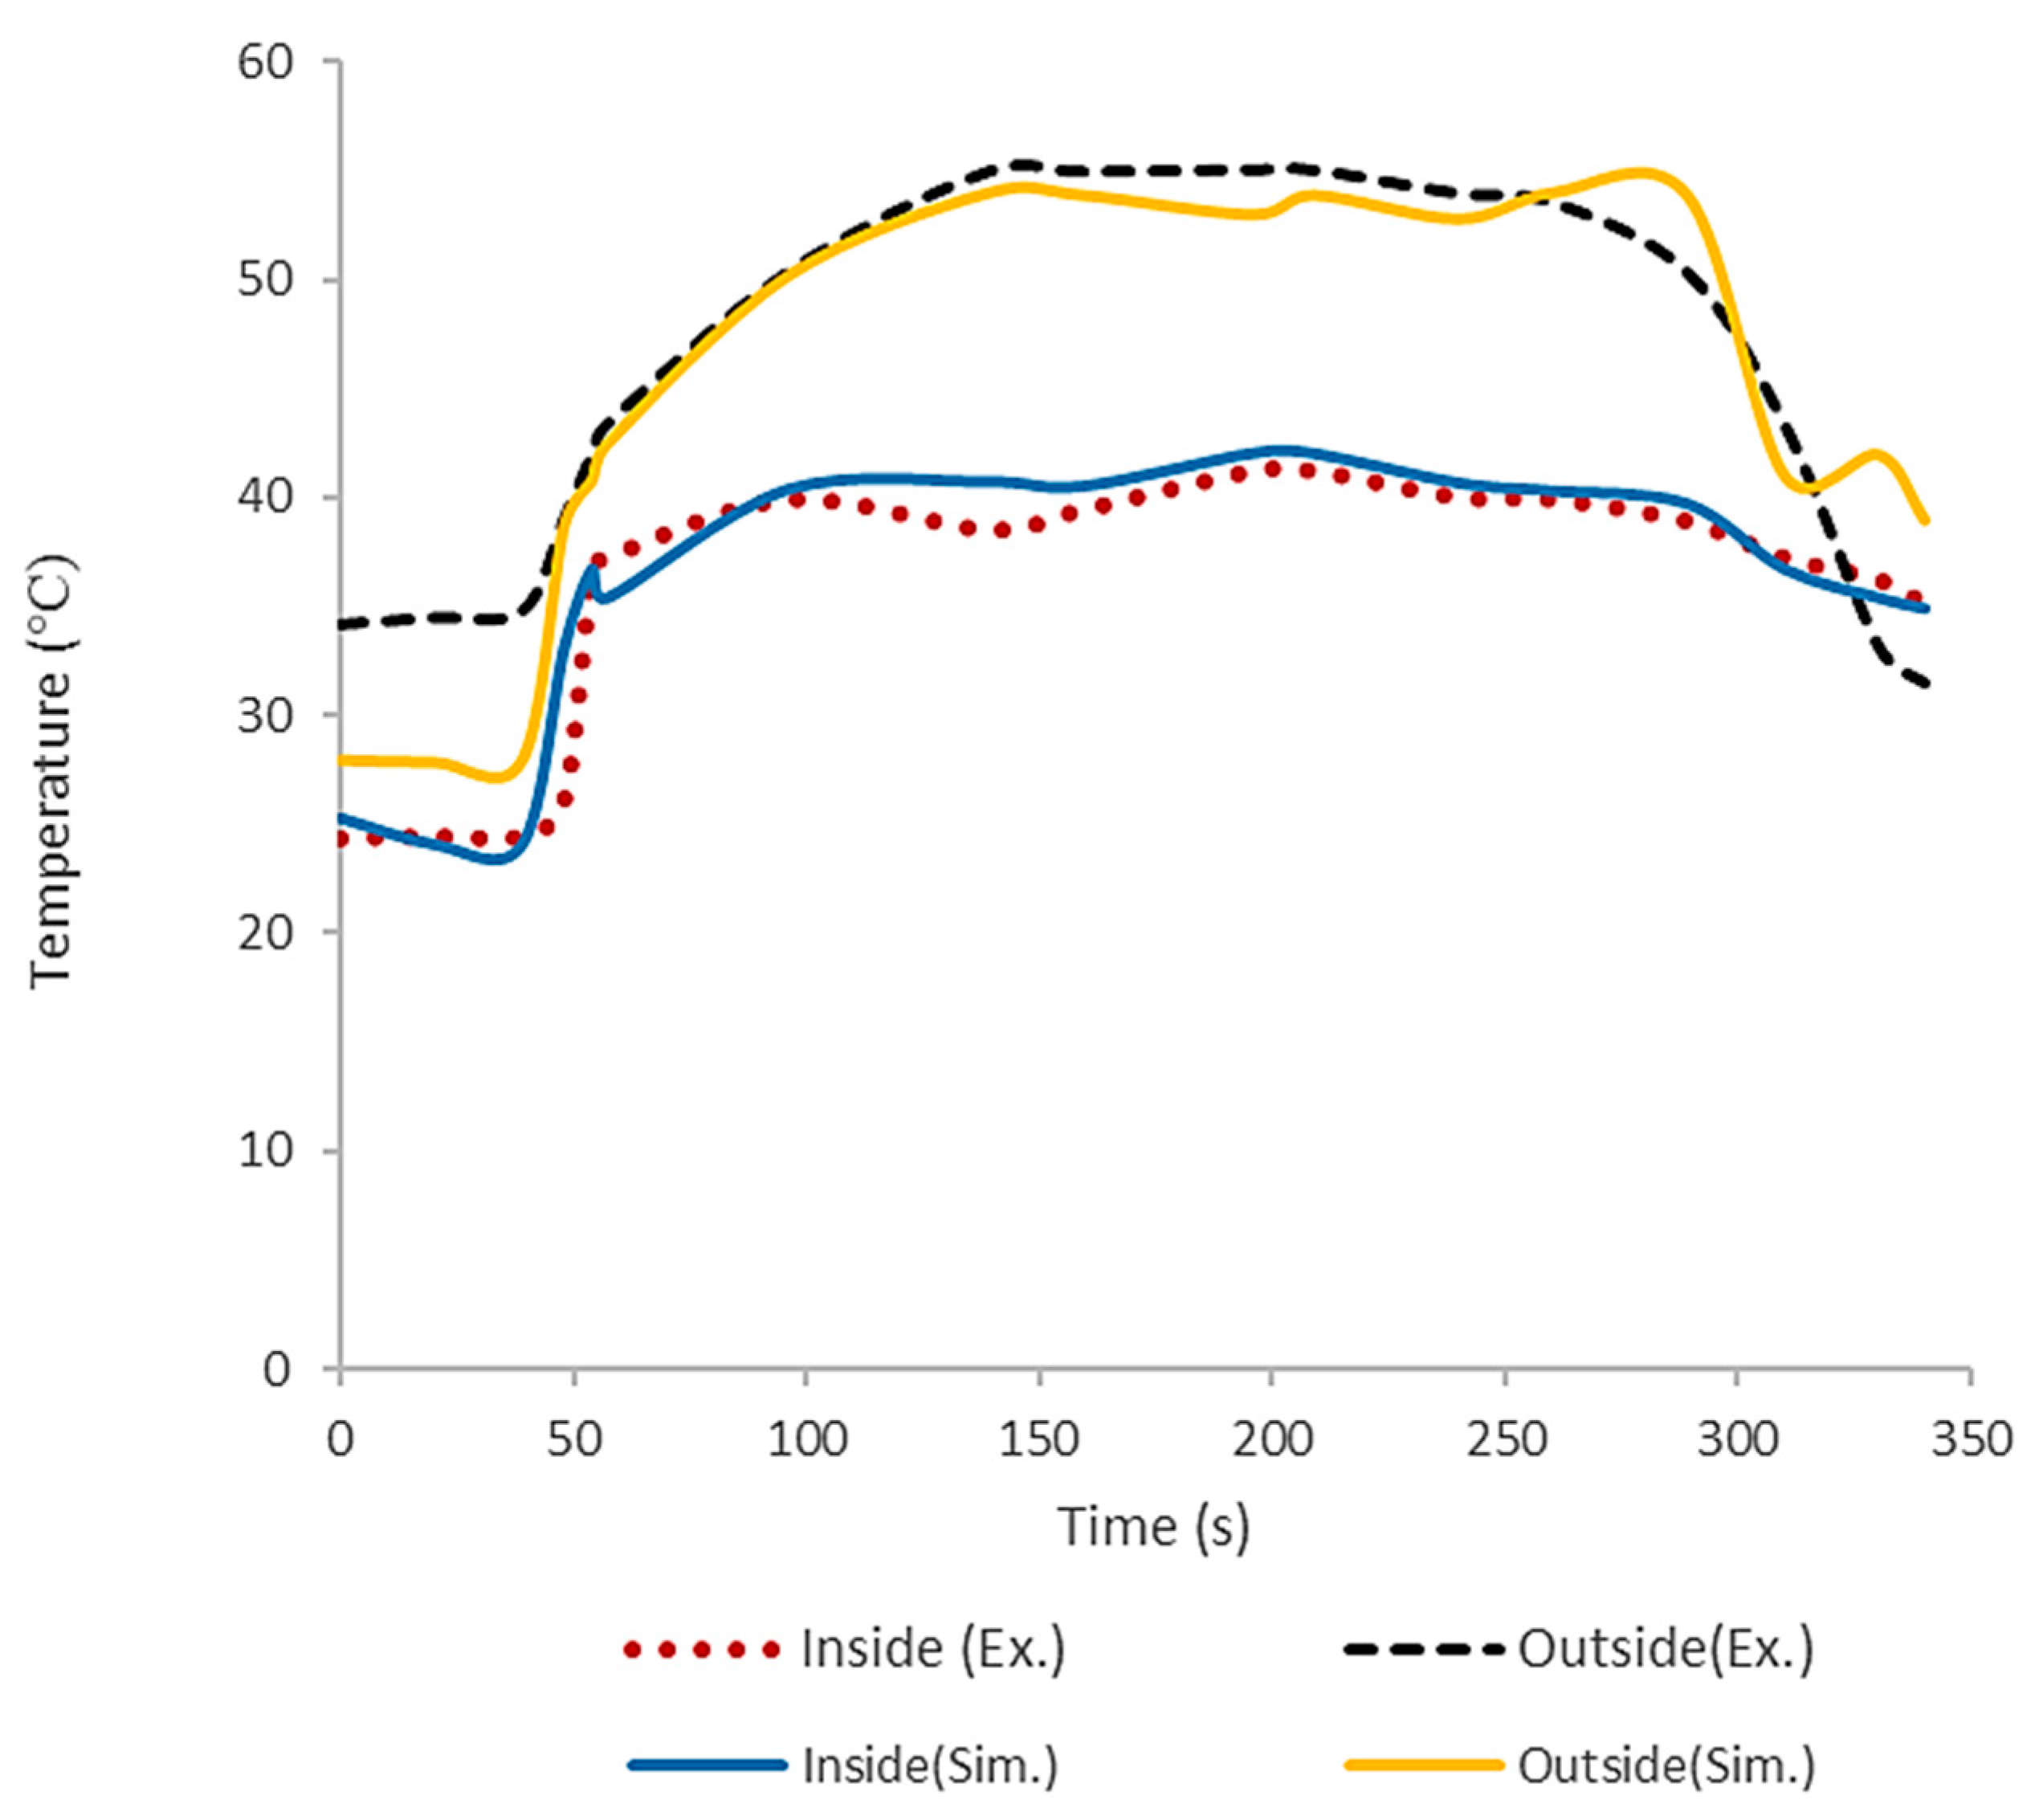
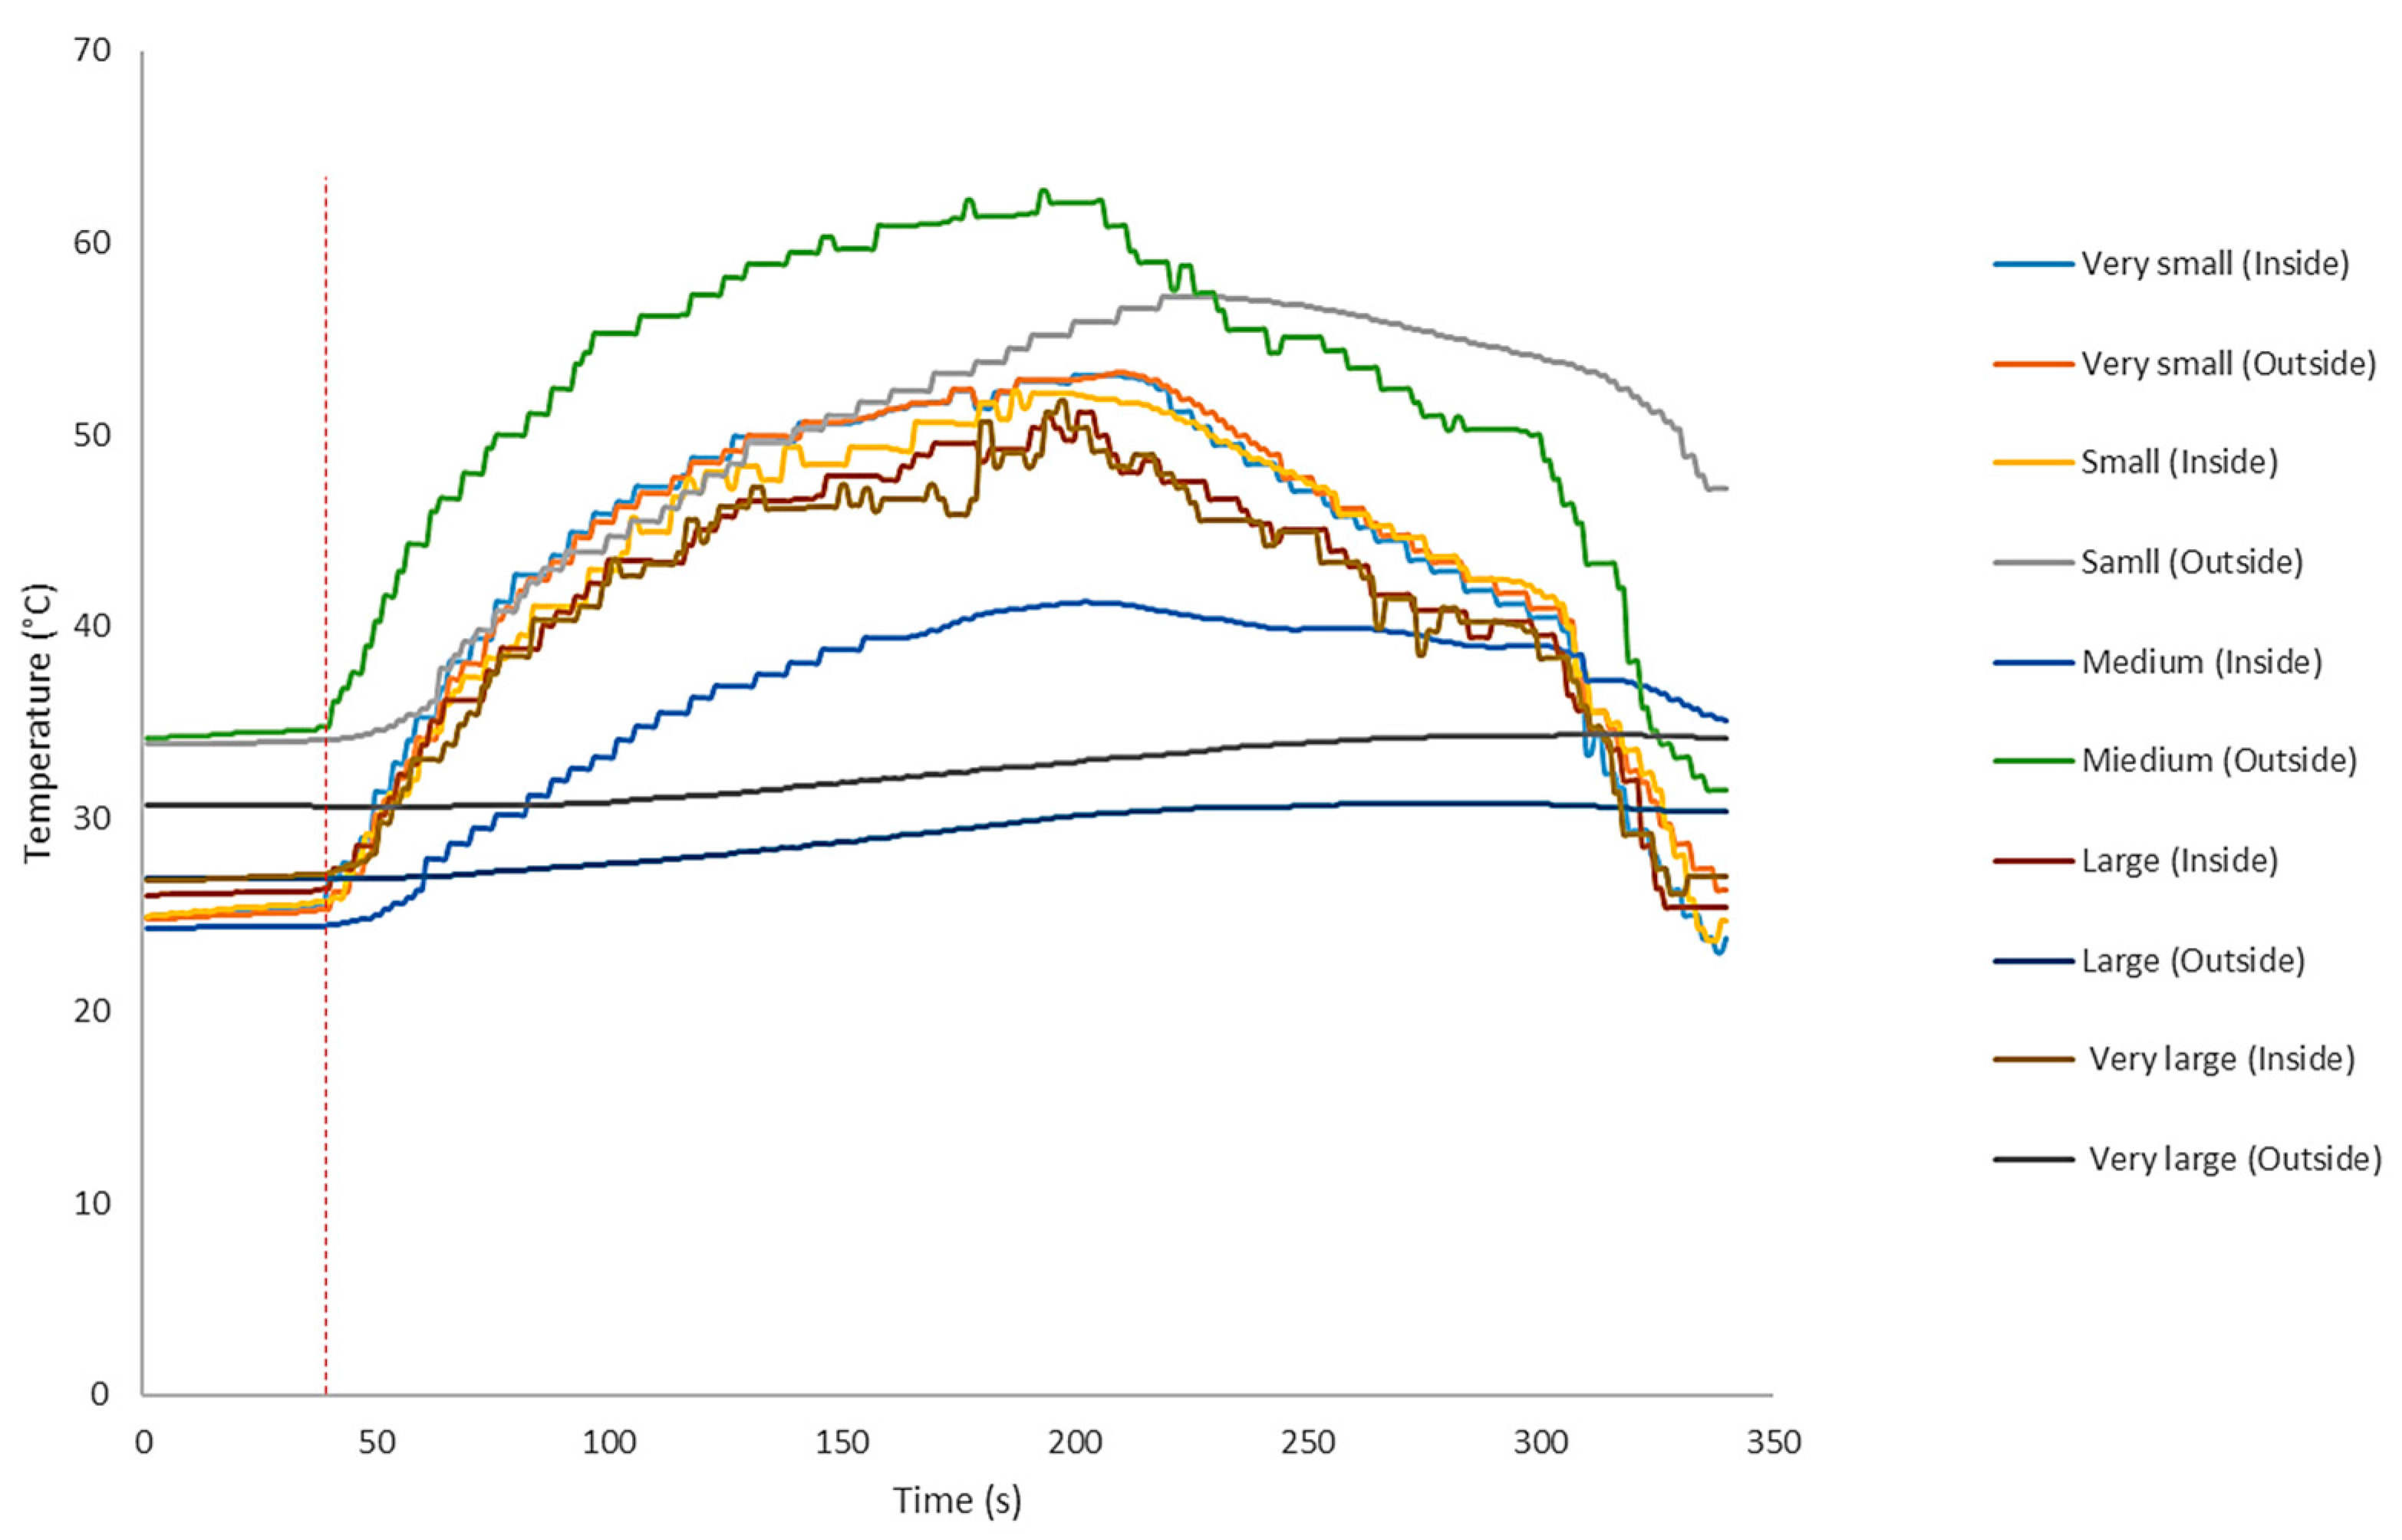
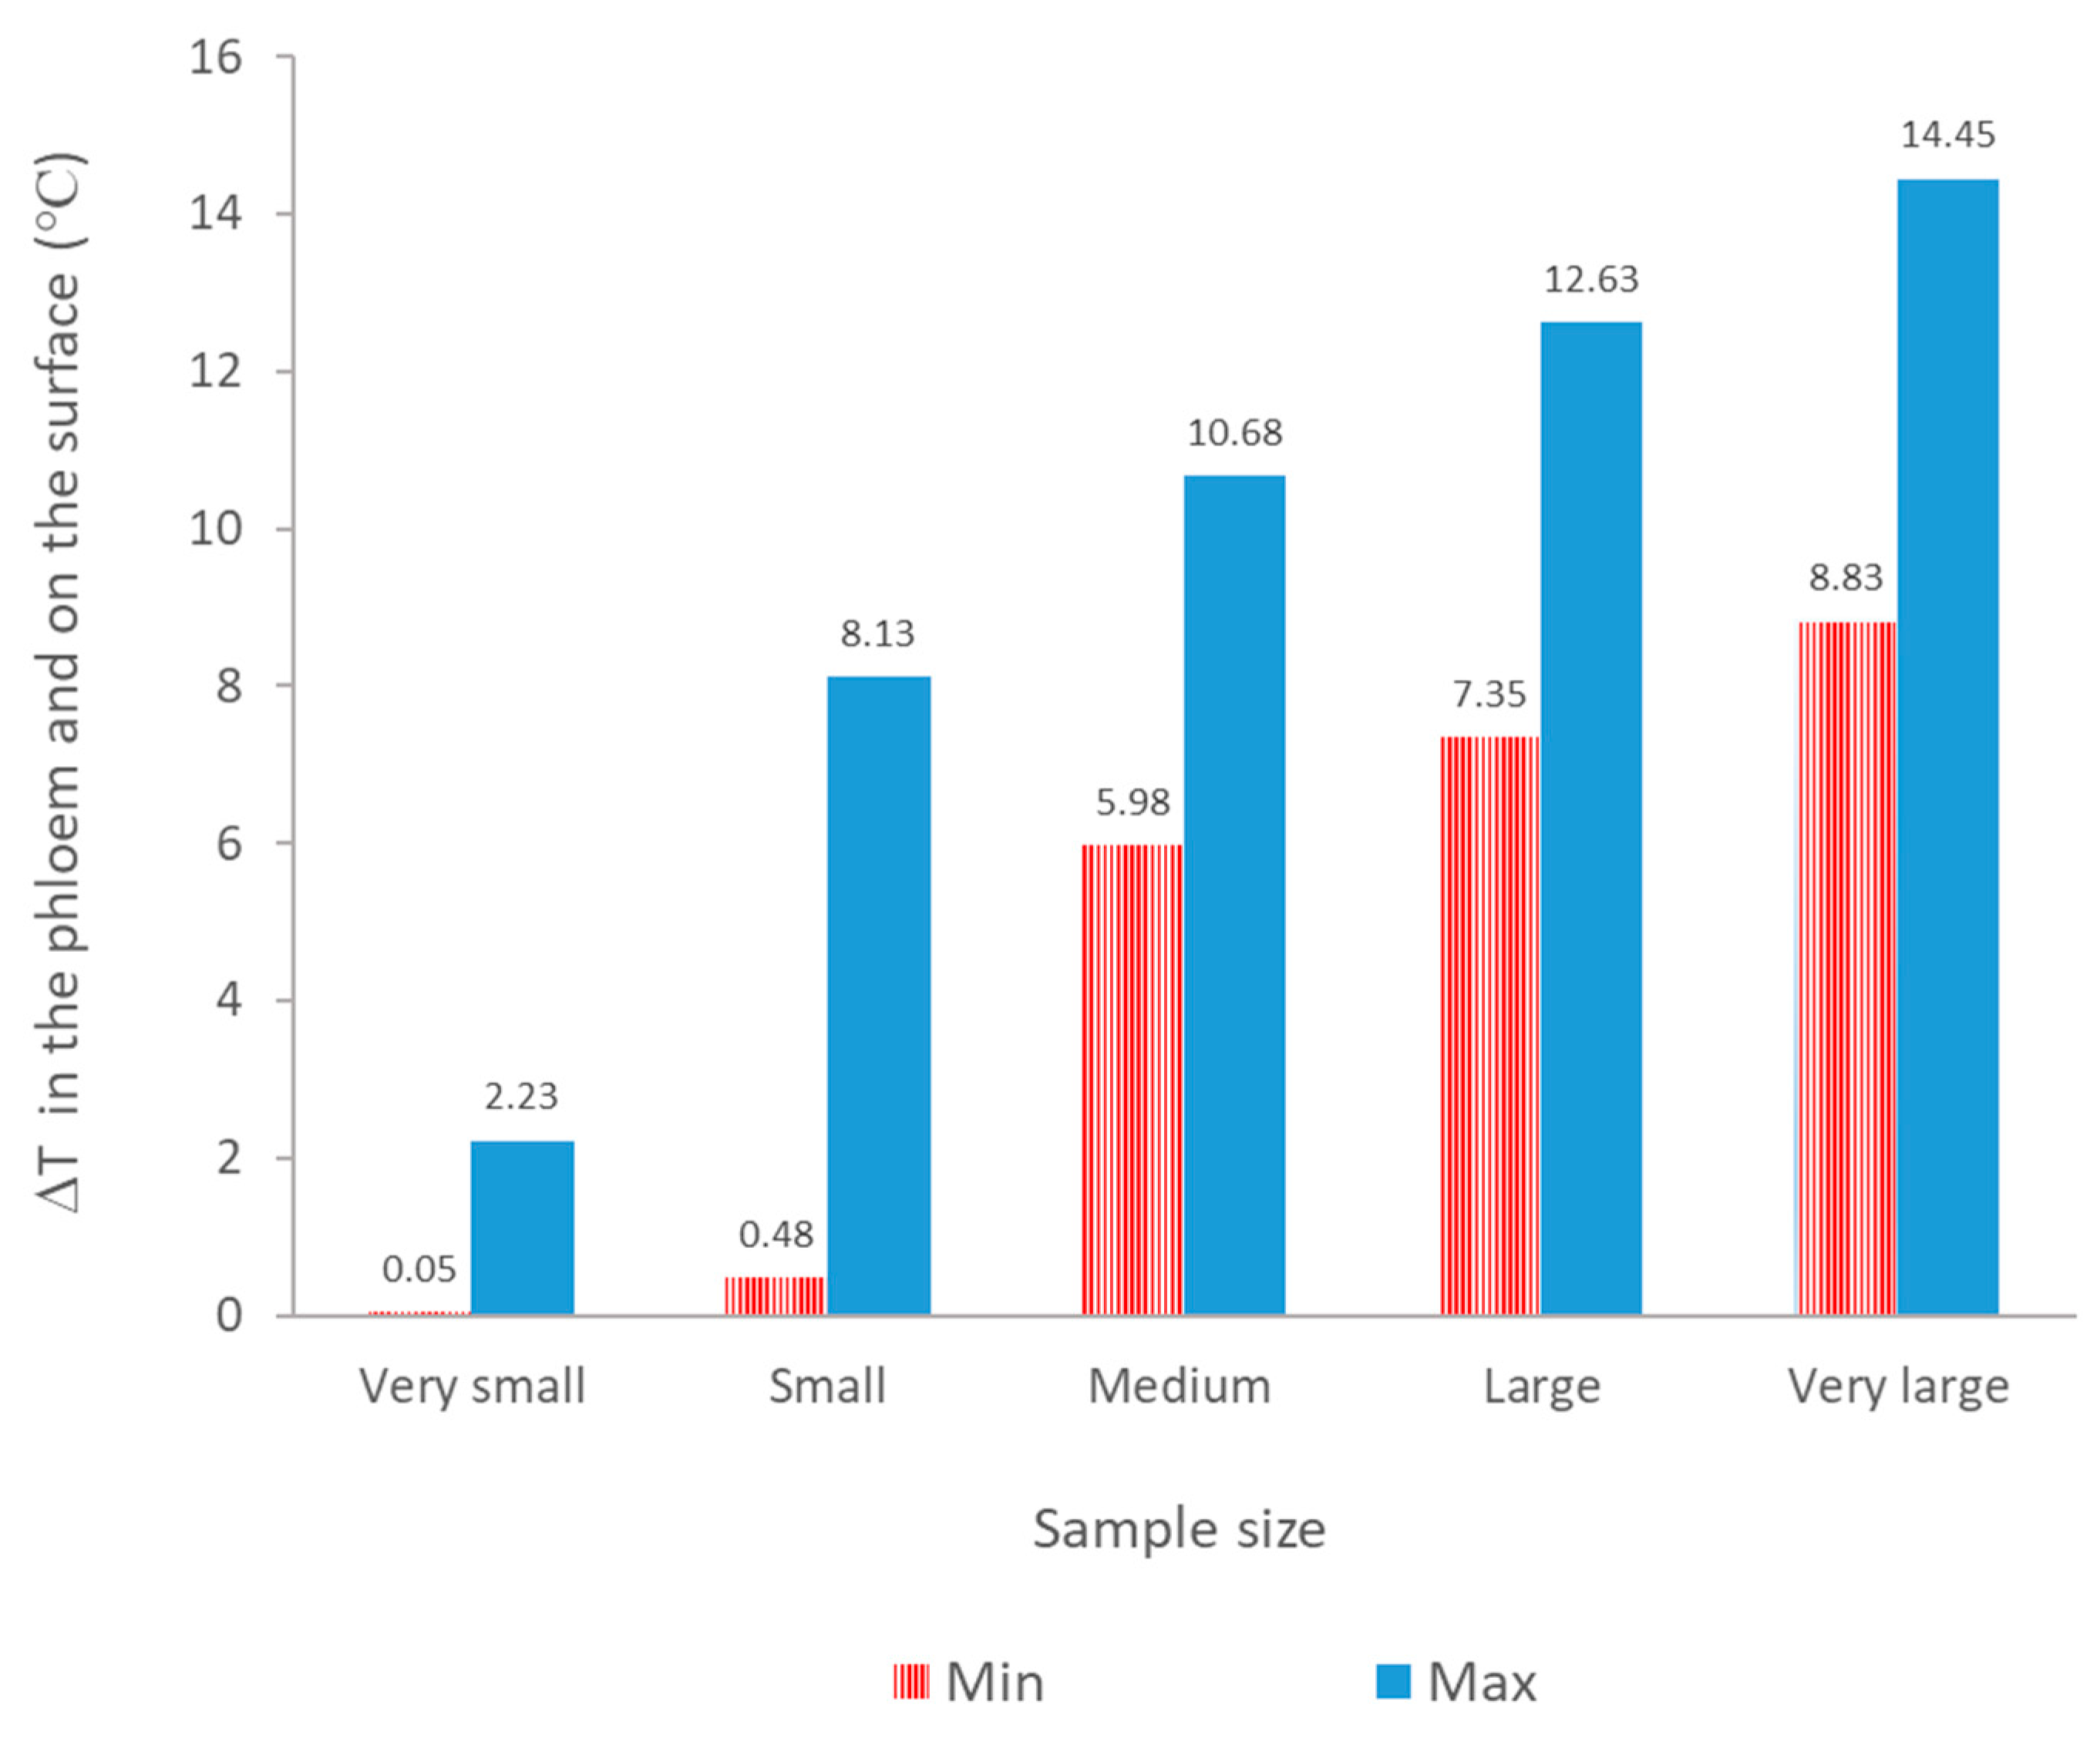
3.1. Experimental Results

The tree with the thermocouples at each of the five categories of diameter (Very small, Small, Medium, Large, and Very large) was subjected to heat treatment four times. Although all repetitions showed a similar trend on increasing temperature, steam injection started at a different point in each experiment and using average values for further analysis would not be accurate. One of the repetitions was randomly chosen as a representative case study for further analysis and simulation. According to experimental results, temperature variation curves inside the phloem and the outside bark surface of the tree were shown in Figure 5. The results are in agreement with the experimental results that were observed and presented in a previous study [4]. A statistical test of the difference between the temperature at the outside bark surface and the phloem resulted in a p-value of 0.004. As expected, the temperature in the phloem could not reach the surface temperature because of the thermal resistance of the bark.
Figure 6 shows the maximum and minimum difference of the temperature inside the phloem and on the surface of the tree for five sample categories (from the moment of starting to inject steam to ending the treatment by opening the canopy cover). The mean and standard deviation of temperature difference for all experiments are shown in Table 3. As the diameter increases, the thickness of the bark increases, and hence a thicker heat isolation layer is generated; the thickness of the cortex is higher with a longer column of cells. Therefore, the physical properties and topology of the bark reduce the heat transfer. Moreover, the tree bark surface is not smooth, and there is some area in which air is trapped and which decreases the level of heat transfer [27].

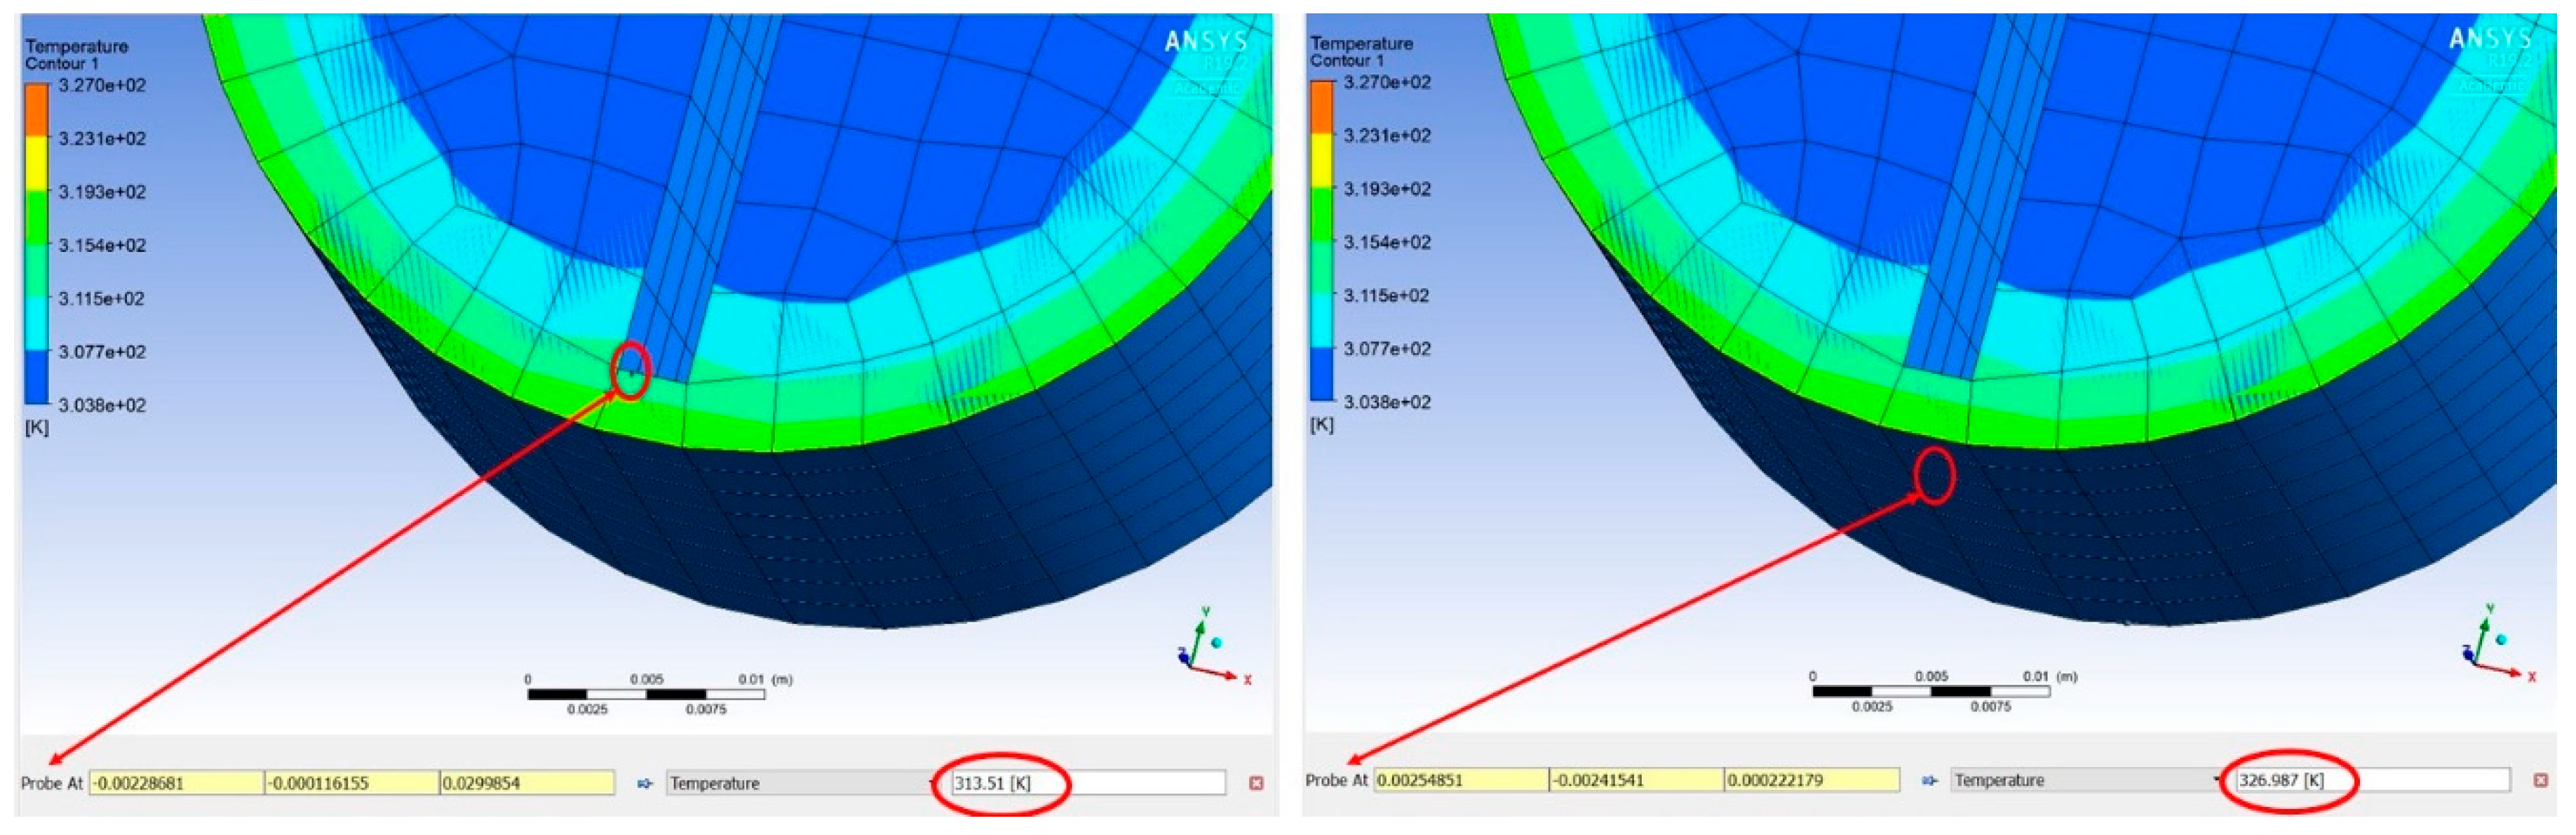
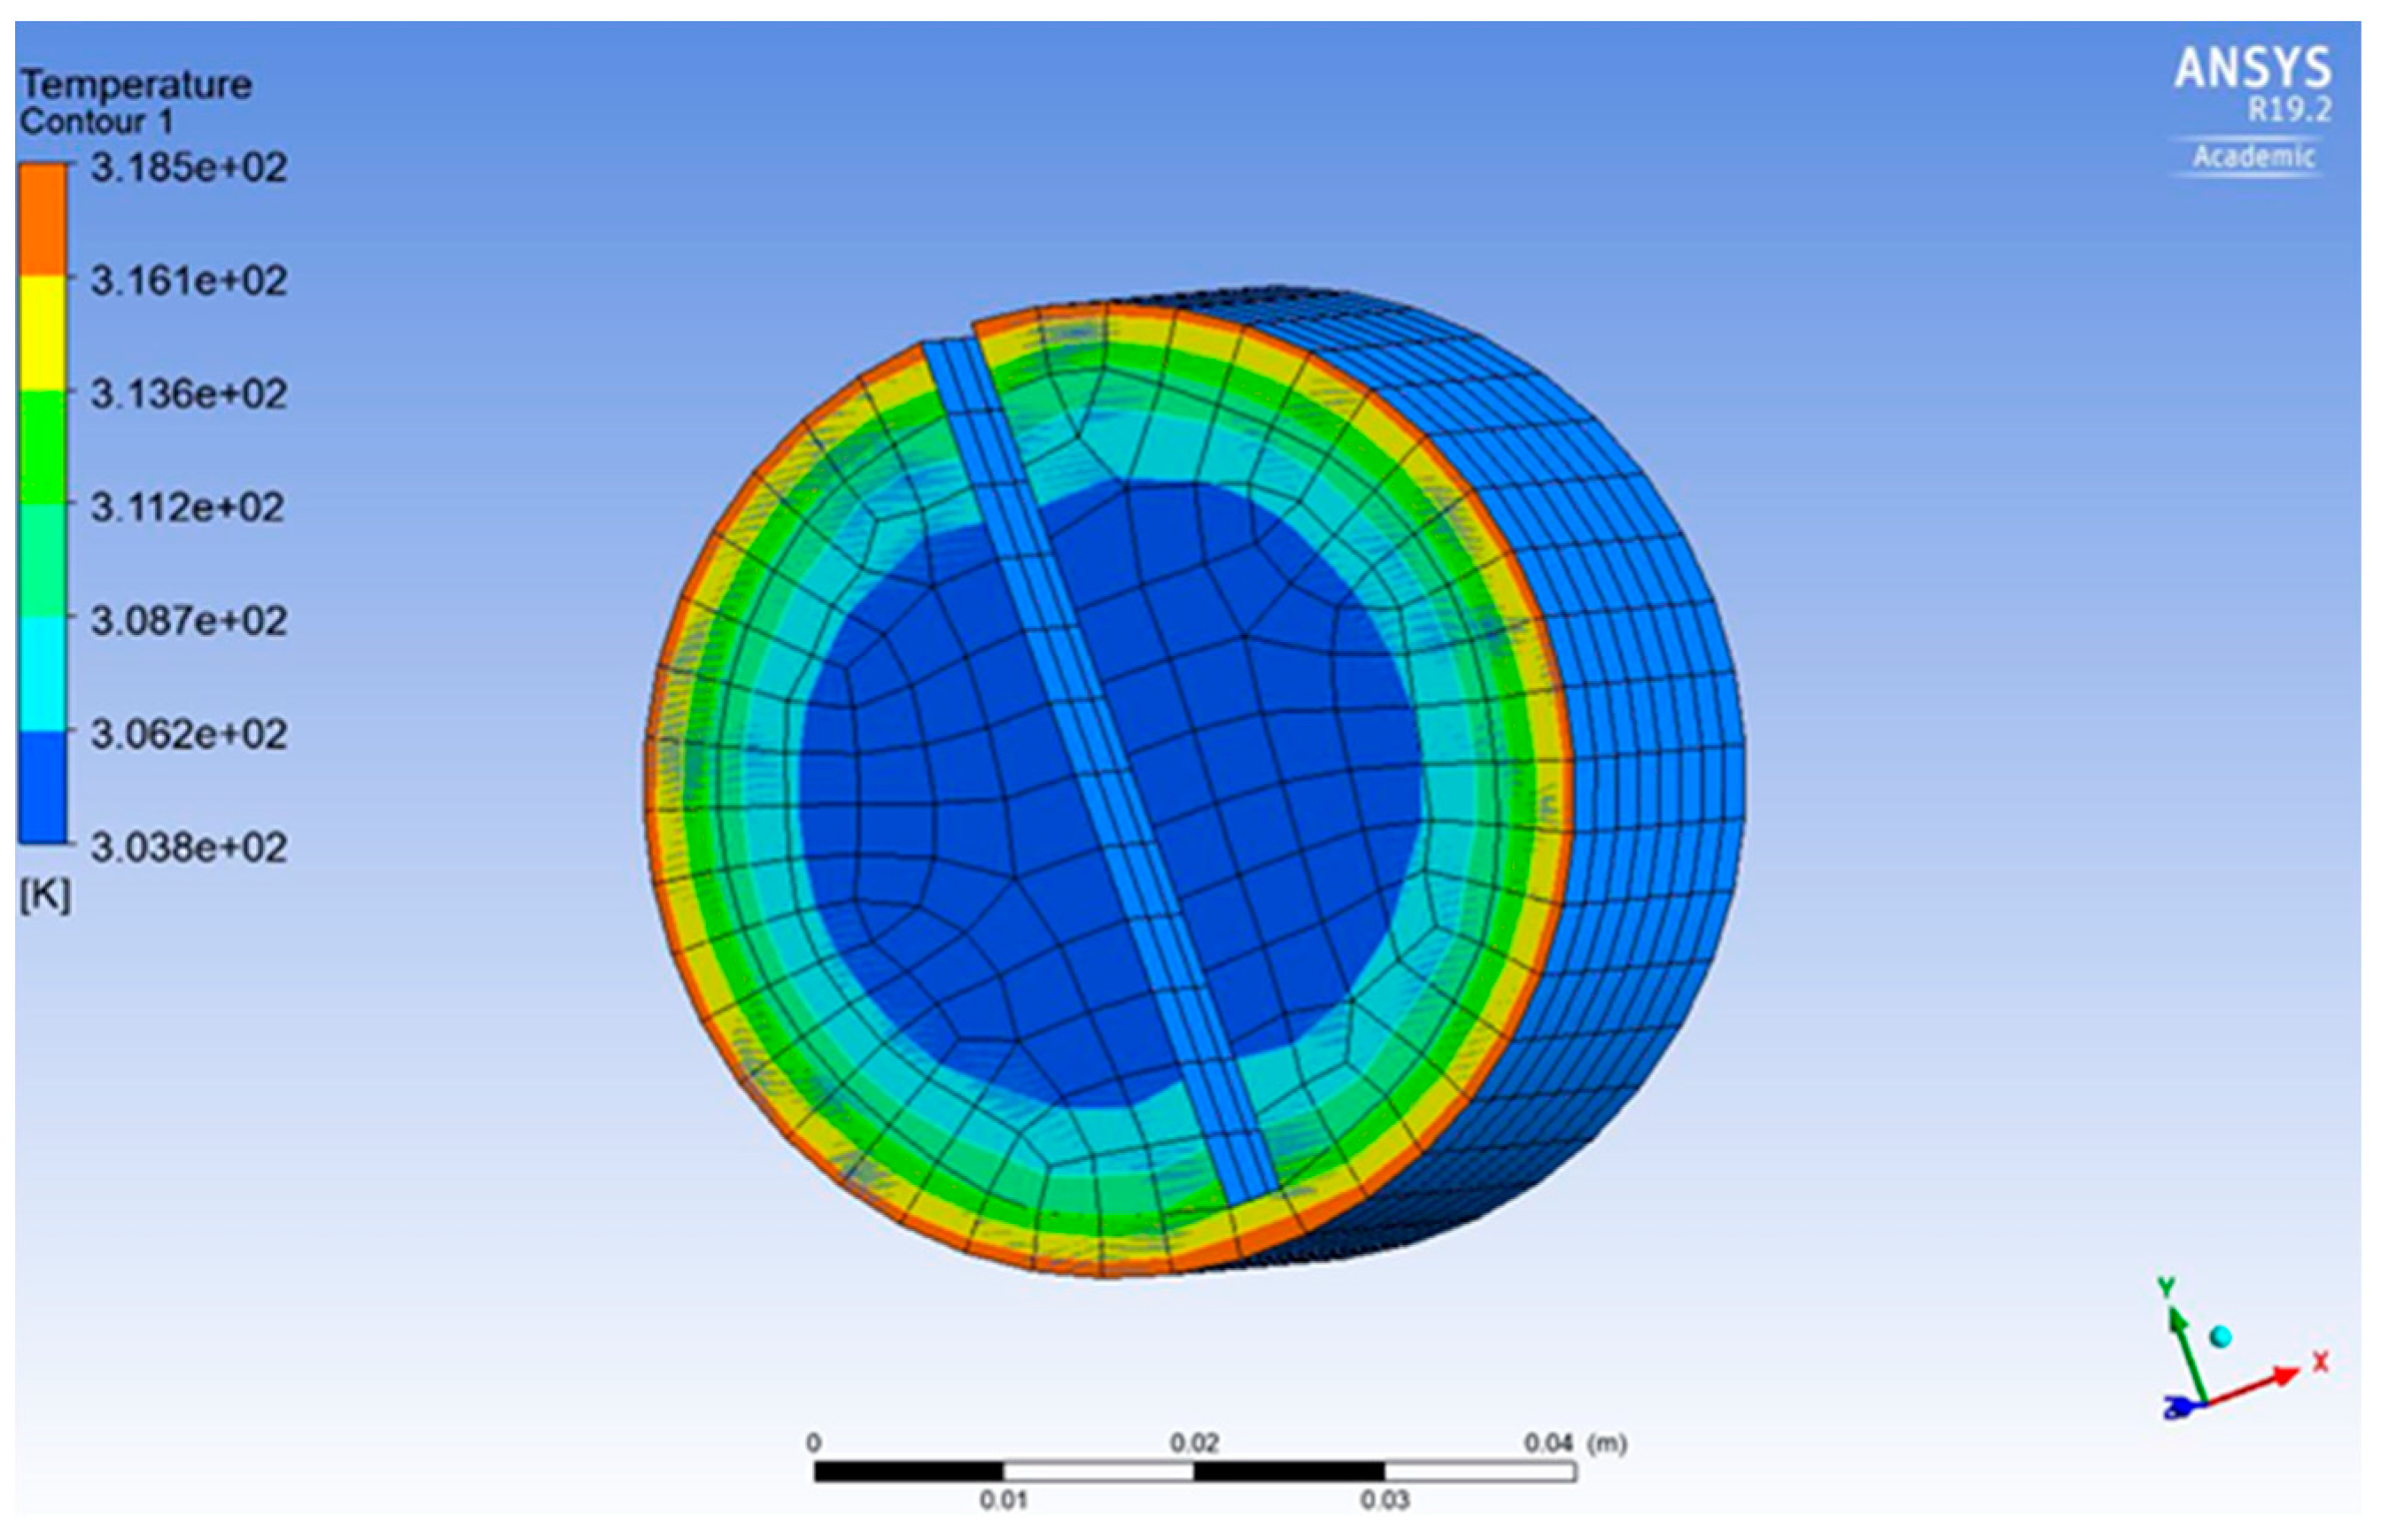
3.2. Simulation Results

To further study the heat penetration inside a tree, the “Medium” diameter category was selected as a representative case study for simulation analysis and evaluation as all samples in different categories showed a similar response, as verified by Ghatrehsamani et al. [4,8]. The ANSYS 19.2 (ANSYS Inc., Canonsburg, PA, USA) software is commonly used for finite element analysis, including to simulate heat and temperature distributions. In this study, the solutions of the presented heat diffusion equations were obtained using ANSYS and the parameters presented in Table 2. The temperature distribution through a sample cross-section is shown in Figure 7.
Table 4 presents the temperature distribution at some points (in the bark and phloem) to compare the simulation and experimental results. Figure 8 shows the temperature on the surface of the branch and inside the phloem at a specific time. Figure 9 compares the simulation and experimental results. Overall, the predicted values are similar to the experimental results (measured temperature).
Under the tested conditions, the developed computational conduction model predicted accurately the temperature distribution, on the bark surface and inside the phloem, during the heat treatment, with an error of 1–4% (Figure 8 and Table 4).

4. Conclusions

A heat transfer computational model was developed to study the heat transfer and distribution inside a citrus tree’s trunk and branches during heat treatments. Understanding this process might be useful in coping with a disease like HLB which is caused by a heat-sensitive pathogen. The ANSYS software was used to model the heat diffusion equations and to measure the heat penetration inside the tree to the phloem where the HLB bacteria live. Overall, the simulation results were consistent with the experimental data, with an error of about 1–4%. This model was used to evaluate the performance of a mobile thermotherapy system for the in-field treatment of HLB-affected citrus trees. It can also be utilized to significantly reduce costly and time-consuming experiments in order to determine the optimal time and temperature combinations to effectively kill specific bacteria during heat treatments. Furthermore, the proposed method can be used to monitor the temperature distribution not only inside the tree canopy branches, but also inside different parts of a tree (e.g., tree trunk), as well as on other types of plants. This approach can potentially help in designing and developing better and more efficient heat treatment systems to control different kinds of pests and diseases.

Author Contributions

Conceptualization, R.E.; methodology, S.G., R.E. and Y.A.; validation, S.G., R.E.; formal analysis, S.G. and J.K.S.; investigation, S.G., R.E., J.K.S. and Y.A.; resources, R.E. and Y.A.; data curation, S.G.; writing—original draft preparation, S.G.; writing—review and editing, J.K.S., R.E. and Y.A.; visualization, S.G., J.K.S. and Y.A.; supervision, R.E., J.K.S. and Y.A.; project administration, Y.A.; funding acquisition, R.E. and Y.A. All authors have read and agreed to the published version of the manuscript.

Funding

This work was supported by the USDA/NIFA award #2015-70016-23030. Statements in this document do not reflect the position or policy of the USDA.

Institutional Review Board Statement

Not applicable.

Informed Consent Statement

Not applicable.

Data Availability Statement

The data that support the findings of this study are available from the corresponding author, [S.G.], upon request.

Conflicts of Interest

The authors declare no conflict of interest.

Nomenclature

HLMHuanglongbing
MTSMobile Thermotherapy System
qHeat flux vector (W)
TTemperature (°C)
TfEnvironmental temperature
TTemperature difference between the surface and inside the phloem
λThermal conductivity (W/(m·K))
pDensity kg/m3
tTime (s)
Diameter of the sample (m)
cSpecial heat capacity (J/kg·K))
hConvective heat transfer coefficient (W/(m2·K))
nNormal direction of the isotherm level at one point in the direction of the temperature gradient

References

  1. Oumarou, N.; Kocaefe, D.; Kocaefe, Y. 3D-modelling of conjugate heat and mass transfers: Effects of storage conditions and species on wood high temperature treatment. Int. J. Heat Mass Transf. 2014, 79, 945–953. [Google Scholar] [CrossRef]
  2. Grondeau, C.; Samson, R.; Sands, D.C. A Review of Thermotherapy to Free Plant Materials from Pathogens, Especially Seeds from Bacteria. Crit. Rev. Plant. Sci. 1994, 13, 57–75. [Google Scholar] [CrossRef]
  3. Hoffman, M.T.; Doud, M.S.; Williams, L.; Zhang, M.Q.; Ding, F.; Stover, E.; Hall, D.; Zhang, S.; Jones, L.; Gooch, M. Heat Treatment Eliminates “Candidatus Liberibacter asiaticus” from Infected Citrus Trees Under Controlled Conditions. Am. Phytopathol. Soc. 2013, 103, 15–22. [Google Scholar] [CrossRef] [PubMed] [Green Version]
  4. Ghatrehsamani, S.; Abdulridha, J.; Balafoutis, A.; Zhang, X.; Ehsani, R.; Ampatzidis, Y. Development and evaluation of a mobile thermotherapy technology for in-field treatment of Huanglongbing (HLB) affected trees. Biosyst. Eng. 2019, 182, 1–15. [Google Scholar] [CrossRef] [Green Version]
  5. Ghatrehsamani, S. A Review of Applied Methods for Treating HLB-Affected Tree. In Proceedings of the 2020 ASABE Annual International Meeting (ASABE AIM), St. Joseph, MI, USA, 13–15 July 2020. [Google Scholar]
  6. Lo, X. Studies on the sterilization effect of the intermittent hot water treatment on citrus budwood and nursling infected with citrus yellow shoot. J. S. China Agric. Univ. 1983, 1, 97–102. [Google Scholar]
  7. Czarnecka, E.; Verner, L.; Gurley, W.B. Liberibacter crescens as a surrogate to model survival of the bacterial pathogen L. asiaticus in heat treatments for citrus greening. In Proceedings of the 131st Annual Meeting of the Florida State Horticultural Society, Ft. Lauderdale, FL, USA, 10–11 June 2018. [Google Scholar]
  8. Ghatrehsamani, S.; Czarnecka, E.; Verner, F.L.; Gurley, W.B.; Ehsani, R.; Ampatzidis, Y. Evaluation of Mobile Heat Treatment System for Treating In-Field HLB-Affected Trees by Analyzing Survival Rate of Surrogate Bacteria. Agronomy 2019, 9, 540. [Google Scholar] [CrossRef] [Green Version]
  9. Inoue, M.; Norimoto, M.; Tanahashi, M.; Rowell, R.M. Steam or heat fixation of compressed wood. Wood Fiber Sci. 1993, 25, 224–235. [Google Scholar]
  10. Dubey, M.; Pang, S.; Walker, J. Changes in chemistry, color, dimensional stability and fungal resistance of Pinus radiata D. Don wood with oil heat-treatment. Holzforschung 2011, 66, 49–57. [Google Scholar] [CrossRef]
  11. Poncsák, S.; Kocaefe, D.; Bouazara, M.; Pichette, A. Effect of high temperature treatment on the mechanical properties of birch (Betula papyrifera). Wood Sci. Technol. 2006, 40, 647–663. [Google Scholar] [CrossRef]
  12. Militz, H. Thermal treatment of wood: European processes and their background. In Proceedings of the Conference on Enhancing the Durability of Lumber and Engineered Wood Products, Kissimmee, FL, USA, 11–13 February 2002. [Google Scholar]
  13. Jamsa, S.; Viitaniemi, P. Heat treatment of wood better durability without chemicals. Nord. Trebeskyttelsesdager 1998, 47–51. [Google Scholar]
  14. Korkut, S.; Akgul, M.; Dundar, T. The effects of heat treatment on some technological properties of Scots pine (Pinus sylvestris L.) wood. Bioresour. Technol. 2008, 99, 1861–1868. [Google Scholar] [CrossRef]
  15. Kamdem, D.P.; Pizzi, A.; Jermannaud, A. Durability of heat-treated wood. Holz Als Roh-und Werkstoff 2002, 60, 1–6. [Google Scholar] [CrossRef]
  16. Sanderman, W.; Augustin, H. Chemical investigation on the thermal decomposition of wood—Part III: Chemical investigation on the course of decomposition. Holz Als Roh-und Werkstoff 1963, 22, 377–386. [Google Scholar]
  17. Damann, K.E.J.; Benda, G.T.A. Evaluation of commercial heat-treatment methods for control of ratoon stunting disease of sugarcane. Plant. Dis. 1983, 67, 966–967. [Google Scholar] [CrossRef]
  18. Smith, G.R.; Fletcher, J.D.; Marroni, V.; Kean, J.M.; Stringer, L.D.; Vereijssen, J. Plant pathogen eradication: Determinants of successful programs. Australas. Plant. Pathol. 2017, 46, 277–284. [Google Scholar] [CrossRef]
  19. Panattoni, A.; Luvisi, A.; Triolo, E. Elimination of Viruses in Plants: Twenty years of progress. Span. J. Agric. Res. 2013, 11, 173–188. [Google Scholar] [CrossRef] [Green Version]
  20. Barba, M.; Ilardi, V.; Pasquini, G. Control of Pome and Stone Fruit Virus Diseases. Adv. Virus Res. 2015, 91, 47–83. [Google Scholar] [PubMed]
  21. Tasdemir, C.; Hiziroglu, S. Measurement of various properties of Southern pine and aspen as function of heat treatment. Measurement 2014, 49, 91–98. [Google Scholar] [CrossRef]
  22. Gebremedhin, K.G.; Wu, B. Simulation of flow field of a ventilated and occupied animal space with different inlet and outlet conditions. J. Therm. Biol. 2005, 30, 343–353. [Google Scholar] [CrossRef]
  23. Boulard, T.; Wang, S. Experimental and numerical studies on the heterogeneity of crop transpiration in a plastic tunnel. Comput. Electron. Agric. 2002, 34, 173–190. [Google Scholar] [CrossRef]
  24. Younsi, R.; Kadem, S.; Lachemet, A.; Kocaefe, D. Transient analysis of heat and mass transfer during heat treatment of wood including pressure equation. Therm. Sci. 2012, 19, 693–702. [Google Scholar] [CrossRef]
  25. Zhang, J.; Qu, L.; Wang, Z.; Zhao, Z.; He, Z.; Yi, S. Simulation and validation of heat transfer during wood heat treatment process. Results Phys. 2007, 7, 3806–3812. [Google Scholar] [CrossRef]
  26. Wang, Z.Y.; Qiu, S.; He, Z.B.; Yi, S.L. Heat transfer in the process of pyrolysis of garden waste. J. Beijing For. Univ. 2016. 38, 116–122.
  27. Chatziefstratiou, E.; Bohrer, G.; Bova, A.; Subramanian, R.; Frasson, R.; Scherzer, A.; Butler, B.W.; Dichinson, M.B. FireStem2D—A Two-Dimensional Heat Transfer Model for Simulating Tree Stem Injury in Fires. PLoS ONE 2013, 8, e70110. [Google Scholar] [CrossRef] [PubMed] [Green Version]
Figure 1. Schematic diagram of mobile thermotherapy system for heat-treating huanglongbing (HLB)-affected trees in the field [4].
Agriengineering 03 00002 g001
Figure 2. Heat treatment process of treating HLB-affected tree in the field [4].
Agriengineering 03 00002 g002
Figure 3. Cross-section of the sample with thermocouples installed in the phloem and on the surface.
Agriengineering 03 00002 g003
Figure 4. Installing thermocouples: (a) Drilling a hole and installing thermocouple inside the hole; (b) filling the gap; (c) dealing the hole; and (d) installing thermocouple on the surface.
Agriengineering 03 00002 g004
Figure 5. The temperature variation on the surface (Outside) and in the phloem (Inside) of the five diameter categories during the experimental heat treatment; Very small: Small; Medium; Large; and Very large. (red dashed line illustrates the starting point of injecting steam).
Agriengineering 03 00002 g005
Figure 6. Temperature differences (∆T) for each sample category.
Agriengineering 03 00002 g006
Figure 7. Temperature nephogram through the cross-section of the sample during the heat treatment process.
Agriengineering 03 00002 g007
Figure 8. Temperature nephogram at specific points inside and outside of the sample during the heat treatment process.
Agriengineering 03 00002 g008
Figure 9. Comparison of temperature curves during the heat treatment process between simulation experimental values on the bark surface (Outside) and in the phloem (Inside).
Agriengineering 03 00002 g009
Table 1. Sample properties.
SampleDiameter (mm)Bark Thickness (mm)
Very small5.070.57
Small14.700.64
Medium 125.191.04
Large51.751.75
Very large72.031.82
1 Medium sample was chosen for simulation and comparing with the experimental results.
Table 2. Sample properties for treatment [25].
Parameter (Unit)Value
Density (kg/m3)7 × 102
Transversal thermal conductivity (W/(m·K))17 × 10−2
Convective heat transfer coefficient (W/(m2·K)) [26]158 × 10−1
Specific heat capacity (J/kg·K))2310
Initial temperature (°C)28
Table 3. The mean and standard deviation of temperature differences for each sample category.
Diameter CategoryMean (°C)Standard Deviation (°C)
Very small1.140.64
Small6.521.53
Medium8.351.67
Large9.502.23
Very large11.732.15
Table 4. Comparison of experiment and simulation results during heat treatment.
Time (s)Average Temperature
Experimental ResultsSimulation Results
°C°K °C°K
0Inside24.3297.4Inside25.3298.4
Outside34.2307.3Outside28.0311.1
29Inside24.4297.5Inside30.8304.0
Outside34.8307.9Outside34.8307.9
48Inside24.8297.9Inside33.1306.2
Outside39.0312.1Outside38.7311.9
57Inside37.2310.3Inside35.3308.5
Outside43.3316.4Outside42.4315.5
96Inside39.9313.05Inside40.3313.5
Outside54.3327.45Outside53.8326.9
159Inside39.4312.1Inside40.5313.6
Outside54.9328.0Outside53.9327.0
209Inside41.2314.3Inside42.0315.1
Outside54.9328.1Outside53.2326.3
260Inside39.9315.0Inside40.3313.4
Outside53.5326.6Outside54.0327.1
310Inside37.2310.3Inside36.7309.8
Outside43.3316.4Outside41.0314.1
Publisher’s Note: MDPI stays neutral with regard to jurisdictional claims in published maps and institutional affiliations.

