1. Introduction
The accurate application of plant protection products (PPP) is an essential prerequisite for obtaining the maximum effectiveness of pest and disease control, reducing the impact on the environment, safeguarding the health of operators, and obtaining a quality product, free from pesticide residues. In order to achieve these objectives in operational practice, the efforts of the farmer generally aim to choose the appropriate PPP to apply, calculate the best time to distribute them, and strictly adhere to the indications contained on the product label. However, especially in recent years, the importance of the role played by the equipment used for the application, its efficiency, and its use have been clearly highlighted. This vision is emphasized by the European Directive 128/08, which led to the issuance in the member countries of NAPs (National Action Plans on the sustainable use of plant protection products), which provide for specific actions regarding the use of sprayers and the application phase of the product. In this context, the drift of PPP is a critical element in the management of plant protection.
The drift constitutes the portion of the pesticide that is dispersed as fine droplets or vapor in the air at the time of treatment or immediately after it [
1], and it includes endo-drift, which is loss within a treated field but not on the intended target, and exo-drift, the movement of spray droplets beyond the edge of a treated field [
2]. The phenomenon is notoriously influenced by multiple factors and, although it can be reduced, it is very likely that it will not be completely eliminated. However, technologies and systems are now available to mitigate the drift effects [
3,
4]. The management of the PPP application is the first and most obvious measure to obtain the maximum level of reduction, even if the training and pruning systems, the planting distances, the cultivation environments, and the location of the plants are to be taken into consideration. These practices include the choice, maintenance and functional verification of the sprayer machine and its components (with particular regard to the nozzles), and the adjustment (or calibration) of the machine distribution parameters according to the specific treatment to be carried out [
5]. Furthermore, regardless of the systems adopted to reduce drift, the quality of the product application must always be evaluated, which must ensure that the vegetation is adequately protected.
Air induction (or air inclusion) nozzles can increase the droplet size, and are less susceptible to drift due to mixing air with the spray liquid. The peculiar design of these nozzles causes a reduction in the fluid pressure inside the nozzle body so that air is drawn into the nozzle (the Venturi effect) through holes in the nozzle side, which is then mixed with the spray liquid [
6,
7].
As regards the applications in hazelnut, the technical–scientific literature is rather lacking [
8,
9]. The pesticide application in this crop can be challenging because traditionally-trained hazelnut orchards have large and dense crowns, and operators prefer to carry out treatments with a high level of spray pulverization, a feature which is not assured by low-drift nozzles. However, drift-reducing nozzles, already widely used for field crops, have also been proven effective in application on many tree crops, such as apples [
10,
11,
12,
13], citrus [
14,
15], and vineyards [
16,
17].
Hazelnut is a major species of interest for nutritional use, and it is the second most economically valuable commercial tree nut crop, after almond. In 2019, hazelnut covered a surface of more than one million of hectares world-wide [
18]. Production is mainly concentrated in two countries: Turkey (ca. 70% of the world’s production) and Italy (10–15%). In recent years, in Italy, a positive trend in hazelnut cultivation has been occurring [
19]. In 2020, the crop covered an area of 88,474 ha [
20], and the Province of Viterbo (Central Italy) contributed with around 1/3 of the national production [
19].
The aim of this work is to compare the quality of application of hydraulic conventional nozzles (core disks and ATR) with two types of low-drift nozzles (cone and flat-fan air induction nozzles). The endo-drift of the treatments was also assessed by evaluating the distribution quality on non-target trees adjacent to those treated. Moreover, the pesticide application on hazelnut is so far poorly investigated and related studies need to be expanded.
2. Materials and Methods
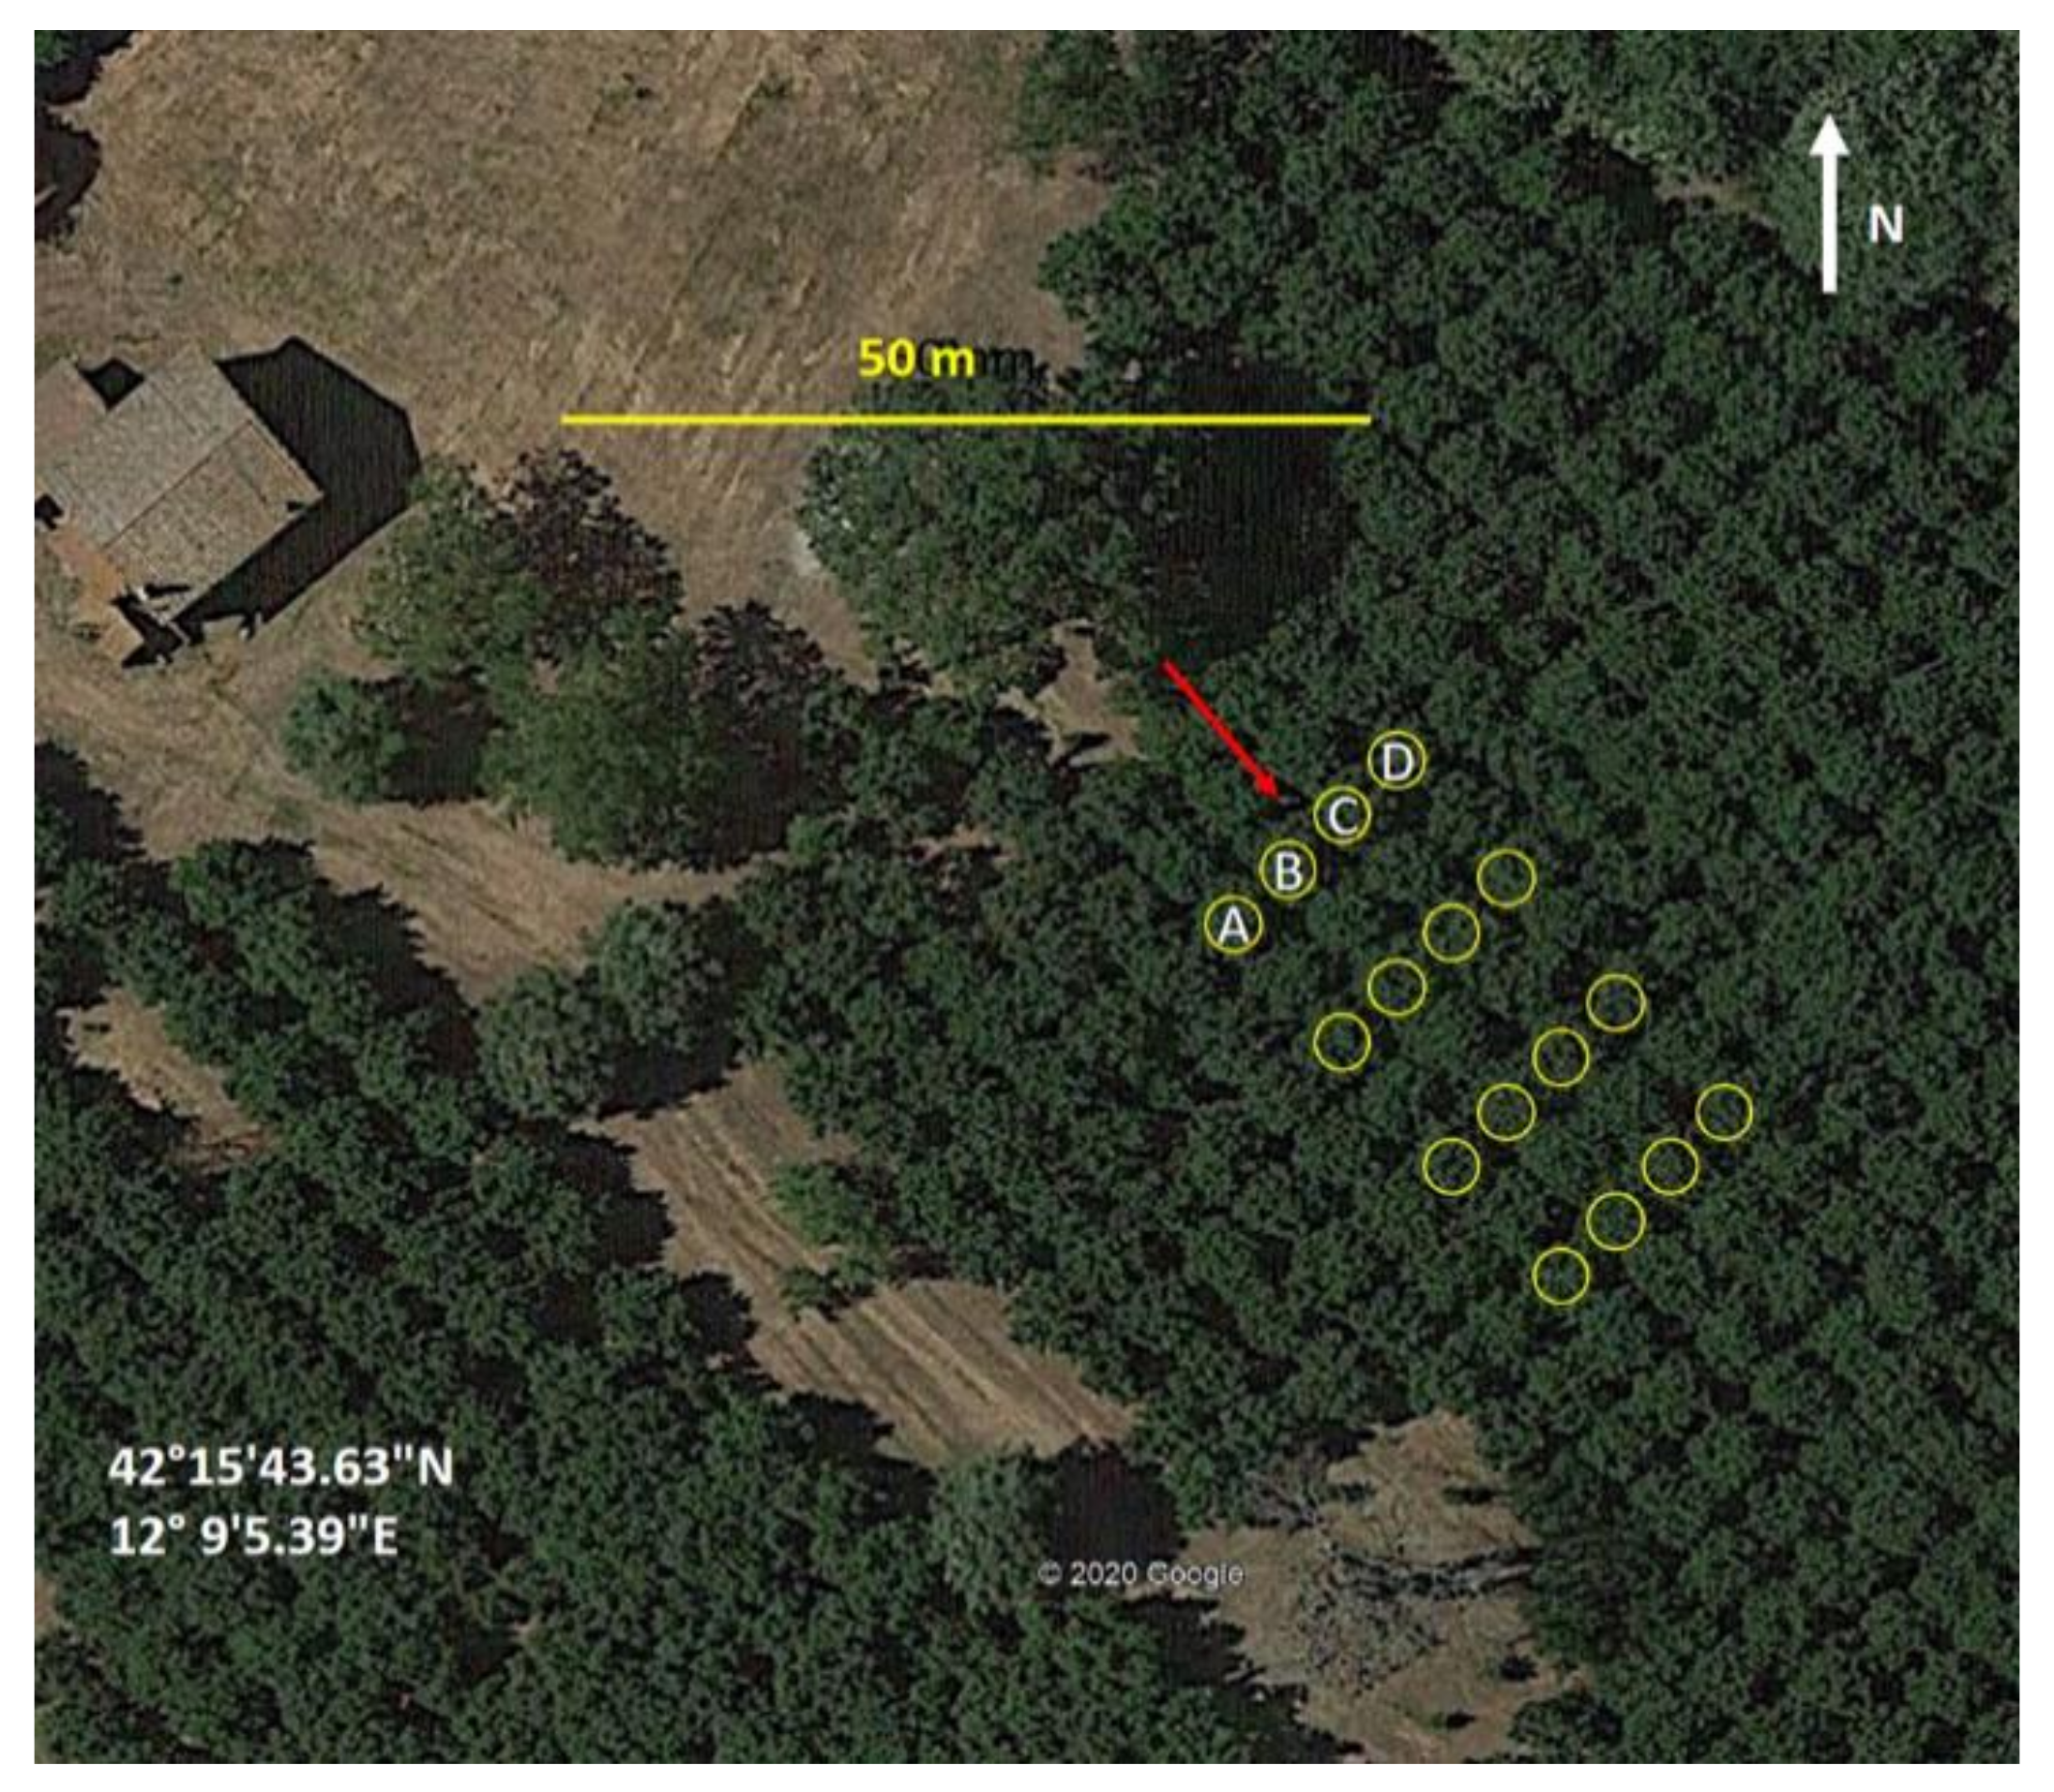
The experimental tests were carried out in an hazelnut grove (
Corylus avellana L., var. Tonda Gentile Romana), with a 5 × 5 m layout and a height of about 6.5 m, located in the Viterbo Province, Central Italy (42°15′43.63 N; 12°9′392 E) (
Figure 1). The trees were trained as a multi-stemmed V-shaped shrub, with 4-5 stems per plant, as is typical of the area. The plants showed uniform vegetative growth. The trials were carried out in July 2020, when the plants reached a full growth stage.
Before planning the experimental design, information on regulation of the sprayers adopted in the area was collected. Moreover, the research group was advised by the local technicians and farmers both on the conventional adopted setup of the sprayer and on the main technical issues of the pesticide application in hazelnut orchards in the region.
The samplers (water sensitive papers–WSP) for the evaluation of the spraying were placed on four plants 10 m apart on each of the four adjacent rows (A, B, C and D) chosen inside the orchard. The sprayer travelled between the central rows (B and C) by spraying the plants with water, according to the four test configurations (
Figure 1). The plants on adjacent rows (A and D) were not sprayed, and the distribution analyses of the WSP placed on these plants provided the data for the endo-drift evaluation.
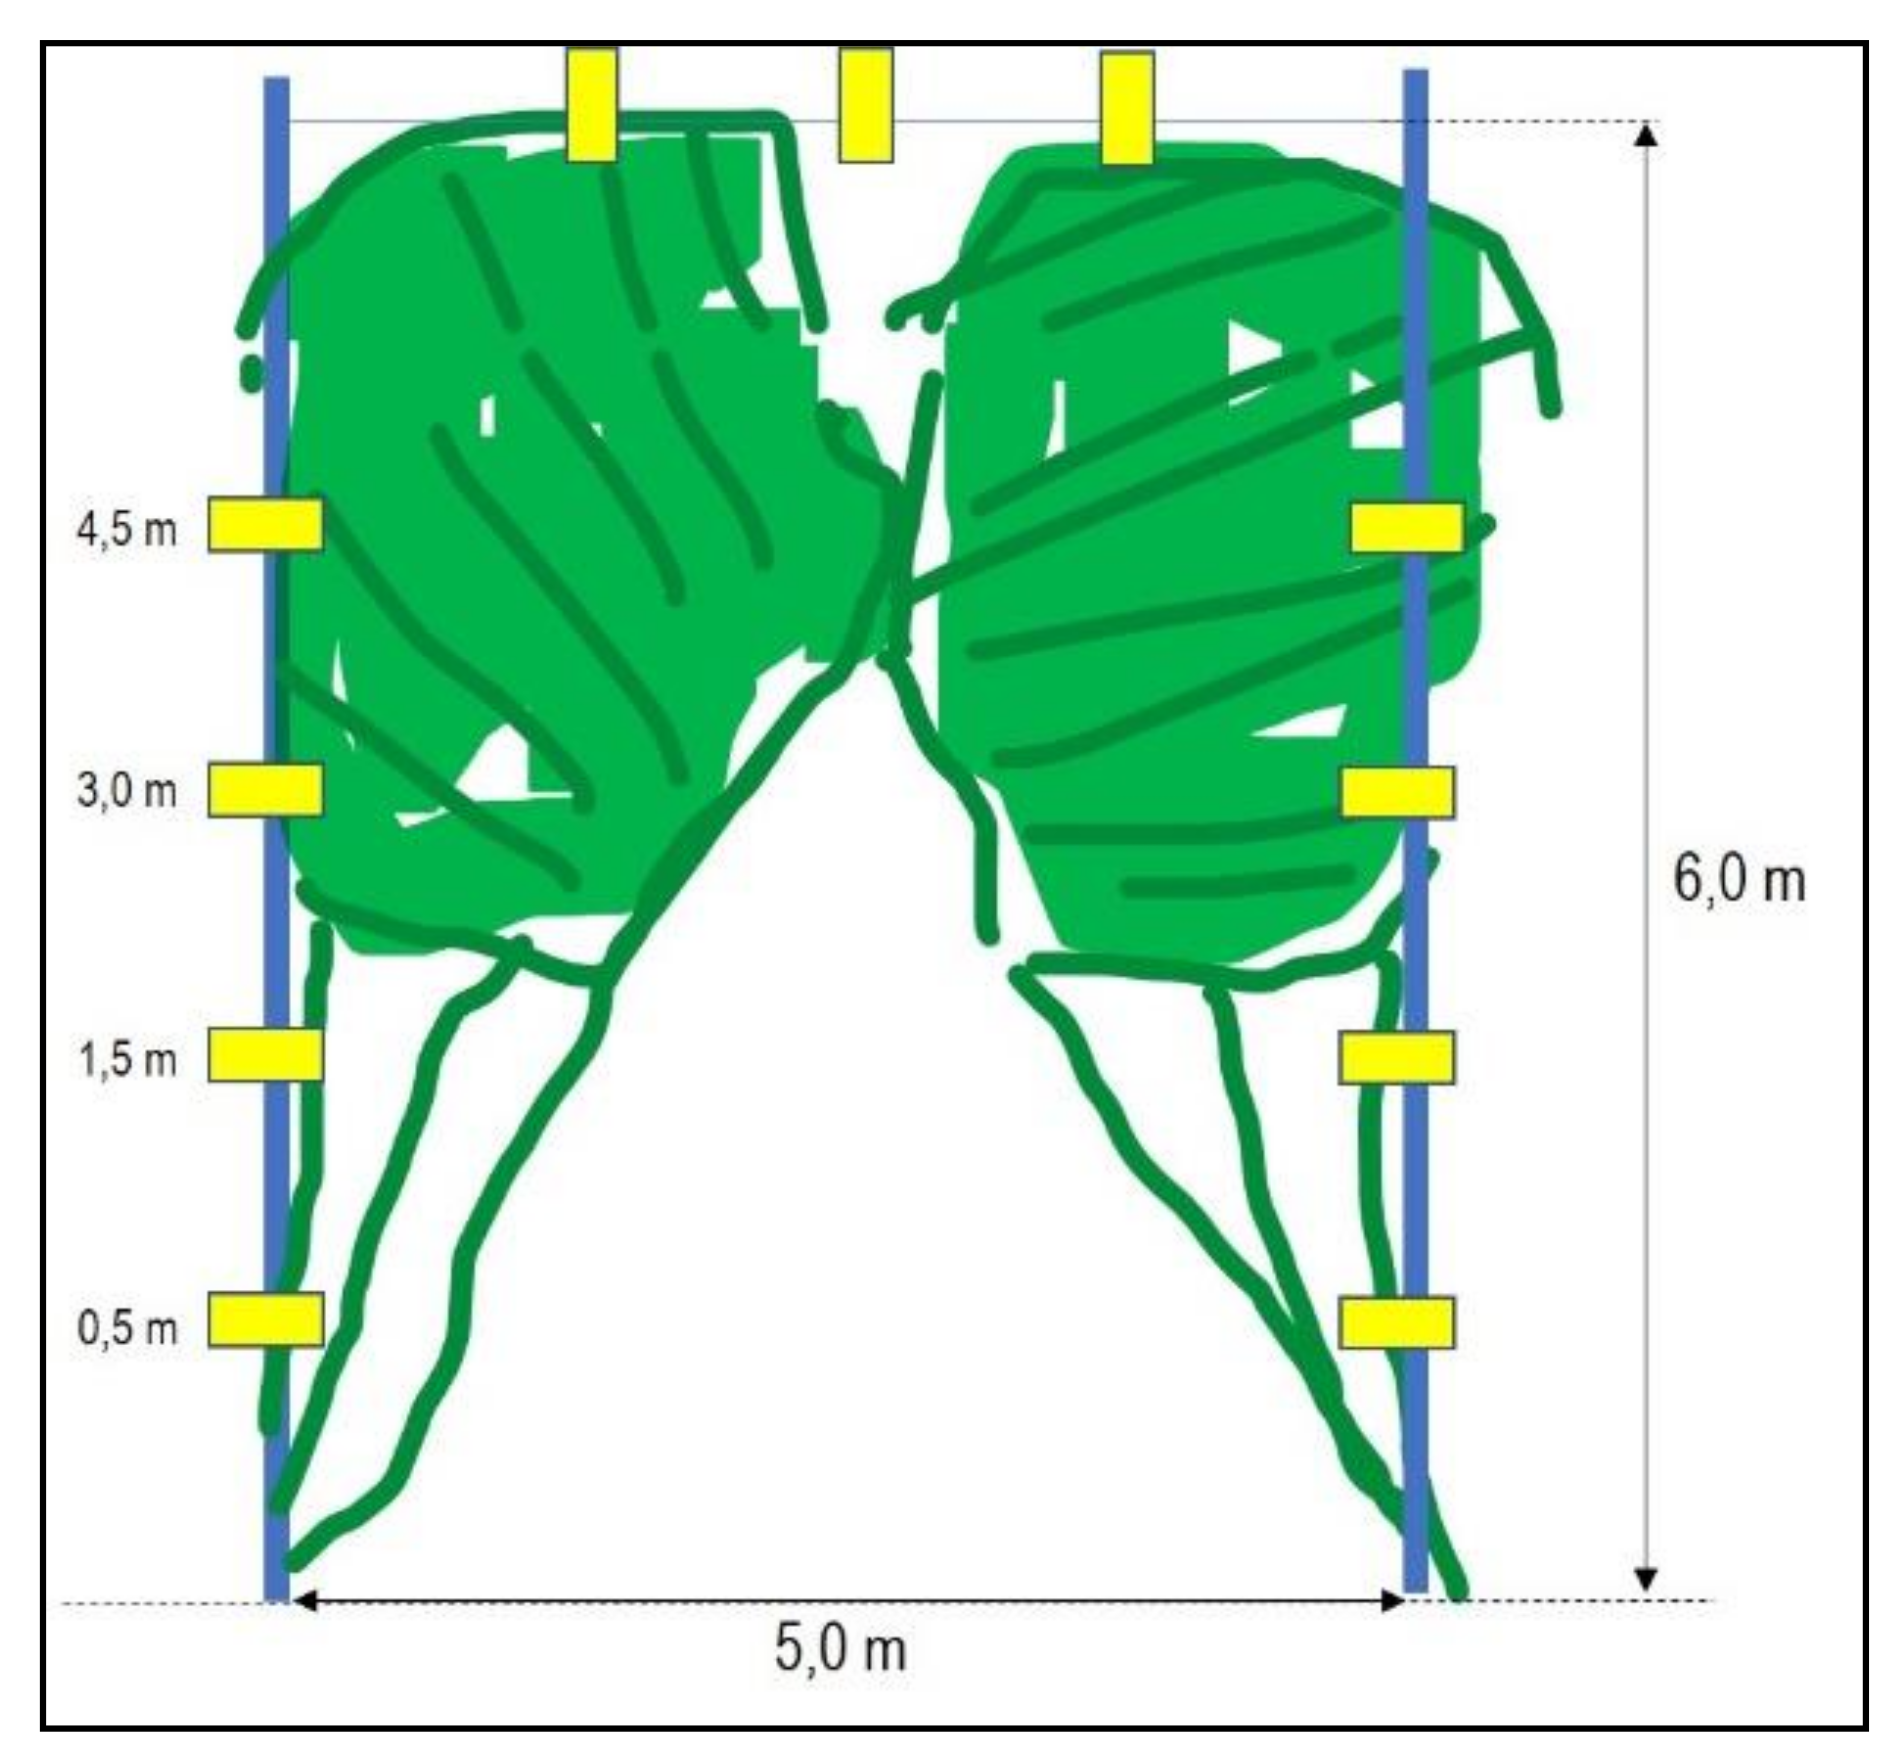
The assessment of the deposition and losses was carried out by means of 7 × 10 cm WSP (Syngenta), placed on vertical metal rods according to the following scheme: on each of the four plants of the central rows (B and C) four WSP were placed at a height of 0.5, 1.5, 3.0, and 4.5 m from the ground, while on the lateral rows (A and D) three WSP were placed at 5.0, 1.5, and 3.0 m (
Figure 2). In addition, three other WSP, spaced about 0.8 m apart, were suspended from a wire placed between the plants of the central rows, at a height of 6.0 m, for a total of 12 sampling points. A total of 72 sampling points was thus obtained for each treatment.
The analysis of the number of the impacts detected on the WSP allowed us to calculate the number of droplets per cm
2, and to assess the spray coverage quality [
21,
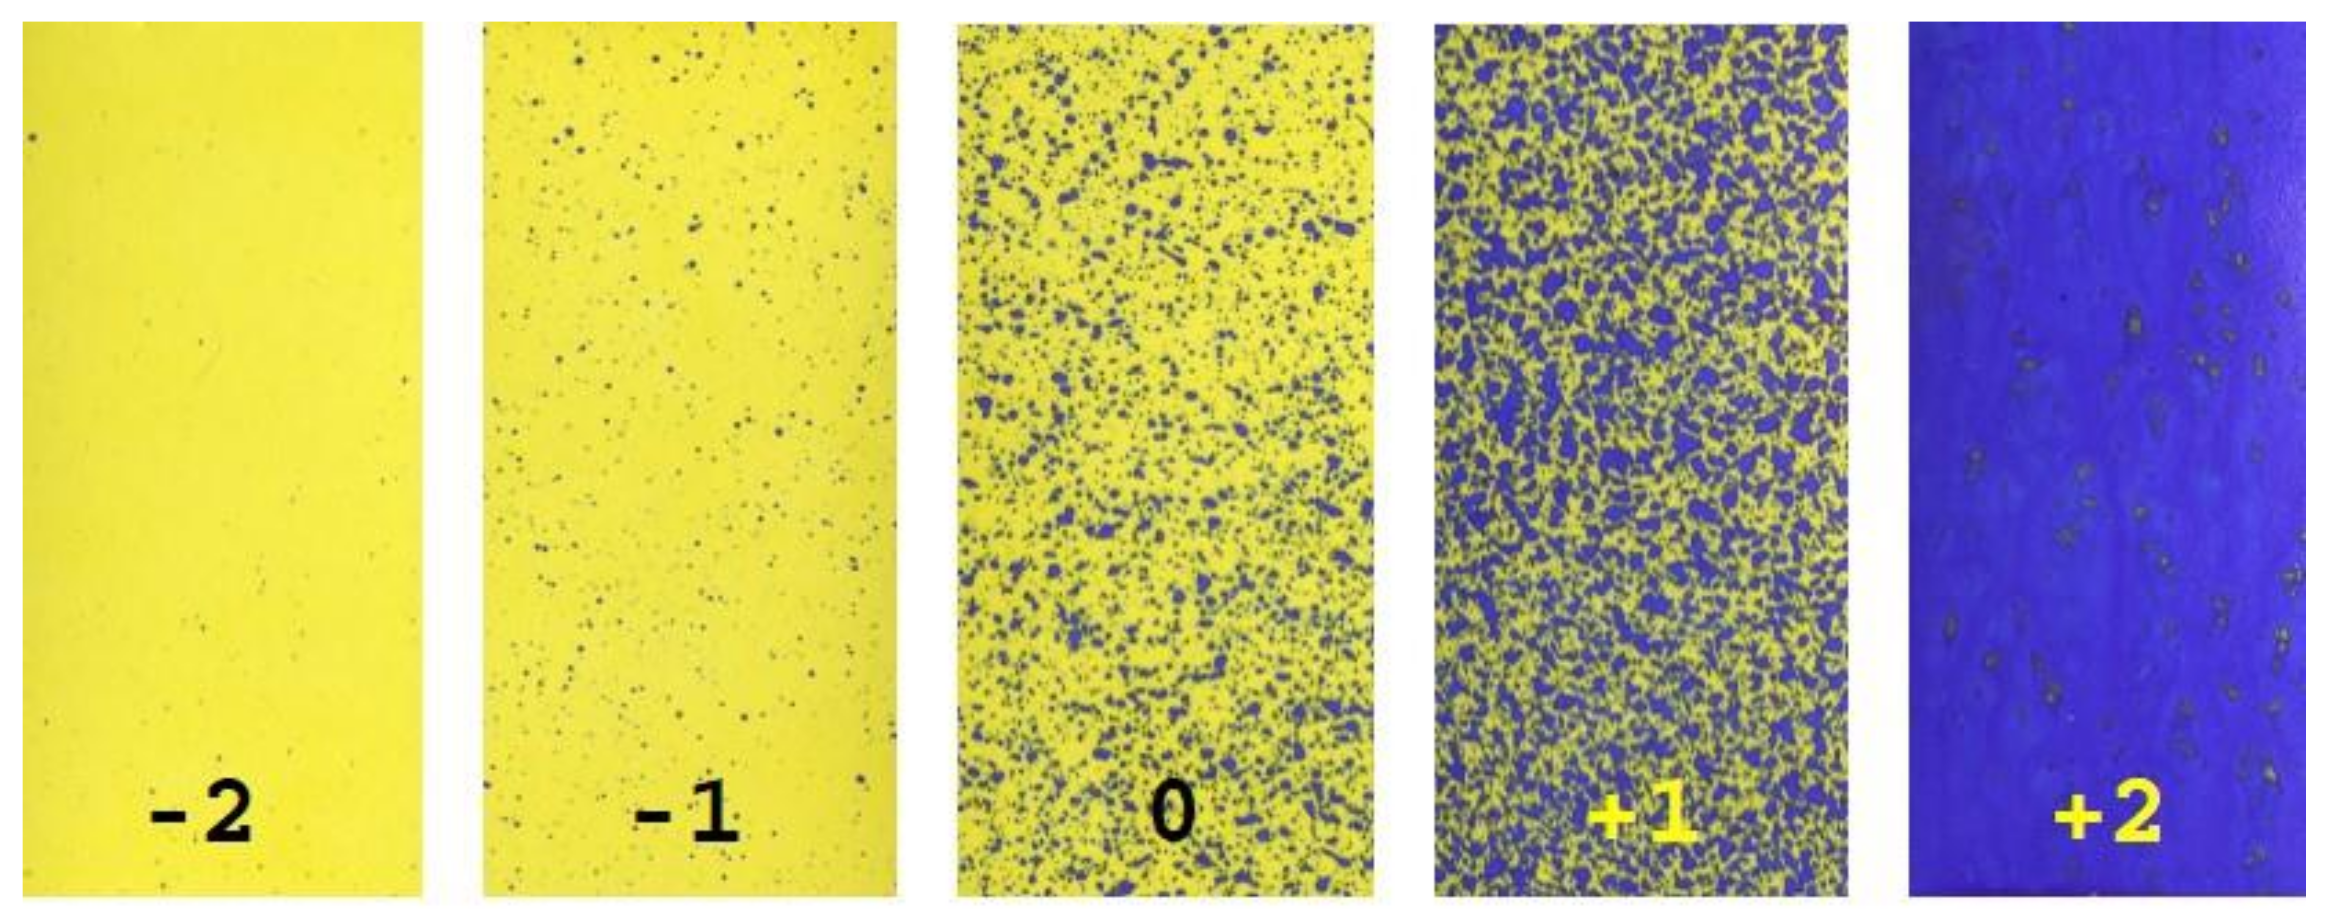
22]. The analysis of the WSP was carried out by two methods: (1) by attributing a qualitative score rating of the degree of coverage after a visual reading of the WSP (
Figure 3), and (2) by means of a computer-assisted image analysis, carried out after the digitization of the WSP images using a specific MATLAB routine developed at CREA-IT, which uses a supervised segmentation method based on K-Nearest Neighbors (KNN) multivariate clustering [
23,
24]. Such a routine allows the automatic counting of the impact stains once the image is segmented. The score attributed through visual analysis is the average of the scores assigned by two researchers who operated independently during the rating of the coverage quality scores. The score rating varied up from −2 (insufficient coverage) to 2 (excessive coverage), by integer values; the score is considered optimal when the values approach 0 (
Figure 3). In general, good distribution occurs when the spray spots are well distributed on the WSP but not overlapping, as an index of a uniform distribution.
An air-blast sprayer with an axial fan (F.lli Muzzi, model RC15S) with a 1000 L tank, pulled by a Massey Ferguson 3660F (Xtra) tractor, was used for the tests.
The sprayer configurations adopted in the experimental field tests are summarized in
Table 1. The following nozzles were used: cone disk core (ceramic) 1.2–1.2; ATR cone 80°, ISO (green); cone low-drift TVI 80° 02 (yellow) and 04 (red); flat-fan low-drift CVI 80° 02 (yellow) and 04 (red); all of the nozzles were made by the company Albuz.
Before trialing the flow rates of the nozzles, the actual operating pressure and the vertical distribution diagrams were determined for each sprayer configuration. For this last purpose, a vertical tray test bench (AAMS-Salvarani mod. 904520) with 14 mounted plates was used. An adjustment of the vertical distribution was made before the ‘V’, ‘R’ and ‘X’ trials, while the configuration ‘P’ was considered the usual sprayer’s setup, and no vertical distribution adjustment was made. Only in one test (‘V’, the one with ATR cone traditional nozzles) the sprayer’s fan speed was set on position 1, obtaining a reduction of the air speed and volume provided by the fan.
The micrometeorological conditions during the tests were continuously monitored by a Kestrel 4500 portable weather station.
The data regarding the coverage quality and the number of droplets per cm2 obtained from the WSP placed on the plants of the two central rows (B and C) of the experimental plot were analyzed in order to assess the quality of the spray distribution. The data coming from the two adjacent rows (A and D) gave information relating to the potential drift. Then, the data of the 12 WSP placed at 6 m from the ground, between rows B and C, were analyzed in order to obtain an evaluation of the spray deposition in the upper part of the crown.
The statistical elaboration of the data was performed with the software R [
25].
3. Results
During the trials, the air average temperature was 27.8 °C, the wind remained stable (with an average wind speed of 0.7 m s−1), and the relative humidity was 51.8%.
The four different configurations tested provided similar values of volume rate, which ranged from 318 to 409 L/ha (
Table 1).
After a preliminary statistical test on the variables’ distribution, the values of the number of droplets per cm
2 and of the visual scores of the WSP were found not to be normally distributed after the Shapiro–Wilk test, which examines whether a variable is normally distributed in a population [
26]. Therefore, in order to analyze the data set and compare the differences in the average values of each test, a statistical non-parametric test—namely the Kruskal–Wallis test—was applied. This test is the non-parametric equivalent and rank-based test of the one-way analysis of variance (ANOVA) [
27].
The visual scores and the number of droplets per cm
2 of the WSP are showed in
Figure 4,
Figure 5, respectively.
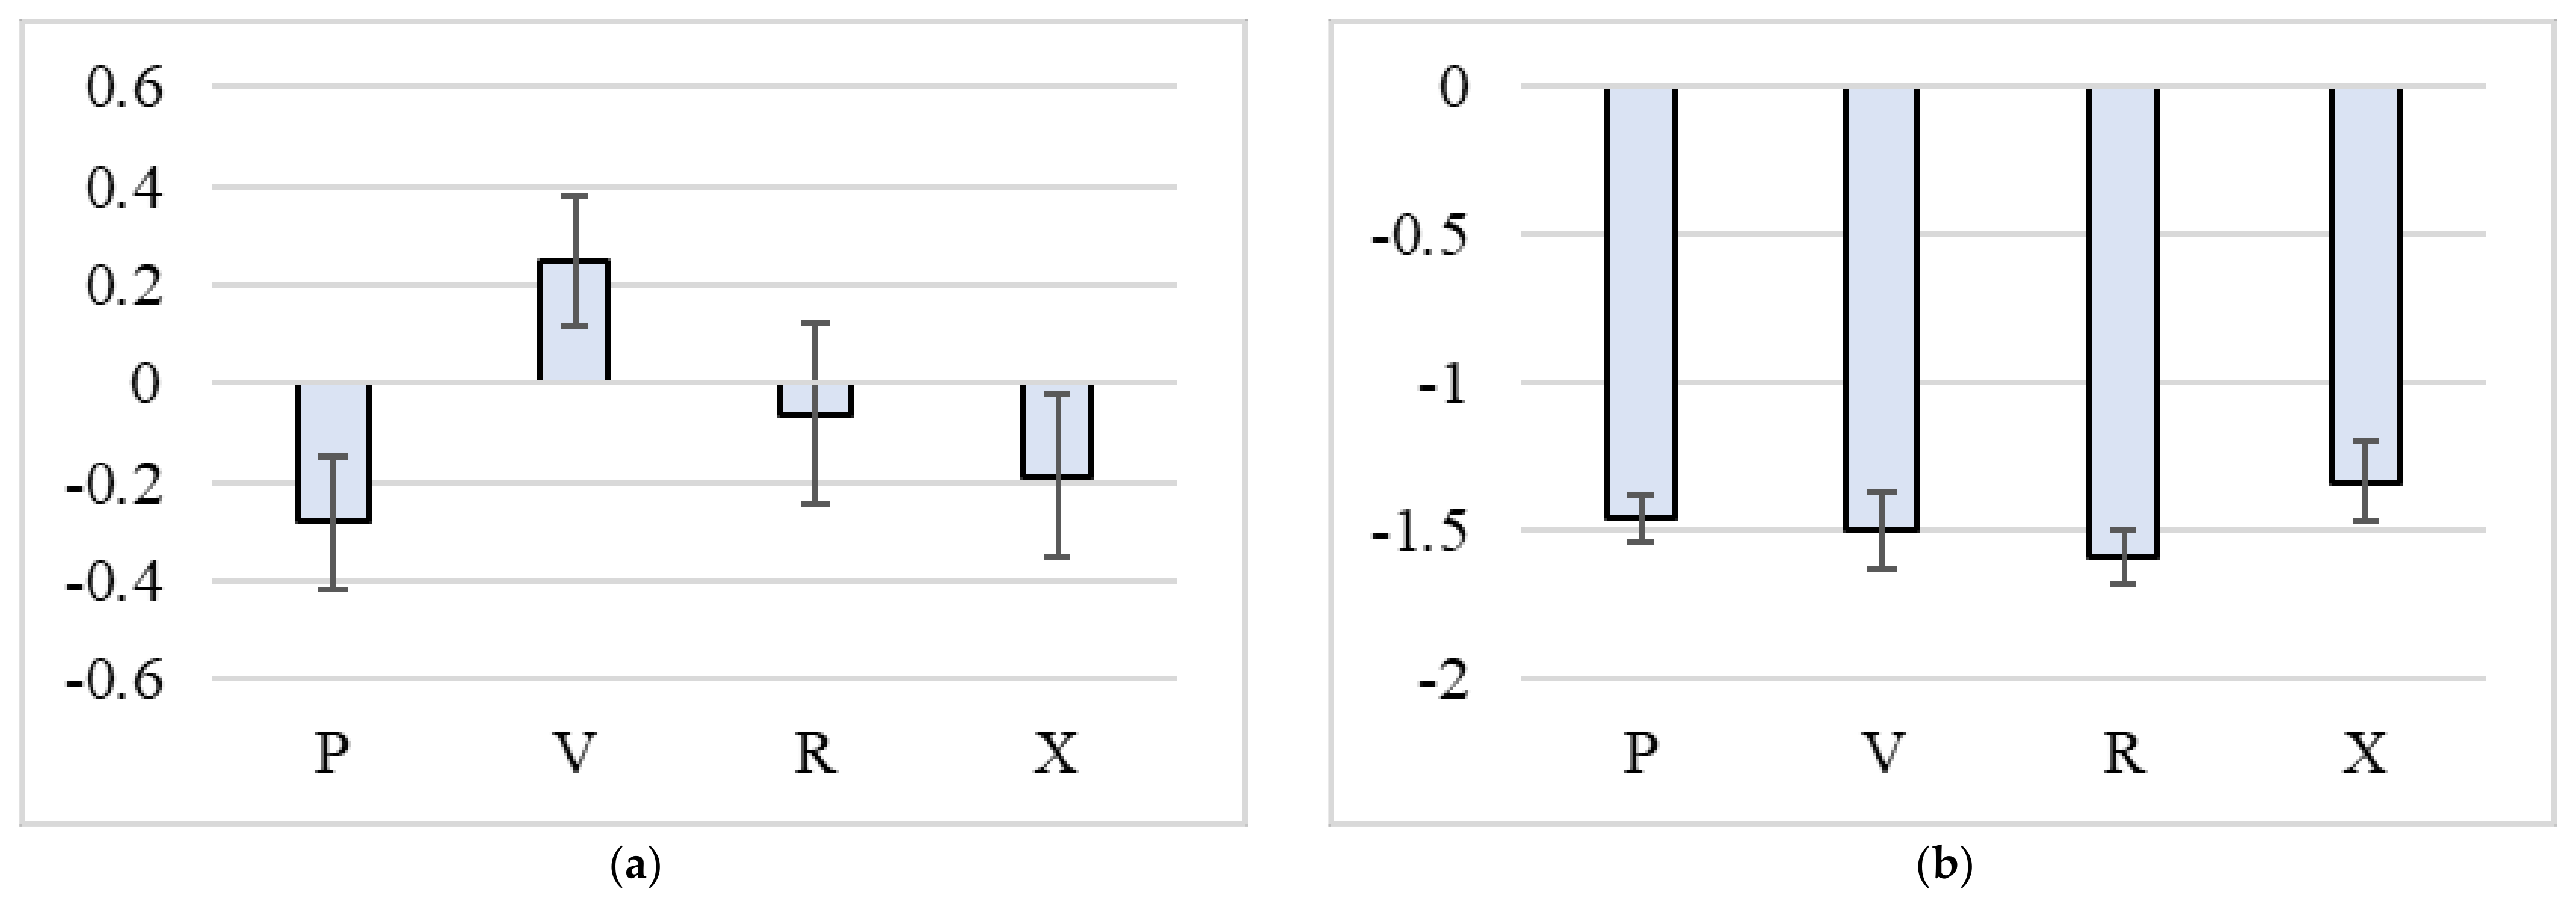
In terms of quality coverage, rated assigning a visual score ranging from −2 to 2, the best result was obtained with the treatment ‘R’, which employed the cone low-drift nozzles (
Figure 4a), which gave a score closer to 0 (ideal coverage quality). However, after the Kruskal–Wallis test, these differences were proven not to be significatively different (
Table 2). The homogeneity of the treatments was even more clear after evaluating the endo-drift of the treatments, assessed by the rating of the WSP placed in the rows adjacent to those treated (
Figure 4b). In this case, all of the WSP presented similar average scores.
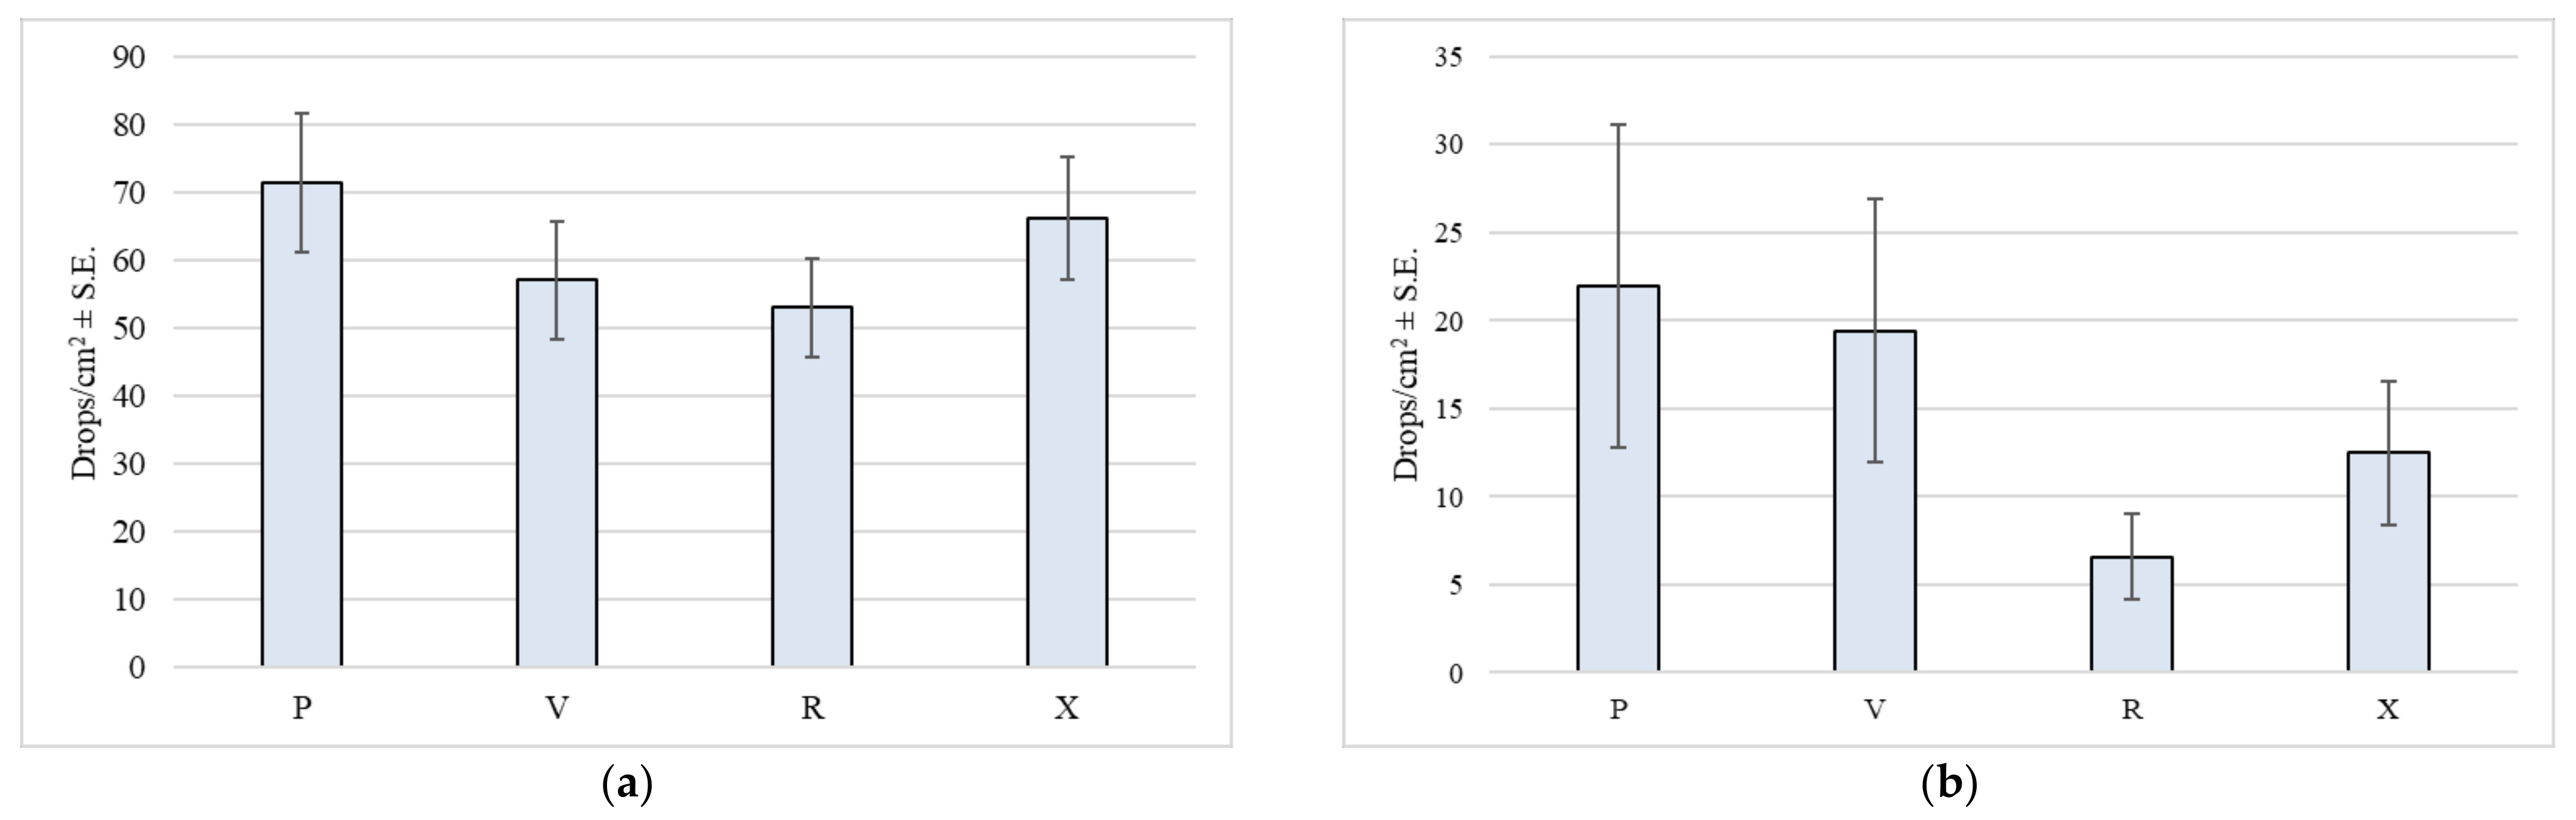
The average number of the impacts per unitary area shows that the four types of tested nozzles gave similar results in the target rows (central rows,
Figure 5a). Regarding the evaluation of endo-drift carried out on the adjacent rows (
Figure 5b), the treatments with low-drift nozzles clearly showed the lowest number of impacts on the WSP, even though also these figures are not statistically different.
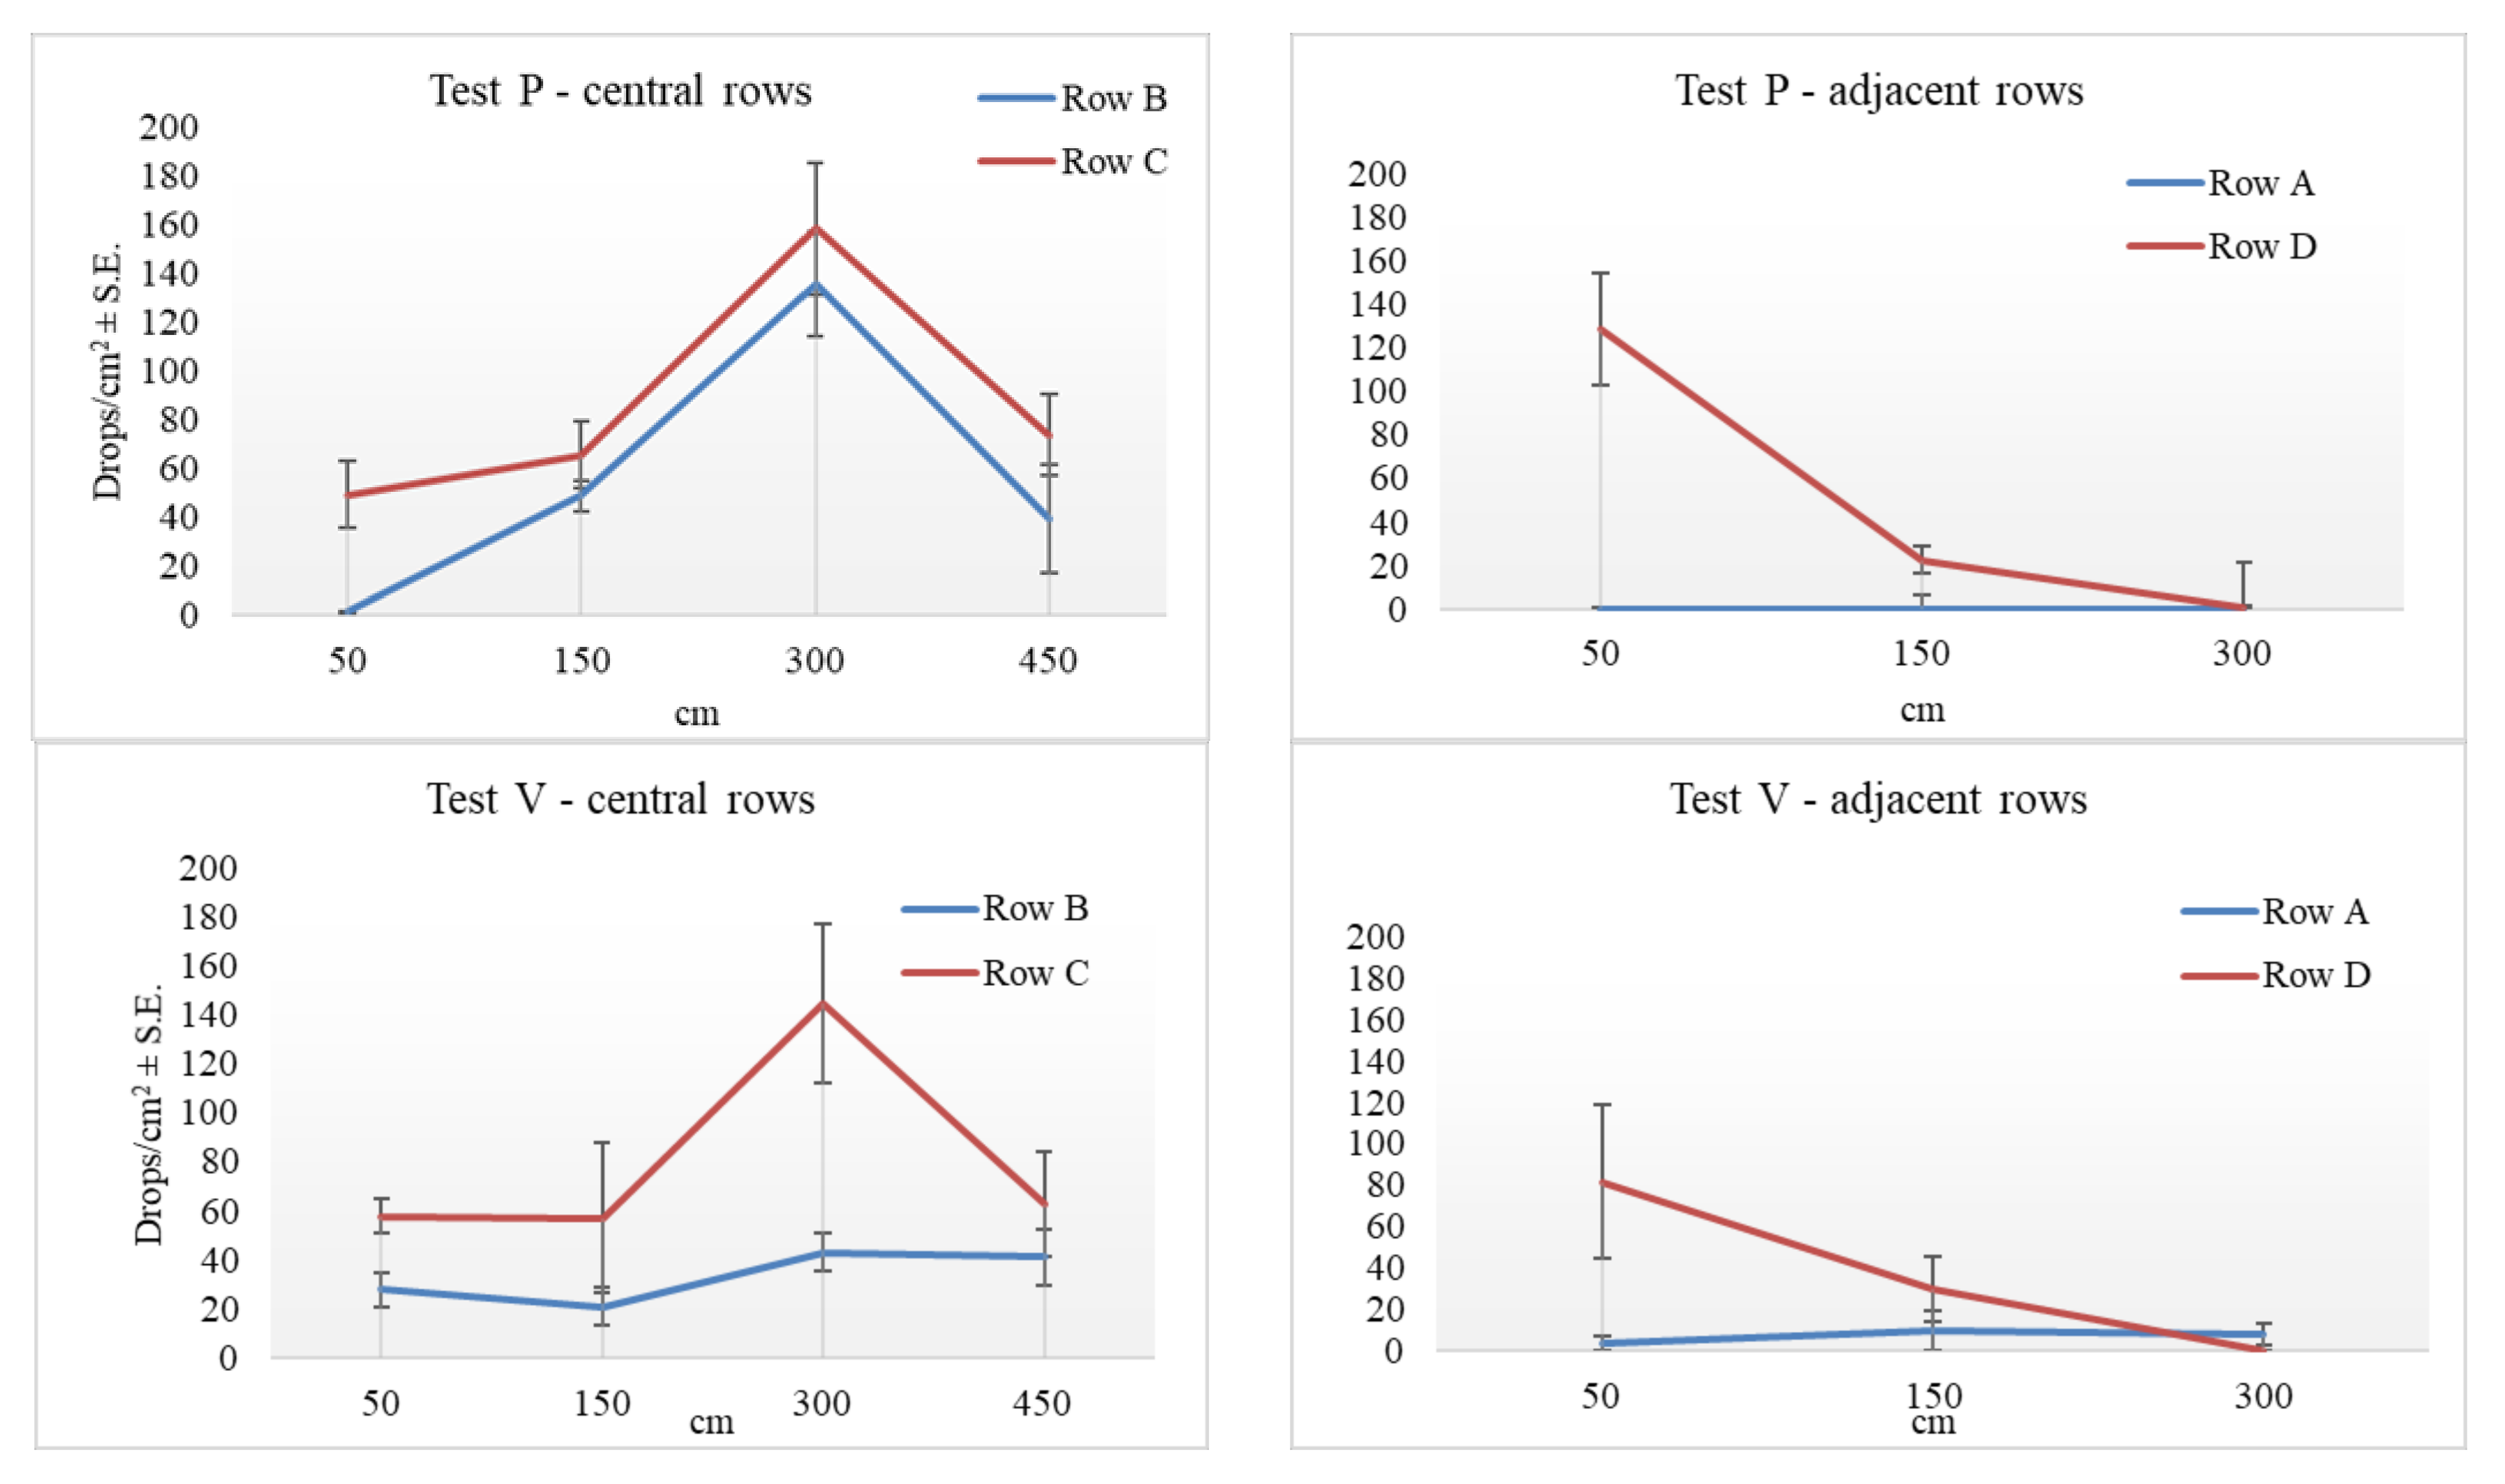
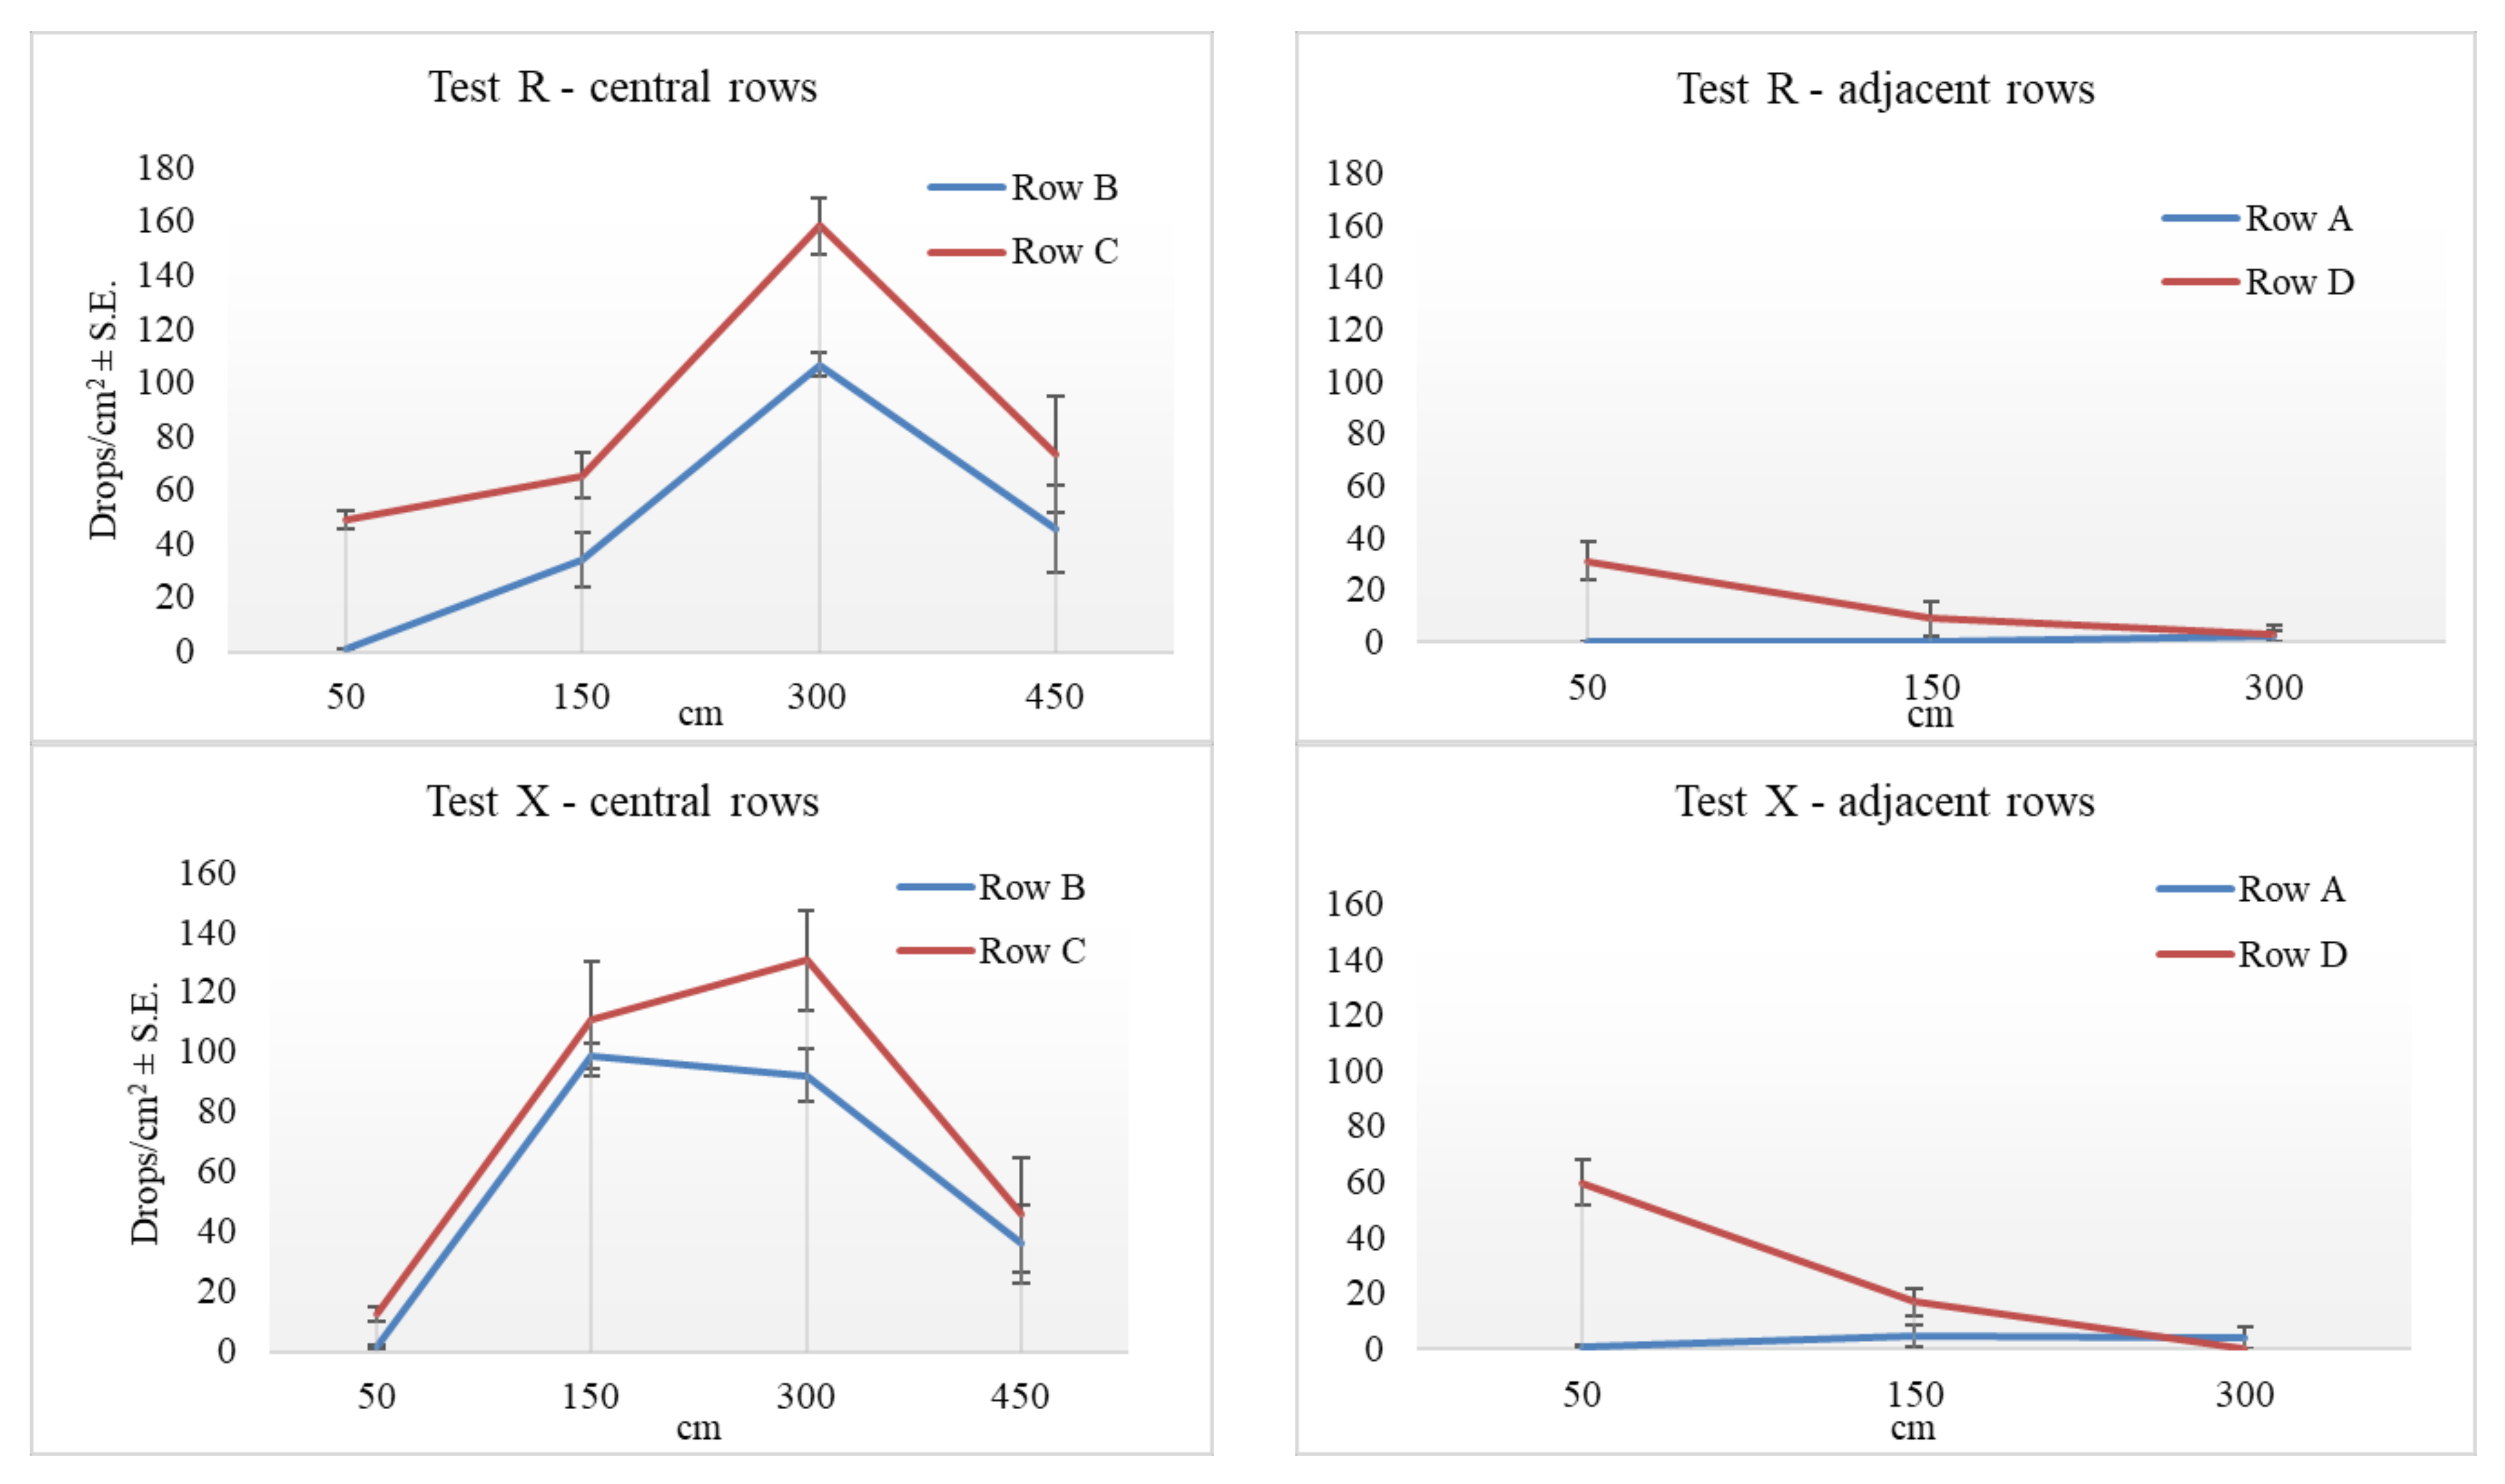
The results in terms of the number of droplets per cm
2 is shown in detail in
Figure 6, in which the values are reported for each row of plants. In this case too, no statistically significative differences among the treatments was observed (
Table 2). However, the treatment ‘X’ which utilized the flat-fan low-drift nozzles, showed a better result in the samples placed at 150 cm of height, a position where the coverage of the vegetation is particularly needed. The treatment ‘R’, the one with cone low-drift nozzles, showed the best results in terms of drift reduction, with the lowest number of droplets per cm
2.
All of the treatments show a peak of impacts per cm2 in the row ‘D’ (those on the right of the treated zone, watching the plot from behind), especially at 50 cm of height.
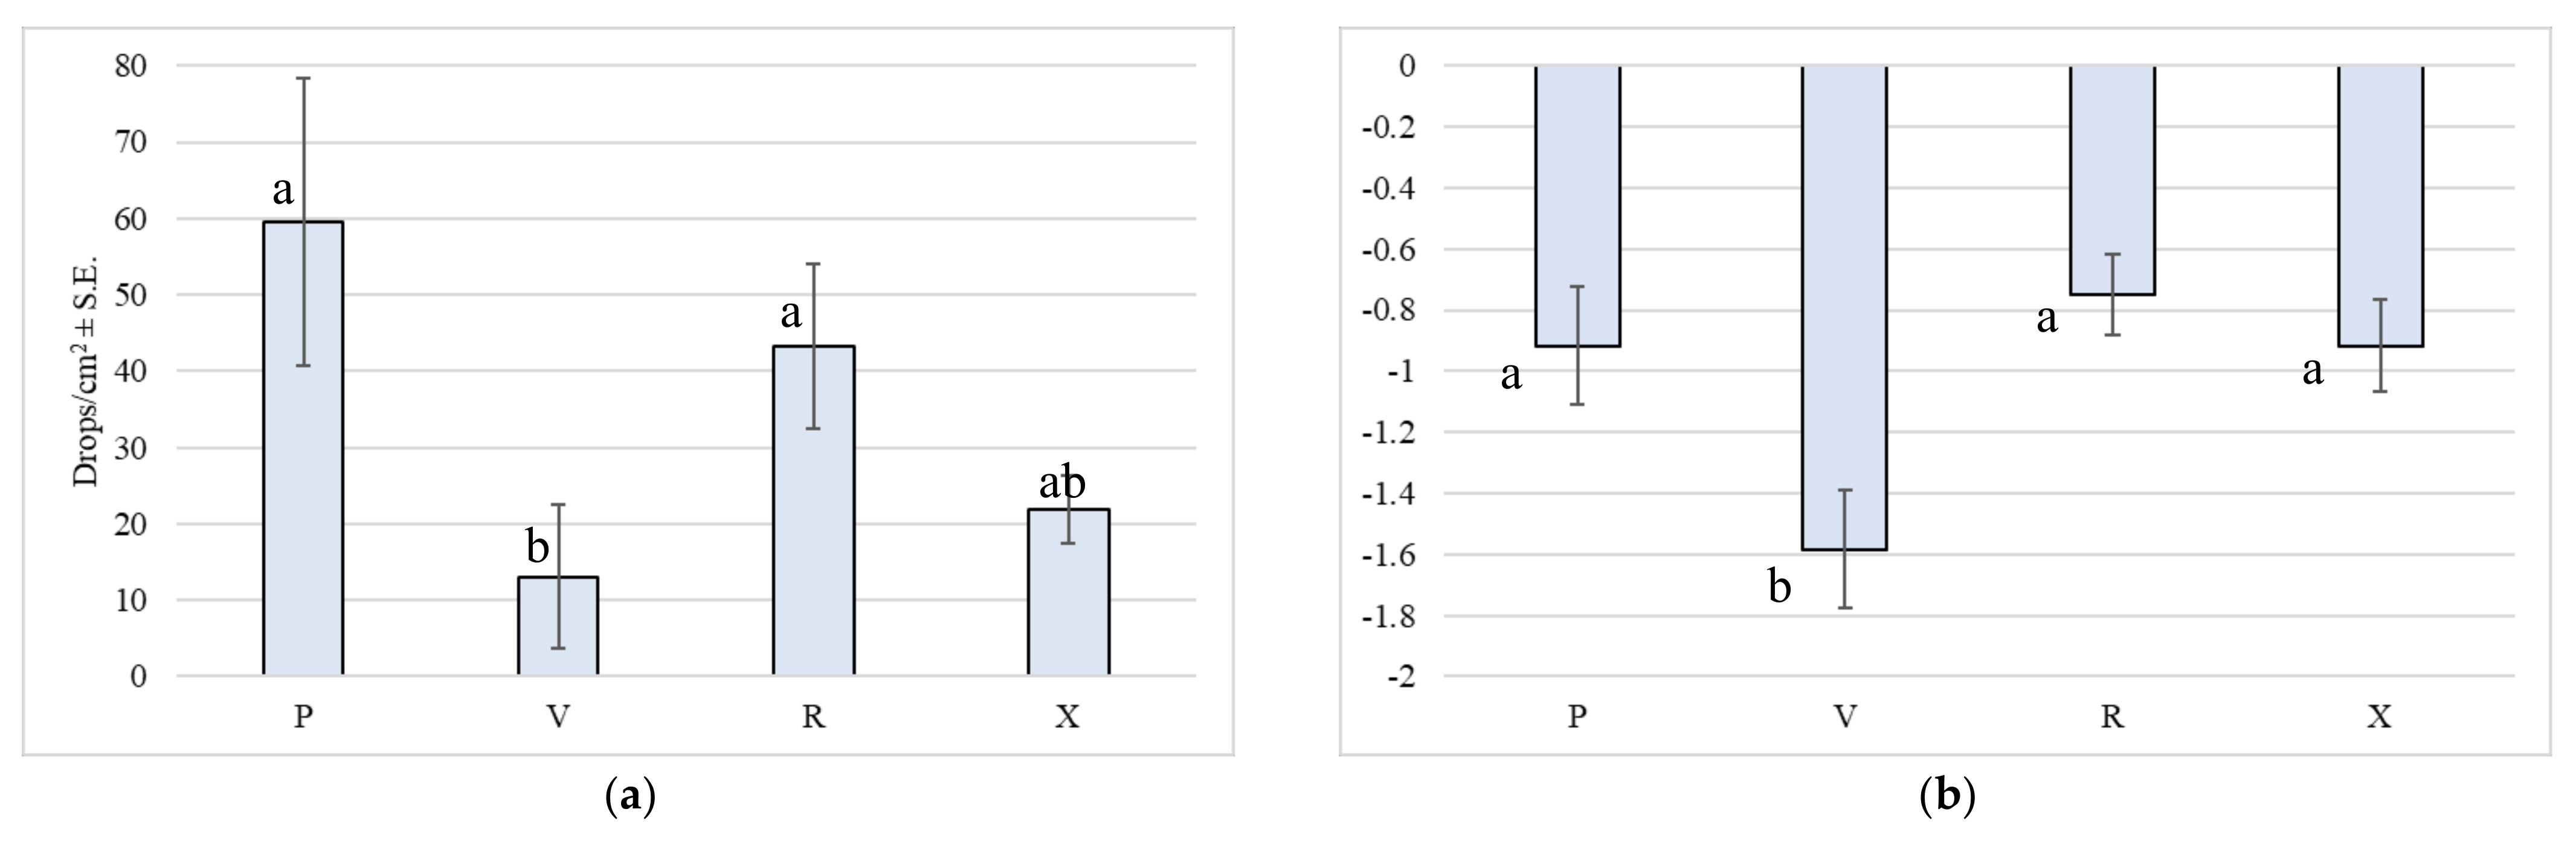
Regarding the results of spraying in the upper part of the trees, evaluated by means of the WSP placed at 600 cm of height, the results in terms of droplets per cm
2, and of the visual quality scores, are summarized in
Figure 7. In this case, the differences are statistically significative, with the worst result provided by the treatment ‘V’ (ATR nozzles), which appears to be unable to correctly cover the tops of the plants (
Table 2).
4. Discussion and Conclusions
The present work tested four different sprayer configurations in order to compare low-drift and traditional nozzles for the treatment of hazelnut. The pesticide applications in this crop are mainly challenged by the crown shape and size of traditionally-trained orchards. Farmers usually tend to obtain a fine pulverization of the spray when they try to reach the upper part and the inner portions of the vegetation. However, this method can lead to an increase of drift, with pesticide losses outside of the treated field. Air induction nozzles can overcome this inconvenience because they produce coarser and heavier droplets, which are less affected by the aerial lift. Numerous scientific and technical studies have shown that low-drift nozzles can also guarantee an adequate protection in tree crops. However, information on the utilization of this category of nozzles in pesticide application in hazelnut is rare. Moreover, given the particular geometric conformation of the crowns of the hazelnut, which is traditionally trained as a multi-stemmed V-shaped shrub, it is not easy to transfer the acquisitions deriving from experimental tests made on other tree crops. Experimental tests are consequently needed.
Generally, the obtained results showed that the coverage quality and the number of droplets per surface unit were statistically comparable for both low-drift and conventional nozzles. The four tested configurations entailed a similar volume rate per hectare and the same working pressure. Only the configuration ‘V’ (with traditional cone ATR hydraulic nozzles) showed a scarce capability to reach the upper part of the vegetation, even if this treatment utilized at the highest volume rate (409 L/ha). This result is easily explained by the fact that the configuration ‘V’ was the only one with the setting of the sprayer’s fan to position ‘1’, which produces a reduced air speed and volume.
Regarding the evaluation of the endo-drift conducted on the adjacent rows (
Figure 5b), the treatments with low-drift nozzles clearly showed the lowest number of impact stains on the WSP, with a greater reduction achieved by the test ‘R’ with cone low-drift nozzles. However, these figures are not statistically different, likely because the obtained data were highly variable according to the height of sampling. In particular, all of the treatments show a peak of impacts per cm
2 in the row ‘D’ (those on the right of the treated zone, watching the plot from behind), especially at a height of 50 cm. This phenomenon is due to the strong asymmetry of the spraying towards the right (being the direction of rotation of the fan clockwise) caused by the typical effect of the axial fan, which blasts the air asymmetrically on the right and left side of the vegetation. The adjustment of the vertical pattern distribution can be achieved using a vertical test bench. However, such a defect was only partially mitigated by the adjustment made with the test bench for the configurations ‘V’, ‘R’ and ‘X’, because the asymmetry of the distribution remained clearly visible on the WSP.
The adopted experimental scheme allowed us to investigate the penetration of the drops at a height that is not frequently examined in experimental spraying tests, which is instead considered of particular interest for the phytoiatric efficacy of the treatment. As for the results obtained by examining the WSP placed at a height of 6 m, in the upper central area of the vegetation, the use of the anti-drift nozzles did not give any problem, and the coverage quality appeared to be even better than that produced by traditional nozzles. In detail, at a height of 6 m, the coverage provided by the ‘V’ treatment (with a reduced fan speed) turned out to be the worst.
In conclusion, the present work showed some low-cost technical solutions which are easily transferable to farmers, i.e., the low-drift nozzles appeared to assure—in the studied conditions—a regular spray coverage of the vegetation and a reduction of the drift during treatments to hazelnut. In order to obtain a more complete picture, the next stage of this research entails the study of biological data on insect and disease control.
Author Contributions
Conceptualization, M.B. and P.G.; methodology, M.B. and P.G.; investigation, M.B. and P.G.; data curation, M.B. and F.P.; writing—original draft preparation, M.B.; writing—review and editing, M.C, E.R. and F.P.; visualization, M.B., M.C. and E.R.; supervision, M.B.; funding acquisition, M.B and P.G. All authors have read and agreed to the published version of the manuscript.
Funding
This research was funded by the organization CO.PRO.N.T., Ronciglione (VT), Italy.
Acknowledgments
The authors are grateful to Gianluca Santinelli of the Cooperative ‘CO.PRO.N.T.’ of Ronciglione (VT), who provided the experimental field; Francesco Violani and Patrizio Pinna of the company ‘Fra.Vi.’, who collaborated in the adjustment and regulation of the sprayers; and to Massimiliano Mochetti of the company ‘Braglia s.r.l.’, who provided the nozzles for the tests.
Conflicts of Interest
The authors declare no conflict of interest.
References
- Zivan, O.; Bohbot-Raviv, Y.; Dubowski, Y. Primary and secondary pesticide drift profiles from a peach orchard. Chemosphere 2017, 177, 303–310. [Google Scholar] [CrossRef] [PubMed]
- Matthews, G.A. Pesticides Health, Safety and the Environment, 2nd ed.; John Wiley & Sons, Ltd: Chichester, UK, 2016; pp. 129–150. [Google Scholar]
- Reichenberger, S.; Bach, M.; Skitschak, A.; Frede, H.G. Mitigation strategies to reduce pesticide inputs into ground and surface water and their effectiveness: A review. Sci. Total Environ. 2007, 384, 1–35. [Google Scholar] [CrossRef] [PubMed]
- Van de Zande, J.C.; Huijsmans, J.F.M.; Porskamp, H.A.J. Spray techniques: How to optimise spray deposition and minimise spray drift. Environmentalist 2008, 28, 9–17. [Google Scholar] [CrossRef] [Green Version]
- Bondesan, D.; Rizzi, C.; Ianes, P.; Angeli, G.; Bassi, R.; Dalpiaz, A.; Ioriatti, C. Towards integration of inspection procedures, calibration and drift reducing devices for an efficient use of pesticides and reduction of application impact. Julius Kühn Arch. 2012, 439, 135–139. [Google Scholar]
- Ellis, M.B.; Swan, T.; Miller, P.C.H.; Waddelow, S.; Bradley, A.; Tuck, C.R. Design factors affecting spray characteristics and drift performance of air. Biosyst. Eng. 2002, 82, 289–296. [Google Scholar]
- Derksen, R.C.; Ozkan, H.E.; Fox, R.D.; Brazee, R.D. Droplet spectra and wind tunnel evaluation of venturi and pre-orifice nozzles. Trans. ASAE 1999, 42, 1573–1580. [Google Scholar] [CrossRef]
- Oggero, G.; Tamagnone, M.; Bozzer, C.; Savoia, S.; Corte, M.; Sonnati, C. First evaluation of different pesticides distribution techniques in Piemonte Region hazelnut crops. Julius Khun Arch. 2015, 448, 49–50. [Google Scholar]
- Duran, H.; Çİlİngİr, İ.; Ak, K. Chemical control of Curculio nucum L. (Coleoptera: Curculionidae) with knapsack sprayers equipped with air-assisted rotary disc nozzles. In Proceedings of the Fourth International Scientific Symposium “Agrosym 2013”, Jahorina, Bosnia & Herzegovina, 3–6 October 2013; pp. 671–677. [Google Scholar]
- Lesnik, M.; Pintar, C.; Lobnik, A.; Kolar, M. Comparison of the effectiveness of standard and drift-reducing nozzles for control of some pests of apple. Crop Prot. 2005, 24, 93–100. [Google Scholar] [CrossRef]
- Wenneker, M.; Heijne, B.; Van de Zande, J.C. Effect of air induction nozzle (coarse droplet), air assistance and one-sided spraying of the outer tree row on spray drift in orchard spraying. Ann. Rev. Agric. Eng. 2005, 4.1, 116–128. [Google Scholar]
- Panneton, B.; Philion, V.; Chouinard, G. Spray deposition with conventional nozzles, low-drift nozzles, or permanent sprinklers for controlling apple orchard pests. Trans. ASABE 2015, 58, 607–619. [Google Scholar]
- Doruchowski, G.; Świechowski, W.; Masny, S.; Maciesiak, A.; Tartanus, M.; Bryk, H.; Hołownicki, R. Low-drift nozzles vs. standard nozzles for pesticide application in the biological efficacy trials of pesticides in apple pest and disease control. Sci. Total Environ. 2017, 575, 1239–1246. [Google Scholar] [CrossRef] [PubMed]
- Garcerá, C.; Román, C.; Moltó, E.; Abad, R.; Insa, J.A.; Torrent, X.; Planas, S.; Chueca, P. Comparison between standard and drift reducing nozzles for pesticide application in citrus: Part II. Effects on canopy spray distribution, control efficacy of Aonidiella Aurantii (Maskell), beneficial parasitoids and pesticide residues on fruit. Crop Prot. 2017, 94, 83–96. [Google Scholar] [CrossRef] [Green Version]
- Torrent, X.; Garcerá, C.; Moltó, E.; Chueca, P.; Abad, R.; Grafulla, C.; Román, C.; Planas, S. Comparison between standard and drift reducing nozzles for pesticide application in citrus: Part, I. Effects on wind tunnel and field spray drift. Crop Prot. 2017, 96, 130–143. [Google Scholar] [CrossRef] [Green Version]
- Baldoin, C.; Beria, S.; De Zanche, C. Performances of air inclusion nozzles on vineyard sprayers. In Proceedings of the Seventh Workshop on Spray Application Techniques in Fruit Growing, Cuneo, Italy, 25–27 June 2003; pp. 273–279. [Google Scholar]
- Fornasiero, D.; Mori, N.; Tirello, P.; Pozzebon, A.; Duso, C.; Tescari, E.; Bradascio, R.; Otto, S. Effect of spray drift reduction techniques on pests and predatory mites in orchards and vineyards. Crop Prot. 2017, 98, 283–292. [Google Scholar] [CrossRef]
- FAOSTAT. Food and Agriculture Data. Available online: http://www.fao.org/faostat/en/#home (accessed on 2 March 2021).
- ISMEA. Ismea Mercati. Frutta in Guscio. Available online: http://www.ismeamercati.it/ (accessed on 2 March 2021).
- ISTAT. Coltivazioni Legnose Fruttifere. Available online: http://dati.istat.it/ (accessed on 25 February 2021).
- Cerruto, E.; Aglieco, C.; Failla, S.; Manetto, G. Parameters influencing deposit estimation when using water sensitive papers. J. Agric. Eng. 2013, 44, 9. [Google Scholar] [CrossRef]
- Salyani, M.; Zhu, H.; Sweeb, R.; Pai, N. Assessment of spray distribution with water-sensitive paper. Agric. Eng. Int. CIGR J. 2013, 15, 101–111. [Google Scholar]
- Menesatti, P.; Biocca, M.; D’Andrea, S.; Pincu, M. Thermography to analyze distribution of agricultural sprayers. Quant. Infr Red Thermogr. J. 2008, 5, 81–96. [Google Scholar] [CrossRef]
- Pallottino, F.; Menesatti, P.; Figorilli, S.; Antonucci, F.; Tomasone, R.; Colantoni, A.; Costa, C. Machine vision retrofit system for mechanical weed control in precision agriculture applications. Sustainability 2018, 10, 2209. [Google Scholar] [CrossRef] [Green Version]
- R: A Language and Environment for Statistical Computing. In R Foundation for Statistical Computing; R Core Team: Vienna, Austria, 2013.
- Shapiro, S.S.; Wilk, M.B. An analysis of variance test for normality (complete samples). Biometrika 1965, 52, 591–611. [Google Scholar] [CrossRef]
- Kruskal, W.H.; Wallis, W.A. Use of ranks in one-criterion variance analysis. J. Am. Stat. Assoc. 1952, 47, 583–621. [Google Scholar] [CrossRef]
| Publisher’s Note: MDPI stays neutral with regard to jurisdictional claims in published maps and institutional affiliations. |
© 2021 by the authors. Licensee MDPI, Basel, Switzerland. This article is an open access article distributed under the terms and conditions of the Creative Commons Attribution (CC BY) license (https://creativecommons.org/licenses/by/4.0/).


