
Discrete Element Modelling of Soil Compaction of a Press-Wheel


Department of Biosystems Engineering, University of Manitoba, Winnipeg, MB R3T 2N2, Canada
*
Author to whom correspondence should be addressed.
AgriEngineering 2021, 3(2), 278-293; https://0-doi-org.brum.beds.ac.uk/10.3390/agriengineering3020019
Submission received: 21 April 2021
/
Revised: 13 May 2021
/
Accepted: 16 May 2021
/
Published: 19 May 2021
Abstract
:Press-wheels are wheels designed to compact the soil above seeds in the “seed cover” region. Soil compaction, produced by the press-wheels of seeders, affects seedling emergence and early plant growth. The Discrete Element Method (DEM) was used to model the amount of soil compaction from a press-wheel with varying down forces. The model was used to predict sinkage and rolling resistance of the press-wheel. The model results were validated with data from soil bin tests of the press-wheel in a sandy loam soil under varying soil moisture content levels (low, medium, and high). The sinkage results from the soil bin tests were 27.7, 26.7, and 25.2 mm for the low, medium, and high soil moisture content levels, respectively. The corresponding rolling resistances obtained from the tests were 104.4, 89.9, and 113.6 N. The press-wheel model adequately predicted the sinkage and rolling resistance for each soil moisture content level with overall Relative Mean Errors (RME) ranging from 13 to 23%. Additional simulation results show that average peak soil stresses across the three soil moisture contents at a depth of 0.12 m were 22,466.7, 8700.0, and 6900.0 Pa for vertical, horizontal, and lateral directions, respectively. The results enhance the understanding of the dynamics of the soil–press-wheel interaction and provided useful information for seeder press-wheel design.
1. Introduction
Soil compaction has an effect on agricultural practices, seedling germination, plant growth, and crop yields. Existing studies focused on the compaction associated with the wheel traffic of field machines [1,2]. Little research has been done on the compaction associated with the press-wheels of seeding machines. The press-wheels of seeders are wheels that roll on the surface of the soil behind seed openers to apply an amount of compaction to the surface promoting adequate soil–seed contact and seed depth [3]. The required compaction levels from press-wheels are much lower than those from field traffic. Soil compaction levels created by press-wheels affect the seedling depth, seedling emergence, and crop yields [4].
The key for obtaining the right soil compaction level for plant growth is to understand how soil compaction is affected by the down force of press-wheels [5]. Unfortunately, this has not been well documented. Many models have been developed for predicting soil compaction. A model was developed to predict the compaction susceptibility of the top-soil layer (2–3 mm) based on soil water content and initial density [6]. Another study was performed to analyze the vehicle ground pressure of various agricultural machines, and the resulting compaction [7]. Moreover, another study investigated the effect of gravel content on the compression characteristics of soils [8]. Unfortunately, none of these models were for predicting soil compaction produced by the press-wheels of seeders with varying down forces and how they affect soil sinkage and rolling resistance. Research in this regard is necessary to avoid the adverse effects of press-wheels on crop production and to design high-performance seeding machines.
The uncontrolled down force imposed on press-wheels of seeders can lead to the poor emergence of crops. Asoodar et al. [9] stated that adequate rates of seedling emergence were obtained with changeable wheel weights proportional to the quantity of accessible soil moisture content in contrast to a specified quantity of press-wheel weights. This leads to the idea that the right kind of down force promotes adequate seedling emergence and improves soil–seed contact. McKyes [10] suggested that, due to the irregular nature of the stress distributions in the ground, the determination of the mechanical analysis and how it affects seedling germination is difficult to interpret. However, the complex nature of stress distribution in the soil has not been well documented.
To address the complex nature of soil dynamics under a press-wheel, the modelling approach was adopted in this study. Numerical modeling techniques, such as Finite Element Modelling (FEM) and Discrete Element Modelling (DEM), have been widely used to simulate compaction produced from wheels and tracks. DEM is considered more suitable for interactions of press-wheels with soil where large soil displacements occur. A study using DEM dealt with the usage of a rigid wheel and a rigid particle to simulate soil–wheel interaction. Different non-practical vertical loads were assigned to both wheel and particle and made to fall or settle onto the modelled soil surface [11]. To mimic the movement of a typical wheel, the rigid wheel and particle were not assigned any translational velocity.
Khot et al. [12] used DEM to simulate dynamic wheel–soil interaction and validate the simulation results with experimental data. The study was conducted using two types of soil at three different vertical loadings. Sinkage, draft, and vertical force measurements were observed throughout the simulation. The results of that study showed a better correlation of the measured data to the simulated data. The numerical modelling studies mentioned above dealt with tractor wheels. There is no apparent usage of DEM to simulate soil dynamics associated with the press-wheels of seeders with varying down forces.
The aim of this study was to fill these gaps by modelling a press-wheel and its interaction with soil using DEM. The specific objectives of this study were to (1) develop a soil-wheel interaction model using Particle Flow Code in Three Dimensions (PFC3D) software, (2) validate the model using measurements from press-wheel experiments and (3) apply the model for examining the soil dynamic attributes (soil sinkage, stress distribution, and particle movement) under various down forces and widths of a press-wheel.
2. Materials and Methods
2.1. Experiment
2.1.1. Description of the Press-Wheel, Test Apparatus and Soil Bin
The studied press-wheel (Figure 1a) was a rubber-type wheel on a typical air seeder. This press-wheel was selected due to its extensive and operational use by commercial air seeders for planting purposes. The press-wheel was 0.12 m wide and 0.41 m in diameter. Following the manufacturer’s specifications, the inflation pressure was set as 483 kPa. The press-wheel was tested in an indoor soil bin located in the Department of Biosystems Engineering, University of Manitoba, Canada. The soil bin was 1.5 m wide, 15.0 m long, and 0.5 m deep, filled with sandy loam soil (70% sand, 16% silt and 14% clay). Sandy loam soil was chosen due to its extensive use for growing crops and its availability across the Canadian prairies. In between each test run, the soil was tilled with a cultivator, levelled, and slightly compacted with a roller, as described by Mak and Chen [13].
A test apparatus was designed and fabricated, consisting of the press-wheel, a frame, a weight-carrying section, and a hitch (Figure 1a). The weight-carrying section (0.34 m × 0.33 m × 0.28 m) served as an area for placing weights to obtain a desired down force of the press-wheel in tests. For testing, the hitch was mounted on the soil bin carriage through a dynamometer.
2.1.2. Experimental Design
The factor of the experiment was soil moisture content which had three levels: low, medium, and high. The corresponding target gravimetric soil moisture contents for these three levels were 10%, 20%, and 30%. To achieve the target soil moisture content, water was applied to the soil and mixed thoroughly. After 24 h, the soil moisture content was determined using the oven-drying method. The actual gravimetric moisture contents used in the experiment were 10.5 ± 0.5% for the low, 19.0 ± 1.0% for the medium, and 28.0 ± 1.0% for the high levels, which were very close to the target values. Each of the three treatments were replicated four times. A total of 12 tests were performed. The down force of the press-wheel was set as 743 N, a typical load of depth-gauge wheels [3]. This force was achieved by adding the appropriate weight in the weight-carrying section of the test apparatus and kept constant during the experiment. For all test runs, the working speed of the press-wheel was 2.22 ms−1, previously used in press-wheel studies by Hanna et al., and Fielke and Bayhan [3,14].
2.1.3. Measurements
After soil preparation and before a test run, three soil samples were taken using a core sampler (0.05 m in diameter and 0.10 m in height) in the soil bin, away from the path of the press-wheel (Figure 1b). After the test run, soil cores were taken along the centre of the press-wheel path. Soil samples were weighed, oven-dried at 105 °C for 24 h to determine the soil moisture content and soil dry bulk density change (Δρ). The soil dry bulk density change was determined as the differences in bulk density before and after the test run.
A horizontal pole, extended from a burette stand relative to the soil surface, was used to measure the initial soil surface elevation before each test run and the soil elevation at the centre of the press-wheel path after the test run (Figure 1c). The difference between the two elevations was considered to be the sinkage (Δz).
The rolling resistance of the press-wheel was monitored by the plate dynamometer (Figure 1a). Force signals were recorded with a Campbell Science data logger (Campbell Scientific Inc., Logan, UT, USA) and a computer at 35 Hz. The recorded rolling resistance (horizontal force) was the average of the data points over a portion of constant velocity of the press-wheel.
2.1.4. Statistical Analysis
SAS University edition, 2018 statistical software was used to perform two statistical tests: Analysis of Variance (ANOVA), and Duncan’s Multiple Range Test (MRT). ANOVA was used to determine if the experimental factor (soil moisture content) had a significant effect on the response variables (change in bulk density, sinkage, and rolling resistance) while MRT is used to pinpoint which specific factor levels produce substantially different means for response variables.
2.2. Soil-Wheel Model Development
A soil–wheel interaction model was developed using PFC3D. The model components included model soil particles and a model press-wheel that traveled on the surface of the model soil, as described in the following sections.
2.2.1. Soil Model
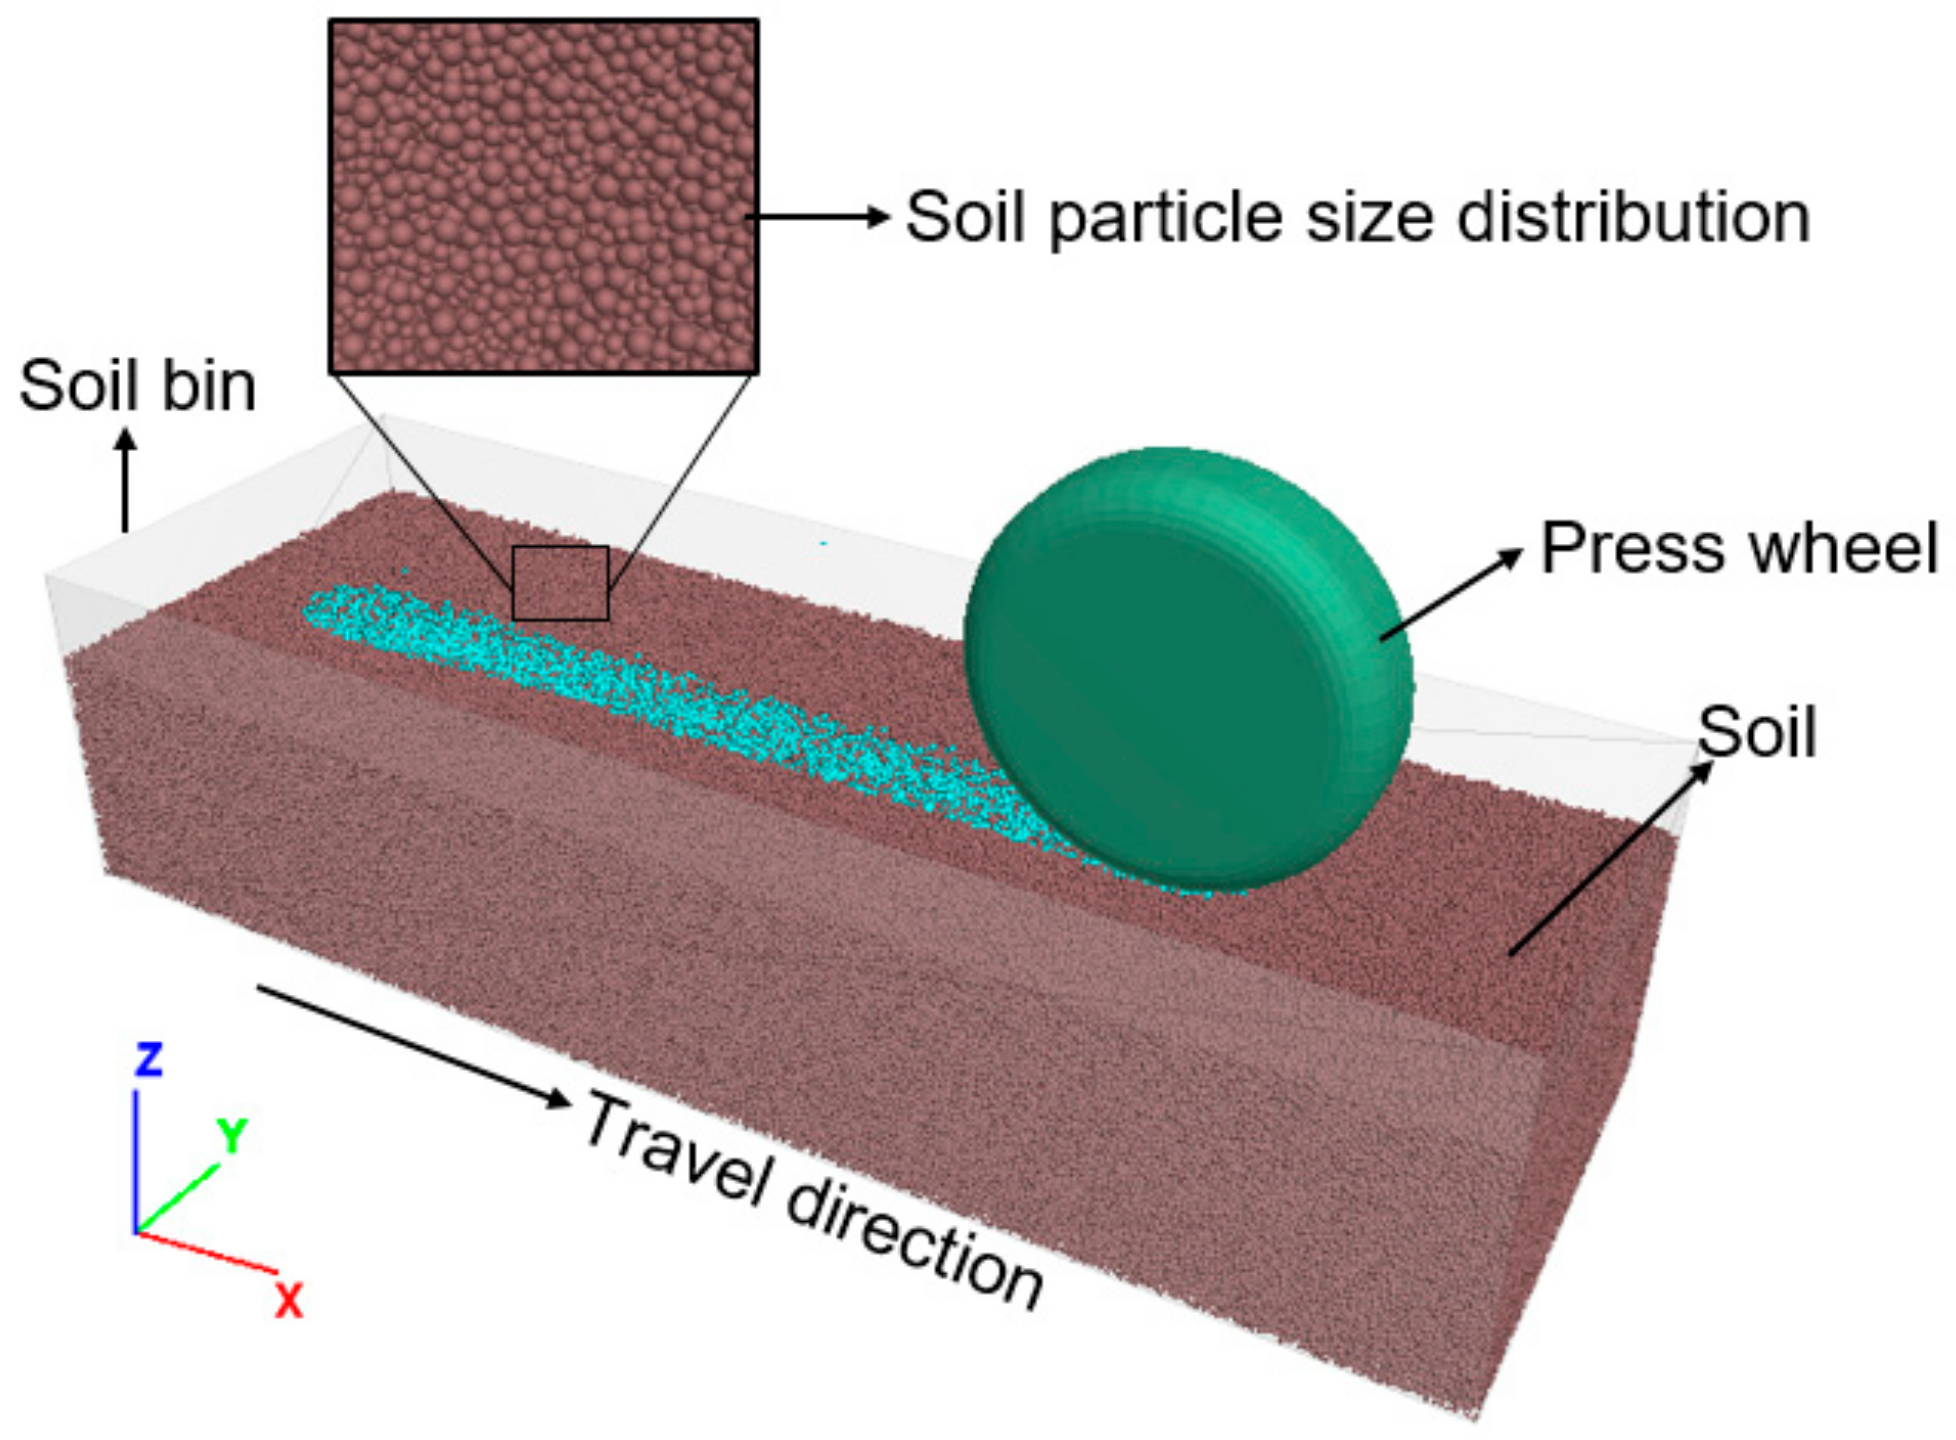
Soil was modeled with an assembly of spherical particles of various sizes [15]. The model soil particles were evenly created with a radius of 0.0025 m to 0.005 m within a soil box that was 1.9 m long, 0.7 m wide and 0.5 m deep (Figure 2). A lesser particle size radius would require higher computational power and time. Murray and Chen, and Sadek and Chen [16,17] have previously used this range of radius values in their DEM studies. Particles were made to settle under gravity, so as to attain an equilibrium status, where the maximum internal force of soil particles was less than 1.00 × 10⁻³ N. Then, particles at the topmost portion were removed to attain a level surface. The total number of soil particles was 1.2 million. A higher number of particles would require unreasonable computational time. Using the relationship between particle density, porosity, and bulk density [18], the particle density was adjusted to match the bulk density of the actual soil bin in the experiment (Equation (1)).
where is the bulk density, is the particle density, and is the soil porosity.
2.2.2. Press-Wheel Model and Down Force
The press-wheel model (Figure 2) had the same dimensions as that used in the soil bin test. Initially, a Computer-Aided Design (CAD) model was created in SolidWorks software and then imported into PFC3D as a stereolithographic (STL) file. In PFC3D, a rigid block (a feature implemented in PFC3D) was generated to take the form of the CAD model.
For the soil bin tests mentioned above, the down force of the press-wheel was achieved by adding weight in the weight-carrying section of the test apparatus. For simulations, the weight-carrying section was not necessary, as the down force could be realized through changing the density of the wheel. To set the down force at 743.0 N (used in the soil bin experiments), a density of 4736 Kg/m3 was assigned to the press-wheel, given the press-wheel volume of 0.0216 m3.
2.2.3. Soil–Wheel Interaction Model
At the onset of each simulation run, the press-wheel was made to settle under its own weight while gravity acted on the whole system. When the contact force between the press-wheel and soil particles became equal to the reaction force, the translational and angular speed was applied to the wheel. The translational speed (V) assigned to the wheel was 2.22 m/s as in the experiment. The angular speed (ω) was computed as the ratio of the translational speed (V) to the radius (R) of the wheel, i.e., ω = V/R, assuming negligible wheel slippage. A constraint was placed on both sides of the wheel to prevent it from falling on its side while travelling on the section of the soil bin.
2.2.4. Model Parameters
The Parallel Bond Model (PBM), implemented in PFC3D [19], was applied to the soil particle assembly to create contact bonds between soil particles. This provided a cohesive phenomenon between particles, as real soil is cohesive [16,17]. This contact model requires eight model parameters: particle normal stiffness (, N/m), particle shear stiffness (, N/m), particle friction coefficient (µ, dimensionless), bond radius multiplier (, dimensionless), normal bond stiffness (, Pa/m), shear bond stiffness (, Pa/m), normal bond strength (σ, Pa) and shear bond strength (τ, Pa). These model parameters were taken from Nandanwar and Chen [20]. In that study, calibration of a DEM model using triaxial tests was performed on the same soil used in this study. The triaxial tests were performed for three soil moisture levels (10.5, 19.0, and 28.0%) at various confining pressures. Only the parameters associated with the confine pressure of 50,000 Pa were adopted here, as it was within the range of the ground pressure from press-wheels. These soil moisture contents were similar to the soil moisture levels used in this study. The simulation results from that study showed that soil moisture content affected the particle friction coefficient (µ), but had little effect on the other DEM parameters. The calibrated particle friction coefficients, corresponding to the low, medium, and high soil moisture levels, were 1.0, 0.7, and 0.2. The other parameters are listed in Table 1.
2.3. Model Validation
For validation, the particle density of the soil model was set as 2396 Kg/m3. The bulk density of the soil assembly was 1349 Kg/m3, which was similar to the bulk density observed in the soil bin experiment. Simulations were run under the same press-wheel down force and travel speed as the soil bin experiment. The simulated values of soil sinkage and rolling resistance were compared with the measured values. The agreement was assessed using relative errors.
2.4. Model Application
The validated model was used to simulate several dynamic attributes, including instantaneous soil stress distribution and effects of varying down forces and press-wheel widths on soil deformation. They are described in the following sections.
2.4.1. Instantaneous Stress Distribution in Soil
In the PFC3D environment, objects known as measurement spheres were used to determine stresses between soil particles in all directions at a specified region within the model soil. Four of these measurement spheres, with a diameter of 0.10 m, were used to monitor the soil stresses in the model. The measurement spheres were equally spaced and placed 0.12 m underneath the soil surface and travel path of the press-wheel (Figure 3). The centre of the measurement sphere was placed at the 0.12 m depth. Lamandé and Schjønning [21] used a similar depth in determining ground stresses in the top soil layer when observing the effect of wheel load at the soil-tyre interface. The instantaneous stresses between soil particles were monitored within the measurement spheres at the specified depth as the press-wheel travelled along the soil box. These measured stresses provided an insight into how far and wide the press-wheel affected the soil particle dynamics.
2.4.2. Stress–Sinkage Relationship
The stress distribution and sinkage observed in the press-wheel model were plotted against each other to understand the relationship that is important for predicting wheel mobility over deformable soils and the effect of stress in the aforementioned terrain [22,23]. The stress and sinkage data were recorded and monitored around the location with the first underlaying measuring sphere (MS-1). At the start of the simulation, the change in position of the press-wheel and stresses developed around MS-1 were monitored simultaneously and later plotted against each other to establish the relationship.
2.4.3. Effects of Down Force on the Sinkage
Further investigation was done on the press-wheel model to observe how different amounts of down force, produced from the wheel, affected sinkage and the stress–sinkage relationship. Commonly used down force levels (180, 335, 490, 690, and 890 Kg/m3) in the literature [3] were assigned to the press-wheel and made to travel at a speed of 2.22 ms−1 on the soil model. Again, sinkage measurements were monitored under three soil moisture conditions in order to provide insight into the dynamic nature of the model.
2.4.4. Effects of Press-Wheel Width on Sinkage
Bayhan et al. [24] suggested that, for effective seed placement, the most important condition is the proper selection of press-wheel width. An investigation was performed to determine how different press-wheel designs affected sinkage. Three models of different press-wheels, with widths of 0.122 m, 0.080 m, and 0.055 m [24,25], were developed in PFC3D. They were simulated at a speed of 2.22 ms−1. Sinkage was monitored for all press-wheel designs under the three soil moisture contents (low, medium and high) and compared with each other. Additionally, the stress–sinkage relationship, based on the width effects, were also established.
3. Results and Discussion
3.1. Experiment Results
3.1.1. Effect of Soil Moisture Content on Change in Bulk Density
The analysis of variance (ANOVA) procedure suggested that the effect of soil moisture content on the change in bulk density was statistically significant. A greater change in bulk density was observed for the medium moisture content (Table 2). Comparatively, the low and high moisture content were observed to have a lower change in bulk density.
Nandanwar and Chen [20] stated that, when applying confining pressure to the sandy loam soil with a higher moisture content (28.0 ± 1.0%), the soil tends to move closer to the soil liquid limit (29.6%). In that state, the soil tends to prevent further compression or compaction. This is quite apparent in this study, where the change in bulk density for the medium moisture content had a higher range than the low and high moisture content. Moreover, this is in agreement with the observation of Saffih-Hdadi et al. [6]. In that study, there was less soil compaction or deformation recorded for soils with higher initial bulk density at a particular moisture content. It is important to note that soil with medium moisture content (19.0 ± 1.0%) can have adverse effects on the seeds during planting when in combination with a press-wheel load of 743.0 N. This is due to the drastic increase in soil bulk density from 1510 Kg/m3 to 1760 Kg/m3. An adequate press-wheel load level must be in combination with the soil moisture condition to prevent damage to seeds and improve seedling emergence [3].
3.1.2. Effect of Soil Moisture Content on Sinkage
The effect of moisture content on sinkage was not statistically significant, and on average, the press-wheel resulted in a sinkage of 26.5 mm (Table 2). At constant press-wheel load and travel speed, the soil condition did not dictate the soil surface sinkage. Since all factors, with the exception of moisture content, were kept constant, there was no significant difference between the sinkage results in this study. Additionally, the studied soil had a very high sand content. In contrast, clay soils may behave differently under different moisture contents. This is because clay soils have a higher water holding capacity than sandy loam soils. Therefore, wet clay soils will deform more readily than dry soils. The consolidation of sandy loam soil in the subsoil or region beneath the topsoil during passage of the press-wheel could stand as a reason for the observed non-significant difference in soil surface sinkage. This prevented the further deformation of the topsoil, but the change in bulk density and rolling resistance became affected.
3.1.3. Effect of Soil Moisture Content on Rolling Resistance
The press-wheel rolling resistance varied and was significantly different between the medium soil moisture content and the other moisture content levels (Table 2). The low and high soil moisture content were not significantly different. Less resistance affected the press-wheel when passing on the soil with medium moisture content. This was reflected in the soil bulk density change results, where the soil condition recorded a higher change, as compared to the low and high moisture contents. Compaction was more evident in the soil with medium moisture content.
3.2. Model Behaviour Validation Results
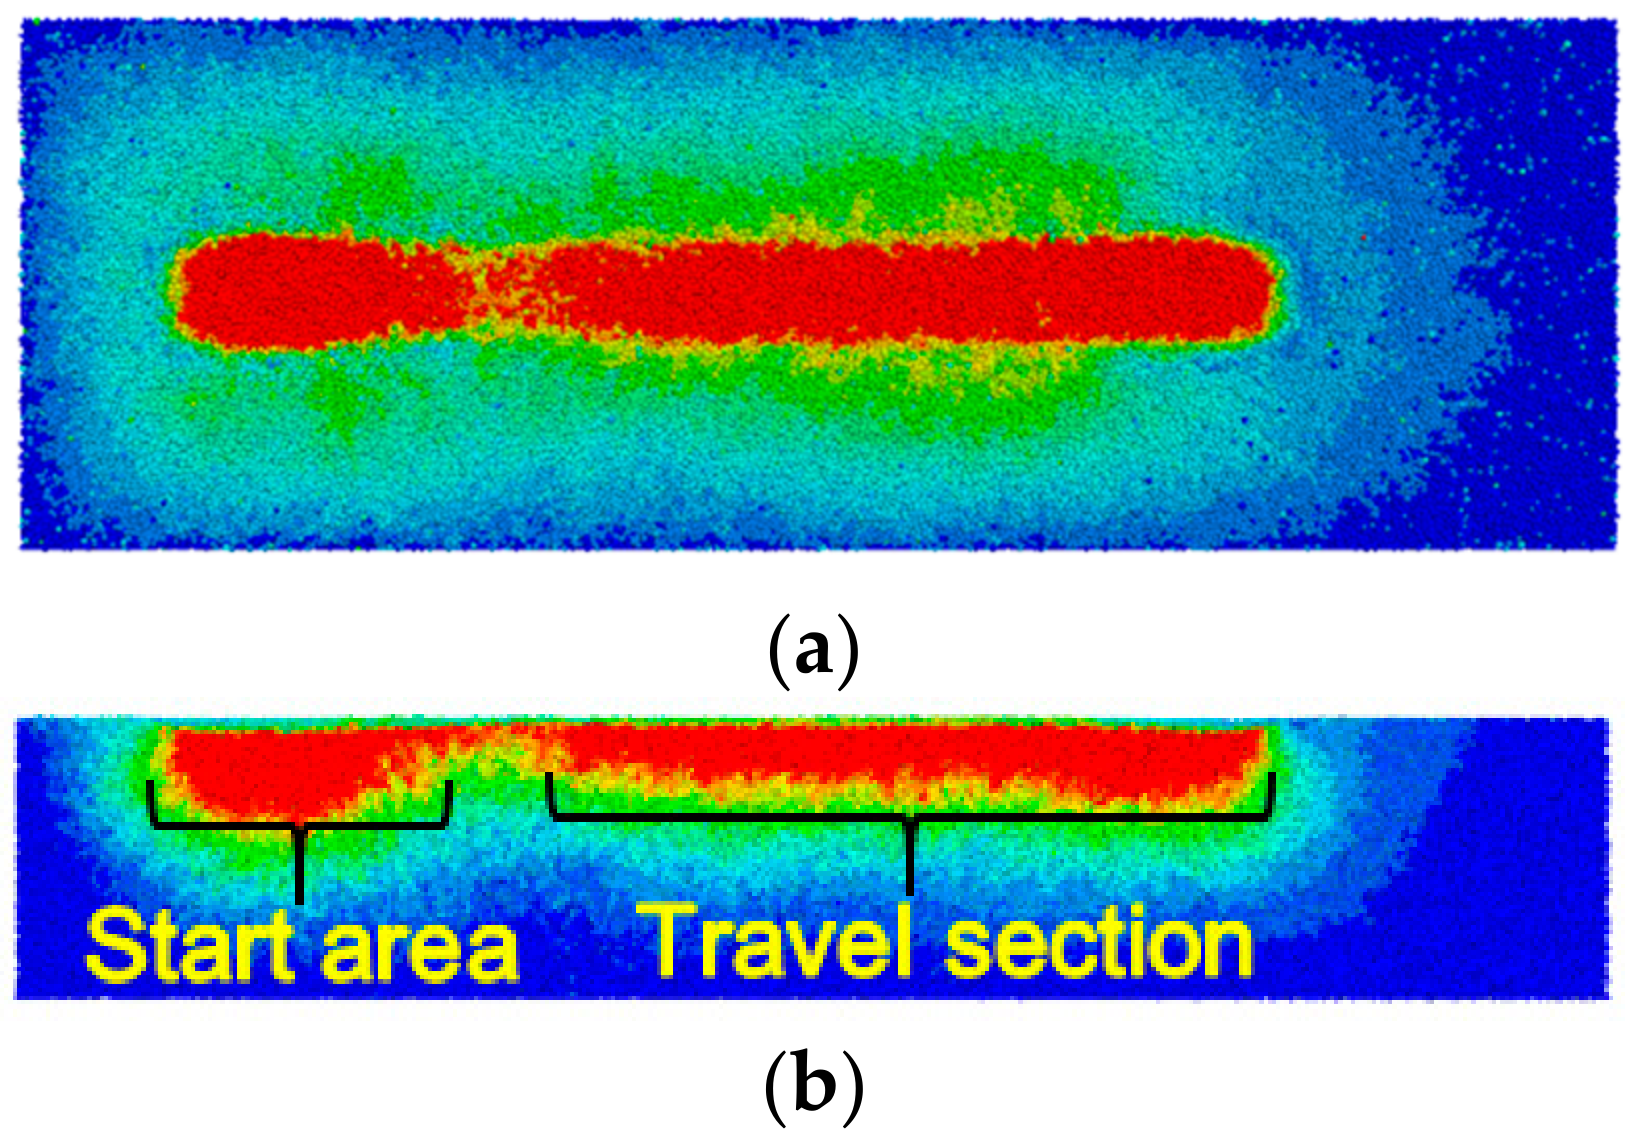
Similar to the observation in the soil bin experiment, soil deformation occurred along the travel path of the soil-wheel interaction model (Figure 4a). The red-coloured contour and green-coloured contour indicated the highly displaced soil particles and fairly displaced soil particles, respectively. The blue-coloured contour indicated the non-displaced soil particles. It should be noted that, at the start of the simulation, soil particles displaced more downwards, as compared to the rest of the travel path (Figure 4b). This was attributed to the fact that, when the press-wheel impacted the soil surface, it produced a force far greater than its own weight, which made the particles beneath it move vigorously downwards until equilibrium of the forces was achieved between the press-wheel and the soil surface. Beyond that area, the dynamic attributes in all directions between the press-wheel and soil surface were fairly constant throughout the rest of the travel path. Sinkage and other variables were monitored within this stable section, which was approximately 1.4 m. The simulated sinkage was determined as the difference between the final position of the wheel base contacting the soil surface and the level of the initial soil surface. The average of the sinkage values over the stable section was presented.
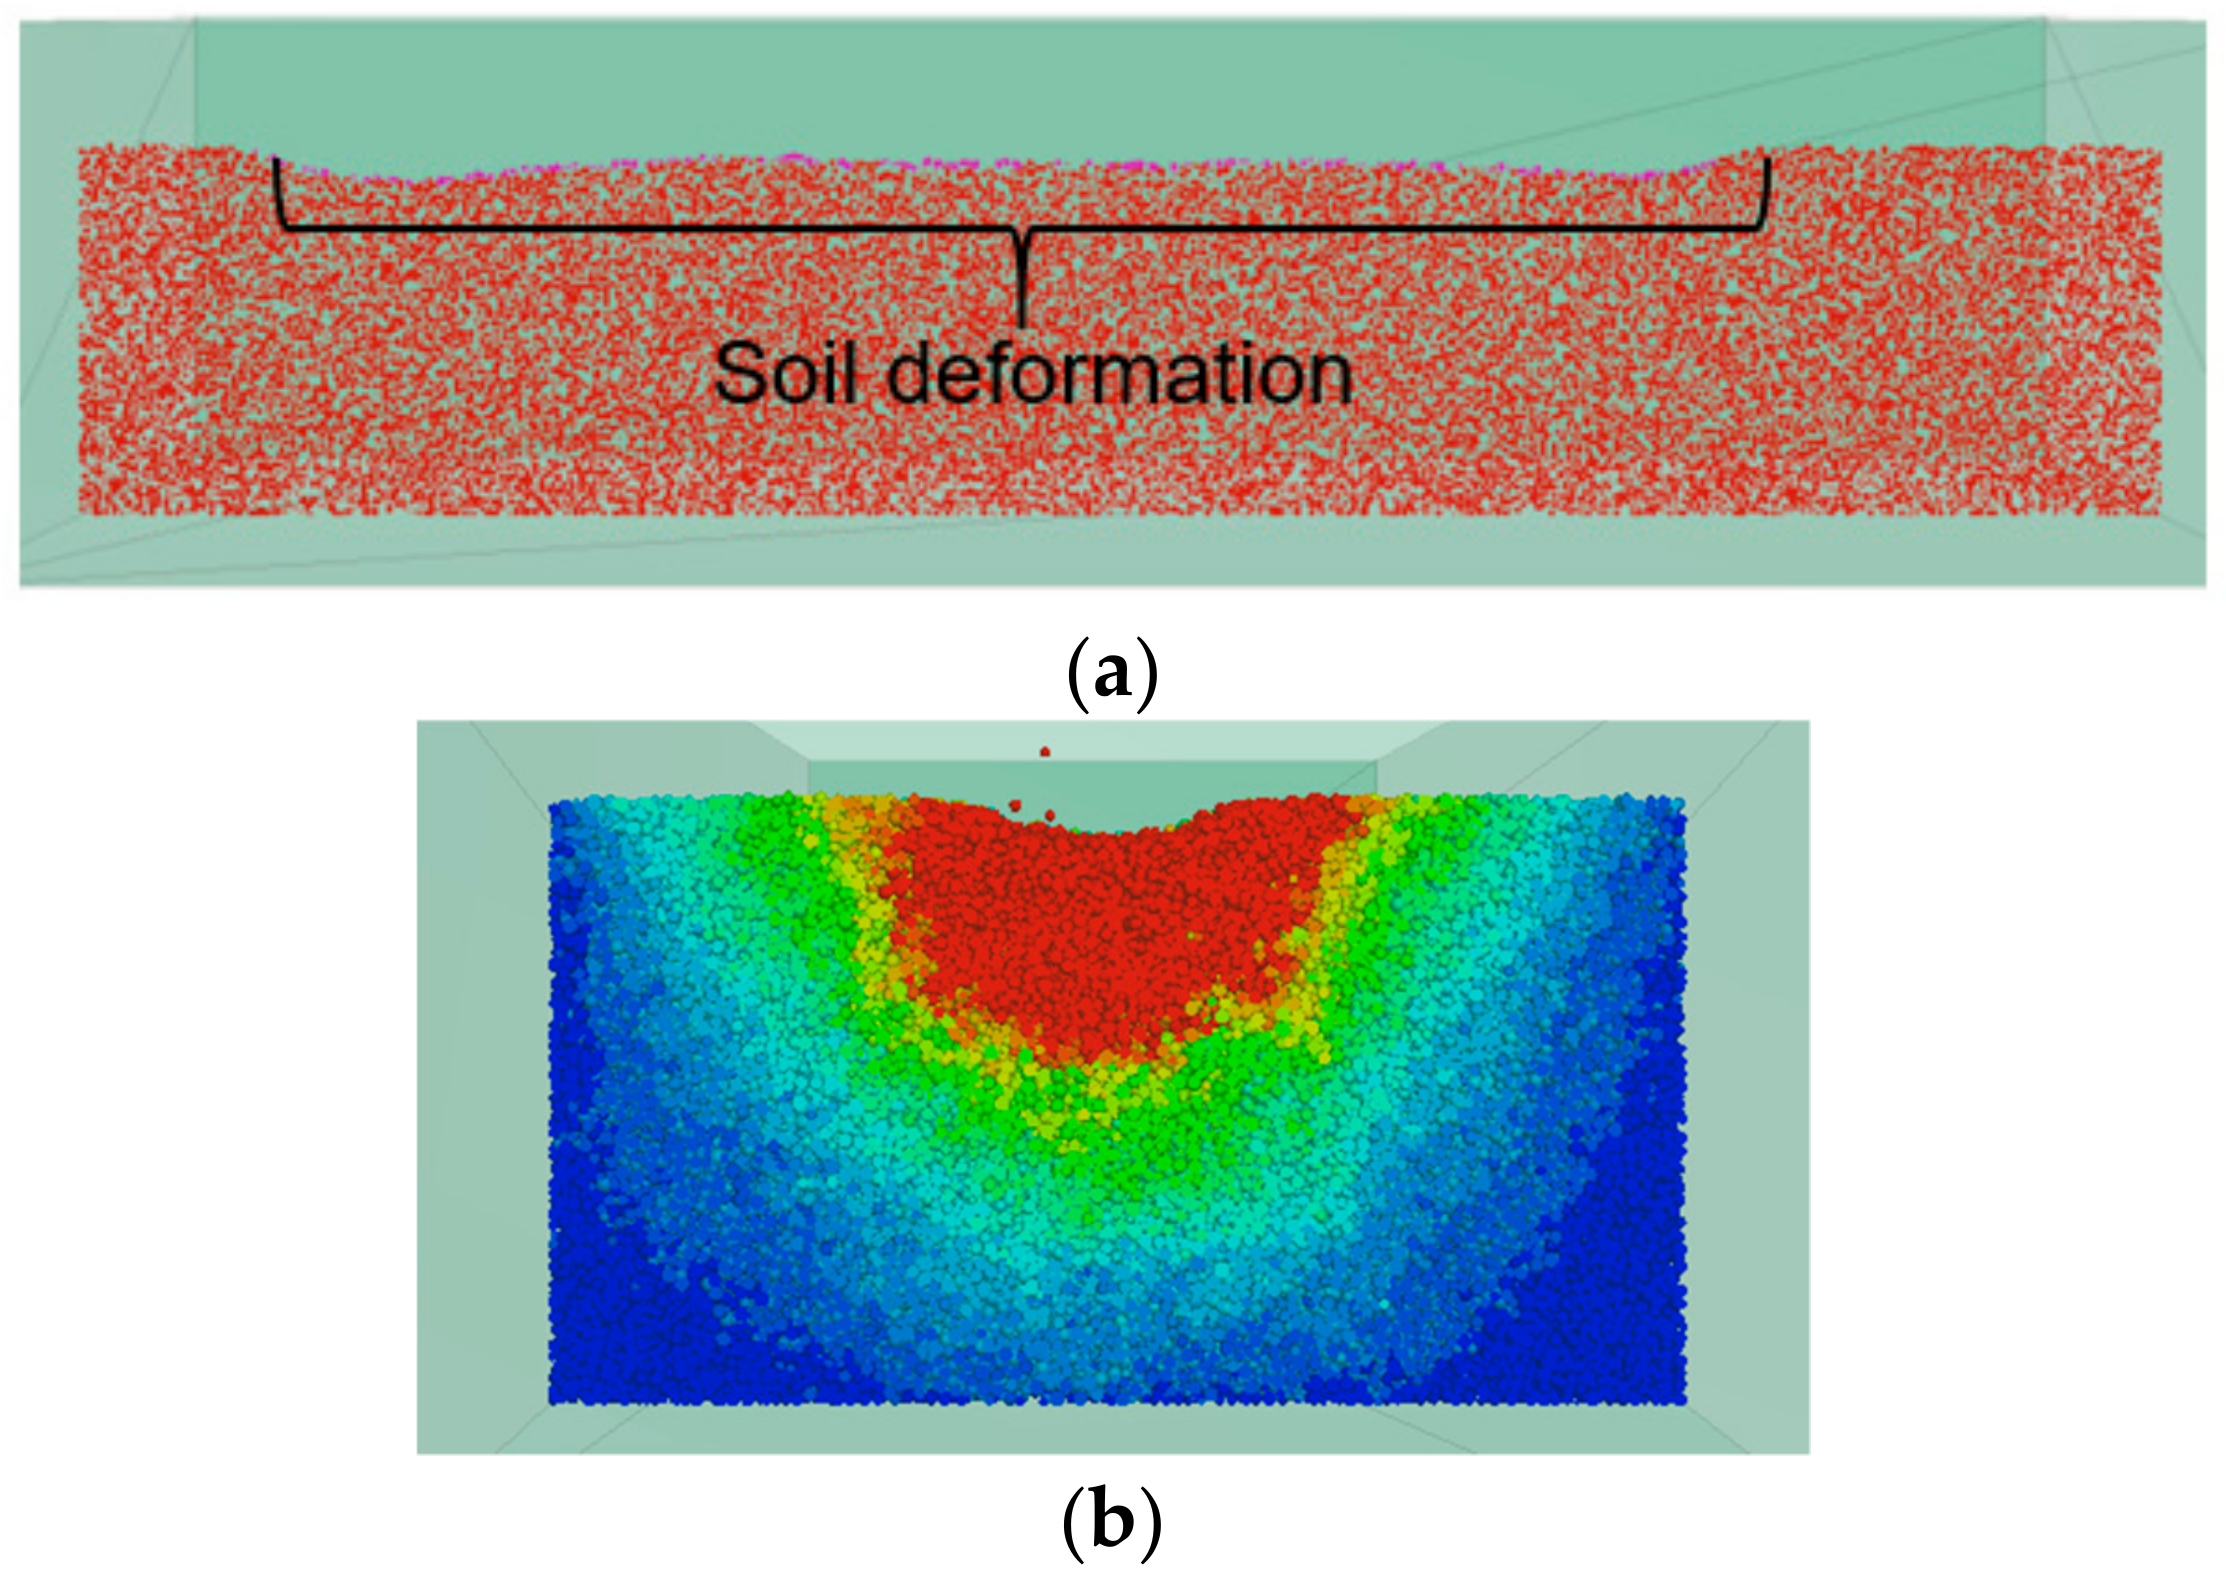
The soil press-wheel model showed an adequate response to soil deformation (Figure 5a). The soil particles were mostly displaced in the downward direction due to the pressure produced from the wheel when it travelled on the soil surface (Figure 5b). The colour description of the contour was similar to that witnessed above. Additionally, there was no evidence of soil throw in the model, as compared to what ensued in the soil bin test. The model was least accurate in simulating the sinkage for the medium soil moisture content and the rolling resistance for the high soil moisture content (Table 3). Generally, the press-wheel model predicted the rolling resistance more accurately, as compared to the sinkage. The overall relative mean errors (RMEs) of model predictions were lower than 23%, which is acceptable, considering the highly heterogeneous nature of agricultural soil.
3.3. Model Application
3.3.1. Instantaneous Stress Distribution in Soil
As the press-wheel approached the area with underlaying measuring spheres, the soil stresses in the sphere drastically increased, reaching a peak at the centre of the sphere (Figure 6). Then, it levelled off as soon as the wheel moved away from that location. The stresses were distributed in all directions. Each measuring sphere gave a pulse of stress in each direction. The pulse curves were not smooth, reflecting the random nature of the soil particles. The magnitude of the stresses in the horizontal (XX-stress) and lateral directions (YY-stress) were smaller when compared with the stress in the vertical direction (ZZ-stress), as expected. The results indicated the pressure propagation from the press-wheel to the soil profile. The press-wheel significantly impacts the soil to a depth of 0.12 m where the measuring spheres are located.
The interesting stress on a pulse in Figure 6 is the peak value that represent the magnitude of soil stress caused by the overlaying, running press-wheel. The peak values were averaged from four measuring spheres for each moisture content to examine the effects of soil moisture content. The magnitude of peak stresses is the highest in the vertical direction and the lowest in the lateral direction, regardless of soil moisture content (Table 4). Over three moisture contents, the peak stress in the vertical direction is about 2.6 times that in the horizontal direction, and 3.3 times that in the lateral direction. As for the effect of soil moisture content, the trends are variable. In general, there are small differences in the peak stresses among all three soil moisture contents in each direction. This was due to the constant wheel load (743.0 N) and wheel contact area used in the simulation. The low standard deviations of the stresses indicate low variabilities of the peak stresses recorded. This was quite evident within all three soil moisture content levels. This means that the model had a good reproducibility for predicting the soil stresses under a press-wheel.
3.3.2. Stress–Sinkage Relationship
Under the same press-wheel width (0.122 m), the simulated relationship between soil stress and sinkage were quite similar among the three moisture content levels. Generally, as the press-wheel ran above the measuring sphere, the soil stress in the sphere increased, and the sinkage caused by the press-wheel also increased from the initial edge to the opposite edge of the measuring sphere but levelled off thereafter. This was quite apparent in the soil with low and high moisture content levels (Figure 7a,c). The soil with medium moisture content showed a steadily increasing trend for the stress–sinkage relationship (Figure 7b). Moreover, there was evidence of a linear trend across the three soil moisture content levels for each press-wheel width (Figure 7d–i). As compared with the other press-wheel widths, higher pressure values were recorded for the 0.055 m press-wheel width across the three soil moisture content levels. This could be attributed to its smaller surface area and, therefore, leading to higher pressure generated on the surface. As soon as the press-wheel moves away from the location of interest (MS-1), the sinkage readings levelled off and remained fairly constant throughout the travel section of the soil bin.
3.3.3. Effects of Press-Wheel down Force on the Sinkage
An increase in press-wheel down force can lead to compaction or deformation of the soil surface [3,25]. The DEM model confirms this by the observed linear increase in sinkage as the press-wheel down force increases across the three soil moisture content levels (Figure 8a). At a press-wheel down force of 180 N, the lowest sinkage was recorded as 2.4, 8.6 and 0.7 mm for low, medium, and high moisture content levels, respectively. Thereafter, it rose steadily for the 335, 490, 690, and 890 N down forces. The highest sinkage was recorded as 23.6, 45.5, and 20.9 mm at a press-wheel down force of 890 N for low, medium, and high moisture content levels, respectively. As the down force increased, the soil peak stress also increased (Figure 8b). This occurred for all three soil moisture content levels.
3.3.4. Effects of Press-Wheel Width on the Sinkage
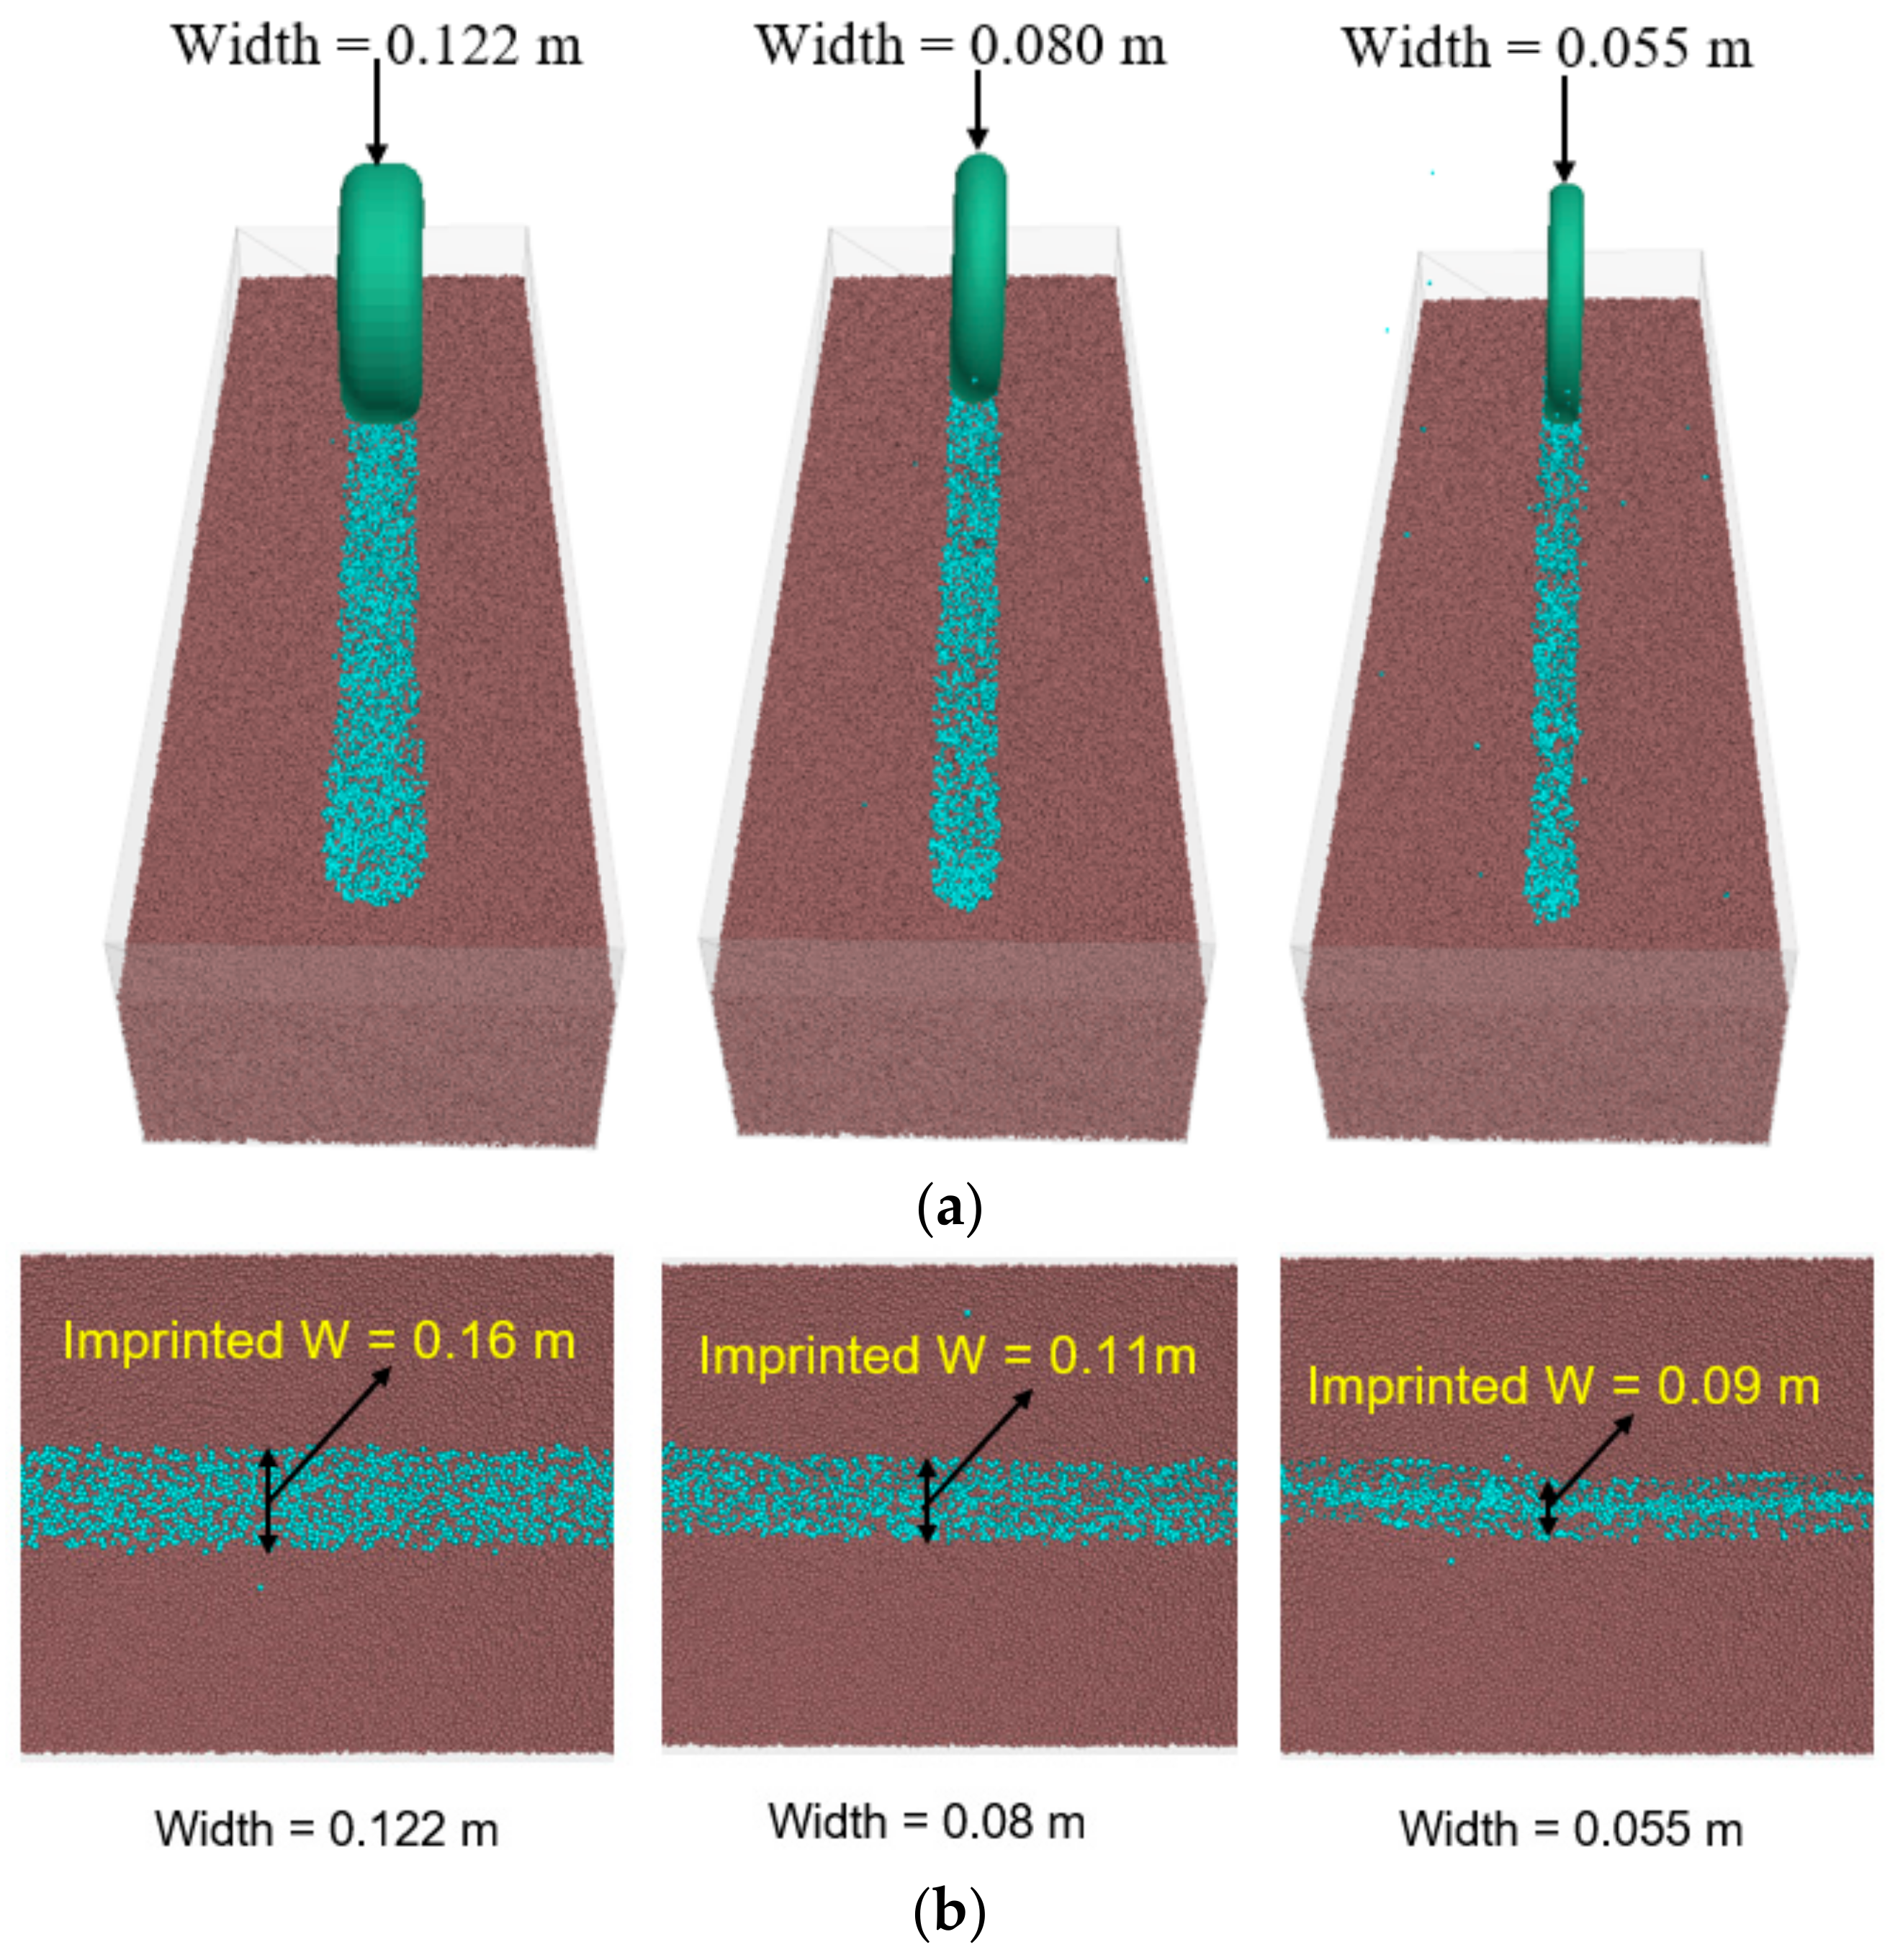
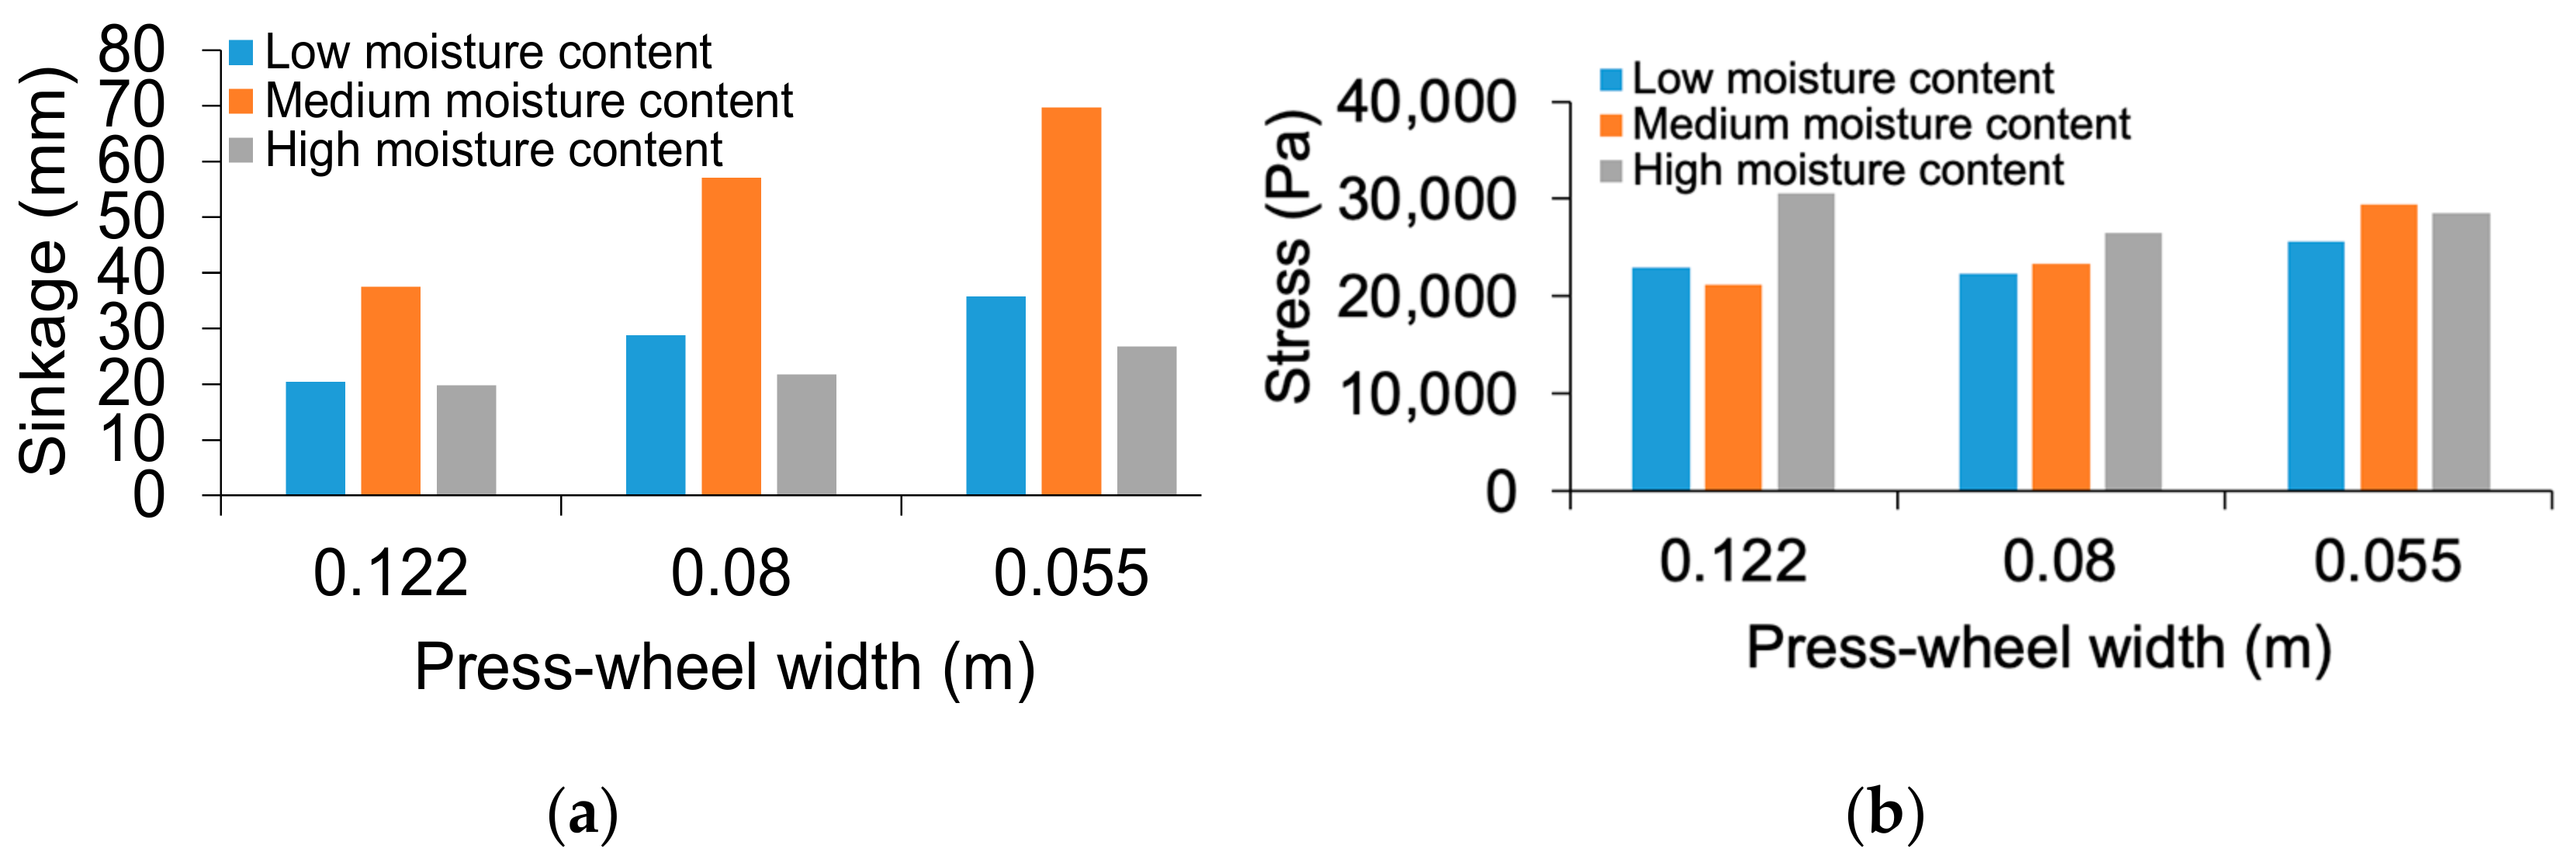
The press-wheels with the three widths indicated noticeable width difference of contact areas on the soil surface after passage (Figure 9a). The press-wheel, with a width of 0.122 m, imprinted a wheel width of 0.13, 0.16, and 0.12 m for the low, medium, and high soil moisture content levels, respectively (Figure 9b). The press-wheel with a width of 0.08 m, imprinted a wheel width of 0.10, 0.11, and 0.08 m for the low, medium, and high soil moisture content levels, respectively. Lastly, the 0.055 m press-wheel width imprinted a wheel width of 0.07, 0.09, and 0.08 m for the low, medium, and high soil moisture content levels, respectively. The low and high soil moisture content levels had values close to the actual press-wheel width. However, the medium soil moisture content level had slightly higher values due to the lower resistance offered by the soil model when the press-wheel travelled on its surface. Therefore, more soil particles were displaced. Width influenced the sinkage in the travel path. The press-wheel with a width of 0.08 m recorded a sinkage of 28.8, 57.1, and 21.8 mm for the low, medium, and high soil moisture content levels, respectively (Figure 10a). The 0.055 m press-wheel width recorded a sinkage of 35.8, 69.7, and 26.8 mm for the low, medium, and high soil moisture content levels, respectively. Based on this observation, as the press-wheel width decreased, the sinkage increased. The relationship between the press-wheel width and soil stress did not yield any clear indication of a trend (Figure 10b). The soil with high moisture content level produced higher stresses, as compared with the other soil moisture content levels. The soil with high moisture content level recorded stresses of 30,516, 26,577, and 28,501 Pa for the 0.122 m, 0.080 m, and 0.055 m press-wheel widths, respectively. The soil with low moisture content levels recorded lower stresses of 22,973, 22,351, and 25,625 Pa for the 0.122 m, 0.080 m, and 0.055 m press-wheel widths, respectively.
3.3.5. Velocity Flow Distribution of Soil Particles
The soil particles beneath the press-wheel in the soil–press-wheel interaction model were observed to move in a peculiar manner. This peculiar flow behaviour can be described or characterized into two regions (Figure 11a). The first region consisted of a forward region, where the soil particles flow or move in an anticlockwise direction. This was possible due to the contact force generated by the press-wheel to push particles forward and outwards creating a “bulldozing” phenomenon. The second region consisted of a rear region, where the soil particles flow or move in a clockwise direction. This can be described as a “digging” phenomenon, where the soil particles are moved outwards by the press-wheel. However, the area between the forward and rear regions had soil particles moved downwards. This was evident in the soil displacement contour (Figure 4). This flow distribution of soil particles was also observed by Zhao and Zang [26] when simulating tire–sand interaction using FEM/DEM applied models. During the passage of the press-wheel, soil particles (red) located 0.13 m directly beneath the surface had the highest velocity (0.09 m/s). The particles (green) with the least velocity recorded a value of 0.04 m/s at a depth of 0.25 m beneath the soil surface (Figure 11a). From the top view, the press-wheel affected soil particles (red) in a diameter of 0.27 m. The least affected soil particles (green) had a diameter of 0.49 m (Figure 11b).
4. Conclusions
In this study, a soil press-wheel model was developed to simulate soil–press-wheel interaction. The model results were validated using sinkage data from soil press-wheel experiments performed on sandy loam soil under three soil moisture contents: low, medium, and high. Then, the validated model was used to predict soil dynamic attributes under different widths and downforce of press-wheel. When compared to the experimental results, the press-wheel model predicted the soil sinkage and rolling resistance for each soil moisture content level adequately with overall relative mean error (RME) ranging from 13 to 23%. The model results showed that average peak stresses across the three soil moisture contents at a depth of 0.12 m were 22,467, 8700, and 6900 Pa for the vertical, horizontal, and lateral directions, respectively. The model predicted an increase in sinkage as the press-wheel width decreased. Increasing the down force on the press-wheel led to an increase in sinkage. The simulated sinkage was larger for the medium soil moisture content, regardless of the down force or width of the press-wheel. This study presented important information to agricultural equipment manufacturers when designing press-wheels for seeders. The optimal values for the operational use can be derived from the developed soil–press-wheel interaction model, but further testing will be needed to explore other parameters, such as tilt angle and tire cross-sectional shape. In terms of the profile of a tire, such as a flat tire cross-sectional shape, a larger tire contact area could be observed. However, the change in bulk density, sinkage and rolling resistance could vary. Determining soil variables, such as soil stresses, can be difficult to achieve. Therefore, the developed model was used to predict the soil stresses. However, the predicted soil stresses were not validated with measured stress data. It should also be noted that the developed model reflected the behaviour of a given sandy loam soil at certain moisture conditions. Further research is required for the different soil types and conditions.
Author Contributions
Conceptualization, Methodology, Resources, Formal analysis, Investigation, Validation, Writing—Original Draft, Data Curation, Visualization, K.A. and Y.C.; Supervision, Y.C.; Software, K.A. All authors have read and agreed to the published version of the manuscript.
Funding
This research was funded by Natural Sciences and Engineering Research Council of Canada (NSERC).
Institutional Review Board Statement
Not applicable.
Informed Consent Statement
Not applicable.
Data Availability Statement
Not applicable.
Acknowledgments
The authors would like to thank Vahid Sadrmanesh for his help in preparing the soil bin prior to the experiments.
Conflicts of Interest
We declare that we have no conflict of interest.
References
- Bayhan, Y.; Kayisoglu, B.; Gonulol, E. Effect of Soil Compaction on Sunflower Growth. Soil Tillage Res. 2002, 68, 31–38. [Google Scholar] [CrossRef]
- Hamza, M.A.; Anderson, W.K. Soil Compaction in Cropping Systems: A Review of the Nature, Causes and Possible Solutions. Soil Tillage Res. 2005, 82, 121–145. [Google Scholar] [CrossRef]
- Hanna, H.M.; Steward, B.L.; Aldinger, L. Soil Loading Effects of Planter Depth-Gauge Wheels on Early Corn Growth. Appl. Eng. Agric. 2010, 26, 551–556. [Google Scholar] [CrossRef]
- Chen, Y.; Tessier, S.; Irvine, B. Drill and Crop Performances as Affected by Different Drill Configurations for No-till Seeding. Soil Tillage Res. 2004, 77, 147–155. [Google Scholar] [CrossRef]
- Tessier, S.; Saxton, K.E.; Papendick, R.I.; Hyde, G.M. Zero-Tillage Furrow Opener Effects on Seed Environment and Wheat Emergence. Soil Tillage Res. 1991, 21, 347–360. [Google Scholar] [CrossRef]
- Saffih-Hdadi, K.; Défossez, P.; Richard, G.; Cui, Y.J.; Tang, A.M.; Chaplain, V. A Method for Predicting Soil Susceptibility to the Compaction of Surface Layers as a Function of Water Content and Bulk Density. Soil Tillage Res. 2009, 105, 96–103. [Google Scholar] [CrossRef]
- Smith, D.L.O.; Dickson, J.W. Contributions of Vehicle Weight and Ground Pressure to Soil Compaction. J. Agric. Eng. Res. 1990, 46, 13–29. [Google Scholar] [CrossRef]
- Rücknagel, J.; Götze, P.; Hofmann, B.; Christen, O.; Marschall, K. The Influence of Soil Gravel Content on Compaction Behaviour and Pre-Compression Stress. Geoderma 2013, 209–210, 226–232. [Google Scholar] [CrossRef] [Green Version]
- Asoodar, M.A.; Bakhshandeh, A.M.; Afraseabi, H.; Shafeinia, A. Effects of Press Wheel Weight and Soil Moisture at Sowing on Grain Yield. J. Agron. 2006, 5, 278–283. [Google Scholar] [CrossRef] [Green Version]
- McKyes, E. Soil Cutting and Tillage. Dev. Agric. Eng. 1989, 10, 192–221. [Google Scholar] [CrossRef]
- Kotrocz, K.; Kerényi, G. Modeling of the Soil-Rigid Wheel Interaction. Agric. Eng. 2015, 2014, 1–11. [Google Scholar]
- Khot, L.R.; Salokhe, V.M.; Jayasuriya, H.P.W.; Nakashima, H. Experimental Validation of Distinct Element Simulation for Dynamic Wheel-Soil Interaction. J. Terramech. 2007, 44, 429–437. [Google Scholar] [CrossRef]
- Mak, J.; Chen, Y. Simulation of Draft Forces of a Sweep in a Loamy Sand Soil Using the Discrete Element Method. Can. Biosyst. Eng. Genie Biosyst. Can. 2015, 56, 2.1–2.7. [Google Scholar] [CrossRef]
- Fielke, J.; Bayhan, Y. Effect of Set up Parameters for a Dual Tine and Presswheel Seeding Module on Seed Placement and Germination. Tarım Makinaları Bilim. Derg. 2011, 7, 191–197. [Google Scholar]
- O’Sullivan, C. Particulate Discrete Element Modelling; Routledge: London, UK, 2014. [Google Scholar] [CrossRef]
- Murray, S.E.; Chen, Y. Soil Bin Tests and Discrete Element Modeling of a Disc Opener. Can. Biosyst. Eng. Genie Biosyst. Can. 2018, 60, 21–210. [Google Scholar] [CrossRef] [Green Version]
- Sadek, M.A.; Chen, Y. Feasibility of Using PFC3D to Simulate Soil Flow Resulting from a Simple Soil-Engaging Tool. Trans. ASABE 2015, 58, 987–996. [Google Scholar] [CrossRef]
- Campbell, G.S. Soil Physics with Basic Transport Models for Soil-Plant Systems. In Developments in Soil Science; Campbell, G.S., Ed.; Elsevier: Amsterdam, The Netherlands, 1985; Volume 14. [Google Scholar]
- Potyondy, D.O.; Cundall, P.A. A Bonded-Particle Model for Rock. Int. J. Rock Mech. Min. Sci. 2004, 41, 1329–1364. [Google Scholar] [CrossRef]
- Nandanwar, M.; Chen, Y. Modeling and Measurements of Triaxial Tests for a Sandy Loam Soil. Can. Biosyst. Eng. 2017, 59, 2.1–2.8. [Google Scholar] [CrossRef] [Green Version]
- Lamandé, M.; Schjønning, P. The Ability of Agricultural Tyres to Distribute the Wheel Load at the Soil-Tyre Interface. J. Terramech. 2008, 45, 109–120. [Google Scholar] [CrossRef]
- Meirion-Griffith, G.; Spenko, M. A Modified Pressure-Sinkage Model for Small, Rigid Wheels on Deformable Terrains. J. Terramech. 2011, 48, 149–155. [Google Scholar] [CrossRef]
- Smith, W.; Melanz, D.; Senatore, C.; Iagnemma, K.; Peng, H. Comparison of Discrete Element Method and Traditional Modeling Methods for Steady-State Wheel-Terrain Interaction of Small Vehicles. J. Terramech. 2014, 56, 61–75. [Google Scholar] [CrossRef]
- Bayhan, Y.; Fielke, J.; Saglam, C. Performance of A Dual Tine And Presswheel Seeding Module for A Range of Speeds, Presswheels and Sowing Tine Alignments. Bulg. J. Agric. Sci. 2015, 21, 454–460. [Google Scholar]
- Johnston, A.M.; Lafond, G.P.; May, W.E.; Hnatowich, G.L.; Hultgreen, G.E. Opener, Packer Wheel and Packing Force Effects on Crop Emergence and Yield of Direct Seeded Wheat, Canola and Field Peas. Can. J. Plant. Sci. 2003, 83, 129–139. [Google Scholar] [CrossRef]
- Zhao, C.; Zang, M. Analysis of Rigid Tire Traction Performance on a Sandy Soil by 3D Finite Element-Discrete Element Method. J. Terramech. 2014, 55, 29–37. [Google Scholar] [CrossRef]
Figure 1.
(a) Press-wheel, test apparatus and soil bin; (b) Soil sinkage resulting from the press-wheel and collection of soil bulk density samples; (c) Measurement of soil surface elevation before and after a test run.
Figure 1.
(a) Press-wheel, test apparatus and soil bin; (b) Soil sinkage resulting from the press-wheel and collection of soil bulk density samples; (c) Measurement of soil surface elevation before and after a test run.

Figure 2.
Soil–wheel model indicating travel path.

Figure 3.
Measuring spheres equally placed beneath the travel path.

Figure 4.
Soil displacement contours resulting from the passage of the press-wheel: (a) top view of the soil surface; (b) soil cross-section parallel to the travel direction.
Figure 4.
Soil displacement contours resulting from the passage of the press-wheel: (a) top view of the soil surface; (b) soil cross-section parallel to the travel direction.

Figure 5.
(a) Parallel cross-section of soil bin, indicating general sinkage; (b) soil cross-section perpendicular to the travel direction showing sinkage (displacement contour).
Figure 5.
(a) Parallel cross-section of soil bin, indicating general sinkage; (b) soil cross-section perpendicular to the travel direction showing sinkage (displacement contour).

Figure 6.
Simulated instantaneous stress distribution curves in all directions from four measuring spheres (MS): (a) low moisture content; (b) medium moisture content and (c) high moisture content.
Figure 6.
Simulated instantaneous stress distribution curves in all directions from four measuring spheres (MS): (a) low moisture content; (b) medium moisture content and (c) high moisture content.

Figure 7.
Press-wheel width (W) effects on the stress–sinkage relationship for the three soil moisture content levels (SMCL) using data from first measuring sphere (MS-1): (a–c) Stress-sinkage relationship for 0.122 m press-wheel width across three soil moisture content levels; (d–f) Stress-sinkage relationship for 0.08 m press-wheel width across three soil moisture content levels; (g–i) Stress-sinkage relationship for 0.055 m press-wheel width across three soil moisture content levels.

Figure 8.
(a) Sinkage results for different down forces of press-wheel under different soil moisture levels; (b) soil stress versus press-wheel down forces under different soil moisture levels.
Figure 8.
(a) Sinkage results for different down forces of press-wheel under different soil moisture levels; (b) soil stress versus press-wheel down forces under different soil moisture levels.

Figure 9.
(a) Simulation of press-wheel under different widths (W); (b) imprinted widths for 0.122 m, 0.08 m and 0.055 m press-wheels after passage on soil with medium moisture content level.
Figure 9.
(a) Simulation of press-wheel under different widths (W); (b) imprinted widths for 0.122 m, 0.08 m and 0.055 m press-wheels after passage on soil with medium moisture content level.

Figure 10.
(a) Sinkage results for different press-wheel widths under different soil moisture levels; (b) soil stress versus press-wheel widths under different soil moisture levels.
Figure 10.
(a) Sinkage results for different press-wheel widths under different soil moisture levels; (b) soil stress versus press-wheel widths under different soil moisture levels.

Figure 11.
(a) Velocity flow distribution of soil particles during passage of press-wheel; (b) magnitude of velocity for soil particles directly beneath the press-wheel during passage (top view of model).
Figure 11.
(a) Velocity flow distribution of soil particles during passage of press-wheel; (b) magnitude of velocity for soil particles directly beneath the press-wheel during passage (top view of model).


Table 1.
Model input parameters taken from Nandanwar and Chen [20].
Table 1.
Model input parameters taken from Nandanwar and Chen [20].
| Model Parameter | Description and Unit | Value |
|---|---|---|
| Ball parameter | ||
| Particle normal stiffness (N/m) | ||
| Particle shear stiffness (N/m) | ||
| βn | Viscous damping coefficient | 1.0 |
| damp | Local damping coefficient | 0.5 |
| Bond parameter | ||
| Bond radius multiplier (dimensionless) | 0.5 | |
| Normal bond stiffness (pa/m) | ||
| Shear bond stiffness (pa/m) | ||
| σ | Normal bond strength (pa) | |
| τ | Shear bond strength (pa) | |
Table 2.
Mean values of the variables measured in the soil bin experiment at different soil moisture contents levels.
Table 2.
Mean values of the variables measured in the soil bin experiment at different soil moisture contents levels.
| Moisture Content | Change in Soil Bulk Density (Kg/mm3) | Sinkage (mm) | Rolling Resistance (N) | |||
|---|---|---|---|---|---|---|
| Mean 1 | Standard Deviation | Mean 1 | Standard Deviation | Mean 1 | Standard Deviation | |
| Low | 60.5c | 18.9 | 27.7a | 1.8 | 104.4ab | 8.8 |
| Medium | 249.0a | 38.5 | 26.7a | 1.1 | 89.9b | 18.4 |
| High | 110.0b | 8.9 | 25.2a | 4.2 | 113.6a | 18.8 |
1 Values followed by different letters were significantly different at a probability of 0.05.
Table 3.
Relative mean errors of measured and simulated rolling resistance results.
| Moisture Content | Sinkage (mm) | Rolling Resistance (N) | Overall RME * (%) | ||
|---|---|---|---|---|---|
| Measurement | Simulation | Measurement | Simulation | ||
| Low | 27.7 | 20.4 | 104.4 | 104.0 | 13.2 |
| Medium | 26.7 | 38.0 | 82.9 | 80.6 | 22.7 |
| High | 25.2 | 20.3 | 113.6 | 138.6 | 20.8 |
* RME stands for relative mean error.
Table 4.
Mean values of simulated peak stresses at different soil moisture content levels.
| Moisture Content | Vertical Stress (Pa) | Lateral Stress (Pa) | Horizontal Stress (Pa) | |||
|---|---|---|---|---|---|---|
| Mean | Standard Deviation | Mean | Standard Deviation | Mean | Standard Deviation | |
| Low | 22,800 | 3.3 | 7100 | 1.1 | 9200 | 0.5 |
| Medium | 21,300 | 2.9 | 6800 | 1.0 | 8500 | 1.3 |
| High | 23,300 | 4.2 | 6800 | 1.1 | 8400 | 1.1 |
Publisher’s Note: MDPI stays neutral with regard to jurisdictional claims in published maps and institutional affiliations. |
© 2021 by the authors. Licensee MDPI, Basel, Switzerland. This article is an open access article distributed under the terms and conditions of the Creative Commons Attribution (CC BY) license (https://creativecommons.org/licenses/by/4.0/).
Share and Cite
MDPI and ACS Style
Acquah, K.; Chen, Y. Discrete Element Modelling of Soil Compaction of a Press-Wheel. AgriEngineering 2021, 3, 278-293. https://0-doi-org.brum.beds.ac.uk/10.3390/agriengineering3020019
AMA Style
Acquah K, Chen Y. Discrete Element Modelling of Soil Compaction of a Press-Wheel. AgriEngineering. 2021; 3(2):278-293. https://0-doi-org.brum.beds.ac.uk/10.3390/agriengineering3020019
Chicago/Turabian StyleAcquah, Kobby, and Ying Chen. 2021. "Discrete Element Modelling of Soil Compaction of a Press-Wheel" AgriEngineering 3, no. 2: 278-293. https://0-doi-org.brum.beds.ac.uk/10.3390/agriengineering3020019