Article

Harvester Evaluation Using Real-Time Kinematic GNSS and Hiring Service Model

by
Md. Kamrul Hasan
1,2,
Takashi S. T. Tanaka
3,*,
Md. Rostom Ali
2,
Chayan Kumer Saha
2 and
Md. Monjurul Alam
2
1
The United Graduate School of Agricultural Science, Gifu University, Gifu 5011193, Japan
2
Department of Farm Power and Machinery, Bangladesh Agricultural University, Mymensingh 2202, Bangladesh
3
Faculty of Applied Biological Sciences, Gifu University, Gifu 5011193, Japan
*
Author to whom correspondence should be addressed.
Submission received: 28 April 2021 / Revised: 27 May 2021 / Accepted: 2 June 2021 / Published: 6 June 2021

Abstract

:
To reduce human drudgery and the risk of labor shortages in the Asian developing countries, the appropriate introduction of agricultural machinery, especially combine harvesters, is an urgent task. Custom hiring services (CHSs) are expected to contribute to making paddy harvesters prevalent in developing countries; however, the economic performance has been rarely quantified. The study was carried out to precisely evaluate the machine performance attributes of medium and large combine harvesters using the real-time kinematic (RTK) global navigation satellite system (GNSS) and to estimate the economic performance of CHSs of paddy harvesters in Japan, as a typical case of Asian countries. The financial profitability was evaluated by four major indicators: net present value, benefit–cost ratio, internal rate of return, and payback period. The financial indicators showed that both types of harvester could be considered financially viable. Thus, the investment in combine harvesters can be highly profitable for CHS business by a local service provider and custom-hire entrepreneur, providing a great opportunity to use a combine harvester without initial investment by general farmers. The findings demonstrated the high feasibility of CHSs of paddy harvesters in Japan, while they highlighted that further study is needed to estimate the feasibility of CHS in the other Asian developing countries.

1. Introduction

Agricultural mechanization is a crucial input for profitable crop production but historically has been neglected in the context of developing countries. Mechanization technologies continue to change with the industrial growth of a country and socioeconomic advancement of farmers [1]. Due to the migration of labor in nonagricultural sectors, shortages of labor and costs for paddy harvesting are serious problems in the peak harvesting season [2]. Currently, timely harvesting of paddies is a major challenge due to the shortage and high cost of labor. Harvests delayed by 5, 7, and 10 days resulted in 3%, 6%, and 11% decreases in paddy yields, respectively [3]. Developed countries worldwide are currently using automatic combine harvesters for harvesting cereal grains, while many developing countries are still using reapers for harvesting paddies and wheat to minimize production costs [4]. In comparison to harvesting manually, using mini-combine harvesters can save 97.5% of time, 61.5% of costs, and 4.9% of grain losses on average [5]. Adoption of modern mechanical harvesting practices, i.e., combine harvesters, is urgently needed to save money, time, and labor by reducing human labor, labor costs, and losses during harvesting and increasing cropping intensity, crop productivity, and economic freedom. The average time, cost, and grain savings obtained by using a combine harvester over manual methods were 97.50%, 35.00%, and 2.75%, respectively [6].
In addition to mechanizations in agricultural sectors, agricultural production systems have benefited from the incorporation of technological advances primarily developed for other industries. Precision agriculture (PA) is one of the top ten revolutions in agriculture [7] that uses information technology, including global navigation satellite system (GNSS), geographic information system (GIS), remote sensing, miniaturized computer components, automatic control, telecommunications, and proximal data gathering, to optimize returns on inputs while potentially reducing environmental impacts [8]. Precision agriculture generally involves better management of farm inputs [9] and is conceptualized by a system approach to reorganize the total system of agriculture towards low-input, high-efficiency, and sustainable agriculture [10]. The invention of the automatic navigation technology of the harvester can effectively reduce the driver’s work intensity while improving the operating efficiency, which is of great significance [11,12]. Now, agricultural machinery navigation systems based on the real-time kinematic (RTK) GNSS have been adopted and are widespread [13]. The technology of GNSS can be used effectively to determine a harvester’s speed, operational time, turning time, and idle time throughout field operations. In all cases, the efficiency of farm machinery operations can be affected by three factors: (i) travel speed, (ii) effective swath width, and (iii) field traffic pattern [14]. With the harvesting speeds ranging from 0.8 to 4.5 km h−1, the mini-combine harvester had a field capacity of 0.10 to 0.39 ha h−1 and consumed as much as 11 L ha−1 of fuel while having a track slip of 6% to 9% [15]. Therefore, the speed of a harvester directly affects machine capacity and efficiency. Harvest efficiency showed a stronger relationship with turning time than with field efficiency, and the values of both were negative. Efficiencies decrease with increasing turning time per acre. More than 60% of the variability in harvest efficiency was captured with turning time, which is substantially better than that obtained with unloading time [16]. Considering two harvest patterns, results reveal that field efficiency could be improved by optimizing harvest patterns [17]. Machine idle time is also one of the most important factors in reducing machine efficiency. Machine idling during harvesting can occur for many reasons, such as an operator’s issue, clogs in the machine, and disturbances in the field. Idling of machines contributes to ineffective field operation, thus reducing field efficiency [18]. The GNSS-based evaluation of heading changes and harvesting tracks can be considered a method for utilizing harvesting machines more efficiently.
The automated combine harvester and RTK GNSS, which allows a precise evaluation of machine performances, are available in Japan. Japan’s small agricultural sector is highly mechanized, sophisticated, and automated. It has a strong farm machinery industry with export to Asian countries and other regions of the world. Many machinery designs currently found in Southeast Asian countries for transplanting, harvesting, and milling were developed in Japan [19]. Japan’s machinery research and development have been oriented towards high technology applications, new farm machinery with much higher field capacity, automation of farm machinery, agricultural robots, energy saving and alternative energy development, and biotechnological equipment and devices [20]. Conversely, the knowledge about either the feasibility or economic benefit of farm machinery management is still largely insufficient in the other Asian developing countries. Suitable machinery, especially harvesting machinery is an urgent need to increase production in the developing countries by reducing drudgery, increasing efficiency, and lowering cost [21].
Due to high initial investment, a combine harvester is not suitable for the small, marginal, and low-income farmers. However, there is an opportunity to use it through a custom-hire service (CHS) to avoid the initial investment issue. As a result, even the smallest farm households can usually access relatively affordable machinery services through a CHS [22,23]. Most private equipment owners started providing the CHS of various machines to the farmers at appropriate times and at reasonable rates which ultimately reduce the fixed cost of farm operations and reduce the burden of capital investments or credit from the bank. The cost of farm operations could be reduced to almost half by custom hiring of the machinery services [24]. Local machinery service providers are conducting business in the agricultural field as CHSs [25].
The main objective of this study was to evaluate the benefit of mechanical harvesting in Japan. Considering the research goal, we evaluated the machine performance attributes precisely by using georeferenced data recorded by GNSS receivers during field operations. In this study, we also conducted a field survey to assess the present mechanization situation, especially during paddy harvesting. The precise information on machinery performance attributes in Japan would be valuable in considering the feasibility of spreading combine harvesters in developing countries because of the similarities in farming scale and field capacity. Therefore, we conducted a detailed study to determine the harvester performances precisely and estimated the economic performance of CHSs of paddy harvesters in Japan.

2. Methodology

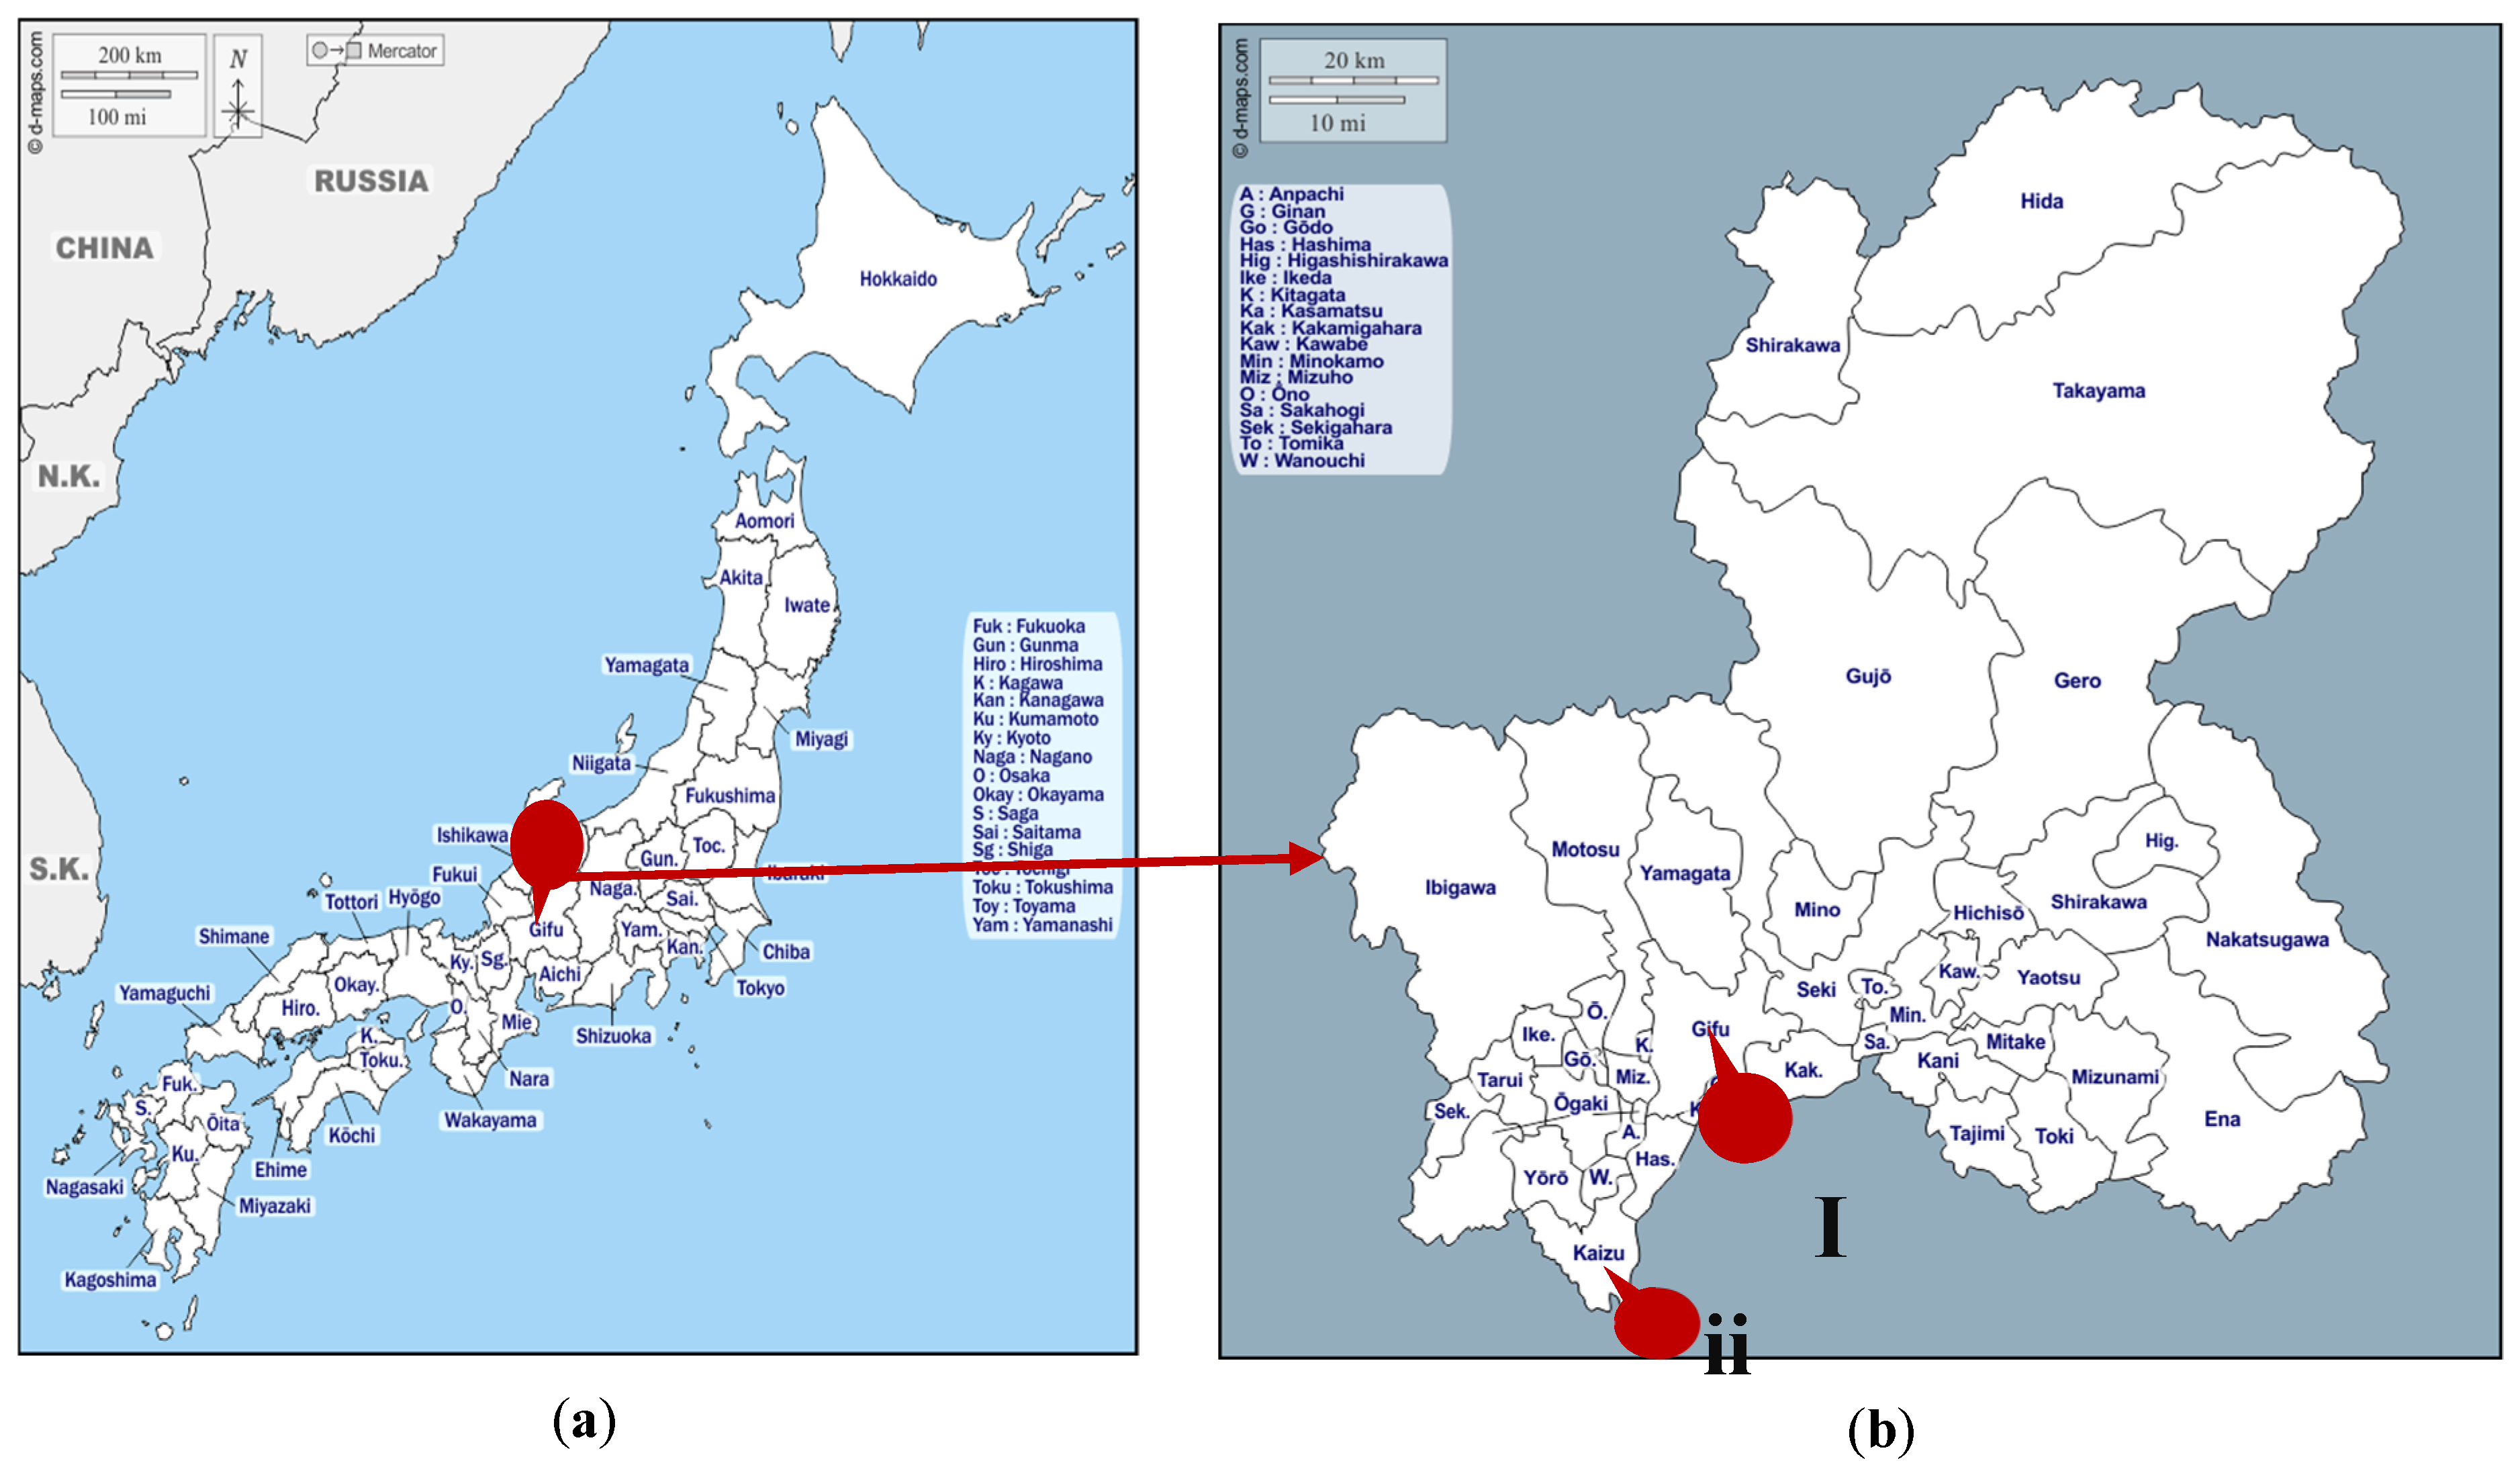
2.1. Experimental Locations

To assess the performance of paddy harvesters, three experiments were carried out in two different working locations, as shown in Figure 1. One location was in the research field of Gifu University, and the other location was in a farmer’s field in Kaizu city in Gifu (35.4234° N, 136.7606° E), Japan.

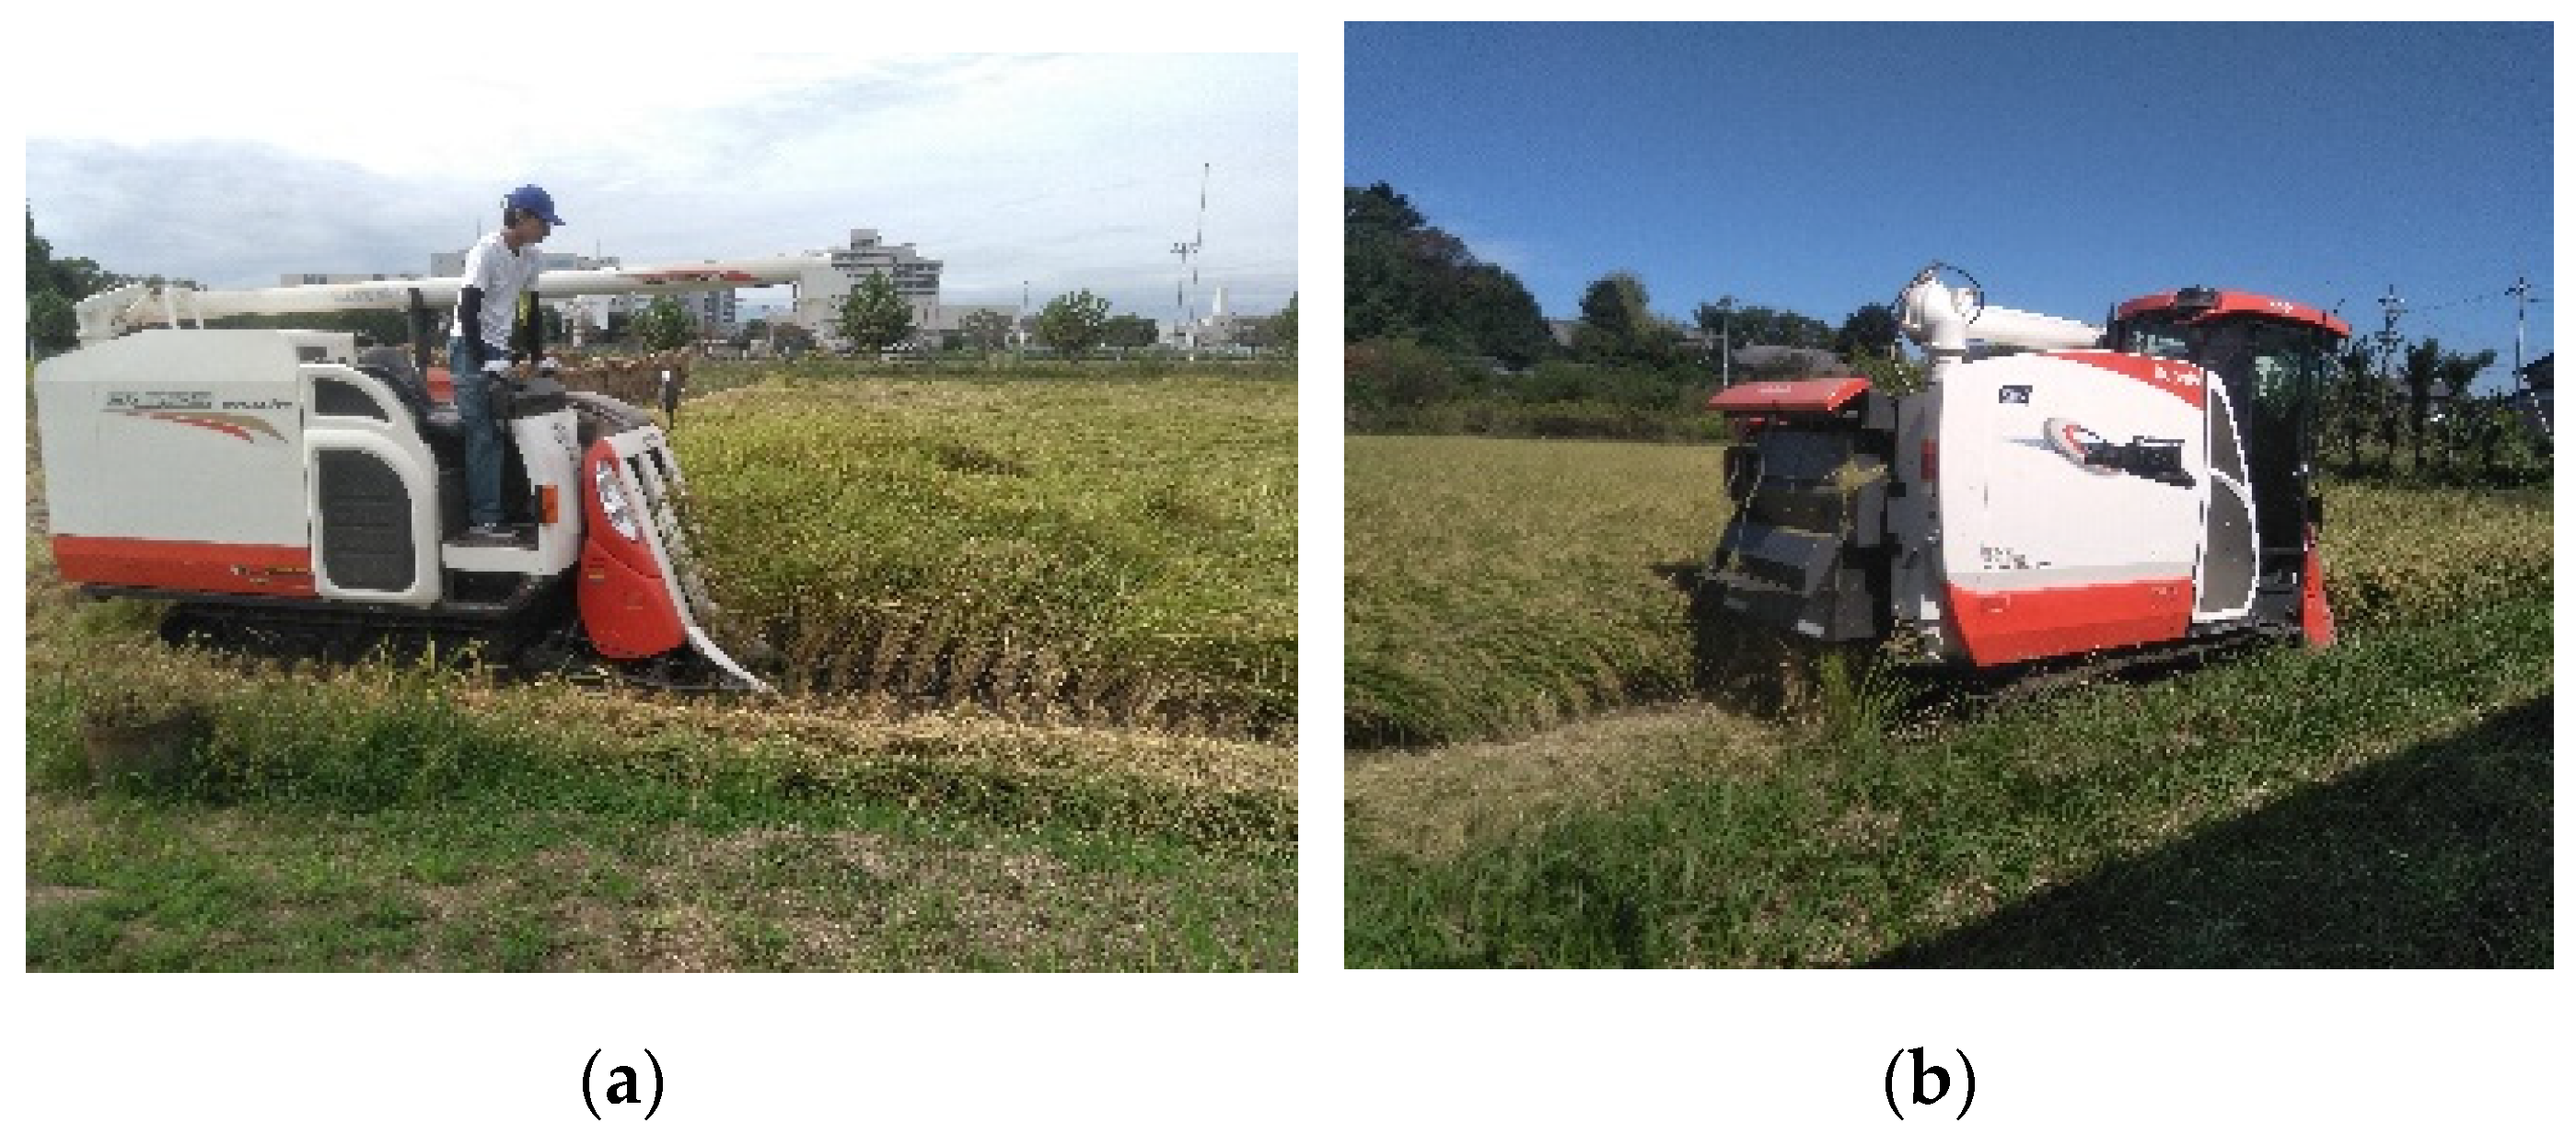
2.2. Selected Harvesting Machines

Two types of Kubota combine harvesters were used for mechanical harvesting of the paddies at the experimental locations in Japan, as shown in Figure 2. One was medium (Model: ER329), and the other was large (Model: ER6120). Both harvesters are manufactured by Kubota Corporation (Osaka, Japan). A brief description of the technical specifications of the harvesters is presented in Table 1.

2.3. In-Field Activities and Performance Indicators

Before starting the field test, the soil conditions, crop conditions, number of tillers/hills, and yield conditions were recorded. Engine fuel and oil levels were checked before operation. To cross-check the RTK GNSS receiver data during mechanical harvesting, each plot was measured using a measuring tape, and the total harvesting time and idle time were recorded using a stopwatch. Additionally, after completing the harvesting operation in each plot, fuel consumption, labor requirements, and grain yields were recorded. Grain losses were collected in a polythene bag and measured after completion of the harvesting operation for further analysis.
To assess the technical performance of the combine harvester during paddy harvesting, some parameters were analyzed after collecting the GNSS receiver data, i.e., harvesting area, harvesting time, harvesting track, harvesting speed, average harvesting speed, speed variation during harvesting, turning loss time, idle time of harvesting, effective/active harvesting time, and effective field capacity of the harvester.

2.4. Data Collection during Mechanical Harvesting

Performance analysis is the most important part of developing an appropriate business policy for agricultural machinery; i.e., mechanical harvesting of paddies is more profitable than traditional manual harvesting systems. For better analysis, original data were collected through field experiments during paddy harvesting in the selected locations. Experimental data were collected using an RTK GNSS (Model: U-Blox M8T, Switzerland). First, paddy fields and harvesters were prepared for harvesting the experimental field. The rover station of the GNSS receiver was fixed on top of the harvester, and the base station was kept beside the experimental field. This module can receive satellite signals from the global positioning system (GPS), Galileo, Beidou, and quasi-zenith satellite system (QZSS) at a one-second interval. Uses of RTK can easily obtain cm-level accuracy of user positions in real time by using the measurements of GNSS signals received both at the user receiver and at the base station [27].

2.5. Data Analyses

The data recorded by the GNSS receiver were analyzed with the following steps:
(i)
Positioning
RTKLIB ver. 2.4.3 b33 was used for analysis and reviewing the data quality received by the rover and base station of the GNSS receivers according to the standard protocol. RTKLIB is a compact and portable program library written in C to provide a standard platform for RTK GNSS applications [28]. The position of the base rover was evaluated by static analysis. The GNSS-based control station of the Geospatial Information Authority of Japan was used for the reference to determine the position of the base station. The coordinates of the rover station were determined by kinematic analysis using the reference base station.
(ii)
Mapping
In this study, the harvesting time, harvesting area, harvesting track, harvester speed, and speed variation during harvesting operation were evaluated from georeferenced data and visually represented by using ArcGIS 10.3 (Esri, Inc., Redlands, CA, USA).
(iii)
Identification of operations
R version 3.5.3 (11 March 2019) was used to create a histogram to show the frequency of velocity during mechanical harvesting using a combine harvester. We assumed that bin width may represent the different harvesting conditions (e.g., harvesting, idle, and unloading time), and 5 bins were used for the identification.

2.6. Cost Determination

In this study, the economic profitability of the combine harvester was estimated based on cost analysis. The cost analysis was performed considering the fixed and variable costs to determine the operating cost of the harvester.

2.6.1. Fixed Cost

Fixed costs are fixed in total but decline per ha as the annual use of a machine increases [29]. Fixed costs consist of those costs that must be borne regardless of the machine used. These costs include (i) depreciation cost; (ii) interest in investment; and (iii) taxes, shelter, and insurances.
(i)
Depreciation cost: Depreciation is the reduction in the value of a machine as a result of use (wear and tear) and obsolescence (availability of newer and better models). In the calculation of a fixed cost, sinking-fund depreciation is assumed and was calculated by the following equation [30]:
D = [ ( P S ) { ( 1 + i ) L ( 1 + i ) n ( 1 + i ) L 1 } + S ] [ ( P S ) { ( 1 + i ) L ( 1 + i ) n + 1 ( 1 + i ) L 1 } + S ]
where D = depreciation, USD year−1; P = purchase price, USD; S = salvage value (10% of P), USD; L = effective working life of machine, years; n = age of the machine in years at the beginning of the year, years; and I = annual bank interest rate, decimal.
(ii)
Interest on investment: The interest on investment for a combine harvester is included in the fixed cost estimation. The following equation was used for the calculation of interest on investment [30]:
Interest   on   investment ,   I = P + S 2 i   ( USD   year 1 )
where P = purchase price, USD; S = resale value, USD; and i = annual interest rate.
(iii)
Taxes, Shelter, and Insurance (STI): The shelter, tax, and insurance were considered in calculating the fixed cost of the harvesting machine. The following equation was used for the calculation of STI [30]:
STI = 2.5% of P
where P = purchase price of the harvester, USD.

2.6.2. Variable Cost

The variable cost of a combine harvester is reflected by the cost of fuel, lubrication, daily service, power, and labor cost. These costs increase with increasing machine use and vary to a large extent in direct proportion to hours or days of use per year. The cost of operator/labor was calculated as the labor rate in USD h−1. The fuel and oil costs were estimated from the consumption rate and multiplied by their respective prices. Fuel cost, oil cost, labor cost, and repair and maintenance cost were determined using the following equations [30]:
Fuel   cost ,   F   ( USD   ha 1 ) = Fuel   consumed   ( L   day 1 ) × Price   ( USD   L 1 ) Area   covered   ( ha   day 1 )
Oil cost, O (USD ha−1) = 15% of Fuel cost, F
Labor   cost ,   L   ( USD   ha 1 ) = Sum   of   wages   of   labor   ( USD   day 1 ) Area   covered   ( ha   day 1 )
Repair and maintenance cost, R&M (USD ha−1) = 0.025% of purchase price
Total variable cost = (F + O + L + R&M + Mc) USD ha−1
Mc = Miscellaneous cost, USD ha−1

2.6.3. Operating Cost

The operating costs are recurring costs that are necessary to operate and maintain a machine during its useful life [31]. The main operating costs of the combine harvester were divided into fixed costs and variable costs. The following equation was used to calculate the operating cost, considering the sum of the fixed and variable costs.
Operation cost (USD ha−1) = Fixed cost (USD ha−1) + Variable cost (USD ha−1)

2.7. Sinking Fund Annual Payment (SFP) or Payment for Replacement

The replacement of a machine by a new one is essential because beyond economic life it is no longer useful for field operation. The performance of a new machine is significantly superior, and it makes the old machine inoperative. Anticipated costs for operating the old machine exceed those of a replaced machine. Uniform annual payments to a fund are of such a size that by the end of the life of the machine the funds and their interest have accumulated to an amount that will purchase another equivalent machine. The following equation was used to find the sinking fund annual payment (SFP) [30]:
Sin king   fund   annual   payment ,   SFP = ( P S ) × i ( 1 + i ) L 1 × 100
where P = purchase price of harvester, USD; S = salvage value, USD; L = life of harvester, years; and i = interest rate, decimal.

2.8. Rent-Out Charge

The rent-out charge is determined by the machine operational cost, sinking fund annual payment, and business profit. An entrepreneur can estimate the harvester rent-out charge from the following expression:
Rent-out charge = Operating cost + Sinking fund annual payment + Estimated profit
The profit of the entrepreneur depends on the socio-economic condition of the harvester user as well as the country. In this study, the profit of the entrepreneur was estimated on the basis of middle-class family income in Japan.

2.9. Economic Analysis for Custom-Hire Service Business

The project appraisal technique has been followed to estimate the profitability of harvesters from the view of the owners. There are four alternative discounting measures that are commonly applied for project appraisal [32,33]. These measures are (a) net present value (NPV), (b) benefit–cost ratio (BCR), (c) internal rate of return (IRR), and (d) payback period (PP). However, this appraisal is based on four assumptions, which are as follows: (i) all the devices are purchased with cash, (ii) operation technology remains unchanged throughout the project life, (iii) prices of all inputs and outputs are given and constant throughout the project life, and (iv) 0.25% interest rate is used for calculating NPV and BCR.

2.9.1. Net Present Value (NPV)

The NPV is a scientific method of calculating the present value of cash flows. The NPV is computed by finding the difference between the present worth of benefit stream minus the present worth of cost stream. Both inflows and outflows of an investment proposal, a discount rate, and subtracting the present value of outflows are used to get the NPV. It is simply the present worth of the cash flow stream, since it is a discounted cash flow measure of project worth along with IRR. The NPV is calculated by using the following formula:
NPV = ∑PWB − ∑PWC
where PWB = present worth of benefits and PWC = present worth of costs.

2.9.2. Benefit–Cost Ratio (BCR)

The BCR is an important factor for measuring the profitability of using a combine harvester. The BCR is the ratio of present worth of benefit stream to present worth of cost stream. If the BCR is greater than unity, then it will be economically viable. The method of benefit–cost analysis is simple in principle. The BCR is calculated by using the following formula:
BCR = ∑PWB/∑PWC
where PWB = present worth of benefits and PWC = present worth of costs.

2.9.3. Internal Rate of Return (IRR)

The IRR is the value of the discount factor when the NPV is zero. It is considered to be the most useful measure of project worth. The IRR is also a relative measure that may be defined as the average earning power of the money invested in a project over the project life [34]. It represents the average earning power of the money used in the project over the project life. The IRR is not affected by the rate of discount, while the NPV may change as a result of using different discount rates [35,36]. It is the maximum interest that a project can pay for the use of resources if the project is to recover its investment and operating cost and still break even. At this point, the BCR is equal to unity. IRR is usually found by trial and error, by interpolation and using the following equation:
IRR = LIR + ( HIR LIR ) × NPV LIR NPV HIR NPV LIR
where LIR = lower interest rate and HIR = higher interest rate.

2.9.4. Payback Period (PP)

The PP is the length of time in which the costs of investment can be recovered by revenues. Shorter paybacks mean more attractive investments. Depreciation is not included in the computation of cost to avoid double accounting since the initial capital is included in the computation. The PP can be computed by applying the following formula:
PP = Total initial investment (USD)/Annual profit (USD yr−1)

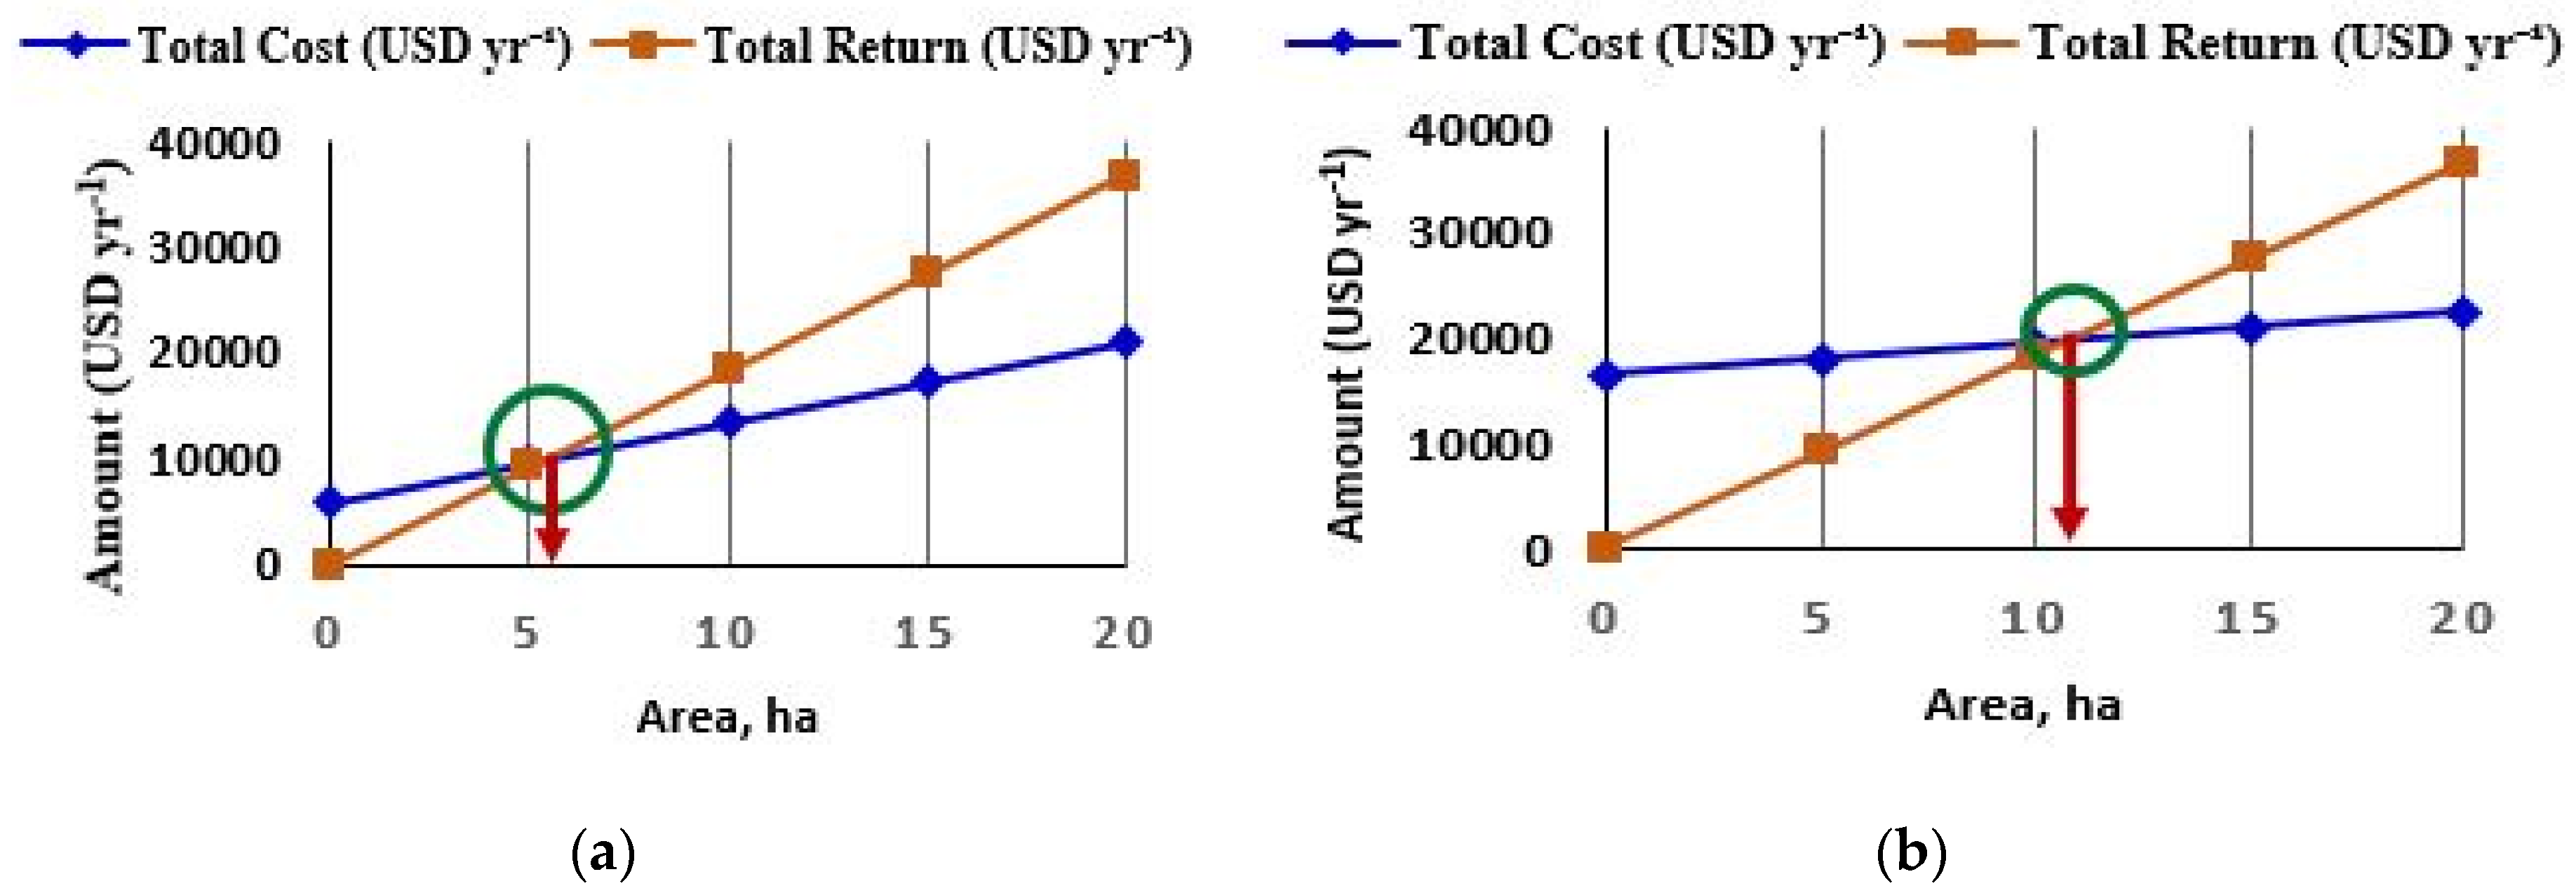
2.10. Break-Even Use

The break-even analysis is a useful tool to study the relationship between operating costs and returns. It is the intersection point at which neither profit nor loss occurs. Above this point, the machine use can be considered as net gain [32]. The break-even use of a combine for capital recovery depends on its capacity of harvesting, power requirement, labor requirement, and other charges.
Break-even use (ha yr−1) = Investment, USD yr−1/(Return − Operating cost) USD ha−1

3. Results and Discussion

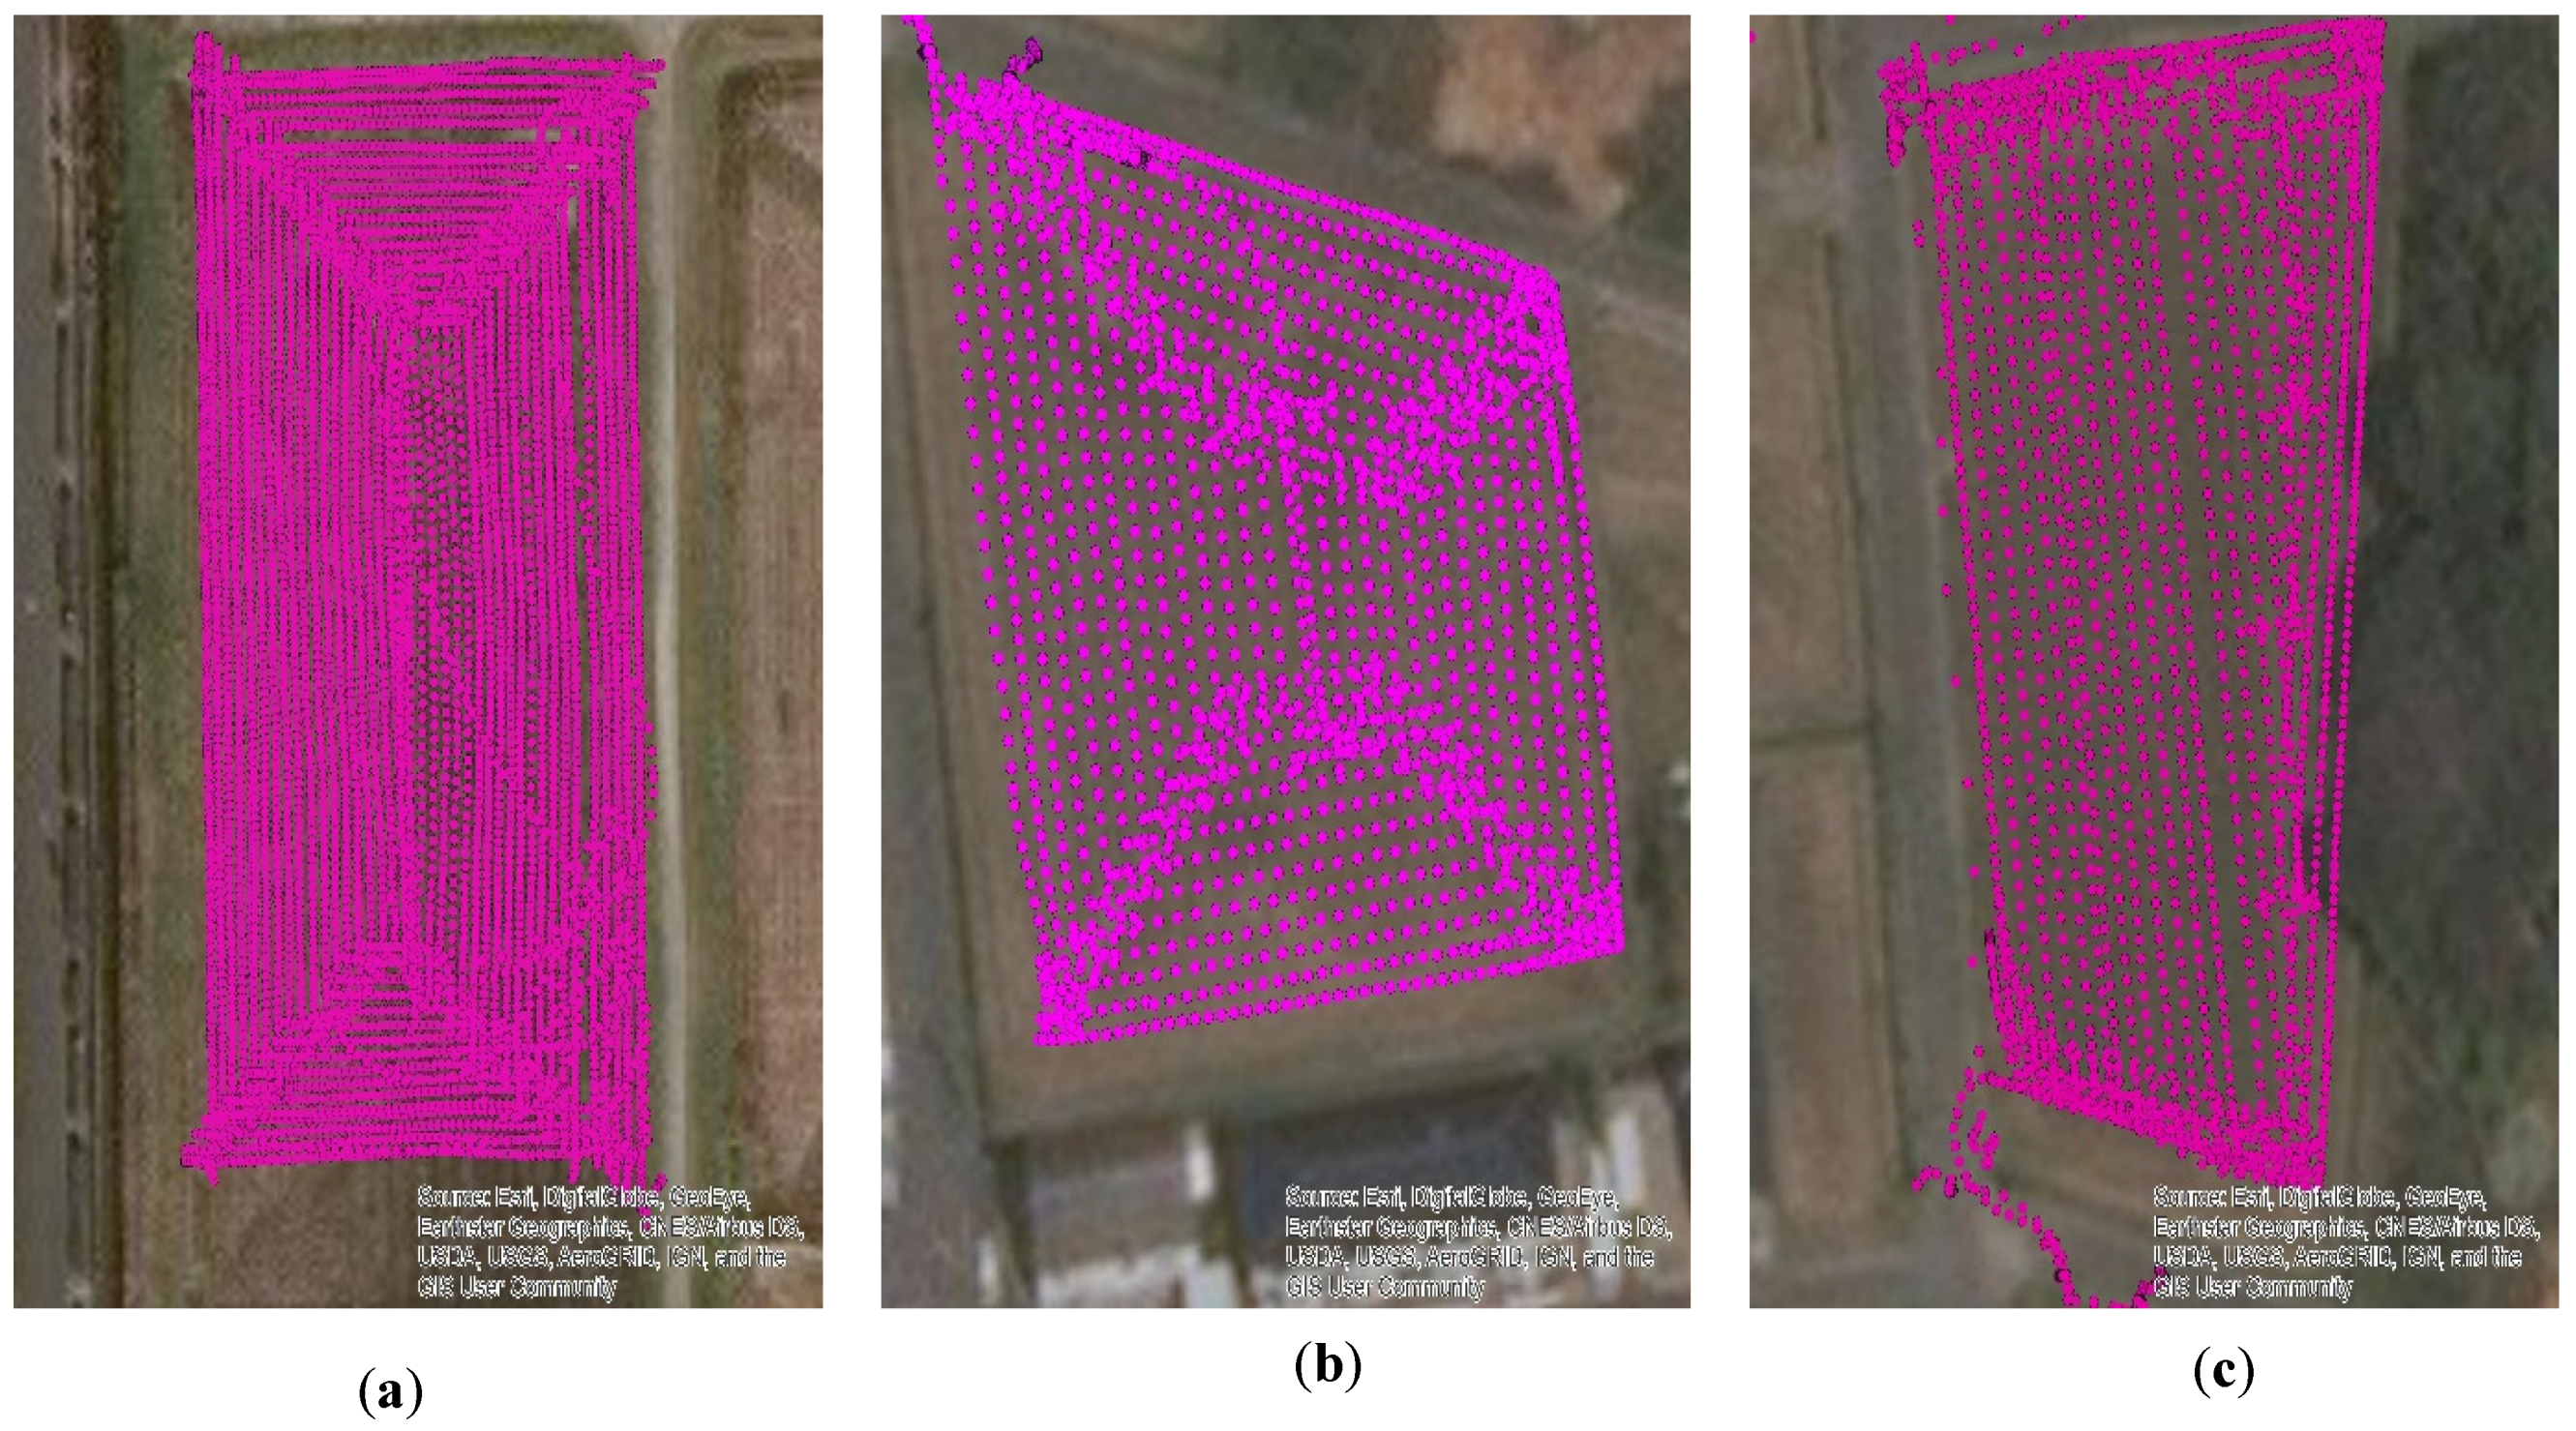
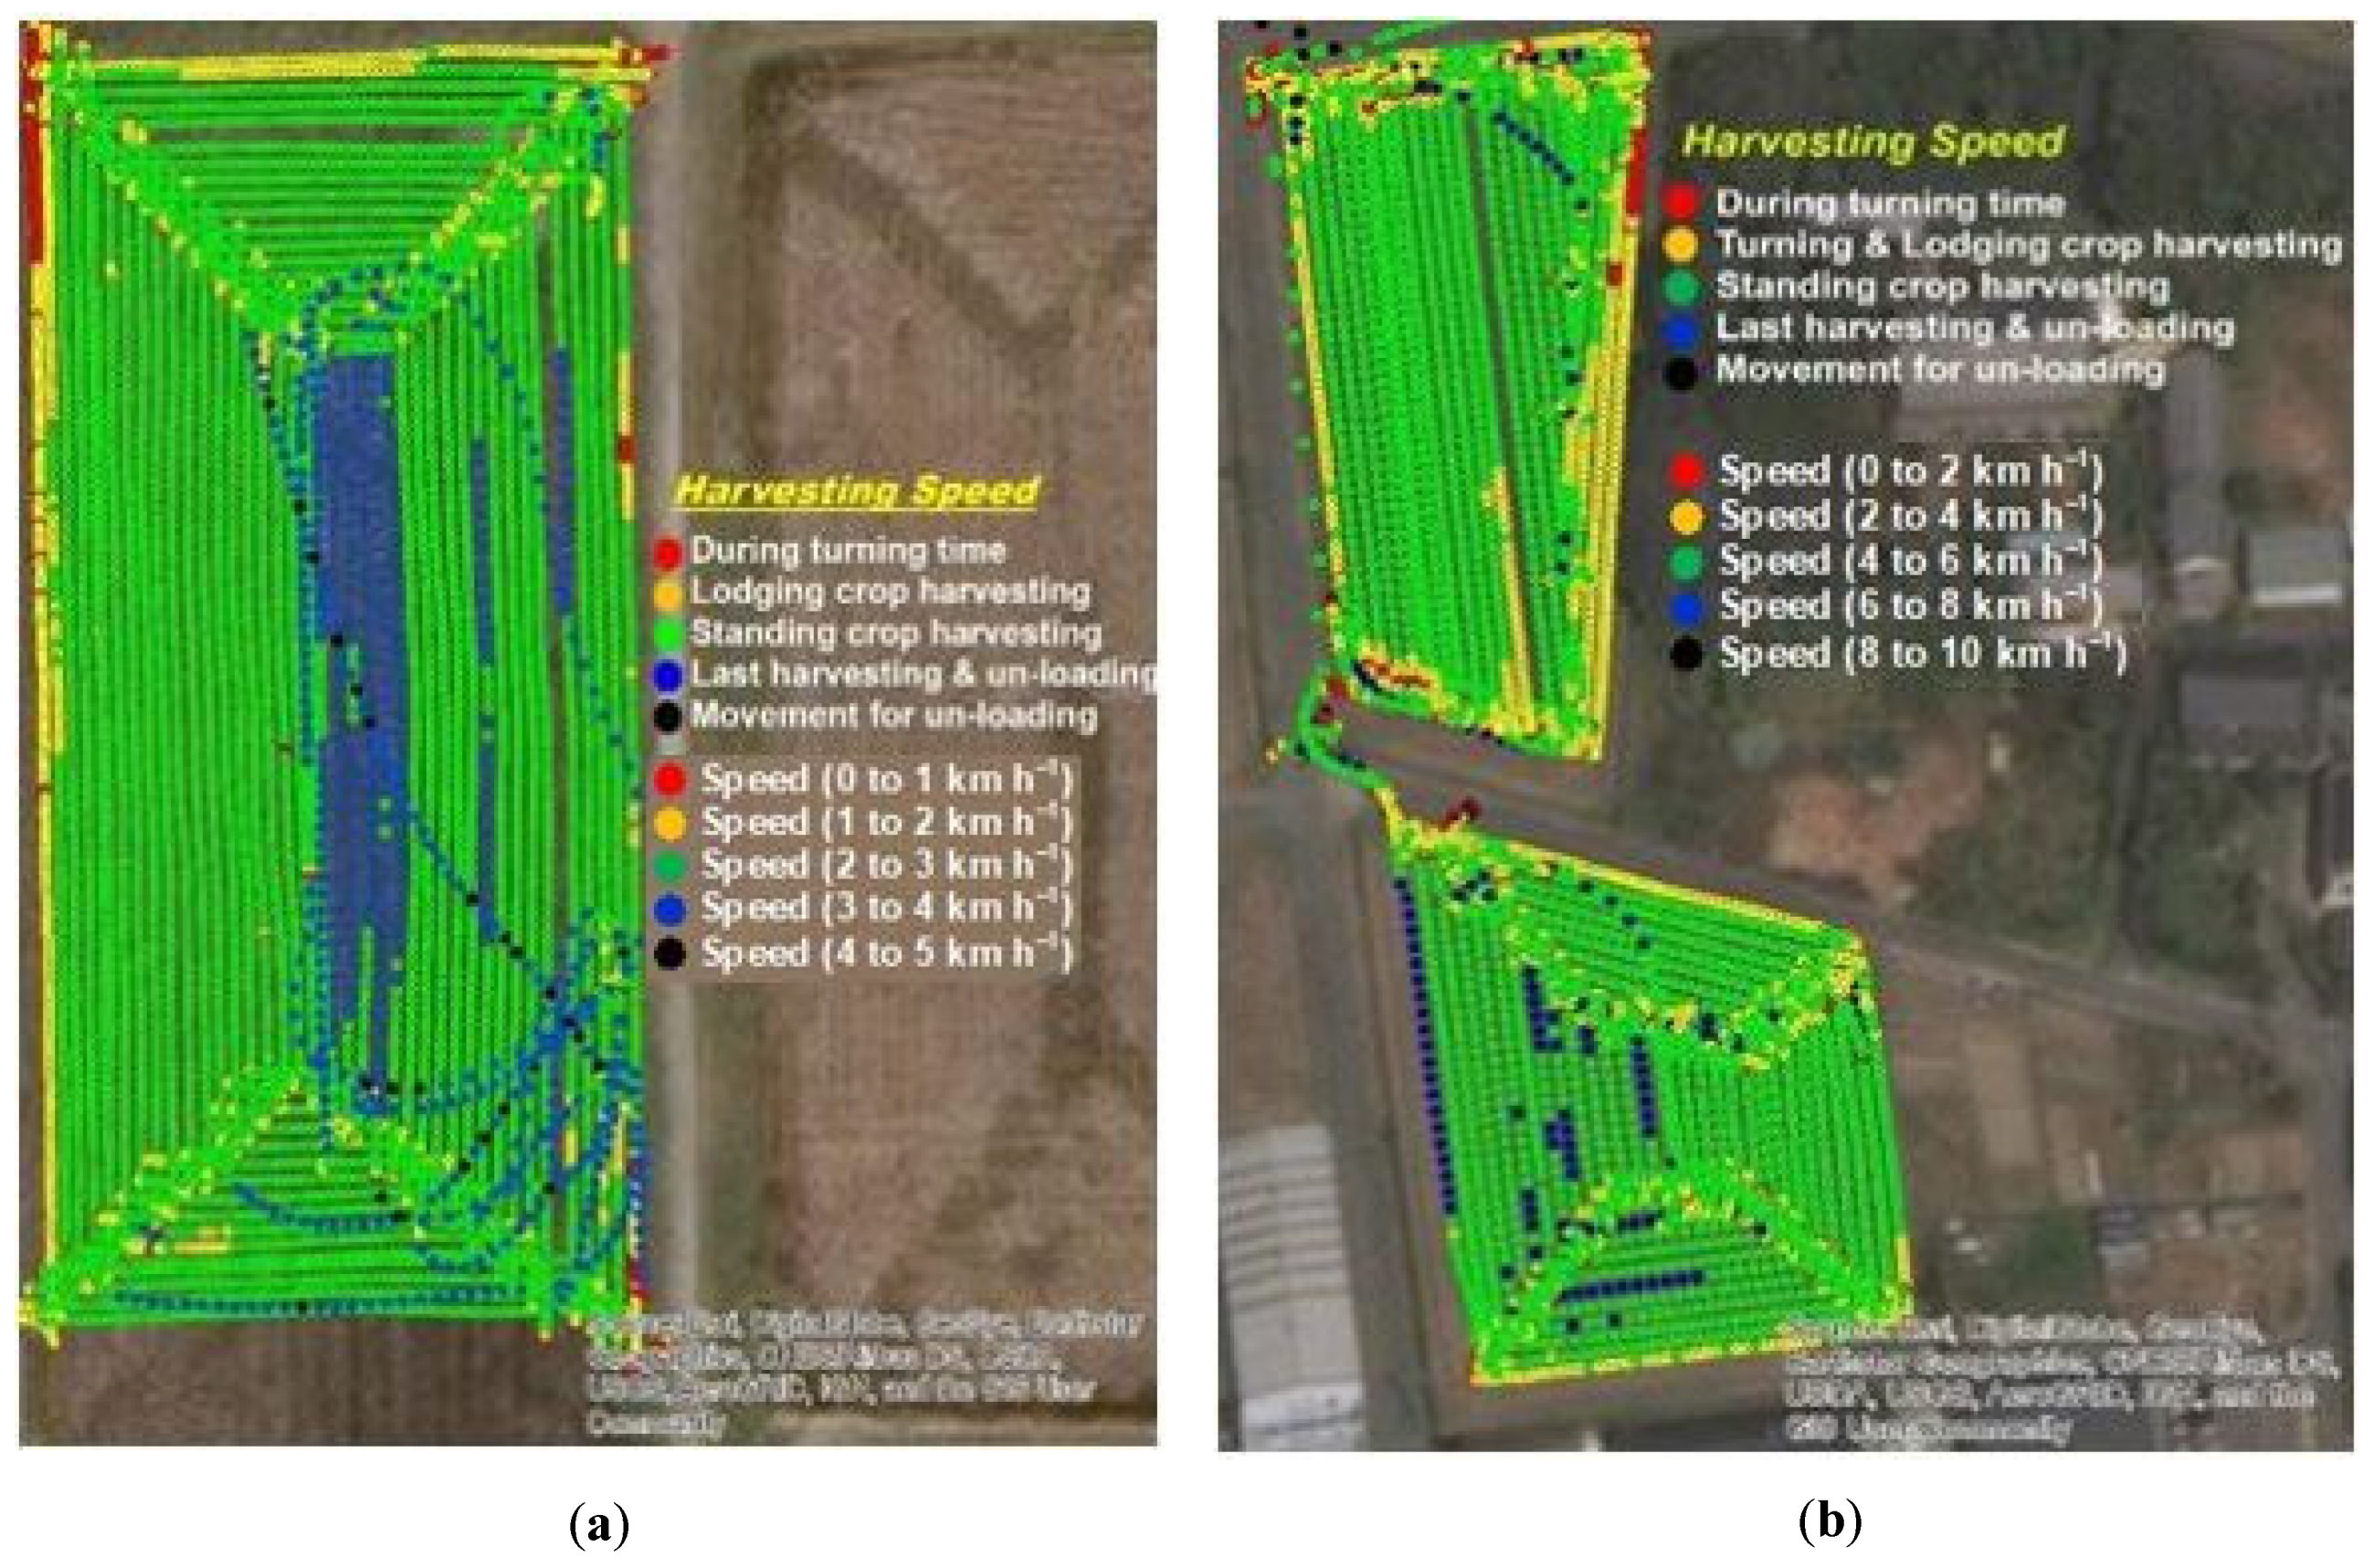
3.1. Harvesting Track and Harvested Area of the Combine Harvester

Harvesting tracks for each plot were identified and are presented in Figure 3a–c. In Figure 3, pictures (a–c) represent the harvesting tracks of Plot 1, Plot 2, and Plot 3, respectively. Picture (a) represents the harvesting track of the medium combine harvester (Model: ER329) during harvesting at the research field of Gifu University, and the other two pictures (b and c) represent the harvesting track of the large combine harvester (Model: ER6120) at the farmer’s field in Kaizu city, Japan. Additionally, some other movement tracks in each plot are visible, which represent the movement path of the harvester during the unloading and return to the previous harvesting point. After each grain tank fill-up, the harvester was moved to a certain place to unload the grain, but it did not follow any certain path to that place or any return path to the previous harvesting point; thus, the GNSS receiver recorded these tracks within the harvesting operational track. The estimated harvesting areas were 0.303, 0.315, and 0.308 ha for Plot 1, Plot 2, and Plot 3, respectively.

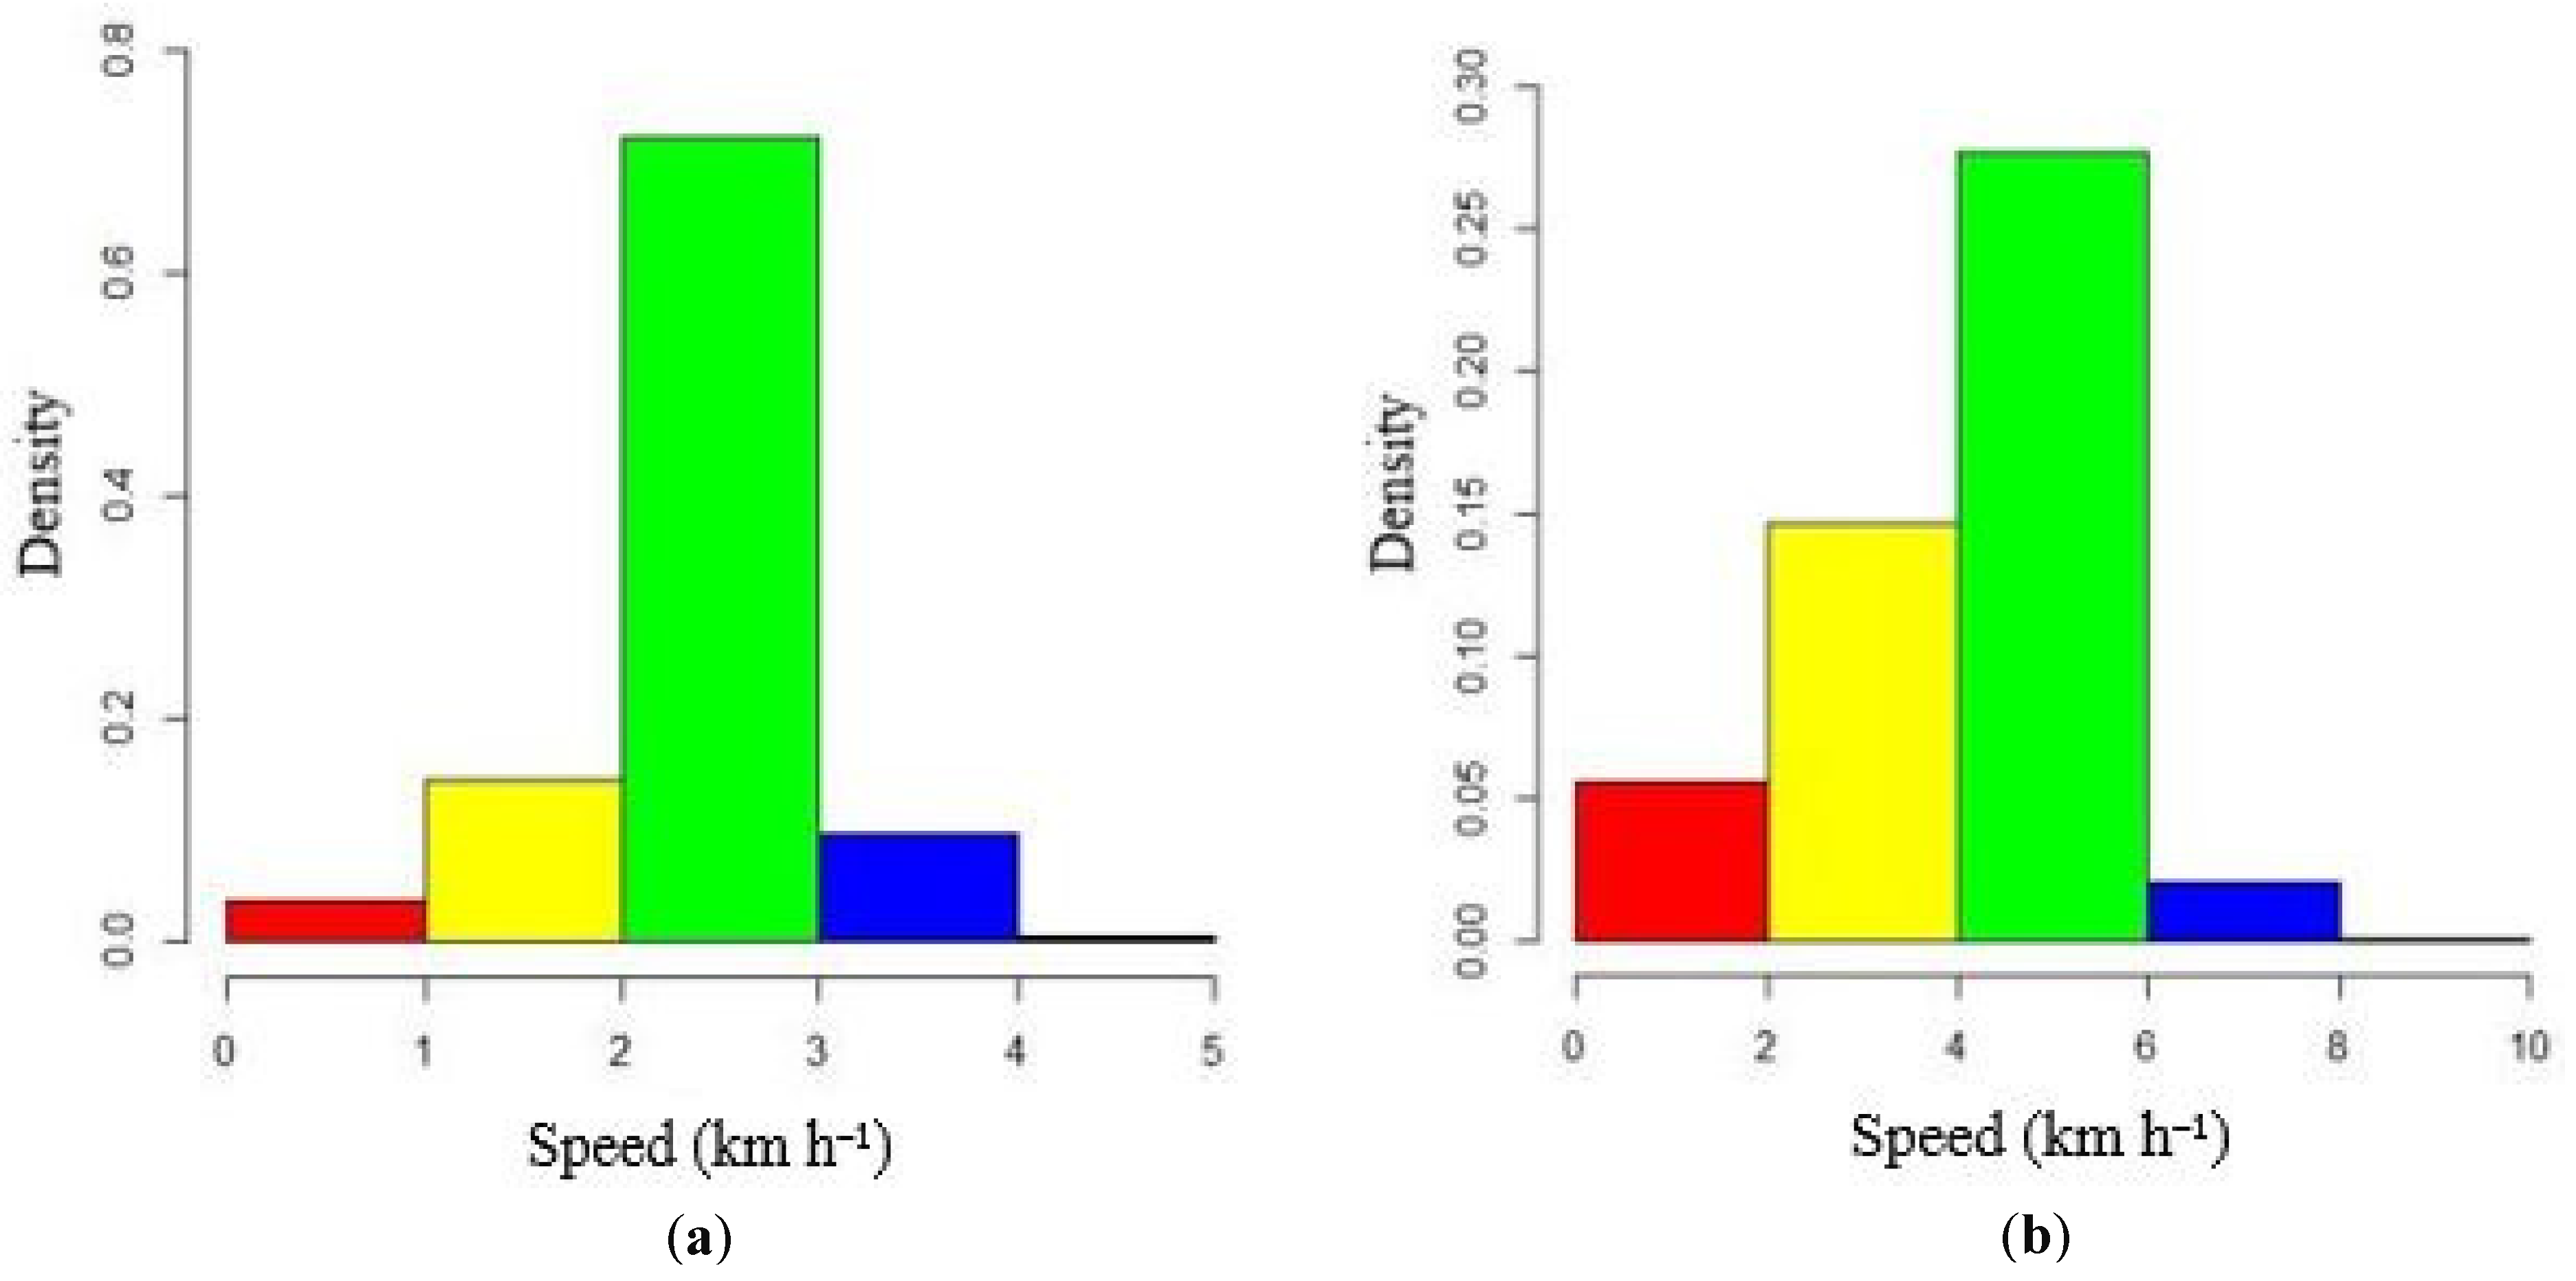
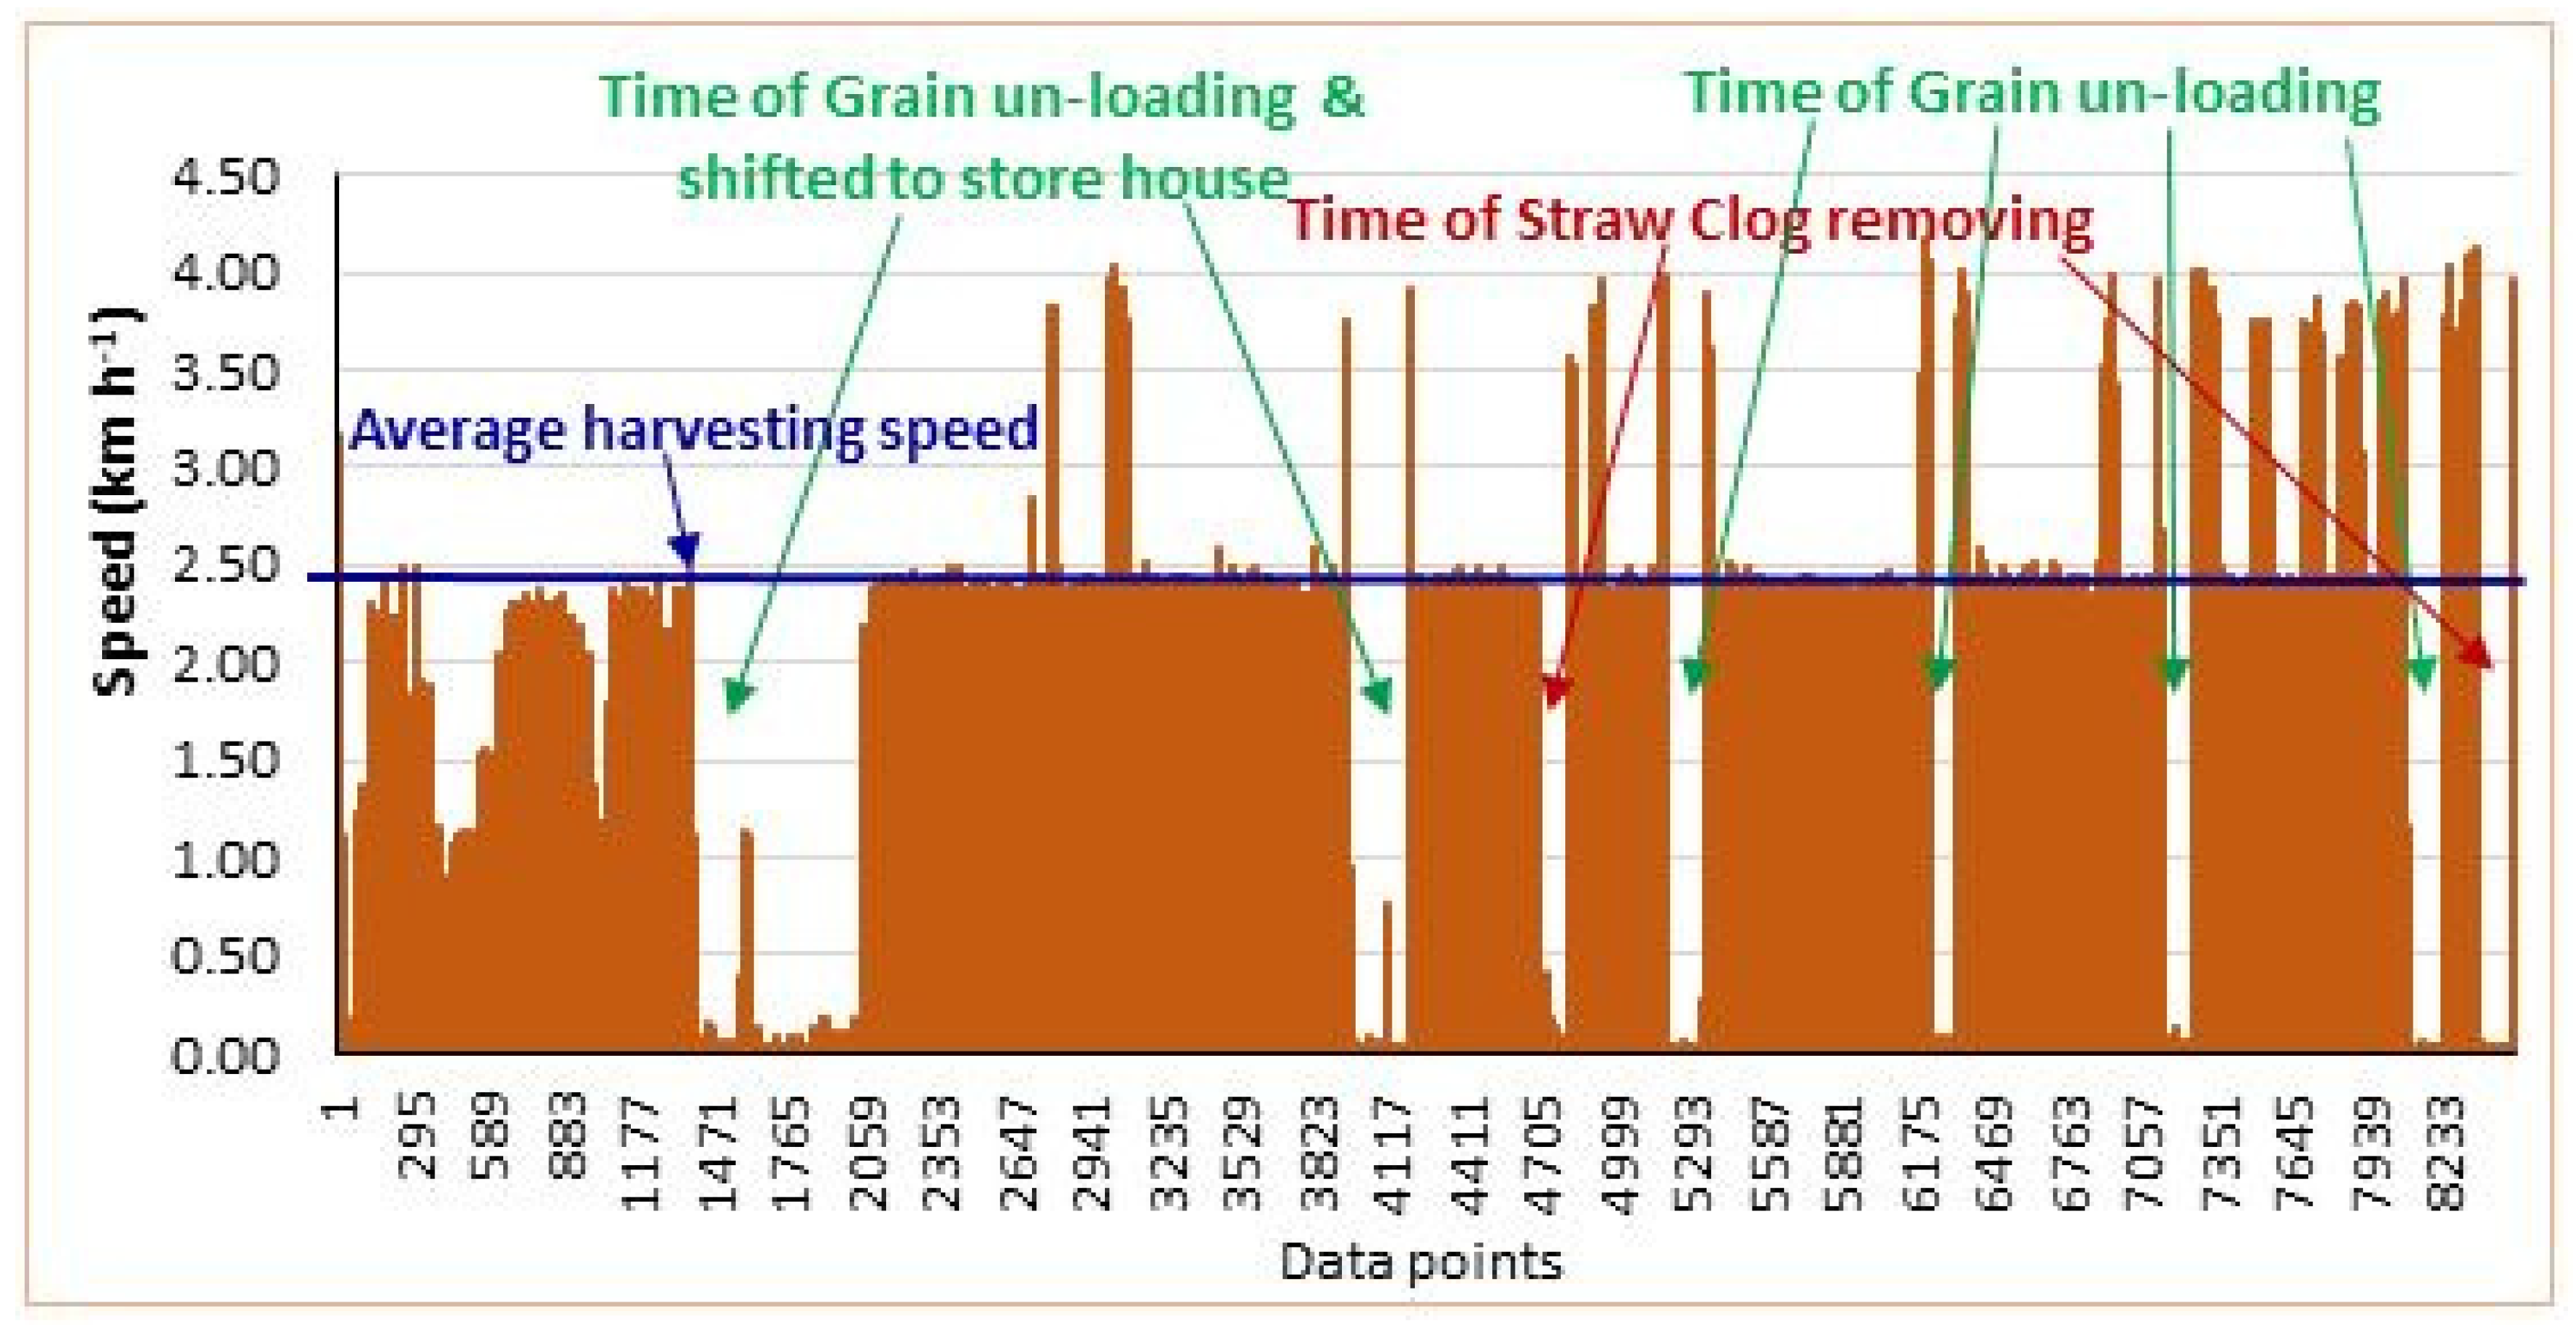
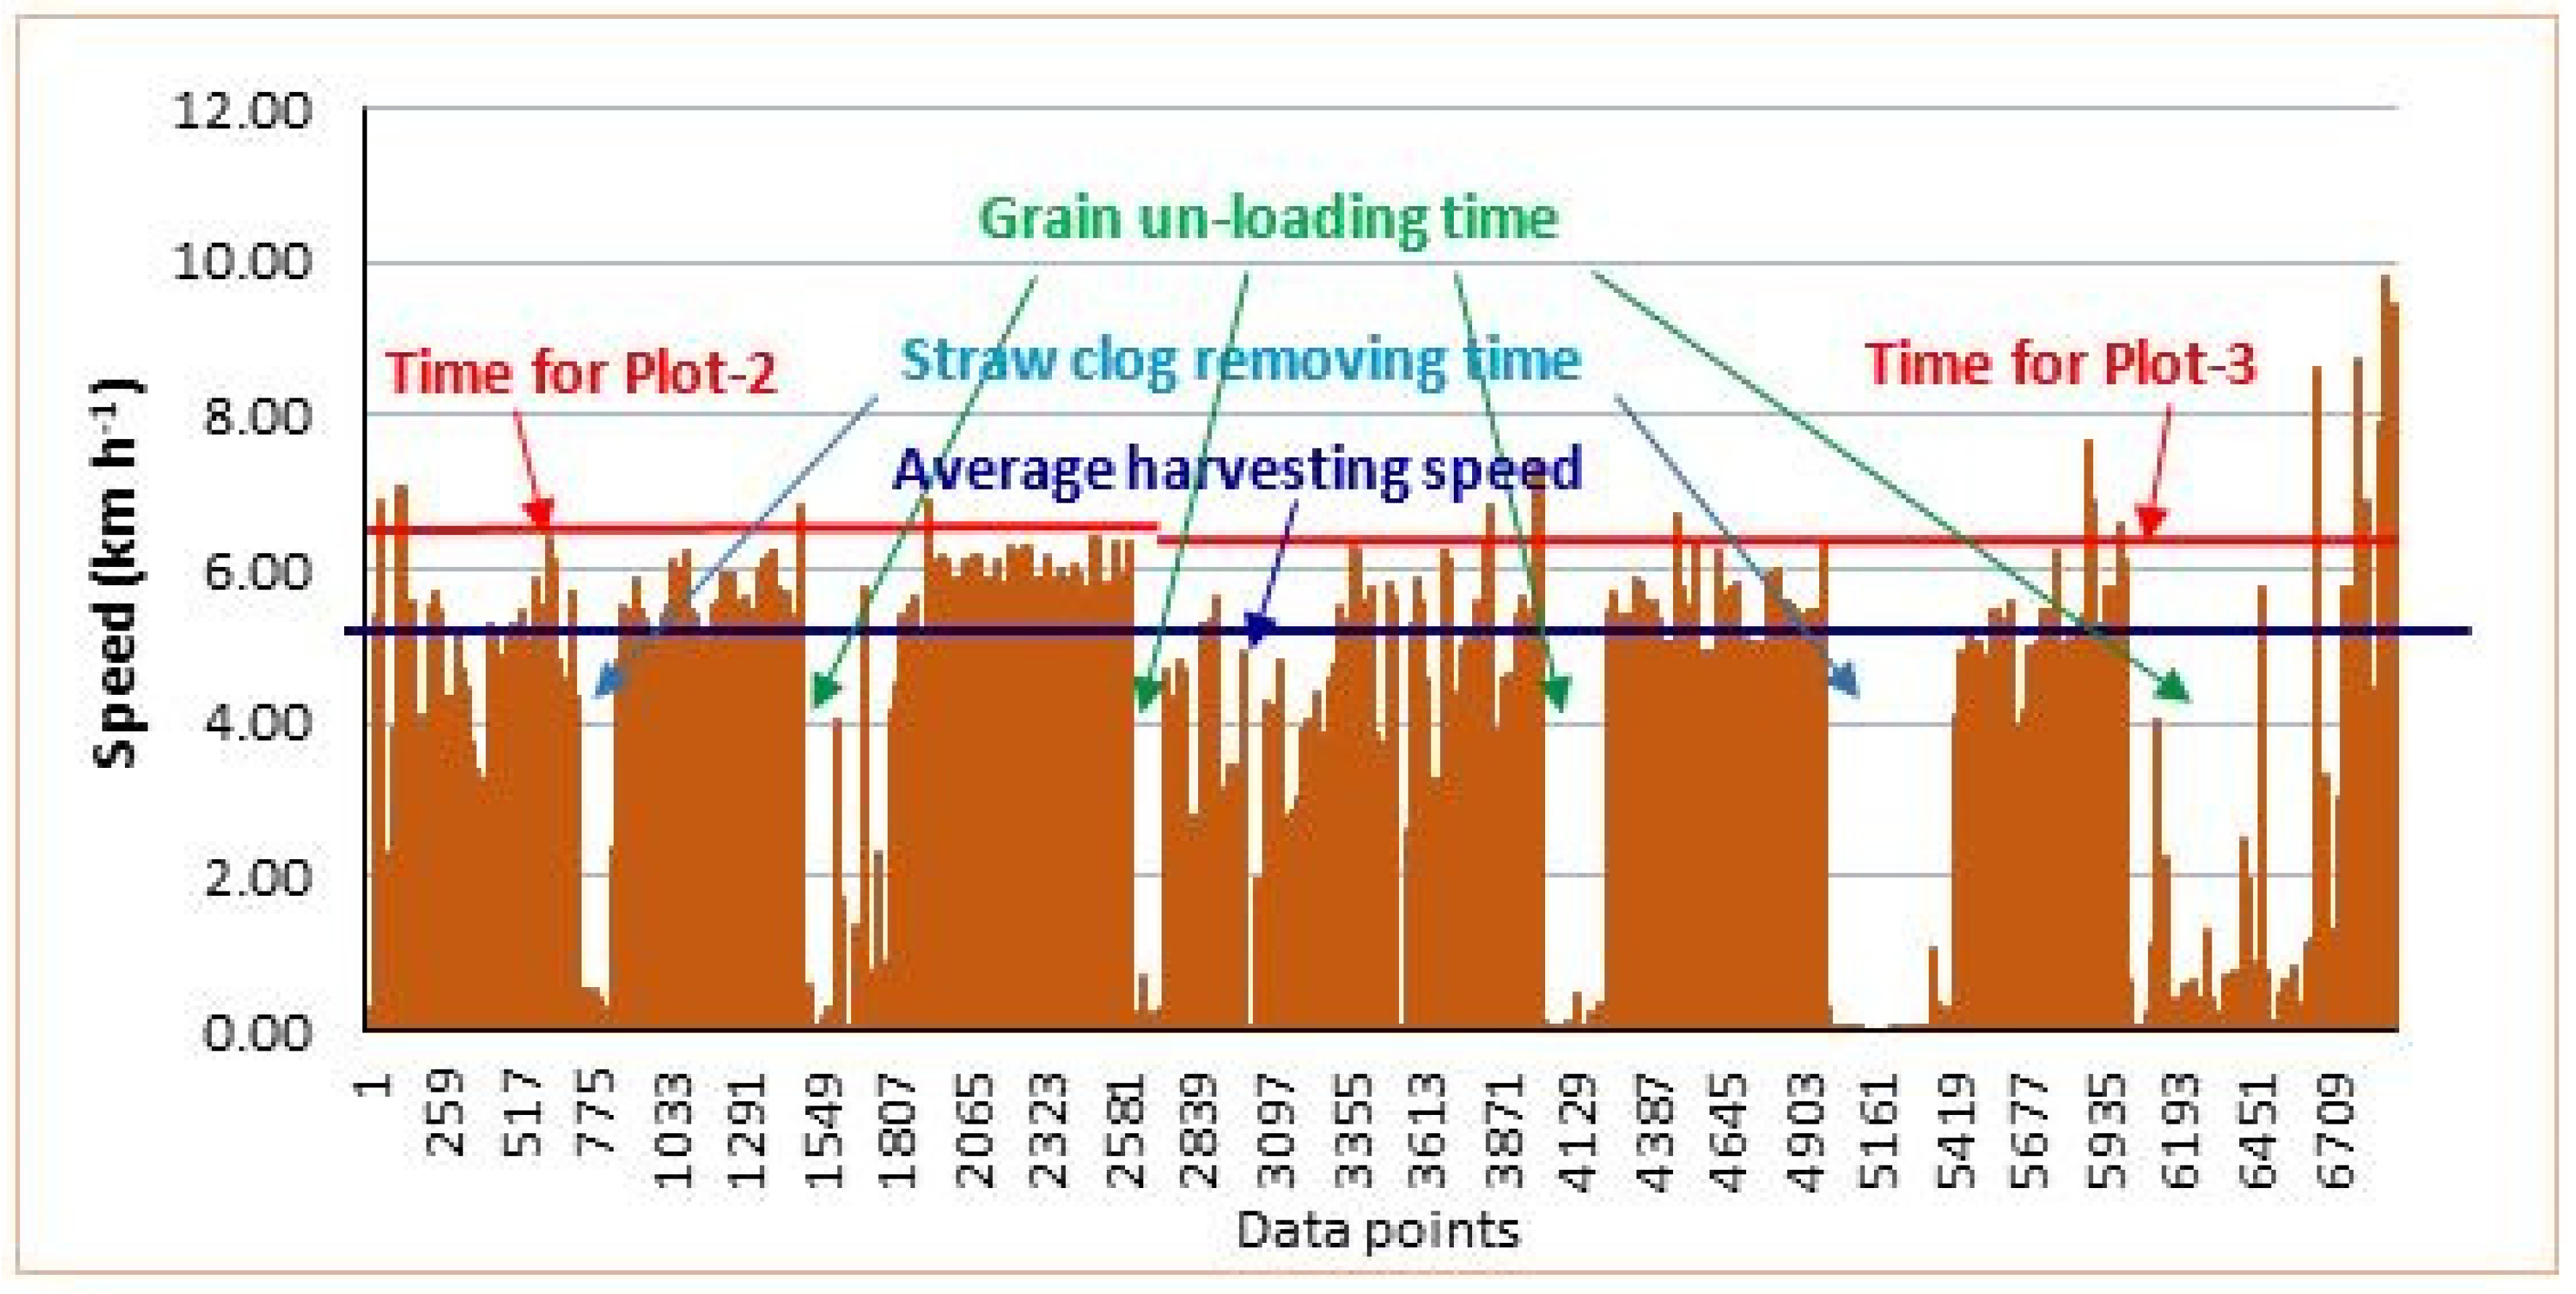
3.2. Speed Variation during Harvesting and Turning Loss Measurement

Histograms were developed to determine the density of the machine speed during paddy harvesting, as presented in Figure 4. In both cases, the green shows the highest speed density. For the medium combine, the green shows speed values from 2 to 3 km h−1, and the density was 0.65 when considering a binary width of 1. On the other hand, for the large combine, the green shows speed values from 4 to 6 km h−1, and the density was 0.55 (2 × 0.275) when considering a binary width of 2. In fact, this highest density occurred during standing crop harvesting. In both cases, black shows the lowest speed density. Black points show speed values from 4 to 5 km h−1 and 8 to 10 km h−1 for the medium and large combine harvesters, respectively. In both cases, machine movement for grain unloading and returning to the harvesting point had the lowest speed density due to its shorter duration than the other operations.
Speed variations in the harvesters were classified from histograms as shown in Figure 5. The five types of speeds were assumed to be (i) turning, (ii) lodging crop harvesting, (iii) standing crop harvesting, (iv) last time of harvesting and movement for grain unloading, and (v) movement for grain unloading and returning to the harvesting point. The speed remained almost constant during standing crop harvesting. The operator increased the speed as he finished the operations during the last harvesting and unloading. In comparison, there was a low speed during turning and lodging crop harvesting. During turning, the machine first needs to slow before turning. Additionally, machines need to operate slowly during lodging crop harvesting to minimize harvesting losses and hazards from straw clogging.
Another analysis was performed to estimate the turning loss during harvesting. Plot 1 and Plot 2 were harvested by following the same harvesting pattern, but a different pattern was followed when Plot 3 was harvested. For this reason, turning loss analysis was performed for Plots 1 and 2, as presented in Table 2. After a comparison with the harvesting area, turning loss was found to be 0.96 and 0.60 h ha−1 for medium and large combine harvesters, respectively. Turning loss was less for the large combine due to its greater cutting width and effective field capacity than the medium combine. However, after a comparison with the active harvesting time, turning loss was found to be 15.99% and 35.03% for the medium and large combines, respectively. The turning loss percentage was less for the medium combine than for the large combine due to the higher active harvesting time of the medium combine. In fact, turning loss varied due to variations in machine size, plot size, operator skill, soil condition, and crop condition. Ultimately, harvesting time (h ha−1) and turning loss (h ha−1) will be less when using a large combine harvester due to its cutting width and effective field capacity being greater than those of a medium combine.

3.3. Estimating Average Harvesting Speed and Idle Time of Harvesting

After the analysis of the RTK GNSS receiving data through ArcGIS, we obtained five types of speeds, but we needed the average value for the technical and economic analysis. Linear speed trend lines were drawn to represent the average harvesting speeds. The within-field speed variation in the harvester is shown in Figure 6 and Figure 7. The average estimated harvesting speeds were 2.50 and 5.52 km h−1 for the medium and large combine harvesters, respectively. The maximum harvesting speeds were 4.18 and 9.78 km h−1 for the medium and large combines, respectively. On the other hand, the lowest speed was approximately 0 km h−1 during the still position (e.g., unloading, straw clog removal, and waiting for the grain transfer pickup after filling the grain collector tank of the harvester). The on-field and off-field speeds of the harvesters varied greatly.
The total machine operation times, idle times, and effective harvesting times are presented in Table 3. Idle times represent not only the still position (speed was 0 km h−1) but also the times for moving to the unloading point and returning to the previous harvesting point (speed was highest). During the harvesting operation, the total number of idle activities was eight for the medium combine (grain unloading six times and straw clog removing two times) and six for the large combine (grain unloading four times and straw clog removing two times). The estimated time loss percentages due to idle time were 23.14% and 41.46% for medium and large combine harvesters, respectively. Time loss percentages depend on the distances between the harvesting point and the grain storehouse. Additionally, they depend on crop conditions and operator skill. Harvesting field capacity and efficiency can be increased by reducing harvesting time losses. The pick-up operators should be aware of minimizing the grain shifting time from the field to the storehouse, and harvester operators must be skilled enough to operate the harvester properly and quickly implement troubleshooting in the field during harvesting time.

3.4. Technical Performances of Harvester

The technical performances of the harvesters were measured from each paddy plot harvest and are presented in Table 4. The estimated average values of forward speed, fuel consumption, and effective field capacity were 2.50 km h−1, 3.18 L h−1, and 0.17 ha h−1 and 5.52 km h−1, 11.93 L h−1, and 0.55 ha h−1, using medium and large combine harvesters, respectively. The effective field capacity was greater for the large combine than for the medium combine due to the larger cutting width and engine power of the large combine. Similar results were found for a combine harvester (Model: DR150A) by a previous researcher: the average values of forward speed, fuel consumption, and effective field capacity were 6.71 km h−1, 10.76 L h−1, and 0.33 ha h−1, respectively [37]. The average value of effective field capacity of a combine harvester was found to be 0.64 to 0.81 ha h−1 with the average forward speed value of 2.75 to 3.00 km h−1 [38]. The estimated field performances varied due to variations in machine size, plot size, forward speed, operator skill, soil condition, and crop condition.

3.5. Economic Performances

3.5.1. Operating Cost of a Combine Harvesters

After field experiment and data analysis, salient features of combine harvester custom-hire entrepreneurship are shown in Table 5. The operating costs (sums of fixed and variable costs) were found to be 903 and 421 USD ha−1 using medium and large combine harvesters, respectively. Fixed cost mainly depends on the purchase price of the harvester, and variable cost depends on the costs of fuel, lubrication, daily service, power, and labor. Fixed costs were found to be 142.71 and 125.97 USD ha−1 and variable costs were found to be 759.87 and 295.51 USD ha−1 using medium and large combine harvesters, respectively. The operating costs of combine harvesters have been mentioned by other researchers: the operating cost was 124 USD ha−1 for using the model of DSC-48 [39] and 123 USD ha−1 for using the model of DR150A [37]. Operating costs mainly varied due to the variations in machine purchase price and labor cost.

3.5.2. Comparison of Financial Features of Harvesters for Custom-Hire Business

The business of medium and large combine harvesters is seasonal. In a year, a medium combine harvester can be used at least 40 days or for 40.80 ha harvesting, and a large combine harvester can be used 40 days or for 132.00 ha harvesting. The harvester machine can be used based on the average working capacity of the machine. Estimated working life of both harvesters is at least 10 years. For using combine harvesters, one operator and one laborer are required for harvesting, preparing the paddy field, and carrying paddy bags to home. Major cost items of a harvester operation business in custom-hire service are presented in Table 6.

PV, IRR, BCR, and PP of Harvesters

Economic analysis for CHS was carried out from the viewpoint of the harvester owner as presented in Table 6. The results supported investment in combine harvesters being highly profitable. Considering a 10% discount rate, the NPVs of the medium and large combine harvesters in existing condition were USD 219,225 and USD 1,104,962, respectively. The NPVs of medium and large combine harvester indicate that both harvesters could be considered financially sound and viable because estimated IRRs for medium and large combine harvester were 87% and 142%, respectively, which all are far greater than the bank interest rate. This indicates that investing in a medium and large combine harvester is highly profitable and suitable for the development of custom-hire entrepreneurs. The estimated BCRs for medium and large combine harvesters are 1.91 and 3.88, respectively, and are higher than unity. The PPs of medium and large combine harvesters were determined to be 1.15 and 0.71 years with initial investment sizes of USD 50,275 and USD 143,578, respectively, which means the stream of cash proceeds produced by an investment to equal the initial expenditure would be incurred after 1.15 years for a medium combine and 0.71 years for a large combine harvester. Similar results were mentioned by another researcher for a mini-combine harvester: estimated IRR, BCR, and PP were 40%, 1.52, and 2.41 years, respectively [40]. Other corresponding results were found for a reaper: estimated IRR, BCR, and PP were 123%, 2.89, and 1.14 years, respectively [41]. The estimated results varied corresponding to the machine purchase price, size of the machine, labor cost, and return from the rent-out charge.

Sinking Fund Annual Payment (SFP) of Combine Harvesters

Considering the economic life of medium and large combine harvesters, an entrepreneur needs to save or deposit 4,474 USD year−1 and 12,777 USD year−1 in a bank account, for medium and large combine harvesters, respectively, as shown in Table 6, so that he or she can buy a new harvester when the economic life of the harvester expires due to harvesting operations. Replacement of a medium or large combine harvester with a new one is essential because beyond economic life it will no longer be useful for operating in the field on a profit basis. The performance of a new harvester is significantly superior, and it makes the old harvester obsolete. Anticipated costs for operating the old harvesters exceed those of replacement combine harvesters. Therefore, a combine harvester entrepreneur has to save money to buy the new one. Uniform annual payments to a fund are of such a size that by the end of the economic life of the machine, the funds and their interest will have accumulated to an amount that will purchase another equivalent machine.

Rent-Out Charge of Harvester Operation for Custom-Hire Service Business

Rent-out charge must be determined to sustain the entrepreneurship or CHS business. Based on the field data, the estimation of cost items with appropriate equations, and the assumptions, the rent-out charge of a combine harvester for the paddy harvesting operation was estimated as 1835 USD ha−1, as shown in Table 6, in which operating cost, profit, and SFP are included. Rent-out charge may differ based on harvester capacity and quality and may vary from country to country as economic conditions differ.

Break-Even Use of Medium and Large Combine Harvesters

The break-even uses of the medium and large combine harvesters were found to be 5.42 and 10.80 ha year−1, respectively, as shown in Figure 8. The medium and large combine harvesters will run fully on a profit basis if the machines can be used more than mentioned areas per year. For determining the break-even use, rent-out charge was considered 1835 USD ha−1 for each harvester on the basis of field survey. Total cost was estimated from the summation of annual fixed cost and variable cost. Annual fixed cost will not vary, but total variable cost will vary depending on the annual area coverage. A similar result was mentioned for a mini-combine harvester: estimated BEU was 9.24 ha year−1 [40]. Another similar result was found for a combine harvester, and it was 22.17 ha year−1 at a harvesting capacity of 0.39 ha h−1 considering break-even point 133 ha of paddy field and harvesting during an economic life of 6 years [15]. In addition, the estimated BEU was 14.79 ha year−1 for using a reaper [42]. The results varied corresponding to the machine size, purchase price, labor cost, and return from CHS business.

3.5.3. Project Worth Analysis

Project worth evaluations are shown in Table 7 and Table 8 for medium and large combines, respectively. Discounted project measures were used for cash flow analysis, which is evidently a little more acceptable since the use of undiscounted measures of project worth prevents taking into consideration the timing of benefits and costs. The NPV, BCR, IRR, and PP of harvesters with existing inflation conditions were estimated at 10% discount rates where the minimum percentage of interest rate associated with agricultural loans to purchase agricultural machinery was 0.25% in Japan. Project worth evaluations are shown in Table 7 and Table 8. The results revealed that investments in medium and large combine harvesters were profitable for an entrepreneur in a CHS business operation.

3.5.4. BCR, IRR, PP, and BEU of Combine Harvesters for Project Worth Evaluation

The results in Table 9 and Table 10 reveal that the BCRs of the medium and large combine harvesters are 1.91 and 3.88 and are higher than unity. Custom-hire business of any farm machine will be profitable if the BCR of the machine is higher than unity. The estimated IRRs are 87% and 142% for medium and large combine harvesters, respectively, and are far greater than the bank interest rate. The PPs of medium and large combine harvesters are 1.15 and 0.71 years with a machine working life of 10 years. This means that the machine owner will obtain profit after 1.15 and 0.71 years, respectively, of using medium and large combine harvesters, until 10 years. The BEUs of the medium and large combine harvesters are 5.42 and 10.80 ha year−1, respectively, with annual machine working capacities of 40.80 and 132.00 ha year−1, respectively. This means that machine owners will obtain profit after exceeding the use rates of 5.42 and 10.80 ha year−1, respectively, for medium and large combine harvesters considering 10 years of working life. This indicates that investments in both types of combine harvesters are profitable and suitable for the development of a custom-hire entrepreneur. Comparatively, a large combine harvester provides more benefit than the medium size combine harvester in terms of harvesting capacity and return. A corresponding result was observed in another study considering a mini-combine harvester: estimated BCR, IRR, PP, and BEU were 1.52, 40%, 2.41 years, and 9.24 ha year−1, respectively [40]. Another similar result was mentioned for a reaper: estimated BCR, IRR, PP, and BEU were 2.04, 91%, 1.06 years, and 14.79 ha year−1, respectively [42]. The estimated results varied corresponding to the machine purchase price, size of the machine, labor cost, and return from the rent-out charge.

4. Conclusions

Our study demonstrated that combine harvesters could be a cost-saving technology and that the application of GNSS and GIS in modern agriculture is essential to quantify machinery performance precisely. The application of RTK GNSS and GIS successfully visualized spatial information about machinery performance attributes, such as area coverage, operational time, harvesting speed, machine idle times, effective operational time, field capacity, harvesting location with operational track, and turning pattern with loss time. In comparison to the other harvesting methods, the large combine harvester had a greater area coverage rate, and its turning loss time was less. Harvester performance could be increased by reducing the turning loss and idle time during harvesting operation. The operating cost of a combine harvester is an important economic aspects of harvester custom-hire entrepreneurship. The results of PBP, BCR, NPV, and IRR further indicated that investments in both types of combine harvesters were highly profitable and suitable for the development of custom-hire entrepreneurs to support Japanese smallholders. To avoid initial investment, there is a great opportunity to use paddy harvesters through CHSs by local service providers and custom-hire entrepreneurs to avoid the initial investment of farmers. Both sides (service provider/entrepreneur and farmer) could benefit from the CHS business of the harvester. Considering the harvesting capacity and return from investment, the large combine harvester might provide more benefit than the medium size combine harvester. Based on the analyses of the collected data, it can be also recommended that innovative farmers and entrepreneurs in well-organized farmers’ groups can invest their shared capital in providing services of combine harvesters to the members of the group and other neighboring farmers for paddy harvesting. Although the findings were based on the estimation in Japan, combine harvesters for paddy harvesting might be also an appropriate solution in developing countries to meet the labor shortages in the peak harvesting period. Thus, further research is needed to estimate the feasibility of CHSs in developing countries on the assumption that the medium and large combine harvesters are introduced in the future. As discussed earlier, the actual performances of reapers or mini-combine harvesters have been reported previously. To the best of our knowledge, this is the first study that providing on-farm precise estimates of machinery performance attributes of medium and large paddy harvesters, which would be very informative in evaluating the feasibility of CHSs in the other Asian developing countries.

Author Contributions

Conceptualization, M.K.H. and T.S.T.T.; methodology, M.K.H., T.S.T.T., and M.R.A.; validation, T.S.T.T., M.R.A., and C.K.S.; formal analysis, M.K.H., T.S.T.T., and M.M.A.; data curation, M.K.H. and T.S.T.T.; software, M.K.H. and T.S.T.T.; writing—original draft preparation, M.K.H. and T.S.T.T.; writing—review and editing, M.K.H., T.S.T.T., and M.R.A.; supervision, C.K.S. and M.M.A. All authors have read and agreed to the published version of the manuscript.

Funding

This research was funded by “The United Graduate School of Agricultural Science, Gifu University (UGSAS, GU), Japan” and Feed the Future Innovation (FtF) Lab for Sustainable Intensification through the United States Agency for International Development (USAID), and University of Illinois at Urbana-Champaign, USA (Subaward Number: 2015-06391-06, Grant code: AB078).

Institutional Review Board Statement

Not applicable.

Informed Consent Statement

Not applicable.

Data Availability Statement

Not applicable.

Acknowledgments

This research was conducted as part of “The United Graduate School of Agricultural Science, Gifu University (UGSAS, GU), Japan”, which provided financial support during the research activities in addition to providing a 6-month sandwich doctoral program at this university. The first author would also like to acknowledge his research in Bangladesh as part of the Appropriate Scale Mechanization Consortium (ASMC) project “Appropriate Scale Mechanization Innovation Hub (ASMIH)—Bangladesh”, which was supported by the Feed the Future Innovation Lab for Sustainable Intensification through the United States Agency for International Development (USAID) and University of Illinois at Urbana-Champaign, USA (Subaward Number: 2015-06391-06, Grant code: AB078). The contents are the sole responsibility of the authors and do not necessarily reflect the views of USAID or the United States Government.

Conflicts of Interest

The authors declare no conflict of interest.

References

  1. Singh, G. Estimation of a Mechanisation Index and Its Impact on Production and Economic Factors—A Case Study in India. Biosyst. Eng. 2006, 93, 99–106. [Google Scholar] [CrossRef]
  2. Noby, M.M.; Hasan, M.K.; Ali, M.R.; Saha, C.K.; Alam, M.M.; Hossain, M.M. Performance evaluation of modified BAU self-propelled reaper for paddy. J. Bangladesh Agric. Univ. 2018, 16, 171–177. [Google Scholar] [CrossRef] [Green Version]
  3. Samson, B.; Duff, B. The Pattern and Magnitude of Field Grain Losses in Paddy Production; IRRI Saturday Seminar Paper; International Rice Research Institute: Los Banos, Philippines, 1973; p. 30. [Google Scholar]
  4. Hasan, M.K.; Ali, M.R.; Saha, C.K.; Alam, M.M.; Hossain, M.M. Assessment of Paddy Harvesting Practices in Southern Delta Region of Bangladesh. Progress. Agric. 2019, 30, 57–64. [Google Scholar] [CrossRef] [Green Version]
  5. Jones, M.; Alam, M.M.; Rahman, M.H.; Ali, M.R.; Hasan, M.K.; Pathan, M.S.I.A. Gender Technology Assessment of Harvesting Technologies in Bangladesh. Agrilinks, the Online Hub, Is a Part of the U.S. Government’s Feed the Future. 2019. Available online: https://www.agrilinks.org/sites/default/files/resources/bangladesh_harvester_tech_profile_2019_08_final.pdf (accessed on 20 April 2021).
  6. Hossain, M.A.; Hoque, M.A.; Wohab, M.A.; Miah, M.A.M.; Hassan, M.S. Technical and Economic Performance of Combined Harvester in Farmers’ Field. Bangladesh J. Agric. Res. 2015, 40, 291–304. [Google Scholar] [CrossRef]
  7. Crookston, K. A top 10 list of developments and issues impacting crop management and ecology during the past 50years. Crop Sci. 2006, 46, 2253–2262. [Google Scholar] [CrossRef]
  8. Zarco-Tejada, P.J.; Neil, H.; Philippe, L. Precision Agriculture: An Opportunity for EU Farmers—Potential Support with CAP 2014–2020; European Union: Brussels, Belgium, 2014; Available online: www.europarl.europa.eu›2014›IPOL-AGRI_NT(2014)529049_EN (accessed on 12 April 2021).
  9. Mulla, D.J. Twenty five years of remote sensing in precision agriculture: Key advances and remaining knowledge gaps. Biosyst. Eng. 2013, 114, 358–371. [Google Scholar] [CrossRef]
  10. Shibusawa, S. Precision Farming and Terra-mechanics. In Proceedings of the Fifth ISTVS Asia-Pacific Regional Conference, Seoul, Korea, 20–22 October 1998. [Google Scholar]
  11. Chen, J.; Yang, G.J.; Xu, K.; Cai, Y.Y. On Research on Combine Harvester Positioning algorithm and Aided-navigation System. In Proceedings of the International Conference on Advances in Mechanical Engineering and Industrial Informatics, Zhengzhou, China, 11–12 April 2015; pp. 848–853. [Google Scholar]
  12. Zhang, Z.; Cao, R.; Peng, C.; Liu, R.; Sun, Y.; Zhang, M.; Li, H. Cut-Edge Detection Method for Rice Harvesting Based on Machine Vision. Agronomy 2020, 10, 590. [Google Scholar] [CrossRef]
  13. Ball, D.; Upcroft, B.; Wyeth, G.; Corke, P.; English, A.; Ross, P.; Patten, T.; Fitch, R.; Sukkarieh, S.; Bate, A. Vision-based Obstacle Detection and Navigation for an Agricultural Robot. J. Field Robot 2016, 33, 1107–1130. [Google Scholar] [CrossRef]
  14. Adamchuk, V.I.; Grisso, R.D.; Kocher, M. Machinery performance assessment based on records of geographic position. In Proceedings of the 2004 ASAE/CSAE Annual International Meeting, Ottawa, ON, Canada, 1–4 August 2004; p. 11. [Google Scholar] [CrossRef]
  15. Amponsah, S.K.; Addo, A.; Dzisi, K.A.; Moreira, J.; Ndindeng, S.A. Performance Evaluation and Field Characterization of The Sifang Mini Rice Combine Harvester. Appl. Eng. Agric. Am. Soc. Agric. Biol. Eng. 2017, 33, 479–489. [Google Scholar] [CrossRef]
  16. Taylor, R.K.; Schrock, M.D.; Staggenborg, S.A. Extracting machinery management information from GPS data. In Proceedings of the ASAE Annual International Meeting, Chicago, IL, USA, 28–31 July 2002; Available online: http://citeseerx.ist.psu.edu/viewdoc/download?doi=10.1.1.490.2662&rep=rep1&type=pdf (accessed on 15 April 2021).
  17. Pandey, M.M.; Devnani, R.S. Analytical determination of an optimum mechanical harvesting pattern for high field efficiency and low-cost of operation. J. Agric. Eng. Res. 1987, 36, 261–274. [Google Scholar] [CrossRef]
  18. Niehaus, C.R. Evaluation of Corn Harvesting Operations with the Use of Geo-Referenced Data. Master’s Thesis, University of Illinois at Urbana-Champaign, Champaign, IL, USA, 2014. [Google Scholar]
  19. Mehta, C.R.; Pajnoo, R.K. Role of Japan in Promotion of Agricultural Mechanization in India. Agric. Mech. Asia Afr. Lat. Am. 2013, 44, 15–17. [Google Scholar]
  20. Hegazy, R.; Schmidley, A.; Bautista, E.; Sumunistrado, D.; Gummert, M.; Elepano, A. Mechanization in Rice Farming—Lessons Learned from Other Countries; Asia Rice Foundation, Los Banos, Philippines, 2013. Available online: https://www.researchgate.net/publication/258951878_Mechanization_in_rice_farming_lessons_learned_from_other_countries (accessed on 28 March 2021).
  21. Hasan, M.D.; Tanaka, T.S.T.; Alam, M.M.; Ali, M.R.; Saha, C.K. Impact of Modern Rice Harvesting Practices over Traditional Ones. Rev. Agric. Sci. 2020, in press. [Google Scholar] [CrossRef]
  22. Justice, S.; Biggs, S. Rural and agricultural mechanization in Bangladesh and Nepal: Status, processes and outcomes. In Mechanization for Rural Development: A Review of Patterns and Progress from around the World; Kienzle, J., Ashburner, J.E., Sims, B.G., Eds.; Food and Agriculture Organization of the United Nations (UNFAO): Rome, Italy, 2013; pp. 67–98. [Google Scholar]
  23. IDE (International Development Enterprises). Commercialization of Selected Agriculture Machineries in Bangladesh; International Development Enterprises (IDE): Dhaka, Bangladesh, 2012; Available online: http://repository.cimmyt.org/xmlui/bitstream/handle/10883/3394/98527.pdf (accessed on 14 May 2015).
  24. Shidu, R.S.; Kamal, V. Improving Economic Viability of Farming: A Study of Cooperative Agro Machinery Service Centres in Punjab. Agric. Econ. Res. Rev. 2012, 25, 427–434. [Google Scholar]
  25. Hossain, M.I.; Siddiqui, M.N.A.; Panaullah, G.M.; Duxbury, J.M.; Lauren, J.G. Raised beds: A resource conserving technology for improved crop production in Bangladesh. In A Booklet under Cornell University-Food of Ithaca, NY, USA for Progress Programme in Bangladesh; Bangladesh Agricultural Research Institute (BARI): Gazipur, Bangladesh, 2014. [Google Scholar]
  26. d-maps. Available online: https://d-maps.com (accessed on 28 May 2021).
  27. Hofmann-Wellenhof, B.; Lichtenegger, H.; Collins, J. Global Positioning System: Theory and Practice, 5th ed.; Springer: New York, NY, USA, 2001. Available online: https://trove.nla.gov.au/version/41748624 (accessed on 20 March 2021).
  28. Takasu, T.; Yasuda, A. Development of the low-cost RTK-GPS receiver with an open source program package RTKLIB. In Proceedings of the International Symposium on GPS/GNSS 2009, Jeju, Korea, 4–6 November 2009; Available online: http://gpspp.sakura.ne.jp/paper2005/isgps_2009_rtklib_revA.pdf (accessed on 10 April 2021).
  29. Barnard, C.S.; Nix, J.S. Farm Planning and Control, 2nd ed.; Cambridge University Press: Cambridge, UK, 1979. Available online: https://trove.nla.gov.au/version/45672432 (accessed on 25 March 2021).
  30. Hunt, D. Farm Power and Machinery Management, 10th ed.; Iowa State University Press: Iowa City, IA, USA, 2001. Available online: https://trove.nla.gov.au/work/10793375 (accessed on 25 February 2021).
  31. White, J.A.; Agee, M.H.; Case, K.E. Principles of Engineering Economic Analysis, 3rd ed.; London-New York-Melbourne; John Wiley & Sons, Inc.: Hoboken, NJ, USA, 1989. [Google Scholar] [CrossRef]
  32. Gittinger, J.P. Economic Analysis of Agricultural Projects; John Hopkins University Press: Baltimore, MD, USA, 1982. [Google Scholar]
  33. Sarma, A.K. Methods/Criteria of Project Evaluation or Measures of Project Worth of Investment; Agricultural Economics, Faculty of Agriculture, Assam Agricultural University: Jorhat, India, 2010. [Google Scholar]
  34. Jaim, W.M.H. Can Potential Capacity of Deep Tube Wells Be Utilized? HRDP, Winrock International: Dhaka, Bangladesh, 1993. [Google Scholar]
  35. George, J.A.; Shorey, O.M. Current Tillage Practices and Needs. In ASEAN, ACIAR, Proceedings Series; Australian Centre for International Agricultural Research: Canberra, Australia, 1978. [Google Scholar]
  36. Miah, M.T.H.; Hardaker, J.B. Benefit-cost analysis of deep and shallow tube well projects in Tangail District in Bangladesh. Bangladesh J. Agric. Econ. 1998, 4, 21–30. [Google Scholar]
  37. Hasan, M.K.; Ali, M.R.; Saha, C.K.; Alam, M.M.; Haque, M.E. Combine Harvester: Impact on paddy production in Bangladesh. J. Bangladesh Agric. Univ. 2019, 17, 583–591. [Google Scholar] [CrossRef] [Green Version]
  38. Veerangouda, M.; Sushilendra, K.; Prakash, V.; Anantachar, M. Performance evaluation of tractor operated combine harvester. Kamataka J. Agric. Sci. 2010, 23, 282–285. [Google Scholar]
  39. Alam, S.M.S.; Rashedujjaman, M.; Hossain, M.M.; Hossain, K.M.D. Comparative harvesting and threshing cost of paddy by combine harvester and self-propelled reaper and thresher. J. Environ. Sci. Nat. Resour. 2017, 10, 133–136. [Google Scholar] [CrossRef] [Green Version]
  40. Hasan, M.K.; Ali, M.R.; Saha, C.K.; Alam, M.M.; Rahman, M.S. Provision of custom hiring service of mini-combine harvester for paddy harvesting: An experimental evidence from Bangladesh. Int. J. Agric. Innov. Technol. Glob. 2020, 1, 338–353. [Google Scholar] [CrossRef]
  41. Acharya, P.; Regmi, P.P.; Gauchan, D.; KC, D.B.; KC, G.B. Benefit Cost Analysis of Adoption of Small Farm Machineries for Rice Cultivation in Nepal. Int. J. Appl. Sci. Biotechnol. 2020, 8, 448–453. [Google Scholar] [CrossRef]
  42. Hasan, M.K.; Ali, M.R.; Saha, C.K.; Rahman, M.S.; Alam, M.M. Custom Hiring Service of Reaper for Harvesting Paddy. J. Bangladesh Agric. Univ. 2020, 18, 872–879. [Google Scholar] [CrossRef]
Figure 1. Experimental locations in Japan: (a) Gifu city is shown on a map of Japan; (b) the research field of Gifu University and farmer’s field of Kaizu city are shown on a map of Gifu. The original maps are available from d-maps [26].
Agriengineering 03 00024 g001
Figure 2. Mechanical harvesting scenario using (a) medium combine (Model: ER329) and (b) large combine (Model: ER6120).
Agriengineering 03 00024 g002
Figure 3. Harvesting tracks: (a) Plot 1 at Gifu University; (b) Plot 2 and (c) Plot 3 at Kaizu.
Agriengineering 03 00024 g003
Figure 4. Histogram of speed by R: (a) medium combine (Model: ER329); (b) large combine (Model: ER6120).
Agriengineering 03 00024 g004
Figure 5. Harvester speed variations: (a) Plot 1 at Gifu University; (b) Plots 2 and 3 at Kaizu. Speed variations are presented by 5 different colors: red, yellow, green, blue, and black. The values of different speed ranges are classified from 0 to 1, 1 to 2, 2 to 3, 3 to 4, and 4 to 5 km h−1 for the medium combine and from 0 to 2, 2 to 4, 4 to 6, 6 to 8, and 8 to 10 km h−1 for the large combine and are shown in red, yellow, green, blue, and black, respectively.
Agriengineering 03 00024 g005
Figure 6. Different speeds and idle times during harvesting at Plot 1 by medium combine.
Agriengineering 03 00024 g006
Figure 7. Different speeds and idle times during harvesting at Plots 2 and 3 by large combine.
Agriengineering 03 00024 g007
Figure 8. Break-even use analysis for (a) medium combine and (b) large combine.
Agriengineering 03 00024 g008
Table 1. Specifications of the medium and large combine harvesters.
Testing ItemDesigned Value
ModelER329ER6120
Overall dimension (L × W × H) (mm) 3890 × 1870 × 20904850 × 2325 × 2660
Weight (kg)19504160
Header width (mm) 12191981
Forward speed (during harvesting) (m s−1)0–1.050–2.00
Capacity (ha h−1)0.20–0.400.50–0.80
Fuel consumption (L h−1) 03–0612–20
Engine typeDiesel engineDiesel engine
Engine power (kW)21.388.3
Cutting row36
Table 2. Turning losses estimation.
MachinePlotTotal Turns, No.Average Turning Loss,
s Turn−1
Total Turning Loss, hActive Harvesting Time, hHarvesting Area, haTurning Loss with Active Harvesting Time, %Turning Loss with Harvesting Area, h ha−1
Medium combine
(Model: ER329)
Plot 17314.330.29061.81750.302915.990.96
Large combine (Model: ER6120)Plot 25412.670.19010.54250.315035.030.60
Table 3. Idle time loss of the combine harvester.
MachinesIdle TimesTotal Idle Time, hTotal Operational Time, hEffective Harvesting Timed, hIdle Time Loss %
Nos. aItem NamesTime, s
Medium combine
(Model: ER329)
(Plot 1)
1Grain unloading and shifting to storehouse6730.552.371.8223.14
2Grain unloading271
3Straw clog removing133
4Grain unloading194
5Grain unloading172
6Grain unloading179
7Grain unloading216
8Straw clog removing136
Large combine
(Model: ER6120)
(Plot 1 + Plot 2)
1Straw clog removing1290.801.931.1341.46
2Grain unloading381
3Grain unloading301
4Grain unloading496
5Straw clog removing632
6Waiting for pick-up and grain unloading940
a Nos. = Consequence of idle activities during harvesting operations.
Table 4. Technical performance of the combine harvesters.
Place and
Use of Harvester Model
Plots Forward Speed (km h−1)Fuel Consumption (L h−1)Fuel Consumption (L ha−1)Effective Field Capacity
(ha h−1)
Effective Field Capacity (Decimal h−1)
Gifu University farm in Gifu, Japan
Model: ER329
Plot 12.503.1819.080.1742
Kaizu city farm in Gifu, Japan
Model: ER6120
Plot 25.8412.1820.980.58143
Plot 35.2011.6822.240.53131
Average for
Model: ER6120
5.5211.9321.610.55137
Table 5. Major cost items for a combine operation business in custom-hire services.
ItemsUnit *Amount
Medium Combine
(Model: ER329)
Large Combine
(Model: ER6120)
Purchase price of combine (P)USD50,275143,578
Salvage value (S) (10% of P)USD502814,358
Working life (L)years1010
Average working hours per yearhr year−1240240
Field capacity of harvesterha h−10.170.55
Average working hectare per yearha year−140.80132.00
Annual fixed costUSD year−15822.5116,628.15
Fixed cost per hourUSD h−124.2669.28
A. Fixed cost per hectareUSD ha−1142.71125.97
Fuel cost per hourUSD h−13.2711.99
Lubricant cost per hour USD h−10.491.80
Repair and maintenance cost (0.025% of P)USD h−112.5735.89
Labor costUSD h−111.0111.01
Operator costUSD h−113.7613.76
Straw and paddy bag collection cost per hourUSD h−188.0788.07
Variable cost per hourUSD h−1129.18162.53
Annual variable costUSD year−131,002.5339,007.74
B. Variable cost per hectareUSD ha−1759.87295.51
Operating cost of a harvester (A+B)USD ha−1903421
* Approximately USD 1 = JPY 109 (JPY = Japanese Yen); daily working of operator and labor = 8 h; daily effective use of machine = 6 h; yearly use = 40 days; price of diesel = 1.01 USD L−1.
Table 6. Financial features of harvesters for custom-hire business.
ItemsUnit Amount (Harvesting to Cleaning)
Medium Combine
Model: ER329
Large Combine
Model: ER6120
Purchase price of combine (P)USD50,275143,578
Working life (L)years1010
Rent out charge
(Including operating cost, profit, and SFP)
USD ha−118351835
Operating costUSD ha−1903421
ProfitUSD ha−18231317
Sinking fund payment (SFP)USD ha−110997
Sinking fund payment (SFP)USD year−1447412,777
Net present value (NPV) at 10% DFUSD219,2251,104,962
Benefit–cost ratio (BCR)%1.913.88
Internal rate of return (IRR)-87%142%
Payback period (PP)years1.150.71
Break-even useha year−15.4210.80
Table 7. NPV, BCR, IRR, and PP calculation for medium combine at DF 10%.
YearFixed Cost (USD)Variable Cost
(USD year−1)
Gross Benefit (USD year−1)Cash Flow (USD)Present Value of Cash Flow (USD)Present Value of Cost (USD)Present Value of Benefit (USD)Balance (USD)
050,27550,275 −50275502750−50275−50275
1031,00374,86243,86028,18468,05739,873−6,415
2031,00374,86243,86025,62261,87036,24837,444
3031,00374,86243,86023,29356,24532,95381,304
4031,00374,86243,86021,17551,13229,957125,164
5031,00374,86243,86019,25046,48427,234169,024
6031,00374,86243,86017,50042,25824,758212,884
7031,00374,86243,86015,90938,41622,507256,744
8031,00374,86243,86014,46334,92420,461300,604
9031,00374,86243,86013,14831,74918,601344,463
10031,00374,86243,86011,95328,86316,910388,323
NPV = USD 219,225; BCR = 1.91; IRR= 87%; PP = 1.15 years
Table 8. NPV, BCR, IRR, and PP calculation for large combine at DF 10%.
YearFixed Cost (USD)Variable Cost
(USD year−1)
Gross Benefit (USD year−1)Cash Flow (USD)Present Value of Cash Flow (USD)Present Value of Cost (USD)Present Value of Benefit (USD)Balance (USD)
0143,578143,578 −143,578143,5780−143,578−143,578
1039,008242,202203,19435,462220,183184,72259,616
2039,008242,202203,19432,238200,167167,929262,810
3039,008242,202203,19429,307181,970152,663466,004
4039,008242,202203,19426,643165,427138,784669,198
5039,008242,202203,19424,221150,388126,168872,392
6039,008242,202203,19422,019136,717114,6981,075,587
7039,008242,202203,19420,017124,288104,2711,278,781
8039,008242,202203,19418,197112,98994,7921,481,975
9039,008242,202203,19416,543102,71786,1741,685,169
10039,008242,202203,19415,03993,37978,3401,888,363
NPV = USD 1,104,962; BCR = 3.88; IRR= 142%; PP = 0.71 years
Table 9. Project worth evaluation of medium combine.
ItemsValueRemarks
Benefit–cost ratio (BCR)1.91If greater than 1.0 (1.91 > 1.0), acceptable as profitable
Internal rate of return (IRR)87%If greater than prevailing interest rate (87% > 9%), acceptable
Payback period (PP)1.15 yearsIf less than economic life (1.15 years < 10 years), acceptable
Break-even use (BEU)5.42 ha year−1If less than service area (5.42 ha year−1 < 40.80 ha year−1), acceptable
Table 10. Project worth evaluation of large combine.
ItemsValueRemarks
Benefit–cost ratio (BCR)3.88If greater than 1.0 (3.88 > 1.0), acceptable as profitable
Internal rate of return (IRR)142%If greater than prevailing interest rate (142% > 0.25%), acceptable
Payback period (PP)0.71 yearIf less than economic life (0.71 year < 10 years), acceptable
Break-even point (BEU)10.80 ha year−1If less than service area (10.80 ha year−1 < 132.00 ha year−1), acceptable
Publisher’s Note: MDPI stays neutral with regard to jurisdictional claims in published maps and institutional affiliations.

