Technical Note

Cotton Gin Stand Machine-Vision Inspection and Removal System for Plastic Contamination: Software Design

Lubbock Gin-Lab, Cotton Production and Processing Research Unit, United States Department of Agriculture, Agricultural Research Services, Lubbock, TX 79403, USA
*
Author to whom correspondence should be addressed.
Submission received: 2 June 2021 / Revised: 30 June 2021 / Accepted: 1 July 2021 / Published: 8 July 2021
(This article belongs to the Special Issue Feature Papers in Cotton Automation, Machine Vision and Robotics)

Abstract

:
The removal of plastic contamination from cotton lint is an issue of top priority to the U.S. cotton industry. One of the main sources of plastic contamination showing up in marketable cotton bales is plastic used to wrap cotton modules produced by John Deere round module harvesters. Despite diligent efforts by cotton ginning personnel to remove all plastic encountered during module unwrapping, plastic still finds a way into the cotton gin’s processing system. To help mitigate plastic contamination at the gin, a machine-vision detection and removal system was developed that utilizes low-cost color cameras to see plastic coming down the gin-stand feeder apron, which upon detection, blows plastic out of the cotton stream to prevent contamination. This paper presents the software design of this inspection and removal system. The system was tested throughout the entire 2019 cotton ginning season at two commercial cotton gins and at one gin in the 2018 ginning season. The focus of this report is to describe the software design and discuss relevant issues that influenced the design of the software.

1. Introduction

The removal of plastic contamination in cotton lint is an issue of top priority to the U.S. cotton industry that has only recently become an urgent issue and is being driven into focus by rapid adoption of new harvester designs that wrap cotton modules in plastic with an associated significant increase in amount of plastic being discovered in cotton bales by textile mills. The U.S. classing offices have determined that one of the main sources of plastic contamination in marketable cotton bales is the plastic that is used to wrap cotton modules, which are harvested by the new John Deere harvesters. Despite recent diligent efforts by cotton ginning personnel to remove all plastic encountered during module unwrapping, plastic still finds a way into the cotton gin’s processing system [1]. Plastic contamination in cotton is thought to be a major contributor to the loss of a USD 0.02/kg premium that U.S. cotton used to command on the international market due to its reputation as one of the cleanest cottons in the world. Current data now shows U.S. cotton is trading at a USD 0.01/kg discount, relative to the market for a total loss of USD 0.034/kg with respect to market conditions prior to wide-spread adoption of plastic-wrapped cotton modules [2,3]. Extrapolating this loss of premium out across the annual cotton yield for a typical year in the United States; the cost of this loss to U.S. producers is in excess of USD 750 million annually. As such, it has caused significant concern to cotton growers and the cotton ginning industry [4,5,6,7,8]. An inspection system was developed in order to help address this loss and mitigate plastic contamination at the cotton gin, utilizing low-cost color cameras to see plastic on the module feeder’s dispersing cylinders that are normally hidden from view by the incoming feed of cotton modules. The research observed that one common source of plastic getting into the module feeder is plastic that is trapped underneath a module if the module is not unloaded or unwrapped properly (Figure 1).
This would invariably lead to large pieces of module wrap plastic from becoming entrained onto the module feeder dispersing cylinders, as shown in Figure 2.
When plastic builds up on the module feeder’s dispersing cylinders, it eventually tears off in small pieces, scattering contamination throughout a large volume of cotton. On the feeder apron just prior to entering the gin stand, the cotton is spread out to the thinnest stream in the ginning process. Thus, the feeder apron is the ideal location to apply a vision system to detect and remove plastic contamination flowing in seed cotton. One of the challenges to this location is that the detection operation must be high-speed as there is only a 0.5 m length of feeder apron on which to detect and then blow the plastic out of the seed cotton. The cotton flows down the feeder-apron at about 3 m s−1, and the machine-vision software has only about 25 ms in which to capture an image, analyze it, and then set a digital output line that will actuate a solenoid to blow the plastic out of the seed cotton stream. To accomplish all of this within the short time constraint, the software was written in C++ using a combination of custom software while leveraging high-quality open-source machine-vision libraries.
The primary objective of this technical note is to present the details of the software design of an automated intelligent machine-vision based cotton gin-stand-feeder inspection–removal system. The system includes a machine-learning program that automatically detects and removes plastic contamination on the gin-stand. The system is capable of semi-automated adaptive learning of the colors of the flowing cotton to be able to adjust detection performance to avoid false-positive detections when cotton’s natural constituents exhibit colors very close to plastic contamination. An example is when cotton has a naturally occurring spotted yellow appearance that is similar to the color or yellow module wrap plastic. The system was tested during the 2019 cotton ginning season at two commercial cotton gins and at one gin during the 2018 ginning season. Included as an attachment to this technical note are all of the software source-code files for the machine-vision system software. This article will be followed up with additional reports on the pneumatic design and then followed up with a final report covering the experimental testing of the efficacy of the system.

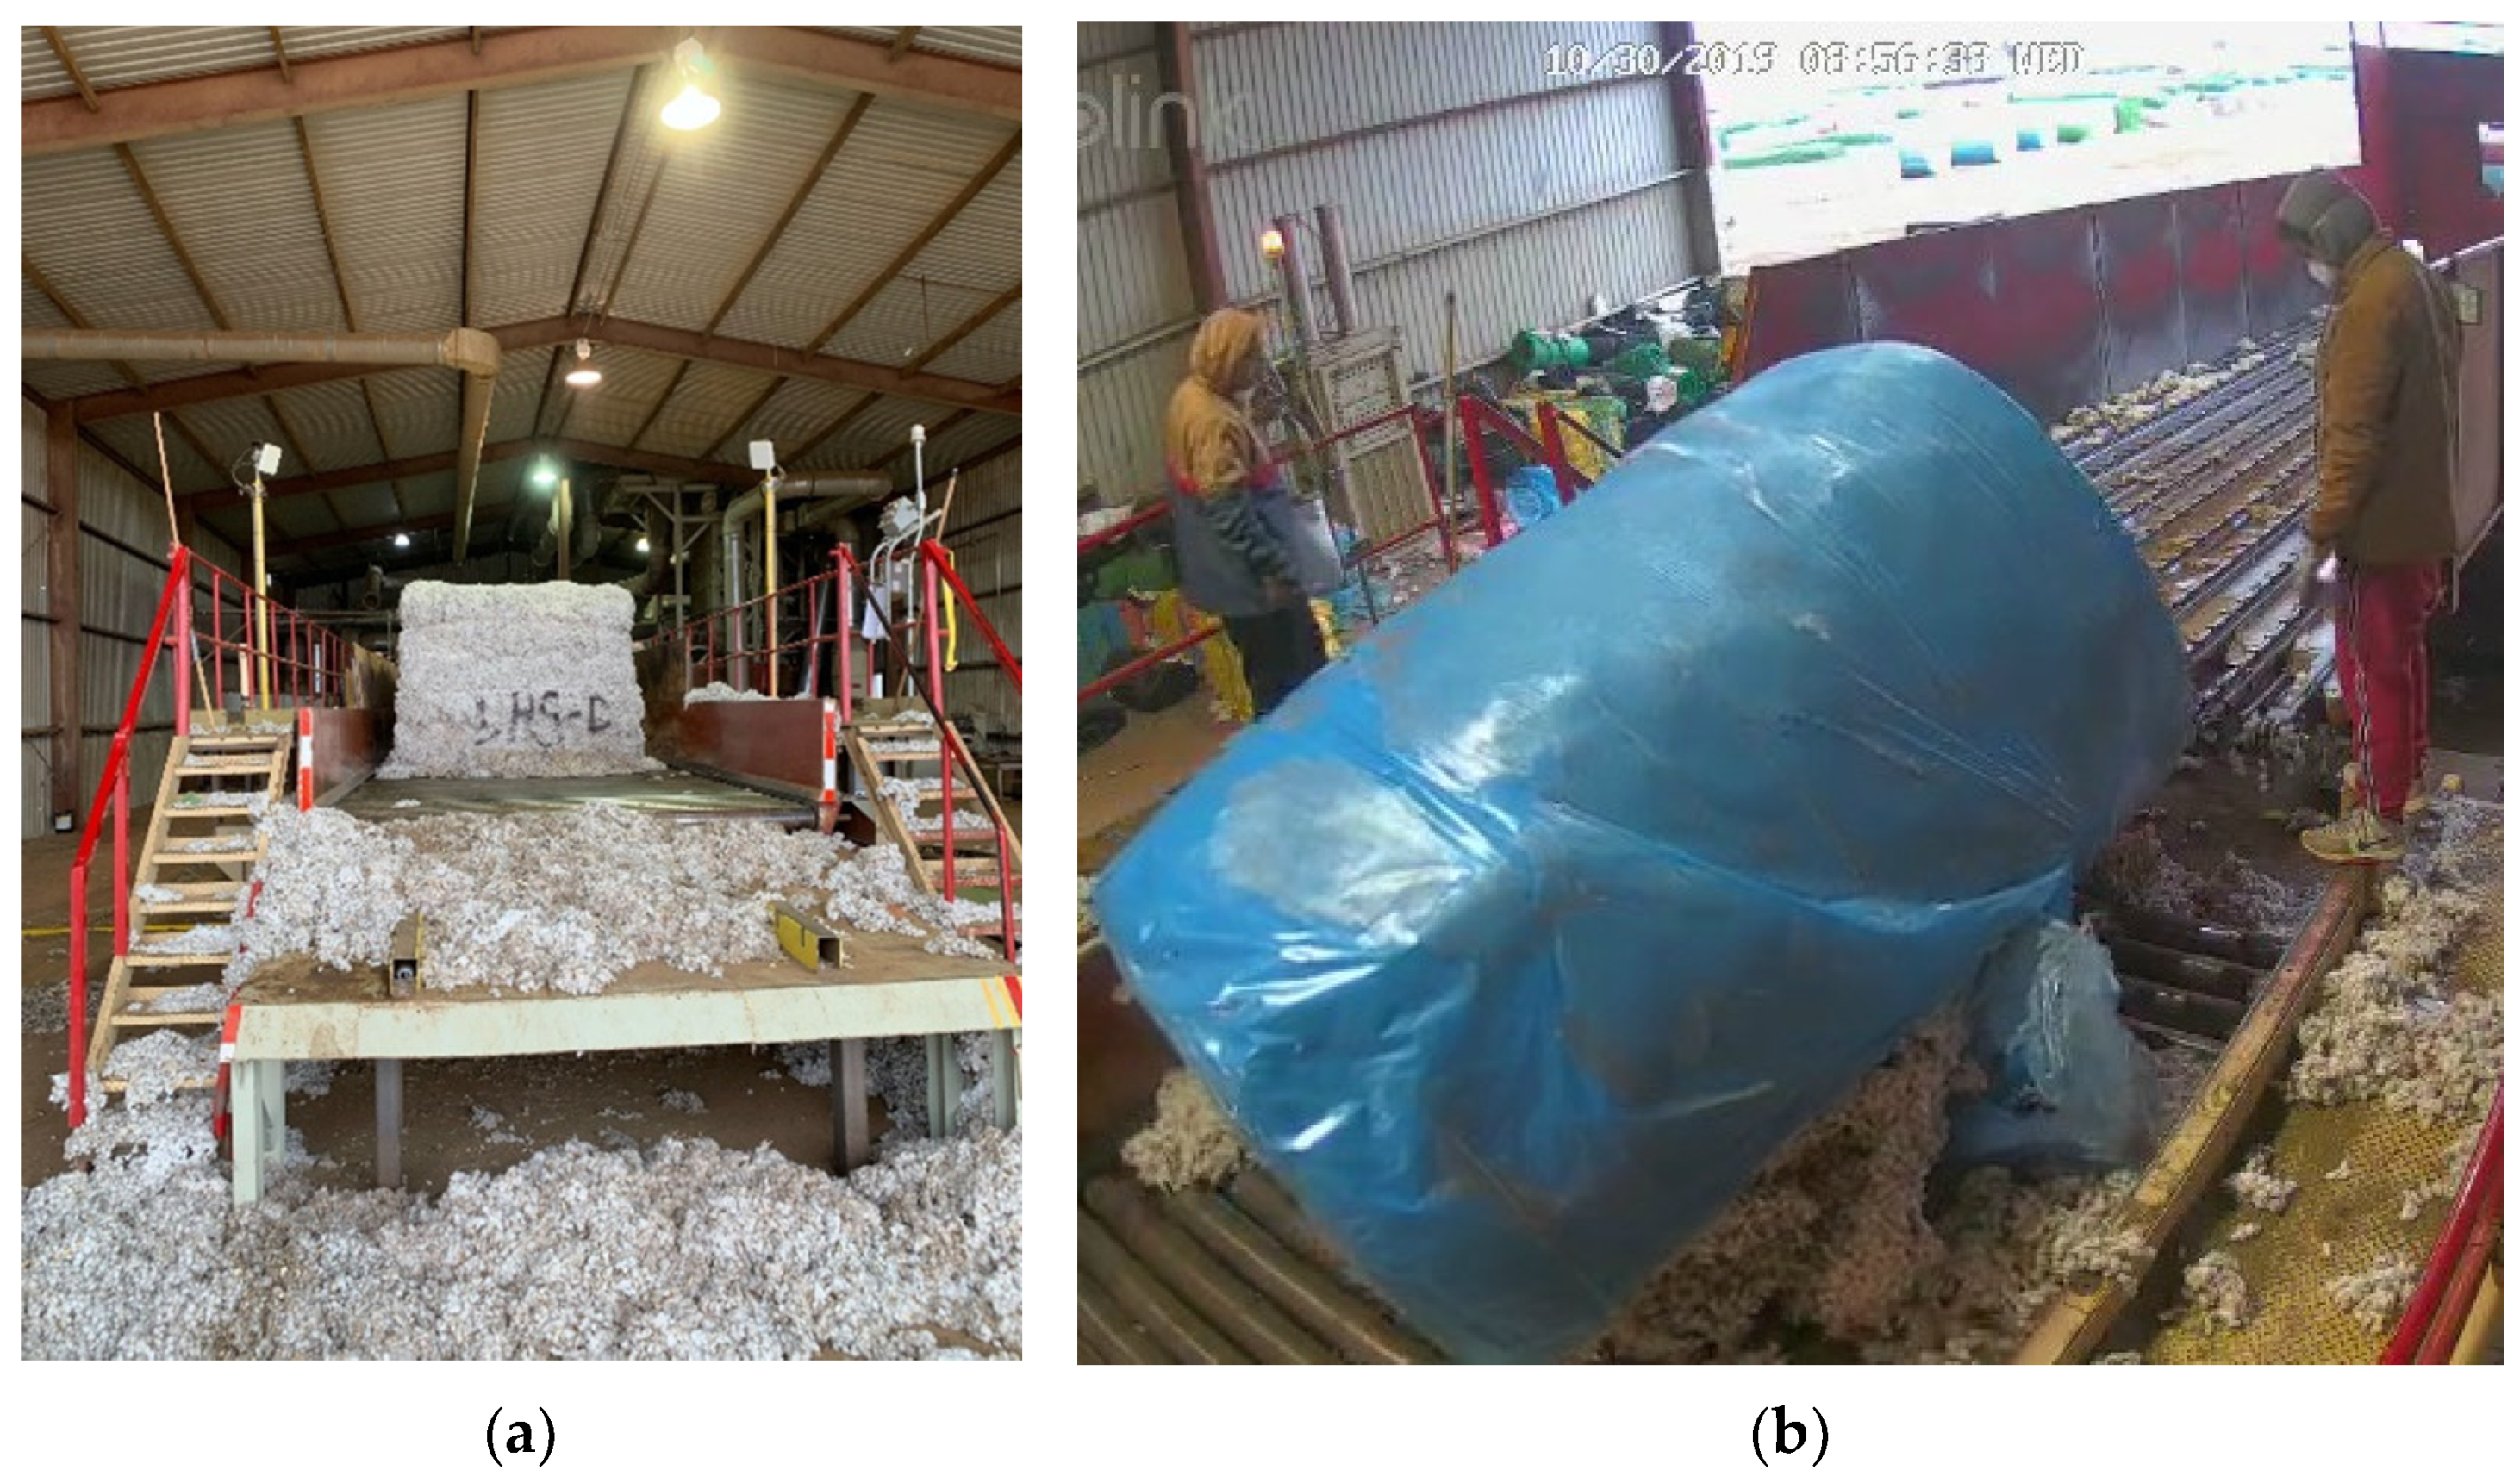
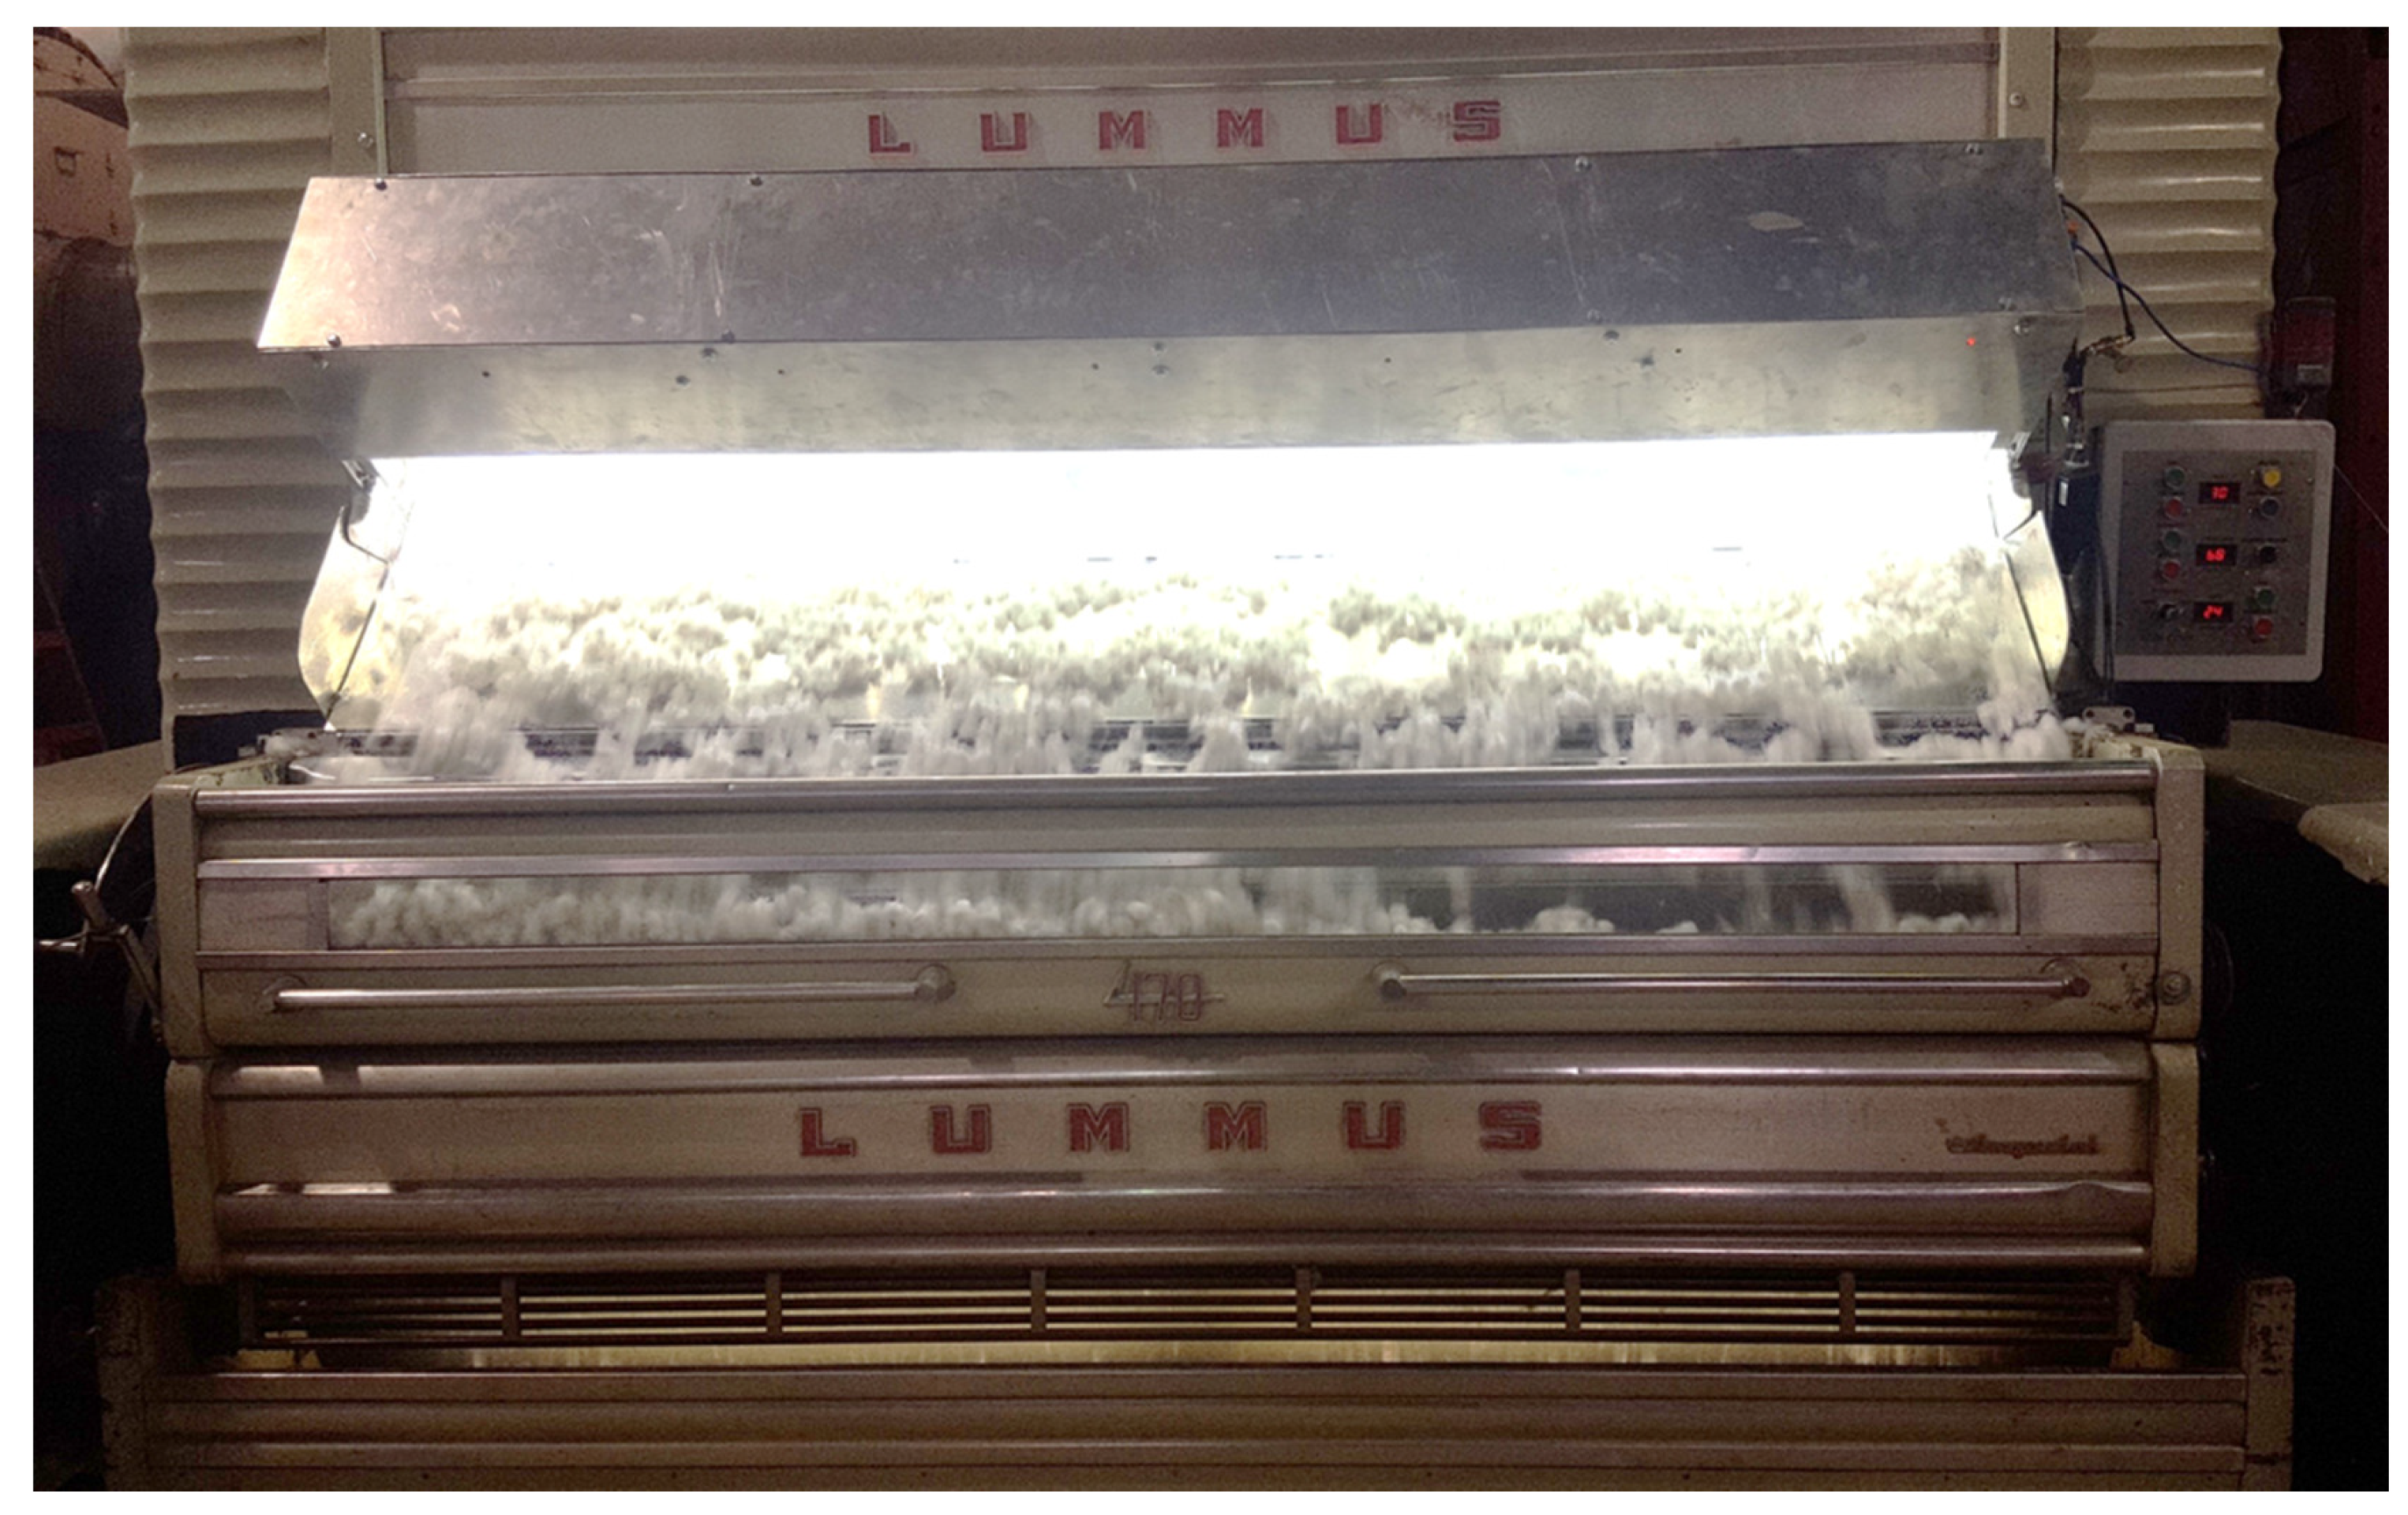
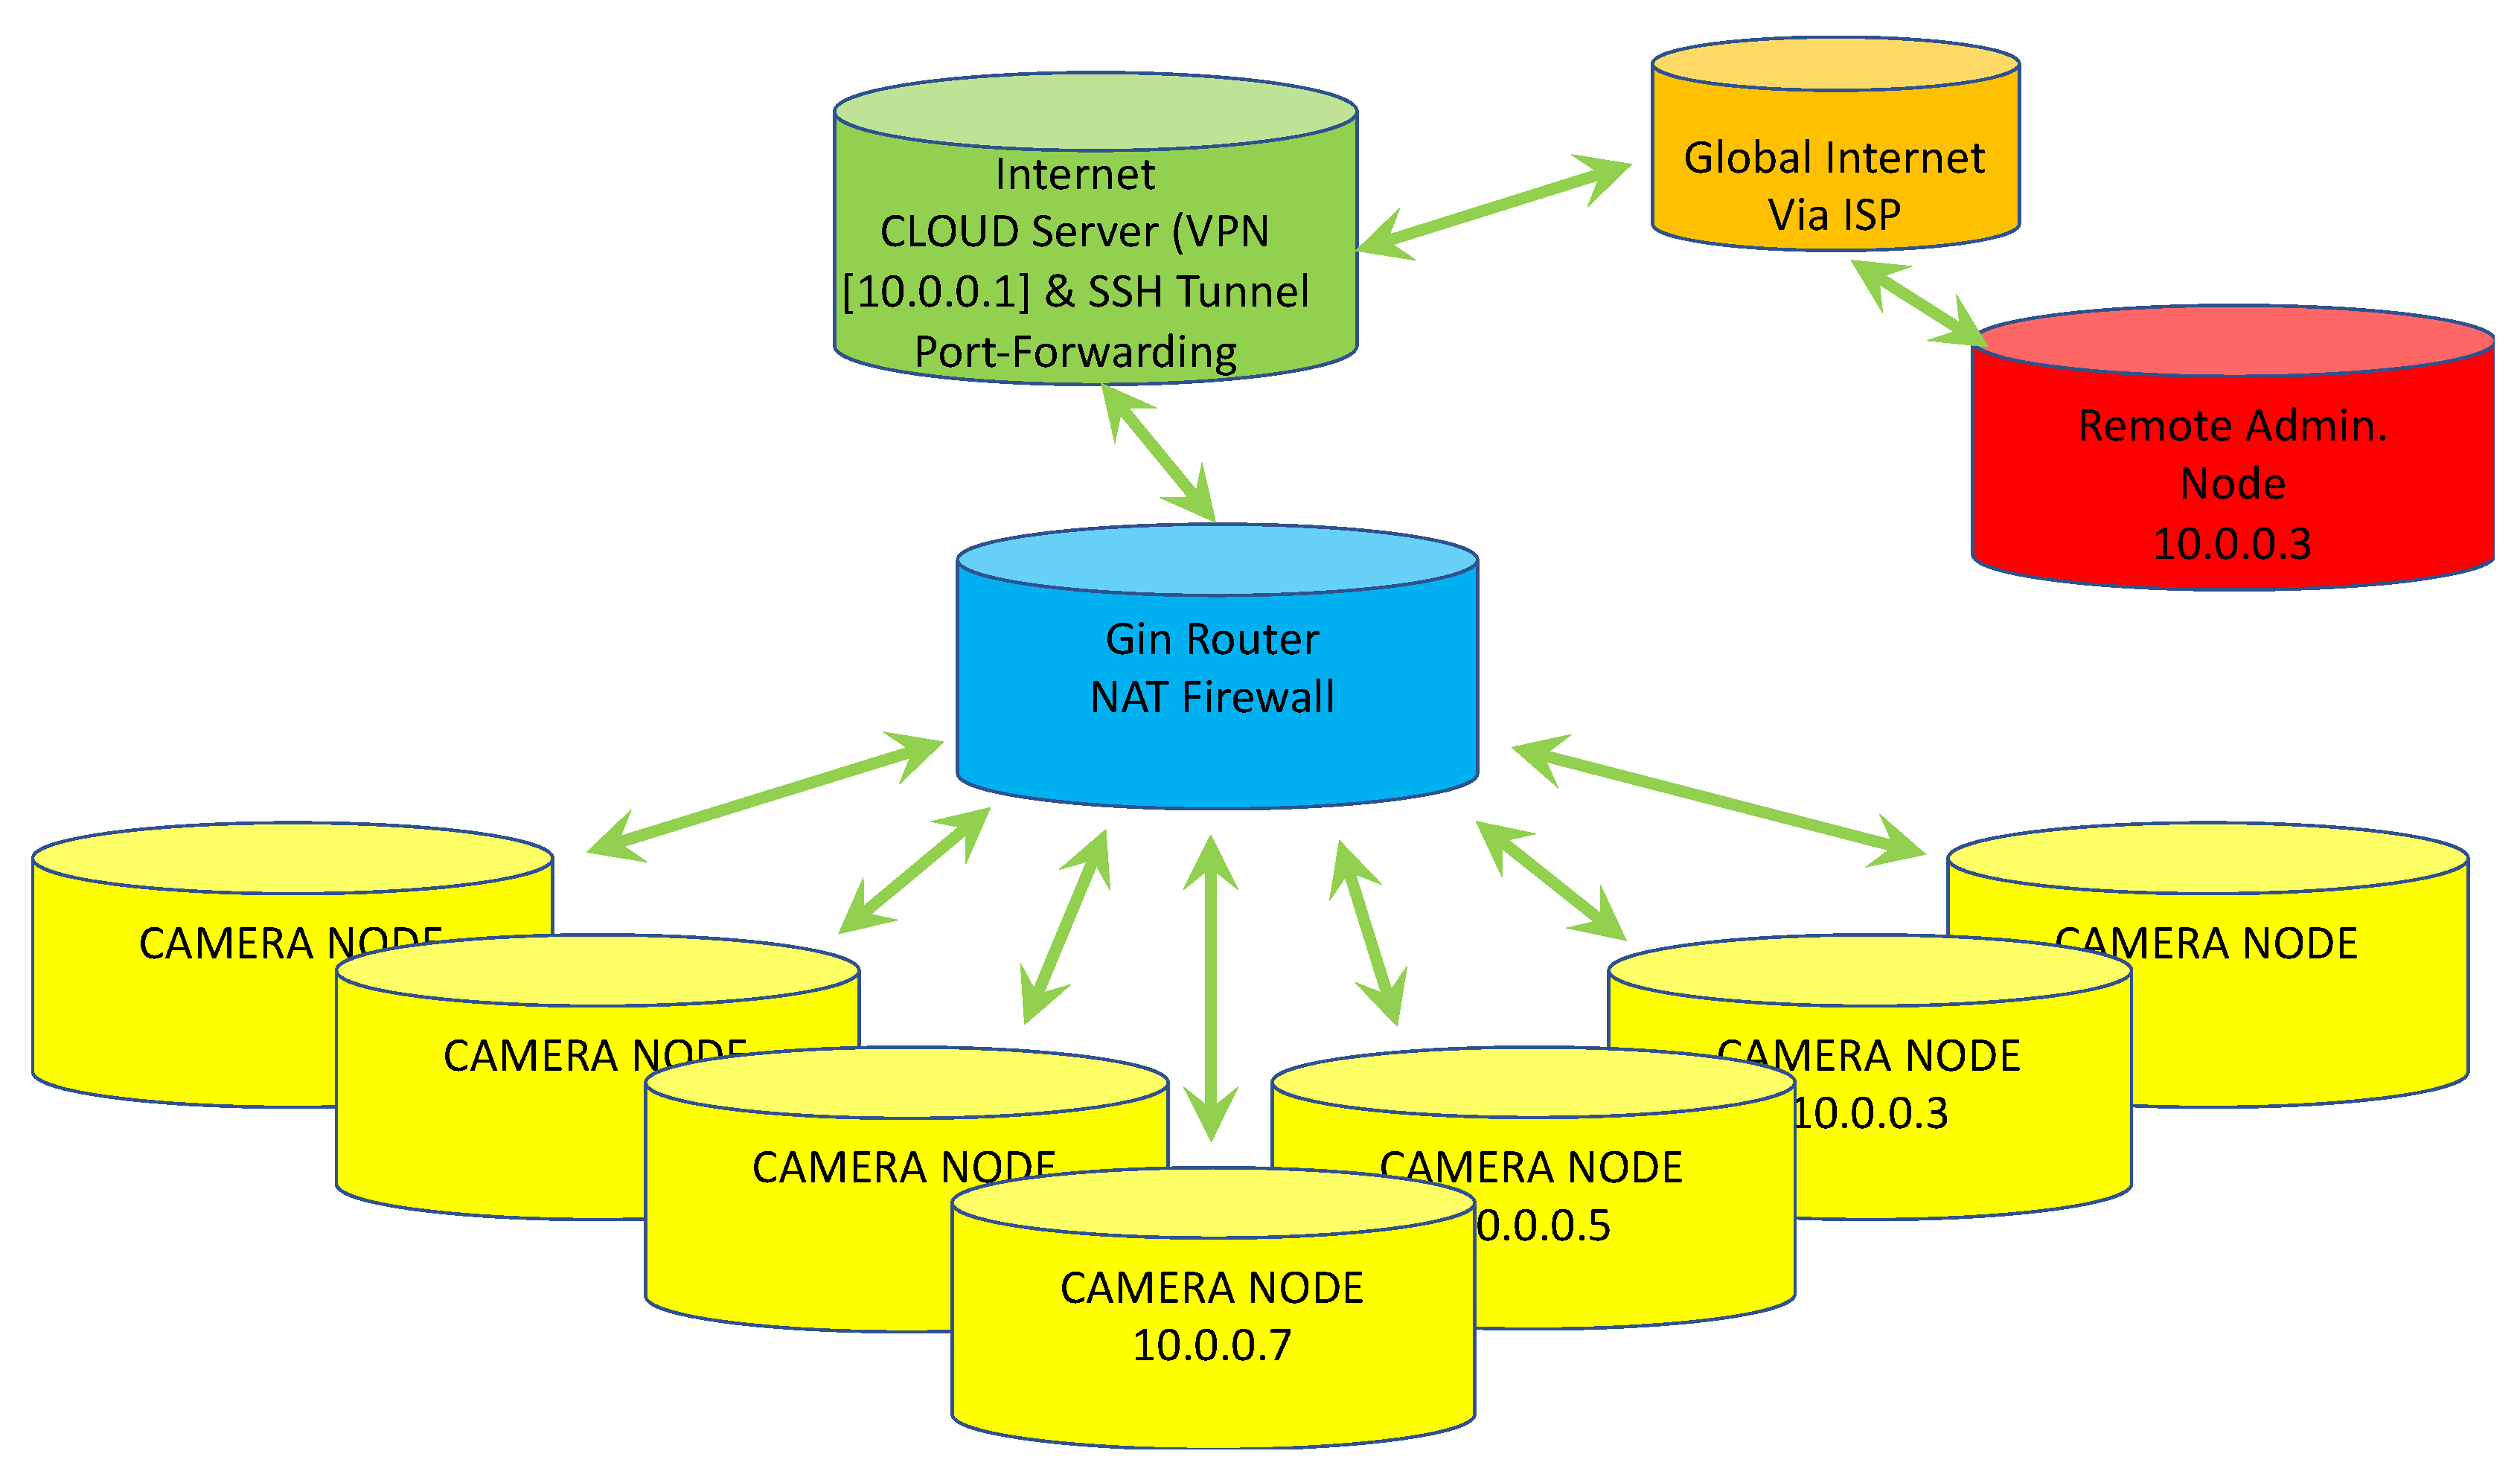
2. Machine-Vision Plastic Detection–Removal System

The overall system is composed of the following sub-sections:
  • Machine-vision plastic detection system that analyzes each image for plastic and notes the location where plastic was detected.
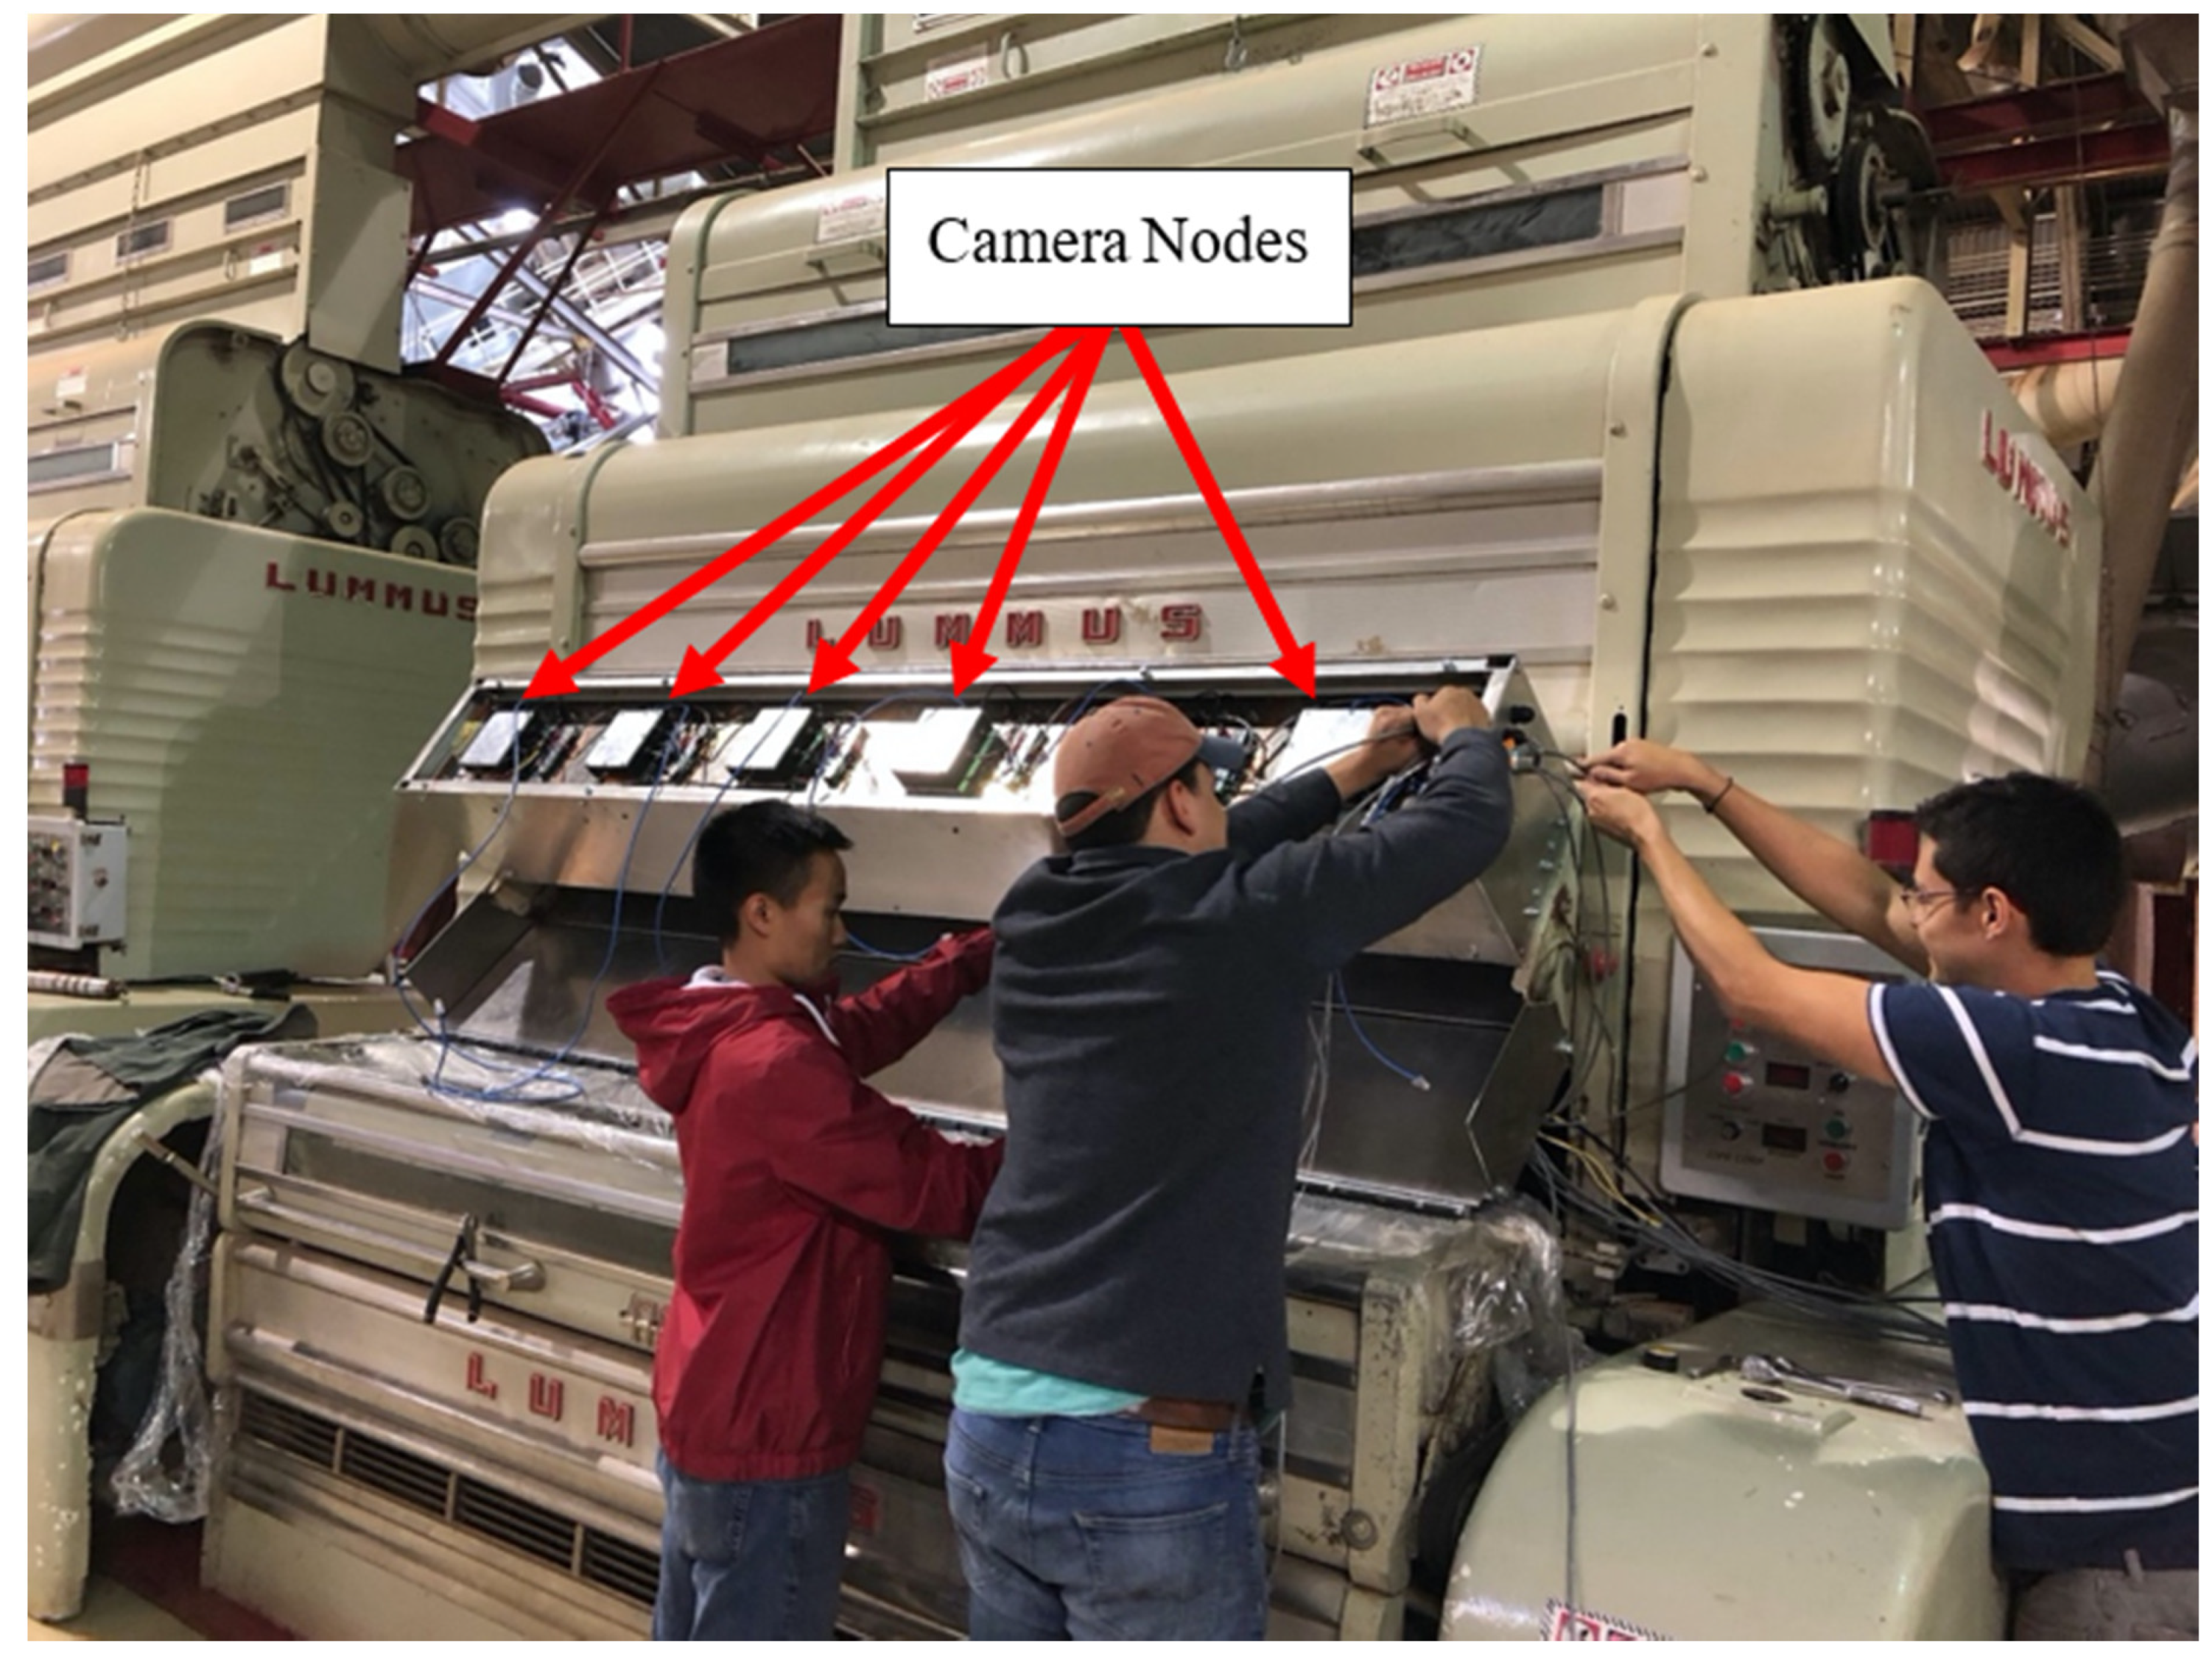
  • Camera-computer node housing that utilizes pneumatic air for cooling and to keep the camera lens clear in the high dust environment of a cotton gin.
  • Electronic drivers to convert the embedded processor’s low-voltage, low-current digital input–output signals to 12-volt direct current (VDC) with sufficient current capacity to drive a pneumatic solenoid.
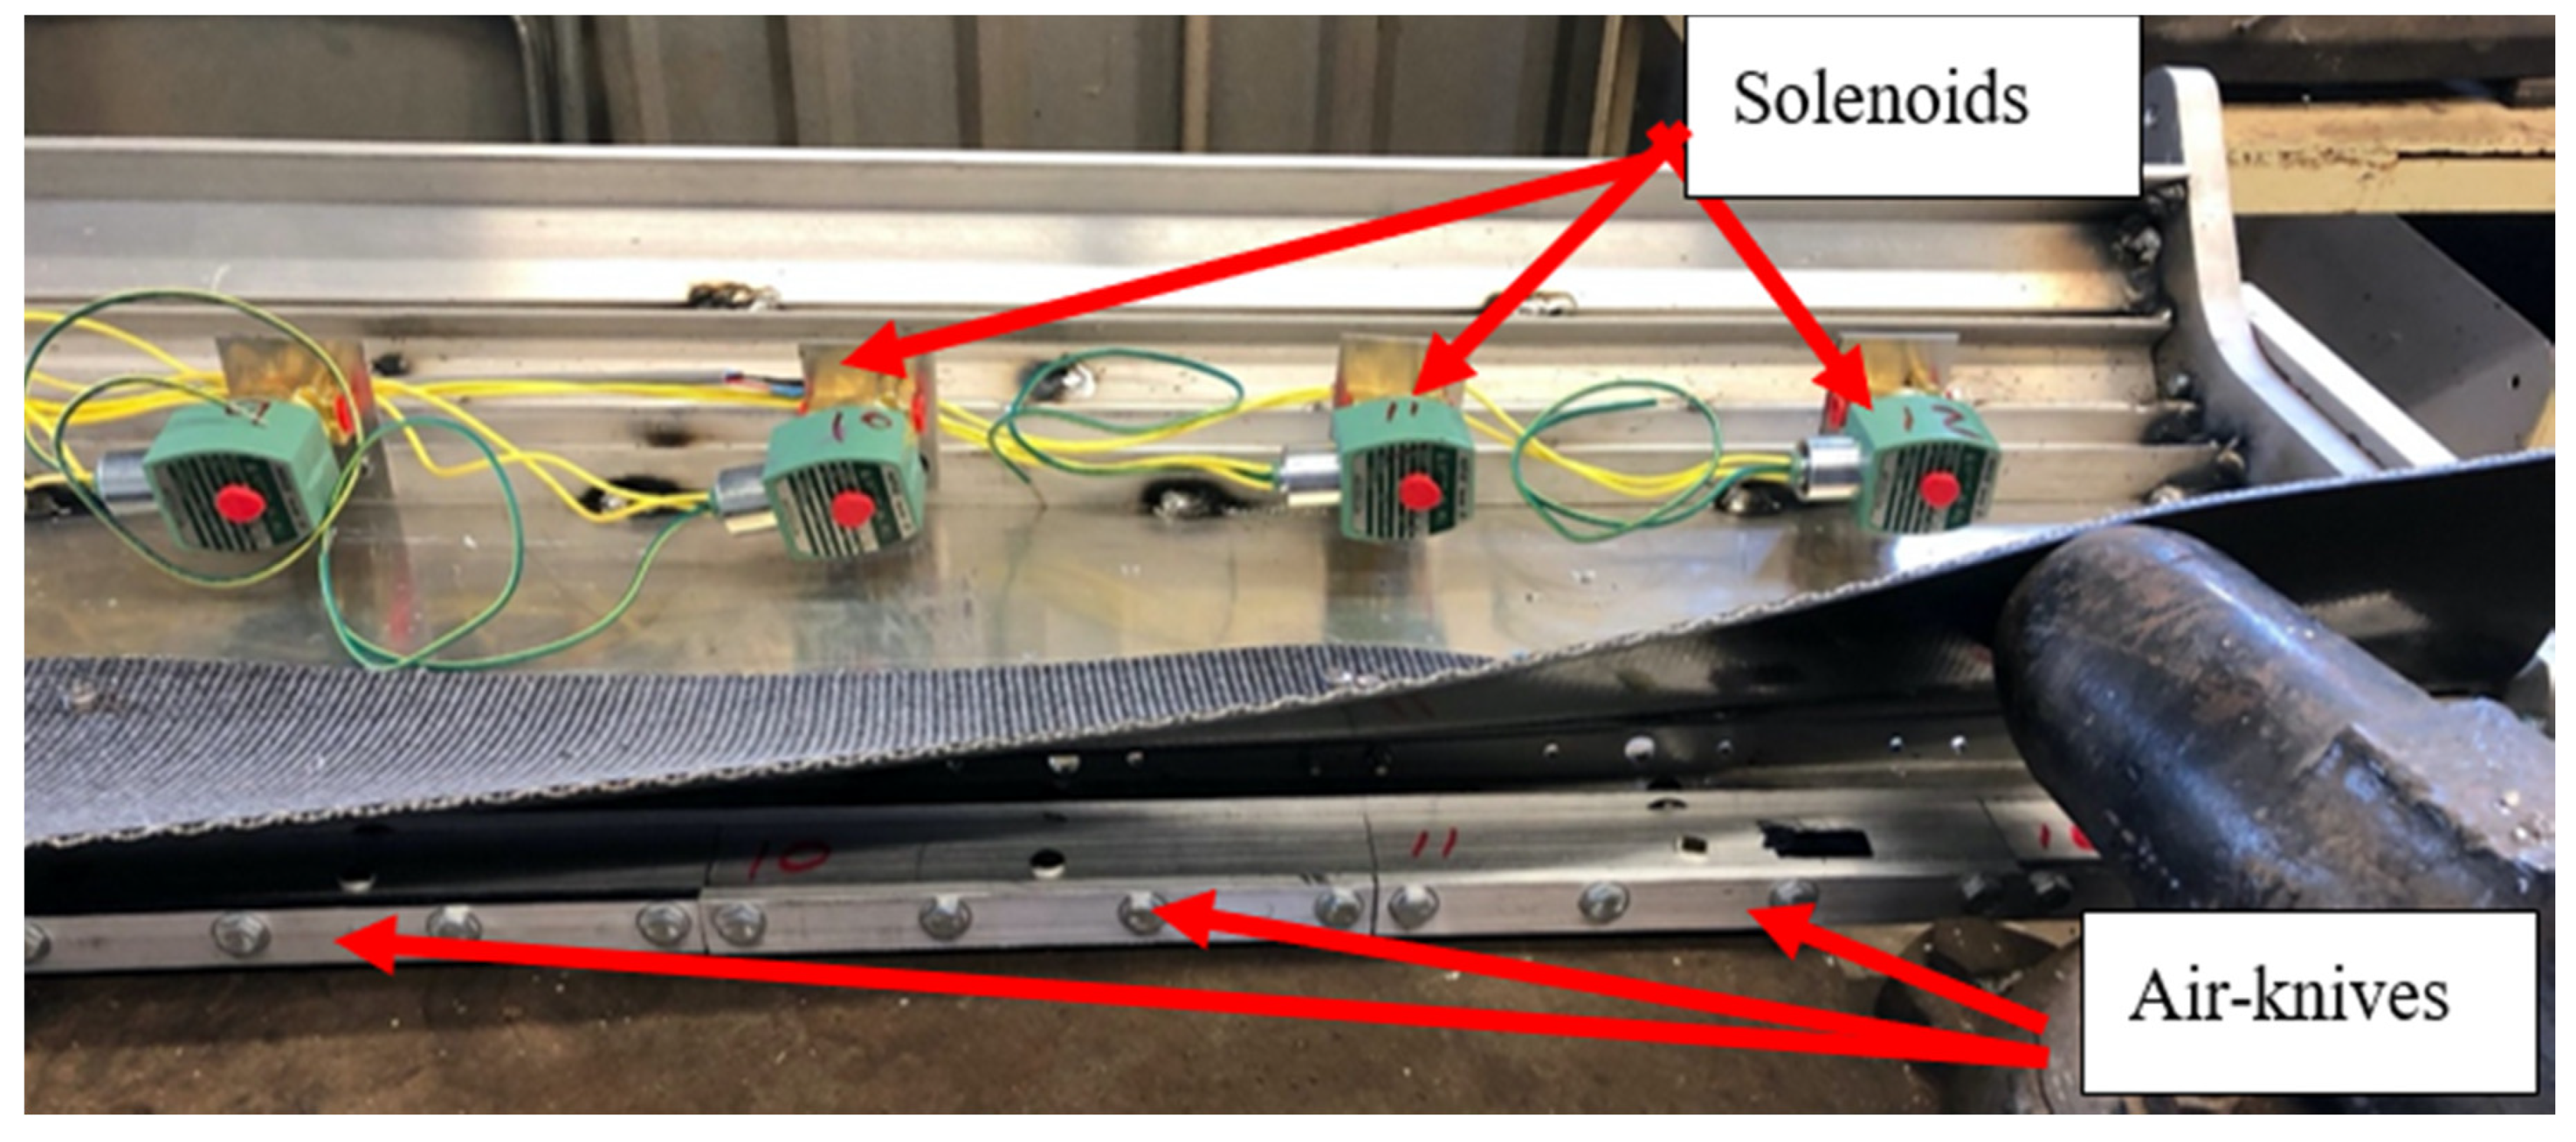
  • Manifold of pneumatic solenoids used to provide compressed air to air-knives located at the base of the feeder apron.
  • Bank of air-knives that provide a strong burst of air to eject the detected plastic from the main cotton flow.
The following will provide an overview of each of the sub-sections and how they interact to affect the global operation of the system. Fine details will be covered in subsequent publications covering key aspects of the design for each of the sub-sections, similar to this paper, which covers the sub-section on the machine-vision software design.
By design, each camera examines 0.35 m of gin-stand feeder apron width; a complete gin-stand will have 6–8 camera-computer nodes, and the cotton ginning facility, with 3–5 gin-stands, will have from 18 to 40 camera-computer nodes. The image resolution in the early versions of the system were 320 × 240; however, in a recent version, with adoption of a faster ARM processor, the image capture resolution was increased to 640 × 480 pixels with an average processing rate of 40 frames per second (FPS). Figure 3 shows the processor-camera housing (hereafter known as “camera-node”) that included an integral air-knife that was design to port air through the housing, for cooling of the processor, which is then routed across the optics, via integral air-knife, to keep the camera optics dust- and dirt-free. Testing on the feeder determined that the extractor saws inside the feeder had a very high extraction efficiency for targets smaller than 50 × 50 cm. This led to the design decision that a high pixel per centimeter resolution could be relaxed, yielding a lower cost installation, with a lower number of computer-nodes and with a lower number of camera-nodes, reducing maintenance with fewer camera-nodes. Testing found that sufficient performance was achievable with an optical viewing region configured to provide a physical horizontal image width of 35.6–40.6 cm (14–16 in.).
Figure 4 shows an example installation on a commercial gin-stand with six camera-computer nodes. Upon detection of plastic, the processor turns on the corresponding digital output pin corresponding to the zone that the plastic was found in the image.
The output pin connects to an electronic driver that boosts voltage and current to drive a 12VDC pneumatic solenoid, where each of the solenoids are mounted underneath the gin-stand feeder apron’s lower section adjacent to the air-knives (Figure 5).
Each camera node was connected to four solenoids. Each solenoid provides actuation air to an air knife. Each camera node drives a bank of air-knives that can be fired independently or in combination, wherein each air knife imparts a removal burst of air to the cotton containing the plastic, thereby ejecting the plastic along with a small fraction of cotton (Figure 6 and Figure 7). The choice of which air-knives to fire is dictated by where in the image the plastic contamination is detected. Physically, there were two air-knives per camera-node; however, to ensure complete plastic ejection when on a boundary between air-knives, the camera-node was configured to fire both adjacent air-knives. Hence, as there are three air-knife edges per camera-node, each camera-node controlled not only its two air-knives, but also was wired so that it could fire the neighboring camera-node air-knives it shares a boundary with. Depending upon where in the image the plastic appears, from 1 to 2 solenoid/air-knife pairs will be turned on to ensure the plastic is safely removed with a minimum of cotton. As it is possible for a large piece of plastic, or multiple pieces, to be detected in more than one lane, the air supply should be designed to support firing of all four air-knives simultaneously. The design of the air-system will be covered in more detail in a subsequent report; however, suffice to say, a local accumulator is an important feature to ensure the system can supply adequate bursts of air for multiple air-knife actuation events.
In practice, it was found that a pulse length of 250 ms was sufficient to ensure ejection while minimizing the amount of cotton ejected onto the floor. A repeated ejection study with this setting found that a typical ejection was 50–100 gm of seed-cotton per ejection event, assuming a single air-knife was fired. As sometimes the targets are detected on an edge between air-knives, the software was thus designed to fire both air-knives, which, in the case of a double air-knife ejection firing, the amount of cotton ejected was 100–200 gm.
Figure 8 shows that during testing in a commercial field trial, typical plastic contaminants were captured during the course of operation. For readers that are interested in developing their own classifiers, an image dataset of plastic captured by the prototype was published from this work [9].
As it was imperative not to contaminate the cotton in the commercial gin where the system was being tested, testing of the system was limited to a few very carefully conducted trials to test efficacy of the PIDES system. More extensive tests are underway under laboratory conditions where a full set of replicated trials can be conducted to fully stress the system and assess the true efficacy of the system. This in-depth experimental testing of the system will be reported on in a follow-up report, as the focus of this report is on the software design portion of the system. To provide the reader an indication as to the level of performance of the system, a brief synopsis of the commercial field trial results is presented in the next section.

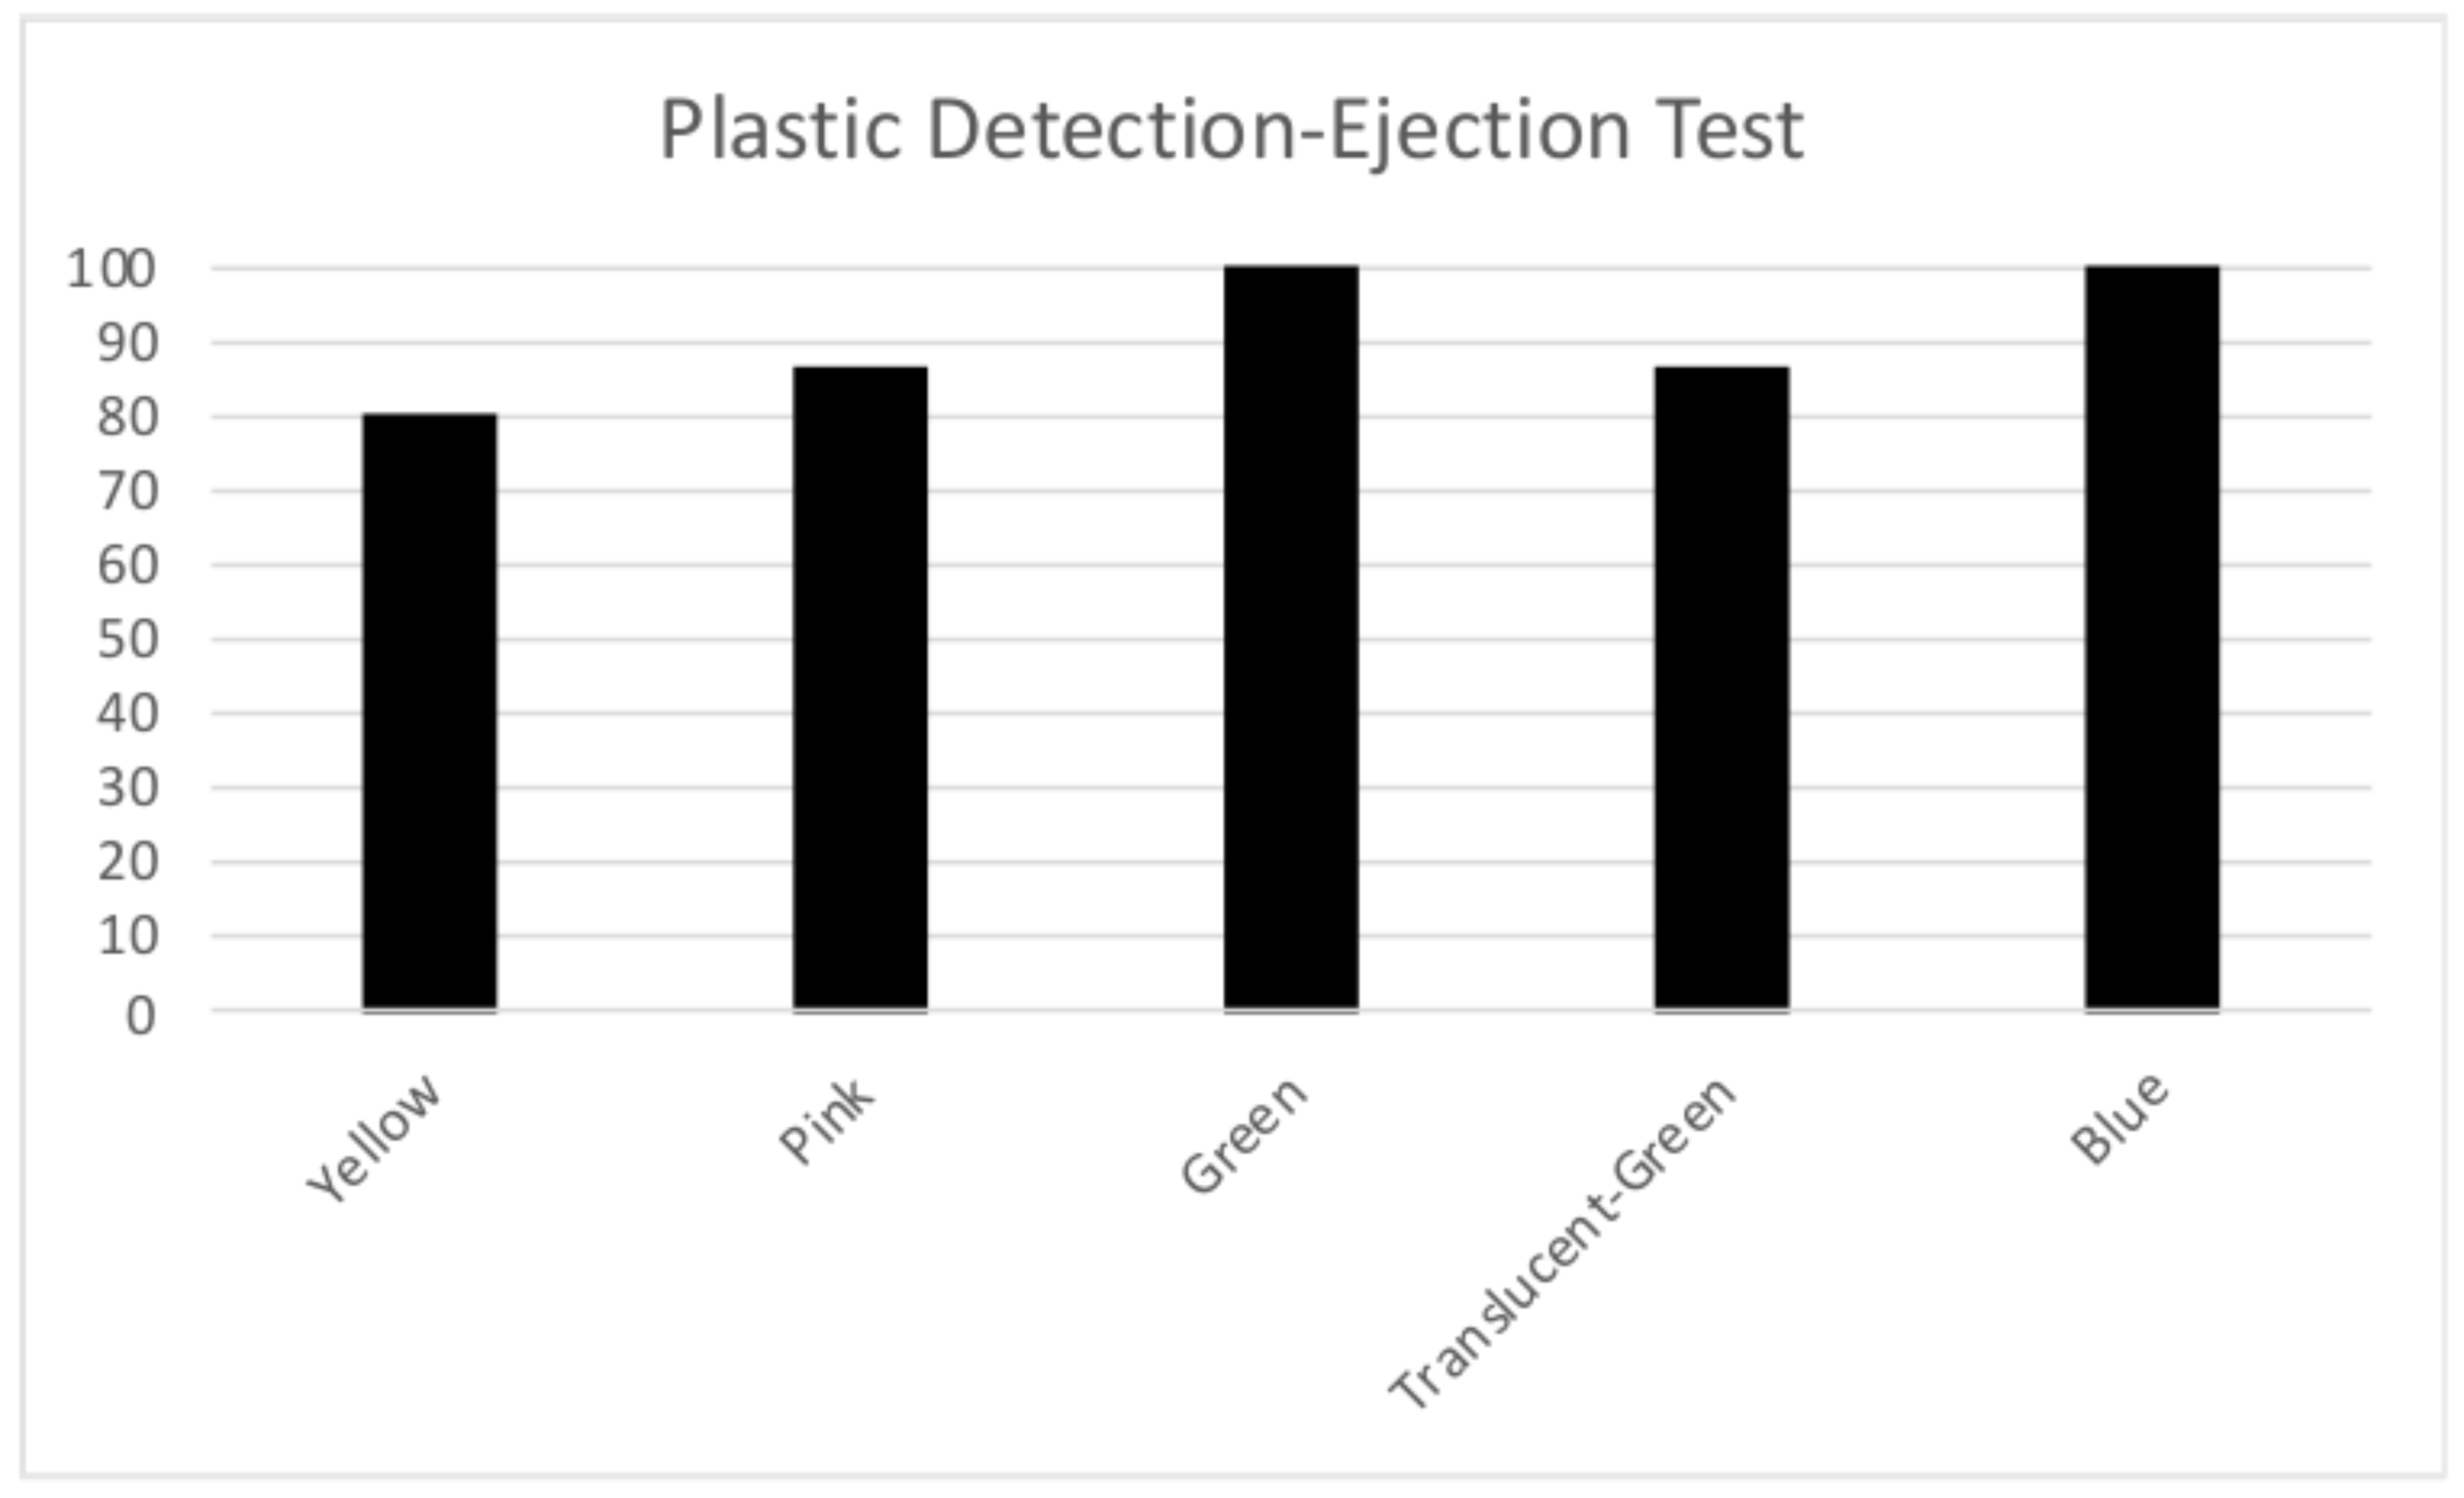
System Performance as Measured in the Commercial Field Trials

The test protocol for the commercial field trial was to inject 10 targets of each size (50 × 50, 100 × 100, 100 × 800 cm) into the cotton flow, just upstream of the PIDES system. This was replicated three times for each color. Results of this preliminary testing under commercial conditions is shown in Figure 9.
The preliminary testing found that yellow and pink were not as readily detectable as green and blue. This degradation in performance was due to the large overlap in the color spectrum between yellow and pink module wrap and the natural cotton colors that were used to build the negative classifier. The negative classifier and the color overlap of pink and yellow module wrap is covered in more detail in Section 3.5. Similarly, the translucent green module wrap had a low color saturation, which resulted in significantly reduced color separation.

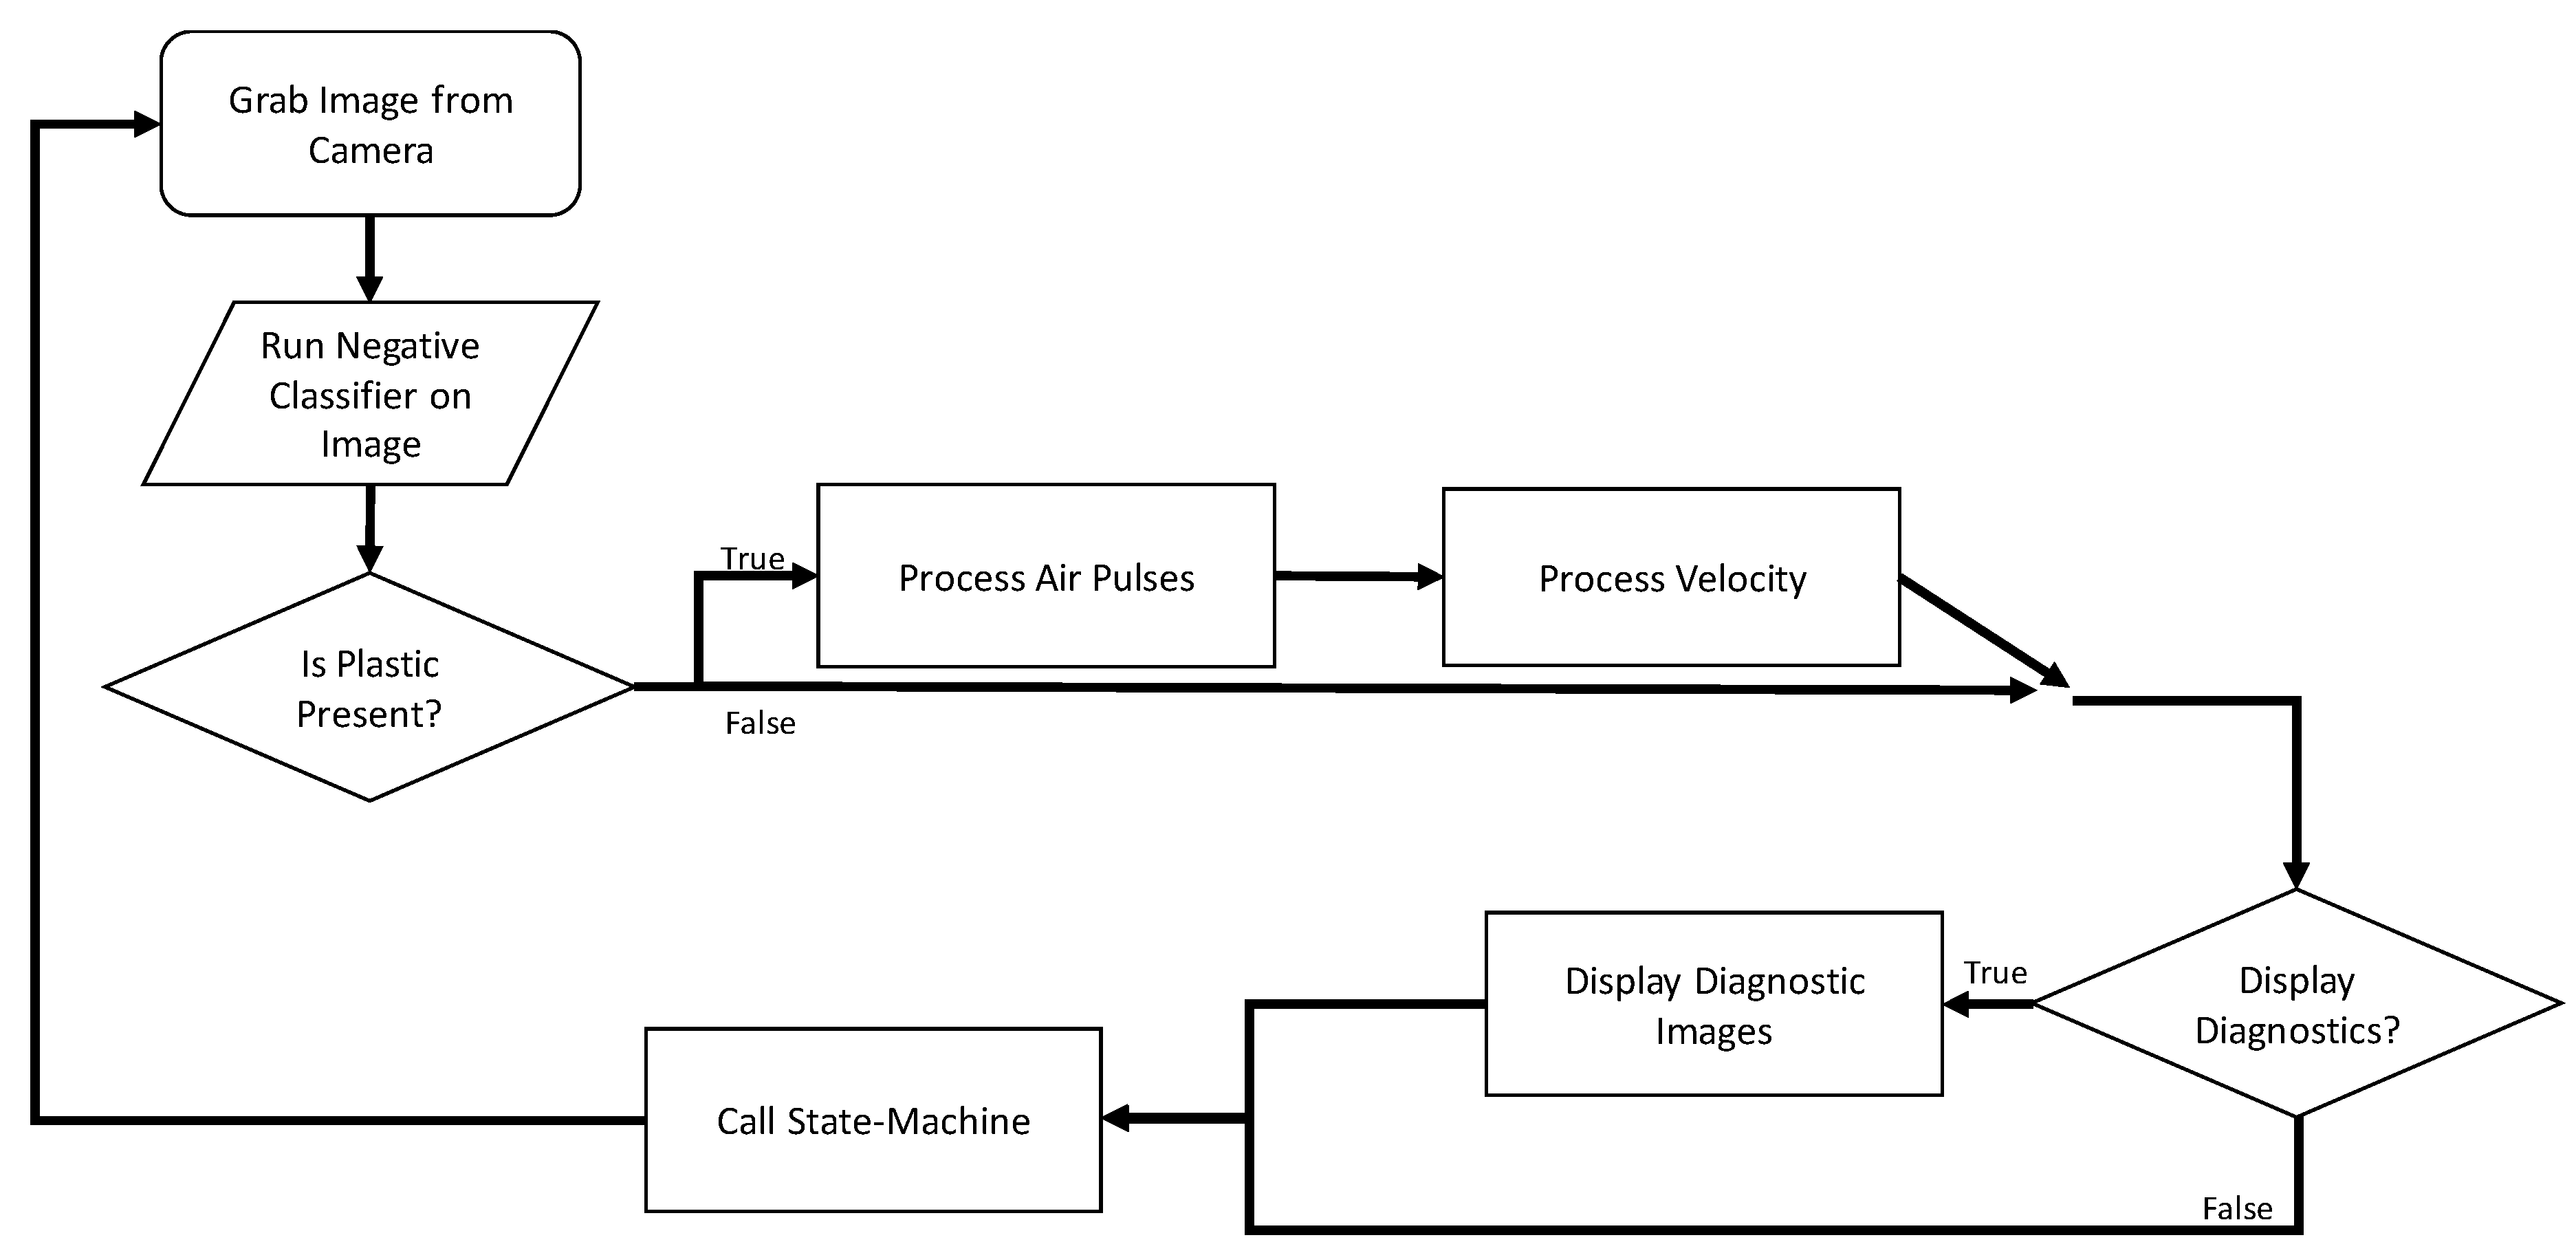
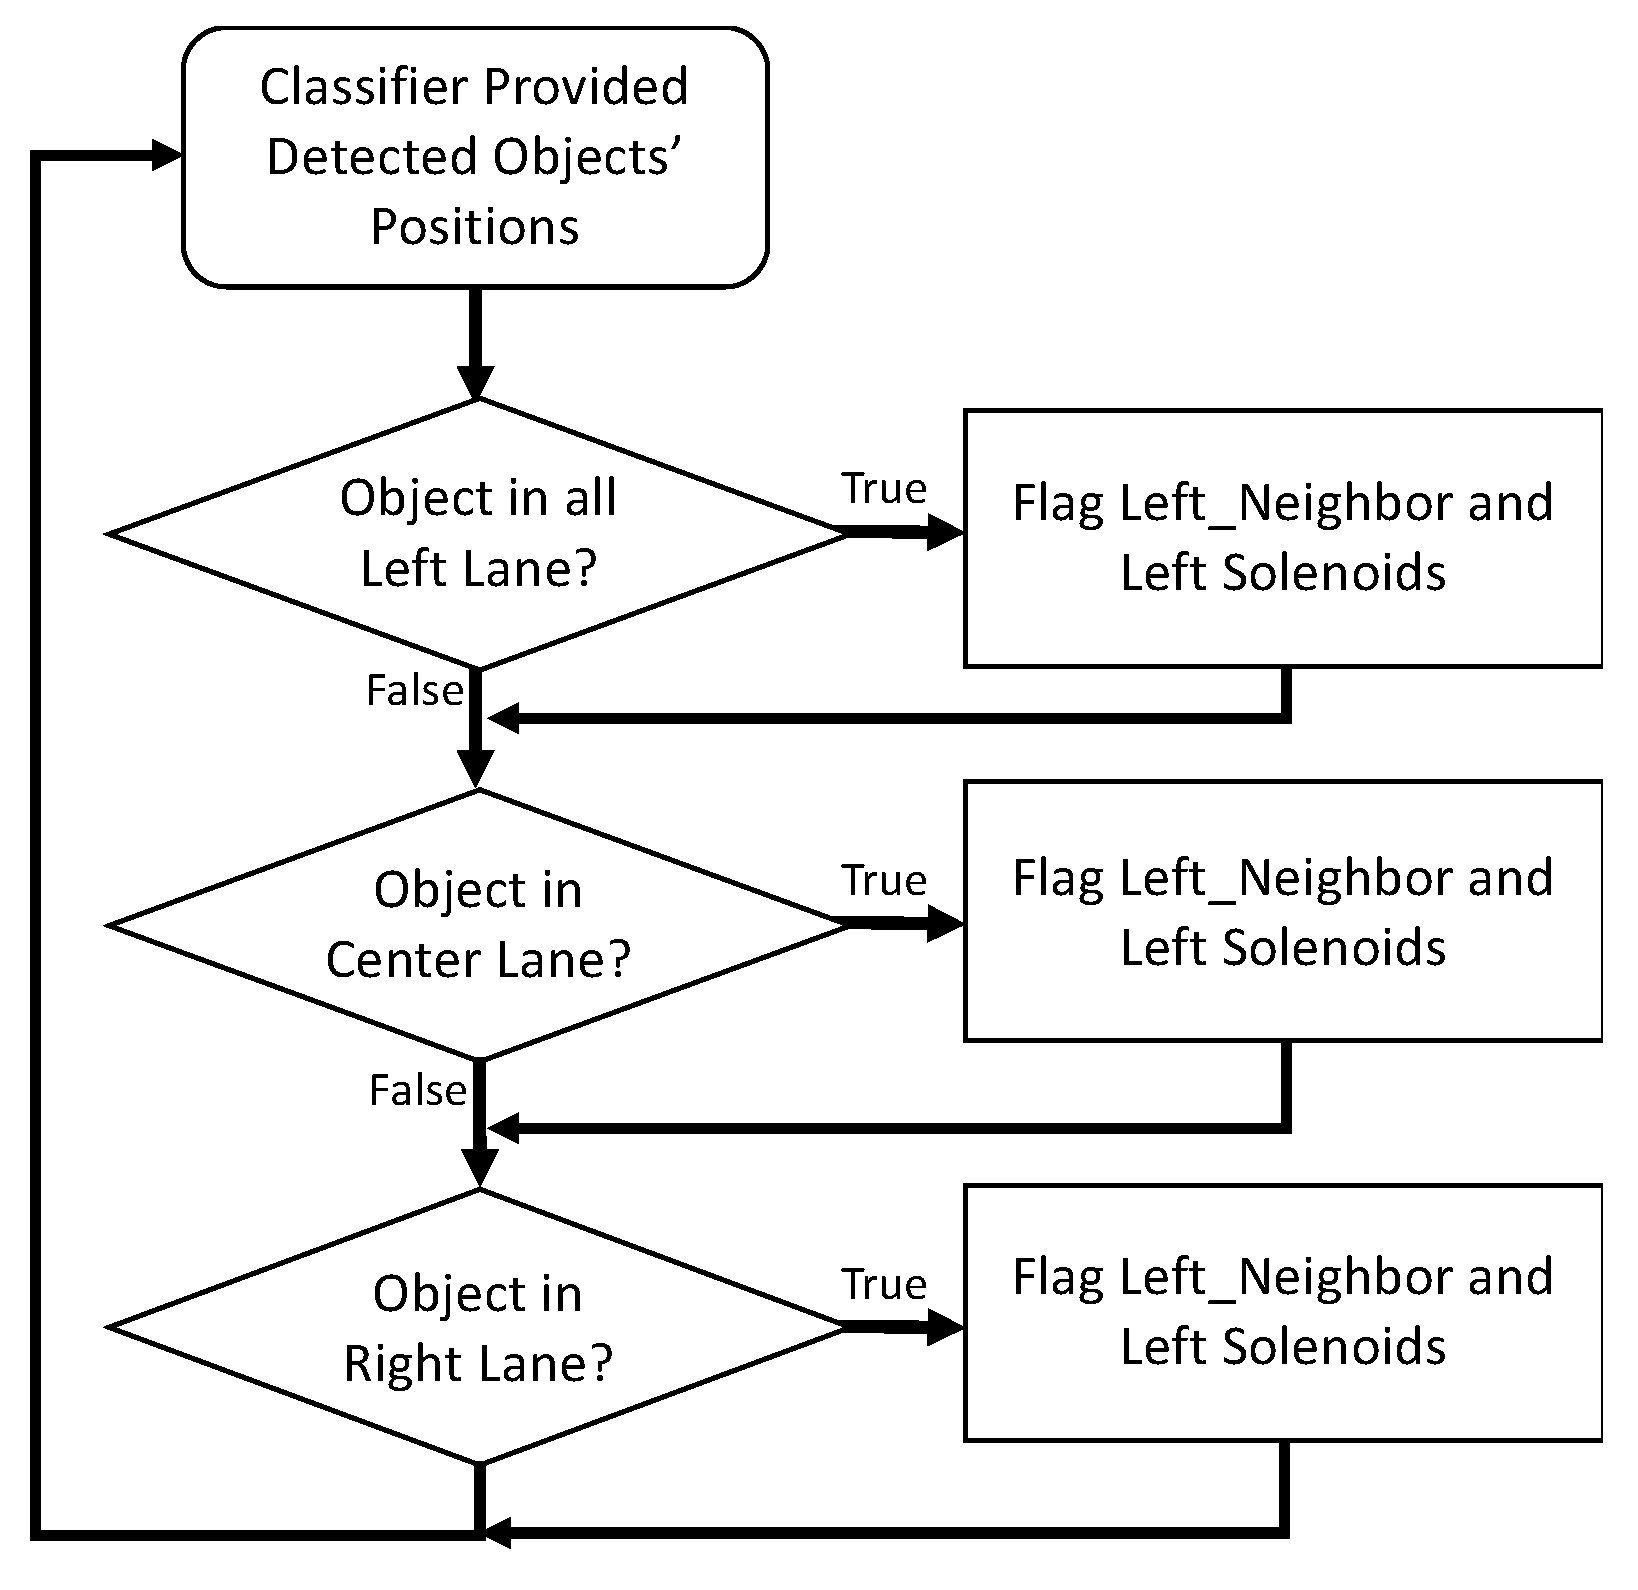
3. Machine-Vision Plastic Detection–Removal Software

The software discussed in this technical note provides a plastic monitoring–ejection system that is mounted on a gin-stand feeder.

3.1. Background Development Tools

The software discussed in this technical note provides a monitoring–ejection system of the gin-stand feeder apron for the ginners. In the system discussed herein, the gin-stand feeder-apron camera system software was designed around an event-driven program using the cross-platform C++ programming libraries and integrated development environment (IDE), provided by QT Company, hereafter known as QT [10]. One of the main advantages of using QT is that it allows for a write-once run anywhere model that is supported across a great number of operating systems (OS) and hardware platforms such as (Linux ARM, Linux x86, Apple OS and IOS, Windows, and Android). Additional advantages are incurred from the extensive set of QT libraries the compiler has built in. For example, the QT application programming interface (API) includes a very streamlined and easy-to-use event-driven model that is based around a signal-slot paradigm whereby when a device or function wants to generate an interrupt service request, it issues a signal to the library that then calls any associated slot-flagged functions. Utilizing this technique, the programmer can link a function, designated as a slot, that will be called every time the signal is emitted by any other function or library request for servicing. This methodology provides an event-driven system that is completely event-driven such that any event will be rapidly responded to by the QT library and slot-associated functions provided by the programmer. This signal-slot paradigm provides a seamless programming interface for asynchronous operations, such as responding to plastic-detection, communication or timer events, etc. In this manner, QT provides the underlying architecture for a generic idle scan loop, until an event occurs. The gin-stand feeder inspection system portion of the software was constructed using the QT paradigm so that all the main functions run at regular intervals, matching the frame rate of the camera via an interruptible signal slot on the basis of a QT timer method. Some of the key events the software utilizes that trigger the slot-denoted functions are:
  • Asynchronous functions responding to events, such as:
    Completion of image processing,
    Firing solenoids for plastic-detection events
    Checking the SQL database for new user-inputs etc.
  • QT timers.
Another key feature that enables rapid program development using QT is its IDE, which features an easy-to-use form layout tool that automatically links slot-functions to appropriate buttons, text boxes, and other assorted graphical user interfaces (GUIs), forming elements and providing an easy-to-use, full-featured debugger that allows for setting watch-points and single stepping through the code to assess program operation. As the system was designed to run on a gin-stand, the OS of choice was to utilize Linux as it has the best support for embedded hardware that is most appropriate for non-desktop industrial environments that must always be on and highly resistant to OS crashes and lock-ups. While Windows is the dominant OS, for embedded applications, one notable problem with using Windows OS for embedded applications is that one cannot turn off automatic updates, and those updates are known to cause installation of driver updates that sometimes, too often, render software programs relying on them to become inoperable. This is obviously a serious detriment to any device seeking to run continuously in a critical environment where technical support is removed, and the application cannot handle down-time. Another notable problem with Windows is that it is a closed OS; as such, if there is an instability, the developer is at the mercy of Microsoft to come up with a fix, whereas in the Linux OS, the developer is free to simply extend the existing drivers to provide the missing functionality. This is a huge advantage in the technology race where sensor advancement is running much faster than OS updates. Linux is also known to provide a highly stable platform for systems that are required to be on 24 h per day. This, coupled with the free license model, provides significant advantages to the embedded developer. To keep end-user costs low, the computer utilized for the basis of the design was based on a low-cost embedded cell-phone ARM processor. The computer was interfaced to a bank of solenoids via a custom electronic board that interfaced to the ARM processor’s digital input–output, IO pins. The IO pins were connected through this custom interface board, which provided optical isolation, level-shifting, and current amplification such that it can drive the 12VDC pneumatic solenoids that provide compressed air to the ejection air knives.
To assist in rapid development, an open-source machine-vision library, OpenCV, was used to handle a large portion of the routine sections of the image processing routines. For plastic identification, a custom high-speed C++ classifier was developed to enable real-time machine vision processing for plastic detection on the gin-stand feeder-apron that was fast enough to capture, process, and then actuate solenoids in time to eject the plastic being carried along with the cotton flowing at 3 m s−1.

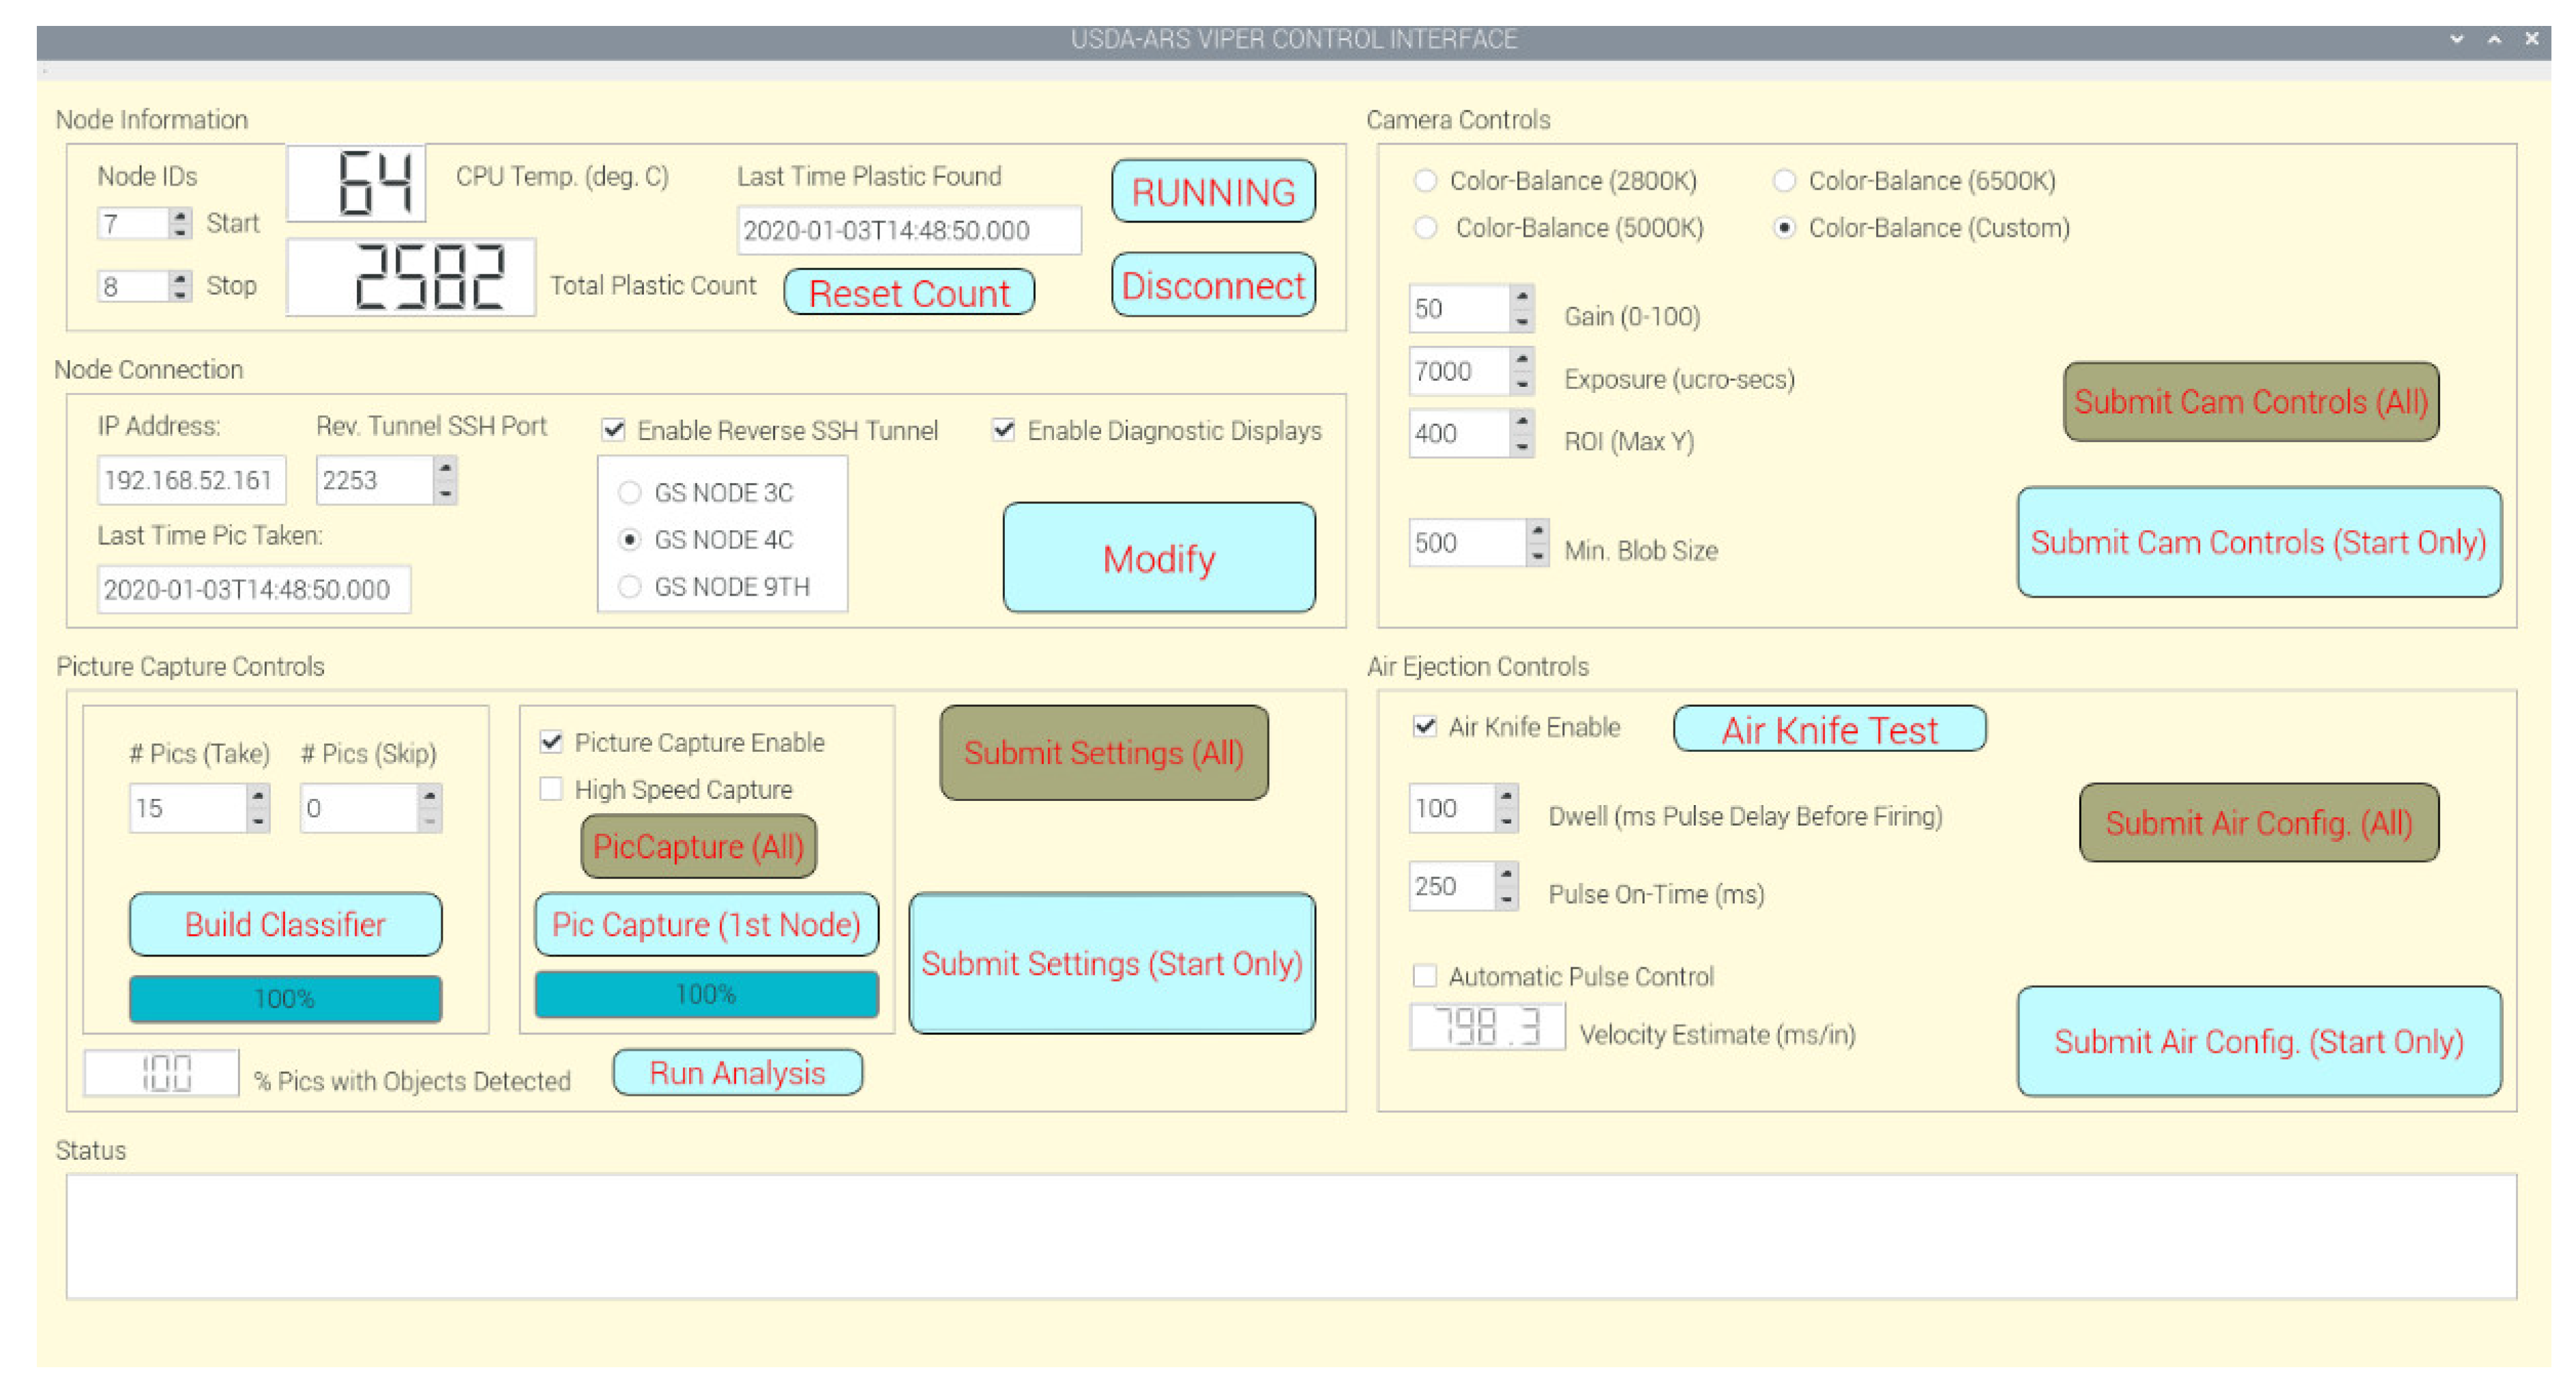
3.2. Node Control Interface

In a typical cotton gin, there are from 3–5 gin stands that range in width from 2.5 to 4 m, with each camera node detector examining 0.36 m of cotton flow. At this configuration, a typical cotton gin will require 30–50 nodes. In order to alleviate the work entailed in configuration of each of these nodes, the software was designed to store, and retrieve, the configuration and interface variables from a database, thereby allowing for updates to occur on either an individual or gang programmed basis. Figure 10 shows a typical management setup for the database, where each node can be configured to connect to a single database per gin-stand, or could be configured to use a local database, in which case the database could be configured to mirror the databases such that a technician could write to a single database and have it propagate the settings to all the nodes, without having to login to each and every node in the plant for configuration and setup. For the prototype, the open-source database project “MariaDB” (a recent fork of “MySQL” project) was utilized. The database variable storage approach was selected as it allows for letting the database software offload the work required for remote access and management, as the database software handles issues associated with concurrent read-writes and ensures atomic writes, thereby protecting variables during the read-write process from only reading a partially changed variable. As modern database software has sophisticated management, fall-back protection modes, and algorithms already designed into them, this approach both reduced the software development requirement, but also ensured the variables were protected during remote access by one or more users. The database approach also leveraged a large and active set of remote monitoring open-source projects that were found to be very helpful in the development as well as troubleshooting of the nodes. As most cotton gins have their networks configured behind a router that employs network address translation (NAT); in order to access the nodes remotely for monitoring and management, each node was set up with a reverse SSH tunnel acting through a cloud-based server that acted as an intermediary that would forward the connection for remote administration. Another approach configures a WireGuard virtual private network (VPN); again acting through a cloud-based server to provide remote administration. Both were tried and found to provide reliable remote administration connection to provide access to the camera-node desktops. To gain graphical user interface operating-system, OS, desktop access, an open-source virtual network computing (VNC) application was utilized (Tight-VNC) and configured to work across the either the SSH tunnel or via the WireGuard VPN.

3.3. User Interface

To alleviate having to individually set up, configure, and periodically re-calibrate each camera-computer-node, the software was written in a split-phase mode with a separate application providing the machine-vision detection with a separate software program (application) to handle the GUI user interface, hereafter called the PIDES-Viewer setup program. The coupling between the two applications was made through a MySQL database, which housed a data table to hold each configuration parameter that the PIDES-Viewer software application allows the user to configure. The PIDES-Viewer also provides feedback state data from the main PIDES machine-vision console application, via the database, for user updates. Examples of this feedback are CPU-temperature, total plastic detected count, and last-time plastic-detected. A key advantage of this split-application approach is that it enables the PIDES-Viewer software to write to multiple compute-nodes (databases) for a given set of user configuration inputs, thereby enabling the user to set up multiple camera-computer nodes simultaneously, therein greatly reducing the on-site setup and configuration time. Another advantage of this split phase approach is that it speeds up the image processing by removing the GUI interface overhead from the main program. Details on the PIDES-Viewer will be provided in a separate paper. A screenshot of the PIDES-Viewer interface is shown in Figure 11.

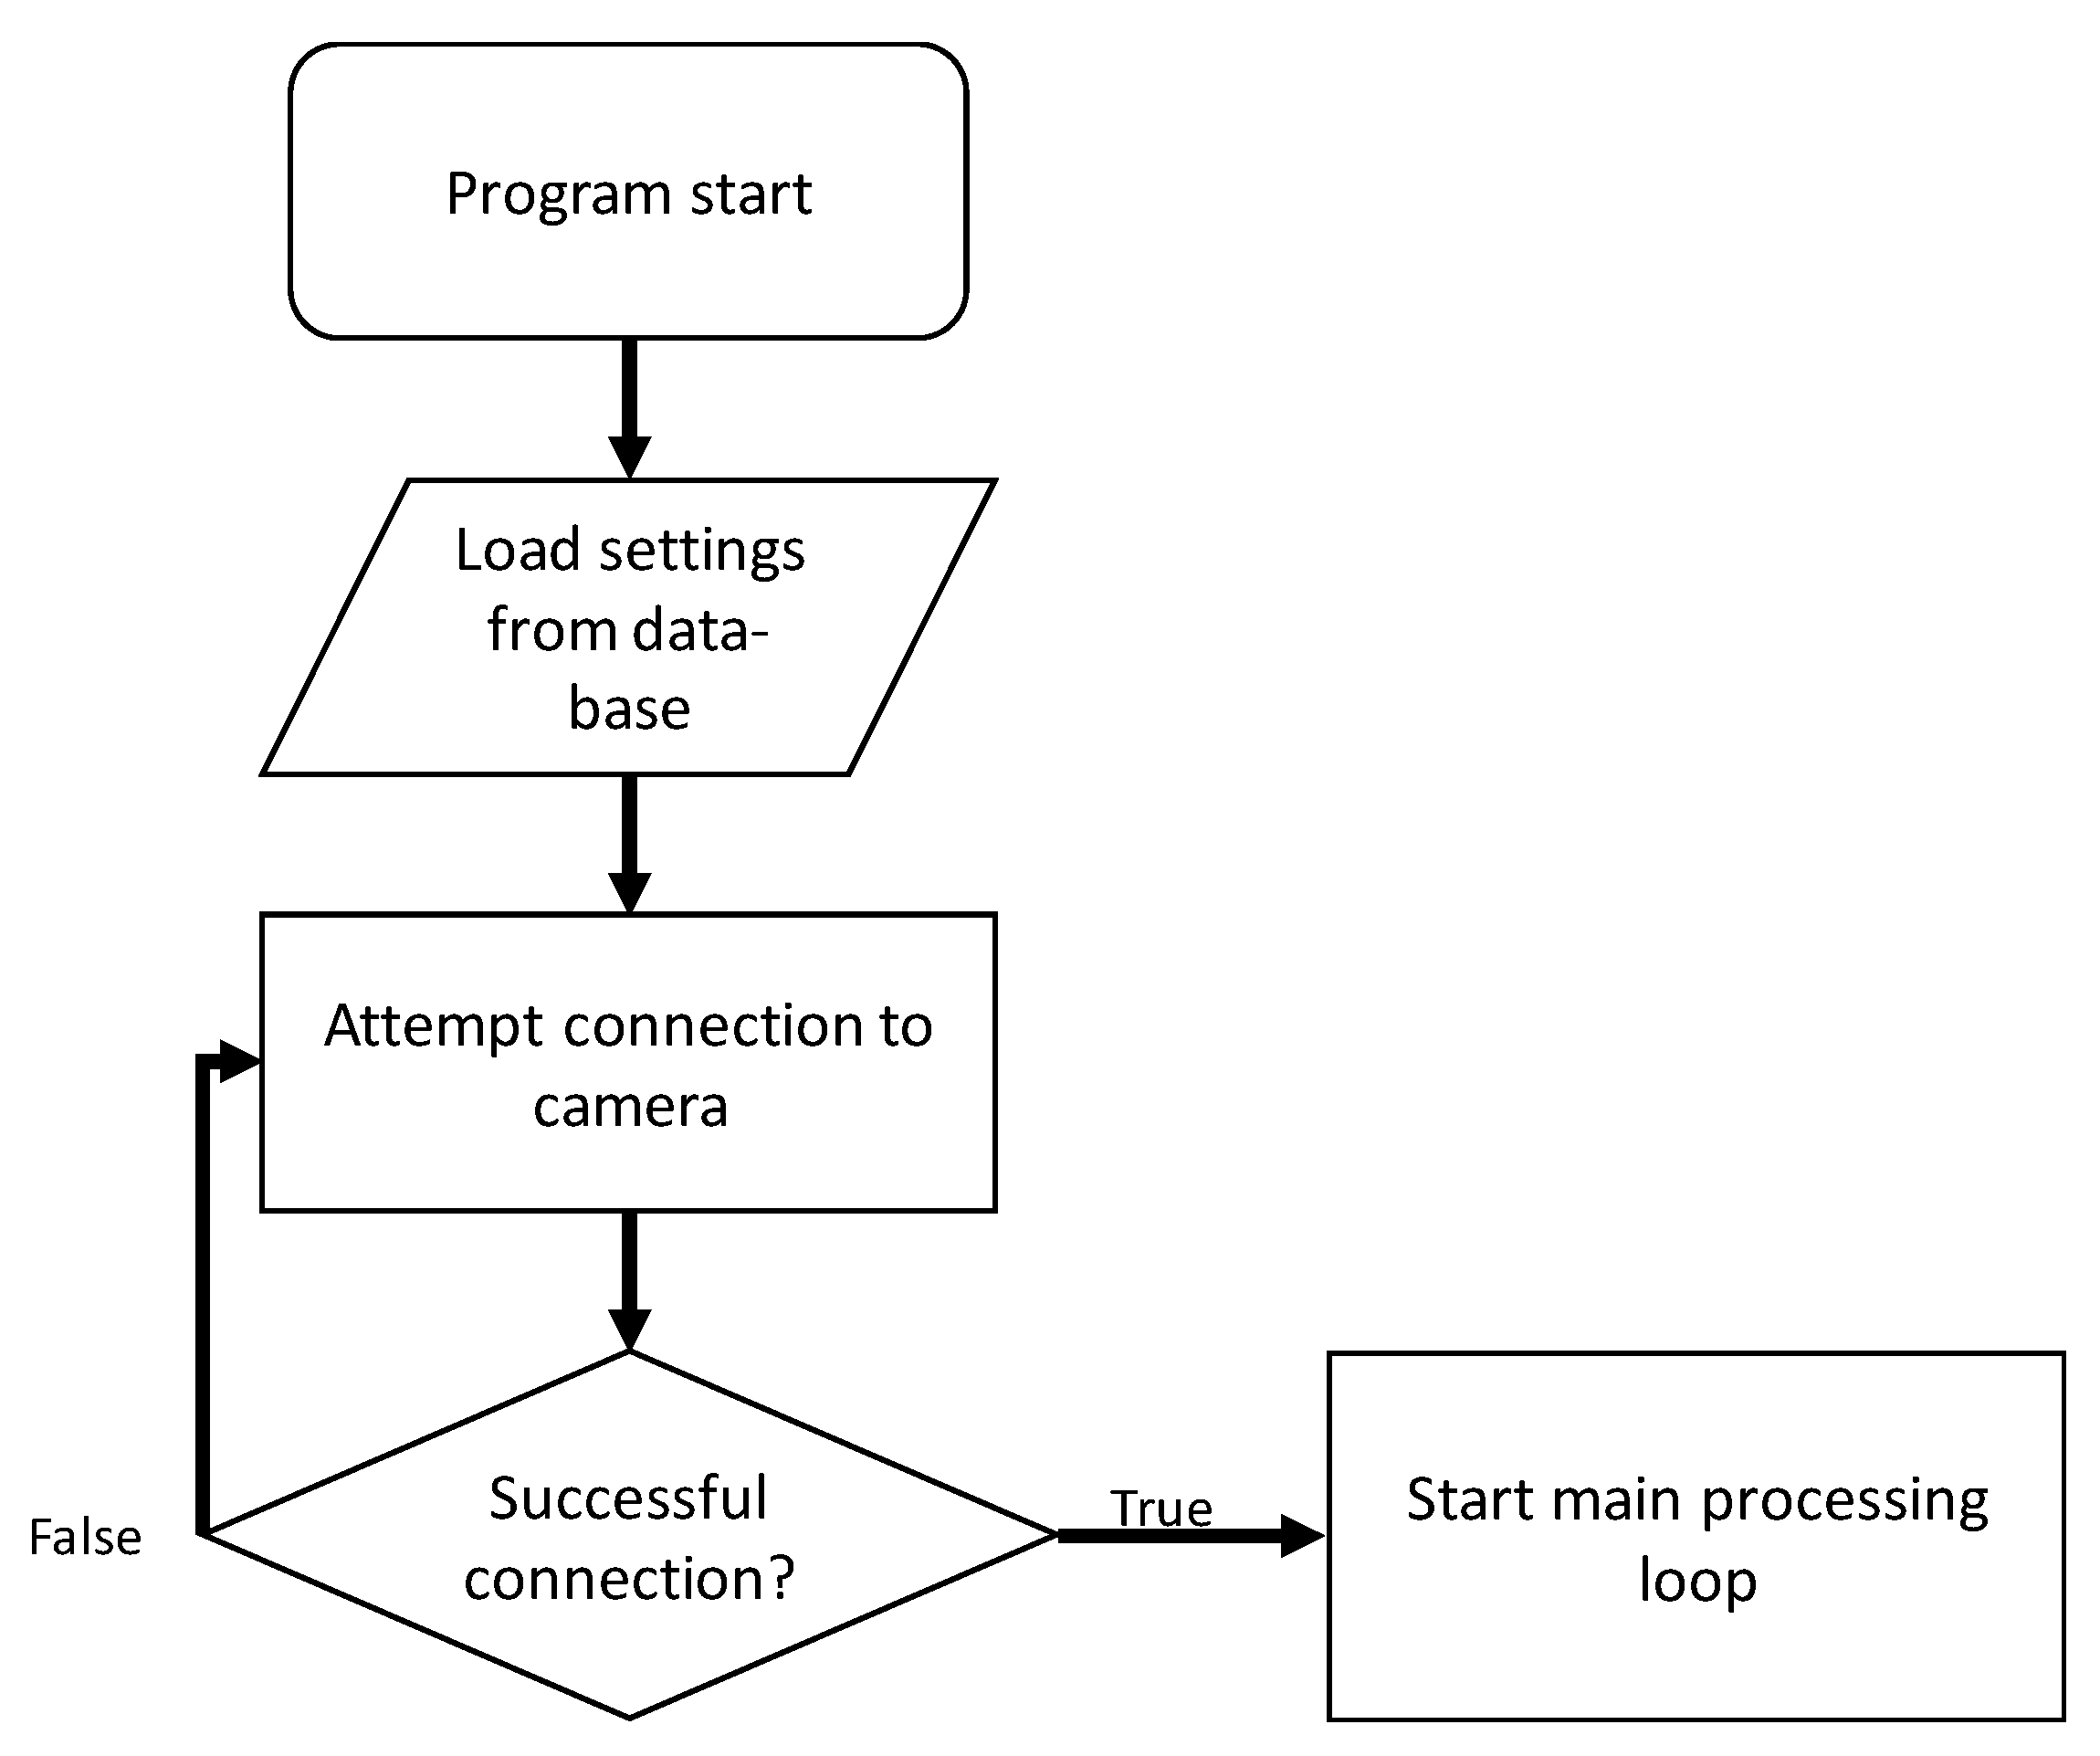
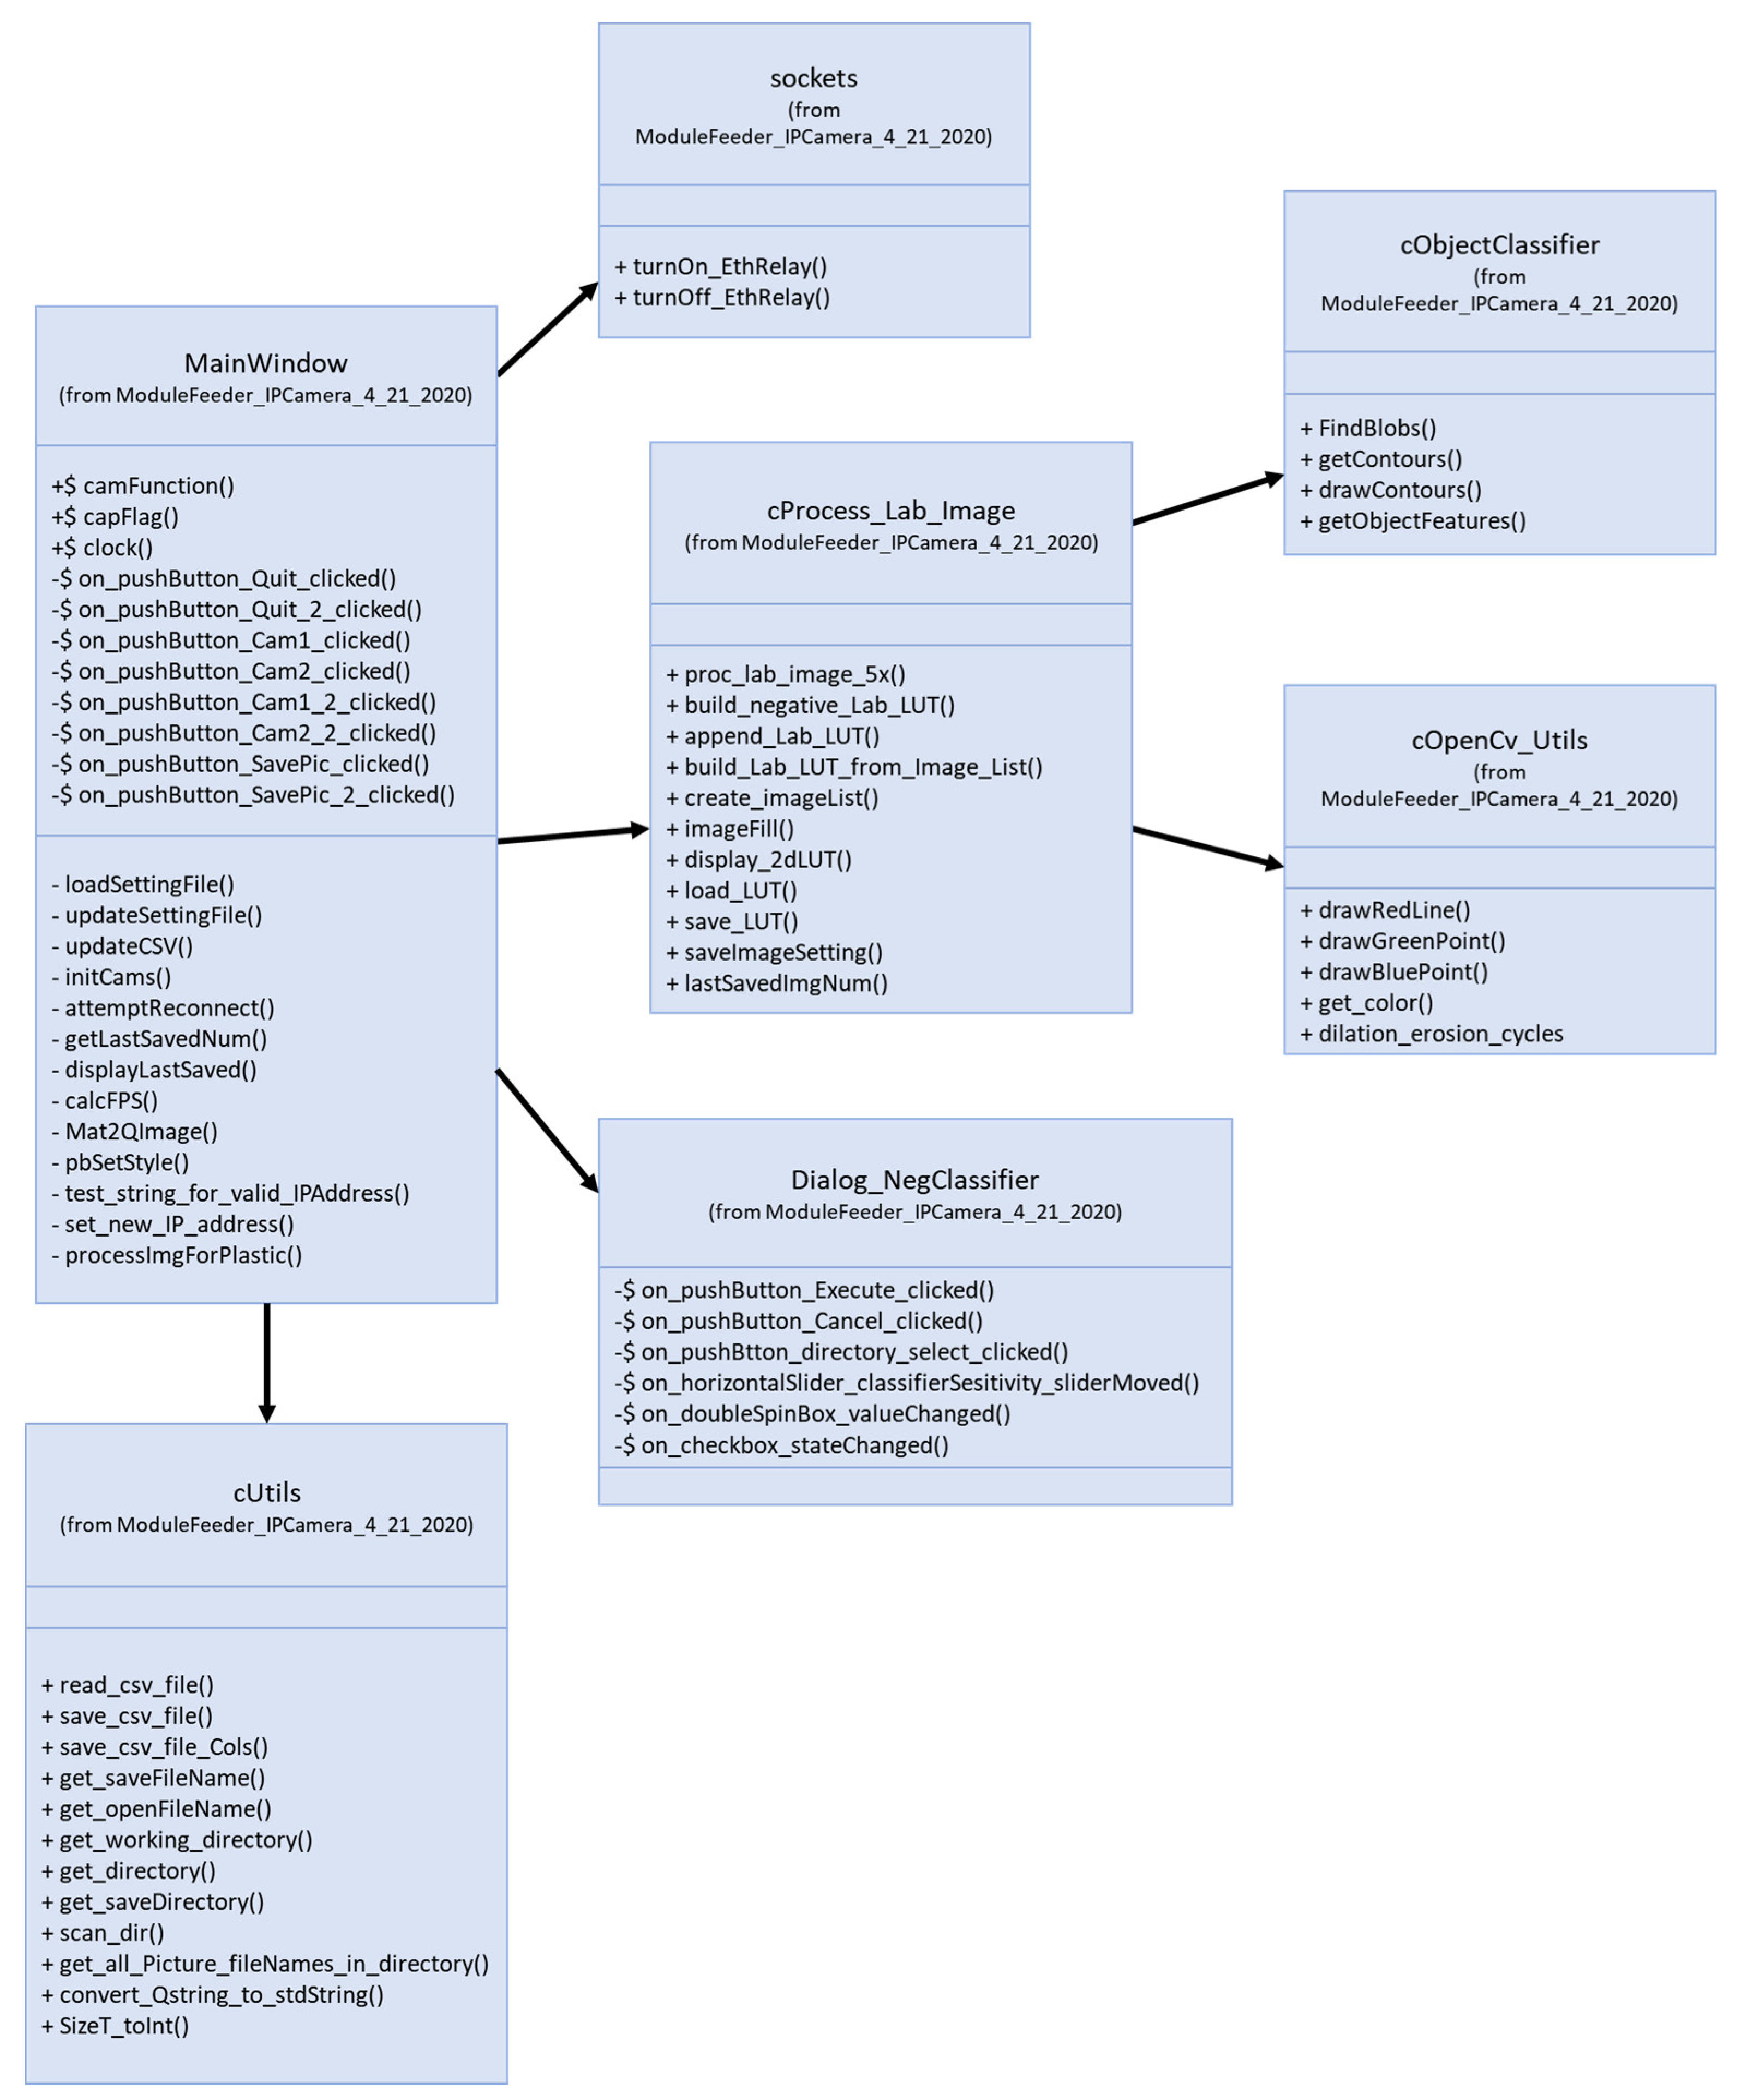
3.4. Software Design

The software was designed so that upon program startup (boot), the initialization processes are automatically run by using settings stored in the database. The program startup process then utilizes this information for initialization and connecting to the video streams of the camera, viewing the flowing cotton, and initializing all supporting utility classes.
The variables that contain the program startup settings are stored in a database. The “loadSettingFile” function reads the options stored in the database and initializes the program using the database configured options (full list in the Appendix A). The primary options that configure and control the software, as stored in the database, are:
  • “IPAddress”: holds IP Address of backup database.
  • “Run_Classifier”: switch to run classifier builder routine.
  • “AddTo_Classifier”: switch to append to an existing classifier, or if “0”, create a new classifier using only images in the classifier build directory (when running classifier builder routine).
  • “Use_Air_Knives”: switch to enable actuation of air-knives upon detection of plastic.
  • “AirKnife_PulseTest”: turn on routine for testing air-knives (multi-level value that both enables air-knife pulse test as well as instructs which air-knives are triggered during pulse test. This is binary “OR” mapping for each solenoid 1–4 as {sol_1 = 1, sol_2 = 2, sol_3 = 4, sol_4 = 8}. Example for testing sol 3 and 4, the mapping would set AirKnife_PulseTest = 0x0C (in hexadecimal).
  • “AirKnife_PulseDelay_ms”: configuration setting that sets how long, in milliseconds, to delay before turning on air-knife after plastic-detection event has occurred.
  • “AirKnife_PulseOn_ms”: configuration setting that determines how long air-knife pulse lasts for each plastic-detection event.
  • “minBlobSize”: determines how large an area a detected plastic object must be before it is recognized as a valid object to remove via air-knife pulse.
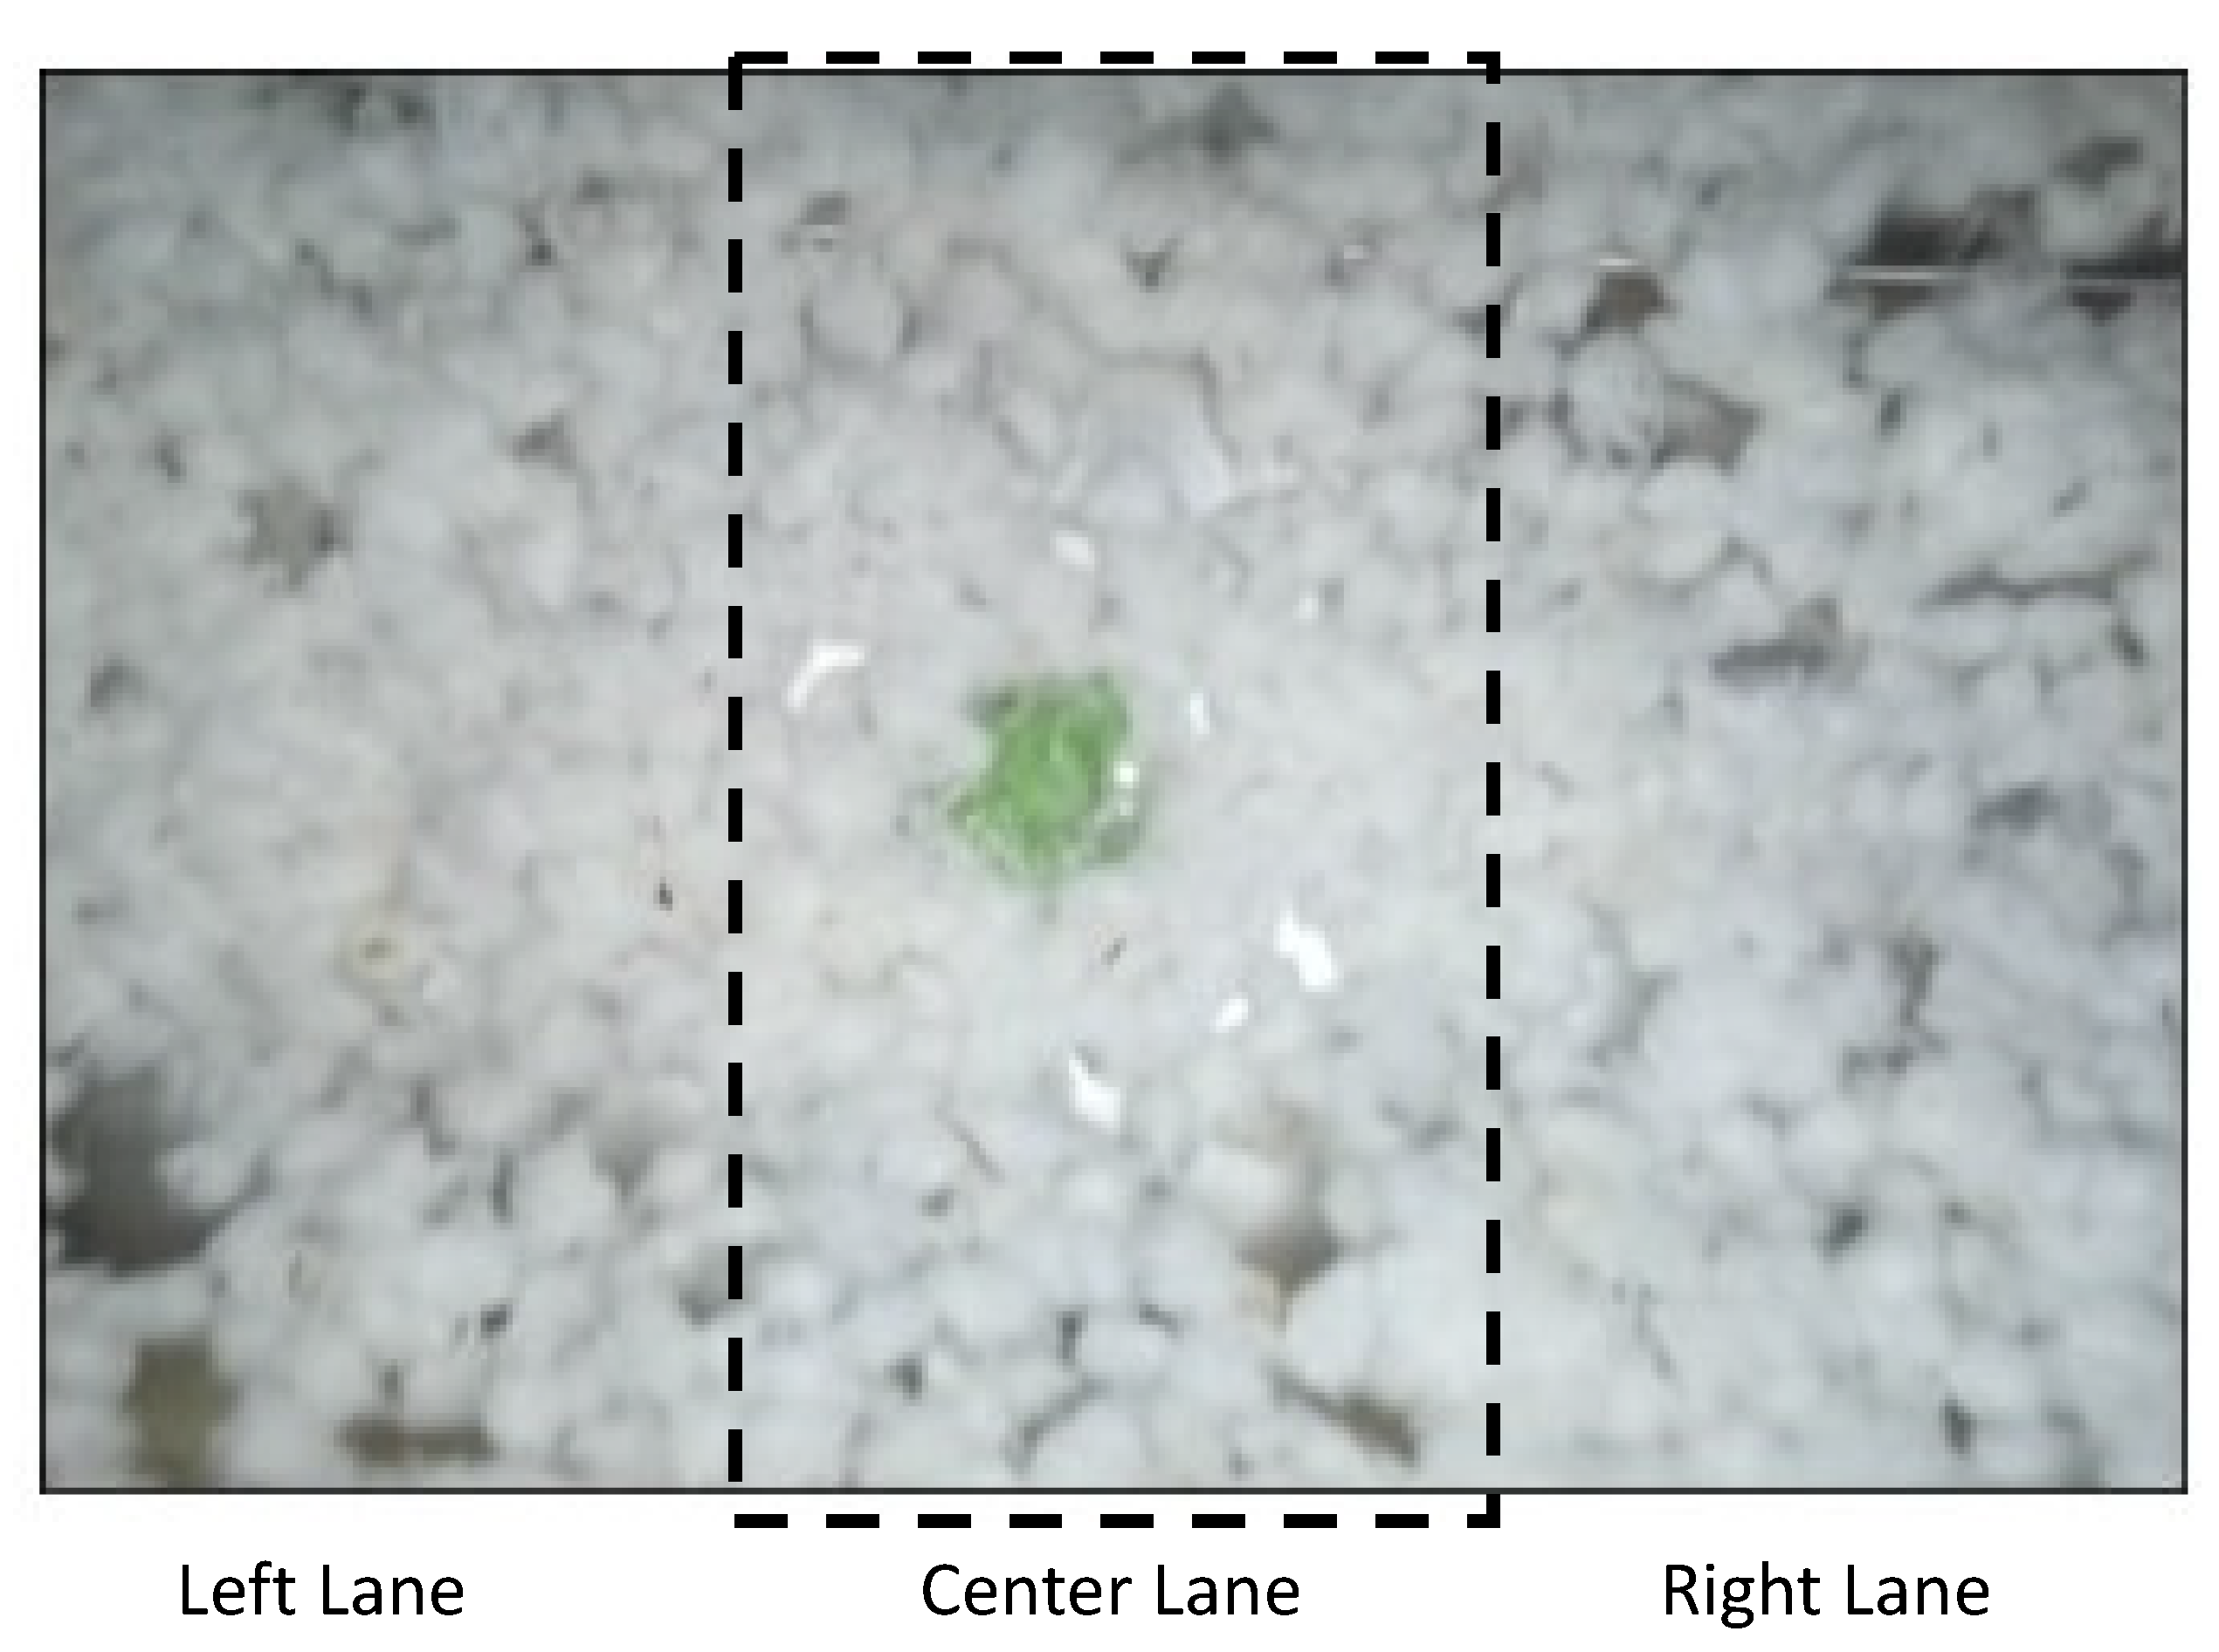
  • “Roi_StartX”: left-side x-coordinate, in pixels, in the captured image where pixels are to be analyzed. Forms the left side of the Region-Of-Interest.
  • “Roi_StopX”: right-side x-coordinate, in pixels, in the captured image where pixels are to be analyzed. Forms the right-side of the Region-Of-Interest.
  • “Roi_StartY”: top-side x-coordinate, in pixels, in the captured image where pixels are to be analyzed. Forms the top side of the Region-Of-Interest.
  • “Roi_StopX”: bottom-side x-coordinate, in pixels, in the captured image where pixels are to be analyzed. Forms the bottom-side of the Region-Of-Interest.
  • “Gain”: camera gain setting.
  • “Exposure”: camera exposure setting.
  • “Use_Daylight_ColorBalance”: use camera default Daylight lighting color-balance mode.
  • “Use_Fluorescence_ColorBalance”: use camera default Fluorescent lighting color-balance mode.
  • “Awb_r”: manual setting for custom white-balance, sets White-balance red-cast.
  • “Awb_b”: manual setting for custom white-balance, sets White-balance blue-cast.
  • “TimeToSavePic_mins”: number of minutes to save pictures when saving calibration images.
  • “Number_of_pics_to_Take”: number of pictures to save, when saving calibration images.
  • “Enable_Input_PicCaptures”: switch to save images, uses either “Number_of_pics_to_Take” or “TimeToSavePic_mins” to control how may images are saved.
  • “SoftwareStart_PicCaptures”: use software trigger to start pic capture saving routine.
Once the settings are loaded on startup, the program then calls for the function to initialize the camera video capture stream, and then upon successful connection, proceeds into the main processing loop. The main startup flow chart is shown in Figure 12.
If the PIDES program cannot make a successful connection to the camera, it will set a flag error in the database. Since the camera is directly connected to the PIDES system and the probability of a connection error is small, it was not necessary to extend this warning out to the PIDES-VIEWER program. The diagnostics windows provided by PIDES-VIEWER avoids the need for a specific variable because if there is no connection, then the diagnostics raw video window will be blank and the user will clearly see that there is a connection issue.
After a successful connection to the camera, the main process loop is entered, which is located in an infinite “Do” loop inside the function mainLoop, which is located inside the class cmain_loop.cpp. The main process loop handles reading images from the camera, inspecting the image for plastic contamination, if plastic object is found, then assesses which and how many air-knives to pulse, loads the air-knife pulse data-structure, calls “processPulse”, and then if plastic present estimates cotton velocity, determines if diagnostics displayed should be shown, and finally calls state-machine routine, which provides the database update functions that run on a separate thread to avoid slowing down the main loop processing speed. Upon return from state-machine call, this ends the loop so that the program cycles back to the beginning of the main loop and repeats. The main process loop routine is shown in Figure 13.

Air-Knife Control

After the classifier runs, the classifier returns a list of positions for each of the detected objects. This object-position list is then fed to the solenoid firing loop. In this loop the image is divided into three lanes (left, center, right; Figure 14), where depending on where objects are detected, various solenoids (air-knives) are flagged for firing (Figure 15). After the flags are established, they are added to a queue, Process_GPIO::sol_queues[][], which then gets processed by a routine that runs on every image capture loop that uses to the queue to turn on or off the appropriate solenoids.
As each pulse has a length that is longer than a single image-capture cycle, the AirKnife_PulseOnTime_ms database variable is used to compute the number of image-capture cycles needed to store the solenoid on-time for a given detected object. This method allows for a single object detection event to fire a solenoid for multiple image-detection cycles. This discrete number of solenoid pulse cycle numbers provides the depth of the queue, which is stored in the variable Process_GPIO::PULSE_QUEUE_LENGTH. The width of the queue is the number of solenoids that are used to eject the plastic. The software is configured to control either three solenoids or four. For testing, the prototype utilizes four solenoids, two of which were positioned to align with the image viewing region. To help in the ejection of plastic pieces sliding on the boundary between air-knives, the system was configured to allow control of the neighboring camera nodes’ adjacent air-knife. To process a given object detection flag, for each detection event, PULSE_QUEUE_LENGTH number of pulse flags are pushed onto the queue (for the queue lane/s that are provided by the flags). The queue is used for firing solenoids during subsequent image-capture cycles, where in each image-capture cycle, one layer of the queue is read, and solenoids are set to corresponding state as determined by the queue. After firing cycle, the top layer of the queue is popped off the stack and a new layer of zeros are entered (that can be later modified to hold a flag in the next cycle; Figure 15).

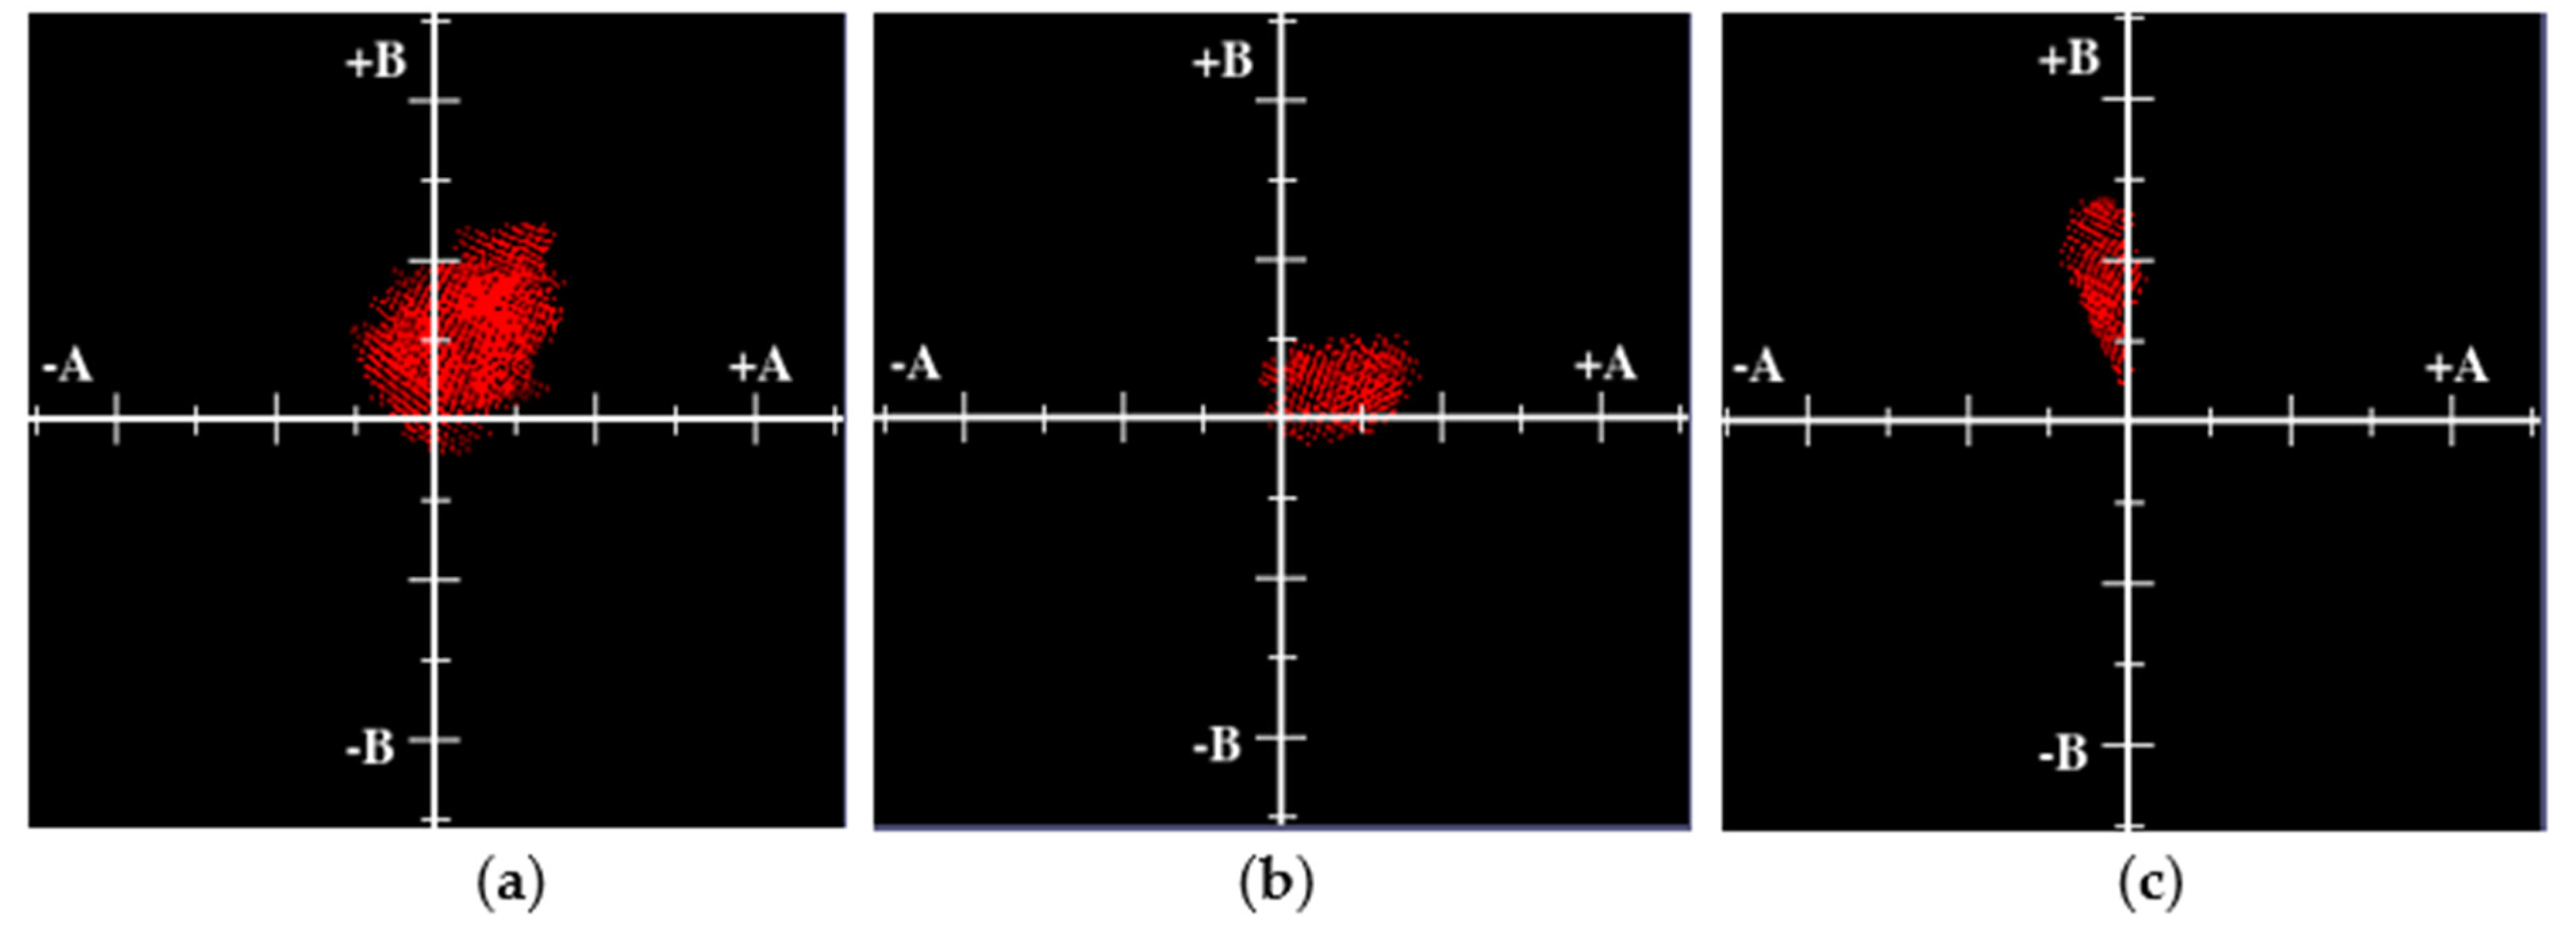
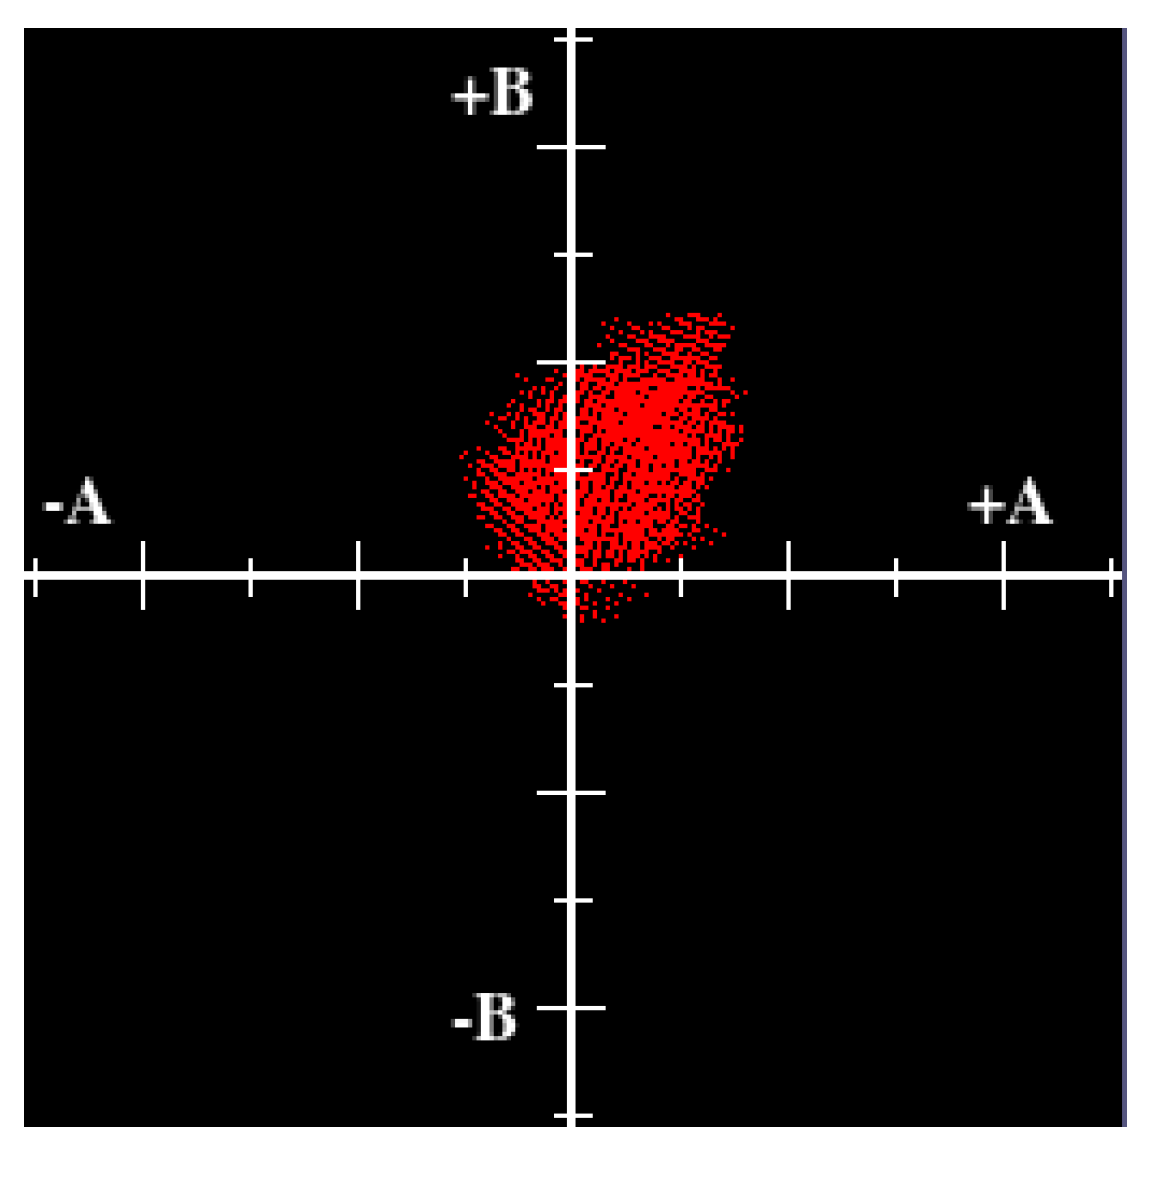
3.5. Lab Color Space

Each image retrieved from the camera stream is passed into the “process_image” function that handles the interface between the main loop and the “cProcess_Lab_Image” class, which houses the classifier routines. The OpenCV libraries are key in enabling the software to handle the basic image processing functions that feed into a block of code that provides a custom low-level C++ function that performs the negative classifier. The main method the module inspection software uses to detect plastic is color detection, and then once the pixels are all classed by color, it then performs blob-clustering and object analysis to allow for pinpointing the size and location of each detected plastic object.
The raw captured camera images are provided to the program in the blue–green–red (BGR) color format. The BGR format has a channel for the blue, green, and red color pigments, totaling three channels with a color space of 256 × 256 × 256 colors. A well-known transformation in machine-vision techniques is to change from the three-dimensional BGR color space to a more perceptually uniform color space that separates the colors into a more manageable two-dimensional color space with an associated brightness channel. This is advantageous as in many circumstances the luminous channel can be ignored or blocked into a few partitions, thereby effectively reducing the processing domain to a small two-dimensional color-space. This can be done via a transformation to hue saturation luminous space or more optimally can be performed via a transformation to L*a*b* color space [11] (Schanda, 2007) (here-after notated as Lab color). In the “process_image” function, the OpenCV function “cvtColor” is used to change the three channels in a BGR image into the Lab color space.
The L*a*b* color space is a three-channel color space that isolates the brightness, or luminance, levels of the image pixels into one channel. The remaining two channels provide the color definition of the image. Image processing in the Lab color space reduces the amount of variation in color since there are only two channels of interest instead of the three channels for the RGB color space. A look-up table (LUT) for plastic detection was built on the basis of the two color channels, “a*” and “b*” channels, of the L*a*b* color space, thereby reducing the color space to two dimensions. This two-dimensional LUT was then mapped to a black-and-white image, where pixel location corresponds to the value of “a*” and “b*”, where x axis is “a*” and the y axis provides “b*”. In use, the software processes each L*a*b* image pixel by pixel by checking in the two-dimensional LUT to see if the pixel is a known color that is safe to ignore, or if it should be flagged as an unknown (contaminant). This method forms the basis for a negative classifier, where all colors of objects, such as cotton, are saved to be safely ignored, while any unknown colors are deemed to be contaminants. This negative classifier approach is a previously unreported concept, to the best of the knowledge of the authors. This approach was developed as the cotton colors are known, readily accessible, and could be predefined, but the class/es representing the plastic are completely unknown and it is impossible to predict what color plastic the harvester might encounter and bring to the gin that must be removed. Hence, by using a definition of the known acceptable pixel colors to ignore, it is straightforward to trigger an ejection on anything that does not belong, thereby providing a “negative classifier” that is able to detect unknown color contaminants. Figure 16 shows several two-dimensional LUTs ranging from normal cotton to common plastic contaminants from harvester module wrap. Figure 16a is the LUT for normal seed-cotton. Figure 16b is a fresh LUT that was built by looking at an image of only pink module wrap. Similarly, Figure 16c was a fresh LUT that was built from images that were solely composed of yellow module wrap. In comparison, it clearly shows the overlap between normal cotton colors and that of the pink and yellow (most common colors) module wrap.

3.6. Negative Classifier Look-Up Table

The negative classifier operates by defining a color range that specifies the standard colors of objects to be ignored. For the detection software, the objects that should be ignored include cotton; the background stainless steel gin-stand feeder-tray; and the various plant materials typically harvested along with the cotton, such as the sticks and cotton flower bracts, or burs. Periodically during the course of a cotton ginning season, it is also possible that the cotton may become stained yellow from the tannins in the sticks and burs. This is known as yellow-spotted cotton, and unfortunately the yellow spots are often very close to the yellow color of the module wrap color. This entails a need for a high finesse separation to allow for detection of the yellow module wrap while not ejecting a significant amount of cotton due to the presence of yellow spotted seed cotton. In practice, the software is designed to allow for capturing of test images that are then processed to build a LUT that holds all the colors found in the test images. To form the LUT, the colors in these test images are compiled into a two-dimensional look-up table after conversion to the L*a*b* color space. By capturing each occurrence of every color, the LUT builds in a history of colors it can safely ignore, assuming all the training images are free of plastic occurrences, which is left to the technician before running the classifier build function. For colors that are not in the look-up table, i.e., not found or negative, the software classifies them as plastic contamination.
In order to create the negative classifier, a series of images, verified to be clear of plastic, are processed to have all colors present in the images added to a look-up table. The look-up table is stored as an image file that the software uses to load as the current negative classifier. The look-up table is a 256 × 256 image where the vertical and horizontal axes of the image correspond to the color channels of the L*a*b* color space. The pixels in the negative classifier image correspond to a color value that allows the software to use it as a coordinate system. The coordinate system allows pixel colors in processing images to be compared to values in the look-up table quickly. An example LUT image used for the detection system is shown in Figure 17.

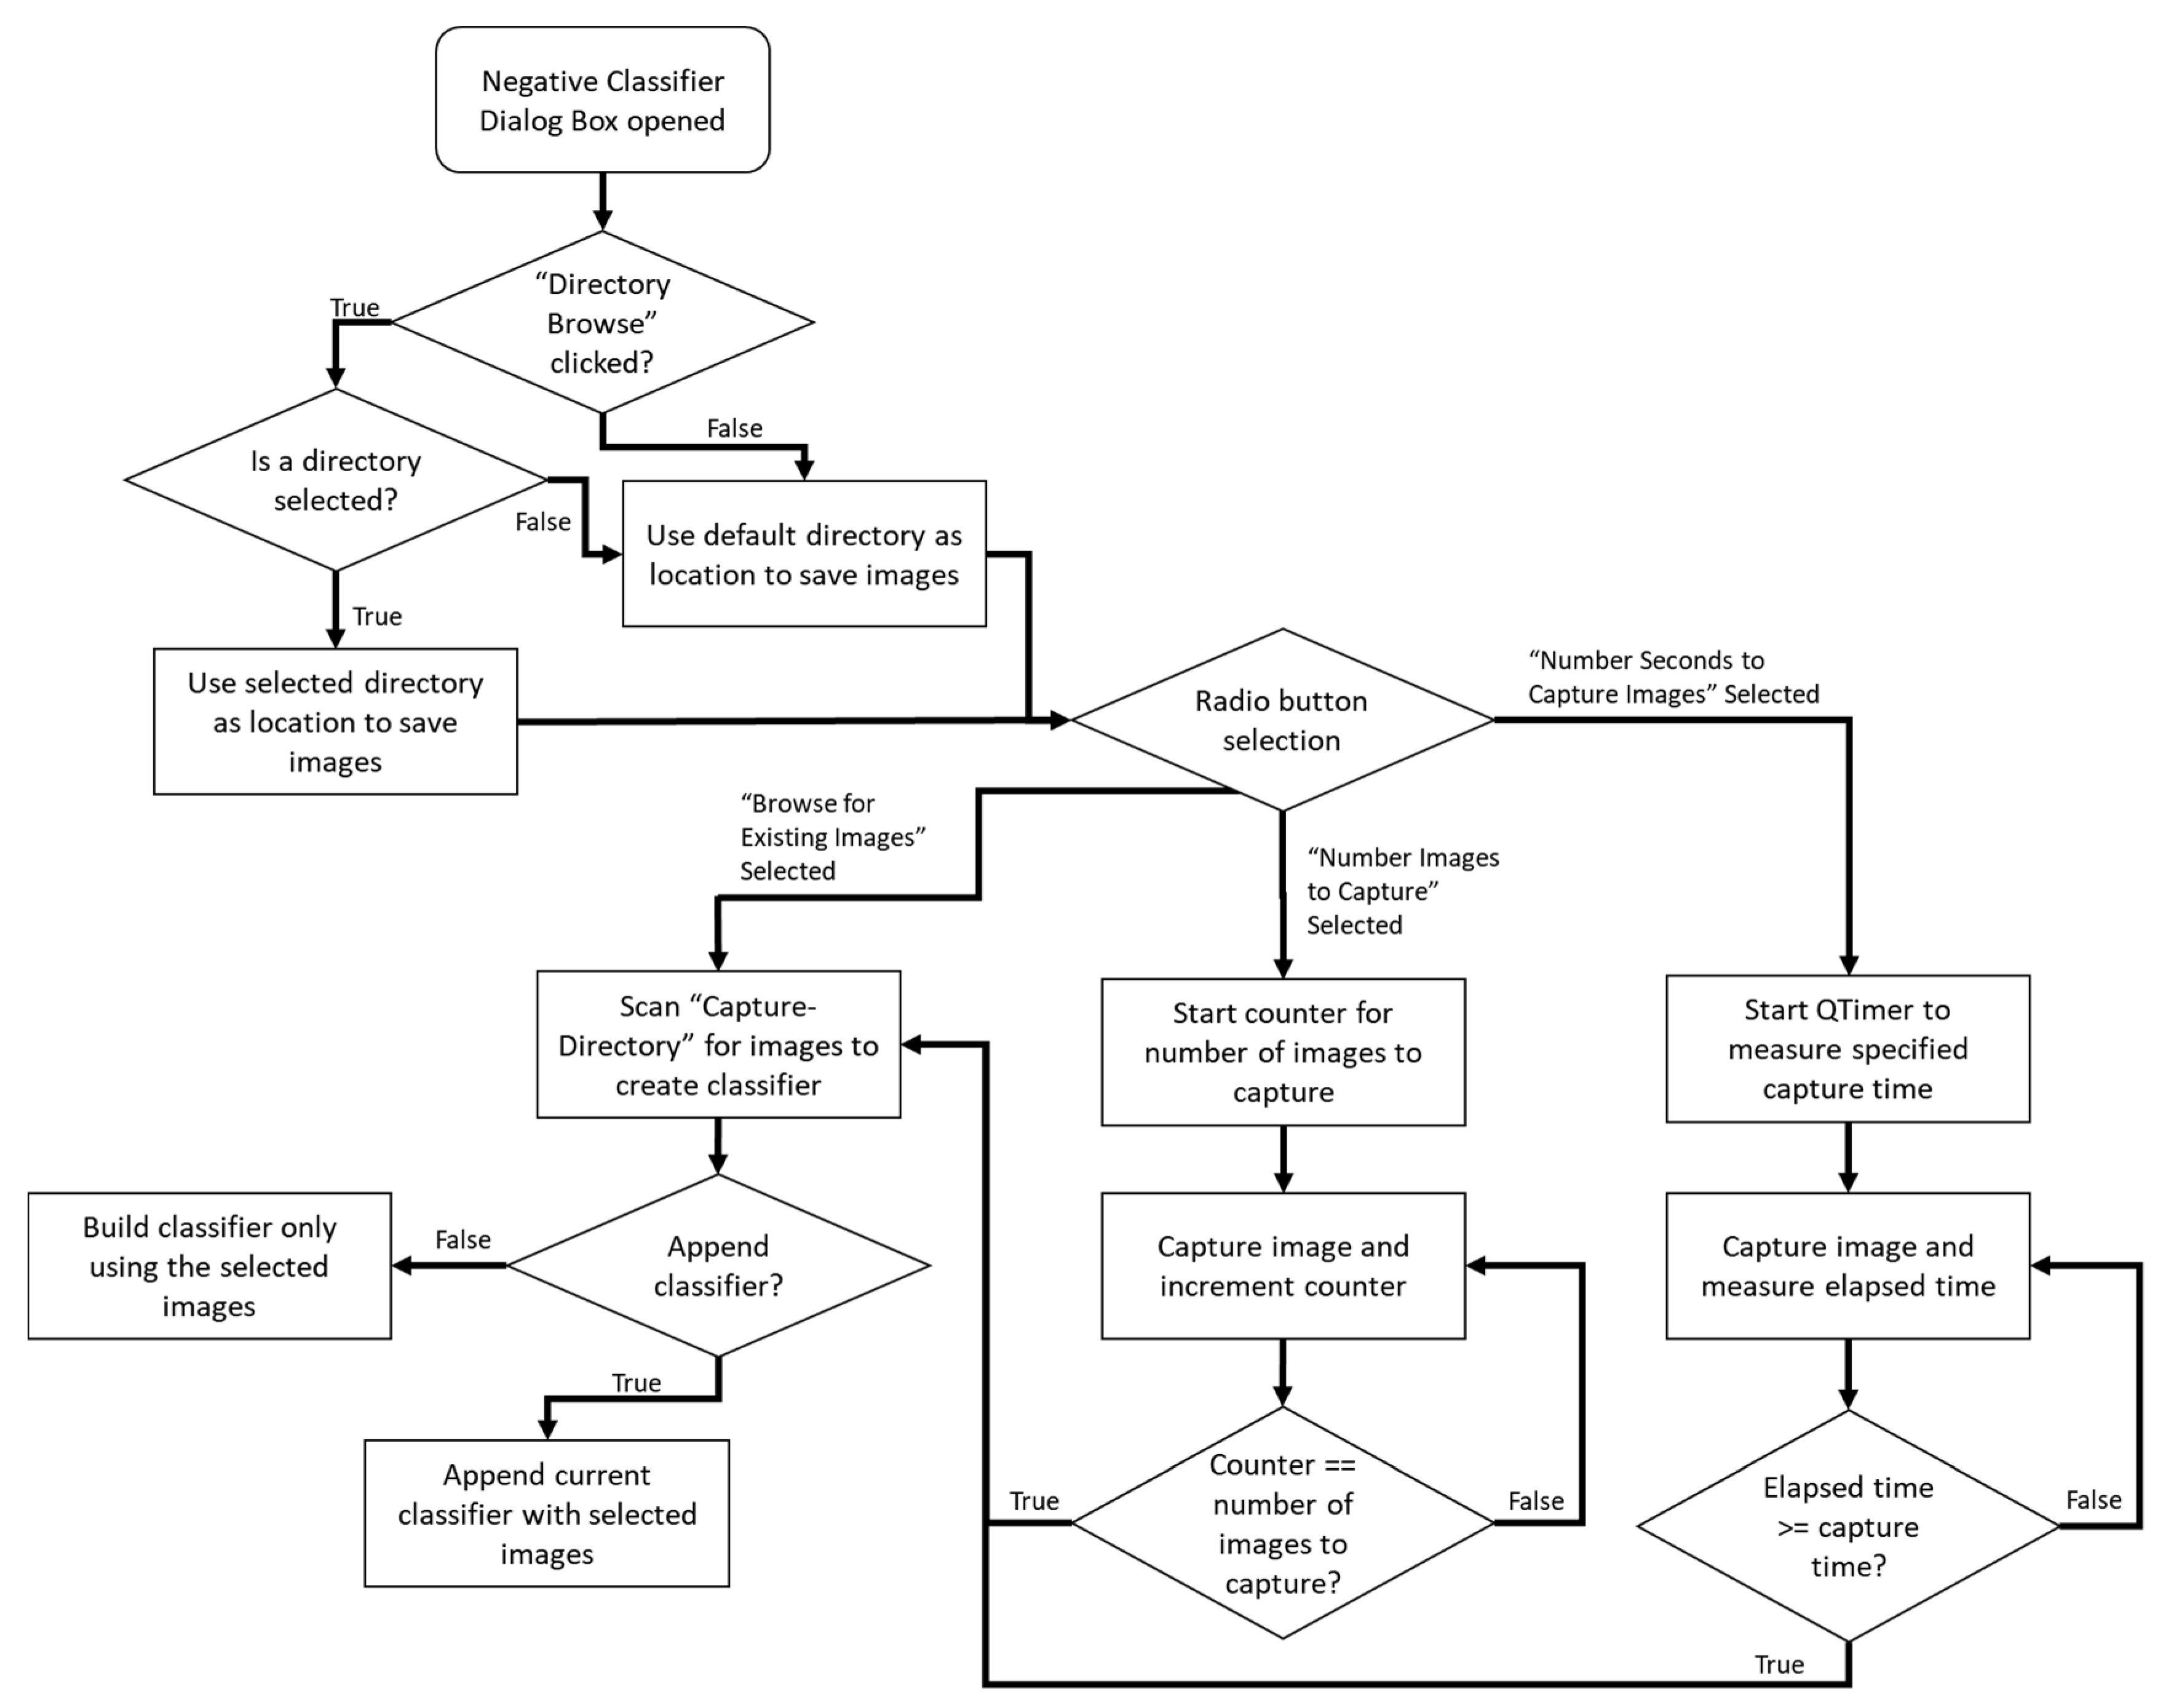
3.7. Building the Negative Classifier

The application GUI, PIDES-Viewer, provides the ability to build or append to the negative classifier look-up table. The GUI provides a selection for “Classifier”, which presents two available options: “Build Negative Classifier” or “Append Negative Classifier”. The “Build Negative Classifier” option creates a new negative classifier LUT from scratch. The “Append Negative Classifier” option adds on to the currently loaded LUT instead of starting over, which was included in order to handle objects present in the camera stream that caused false positives. These re-occurring false-positives can be removed by simply capturing more images, with the pathologic colors, and then re-running the Build Negative Classifier in the append mode. A flow chart that details the negative classifier dialog process is shown in Figure 18. Figure 19 shows the flow-chart for the GUI that allows control over the “a*b*” LUT.
Once the images are captured, the application uses the “build_negative_Lab_LUT” or “append_Lab_LUT” to create or append the classifier LUT. In practice, the approach for configuring and building a classifier is to:
  • Without cotton flowing, capture 10–20 images and then build a “new” classifier (this initial classifier build will add all colors required to allow software to ignore the feeder apron).
  • The next step is to set the software to capture 40–60 images or so, at a rate of 1 per second, while cotton is flowing. Once these cotton images are captured, the technician examines each image to ensure no plastic was inadvertently captured in any of these images. Once the cotton image dataset is verified, the build classifier routine is engaged, this time in “append” mode. In append mode the classifier adds in all the cotton colors so that the classifier now also ignores cotton.
  • <Optional> If conditions of the cotton changes, becomes yellow-spotted, or has an unusual amount of green-leaf in it or has additional cotton by-products that are causing too many false-positives, step 2 can be re-run to add in these extra-colors to the classifier, thereby tuning the system to avoid these new objects and prevent mis-firing on these false-positive triggers. For ease of use, for every detection event, the software stores both the raw image as well as the binary classified image for later review so that technicians can assess what is causing the false-positive triggering.
  • <Optional> The software also has the capability to reduce the active region of interest in the images. This can be useful to employ in case where a pivot seam, or other object in the field of view, is causing false triggers.
Note: With each run of the “Build-Classifier” routine, a 2D look-up table (LUT) is built and stored in the home directory. Hence, if conditions should revert to a previously known condition, the classifier can be easily switched to this prior condition by simply replacing the LUT file with the original. In this manner, several LUT can be created for a range of cotton conditions and then easily reverted at will of gin operator to adapt to conditions. As the process is only semi-automated and is directed under the watchful eye of the technician, the classifier is prevented from continuously adding colors that might include plastic. This approach ensures the most accurate classifier for plastic detection, while also ensuring minimal false positives occur.

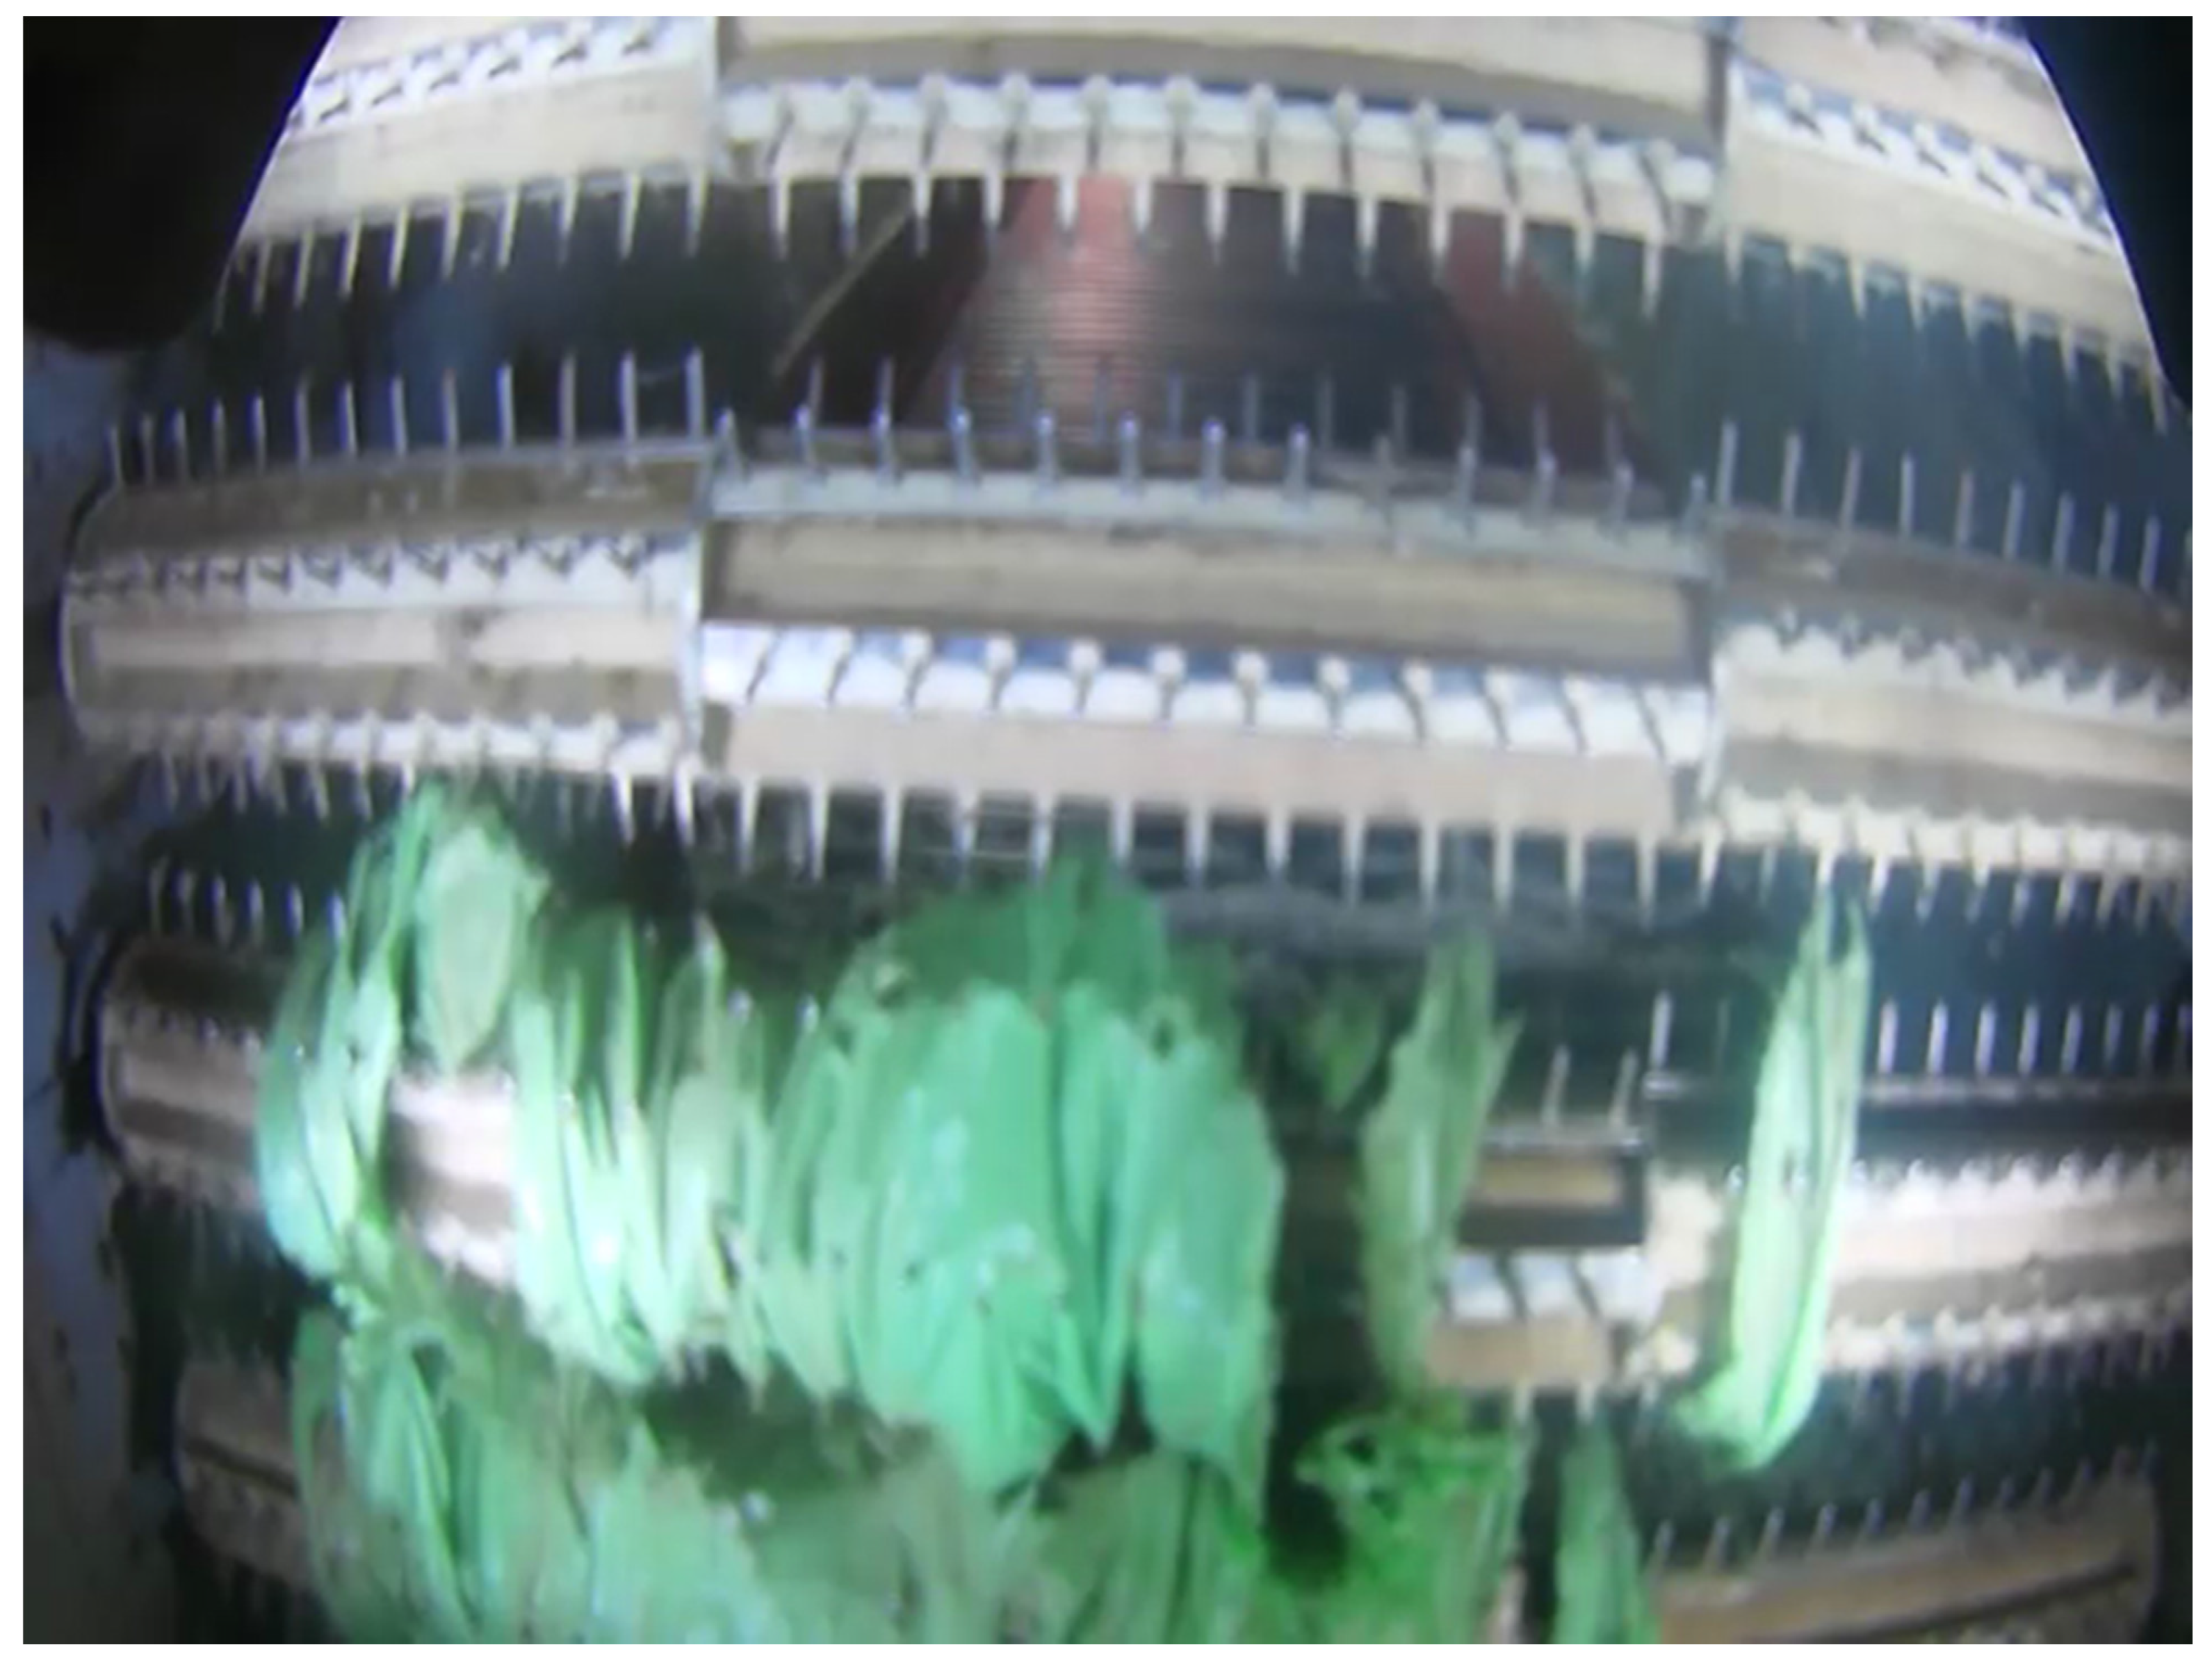
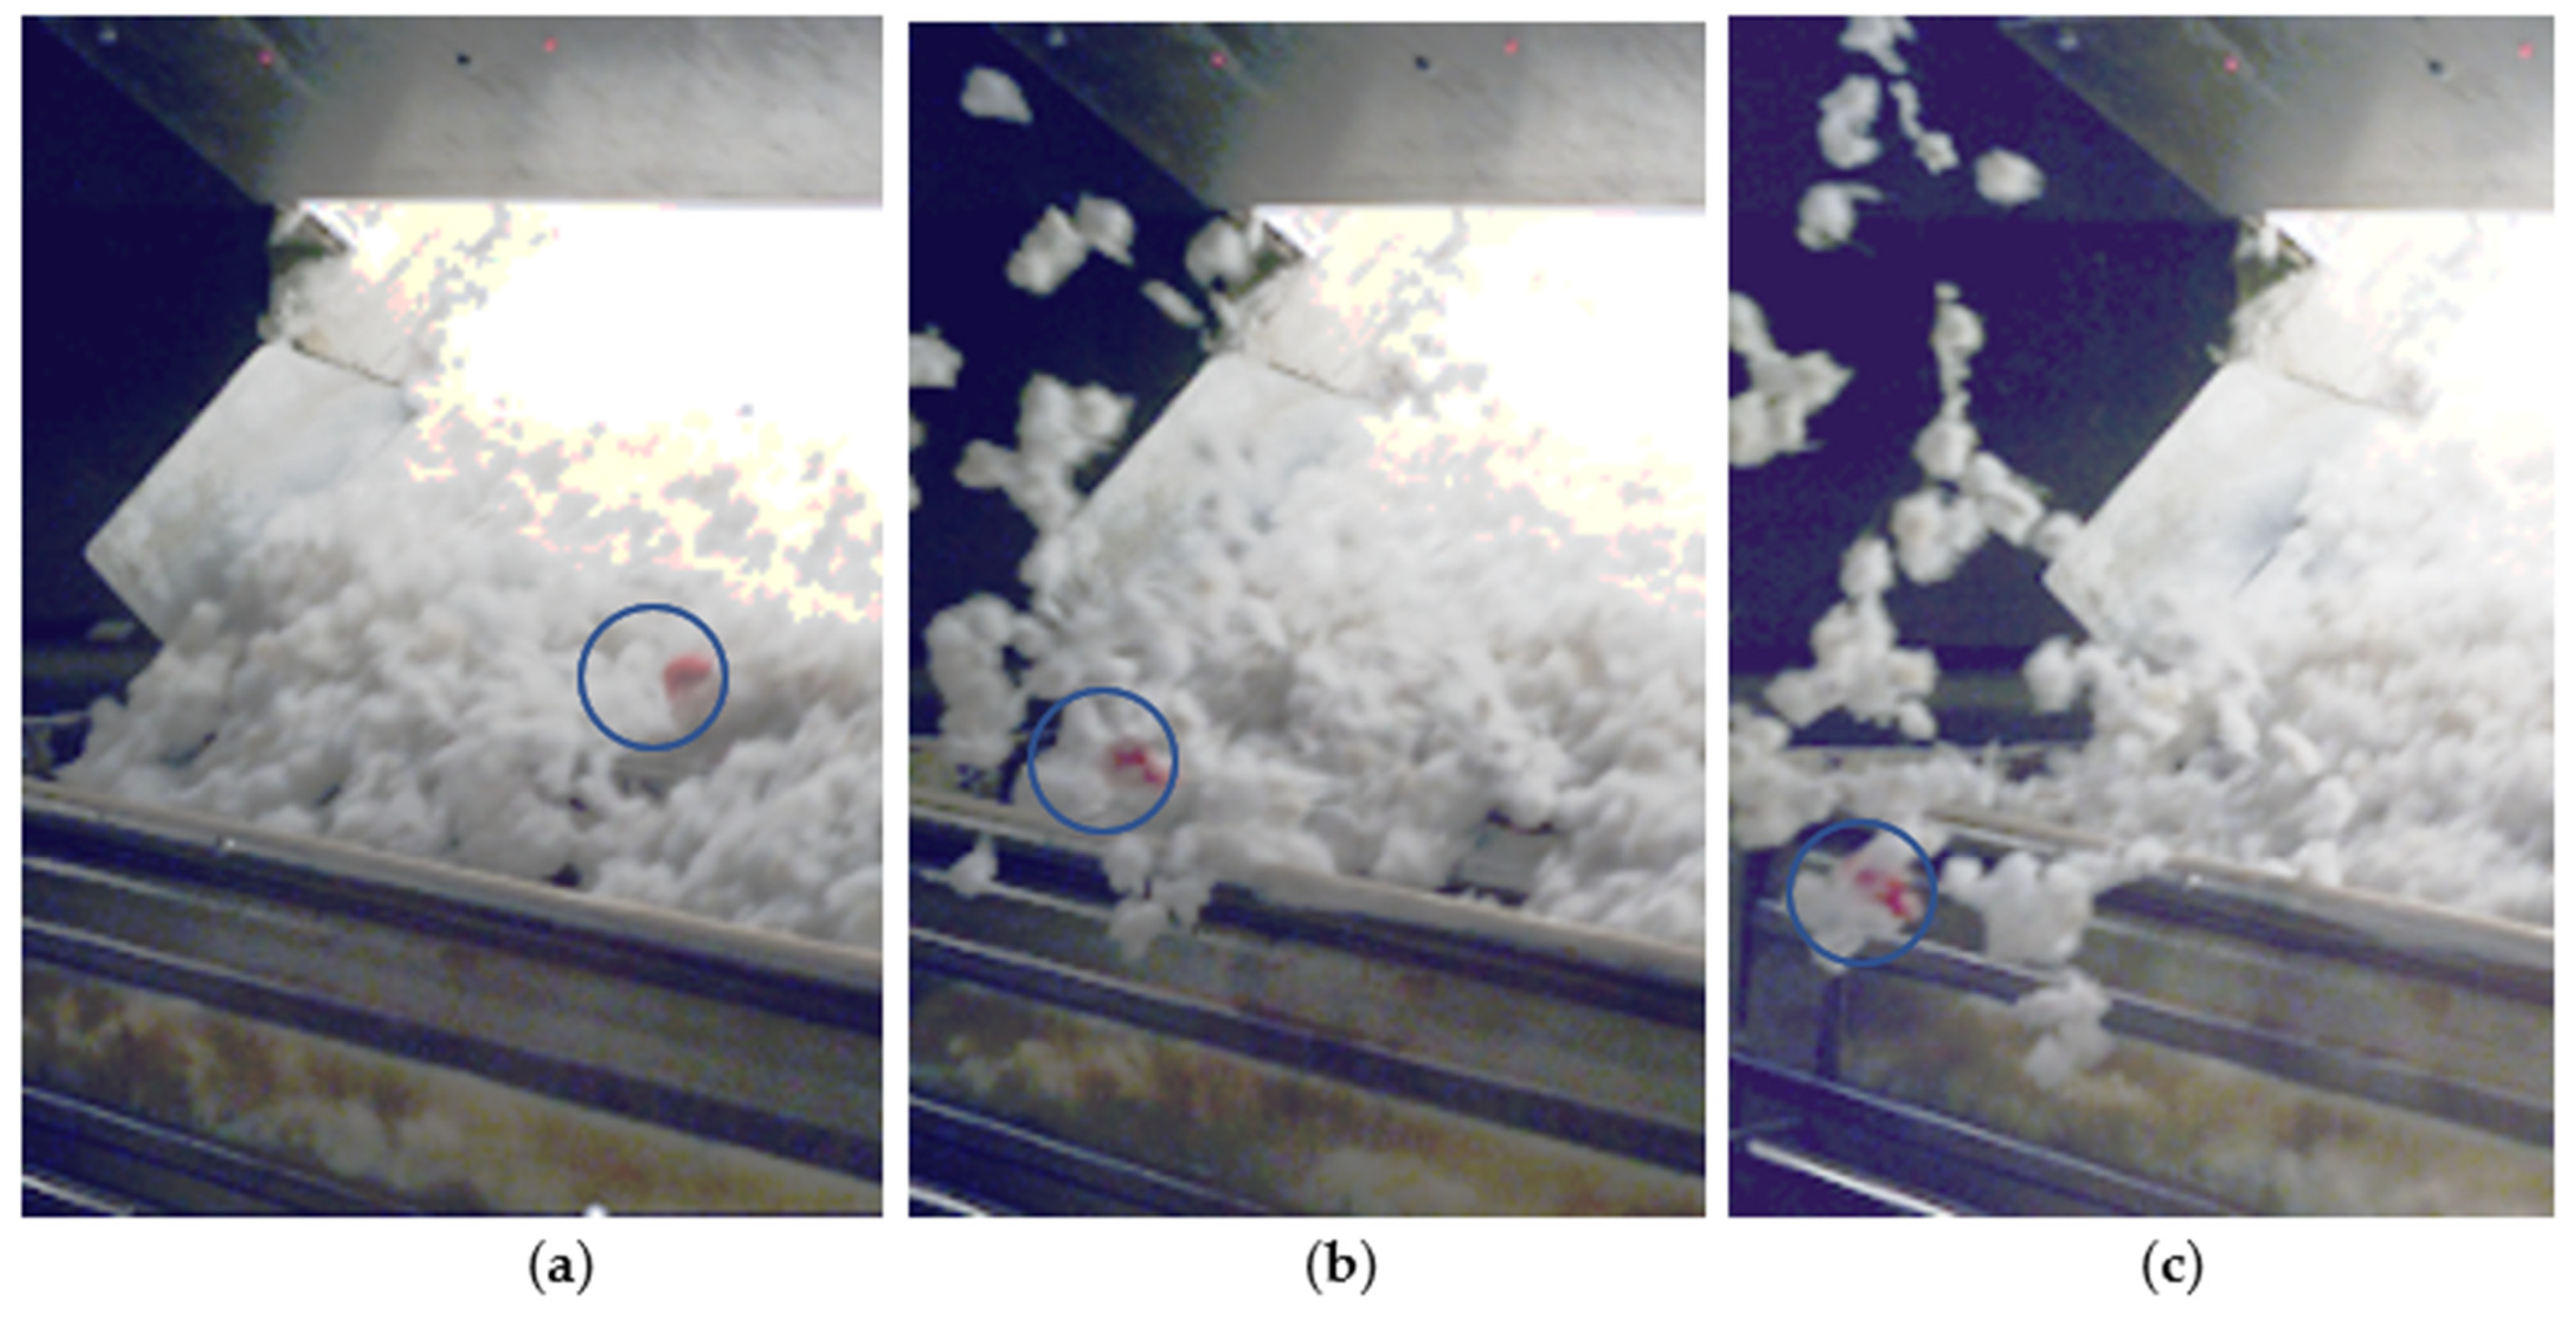
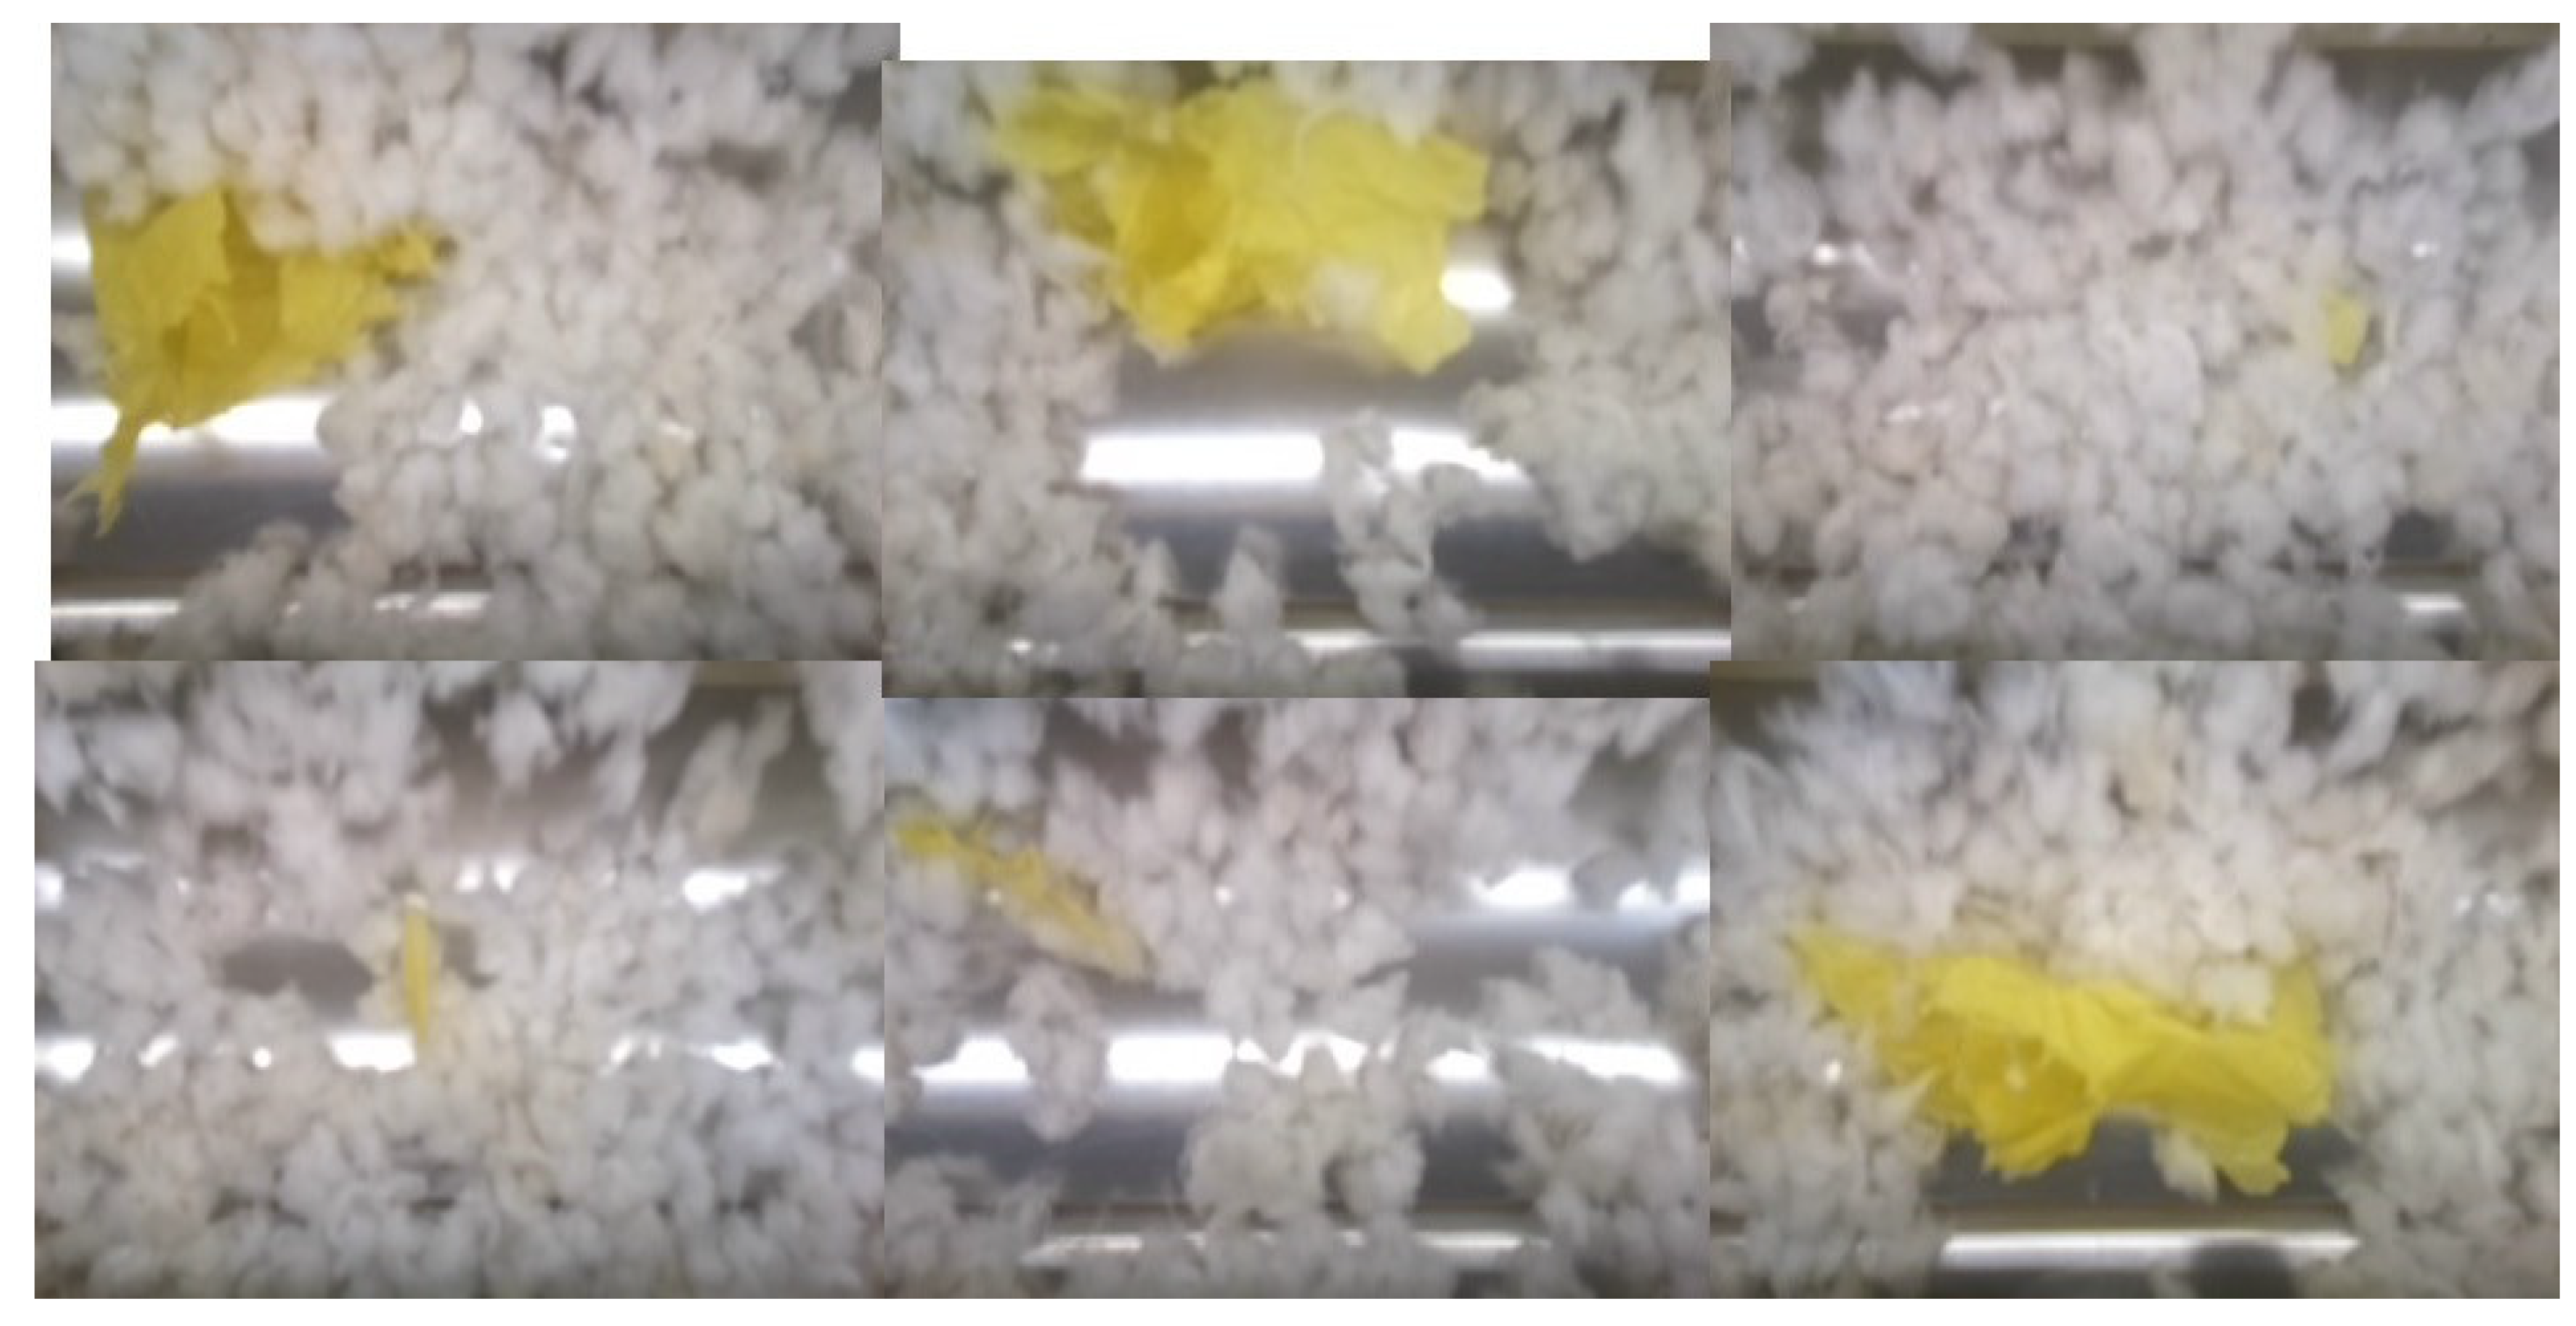
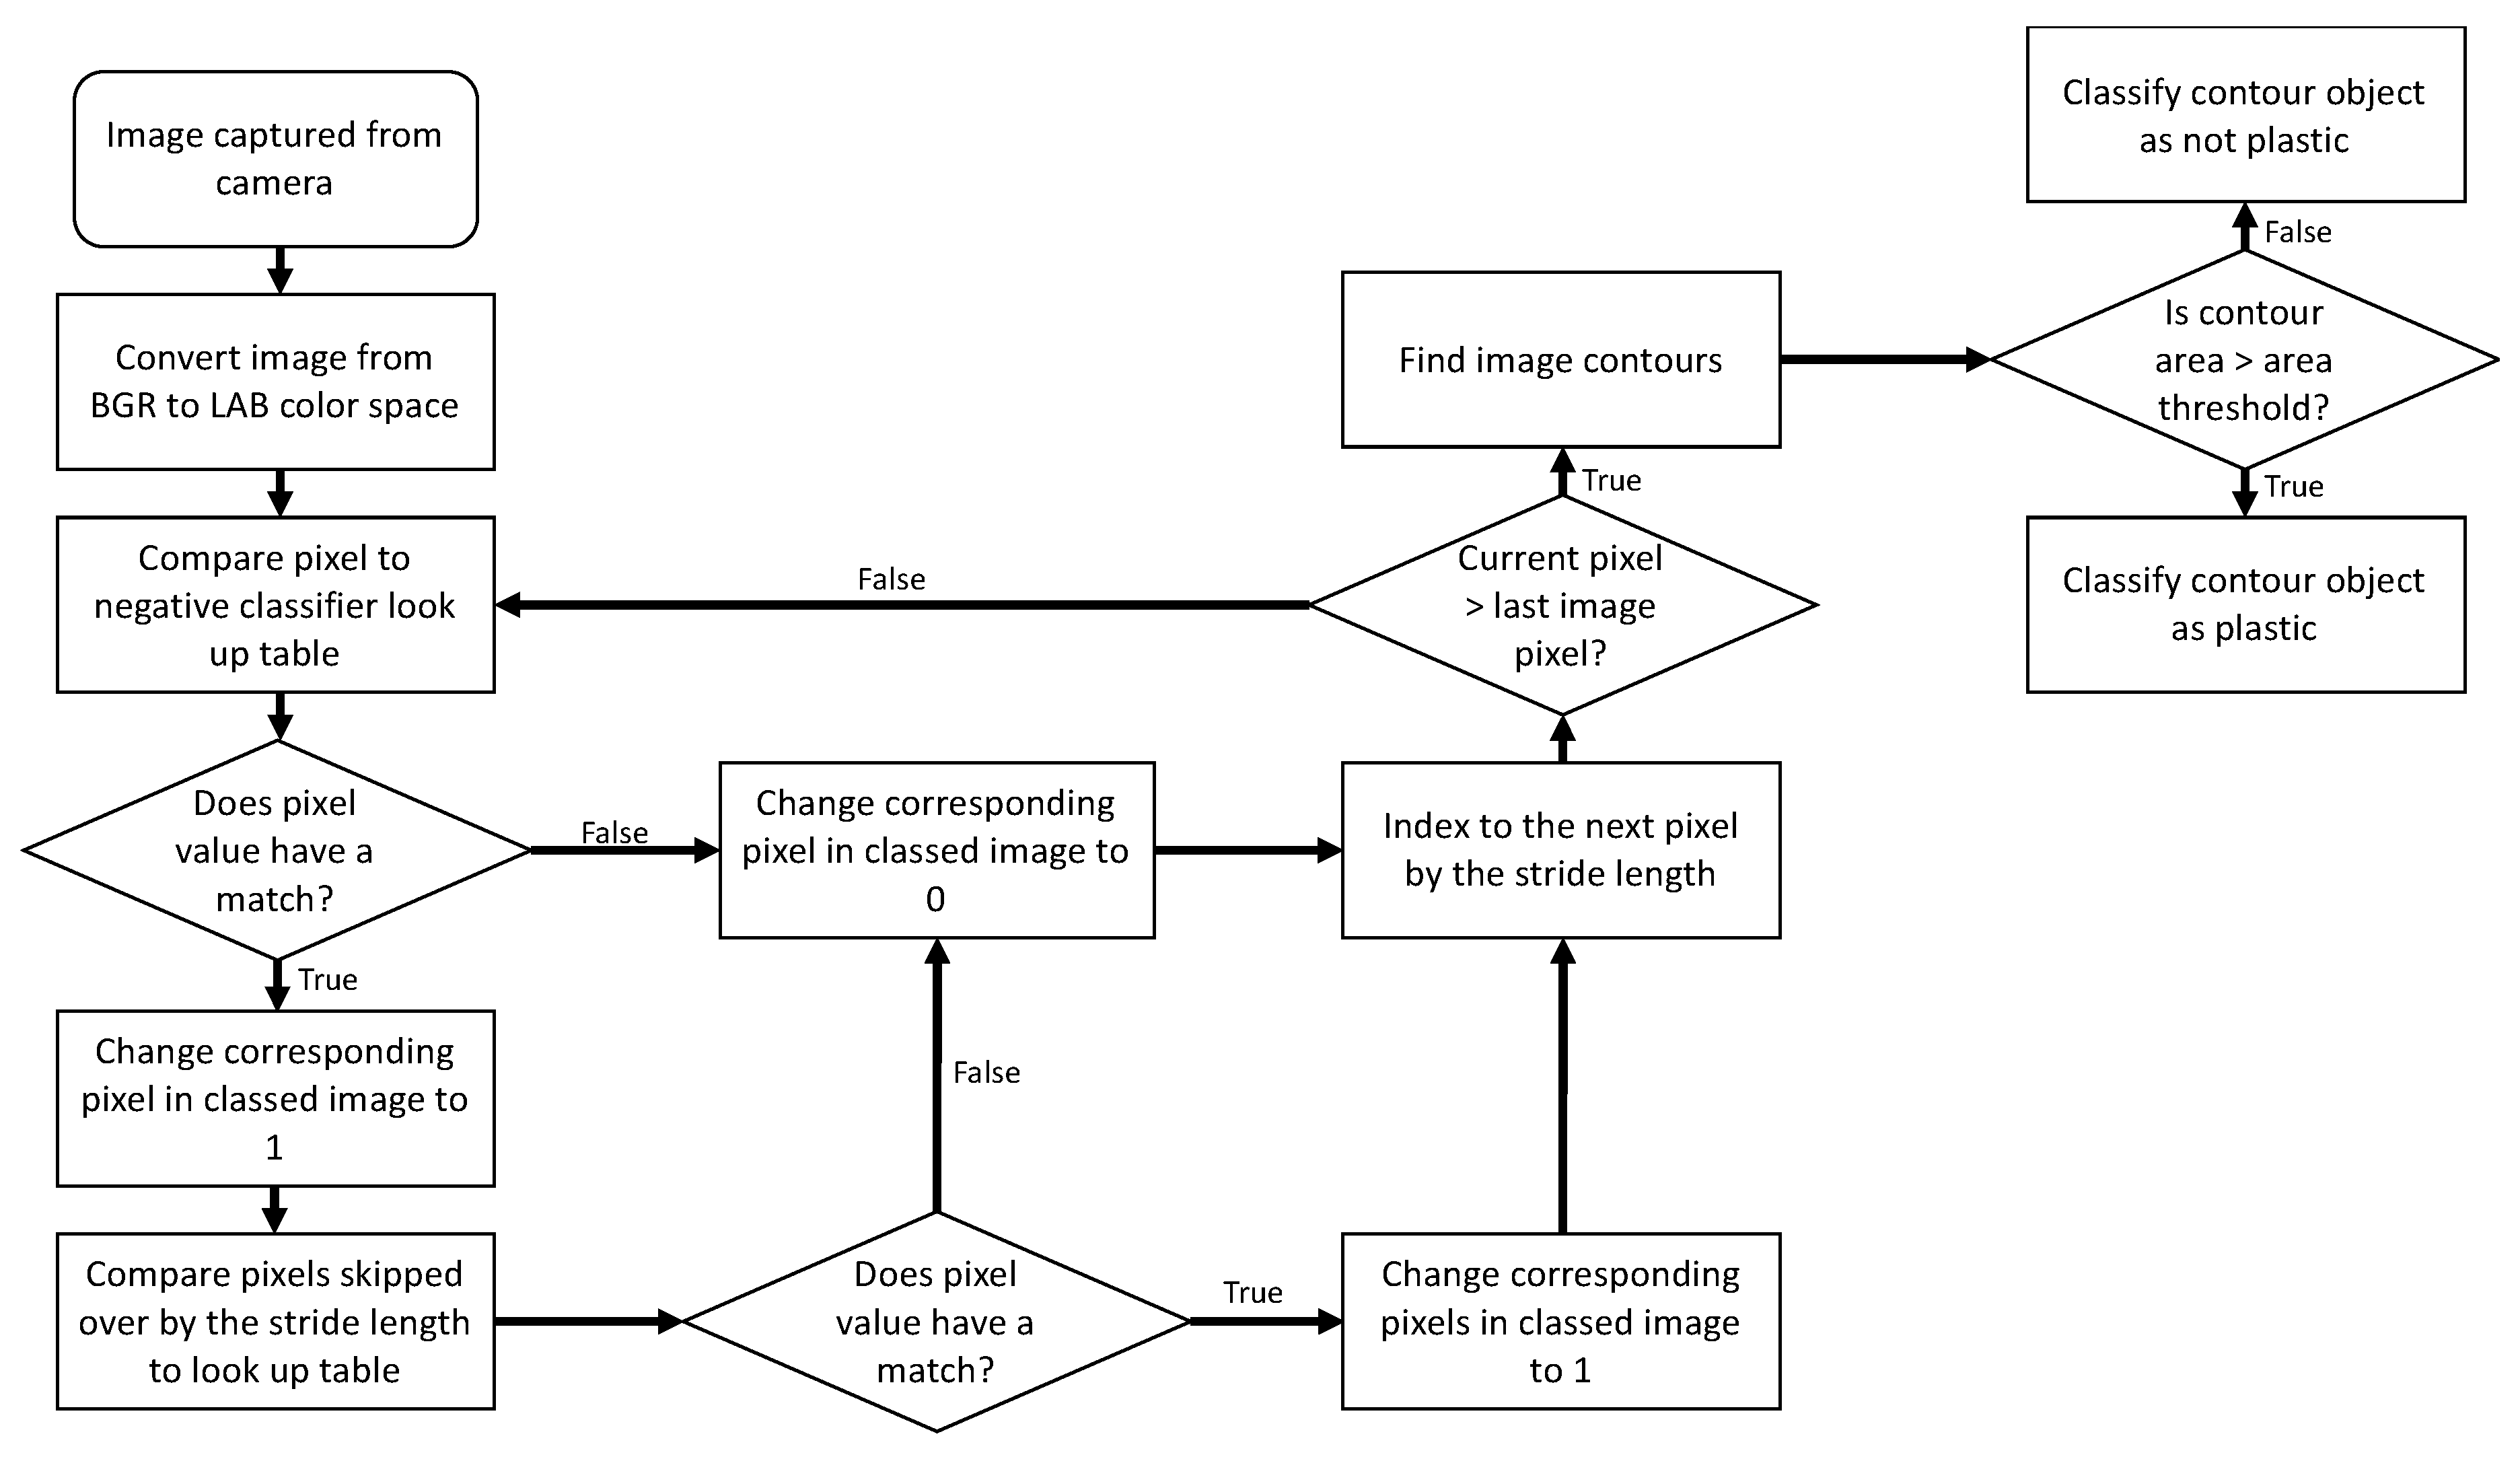
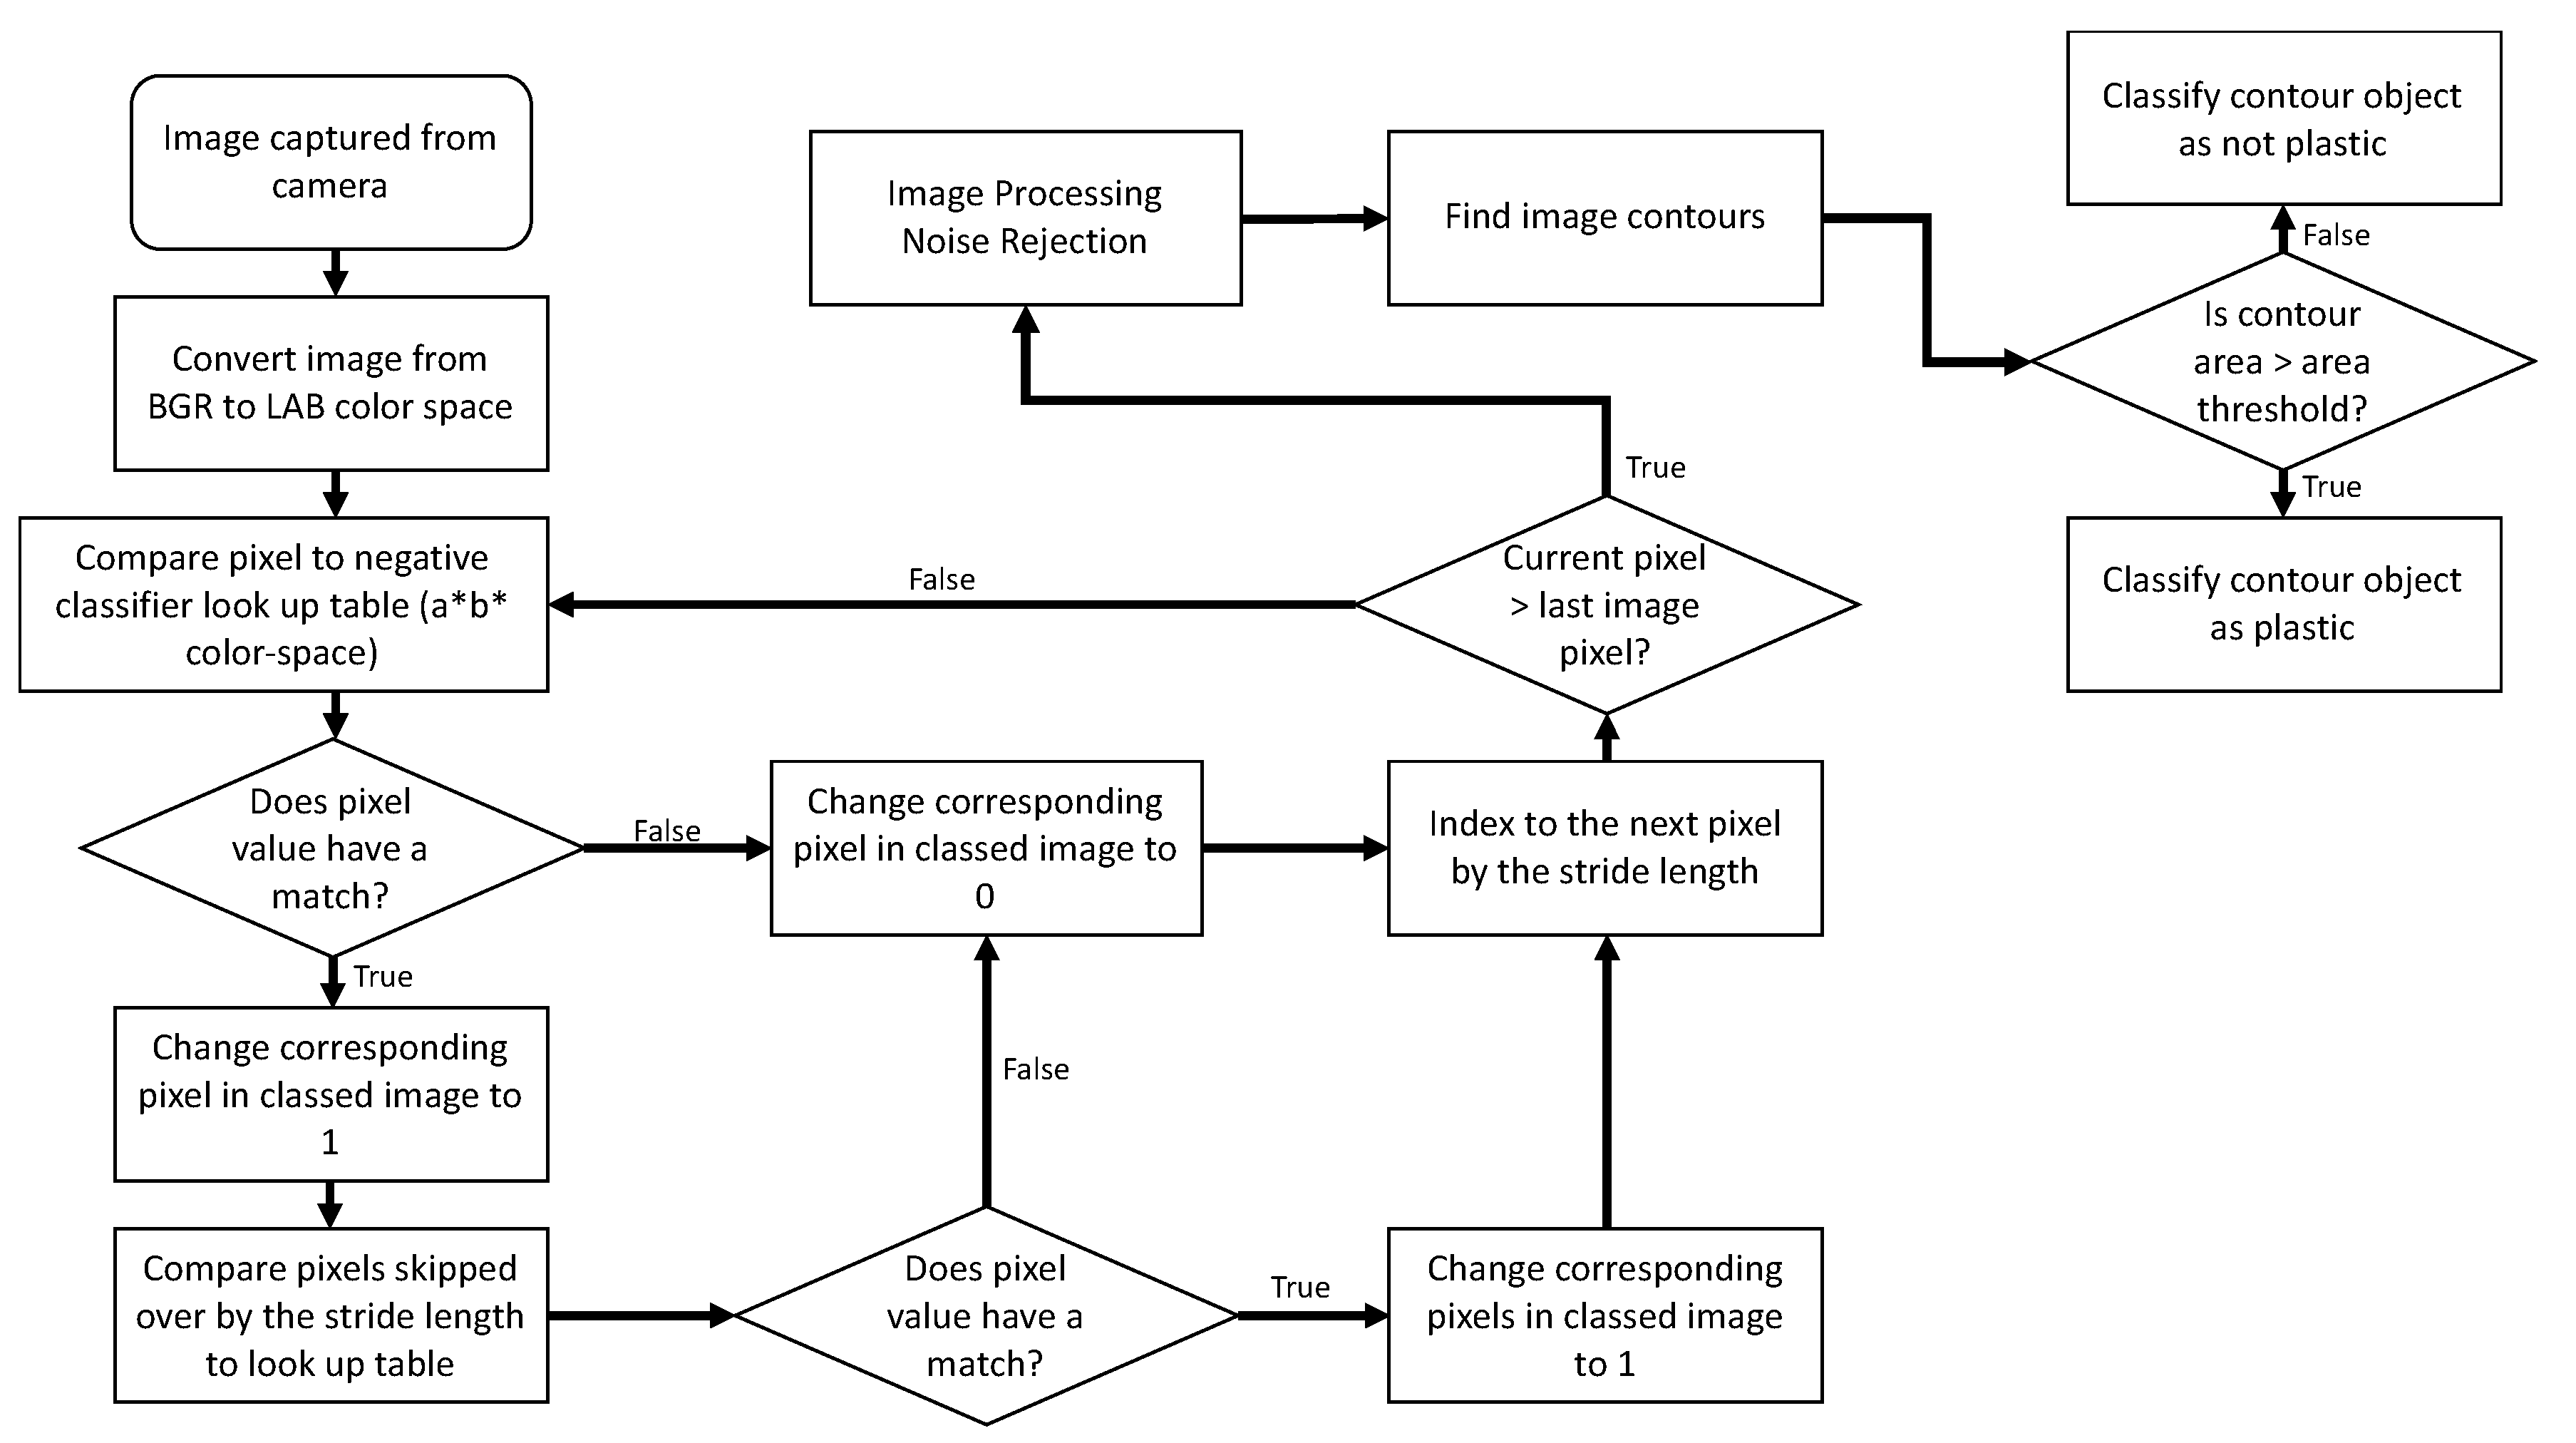
3.8. Image Processing for Plastic Detection

After an image is converted to the L*a*b* color space, the image is then processed using the “proc_lab_image_1x” or “proc_lab_image_5x” public function of the “cProcess_Lab_Image” class. The “5x” label in the function name specifies a stride length of 5 pixels for processing the image; similarly, the 1x processes every pixel. When the system was in early development, the speed up obtained from skipping pixels was imperative; however, over the course of the project, a faster ARM processor was adopted that alleviated the need while still allowing processing of images at 40 frames-per-second, which was adequate for high accuracy detection–ejection. For higher-end ARM processors, the 1x version is recommended, for lower cost, lower performance processors or in applications with tighter time budget on the processing step, use of one of the higher x versions of the routine will be a valuable enabling alternative. The stride length was implemented in order to balance processing speed with system performance.
The “proc_lab_image_5x” function steps through the entire image and analyzes every fifth pixel to determine if the pixel color matches a value in the look up table. The flow chart in Figure 20 details the image classification process.
After pixel classification, with the negative classifier (still in the “proc_lab_image_xx” function), the binary image is further processed according to standard image processing flows to reduce noise and subsequent false triggers, which is achieved with the following steps (Image Processing Noise Rejection Step; Figure 20):
  • Three stages of dilation–erosion (to fill voids between neighboring lit pixels).
  • Median filter (to reject any leftover shot-noise).
  • Object clustering using contour analysis.
    • Objects were then size-excluded on the basis of a threshold minimum size (Figure 18).

3.9. Image Capture Driver

The driver used to interface between the ARM central processing-unit (CPU; BROADCOM BCM2711) and the camera (Sony IMX219 rolling-shutter color-imager) was based on an open-source “OPENCV” C++ wrapper for the original low-level C source-code. Of necessity, since the original driver did not include a means to set fixed gains for red and blue channels, on the camera imager, custom code was developed to augment the C++ OPENCV wrapper with this functionality. This new wrapper driver source code was compiled separately and installed as a global library into the Linux operating system (OS). The driver source code is included in the software source code supplemental files for this paper.

3.10. Open-Source Libraries

The software leverages open-source libraries where possible. The main primary libraries utilized were:
  • OpenCV (machine-vision library; originally written by Intel Corp. Research).
  • WiringPi (provides high-speed C++ interface library utilized to control BCM2711 digital output ports that were used as inputs to a custom electronics solenoid driver board; artwork is shown in Figure 15. A separate manuscript will follow this paper, describing the electronic sub-system).
The OpenCV library was custom compiled as the normal ARM binary was too slow for the real-time requirements for this application. Of importance was the inclusion of the parallel and the NEON floating point extensions.

4. Software Design Summary

This manuscript covers the main aspects of the software source code; for specific details on the full code implementation, a list of all the functions that make up the man-machine interface software is shown in Figure 21, and a full copy of the documented source code is attached in the Supplementary materials.
While there is a great deal more code in this software package, the rest of the code is self-explanatory and well documented in the attached files.

Conclusions

The gin-stand inspection and removal software design covered in this technical note was tested in conjunction with the electrical system along with the mechanical and optical system design for several prototype systems. The final system was installed in several commercial cotton gins and, with diligent use, was found to significantly lower the number of plastic calls after installation. On-site testing of the system revealed that the plastic inspection–detection and ejection system (PIDES) provides complementary protection in combination with the feeder, with the PIDES system removing in excess of 90% of large pieces of plastic and the feeder removing in excess of 90% of the small pieces of plastic, such that when combined with the feeder, the total removal rate for all sized plastic pieces was in excess of 90%.

Supplementary Materials

The following are available online at https://0-www-mdpi-com.brum.beds.ac.uk/article/10.3390/agriengineering3030033/s1. The software source code files are available along with this technical note online and are released into the public domain as open-source software as the code is written using QT windowing API, the open-source license is dictated by the QT open-source GPL-3 license. The software was developed and compiled using QT Creator IDE using QT-5 application programming interface (API).

Author Contributions

Methodology, M.G.P., G.A.H., J.D.W.; software and electronics, M.G.P.; validation, M.G.P.; formal analysis, M.G.P.; investigation, M.G.P., G.A.H., J.D.W. All authors have read and agreed to the published version of the manuscript.

Funding

This research received funding from Cotton Incorporated, Cary N. Carolina 27513. U.S.A. under grant 18-239.

Data Availability Statement

Preliminary data is included in this article as a indication as to the level of performance of the system. The full experimental data will be provided in the next upcoming article on the validation testing study.

Conflicts of Interest

Mention of a product or tradename in this article does not constitute an endorsement by the USDA-ARS over other compatible products. Products or trade names are listed for reference only. USDA is an equal opportunity provider and employer.

Appendix A. Database Command Variables, Used to Control Software

List: MariaDB Database-Table [camera_nodes]> desc Camera_Configuration;
+---------------------------+-------------+------+-----+---------+-------+
| Field | Type | Null | Key | Default | Extra |
+---------------------------+-------------+------+-----+---------+-------+
0 | Id | int(11) | NO | PRI | NULL | |
1 | Location | text | YES | | NULL | |
2 | Function | text | YES | | NULL | |
3 | IP_Address | text | YES | | NULL | |
4 | SSH_Port | int(11) | YES | | NULL | |
5 | Status | text | YES | | NULL | |
6 | ReBoot | int(11) | YES | | 0 | |
7 | CPU_Temp | int(11) | YES | | 0 | |
8 | Comm_Messages | text | YES | | NULL | |
9 | Error_Message_Log | text | YES | | NULL | |
10 | Open_ReverseTunnel | int(11) | YES | | NULL | |
11 | Reset_Variables | int(11) | YES | | 0 | |
12 | LastPic_AveWhite | int(11) | YES | | NULL | |
13 | Run_Config | int(11) | YES | | NULL | |
14 | Run_Classifier | int(11) | YES | | NULL | |
15 | AddTo_Classifier | int(11) | YES | | NULL | |
16 | Use_Air_Knives | int(11) | YES | | NULL | |
17 | AirKnife_PulseTest | int(11) | YES | | NULL | |
18 | AirKnife_PulseDelay_ms | int(11) | YES | | NULL | |
19 | AirKnife_PulseOnTime_ms | int(11) | YES | | NULL | |
20 | Cool_Group_ID | int(11) | YES | | NULL | |
21 | Min_BlobSize | int(11) | YES | | 50 | |
22 | Roi_StartX | int(11) | YES | | NULL | |
23 | Roi_StopX | int(11) | YES | | NULL | |
24 | Roi_StartY | int(11) | YES | | NULL | |
25 | Roi_StopY | int(11) | YES | | NULL | |
26 | Classifier_Image | blob | YES | | NULL | |
27 | LastTime_ContFound | datetime | YES | | NULL | |
28 | LastTime_NormalPic_Taken | datetime | YES | | NULL | |
29 | Total_Plastic_Count | int(11) | YES | | NULL | |
30 | Capture_Image_DataSet | int(11) | YES | | NULL | |
31 | Gain | varchar(45) | YES | | NULL | |
32 | Exposure | varchar(45) | YES | | NULL | |
33 | ColorBalance | int(11) | YES | | 1 | |
34 | awb_r | varchar(45) | YES | | NULL | |
35 | awb_b | varchar(45) | YES | | NULL | |
36 | TimeToSavePic_mins | varchar(45) | YES | | NULL | |
37 | Number_of_Pics_to_Take | int(11) | YES | | NULL | |
38 | Number_of_Pics_to_Skip | int(11) | YES | | 0 | |
39 | Enable_Input_PicCaptures | int(11) | YES | | 0 | |
40 | SoftwareStart_PicCaptures | int(11) | YES | | 0 | |
41 | Enable_Diagnostic_Display | int(11)
42 | Save_Directory   | varchar(45)    “/home/pi/Pictures/Capture1”
43| Run_Analysis      | int(11)    0
44 | Percent_Pics_with_Objects | int(11) | -1
45 | HighSpeed_CaptureMode | int(11)
46 | MaxImages_PlasticSaveQueue
47 | MaxImages_SavedPerDay
48 | NumPlasticImages_SavedToday
49 | SavePlasticImages
50 | PlasticSaveDirectory
51 | DownScaleX_PlasticImages
52 | ReduceSize_PlasticImages
53 | Progress_PicCapture
54 | Progress_BuildClassifier
55 | Current_Velocity
+---------------------------+-------------+------+-----+---------+-------+

References

  1. Pelletier, M.G.; Holt, G.A.; Wanjura, J.D. A Cotton Module Feeder Plastic Contamination Inspection System. AgriEngineering 2020, 2, 280–293. [Google Scholar] [CrossRef]
  2. Devine, J. (Cotton Incorporated Economist, Cary, NC, USA). Interview Conducted, 6 January 2020.
  3. Barnes, E.; Morgan, G.; Hake, K.; Devine, J.; Kurtz, R.; Ibendahl, G.; Sharda, A.; Rains, G.; Snider, J.; Maja, J.M.; et al. Opportunities for Robotic Systems and Automation in Cotton Production. AgriEngineering 2021, 3, 339–362. [Google Scholar] [CrossRef]
  4. Blake, C. Plastic Contamination Threatens U.S. Cotton Industry; Southwest Farm Press: Irving, TX, USA, 2013; Available online: https://www.farmprogress.com/node/319085 (accessed on 5 July 2020).
  5. Adams, G. A Very Serious Matter. Cotton Farming. 3 August 2017. Available online: https://www.cottonfarming.com/cottons-agenda/a-very-serious-matter/ (accessed on 5 July 2020).
  6. Ramkumar, S. Plastic Contamination Not Just a Cotton Problem. Cotton Grower. 13 September 2018. Available online: https://www.cottongrower.com/opinion/plastic-contamination-not-just-a-cotton-problem/ (accessed on 5 July 2020).
  7. O’Hanlan, M. With Cotton Harvest Underway, FARMERS fear Grocery Bags, Plastic Contamination. Victoria Advocate. 25 August 2019. Available online: https://www.victoriaadvocate.com/news/local/with-cotton-harvest-underway-farmers-fear-grocery-bags-plastic-contamination/article_9f8c90b0-c438-11e9-9c61-03c92ae351a7.html (accessed on 5 July 2020).
  8. Adams, G. A Reputation at Stake. Cotton Farming. 1 October 2019. Available online: https://www.cottonfarming.com/cottons-agenda/a-reputation-at-stake/ (accessed on 5 July 2020).
  9. Pelletier, M.G.; Holt, G.A.; Wanjura, J.D. A Plastic Contamination Image Dataset for Deep Learning Model Development and Training. AgriEngineering 2020, 2, 317–321. [Google Scholar] [CrossRef]
  10. QT Company. QT Version 5.5; QT Group Plc: Helsinki, Finland, 2014; Available online: https://www.qt.io (accessed on 6 August 2019).
  11. Schanda, J. Colorimetry Understanding the CIE System; Wiley-Interscience; John Wiley & Sons, Inc.: Hoboken, NJ, USA, 2007; p. 61. ISBN 978-0-470-04904-4. [Google Scholar]
Figure 1. Module feeder floor system (a) and unloading of round module onto the module feeder floor (b) where a module accidentally tipped over, trapping plastic underneath it. Whenever this situation occurred, the gin crew was not completely able to remove all of the plastic before it went into the gin.
Agriengineering 03 00033 g001
Figure 2. Module feeder image capture by inspection system with plastic on dispersing cylinders.
Agriengineering 03 00033 g002
Figure 3. Camera-computer node housing design with integral dust cleaning air-knife.
Agriengineering 03 00033 g003
Figure 4. Gin-stand feeder-apron installation with a bank of 6 camera-computer nodes.
Agriengineering 03 00033 g004
Figure 5. Under-side of the lower section of the gin-stand feeder-apron installation with a bank of 12 pneumatic solenoids that provide pneumatic actuation to 12 air-knives (two air-knives per node with each node controlling four air-knives, their two local air-knives plus one on either side of the node to allow for ejection of plastic detected along the edge between nodes).
Agriengineering 03 00033 g005
Figure 6. Plastic detection–ejection system installed and running at a commercial cotton gin.
Agriengineering 03 00033 g006
Figure 7. Plastic inspection–detection and ejection system (“PIDES”). Plastic removal system in operation, taken with high-speed video. (a) Target (inside circle) just before ejection, after detection. (b) Target during ejection process. (c) Target after ejection is complete.
Agriengineering 03 00033 g007
Figure 8. Module wrap plastic contaminants that were detected during a commercial field trial of the plastic inspection–detection and ejection system, “PIDES”.
Agriengineering 03 00033 g008
Figure 9. Plastic detected efficacy for various module wrap colors, which was conducted during a commercial field trial of the plastic inspection–detection and ejection system, “PIDES”.
Agriengineering 03 00033 g009
Figure 10. Screenshot of the PIDES-Viewer software that provides the user interface to the machine-vision plastic detection system.
Agriengineering 03 00033 g010
Figure 11. Screenshot of the PIDES-Viewer software that provides the user interface to the machine-vision plastic detection system.
Agriengineering 03 00033 g011
Figure 12. The flow chart for the program initialization that runs on the program start. The IP addresses of the cameras are stored locally in a text file. If the program can connect to the camera, the program will allow image capture from that camera during the main process loop (camera function). This functionality allows the program to run without crashing so that operators can troubleshoot the cameras.
Agriengineering 03 00033 g012
Figure 13. The flow chart for the main process loop.
Agriengineering 03 00033 g013
Figure 14. The flow chart for the solenoid firing loop.
Agriengineering 03 00033 g014
Figure 15. The flow chart for the solenoid firing loop.
Agriengineering 03 00033 g015
Figure 16. Two-dimensional color space, utilized in the software’s “negative-classifier”, showing location of common cotton colors (a), pink module wrap contaminant (b), and yellow module wrap contaminant (c).
Agriengineering 03 00033 g016
Figure 17. The L*a*b* color space look-up table used for negative classification of plastic in a cotton gin-stand detection system. The black pixels in the image show the colors defined as non-plastic and are thus ignored. Should a color in a processing image land outside of the black pixel coordinates, the pixels are classified as plastic.
Agriengineering 03 00033 g017
Figure 18. Flow chart detailing the building of a negative classifier.
Agriengineering 03 00033 g018
Figure 19. The negative classifier dialog box that displays when the “Build Negative Classifier” or “Append Negative Classifier” option is selected from the “Classifier” menu. The three radio buttons provide the different options for image selection.
Agriengineering 03 00033 g019
Figure 20. The process to detect plastic in an image showing the methods used to detect plastic in the “cProcess_Lab_Image” class. Image pixels colors are compared to the values stored in the look-up table to build objects of interest in the image. For pixels that are classified as plastic, the surrounding pixels are also analyzed for classification. Once the pixels are finished being classified, contours are defined to outline the objects. The area of the pixels is compared to a set threshold to reduce noise and determine whether plastic is present in the image.
Agriengineering 03 00033 g020
Figure 21. The C++ class definitions used in the module inspection system software. In the figure’s class specifications, the leading ‘+’ signifies public functions, while the leading ‘-’ signifies private functions and the leading ‘$’ signifies event response function (SLOT) that are called and used by the windowing event loop structures. The SLOT functions provide the equivalent of an interrupt service routine that frees up active process from having to continuously poll various resources for data event occurrences. The class structure is flat with no inheritance by any of the classes; the arrows between classes only indicate which class is calling other classes by means of publicly visible functions.
Agriengineering 03 00033 g021
Publisher’s Note: MDPI stays neutral with regard to jurisdictional claims in published maps and institutional affiliations.

