
Modeling and Assessing Heat Transfer of Piglet Microclimates


Department of Agricultural and Biosystems Engineering, Iowa State University, Ames, IA 50011, USA
*
Author to whom correspondence should be addressed.
AgriEngineering 2021, 3(4), 768-782; https://0-doi-org.brum.beds.ac.uk/10.3390/agriengineering3040048
Submission received: 13 August 2021
/
Revised: 1 October 2021
/
Accepted: 5 October 2021
/
Published: 8 October 2021
(This article belongs to the Special Issue Innovative Technology in Livestock Production)
Abstract
:High piglet pre-weaning mortality rates can be attributed to poor creep area microclimate resulting in negative productivity, welfare, and economic consequences. A piglet mechanistic steady-state thermal balance model was developed using previous models and expanded to assess (a) thermal interactions of multiple pigs and (b) conduction heat transfer. The piglet Effective Environment Temperature (EET) equation was also modified to incorporate piglet age (day 0 to 30) and a conduction heat transfer term. Model parameters were validated with empirical data consisting of the thermal component (dry-bulb temperature, Tdb; mean radiant temperature, TMR; airspeed, U; mat underside temperature, Tm) of the microclimate and dimension data of the piglets (i.e., body weight, length, height, width, and calculated surface area). Model results demonstrate that the common microclimate supplemental heat sources (heat mats and heat lamps; HL) can meet the needs of the piglets. The new EET was more consistent for a novel semi-enclosed heated microclimate (SEHM) in comparison to the HL. This demonstrates the benefit of precision technologies over manually adjusted supplemental heat sources. The experimental data and model results suggest further development of an ideal thermal index for piglet microclimates needs to account for variations of piglet health and body condition to be more applicable in industry.
1. Introduction
Modern swine farrowing facilities have unique environmental control design constraints; the system must simultaneously achieve the thermal needs of the mature sows and newborn piglets. This set of thermal needs conflict with each other as the air temperature defining the thermoneutral zone for farrowing/lactating sows is approximately 18 °C [1,2] and for piglets is approximately between 32 °C to 35 °C [3]. The widely adopted solution has been to create two distinct thermal environments in the room [1,4]. The room macroenvironment is targeted to meet the cooler thermal needs of the sows, via increased ventilation exchange rate and decreasing air temperature with evaporative cooling pads. A localized microclimate via supplemental heat sources is provided in the farrowing stall creep area to achieve the warmer needs of the piglets. The swine industry uses several different supplemental heat sources including heat lamps (infrared bulb ranging from 125 to 250 W), heat mats (electric heaters encapsulated in plastic), semi-enclosed heated microclimates (parabolic shield with an infrared heat source for two creep areas), and brooders (totally enclosed area with a heat lamp) [1,5,6,7]. This cost-effective approach (both capital cost and energy usage) is capable of meeting both the thermal needs of sows and piglets; however, the diversity in macro- and micro-climates results in variable thermal conditions for the piglets, which could result in reduced piglet growth and increased pre-wean mortality (PWM) rates [2,8]. The creation and control of the microclimate is an excellent use case for precision livestock farming technology (PLF) as a model-based control system can be developed and deployed [9].
Piglets experience heat transfer from the four modes of heat transfer within their microclimate, that is, conduction, convection, thermal radiation, and evaporation. For thermoneutral piglets, thermal radiation and convection are presumed to be the two primary modes of heat dissipation [4,10,11]. However, piglets can also lose or gain heat through conduction via contact with the floor (often a rubber mat or heat mat), depending on the creep area microclimate configuration. The type of mat material and surface temperatures are key variables in determining the rate of conductive heat dissipation with between 10% to 28% (based on material) of total heat dissipation being conducted to the floor [12]. Heat dissipation due to evaporation from either wetted skin dominates total heat dissipation immediately following birth due to drying of the placental fluids [13,14]. Additional measures including drying and warming of piglets have been shown to improve piglet rectal temperatures following this event of evaporative cooling post birth [14]. However, throughout lactation, evaporative heat dissipation is minimal since heat stress conditions are often not encountered. Heat production of piglets is negligent in recent studies [15,16,17]. However, values have been reported on an individual piglet basis for a limited age and weight range [18]. The production scenario of piglets living with the sow creates a complex environment for making accurate heat production measurements in commercial settings. Predicting piglet heat dissipation through models can be advantageous for understanding and assessing the microclimate for the piglet.
Heat dissipation from piglets has been predicted using several different approaches, including mechanistic, empirical, and machine learning models. Mechanistic models are based on bioenergetics relationships governed by conservations of energy, momentum, and mass between a piglet and its environment [19]. These models show the non-linear relationship of input parameters and require assumptions for values that are difficult to measure (e.g., tissue thickness). One aspect of a mechanistic model that is of unique interest for piglets is the surface area to body weight ratio. As the surface area to body weight (BW) ratio increases, piglet heat dissipation also increases; therefore, supplemental heat is needed to overcome this increasing heat loss. Alternatively, empirical models are derived from data and influenced by the researcher’s preferences and conditions in which the data were collected [20]. The last approach is machine learning models that use empirically collected data to develop non-linear relationships between the input and output parameters [7]. The limitation of machine learning models is that they are limited in predictive ability of the inputs, and applicability is constrained by the model’s inputs and outputs. Of these common approaches, a mechanistic model offers the greatest advantage because they are based on physical laws describing equations of heat transfer [4]. For assessing the piglet’s microclimate the use of the Effective Environment Temperature (EET) is the thermal index adjusted for piglets [21]. The EET [21] transforms the convective and radiative heat transfer potential a standing piglet is experiencing into a temperature-based index. This version of the EET limits its application to other types of supplemental heat sources since conduction is neglected, which is the primary mode used by heat mats for warming piglets.
The goal of this study was to investigate and further define the piglet’s microclimate with three dominant modes of heat transfer (conduction, convection, and thermal radiation) using a mechanistic, thermal balance model. Then, a thermal index for creep area environment assessment was adapted and modified to compare different supplemental heat sources for all ages of piglets based on the piglet’s varying thermoregulation capabilities. The specific objectives are:
- Develop a steady-state, thermal balance model for piglet heat transfer,
- Expand the Effective Environment Temperature (EET) to include a conduction component with the mat and multiple piglets in the creep area (assuming a single layer, no piling), and
- Demonstrate differences in EET for two different microclimates provided by (1) a conventional heat lamp and (2) a heated semi-enclosed device.
2. Materials and Methods
2.1. Model Development
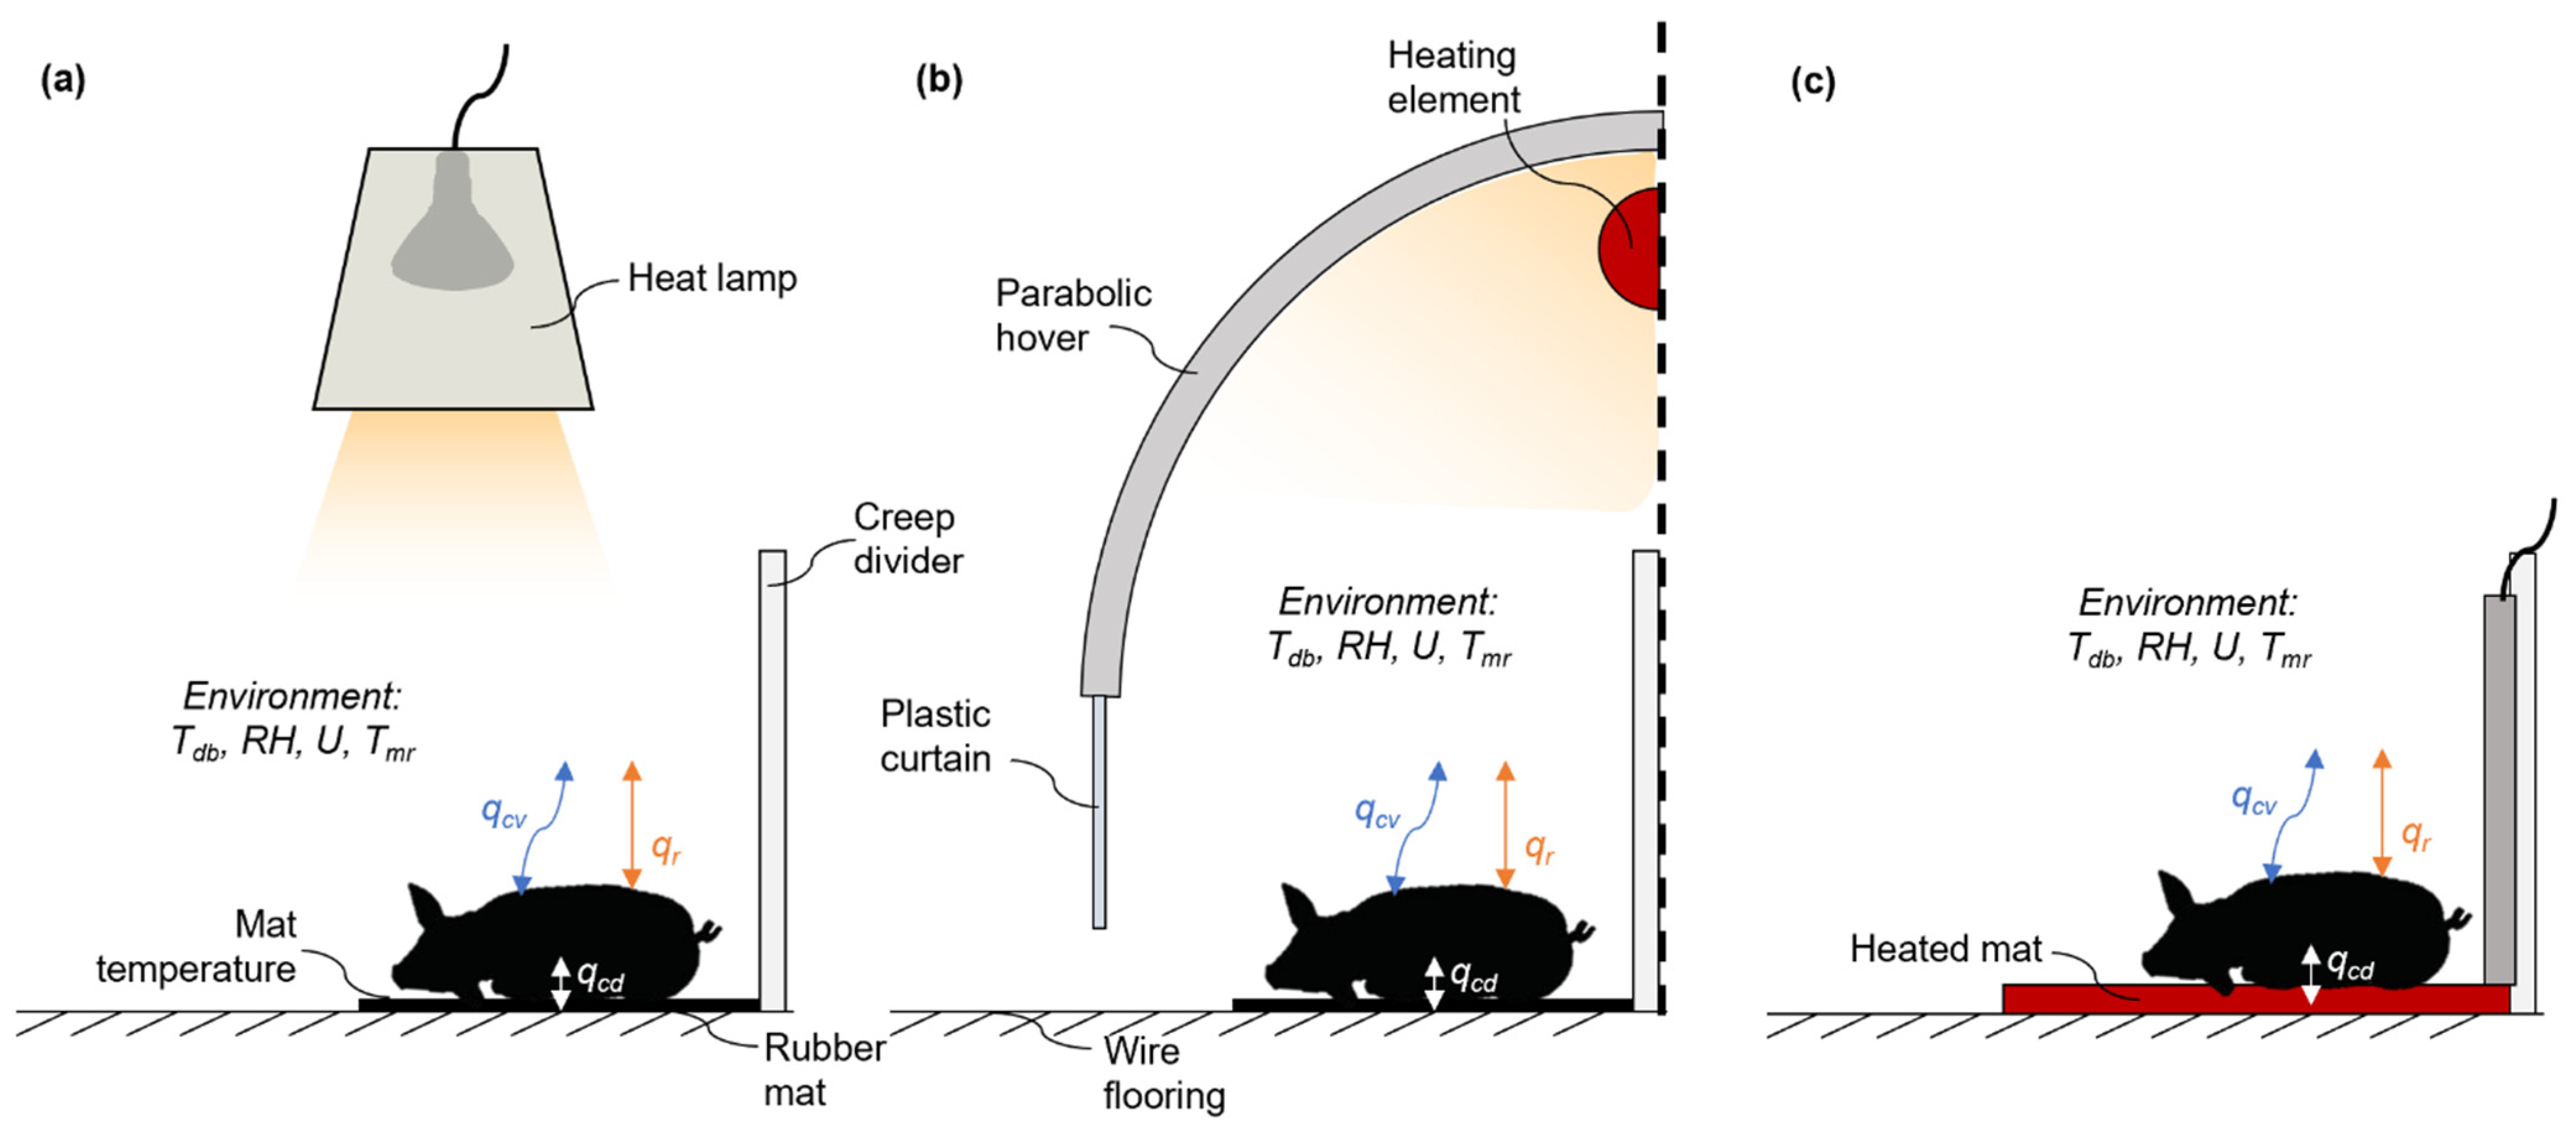
A mechanistic, steady-state thermal balance model (Equation (1)) was created and derived from [4]. The model focused on convective and radiative heat transfer [4]; hence, this model was expanded to include steady-state conduction from the piglet’s skin (assumed recumbent lying) to a floor material (either a single-layer rubber mat or electrically heated mat; Equation (1)). Addition of conductive heat transfer is needed because it can be a heat gain (e.g., heated mat) or loss (e.g., metal woven wire, unheated rubber mat) potentially resulting in thermal stress [12]. This key addition promotes improved representation of the microclimate a piglet experiences (Figure 1). Latent heat dissipation from respiration and passive skin diffusion was neglected, as it has been shown that for piglets exposed to temperatures below 35 °C, the latent heat dissipation partition is less than 10% of total heat dissipation [22]. Therefore, only conditions less than 35 °C were considered as reasonable for the latent heat loss assumption.
where
- = piglet steady-state internal heat production (W)
- = conductive steady-state heat transfer (dissipation or gain, W)
- = convective steady-state heat dissipation (W)
- = radiative steady-state heat dissipation (W)
Rate of conductive heat transfer can be described by the piglet surface area in contact with a rubber mat (recumbent lying), piglet core body temperature (39.5 °C, [4]), piglet tissue resistance, mat underside temperature, and mat thermal resistance (Equation (2)). Thermal conductance of the rubber mat was assumed to be 0.15 W m−2 °C−1 (hard rubber with a thickness of 6.35 mm; [23]). For electrically heated mats, the assumed conductive heat transfer (Equation (3)) to the piglet can be assessed by using the heat mat/piglet contact temperature and the contact area with the piglet. The contact temperature of the heat mat was calculated using Equation (4) from [24]. It was assumed that both the rubber and heat mat were perfect insulators and lost no heat from the underside of the mat.
where
- = steady-state conductive heat transfer to rubber mat (W)
- = piglet surface area (m2)
- = surface area portion touching the mat
- = piglet core body temperature (39.5 °C)
- = mat underside temperature (°C)
- = piglet tissue resistance (m2 °C W−1)
- = mat thermal resistance (m2 °C W−1)
- = steady-state conductive heat gain from heat mat (W)
- = heat mat contact temperature with a piglet (°C)
Piglets can lose heat through either natural (still-air conditions) or forced convection (Equation (5)). The convective heat transfer coefficient includes air conductivity, Prandtl number, kinematic viscosity, density, volumetric coefficient of expansion, and Grashof number. Empirical relationships between Tdb, input variables (Prandtl number, volumetric coefficient of expansion, air conductivity), film temperature (average of Tsk and Tdb), and kinematic viscosity were developed from air property tables for use in calculating the convective heat transfer coefficient [23]. For airspeeds ≤ 0.12 m s−1, the natural convection coefficient was calculated, while for airspeeds > 0.12 m s−1 the forced convection was calculated for a cylinder in cross flow with the diameter equal to the width of the piglet as outlined in [23] and derived in [21].
where
- hcv = convective heat transfer coefficient (W m−2 K−1)
- kcr = surface area proportion interacting with mixed modes heat transfer (m2)
- Tsk = piglet skin surface temperature (K)
- Tdb = microclimate dry-bulb temperature (K)
Radiative heat transfer from a piglet was calculated by using the mean radiant temperature (TMR; Equation (6)). This approach simplifies the radiative heat transfer calculations by eliminating the need to know all surface temperatures a piglet is exposed to as well as the corresponding shape factors [4,25]. Measurement of TMR is performed with a black globe thermometer and has been successfully applied in several field studies [26]. Piglet skin emissivity was assumed to be 0.91 (dimensionless) [4]. This emissivity value was utilized for piglets based on previous model use and data collected from piglets [4,11].
where
- ε = emissivity (dimensionless)
- σ = Stefan‒Boltzmann constant (5.67 E-8 W m−2 K−4)
- TMR = mean radiant temperature (K)
Additionally, the model was expanded to integrate growth of the piglet by incorporating both body weight (BW) and width (Wi) by age for modern commercial genetics [27]. Surface area (SA) partitions for various heat transfer modes (conduction vs. mixed modes) followed the calculation outlined by [28] which included the following components: touching itself (limbs touching torso), touching other pigs, touching the mat, and interacting with mixed modes of heat transfer. It was assumed for all scenarios that 5% of the piglet’s SA was touching itself and 20% of the SA was touching the mat [29]. The SA was calculated using (Equation (7); [30]).
where
- SA = surface area of a piglet (m2)
- BW = body weight of the piglet (kg)
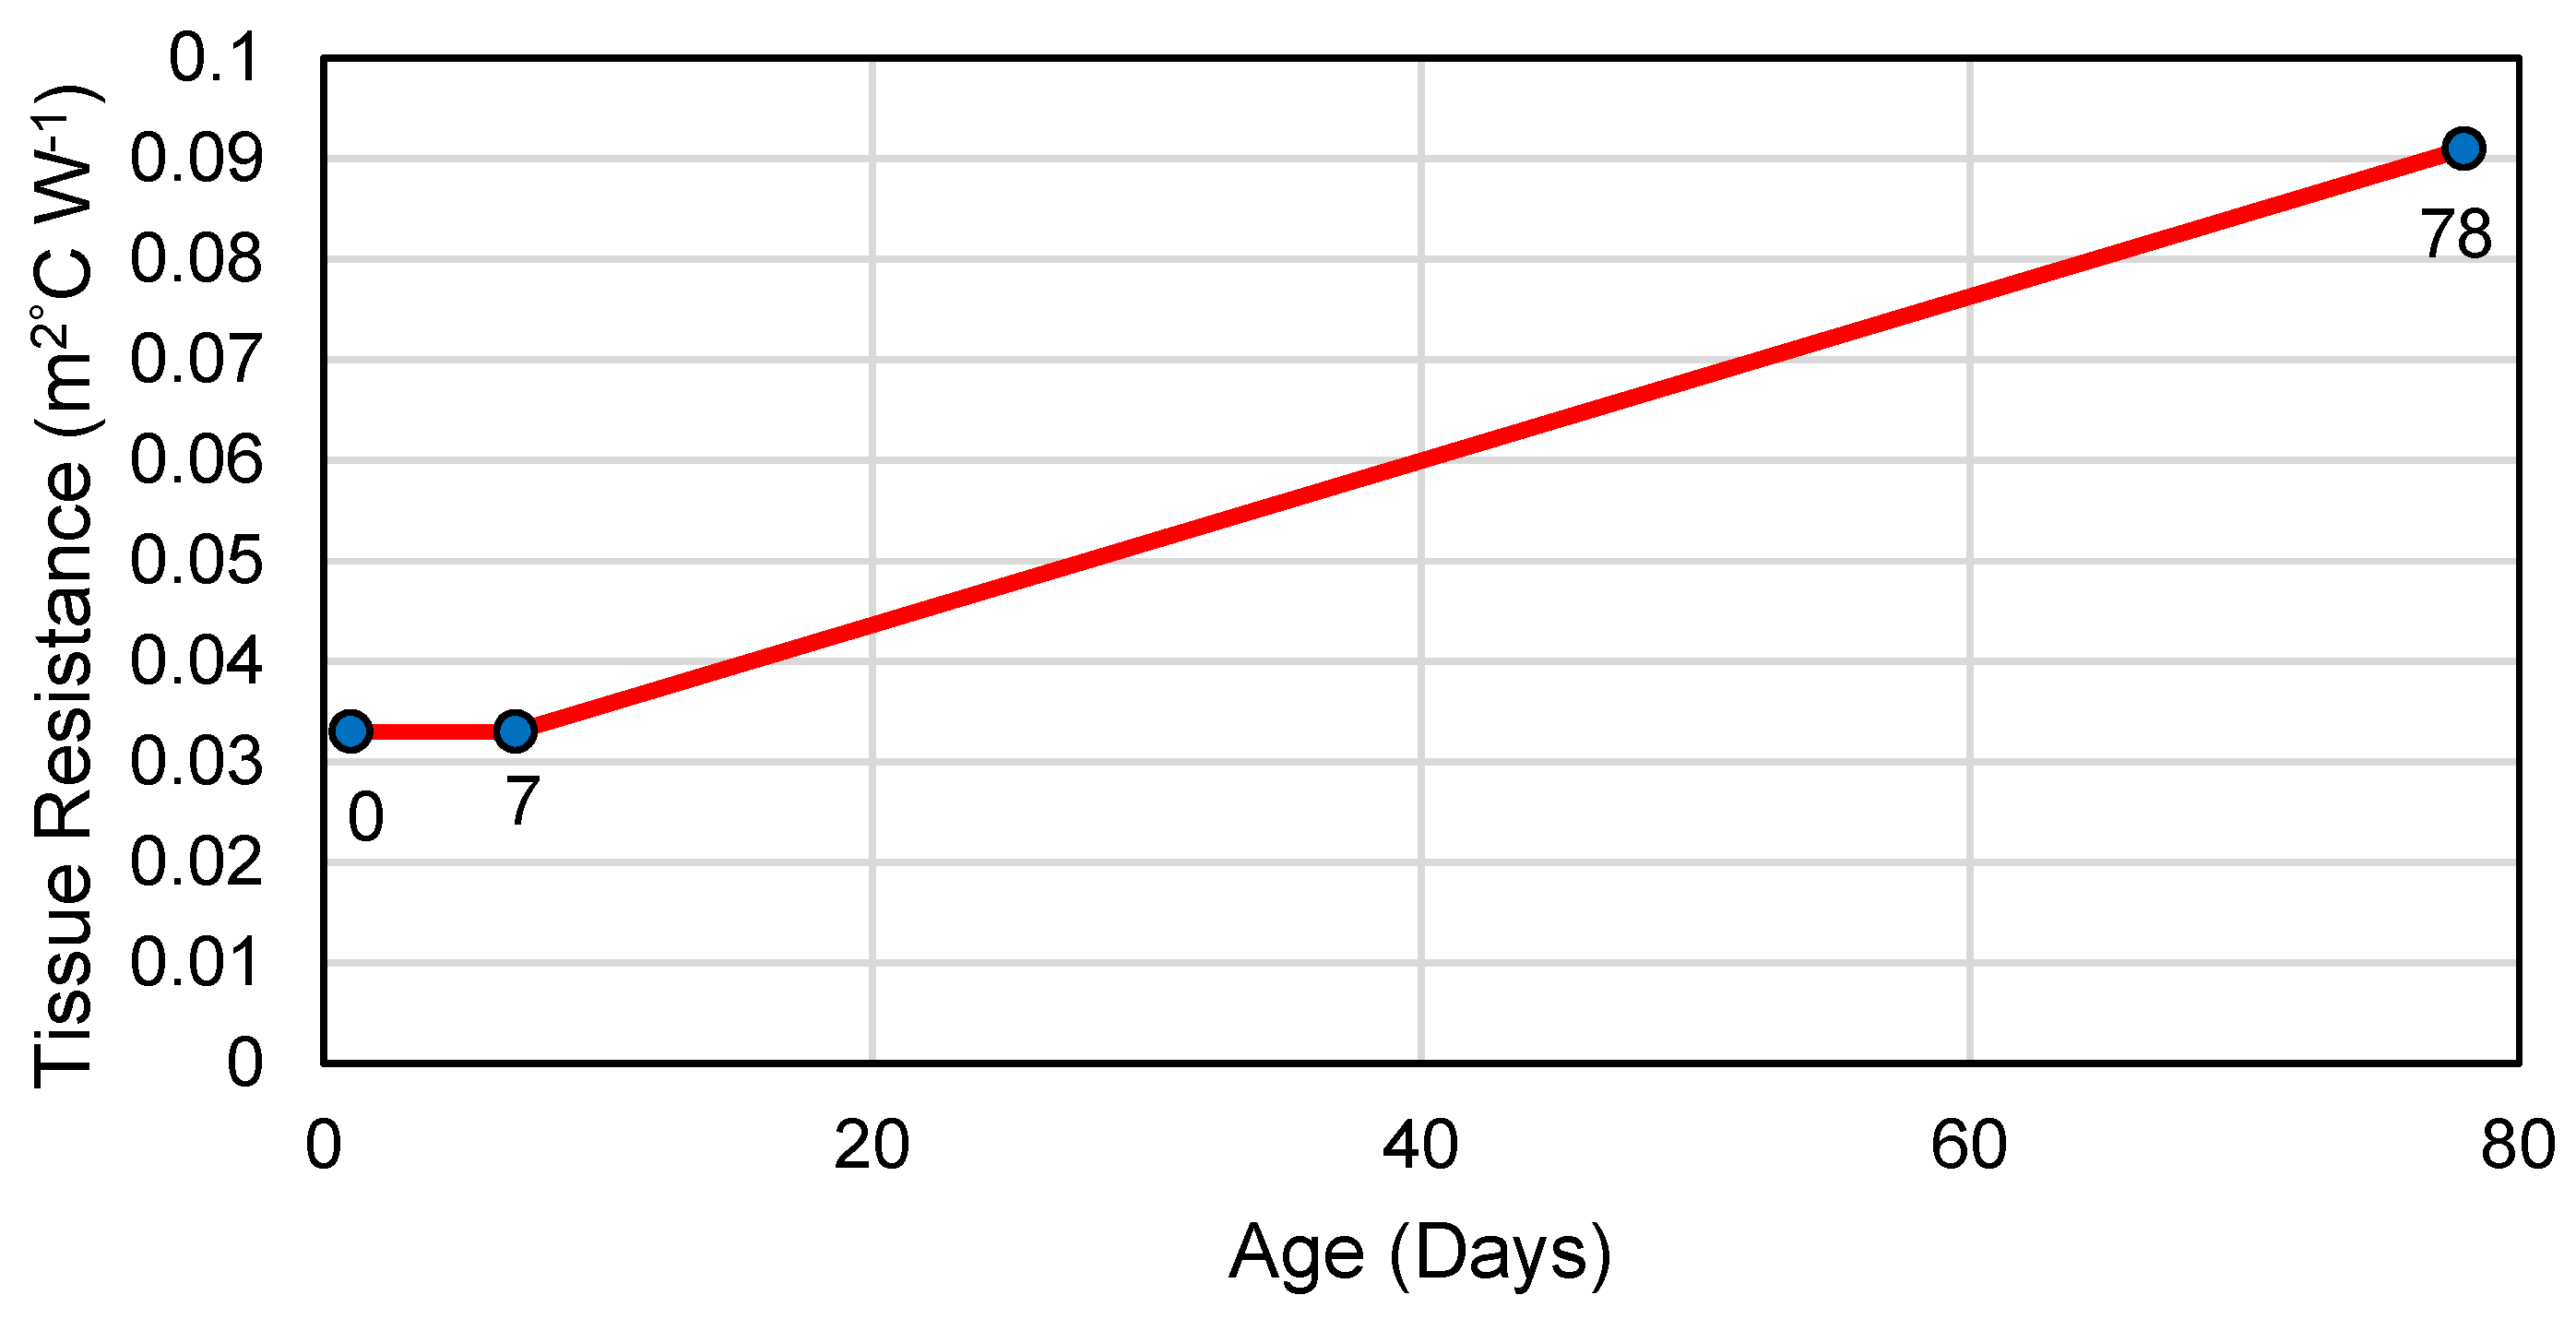
A tissue resistance curve was developed based on assumptions related to the piglet’s development of thermoregulatory capabilities due to the lack of data in the literature for piglet values. Tissue resistance values were fixed from birth to 7 days of age, as done in similar thermal balance models [4]. The tissue resistance from day 8 to 30 was determined using a linear regression of published values. Birth to 7 days of age values were obtained from Hoff et al. [4]. The maximum tissue resistance of a 50 kg pig and an assumed age (78 days) at 50 kg for PIC genetics was used as the high tissue resistance point in the age versus tissue resistance regression (Figure 2; 78 days; [31,32]). A linear regression of age (x-axis) and tissue resistance (y-axis) was used to determine the tissue resistance of the piglet between 7 and 30 days of age. This assumes that the piglet is of average weight and in good health. This approach was utilized as to use previous research reporting tissue resistance values at a given weight of a piglet and a nursery pig. Current data are lacking in tissue resistance values to better utilize current growth cures that are non-linear.
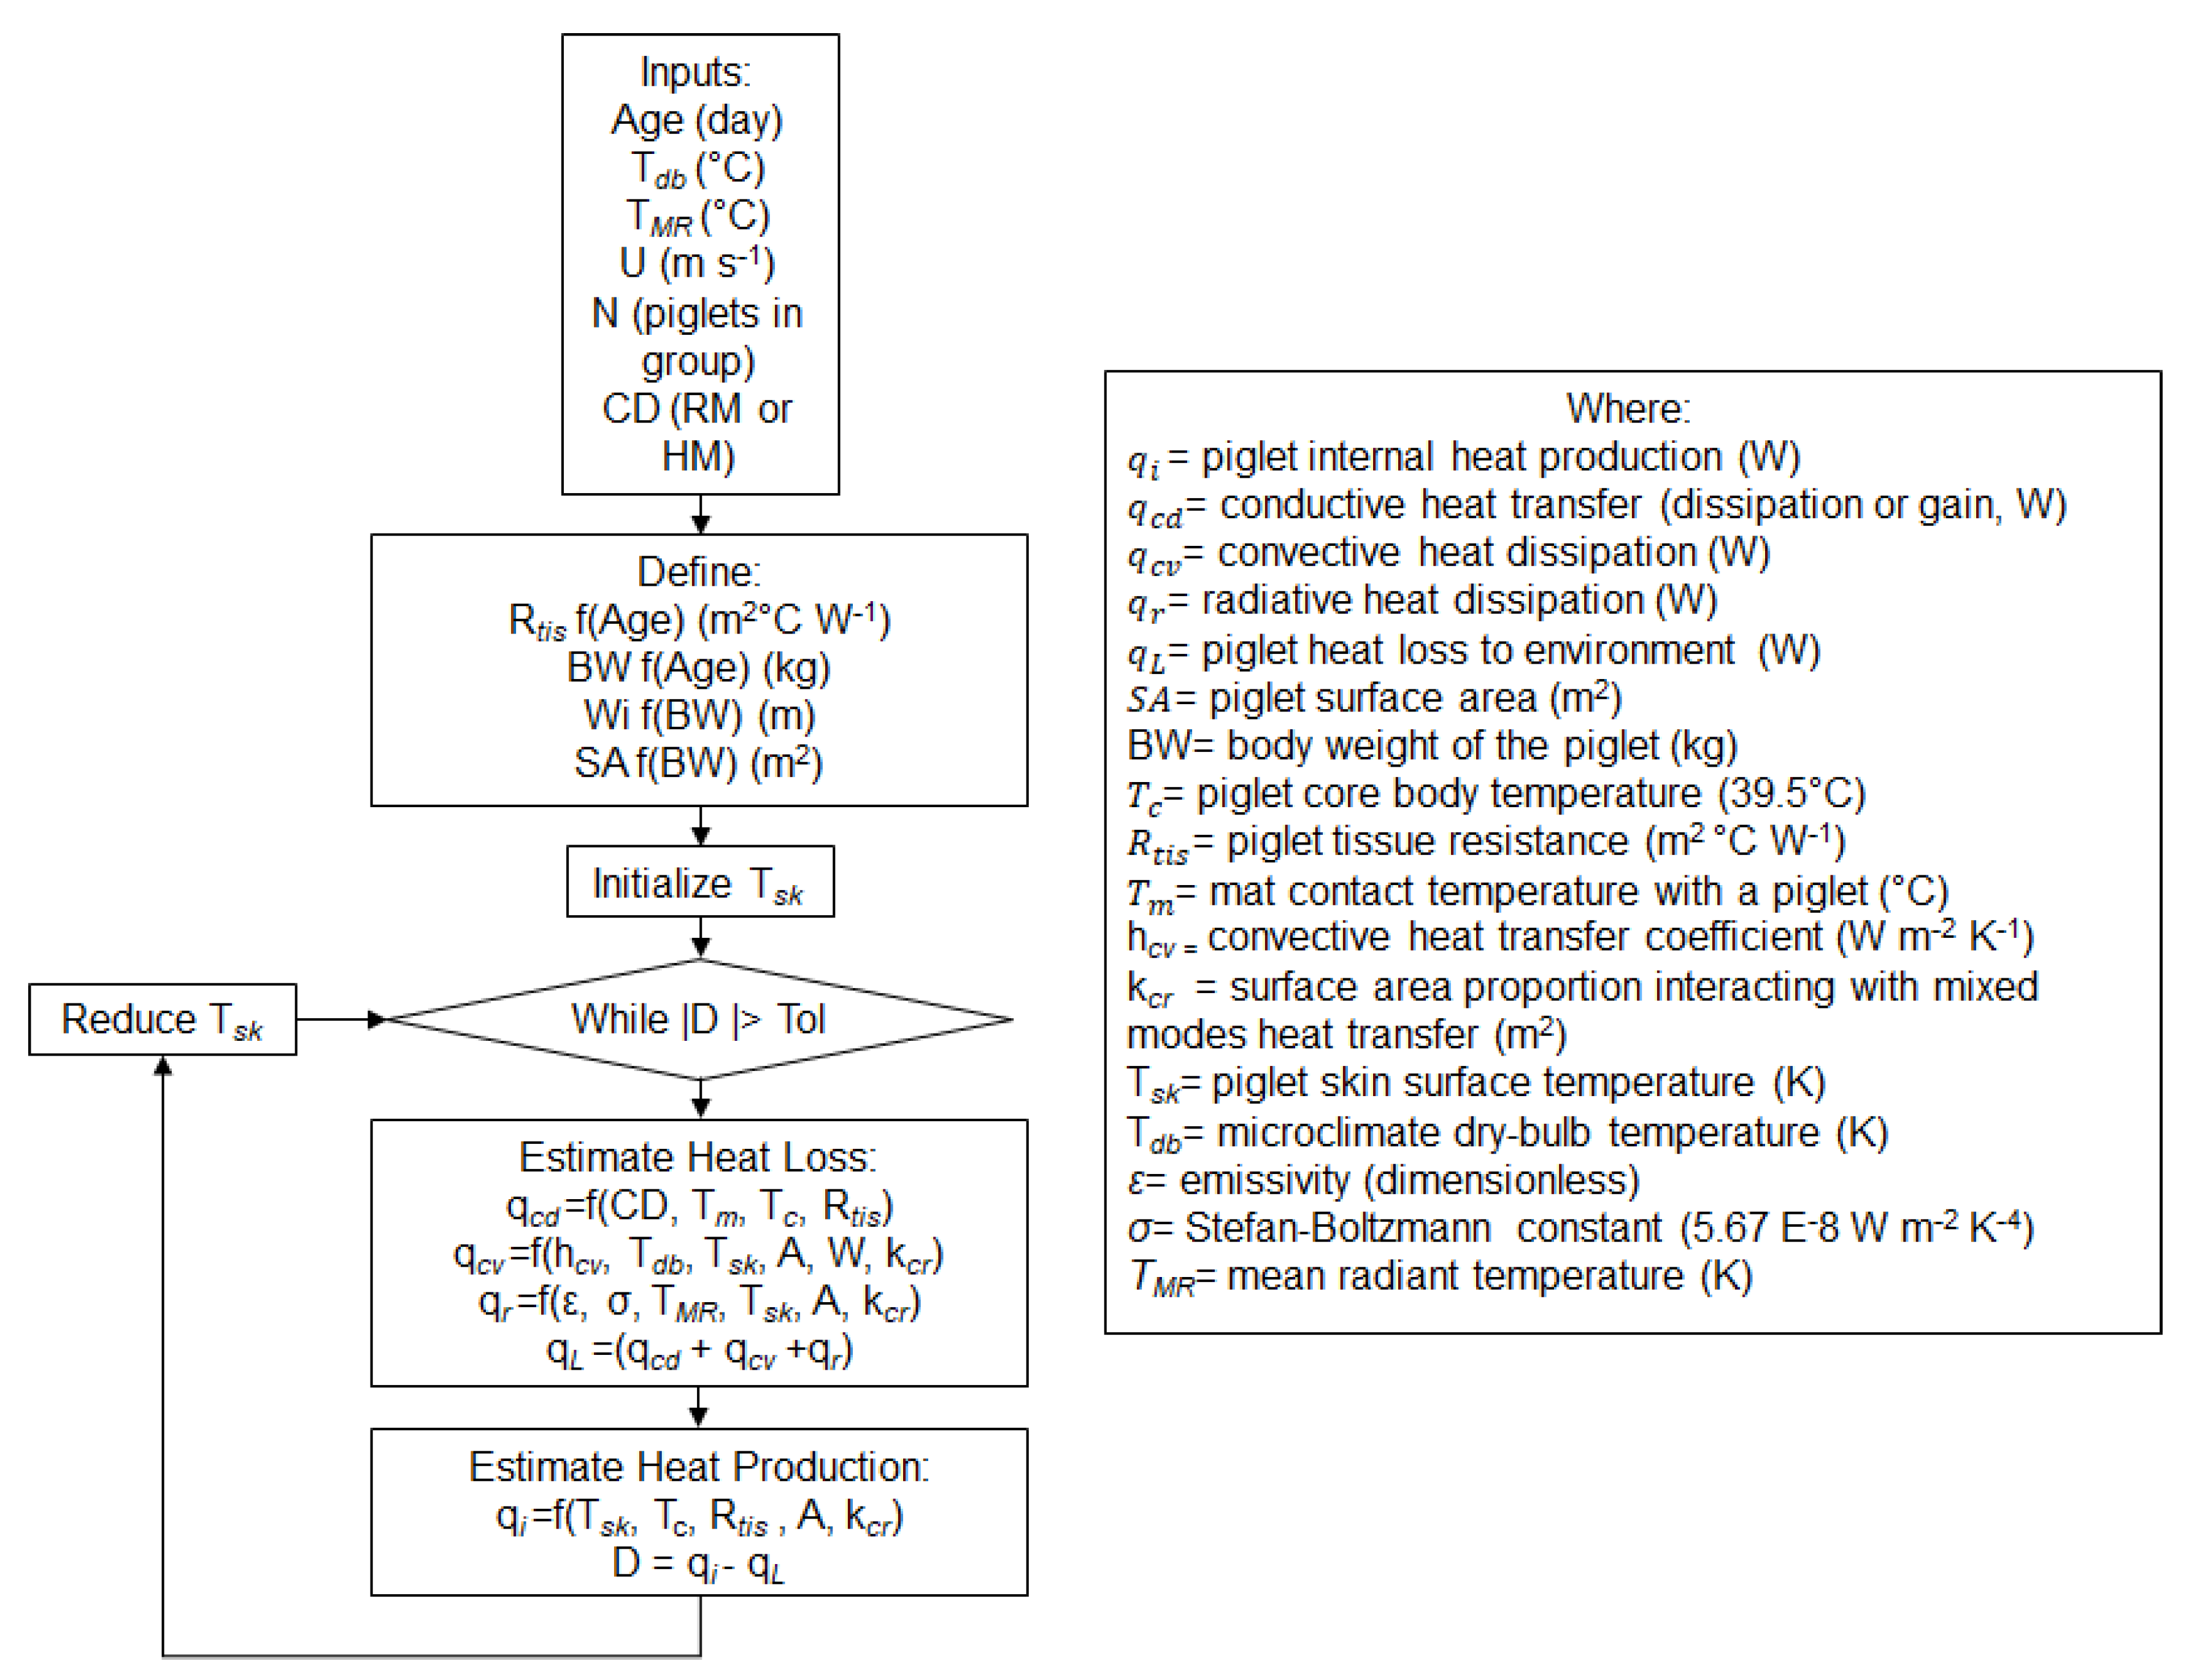
The steady-state thermal balance model, built into a custom software (Python 3.7, Python Software Foundation, Wilmington, DE, USA) using an integrated development platform [33]. The model started with key inputs of age and thermal environment parameters. The age dependent inputs of piglet dimensions were calculated, followed by the SA for the piglet and the number of piglets in the group (Equation (8); Figure 3). The model iterated Tsk until the core to skin heat transfer was balanced by skin to ambient, which included the conductive, convective, and radiative heat transfer. A tolerance of 0.5 mW was used as the tolerance in the absolute difference for convergence of the model.
2.2. EETcp Development
The Effective Environment Temperature (EET), as previously defined by [21], was based on the operative temperature [25] and incorporated both the Modified Ambient Temperature (MAT) and TMR. Operative temperature is defined as the temperature of an imaginary enclosure in which an animal exchanges the same amount of sensible heat via convection and radiation as the actual environment [25]. The MAT is the representative temperature of a naturally convective environment where an animal would exchange the same amount of sensible energy via convection as the actual environment [21]. The EET index infers that the piglet’s body is primarily interacting with its environment through convection and radiation and the piglet is standing in its environment.
This index neglects evaporative and conductive heat dissipation and assumes that the entirety of the piglet’s SA is interacting in mixed modes of heat transfer (i.e., standing). Two additions were included in the development of the EETcp (EET for creep area microclimate): (1) piglet parameters for both dimensions and tissue resistance over a variety of ages were used to calculate the MAT and (2) conductive heat dissipation. The first expansion incorporated the dimension curves from current commercial genetics [27], as well as the tissue resistance curve presented in the model development methods (Figure 2). These curves account for the growth of the piglet throughout lactation and the physiological development of the piglet for body regulation. The second expansion of EETcp (Equation (9)) included top surface mat temperature, contact surface with piglets, and a temperature proxy for the potential of heat dissipation or gain through conduction.
where
- EETcp = Effective Environment Temperature (°C)
- TMAT = Modified Ambient Temperature (°C, [21])
- kmm = surface area proportion interacting with mixed modes of heat transfer (0.80)
- kcd = surface area proportion interacting with conduction to the mat (0.20)
- Tmc = mat contact surface temperature (°C)
The mat contact temperature for rubber mats can be calculated by measuring the bottom mat surface temperature and assuming a piglet is lying on the mat with a known underside temperature assuming only one directional conduction to calculate the top surface temperature. Alternatively, for heat mats, mat surface temperature was estimated using the approach in Equation (4) [24].
2.3. Model and EETcp Application
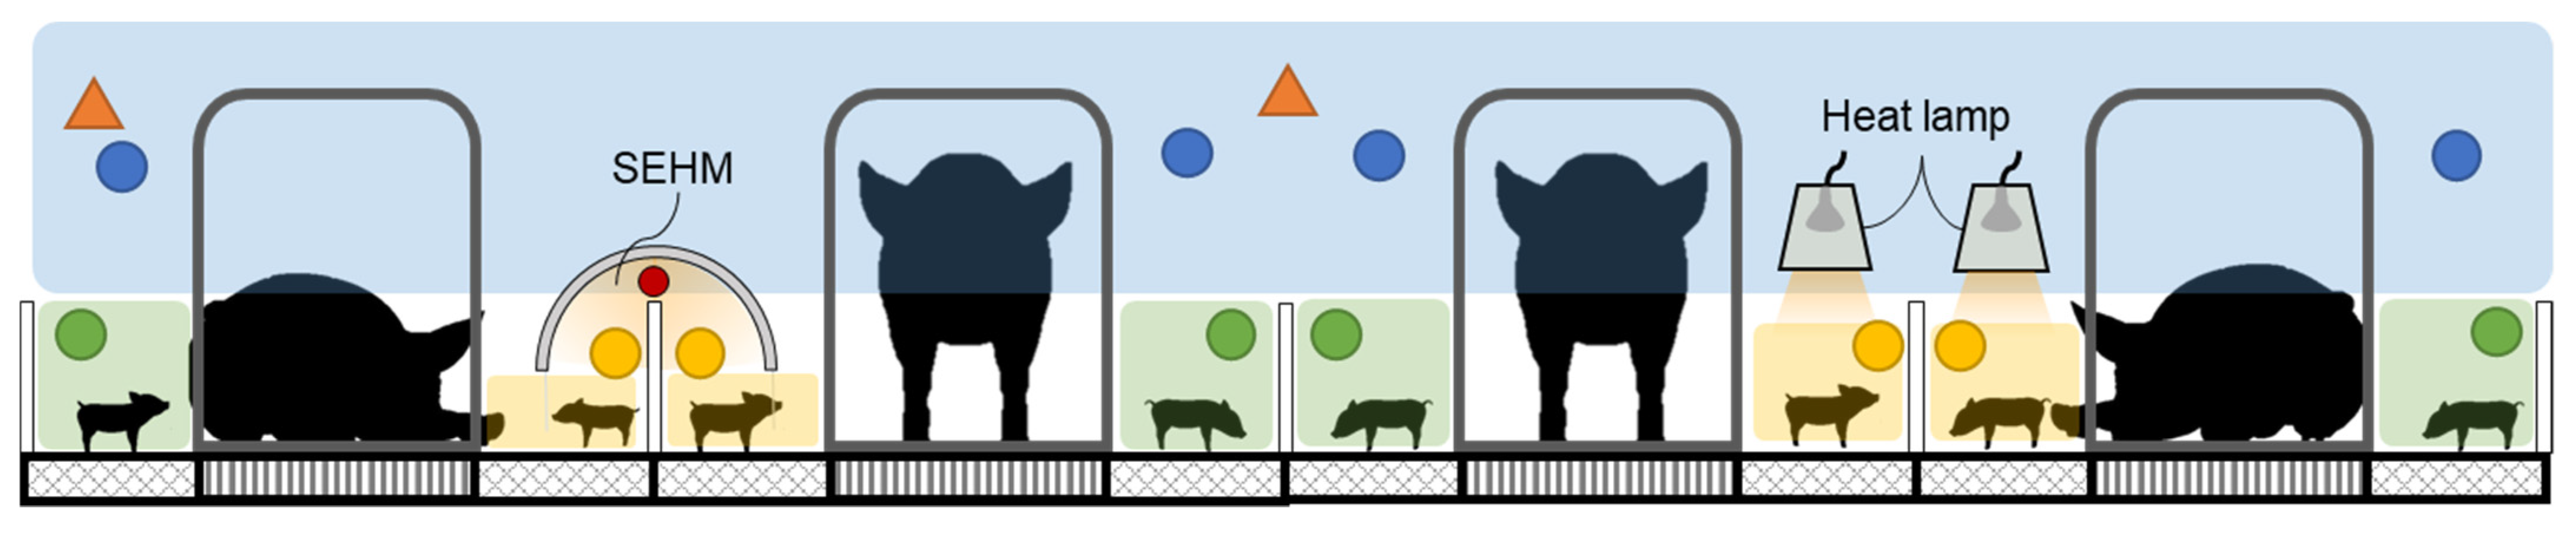
The steady-state thermal balance model was used to predict piglet heat production at combinations of Tdb, TMR, U, and Tm across a range of 0 to 30 days of age for one piglet, three piglets, and fourteen piglets in a group. Thermal environment conditions were selected from a database of thermal environment parameters collected in the Animal Thermal Environment Interaction Laboratory (ATEIL) from a farrowing turn with eight litters of commercial crossbred genetics [34]. Room 1 in ATEIL featured semi-enclosed heated microclimates (SEHM, Haven, FarrPro, Iowa City, IA, USA) and Room 2 featured heat lamps (HL; Retroliter®, QC Supply, Schyler, NE, USA with S475 bulbs, SATCO, Brentwood, NY, USA); for specifics on the data collected see [35]. Figure 4 depicts where in the farrowing stall data was collected using thermal environment sensor arrays (TESAs; Tdb, U, TMR, and Tmc). Data collected in ATEIL were utilized as the inputs for this data set as it was possible to measure and record all values needed in this laboratory setting. Temperature control was performed using a commercially available data acquisition and control system (Fusion, ControlTech, Bondurant, IA, USA). Room 1 was started at a temperature of 20.6 °C and Room 2 was started at 23.3 °C with the temperature in each room decreasing 0.3 °C per day. Heat lamp temperature management followed industry standard practices [1]. The SEHM temperature was controlled with an integrated control unit on board using a temperature curve previously used in research with the units [6]. The animal procedures are outlined in [35] and the animal use protocol for this study was approved by the Institutional Animal Care and Use Committee (IACUC #20-084). During the study, sows were housed in stainless steel bow bar crates (Standard Crate with anti-crush bar, Thorp Equipment, Thorp, WI, USA). Piglets were housed in a farrowing stall at all times while TE was being collected.
For use in the thermal model and EETcp the supplemental heat creep zone (SHCZ) was used and the conditions in the non-heated creep zone (NHCZ) were used for the heat mat model thermal conditions. The EETcp was calculated for each microclimate combination with a rubber mat and one piglet, such that a linear regression could be fit by day with EETcp on the x-axis and piglet heat production on the y-axis. Inverse of the linear regressions were used to calculate the EETcp for a given piglet heat production.
Piglet heat production data as a function of BW are limited in literature (on a per piglet basis). Total heat production (THP; Equation (10)) of the piglet was determined as the sum of the fasting heat production (FHP) estimated using Brody’s basal metabolic rate equation and the heat increment (HI) [36]. It was assumed the heat increment (HI) was 91% of the FHP value, which was based on the relationship between HI and FHP in relation to the metabolizable energy (ME) of the diet for a growing pig using the average reported values from literature [37,38,39,40]. It was assumed that the partitioning of energy for piglets was similar in nature to a growing pig, whereby key energy use is growth, thus justifying the use of growing pig data to estimate the THP.
where
- THP = total heat production (W)
- FHP = fasting heat production (W)
- HI = heat increment (W)
The THP was calculated as a function of BW (Equation (9)) for piglet BWs ranging from birth to weaning (28 days old) using the commercial genetics’ line growth curve ([27], PIC personal communication, 2020). This approach produced THP results similar to previous studies [18,41]. To determine the piglet’s heat production associated with the piglet’s thermoneutral zone, results from [41] were used as it was reported that piglets preferred an environment that allowed for 7.5 to 10.5 W of piglet heat production. Using this range and the predicted heat production of 9 W for a 1.5 kg piglet, a range of ±1.5 W was determined. The ideal EETcp was determined using the minimum and maximum thermoneutral piglet heat production values and the linear regressions fit from the model data.
The day 0 (day of farrowing) ideal piglet heat production values were offset from the predicted piglet heat production at birth weight by −3 W due to preliminary model results and observations of post-farrowing rectal temperature change impacted by microclimate. In this study the rectal temperature of eight litters of piglets (Room 1, n = 72 piglets across 4 litters and Room 2, n = 117 piglets across 4 litters) was taken hourly for the first eight hours post birth; specifics of this study can be found in Smith [35]. EETcp calculation was applied to the collected data for comparison of the two microclimate heat sources, SEHM and HL.
3. Results and Discussion
3.1. Model and EETcp
Results of the model for a variety of piglet and thermal inputs yielded logical outcomes. Without animal data or a simulated physical model for validation, it is difficult to thoroughly verify the accuracy of the model. Table 1 presents the results for day 1 of age for a set of Tdb and TMR from a sub-sample of TE parameters to show the impact of input values on the model results. Thermal environment conditions were the inputs into the thermal balance model, with the piglet heat production and corresponding skin temperature resulting from the model. The final two columns of Table 1 show the corresponding EET and EETcp for the given thermal environment conditions. The TE conditions representing the SEHM from the experimental data consistently provided an environment capable of dissipating less than the ideal piglet heat production (7.5 to 10.5 W) for the piglet day 0 to 7. When comparing the predicted piglet heat production from each of the two microclimates using collected data as inputs, it was noted that the Room 1 predicted piglet heat production was less than the predicted THP. When considering this in the context of the post-farrowing study, results showed the Room 1 piglets returned to a normal rectal temperature in less time [35], supporting the notion that at birth a warmer environment is ideal for the piglet, which is also noted in literature [2,4,10,41]. When considering the difference in the post-farrowing temperature experiment in conjunction with these results, it could be inferred that the warmer TE, above what is considered ideal, is more beneficial for the piglet especially on the day of farrowing. As such it would suggest that at the time of birth, a higher EETcp would be warranted to promote a faster recovery of piglet body temperature following drying.
Despite the lack of model validation with empirical data or data from a physical model similar to [4], the model has several relative advantages compared to similar models due to the incorporation of conduction. Predicted skin temperatures align with the range of temperatures (32 to 40 °C) reported for piglets lying under a HL and on a heat mat [24,29].
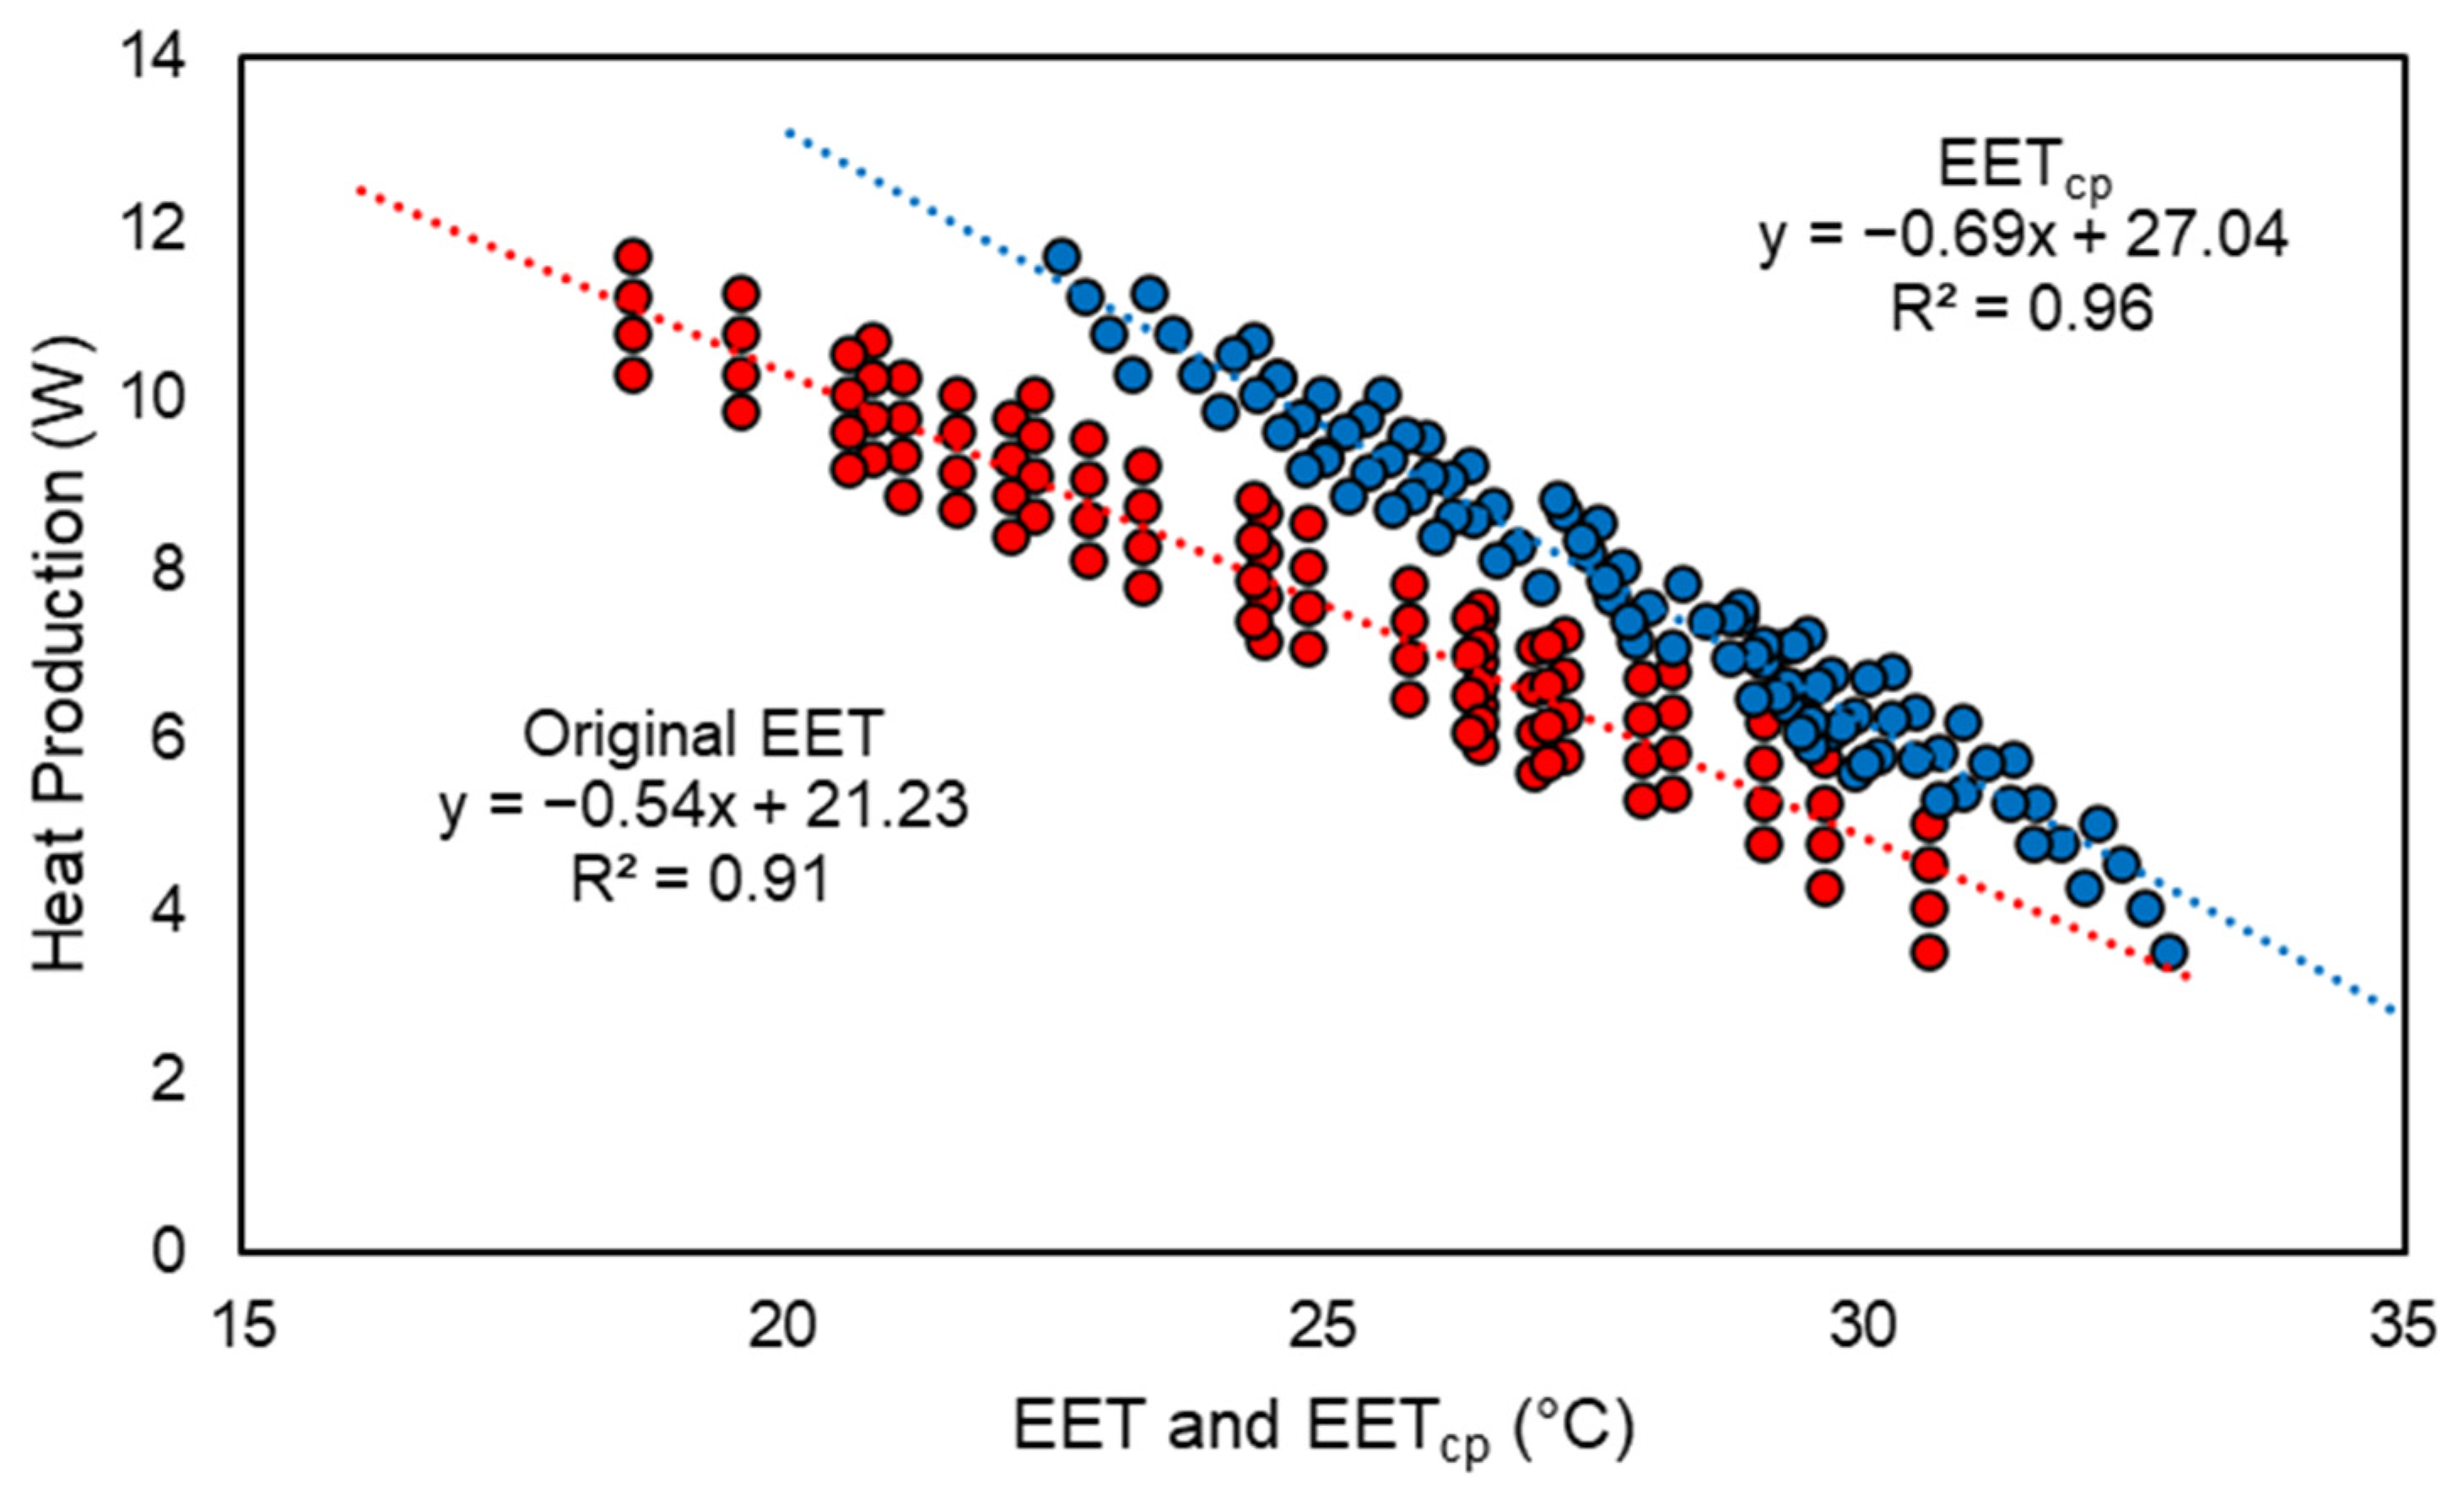
Addition of conductive heat transfer into EETcp allows for a more accurate evaluation of the creep area microclimate. Figure 5 depicts the comparison of EET [21] and EETcp for the simulated condition of a single piglet at 1 day of age on a rubber mat. The original EET fails to characterize the thermal environment when considering the conduction to the mat. The different intercepts and slopes of the two regressions is attributed to the EETcp more accurately depicting the piglet’s interaction with the environment through the inclusion of conduction and allocating different values of SA to the convection and radiation components. The shift in EETcp warranted the reclassification of the ideal thermoneutral range that was derived from previous literature.
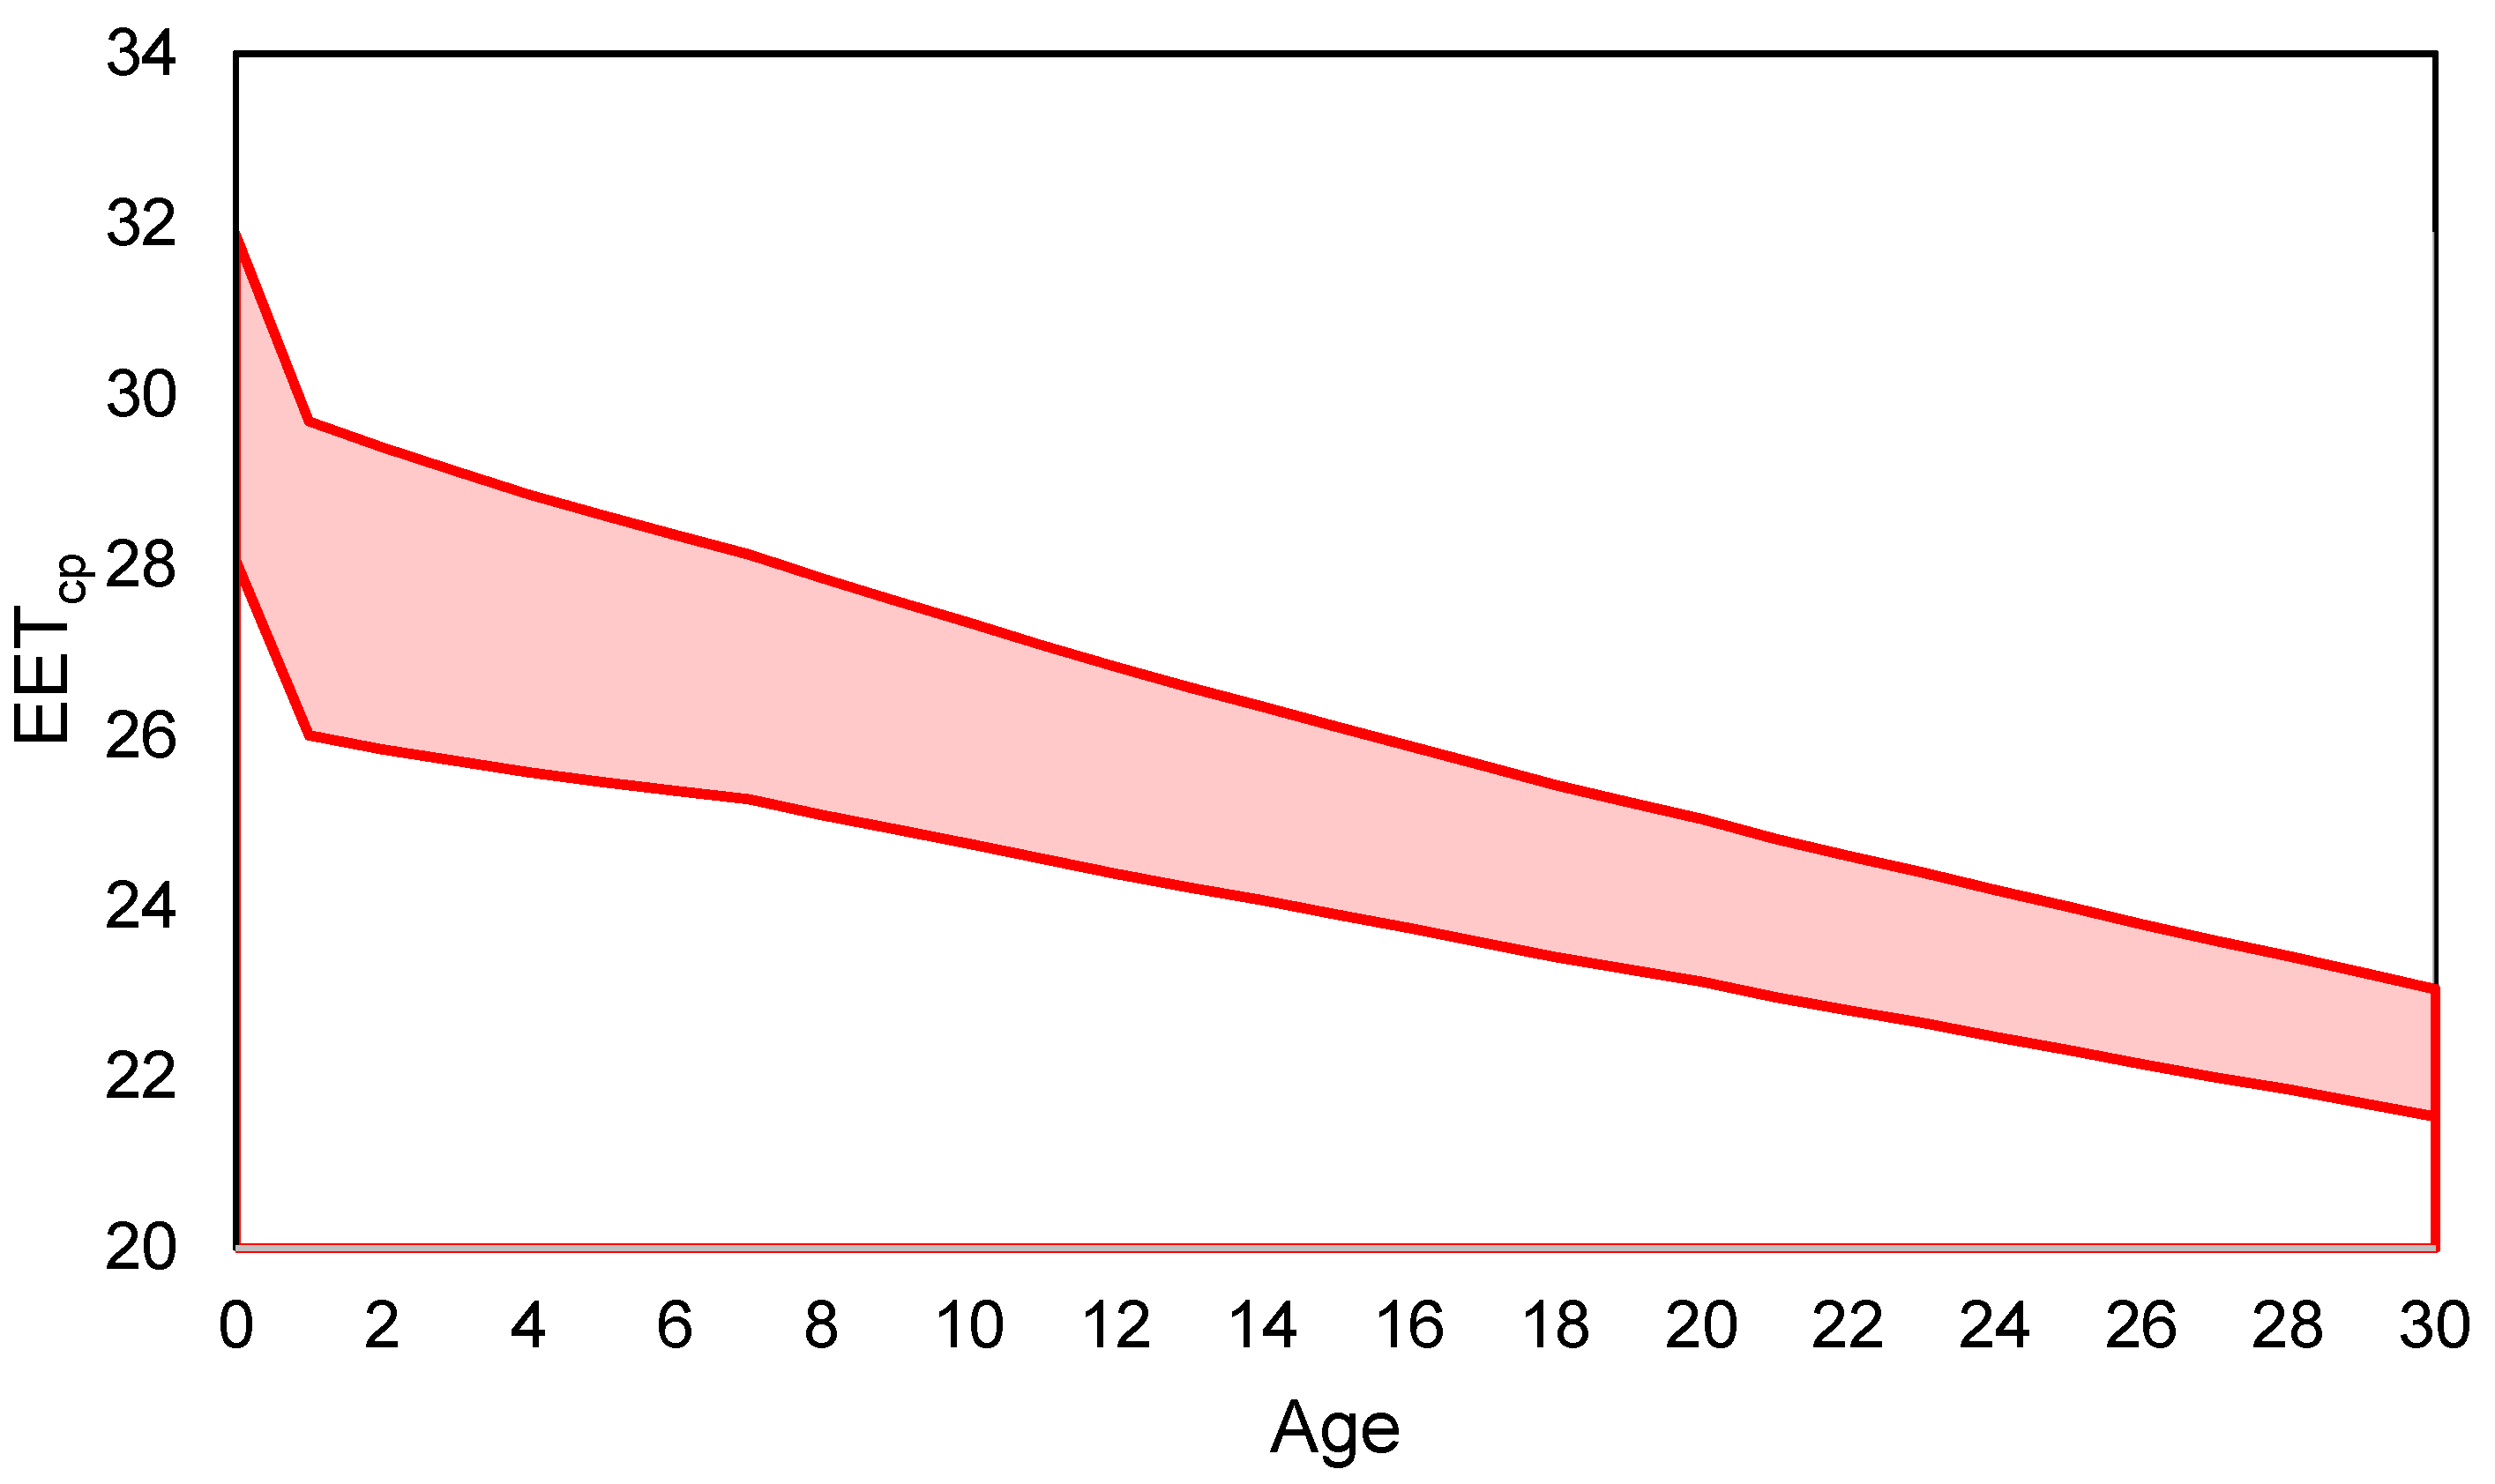
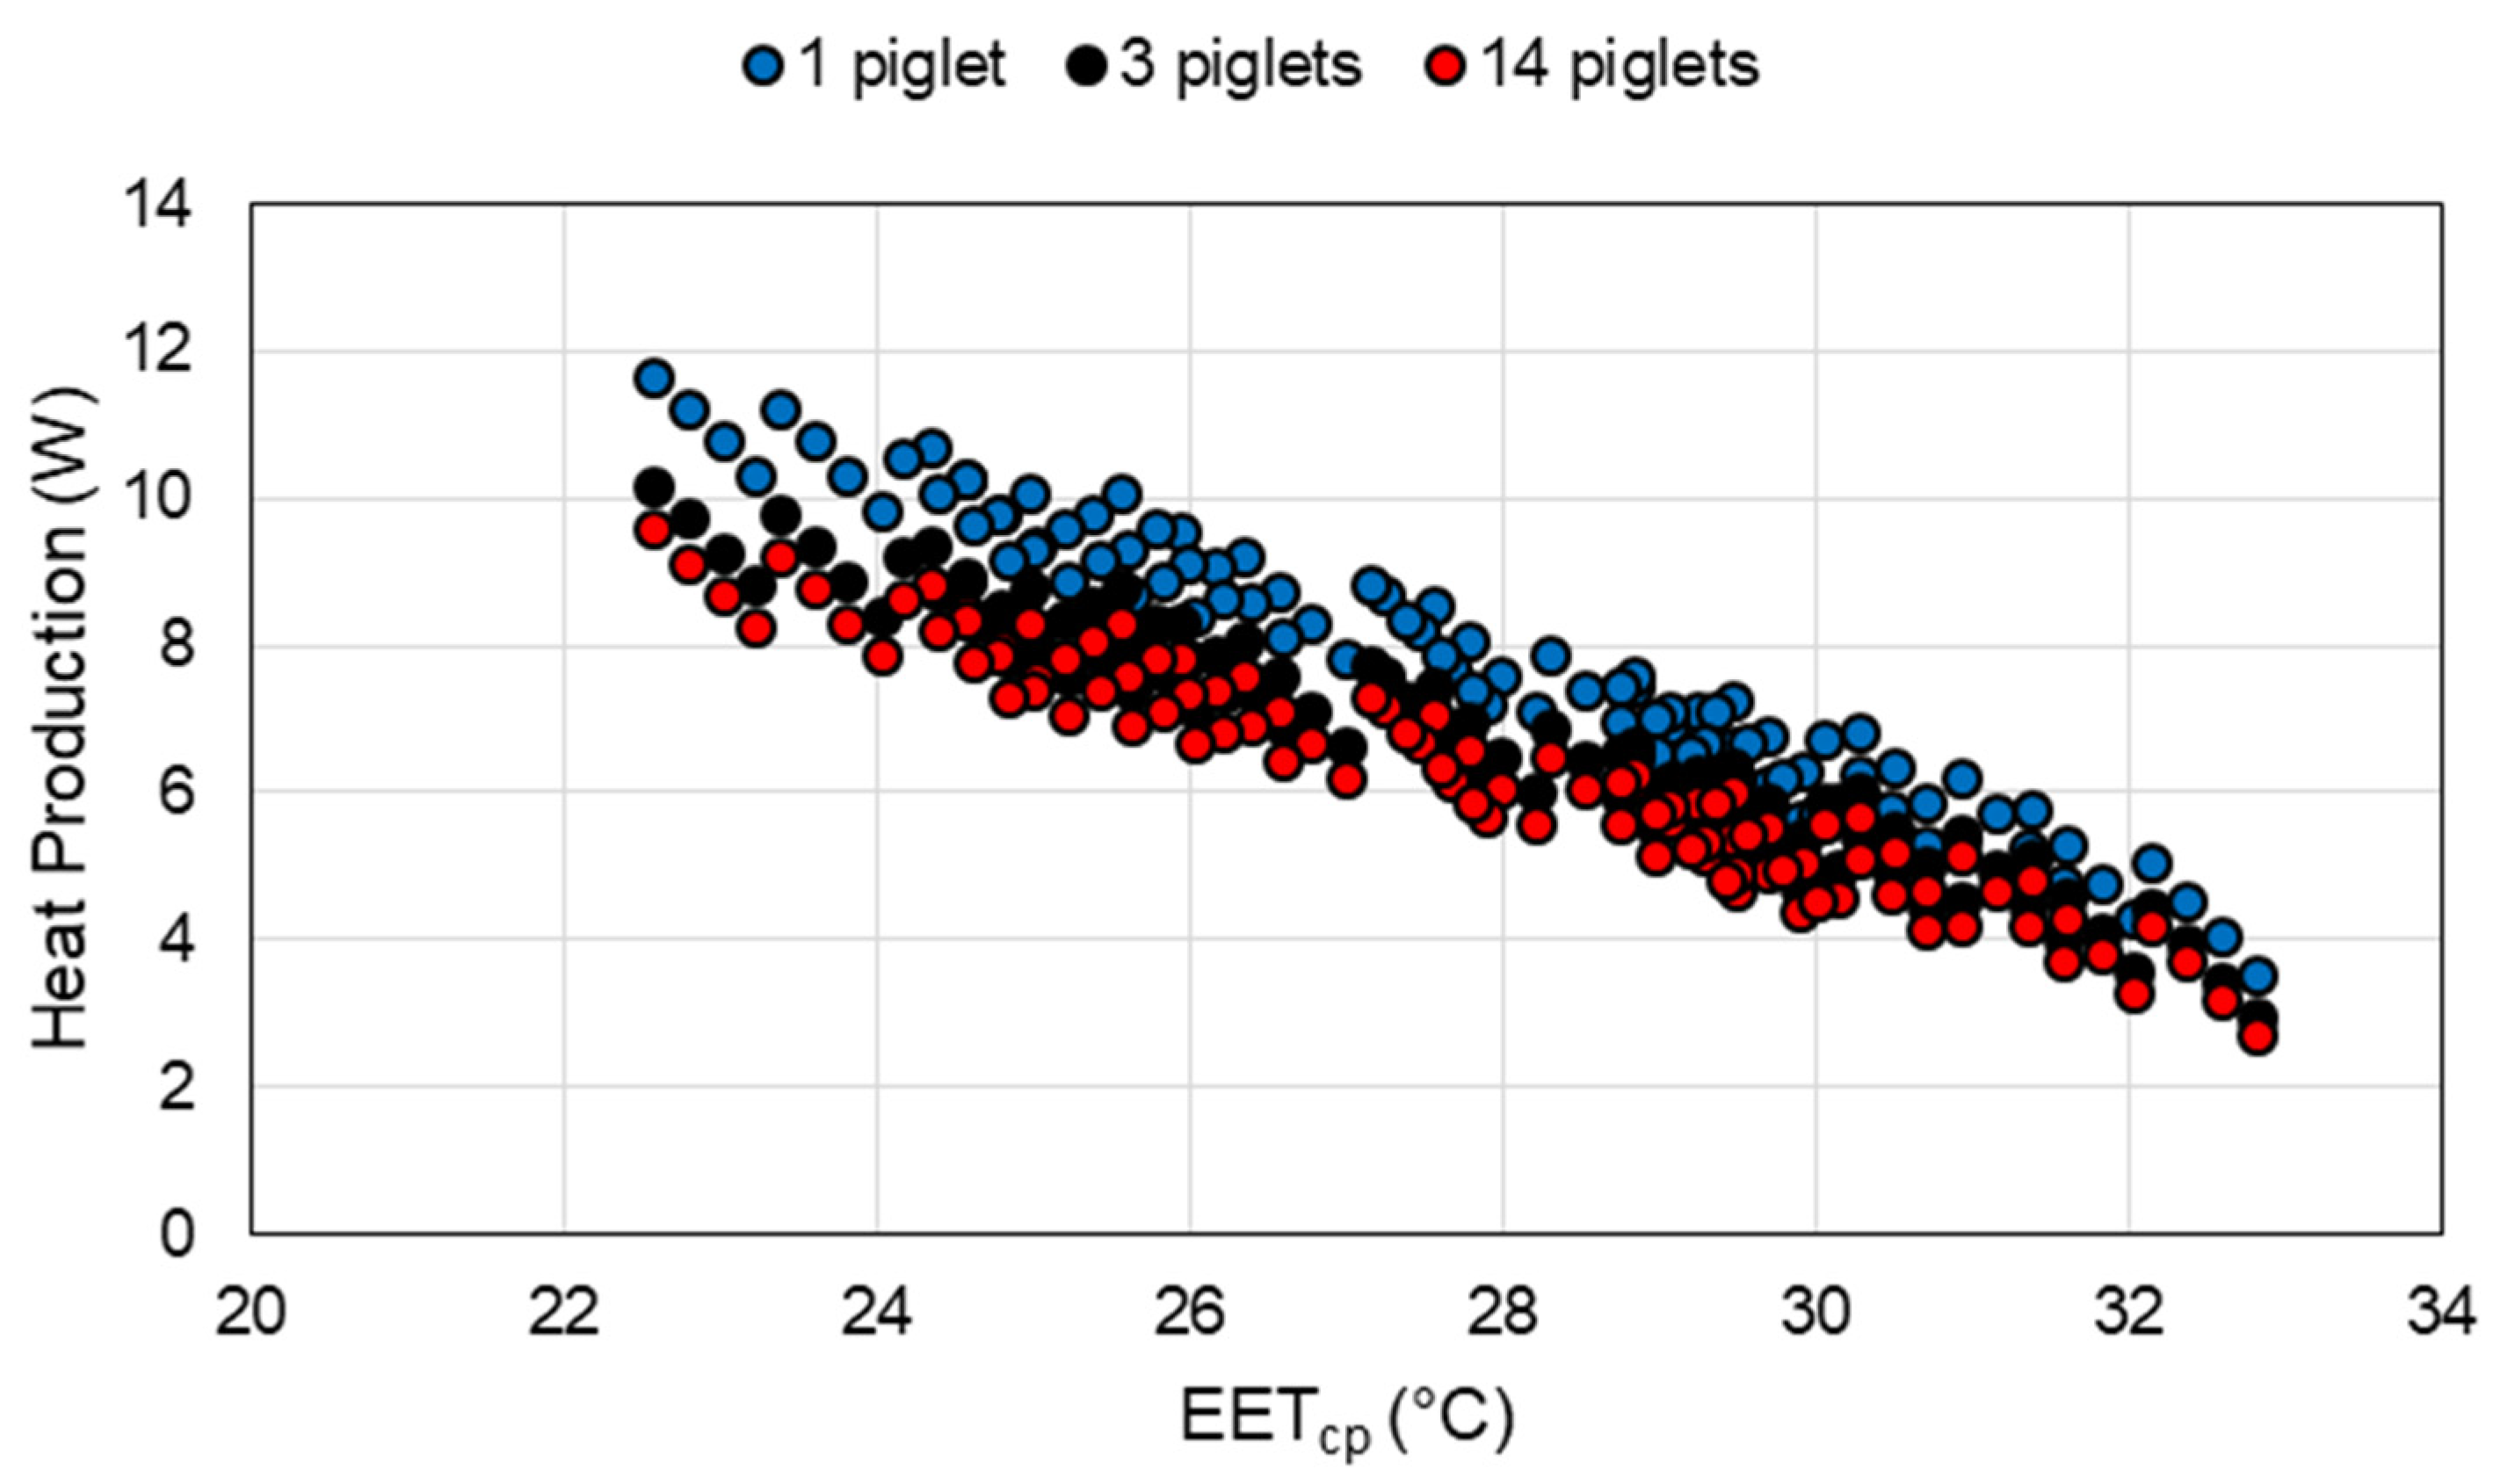
The ideal EETcp range (Figure 6) includes piglets age from birth (day 0) to 30 days of age. Note the major shifts in the range occur at one day of age following the offset for a warmer EETcp for birth and seven days of age when the tissue resistance of the piglet begins to increase. The major limitation of EET and EETcp is that they represent the thermal environment for a single piglet. In commercial production, piglets are often housed in litters that consist of multiple piglets in the creep area at one time. As shown in Figure 7, for groups of piglets, assuming no piling, piglet heat production is reduced with an increase in group size due to the proportion of SA exposed to convective and radiative modes of heat transfer being reduced.
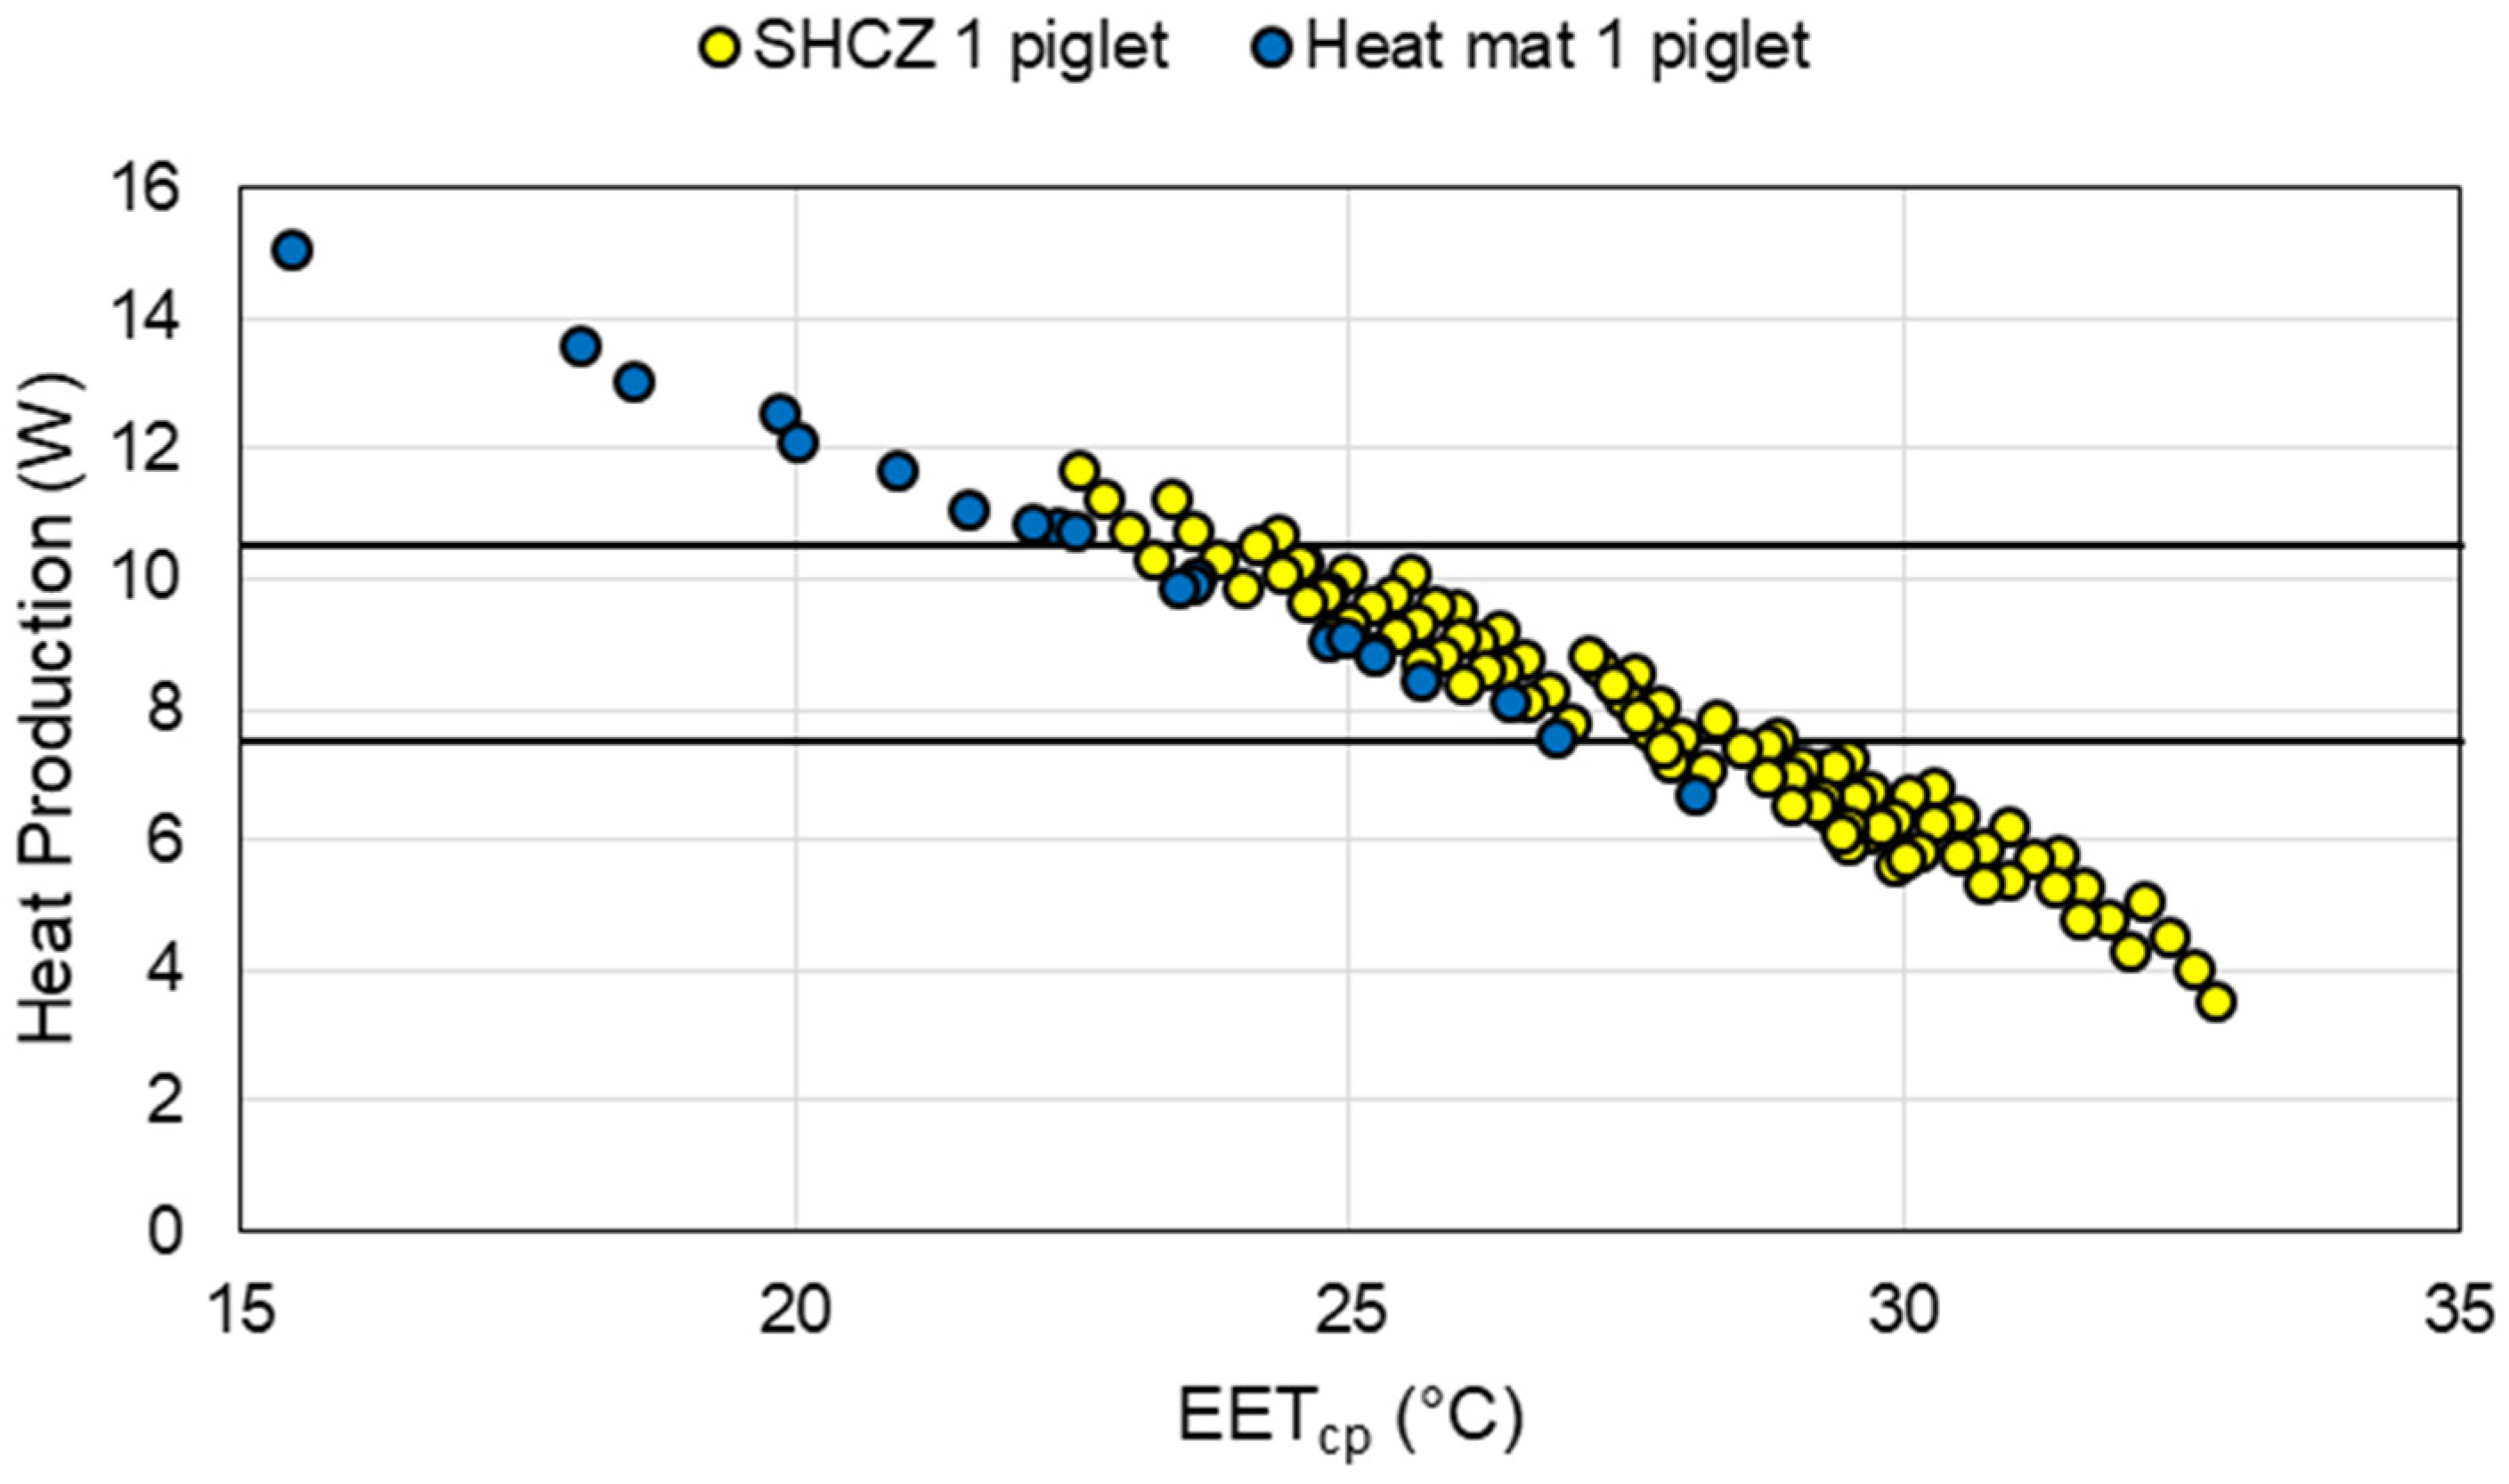
The heat mat scenario evaluated with the thermal balance model showed that the heat mat model performed as expected (Figure 8). Results of a worst-case scenario, that is, only one piglet on the heat mat, showed that in certain environments it is an effective supplemental heat source for piglets. A drawback to heat mats from a thermal environment standpoint is the lower TMR and Tdb in the creep area, resulting in a lower skin temperature. To overcome this, it would require the macroenvironment temperature to be warmer, above the sow preference temperature, to ensure the creep area microclimate is adequate for the piglets. Another significant disadvantage of heat mats is the increased contact temperature, which may cause the piglet’s heat gain to be greater than desired; [29] suggested a contact temperature below 49 °C. A downside to this model with respect to heat mats is it does not account for the relationship between mat contact temperature and occupancy (piglet occupying the area or exposed to ambient environment) of the area, which could be resulting in an over prediction of the contact temperature and thus heat gain [42].
3.2. EETcp Application
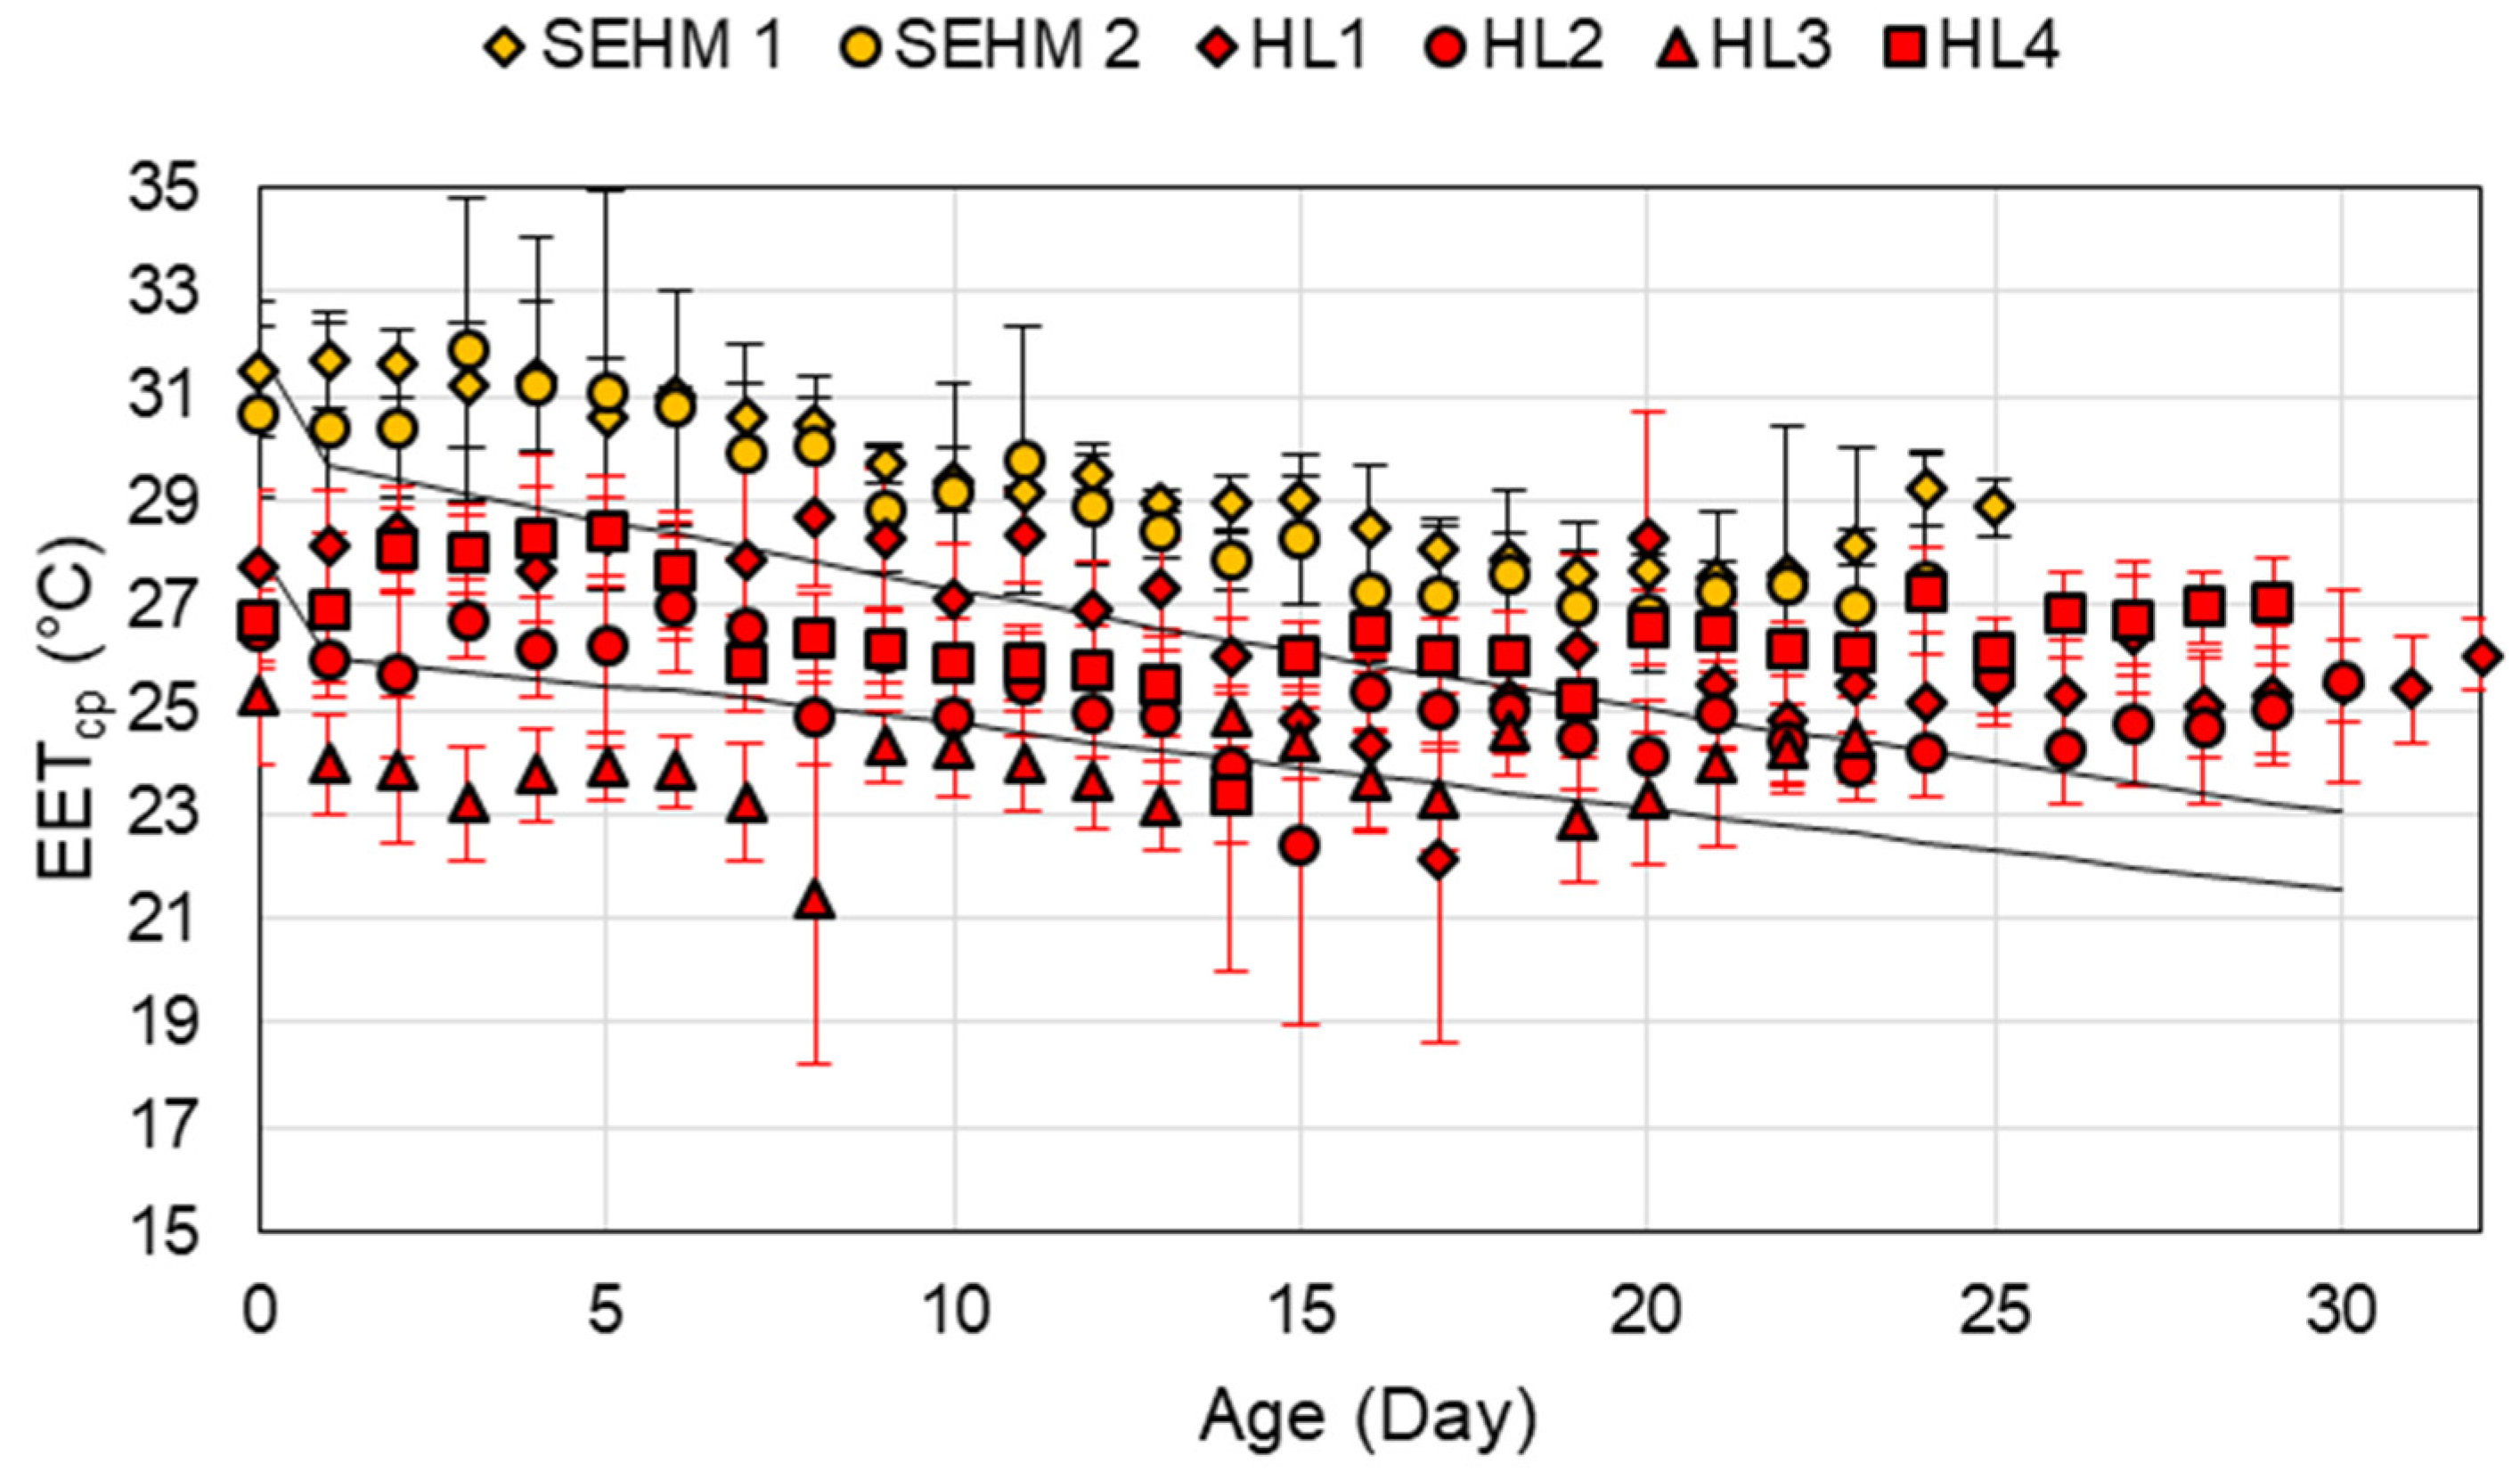
Application of the EETcp calculation to the experimental data showed microclimate differences between the two supplemental heat sources (Figure 7). Both SEHM provided similar microclimate environments aligned with the programmed set point curves. Conversely, evaluation of the HL microclimate with EETcp showed variation among farrowing stalls. The age difference of the piglets in Room 2 (maximum 10 days) was significantly greater than in Room 1 (maximum 1 day) with the average age in Room 2 being three days older. This likely added variance to the environment as the room temperature setpoint was not consistent with each litter’s day of age. Initially at birth, SEHM average EETcp was within the ideal range previously presented, then for the duration of lactation, was greater than the ideal range, whereas all four HLs were not in the ideal range at birth; HL EETcp average values were within the ideal range most days.
This resulting difference in EETcp between the HL and SEHM offers a unique insight into field study results with the SEHM. It was shown in a commercial study that the SEHM significantly reduced the occurrence of over-lay mortalities [6], which most commonly occur during the first few days following farrowing, therefore suggesting that the warmer environment is a contributing factor. As EETcp and the model assumes a single piglet in good health, incorporation of other parameters that describe commercial production settings, including multiple piglets and varying health and body conditions, will help refine an ideal thermal environment index for piglets.
The increasing trend of the EETcp starting at around 21 days of age (Figure 9) suggests that the piglets are more effective at thermoregulation and require a lower EETcp. Recent studies have predicted the supplemental heat needs for piglets based on Tdb and BW resulting in conditions late in lactation needing no supplemental heat [10]. These results align with the increase in EETcp and the average weight at 21 days of age to support the lack of supplemental heat need for the piglets.
Overall, the EETcp comparison highlights the benefit of the PLF technology, consistent environment between both SEHM units, while the HL, manual control, was highly variable. The inability of the HL to maintain the ideal EETcp early on could be attributed to air drafts, which are a downside of HL or the manual control; however, later in age the HL is capable as the piglet becomes less susceptible to air drafts having a major impact on their ability to maintain body temperature. In commercial settings, maintaining a draft free environment for HL is key through proper air inlet management. This study also enlightens the relationship of the piglet’s microclimate and production performance. The ideal range of a single thermal index for the microclimate requires further refinement to better encompass the multiple parameters that could be impacting a litter overall.
4. Conclusions
The results of the model and EETcp highlight key aspects of the piglet’s microclimate and the impact on the piglet’s heat production. Improvements to the model’s handling of conduction for heat mats is warranted to improve the accuracy. Further refinement of the ideal EETcp to encompass aspects of production such as number of piglets, health status, and body condition could greatly improve the applicability of the index. Validation of the model via physical model systems or animal studies is warranted.
The characterization and control of the piglet’s microclimate is an important venture for future precision livestock farming technology development The potential uses of the model and EETcp for PLF technologies could effectively control the supplemental heat source by accounting for all heat transfer modes that impact the piglet. The comparison of the two supplemental heat source microclimates highlighted key aspects of both units.
- (1)
- The SEHM is capable of consistent microclimate environments across multiple units covering different creep areas.
- (2)
- Manual adjustment of HL height results in variable environments within a room.
The future use of this type of model and EETcp in PLF technologies has the potential to improve energy efficiency and animal production and welfare across any type of supplemental heat source.
Author Contributions
Conceptualization, B.C.S., B.C.R. and S.J.H.; data curation, B.C.S.; formal analysis, B.C.S., B.C.R. and S.J.H.; funding acquisition, B.C.R.; methodology, B.C.S., B.C.R. and S.J.H.; project administration, B.C.R.; supervision, B.C.R.; writing—original draft, B.C.S.; writing—review and editing, B.C.R. and S.J.H. All authors have read and agreed to the published version of the manuscript.
Funding
This work is a product of the Iowa Agriculture and Home Economics Experiment Station, Ames, Iowa. Project Number IOW04100 is sponsored by the Hatch Act and State of Iowa funds. The content of this article is however solely the responsibility of the authors and does not represent the official views of the USDA.
Institutional Review Board Statement
This study was approved by the Iowa State University Institutional Animal Care and Use Committee (IACUC #20-084, approved 15 June 2020).
Informed Consent Statement
Not Applicable.
Data Availability Statement
The data presented in this study are available on request from the corresponding author.
Acknowledgments
The authors would like to thank Sara Weyer, Dylan Riedemann, Gabe Greiner, Devri Cliburn, Julia Bowman, Sam Te Slaa, and Chad Schechinger for their work during the thermal environment data collection experiment.
Conflicts of Interest
The authors declare no conflict of interest. The funders had no role in the design of the study; in the collection, analyses, or interpretation of data; in the writing of the manuscript, or in the decision to publish the results.
References
- PIC. PIC Sow and Gilt Manual 2015; PIC: Henersonville, TN, USA, 2015. [Google Scholar]
- Varley, M.A. (Ed.) The Neonatal Pig Development and Survival; CAB International: Wallingford, UK, 1995; ISBN 0 85198 925 X. [Google Scholar]
- Mount, L.E. Adaptation to Thermal Environment; Edward Arnold Limited: London, UK, 1979; ISBN 0-7131-2739-2. [Google Scholar]
- Hoff, S.J.; Janni, K.A.; Jacobson, L.D. Modeling Newborn Piglet Thermal Interactions with a Surface Energy Balance Model. Trans. ASAE 1993, 36, 151–159. [Google Scholar] [CrossRef] [Green Version]
- Stinn, J.P.; Xin, H. Heat Lamp vs. Heat Mat as Localized Heat Source in Swine Farrowing Crate; Iowa State University, Digital Repository: Ames, IA, USA, 2014. [Google Scholar]
- Smith, B.C.; Ramirez, B.C.; Hoff, S.J.; Greiner, L.L. Pilot-Scale Assessment of a Novel Farrowing Creep Area Supplementary Heat Source. Animals 2019, 9, 996. [Google Scholar] [CrossRef] [PubMed] [Green Version]
- Gorczyca, M.T.; Milan, H.F.M.; Maia, A.S.C.; Gebremedhin, K.G. Machine Learning Algorithms to Predict Core, Skin, and Hair-Coat Temperatures of Piglets. Comput. Electron. Agric. 2018, 151, 286–294. [Google Scholar] [CrossRef] [Green Version]
- Morello, G.M.; Lay, D.C., Jr.; Rodrigues, L.H.A.; Richert, B.T.; Marchant-Forde, J.N. Microenvironments in Swine Farrowing Rooms: The Thermal, Lighting, and Acoustic Environments of Sows and Piglets. Sci. Agric. 2018, 75, 1–11. [Google Scholar] [CrossRef] [Green Version]
- Berckmans, D. General Introduction to Precision Livestock Farming. Anim. Front. 2017, 7, 6–11. [Google Scholar] [CrossRef]
- Milan, H.F.M.; Campos Maia, A.S.; Gebremedhin, K.G. Prediction of Optimum Supplemental Heat for Piglets. Trans. ASABE 2019, 62, 321–342. [Google Scholar] [CrossRef]
- Mount, L.E. Radiant and Convective Heat Loss from the Newborn Pig. J. Physiol. 1964, 173, 96–113. [Google Scholar] [CrossRef] [Green Version]
- Mount, L.E. The Heat Loss from Newborn Pigs to the Floor. Res. Vet. Sci. 1967, 8, 175–186. [Google Scholar] [CrossRef]
- Andersen, I.L.; Haukvik, I.A.; Bøe, K.E. Drying and Warming Immediately after Birth May Reduce Piglet Mortality in Loose-Housed Sows. Animal 2009, 3, 592–597. [Google Scholar] [CrossRef] [Green Version]
- Vande Pol, K.D.; Tolosa, A.F.; Shull, C.M.; Brown, C.B.; Alencar, S.A.S.; Ellis, M. Effect of Drying and/or Warming Piglets at Birth on Rectal Temperature over the First 24 h after Birth. Transl. Anim. Sci. 2020, 4, txaa184. [Google Scholar] [CrossRef]
- Brown-Brandl, T.M.; Hayes, M.D.; Xin, H.; Nienaber, J.A.; Li, H.; Eigenberg, R.A.; Stinn, J.P.; Shepherd, T. Heat and Moisture Production of Modern Swine. ASHRAE Trans. 2014, 120, 469. [Google Scholar]
- Stinn, J.P.; Xin, H. Heat and Moisture Production Rates of a Modern U.S. Swine Breeding, Gestation, and Farrowing Facility. Trans. ASABE 2014, 1517–1528. [Google Scholar] [CrossRef] [Green Version]
- Hayes, M.D.; Brown-Brandl, T.; Stinn, J.P.; Li, H.; Xin, H.; Nienaber, J.A.; Shepherd, T.A. House-Level Moisture Production of Modern Swine by Age, Temperature and Source; ASABE: Kansas City, MI, USA, 2013. [Google Scholar]
- Johnson, J.S.; Zhang, S.; Morello, G.M.; Maskal, J.M.; Trottier, N.L. Technical Note: Development of an Indirect Calorimetry System to Determine Heat Production in Individual Lactating Sows. J. Anim. Sci. 2019, 97, 1609–1618. [Google Scholar] [CrossRef]
- DeShazer, J.A. Livestock Energetics and Thermal Environmental Management, 1st ed.; American Society of Agricultural and Biological Engineers: St. Joesph, MI, USA, 2009; ISBN 1-892769-74-3. [Google Scholar]
- Mostaco, G.M.; Miranda, K.O.S.; Condotta, I.C.F.S.; Salgado, D.D.A. Determination of Piglets’ Rectal Temperature and Respiratory Rate through Skin Surface Temperature under Climatic Chamber Conditions. J. Braz. Assoc. Agric. Eng. 2015, 35, 979–989. [Google Scholar] [CrossRef] [Green Version]
- Hoff, S.J.; Janni, K.A.; Jacobson, L.D. Defining the Newborn Piglet’s Thermal Environment with an Effective Environmental Temperature. Trans. ASAE 1993, 36, 143–150. [Google Scholar] [CrossRef]
- Mount, L.E. Evaporation Heat Loss in the Newborn Pig. J. Physiol. 1962, 164, 274–281. [Google Scholar] [CrossRef] [Green Version]
- Holman, J.P. Heat Transfer, 9th ed.; McGraw-Hill: New York, NY, USA, 2002; ISBN 0-07-240655-0. [Google Scholar]
- Zhang, Q.; Xin, H. Responses of Piglets to Creep Heat Type and Location in Farrowing Cage. Appl. Eng. Agric. 2001, 17, 515–519. [Google Scholar] [CrossRef]
- ASHRAE. ASHRAE Handbook; Volume Fundamentals; ASHRAE: Atlanta, GA, USA, 2013. [Google Scholar]
- Ramirez, B.C.; Gao, Y.; Hoff, S.J.; Harmon, J.D. Thermal Environment Sensor Array: Part I. Development and Field Performance Assessment. Biosyst. Eng. 2018, 174, 329–340. [Google Scholar] [CrossRef]
- Smith, B.C.; Ramirez, B.C. Dimensions of the Suckling Pig. Front. Anim. Sci. 2021, 2, 31. [Google Scholar] [CrossRef]
- Fialho, F.B.; Bucklin, R.A.; Zazueta, F.S.; Myer, R.O. Theoretical Model of Heat Balance in Pigs. Anim. Sci. 2004, 79, 121–134. [Google Scholar] [CrossRef]
- Zhang, Q.; Xin, H. Static and Dynamic Temperature Distribution of Heat Mats for Swine Farrowing Creep Heating. Appl. Eng. Agric. 2000, 16, 563–569. [Google Scholar] [CrossRef]
- Bruce, J.M.; Clark, J.J. Models of Heat Production and Critical Temperature for Growing Pigs. Anim. Sci. 1979, 28, 353–369. [Google Scholar] [CrossRef]
- PIC. Wean To Finish Manual; PIC: Hendersonville, TN, USA, 2014. [Google Scholar]
- Usry, J.L.; Turner, L.W.; Bridges, T.C.; Nienaber, J.A. Modeling the Physiological Growth of Swine Part III: Heat Production and Interaction With Environment. Trans. ASAE 1992, 35, 1035–1042. [Google Scholar] [CrossRef]
- Kluyver, T.; Ragan-Kelley, B.; Pérez, F.; Granger, B.E.; Bussonnier, M.; Frederic, J.; Kelley, K.; Hamrick, J.; Grout, J.; Corlay, S.; et al. Jupyter Notebooks—A Publishing Format for Reproducible Computational Workflows. In Positioning and Power in Academic Publishing: Players, Agents and Agendas; IOS Press: Amsterdam, The Netherlands, 2016; pp. 87–90. [Google Scholar] [CrossRef]
- Smith, B.C.; Weyer, S.E.; Ramirez, B.C.; Hoff, S.J.; Gates, R.S. Development and Validation of an Animal Thermal Environement Interaction Laboratory. Appl. Eng. Agric. 2021, in press. [Google Scholar] [CrossRef]
- Smith, B.C. Technology and Assessment Techniques for Swine Farrowing Facility Management. Master’s Thesis, Iowa State University, Ames, IA, USA, 2021. [Google Scholar]
- Brody, S. Bioenergetics and Growth; Reinhold: New York, NY, USA, 1945. [Google Scholar]
- Jurgens, M.; Bergendahl, K.; Coverdale, J.; Hansen, S. Animal Feeding and Nutrition, 11th ed.; Kendall Hunt: Dubuque, IA, USA, 2012; ISBN 978-0-7575-9113-6. [Google Scholar]
- Labussière, E.; van Milgen, J.; de Lange, C.F.M.; Noblet, J. Maintenance Energy Requirements of Growing Pigs and Calves Are Influenced by Feeding Level. J. Nutr. 2011, 141, 1855–1861. [Google Scholar] [CrossRef] [PubMed] [Green Version]
- Labussière, E.; Dubois, S.; van Milgen, J.; Noblet, J. Partitioning of Heat Production in Growing Pigs as a Tool to Improve the Determination of Efficiency of Energy Utilization. Front. Physiol. 2013, 4, 146. [Google Scholar] [CrossRef] [PubMed] [Green Version]
- Milgen, J.V.; Noblet, J.; Dubois, S.; Bernier, J.-F. Dynamic Aspects of Oxygen Consumption and Carbon Dioxide Production in Swine. Br. J. Nutr. 1997, 78, 397–410. [Google Scholar] [CrossRef] [PubMed] [Green Version]
- Mount, L.E. Environmental Temperature Preferred by the Young Pig. Nature 1963, 199, 1212–1213. [Google Scholar] [CrossRef]
- Zhang, Q.; Xin, H. Modeling Heat Mat Operation for Piglet Creep Heating. Trans. ASAE 2000, 43, 1261–1267. [Google Scholar] [CrossRef]
Figure 1.
Graphic depiction of the piglet model structure with conduction, convection, and thermal radiation heat transfer modes in (a) heat lamp (HL), (b) semi-enclosed heated microclimate (SEHM), and (c) heated mat.
Figure 1.
Graphic depiction of the piglet model structure with conduction, convection, and thermal radiation heat transfer modes in (a) heat lamp (HL), (b) semi-enclosed heated microclimate (SEHM), and (c) heated mat.

Figure 2.
Piglet tissue resistance curve developed from previous studies to estimate tissue resistance based on age of the piglet from day 8 to day 30 in the model. The blue circle represents the tissue values from literature with the age below them.
Figure 2.
Piglet tissue resistance curve developed from previous studies to estimate tissue resistance based on age of the piglet from day 8 to day 30 in the model. The blue circle represents the tissue values from literature with the age below them.

Figure 3.
Flow chart of the mechanistic thermal balance model for piglets accounting for conduction, convection, and thermal radiation. Note the CD in the conduction term represents the determination between the rubber mat and heat mat calculations. All variables are defined in Equations (1)‒(8).
Figure 3.
Flow chart of the mechanistic thermal balance model for piglets accounting for conduction, convection, and thermal radiation. Note the CD in the conduction term represents the determination between the rubber mat and heat mat calculations. All variables are defined in Equations (1)‒(8).

Figure 4.
Side view of the installed locations of the thermal environment sensor arrays (TESAs) in the three animal occupied zones (AOZs) in ATEIL. The green zone represents the locations of the non-heated creep zone (NHCZ), the blue zone represents the sow occupied zone (SOZ), and the yellow zone represents the supplemental heat creep zone (SHCZ). The colored dots represent the respective zone sensor locations and the orange triangles represent the room level sensors. Note this drawing is not to scale. SEHM is a semi-enclosed heated microclimate.

Figure 5.
Effective Environment Temperature (EET) and Effective Environment Temperature for creep area microclimate (EETcp; x-axis) versus the predicted piglet heat production (y-axis) for a single piglet at one day of age. Red dots represent the original EET, blue dots represent EETcp.
Figure 5.
Effective Environment Temperature (EET) and Effective Environment Temperature for creep area microclimate (EETcp; x-axis) versus the predicted piglet heat production (y-axis) for a single piglet at one day of age. Red dots represent the original EET, blue dots represent EETcp.

Figure 6.
Ideal Effective Environment Temperature for creep area microclimate (EETcp) range (shaded area) based on age of the piglet for birth (day 0) to day 30 of lactation. The red lines represent the high and low EETcp values for each age of piglet. Note the first shift is at 1 day of age following an offset for a warmer EETcp for birth and the second major shift is at seven days of age when the tissue resistance of the piglet begins to increase.

Figure 7.
Effective Environment Temperature for creep area microclimate (EETcp) versus piglet heat production of a piglet based on the number of piglets in the creep area at 1 day of age.
Figure 7.
Effective Environment Temperature for creep area microclimate (EETcp) versus piglet heat production of a piglet based on the number of piglets in the creep area at 1 day of age.

Figure 8.
Comparison of results from the model for a supplemental heat creep zone (SHCZ) with either semi-enclosed heated microclimate (SEHM) or heat lamp (HL) and heat mat model of Effective Environment Temperature for creep area microclimate (EETcp; x-axis) versus piglet heat production (y-axis) for a single 1-day-old piglet. The black lines represent the ideal piglet heat production for 1-day-old piglets.

Figure 9.
Average Effective Environment Temperature for creep area microclimate (EETcp) for the two semi-enclosed heated microclimate (SEHM) units and four heat lamps (HL) in the Animal Thermal Environment Interaction Laboratory (ATEIL) data set. The error bars represent one standard deviation around the mean. The dark lines represent the ideal EETcp range for piglets.


Table 1.
Model results for a single piglet, at 1 day of age in a creep area with a rubber mat for a sub-sample of conditions in the data set used with the model. Dry-bulb temperature (Tdb), mean radiant temperature (TMR), airspeed (U), mat temperature (Tm), effective environment temperature (EET), and effective environment temperature for creep areas (EETcp).
| Tdb (°C) | TMR (°C) | U (m s−1) | Tm (°C) | Predicted Piglet Heat Production (W) | Predicted Piglet TSK (°C) | EET (°C) | EETcp (°C) |
|---|---|---|---|---|---|---|---|
| 29 | 33 | 0.12 | 37.0 | 5.8 | 37.3 | 29.6 | 31.4 |
| 25 | 29 | 0.12 | 37.0 | 7.4 | 36.3 | 26.5 | 28.8 |
| 29 | 33 | 0.32 | 37.0 | 6.7 | 36.6 | 28.0 | 30.1 |
| 25 | 29 | 0.32 | 37.0 | 9.5 | 35.4 | 22.8 | 25.9 |
| 29 | 33 | 0.12 | 39.5 | 4.5 | 37.5 | 30.6 | 32.4 |
| 25 | 29 | 0.12 | 39.5 | 6.9 | 36.5 | 26.5 | 29.1 |
| 29 | 33 | 0.32 | 39.5 | 6.2 | 36.8 | 28.0 | 30.3 |
| 25 | 29 | 0.32 | 39.5 | 9.1 | 35.6 | 22.8 | 26.2 |
| 29 | 33 | 0.12 | 42.0 | 4.0 | 37.8 | 30.6 | 32.6 |
| 25 | 29 | 0.12 | 42.0 | 6.4 | 36.7 | 26.5 | 29.3 |
| 29 | 33 | 0.32 | 42.0 | 5.8 | 37.0 | 28.0 | 30.5 |
| 25 | 29 | 0.32 | 42.0 | 8.6 | 35.8 | 22.8 | 26.4 |
| 29 | 33 | 0.12 | 44.5 | 3.5 | 38.0 | 30.6 | 32.8 |
| 25 | 29 | 0.12 | 44.5 | 5.9 | 36.9 | 26.5 | 29.5 |
| 29 | 33 | 0.32 | 44.5 | 5.3 | 37.2 | 28.0 | 30.7 |
| 25 | 29 | 0.32 | 44.5 | 8.1 | 36.0 | 22.8 | 26.6 |
Publisher’s Note: MDPI stays neutral with regard to jurisdictional claims in published maps and institutional affiliations. |
© 2021 by the authors. Licensee MDPI, Basel, Switzerland. This article is an open access article distributed under the terms and conditions of the Creative Commons Attribution (CC BY) license (https://creativecommons.org/licenses/by/4.0/).
Share and Cite
MDPI and ACS Style
Smith, B.C.; Ramirez, B.C.; Hoff, S.J. Modeling and Assessing Heat Transfer of Piglet Microclimates. AgriEngineering 2021, 3, 768-782. https://0-doi-org.brum.beds.ac.uk/10.3390/agriengineering3040048
AMA Style
Smith BC, Ramirez BC, Hoff SJ. Modeling and Assessing Heat Transfer of Piglet Microclimates. AgriEngineering. 2021; 3(4):768-782. https://0-doi-org.brum.beds.ac.uk/10.3390/agriengineering3040048
Chicago/Turabian StyleSmith, Benjamin C., Brett C. Ramirez, and Steven J. Hoff. 2021. "Modeling and Assessing Heat Transfer of Piglet Microclimates" AgriEngineering 3, no. 4: 768-782. https://0-doi-org.brum.beds.ac.uk/10.3390/agriengineering3040048