1. Introduction
A large amount of pulp is produced annually in the pulp and paper industries [
1,
2]; concurrently, thousands of tons of inorganic and organic solid waste is generated every year, and mainly the inorganic solid waste (e.g., dregs, grits, and ash) is sent for landfill disposal. The generated inorganic and organic residues from the bleached kraft pulp process can cause numerous environmental problems. In the kraft pulping process, wood chips are treated with an aqueous solution of NaOH and Na
2SO
4 for cooking at higher temperatures for the digestion of lignin and to separate the cellulose fibers; in the digestion process, generated black liquor is sent to the chemical recovery process. During the combustion process, NaOH and Na
2SO
4 form a molten smelt of sodium sulfide and sodium carbonate (green liquor). In the recausticizing process, the sodium carbonate containing green liquor from the recovery smelt dissolving tank reacts with quick lime Ca(OH)
2 to form sodium hydroxide (white liquor) and calcium carbonate (lime mud; LM). The lime mud, after washing, is sent to the lime kiln to be processed into calcium oxide, which is then used to regenerate the NaOH from sodium carbonate and again the slaked lime (Ca(OH)
2) is generated from the lime kiln (CaO) by the hydration process in the smelt solution (green liquor), which is produced from the recycled lime mud in the paper industry, as shown in Equation (1) [
3].
There may be some small pulp mills in developing countries that lack chemical recovery systems. For example, China has over 5300 pulp and paper mills, most of them small or very small; these industries annual effluents amount to about 15 percent of the total industrial discharge, and the recovery of chemicals is very limited [
4]. In Mexico, the technical association of the industry has a lack of laboratory resources for smaller mills [
5]. However, lime mud obtained from such mills and recycling processes is essential. It estimated that one ton of pulp could produce on an average of 0.5 tons of lime mud in a paper mill. China, Japan, and the United States produced more than 50% of the total lime mud. These three countries account for half of the world’s total paper production, which is over 400 million tons per year [
6]. The rate of disposal of these waste byproducts continuously increases because of the ever-growing demand for paper products for society [
7,
8,
9,
10,
11,
12].
Lime mud production and its toxic effects are illustrated in
Table 1. The industrial waste can produce a high alkalinity source of lime mud along with toxic heavy metals and can create environmental issues, specifically landfill occupation, groundwater pollution, and toxic fine dust, etc. [
13,
14]. This solid waste is mainly managed by the landfill process [
15]. Apart from the economic losses associated with landfill disposal, useful resources are wasted which ultimately causes environmental problems [
16]. To overcome this problem, small scale mills should establish chemical recovery processes from black liquor. If they lack a recovery process, generated waste must be recycled or treated before discharging into the environment.
The main chemical composition of lime mud is CaCO
3 (~97%) and a small amount of unslaked lime (CaO) with Mg, K, Mn, Cr, and Fe as trace elements [
18]. The LM color has varied from nearly white to dark green color due to recaust process upsets such as the plugging of pressure and rotary lime mud filters that seem to occur when the dark green color lime mud has non-process elements (NPEs) that contributes to the operational problems of the recausticization process in the paper mills and produces the green color lime mud [
19].
In the kraft mill process, accumulates the aluminum, silicon [
20], and other metals (Ca, Mg, Fe and Zn) are present in green liquor [
21,
22] including heavy metals (As, Cd, Cu, Mn, Pb, Sb, etc.) [
23]. These studies are mainly focused on the individual NPEs concentrations and their source, with purge points, etc. The formation of hydrotalcite (Mg
6Al
2CO
3 (OH)
16) in lime mud was first observed by Bennett et al. [
24], and it was formed in the green liquor clarifier [
25]. Aluminosilicate compounds are present in the lime mud sample and lead to reduce filtration efficiency [
19]. Phosphorus, a primary component of hydroxylapatite (Ca
5(PO
4)
3(OH)) are also identifiable in the lime mud sample by XRD analysis [
26]. The sulfide ions interact with aluminosilicates to form kaolinite or hydroxy sodalite along with sulfur compounds [
27] that occur in a lime cycle, which is mainly responsible for the green color in lime mud samples.
Most modern pulp mills would not be permitted to discharge the lime mud material into the environment, but some of the lime mud waste from the paper industries is disposed into the environment due to an inefficient and expensive re-utilization method resulting in the enhancement of environmental pollution and land occupation [
28]. With environmental concerns, the lime mud re-utilization process needs urgent and advanced research to prevent environmental toxicity and proper techniques for the valorization of lime mud for industrial applications. Some of the studies suggest that the inorganic pulp mill residues may use as fertilizers and soil improvement chemicals in the agriculture field [
12], likewise wastewater treatment and construction field [
8] and also utilizing as the controlling agent for acid mine drainages [
29]. Consequently, waste lime mud sample management, recycling, and a cost-effective re-utilization process are essential for development [
30]. The present study mainly focuses on the sustainable use of green colored lime mud waste from the paper mill for recovering a purified lime mud by calcination and hydration processes. This purified lime can be reutilized in the preparation of hand sheets as an alternative to commercial calcium carbonate for improving paper brightness thereby, reducing the burden on natural resources.
2. Materials and Methods
Lime mud sample was collected from the Moorim paper mill in Ulsan, South Korea. This green colored lime mud was characterized with X-ray fluorescence (XRF) (Shimadzu Sequential XRF-1800, Shimadzu Scientific Instruments, Kyoto, Japan), XRD (Rigaku Xpert MPD equipped with Cu Kα radiation (λ = 1.5406 Å) BD2745N, Rigaku, Tokyo, Japan), FTIR spectra were recorded at ATR mode with 32 scans at 4 resolution (6700 FTIR, Thermo Scientific Nicolet, Waltham, MA, USA), Scanning Electron Microscopy equipped with energy-dispersive x-ray spectroscopy (SEM-EDS, JSM-6380 LA, JEOL Company, Seoul, Korea) was employed, and a 10 nm Au coating was conducted to provide surface conductivity on each of the powders. The whiteness of the raw lime mud, after the calcination and hydration samples, was measured by X-Rite Premier 8400 (X-RITE, Austin, TX, USA) and the paper brightness was measured by Color Touch 2-Technidyne (AML instruments Limited, Lincoln city, UK).
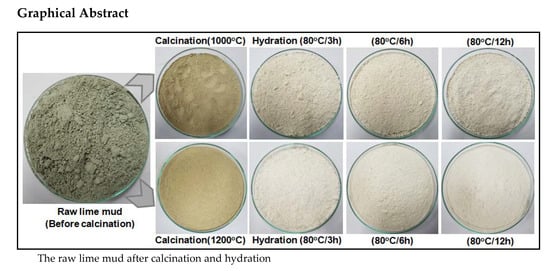
In the experimental procedure, the dried green colored raw lime mud sample was calcinated in an electric furnace at different temperatures from 1000 °C and 1200 °C for 2 h. The calcinated lime mud sample was ground using comminution equipment to obtained a fine powder, the particle size was less than 100 µm. The fine powder was used for hydration at different temperatures (30 and 80 °C) and time (3–12 h) for reducing impurities and improving the whiteness of the lime mud powder.
2.1. The Hydraulic Activity of Calcinated Lime Mud Samples
The hydraulic activity of the calcinated lime mud samples was measured using Graphtec-GL240 (Graphtec Corporation, Totsuka-ku Yokohama, Japan). In this process, the calcinated lime mud (CaO) samples were mechanically ground to get a particle size smaller than 100 μm, which was then used to measure the hydraulic activity for heat generated by the hydration process in relation to reaction time. In the hydraulic activity measuring process, 30 g of the quick lime sample from the calcinated lime mud was placed in the heat measuring apparatus for agitation at room temperature (25 °C), and 120 mL of distilled water was added to the reactor. The temperature inside the calorimeter was measured at 5 s intervals upon the addition of distilled water. The heat produced from the hydration reactions of quicklime from calcinated lime mud was measured for 3 h after the reactions began.
2.2. Hydration Process of Lime Mud Samples for Improving Powder Whiteness
In the hydration experiments, 100 g of calcinated lime mud samples were hydrated with 1 L of distilled water at different temperatures (30 and 80 °C) and time (3–12 h). Finally, the filtrates were collected and dried at 80 °C for 12 h for measuring the powder whiteness. The main chemical reaction mechanism in the calcination and hydration process is described in Equations (2) and (3).
2.3. In-Situ Carbonation
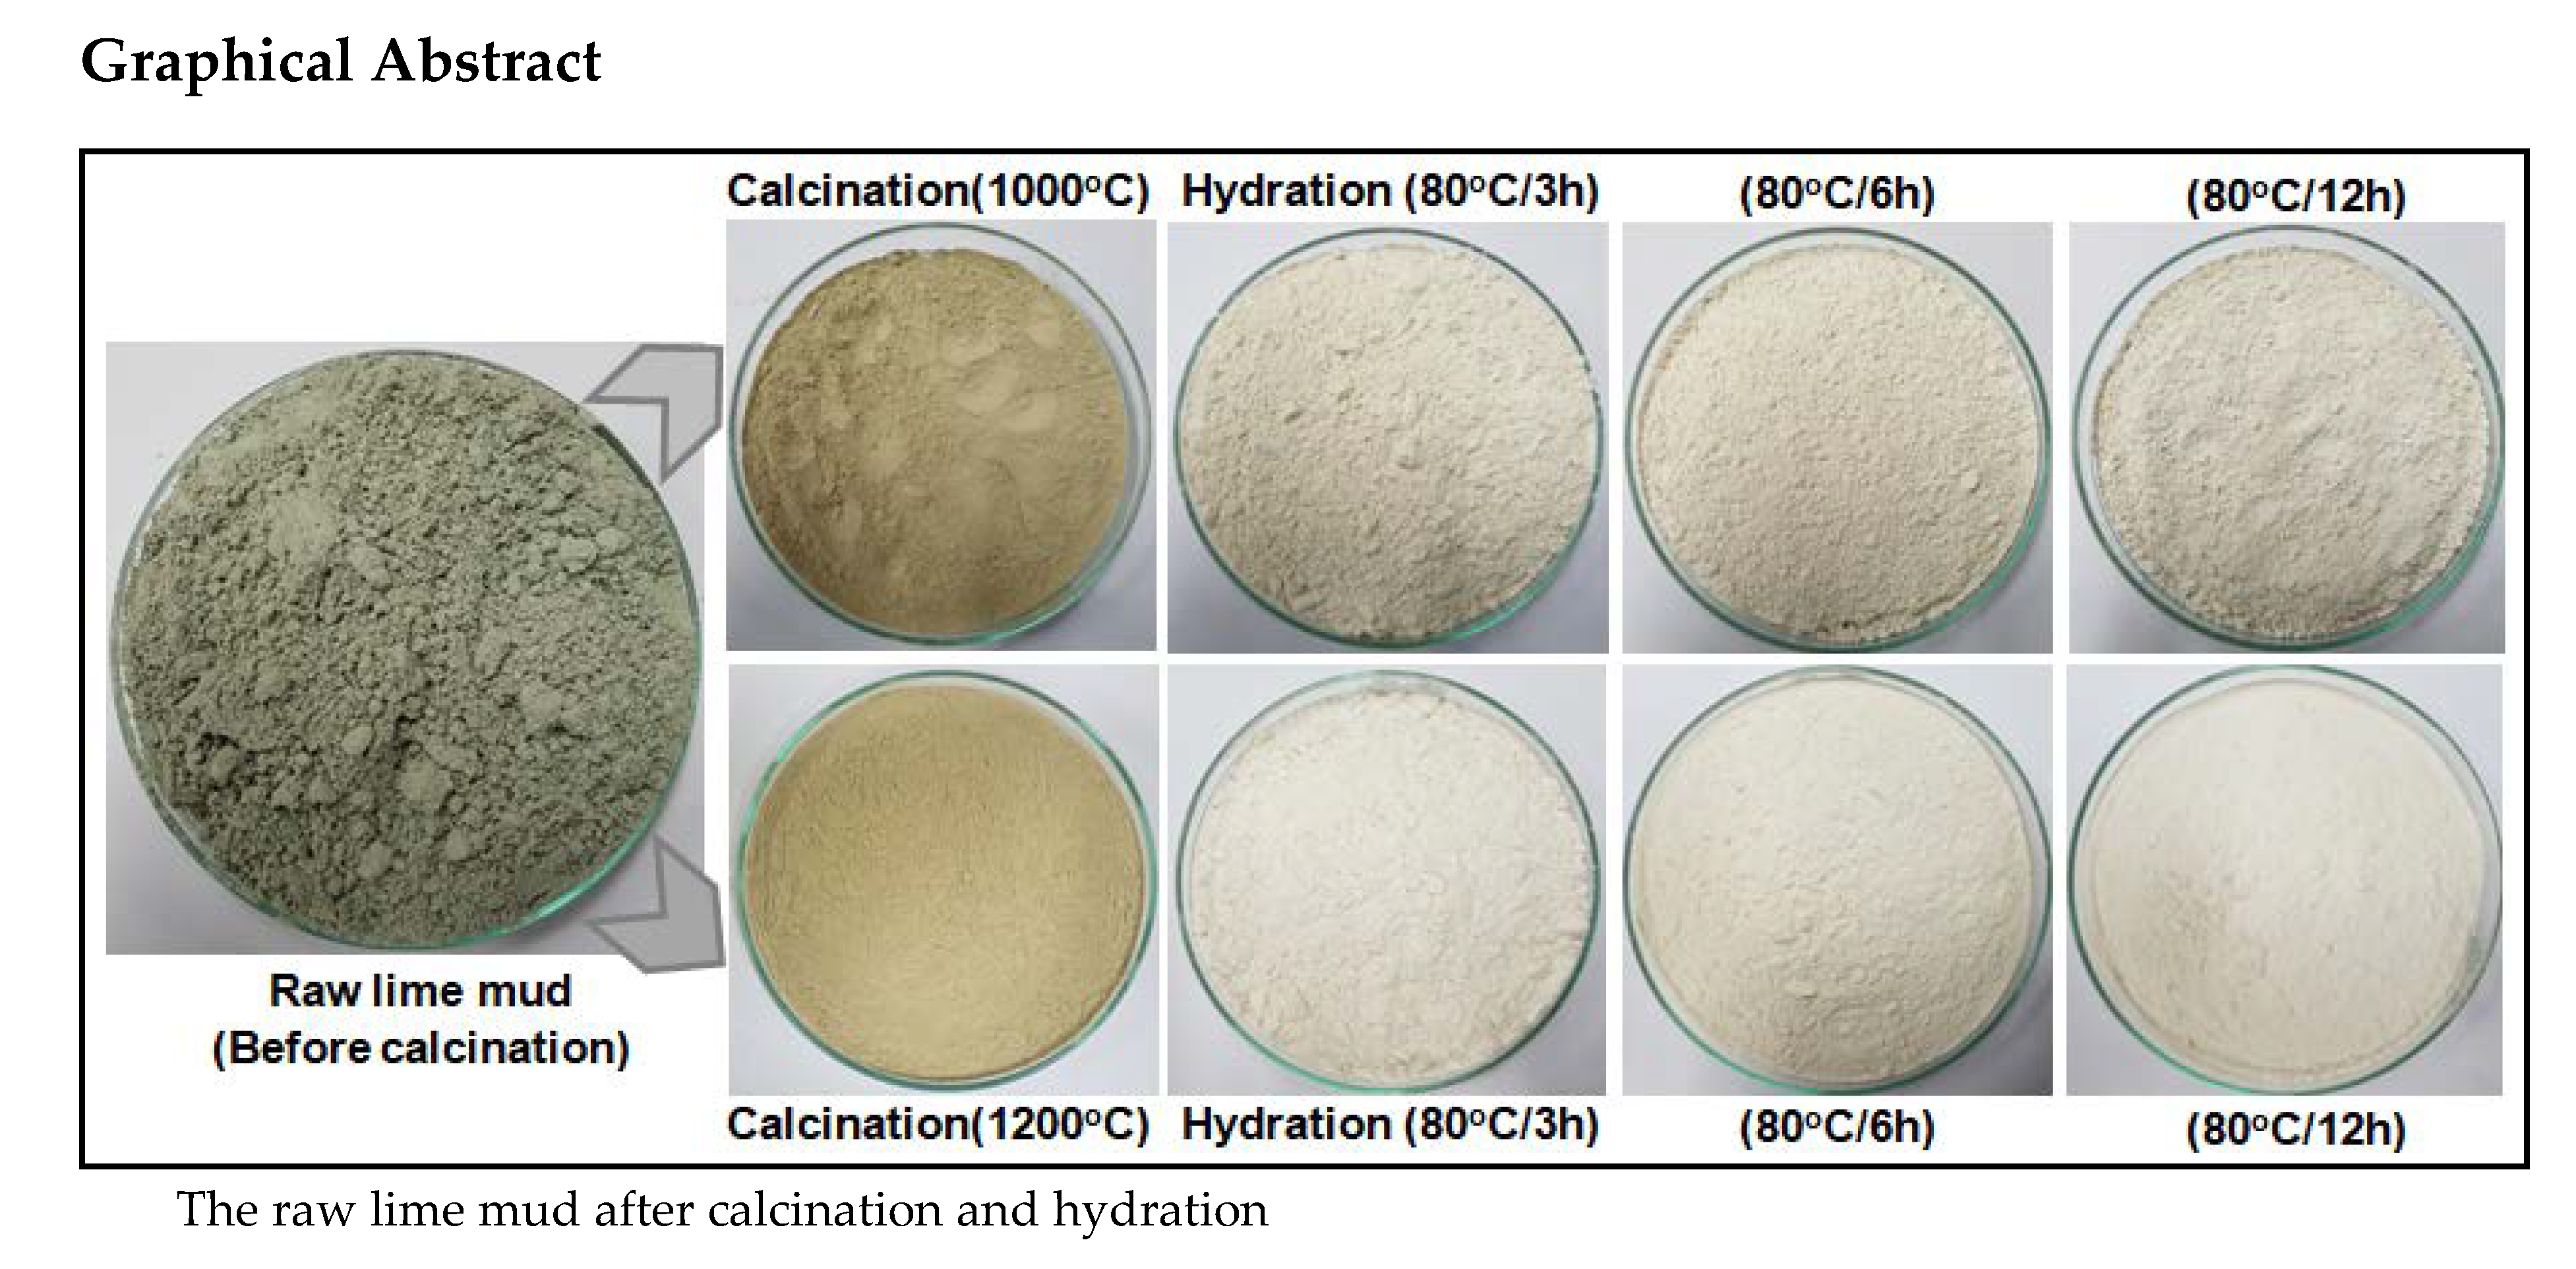
The in-situ carbonation experiments were conducted using 2 L bench-scale reactor, which was surrounded by a water bath system for maintaining a constant temperature of 25 °C for the entire reaction time. The homogenization of the reaction was fixed at a stirring speed of 400 rpm, as shown in
Figure 1. In the in-situ carbonation reaction process, we used kraft pulp (KP) along with hydrated lime mud and commercial Ca(OH)
2 with different weight ratios, as shown in
Table 2. These varied ratios of lime mud sample were added to the 300 g of KP slurry (5 mass%) and maintain the reaction volume of 2 L by adding distilled water. CO
2 gas (50 mL/min) was injected into the reaction mixture through a porous glass bubbler, and then the reaction was continued from the initial pH 12, which decreased during the reaction time and reached pH 6 by the end of the reaction.
In the in-situ carbonation process, we synthesized the precipitated calcium carbonate (PCC) slurry, and then a 60 g/m
2 basis weight of slurry was used for the preparation of the hand sheets by using a Technical Association of the Pulp and Paper Industry (TAPPI) machine. The hand sheet brightness is reported as the International Organization for Standardization ISO (%) for comparison of paper brightness with all different weight percentages of lime mud samples, as shown in
Table 2.
3. Results and Discussion
The chemical composition of the raw lime mud sample was identified through XRF analysis, and the results were as follows: SiO
2 (0.26%), Al
2O
3 (0.32%), Fe
2O
3 (0.39%), MgO (1.12%), SO
3 (0.58%), P
2O
5 (0.22%), Na
2O (0.99%), CaO (53.1%), and the loss on ignition (LOI) (43.02%). In this sample, CaO is the dominant element (53.1%) and the loss of CO
2 gas was nearly 43.02 wt%, as shown in
Table 3.
The calcinated (1000 and 1200 °C/2 h) lime mud samples were hydrated at different temperatures and contact times to improve the whiteness of the sample, which was then used to prepare hand sheets by an in-situ carbonation process. The chemical compositions of the raw lime mud and calcinated and hydrated lime mud samples were characterized by XRD and FTIR analysis.
The XRD patterns and FTIR spectrum revealed that the major mineralogical composition of green color lime mud is calcium carbonate with minor impurities. Calcination (1000 and 1200 °C/2 h) of this sample can produce pure CaO with a further reduction of impurities and other non-process elements. This calcinated sample was used for the hydration process at 30 °C and 80 °C for 3–12 h of residence time and produced pure Ca(OH)
2, as shown in
Figure 2. The XRD patterns of differently treated lime mud samples are presented in
Figure 2 and
Figure 3 depicts the FTIR spectrum of differently treated lime mud samples.
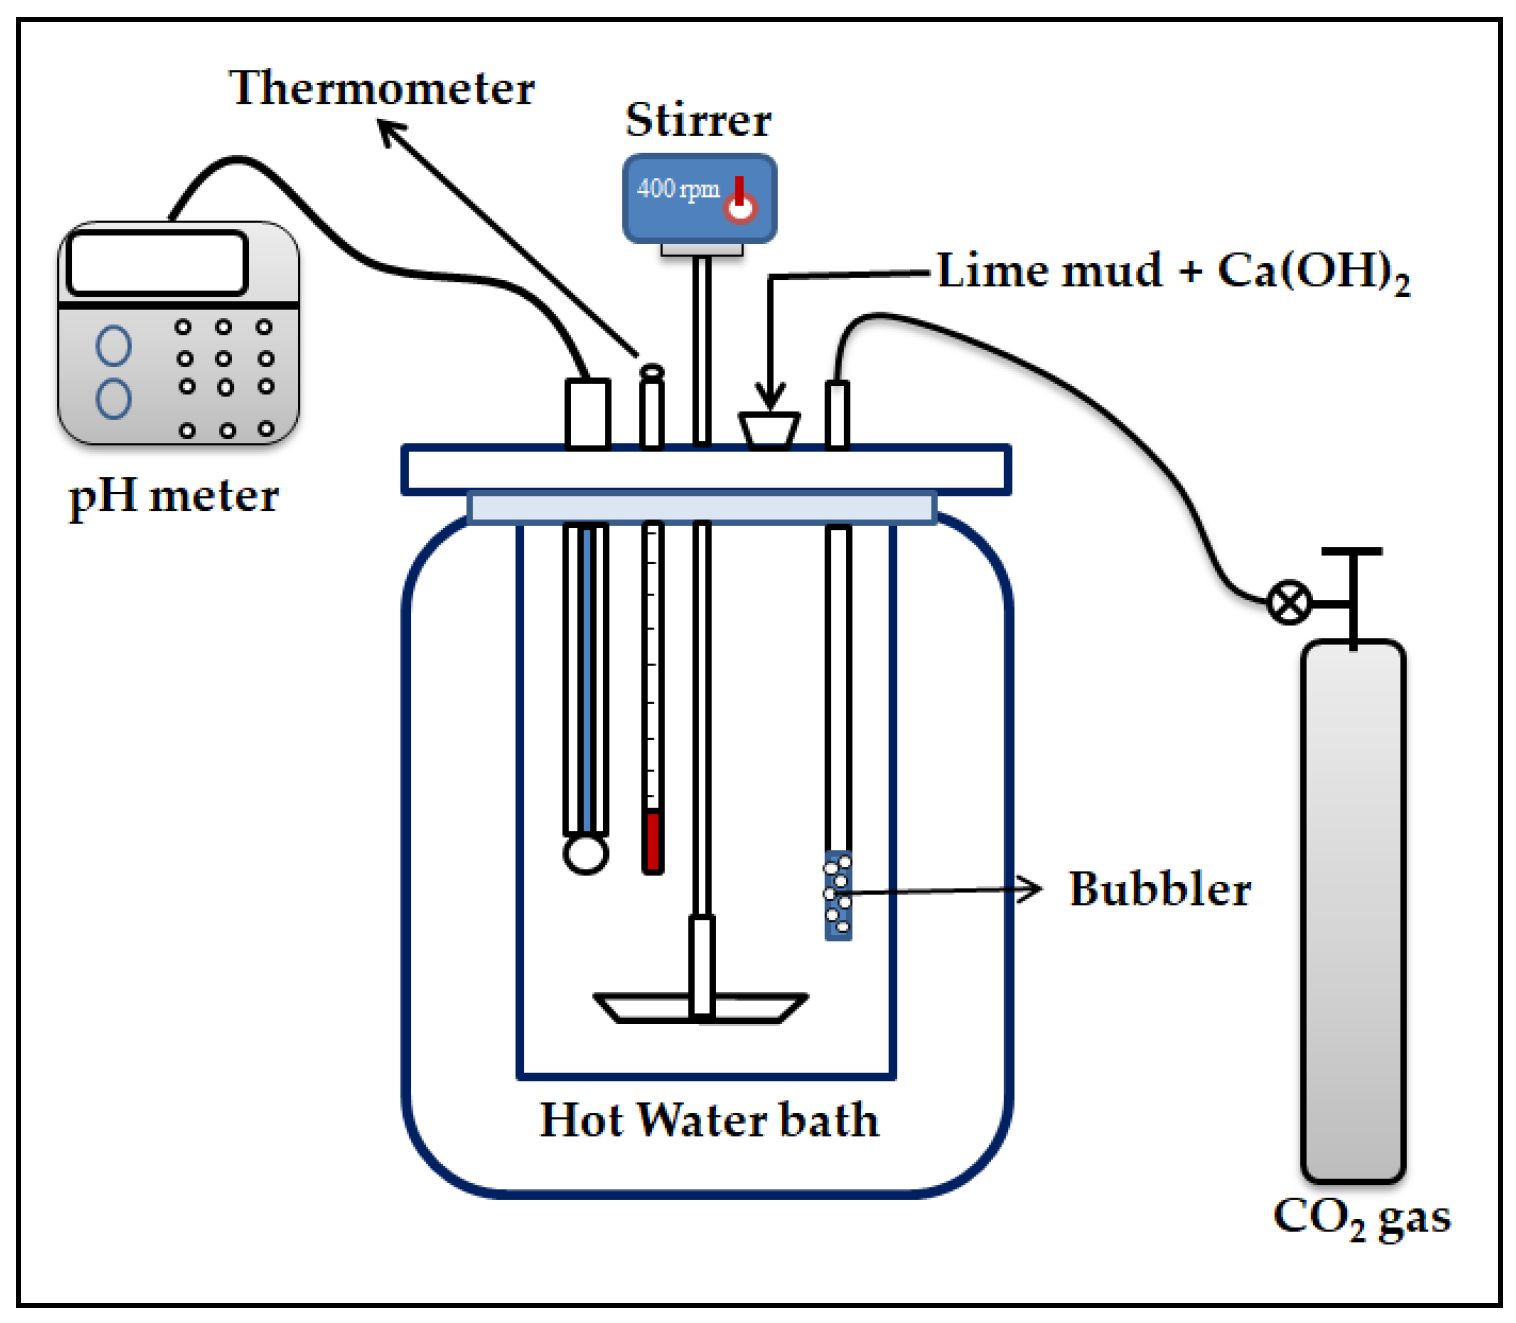
The XRD patterns in
Figure 2 show (a) the raw lime mud, (b) calcinated lime mud, and (c) calcinated with hydrated lime mud samples. The XRD patterns of
Figure 2a were matched with the rhombohedral structure of the calcite phase (CaCO
3) with a JCPDS Card No. 00-083-0577, indicating that the raw lime mud sample had a major calcite phase of calcium carbonate with minor impurities. After the calcination process, the XRD patterns of the calcinated lime mud, as shown in
Figure 2b, matched to the cubic shape of lime (CaO) with a JCPDS Card No. 00-078-0649, which indicates that the raw lime mud sample after the calcination process can produce pure lime (CaO). In addition, that the calcinated lime (CaO) sample after the hydration process can produce pure Ca(OH)
2 was confirmed by the XRD patterns shown in
Figure 2c, that matched with the hexagonal shape of portlandite (Ca(OH)
2) with a JCPDS Card No. 00-072-0156.
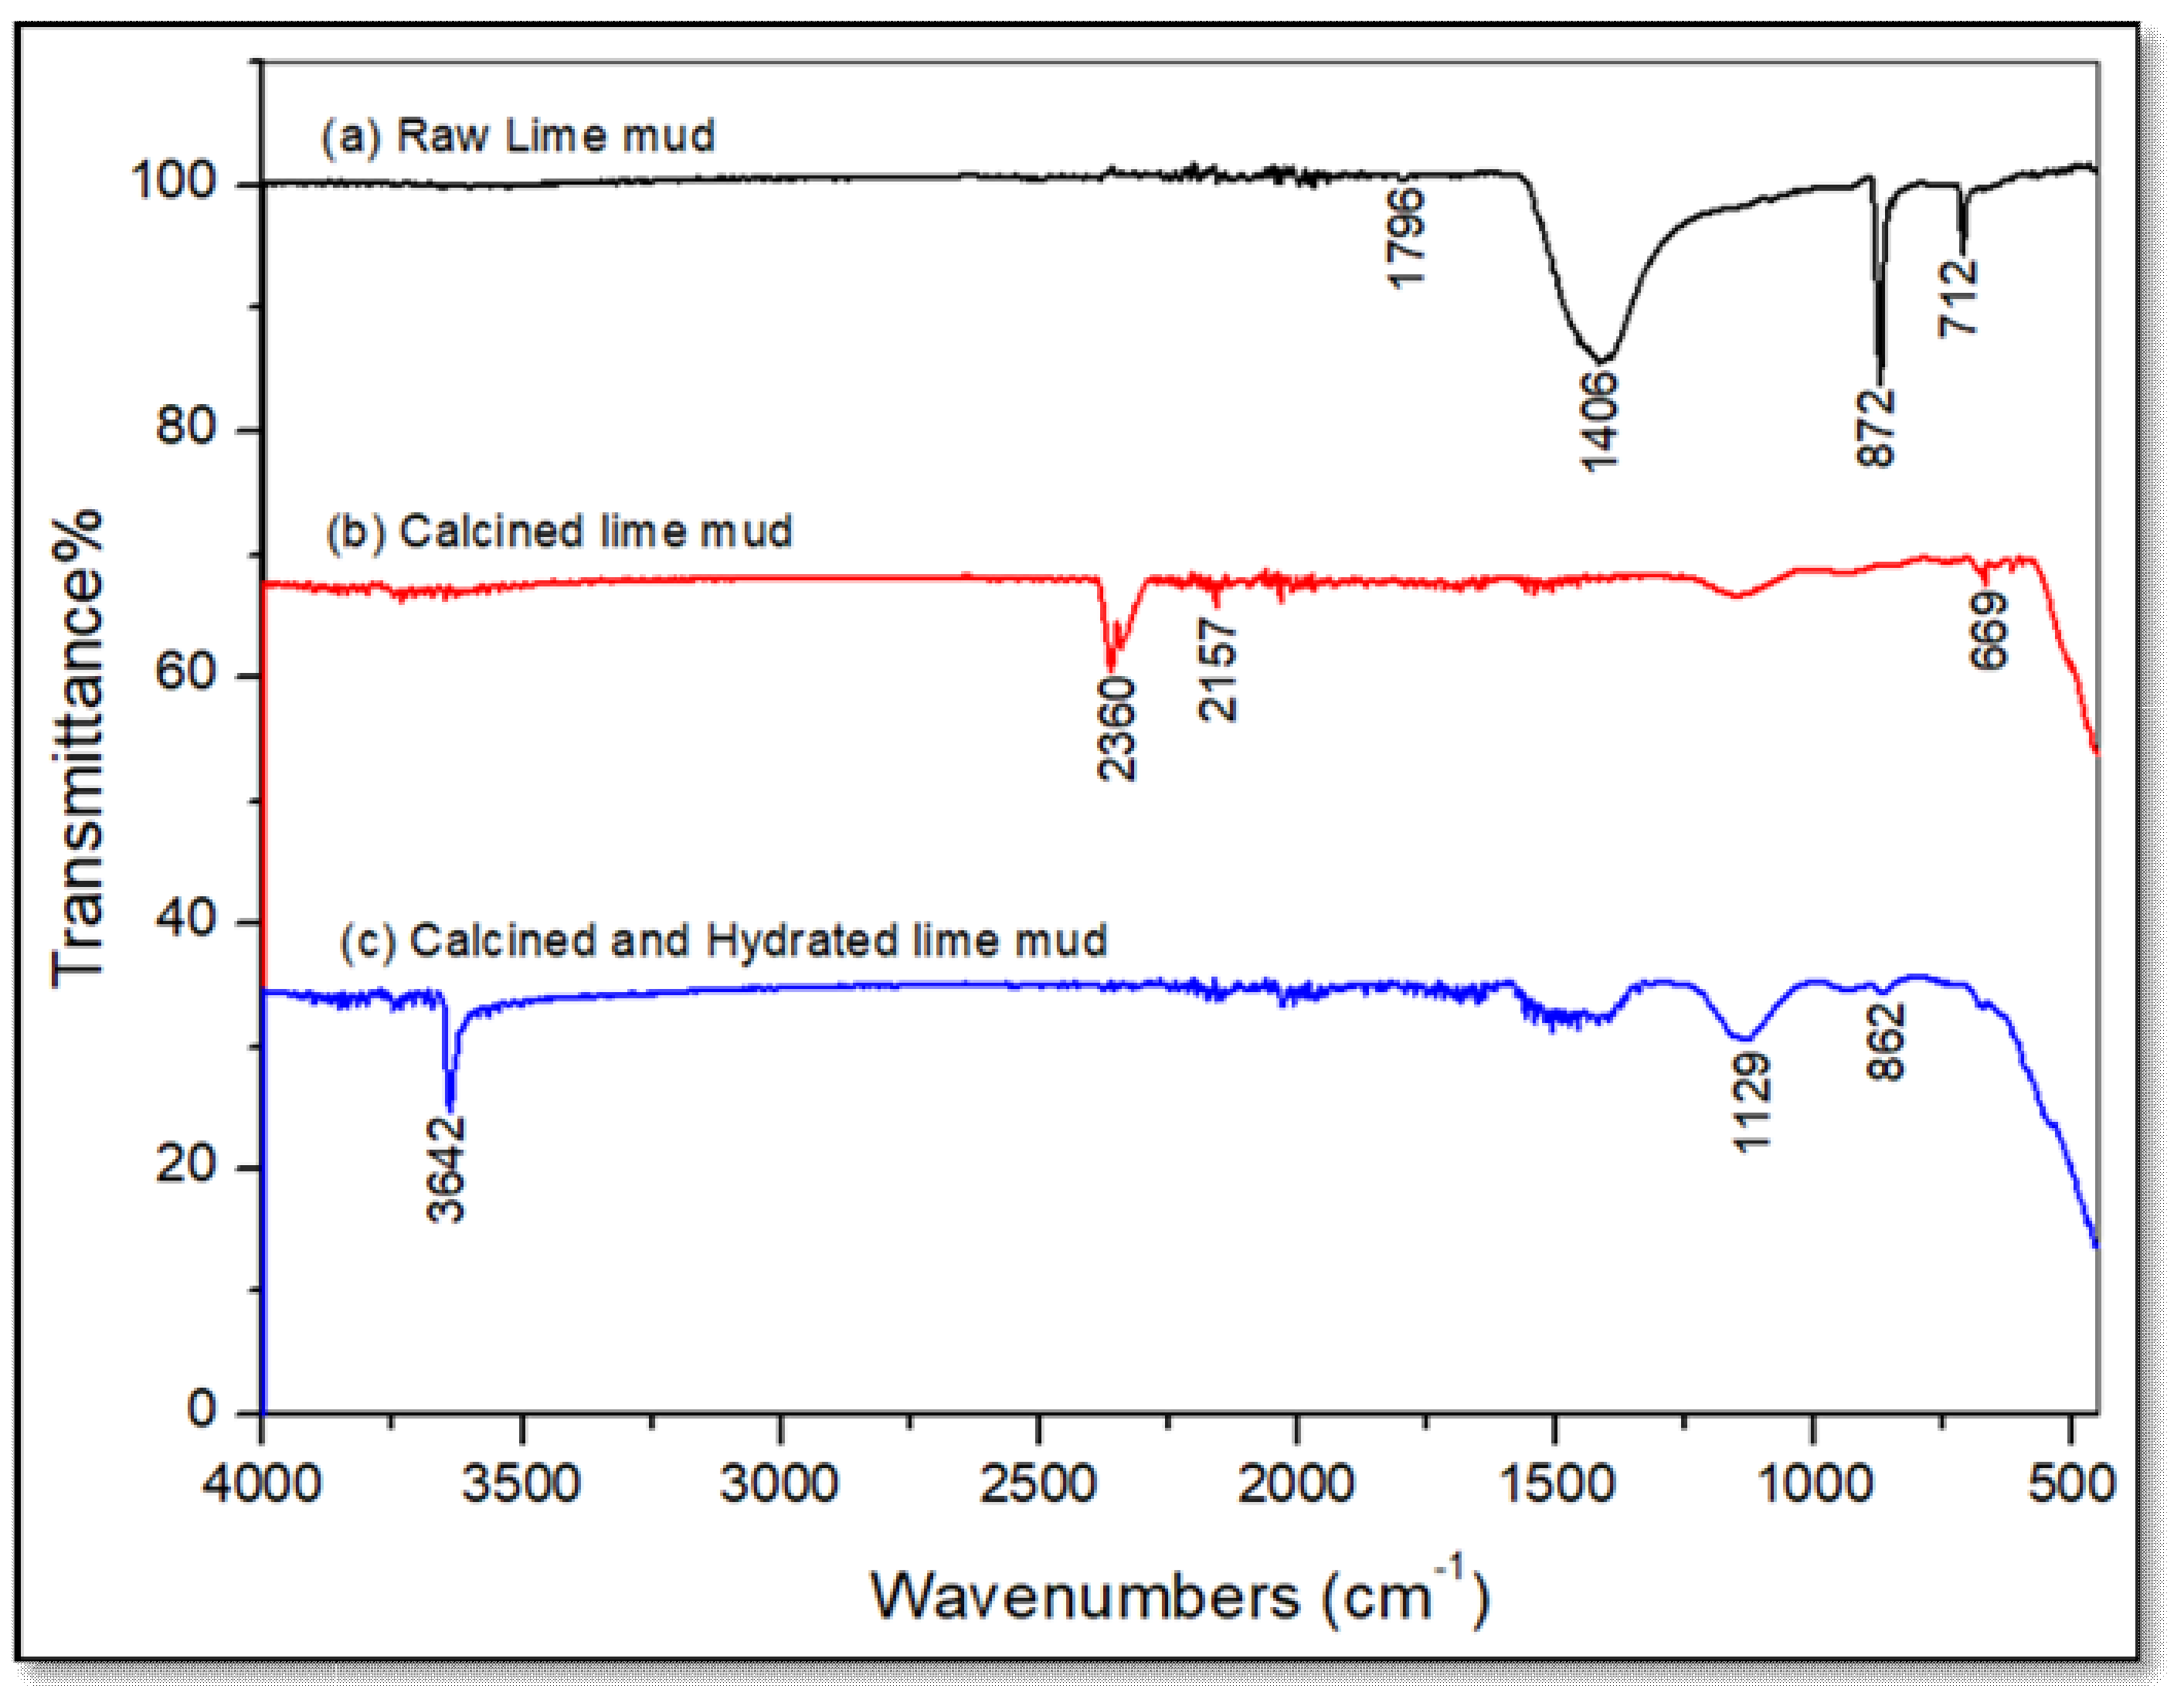
In the results of the FTIR spectrum shown in
Figure 3, sample (a) is the raw lime mud, sample (b) is the calcinated lime mud, and sample (c) is the calcinated with hydrated lime mud samples. The major composition of the raw lime mud sample was CaCO
3, which was confirmed by the FT-IR spectrum in
Figure 3a and showed vibrational bands at 1406 cm
−1 and 872 cm
−1, indicating the plane bending vibration modes (C–O) of carbonate groups (CO
32−) and vibrational bands at 712 cm
−1 assigned to the C–O bond. The raw lime mud material was calcinated at 1000 °C and 1200 °C for 2 h; all those bands disappeared. The FTIR spectrum of a calcinated lime mud sample showed that the major composition was CaO, as shown in
Figure 3b, that the peak at 669 cm
−1 corresponded to the Ca–O bond, and that the vibrational bands at 2360 and 2157 cm
−1 indicated the C–O bond. The calcinated lime mud sample hydrated at 30 °C and 80 °C for 3 h to 12 h duration can produce Ca(OH)
2, as shown in
Figure 3c, and was confirmed by the FTIR that an absorption band appeared at 3642 cm
−1, which was due to stretching the mode of O–H present in the hydrated lime mud sample [
31]. The vibrational wide band at 1129 cm
−1 and the peak at 862 cm
−1 indicated Ca–O bonds.
3.1. Identification of Non-Process Elements by SEM-EDS Analysis of Indifferently Treated Lime Mud Samples
The raw lime mud sample, calcinated at (1000 and 1200 °C/2 h) and the calcinated (1200 °C/2 h) with hydrated (80 °C) lime mud samples were used for the SEM-EDS analysis. The results depicted in
Table 4 indicated that the raw lime mud sample had major impurities such as Fe, Na, Mg, Al, Si, P and S oxides present. Based on the literature survey, sulfur species interact with aluminum silicates and iron sulfides (FeS), which causes lime mud to appear green in color [
18,
19,
20,
21,
22,
23,
24,
25,
26,
27,
28,
29]. In the calcination (1000 and 1200 °C/2 h) process, the sulfur and phosphorous ions were completely removed from the lime mud sample, but some impurities remained present in a lower amount. However, after hydration at 80 °C /12 h these non-process elements were reduced up to 70 to 80 wt%, with improved powder whiteness.
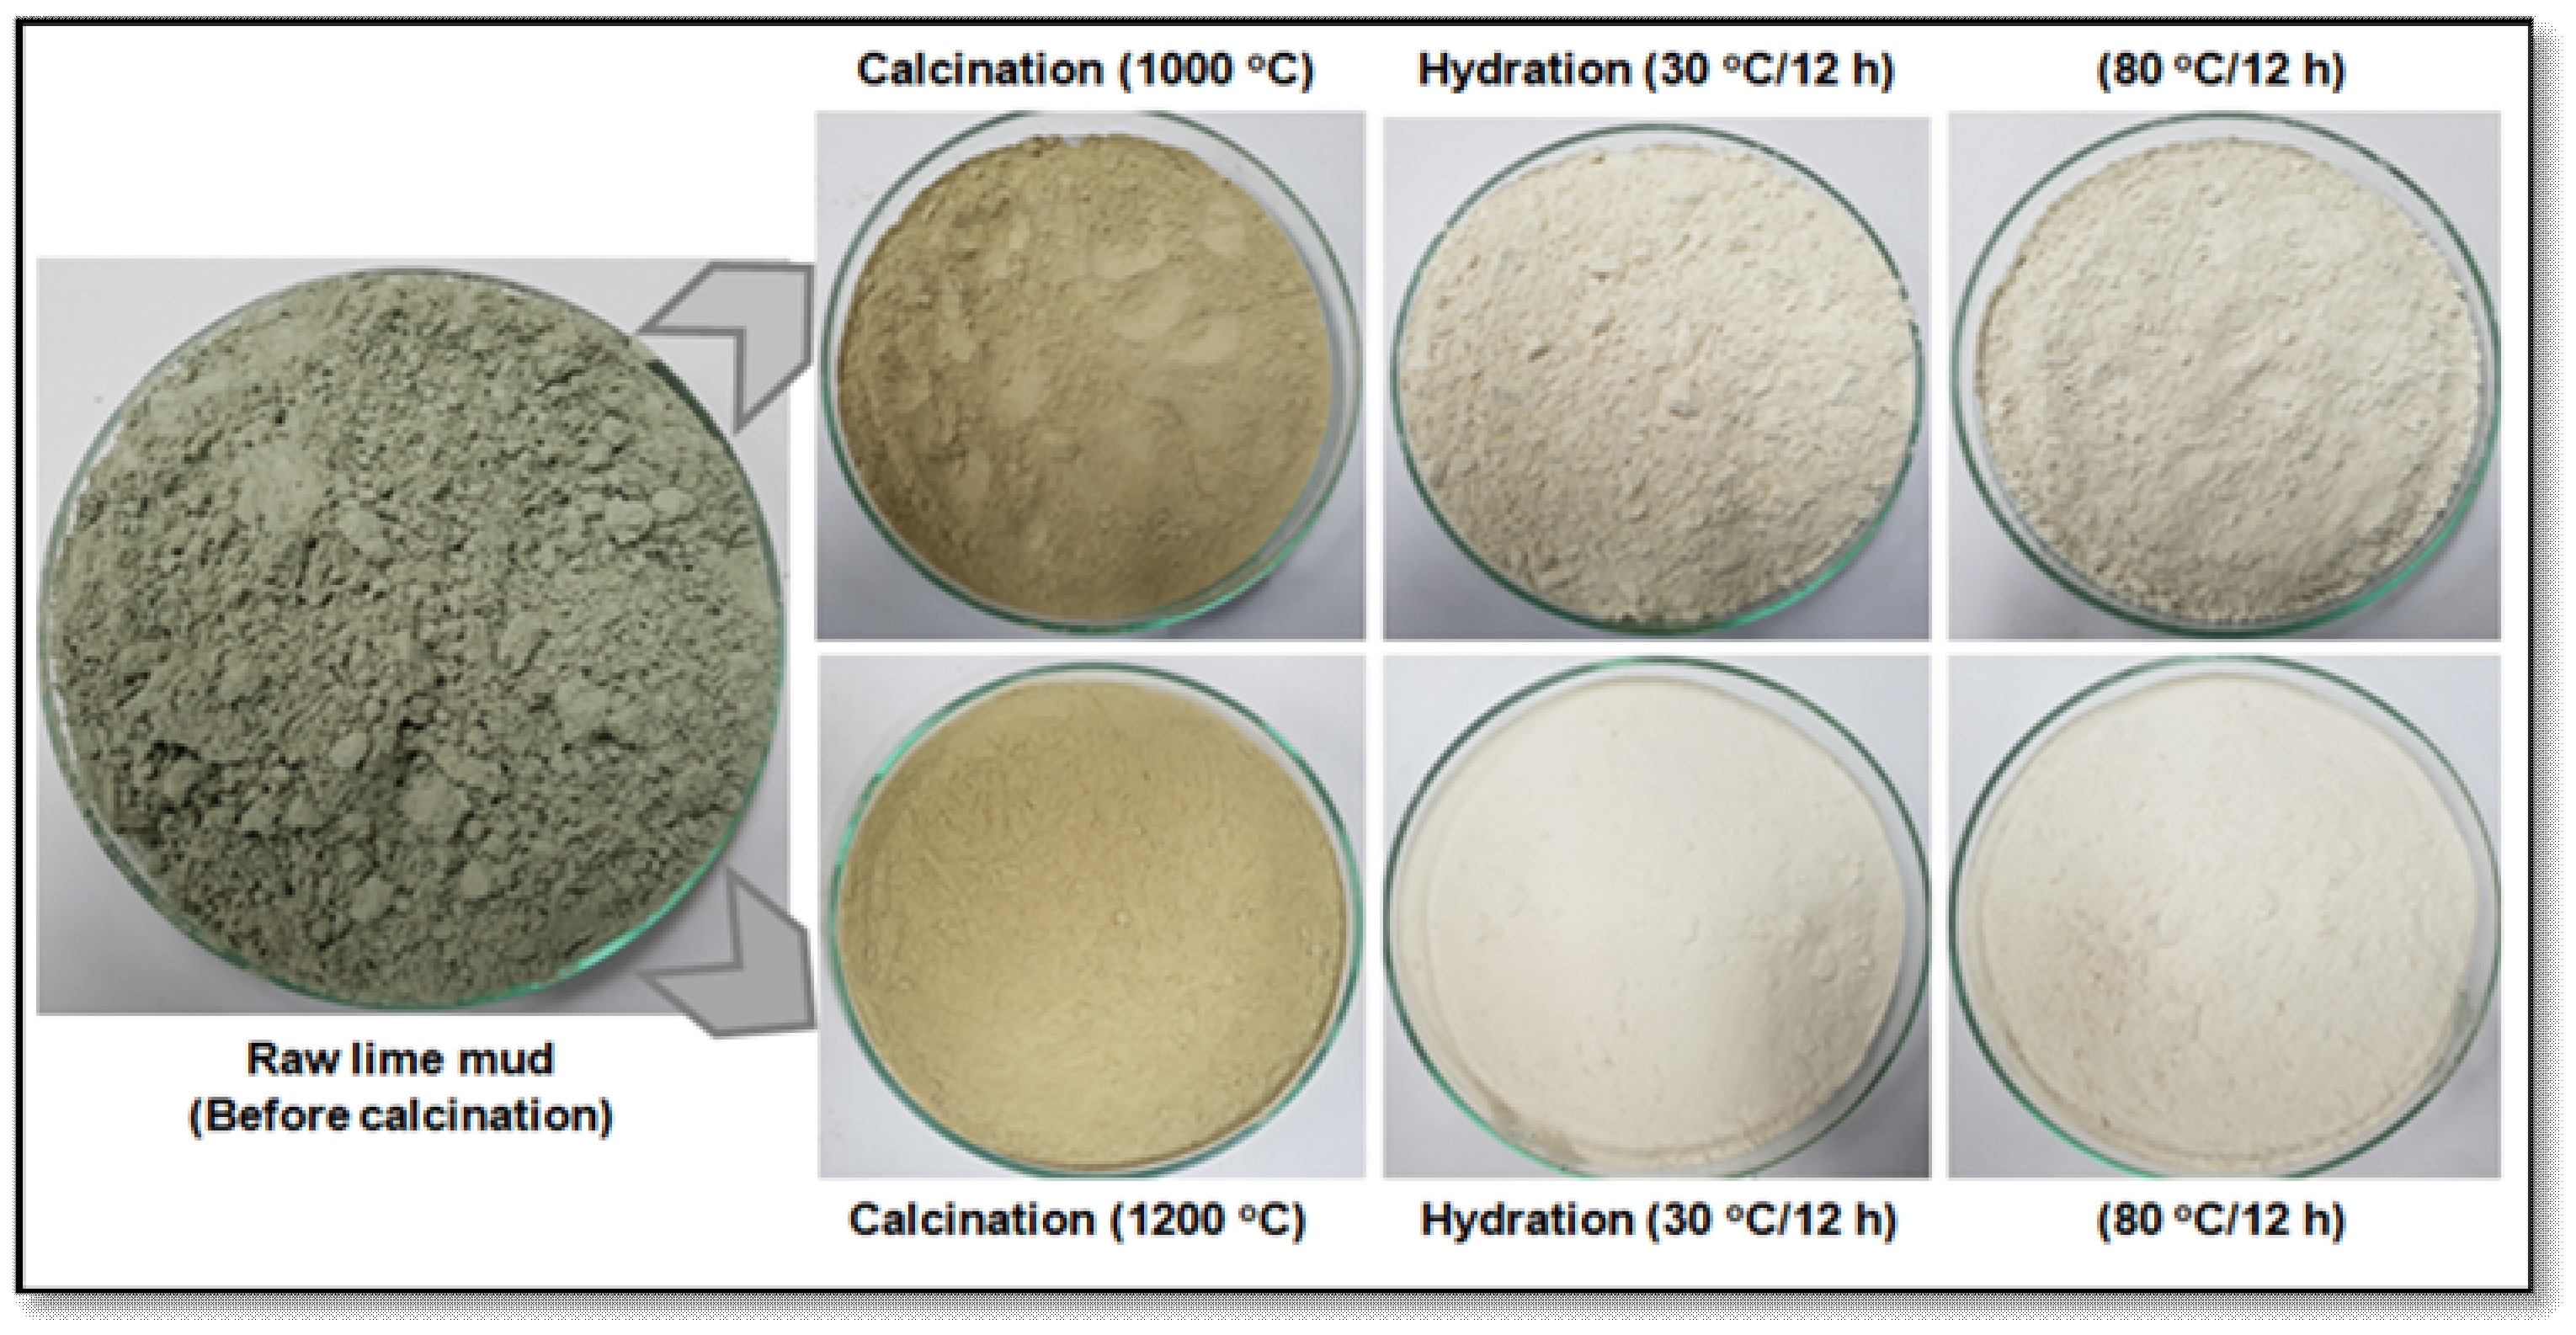
3.2. The Effect of Temperature on the Hydration Process of the Lime Mud Samples
Temperature is one of the key determining factors for improving the whiteness of the lime mud sample. In these experiments, we took two different calcinated (1000 and 1200 °C/2 h) lime mud samples for the hydration process at two different temperatures, i.e., at 30 °C and 80 °C for a 12 h reaction time, as shown in
Figure 4. The results in
Table 5 show that the raw lime mud powder whiteness is very low, but after the calcination and hydration process the whiteness of the powder can be improved with increasing the hydration temperature from 30 °C to 80 °C for a 12 h contact time.
The effect of temperature on the hydration process of the raw lime mud and calcinated lime mud powder whiteness is shown in
Table 5. The results indicate that the raw lime mud sample has poor whiteness due to the presence of high impurities such as Fe, Na, Mg, Al, Si, P, and S elements with CaCO
3, which were described in the SEM-EDS results in
Section 3.1. The non-process green color compounds formed from sulfides and aluminosilicate compounds are well known [
32,
33,
34] and were also confirmed by the SEM-EDS results. These sulfide species combine in varying amounts with the aluminosilicate mineral sodalite to form the intensely colored pigments aquamarine green, blue and red. In the calcination process, the Na, P, S composition was reduced and produced lime (CaO) with some other minor impurities, and the calcinated lime mud sample powder whiteness was very poor. But hydration at 80 °C for a 12 h contact time can improve the maximum powder whiteness more than hydration at 30 °C/12 h, as shown in
Figure 4. The results indicated that the calcinated lime mud samples hydration at higher temperatures (80 °C /12 h), can produce more white powder when compared to lower temperatures (30 °C/12 h). They indicate that increasing temperatures for the hydration process are more effective in reducing the impurities and enhance the lime mud powder whiteness.
3.3. The Effect of Time on the Hydration Process of Lime Mud Samples
For improving the whiteness of the lime mud sample, the hydration experiments were conducted at 80 °C for different contact times. In this experimental process, the raw lime mud and two different calcinated (1000 °C /2 h and 1200 °C /2 h) lime mud samples were used in the hydration process.
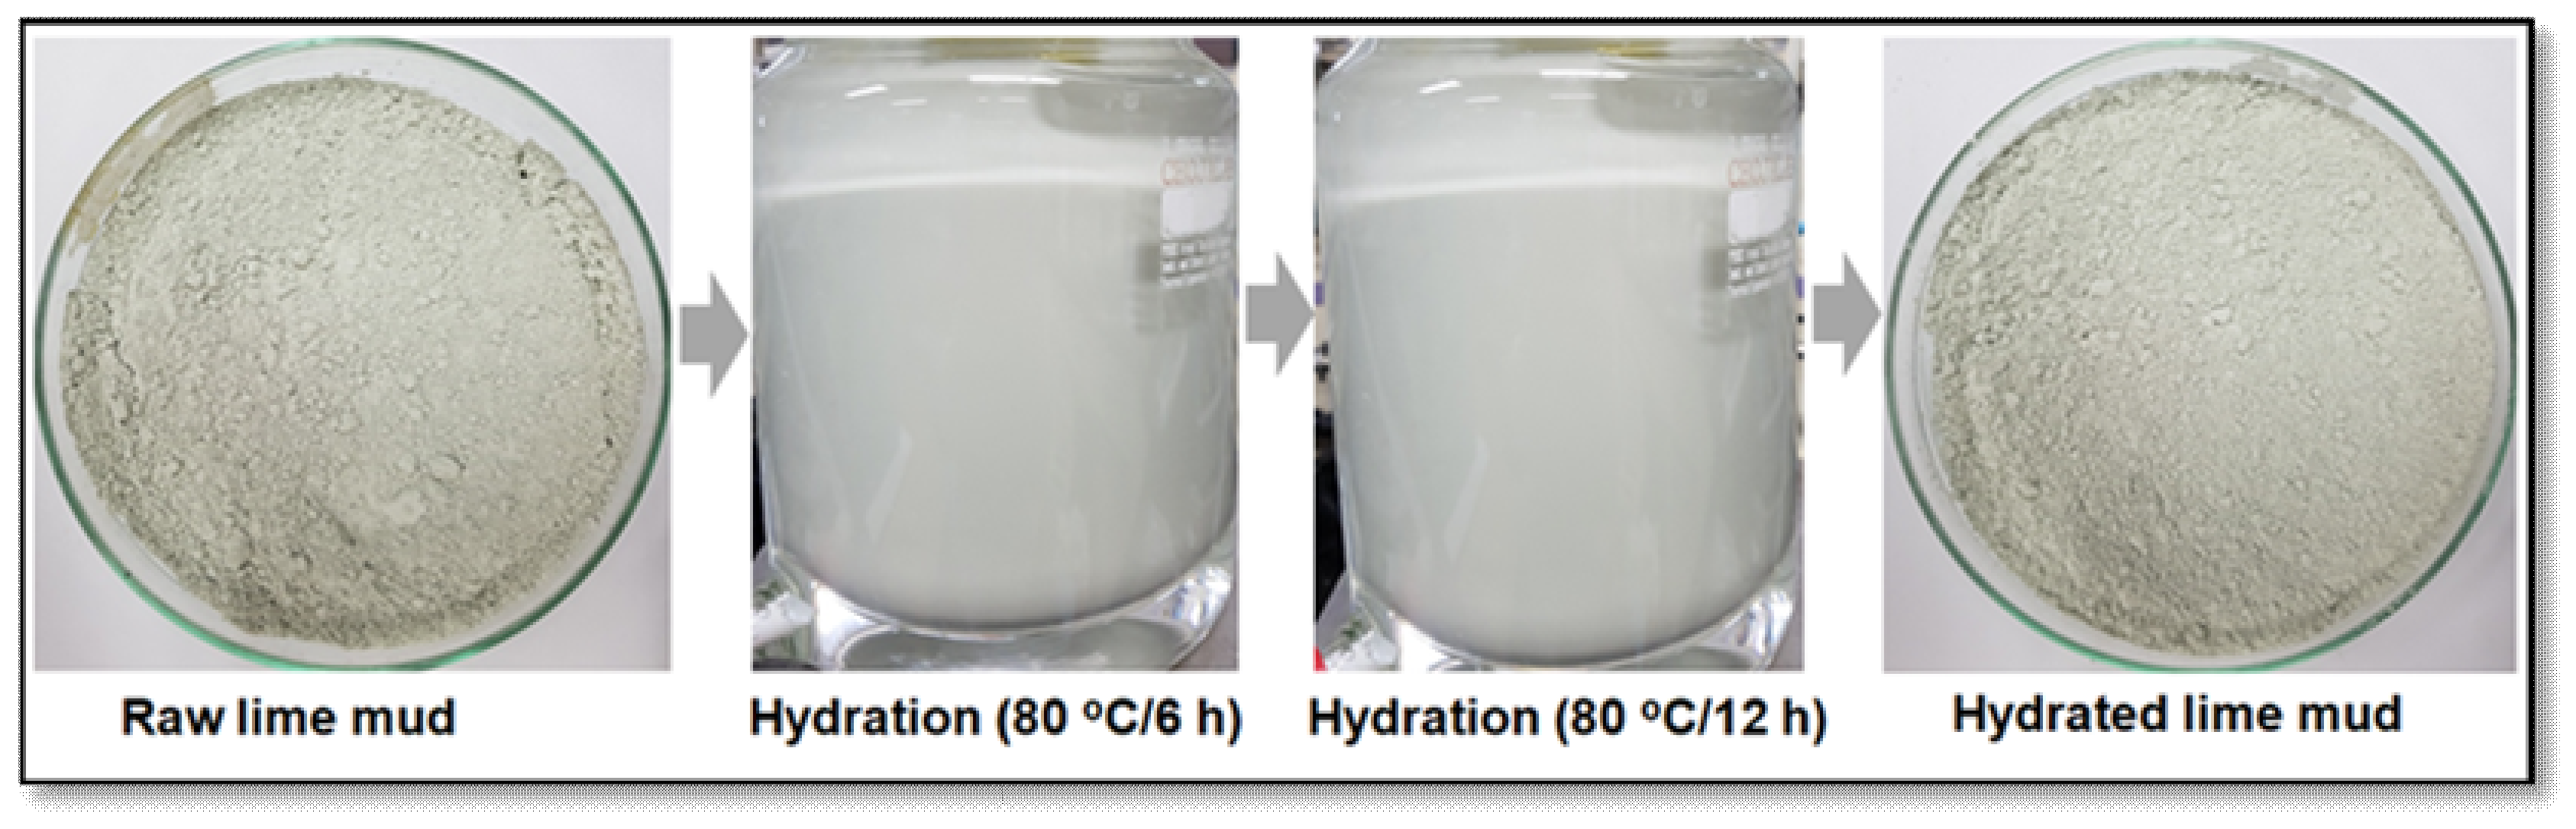
3.3.1. Hydration of Raw Lime Mud
In the hydration experiments, the raw lime mud (CaCO3) sample was used for hydration at 80 °C for a 6 h and 12 h contact time. After the hydration process, the sample was filtered and dried at 80 °C for 12 h. The results indicate that the hydration process has no effect on reducing impurities from raw lime mud samples and the green color does not disappear.
The results shown in
Figure 5 indicate the green color impurities of lime mud were not removed due to a stable form of calcite, and cannot react in the hydration (80 °C /12 h) process for reducing non-process elements and the powder whiteness was not improved. But after the calcination process, the stable form of calcite was converted into pure lime (CaO) by the heat treatment, and it effectively reacted with water in the hydration process to produce Ca(OH)
2 slurry, as shown in Equation (3).
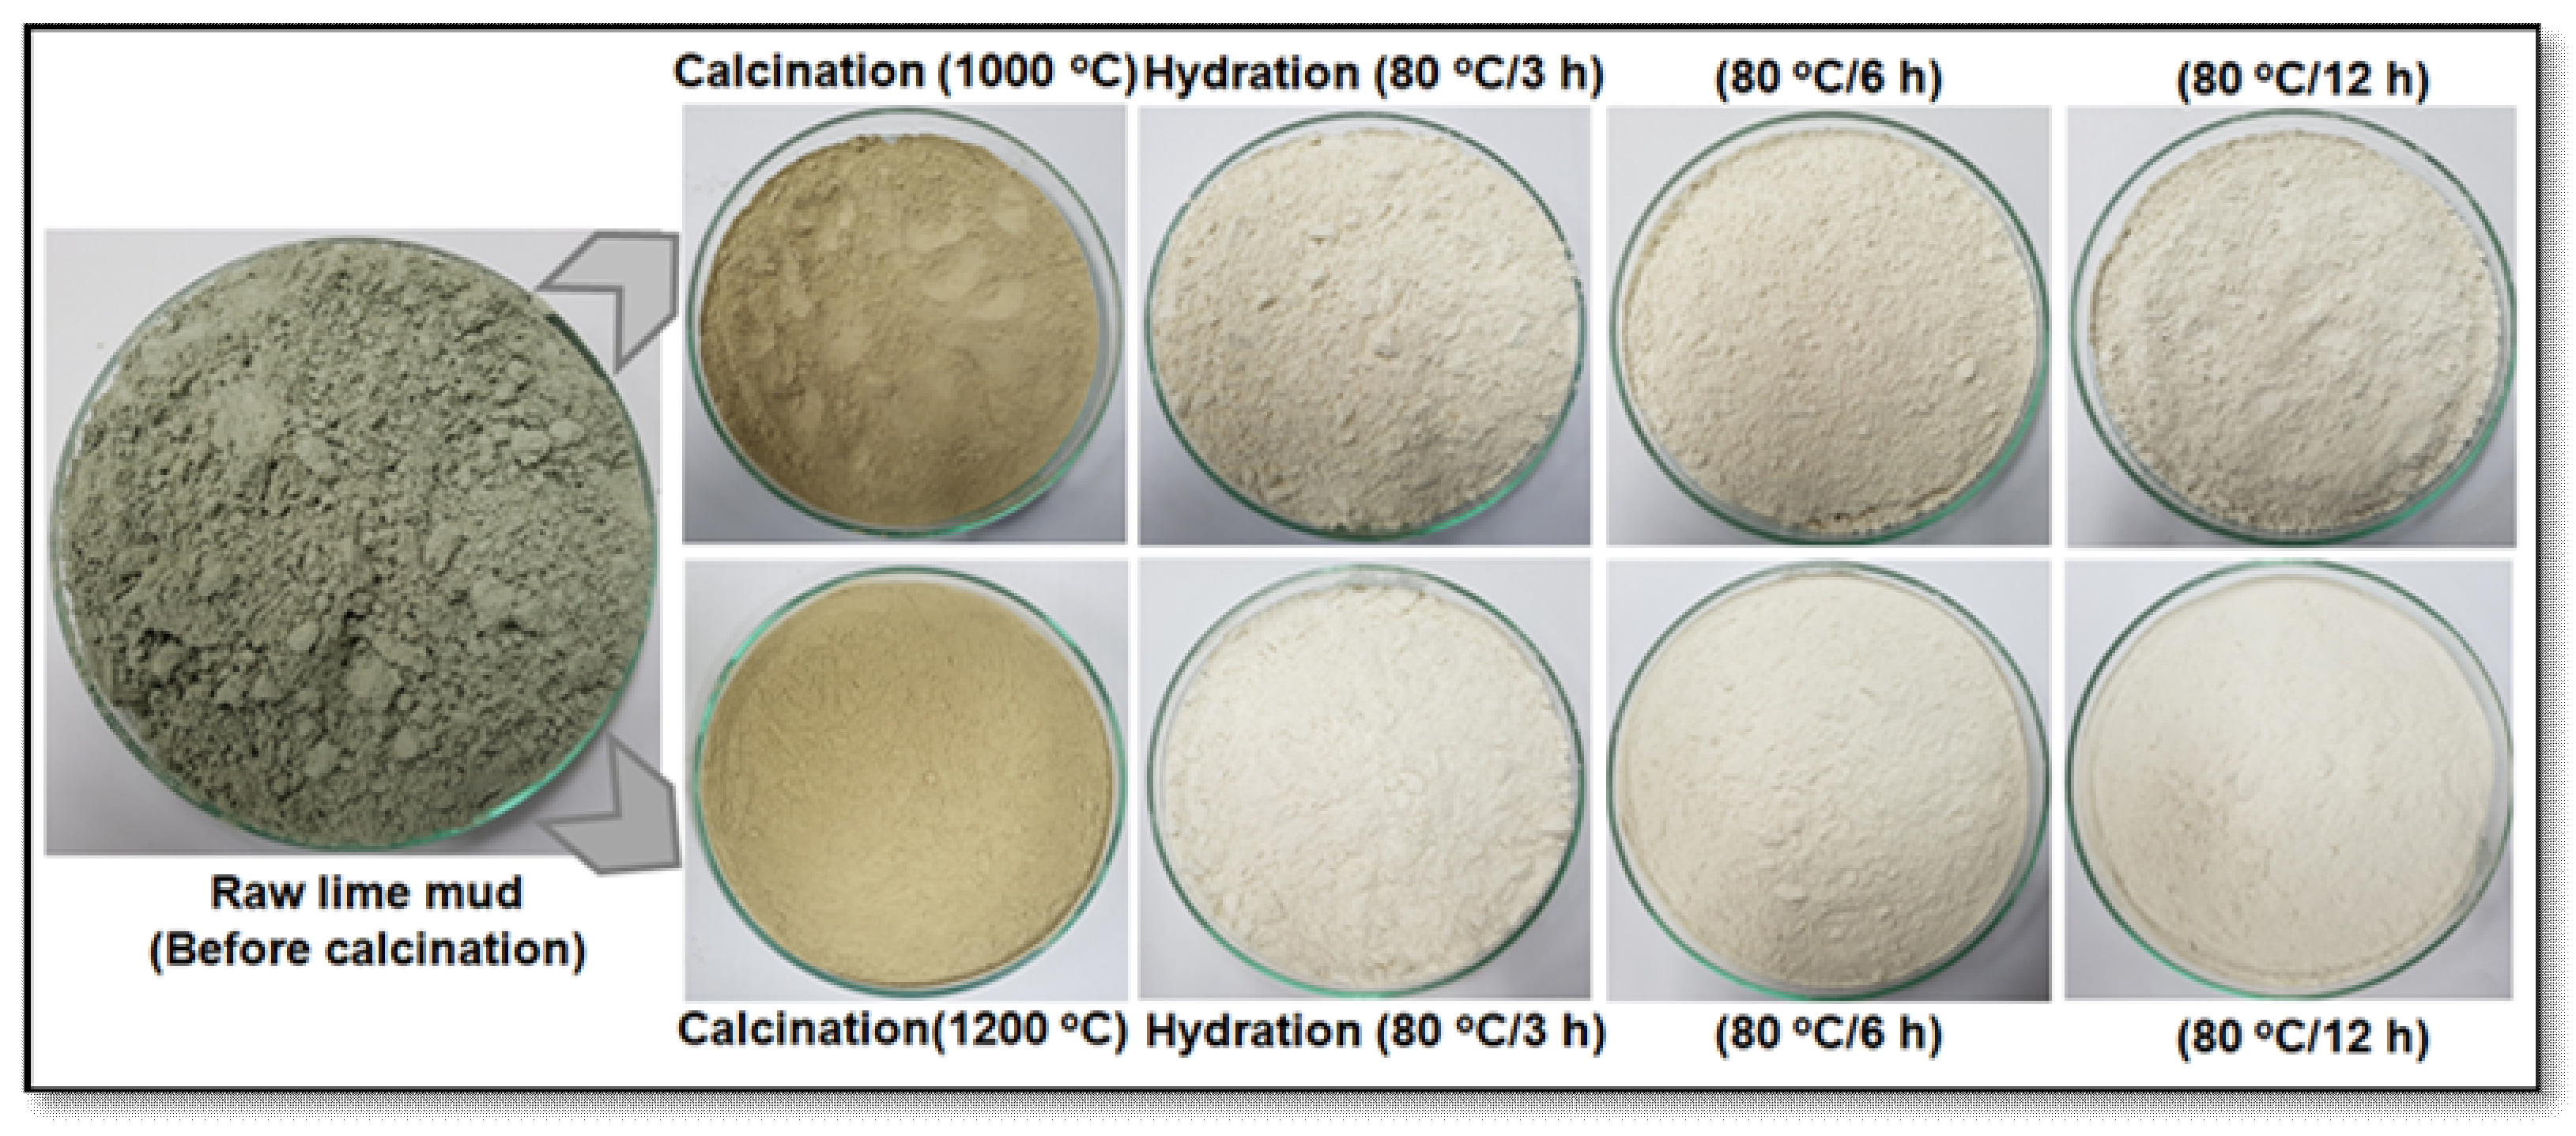
3.3.2. The Effect of Hydration with Different Contact Time for the Calcinated Lime Mud Samples
In the hydration process, we measured the effect of reaction time on improving the whiteness of the calcinated (1000 °C and 1200 °C /2 h) lime mud sample at 80 °C for a 3 to 12 h reaction time durations, as shown in
Figure 6. The results show that, when the reaction time was increased, the powder whiteness also gradually increased at higher temperatures, as shown in
Table 6. The hydration effect for improving lime mud powder whiteness during with different contact timings at 80 °C.
The experimental results describe the time effect of the calcinated lime mud sample in the hydration process at 80 °C for 3 h, 6 h, and 12 h contact time. In these experiments, we used two different lime samples for hydration: (a) calcinated at 1000 °C /2 h lime mud, and (b) calcinated at 1200 °C /2 h lime mud samples. The final product was received after the filtering and drying processes; the dried lime mud powder is shown in
Figure 6. The powder whiteness results are described in
Table 6. The powder whiteness of the dried hydrated sample (a) was increased from 78.88 to 86.62, 87.45, and 88.79 by increasing the hydration reaction time to 3 h, 6 h, and 12 h, respectively. The powder whiteness of sample (b) also gradually increased from 78.88 to 88.54, 89.41, and 89.67 with the same increasing reaction times. These results suggest that the maximum non-process elements were reduced in a 1200 °C /2 h calcination process and more powder whiteness was obtained from the 12 h hydration process at 80 °C. This white color powder was used for making a hand sheet through the in-situ carbonation process.
The calcination (1000 °C and 1200 °C /2 h) and hydration (3 to 12 h at 80 °C) experimental results clearly explain that the optimal condition for obtaining more whiteness of the powder was the calcinated (1200 °C /2 h) lime mud sample hydrated at 80 °C/6 to 12 h contact time, as the rate of reducing the non-process elements from lime mud is higher at higher temperatures. This is indicated in the SEM-EDS results in
Section 3.1. During the calcination process, impurities such as Na
2O, P
2O
5, and SO
3 were separated by evaporation; later, these calcinated lime samples were hydrated and produced Ca (OH)
2.
3.4. Preparation of Hand Sheets by the In-Situ Carbonation Process
The preparation of the hand sheet by an in-situ carbonation process was carried out by gaseous CO
2 injection into the KP pulp slurry (5 mass%). The experimental details for papermaking with KP pulp by adding purified lime mud samples with different ratios of commercial Ca (OH)
2 are shown in
Table 2. In this process, the maximum improved whiteness (89.67) of the lime mud powder was synthesized from the optimized condition of calcinated at 1200 °C /2 h and hydrated at 80 °C /12 h. The most white colored hydrated lime mud powder, along with commercial Ca(OH)
2, was used for making hand sheets for comparison of the brightness of the sheets, as shown in
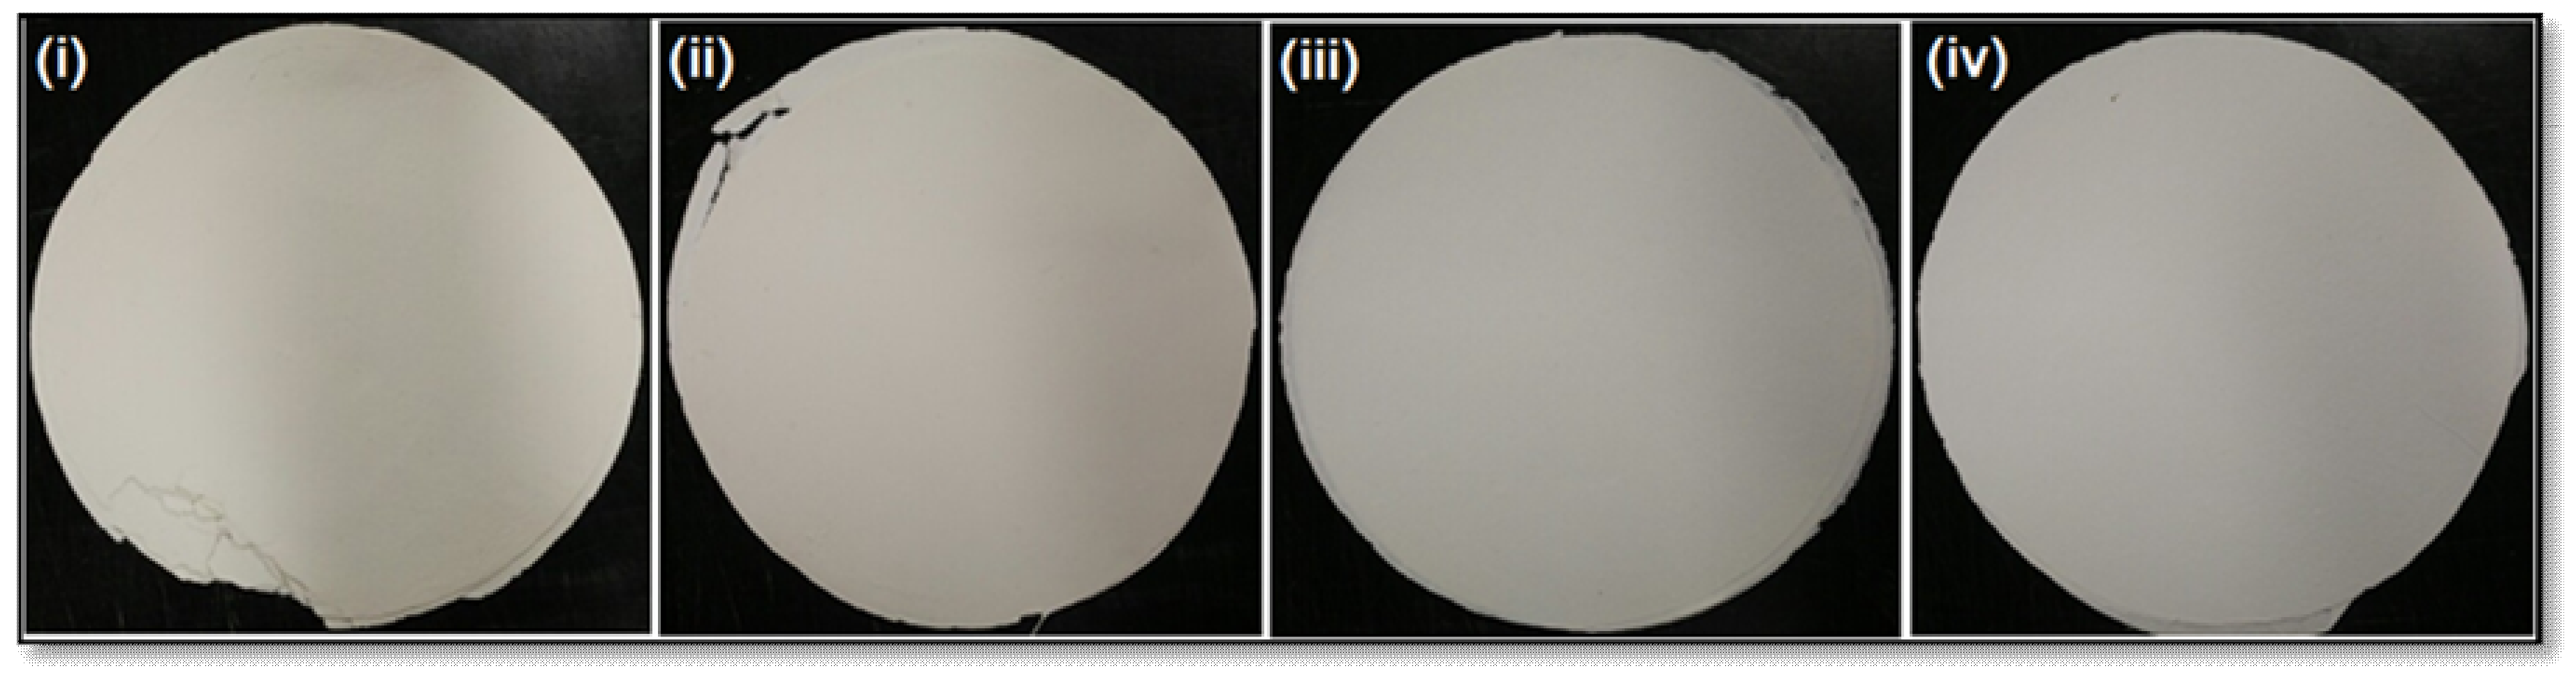
Figure 7.
In
Table 7, the sample (i) results suggested that by using 30 g of purified Ca(OH)
2 from lime mud waste by the calcination and hydration process, one is able to make handmade sheets with a maximum brightness of 82.03, as shown in
Figure 7i. The commercial Ca(OH)
2 utilizing handmade sheets had a brightness of 91.24, as shown in
Figure 7iv. This indicates that the maximum purified Ca(OH)
2 was synthesized by the optimal conditions of the calcination (1200 °C /2 h) and hydration (80 °C /12) process, and can utilized as a filler to prepare handmade sheets with improving brightness that is close that of to commercial Ca(OH)
2 utilizing paper. The combination treatment of the 20 g lime mud sample with 10 g Ca(OH)
2 as described in sample (ii), can produce a hand sheet brightness of 85.17, as shown in
Figure 7ii. The other combination treatment of 10 g lime mud sample mixing with 20 g Ca(OH)
2, as described in sample (iii), can produce the brightness of 86.22, as shown in
Figure 7iii. These results indicate that when the commercial Ca(OH)
2 increased, the paper brightness also slightly increased. Using lime mud samples with commercial Ca(OH)
2 is beneficial to making different brightnesses of the papers as per consumer convenience for utilizing the paper.
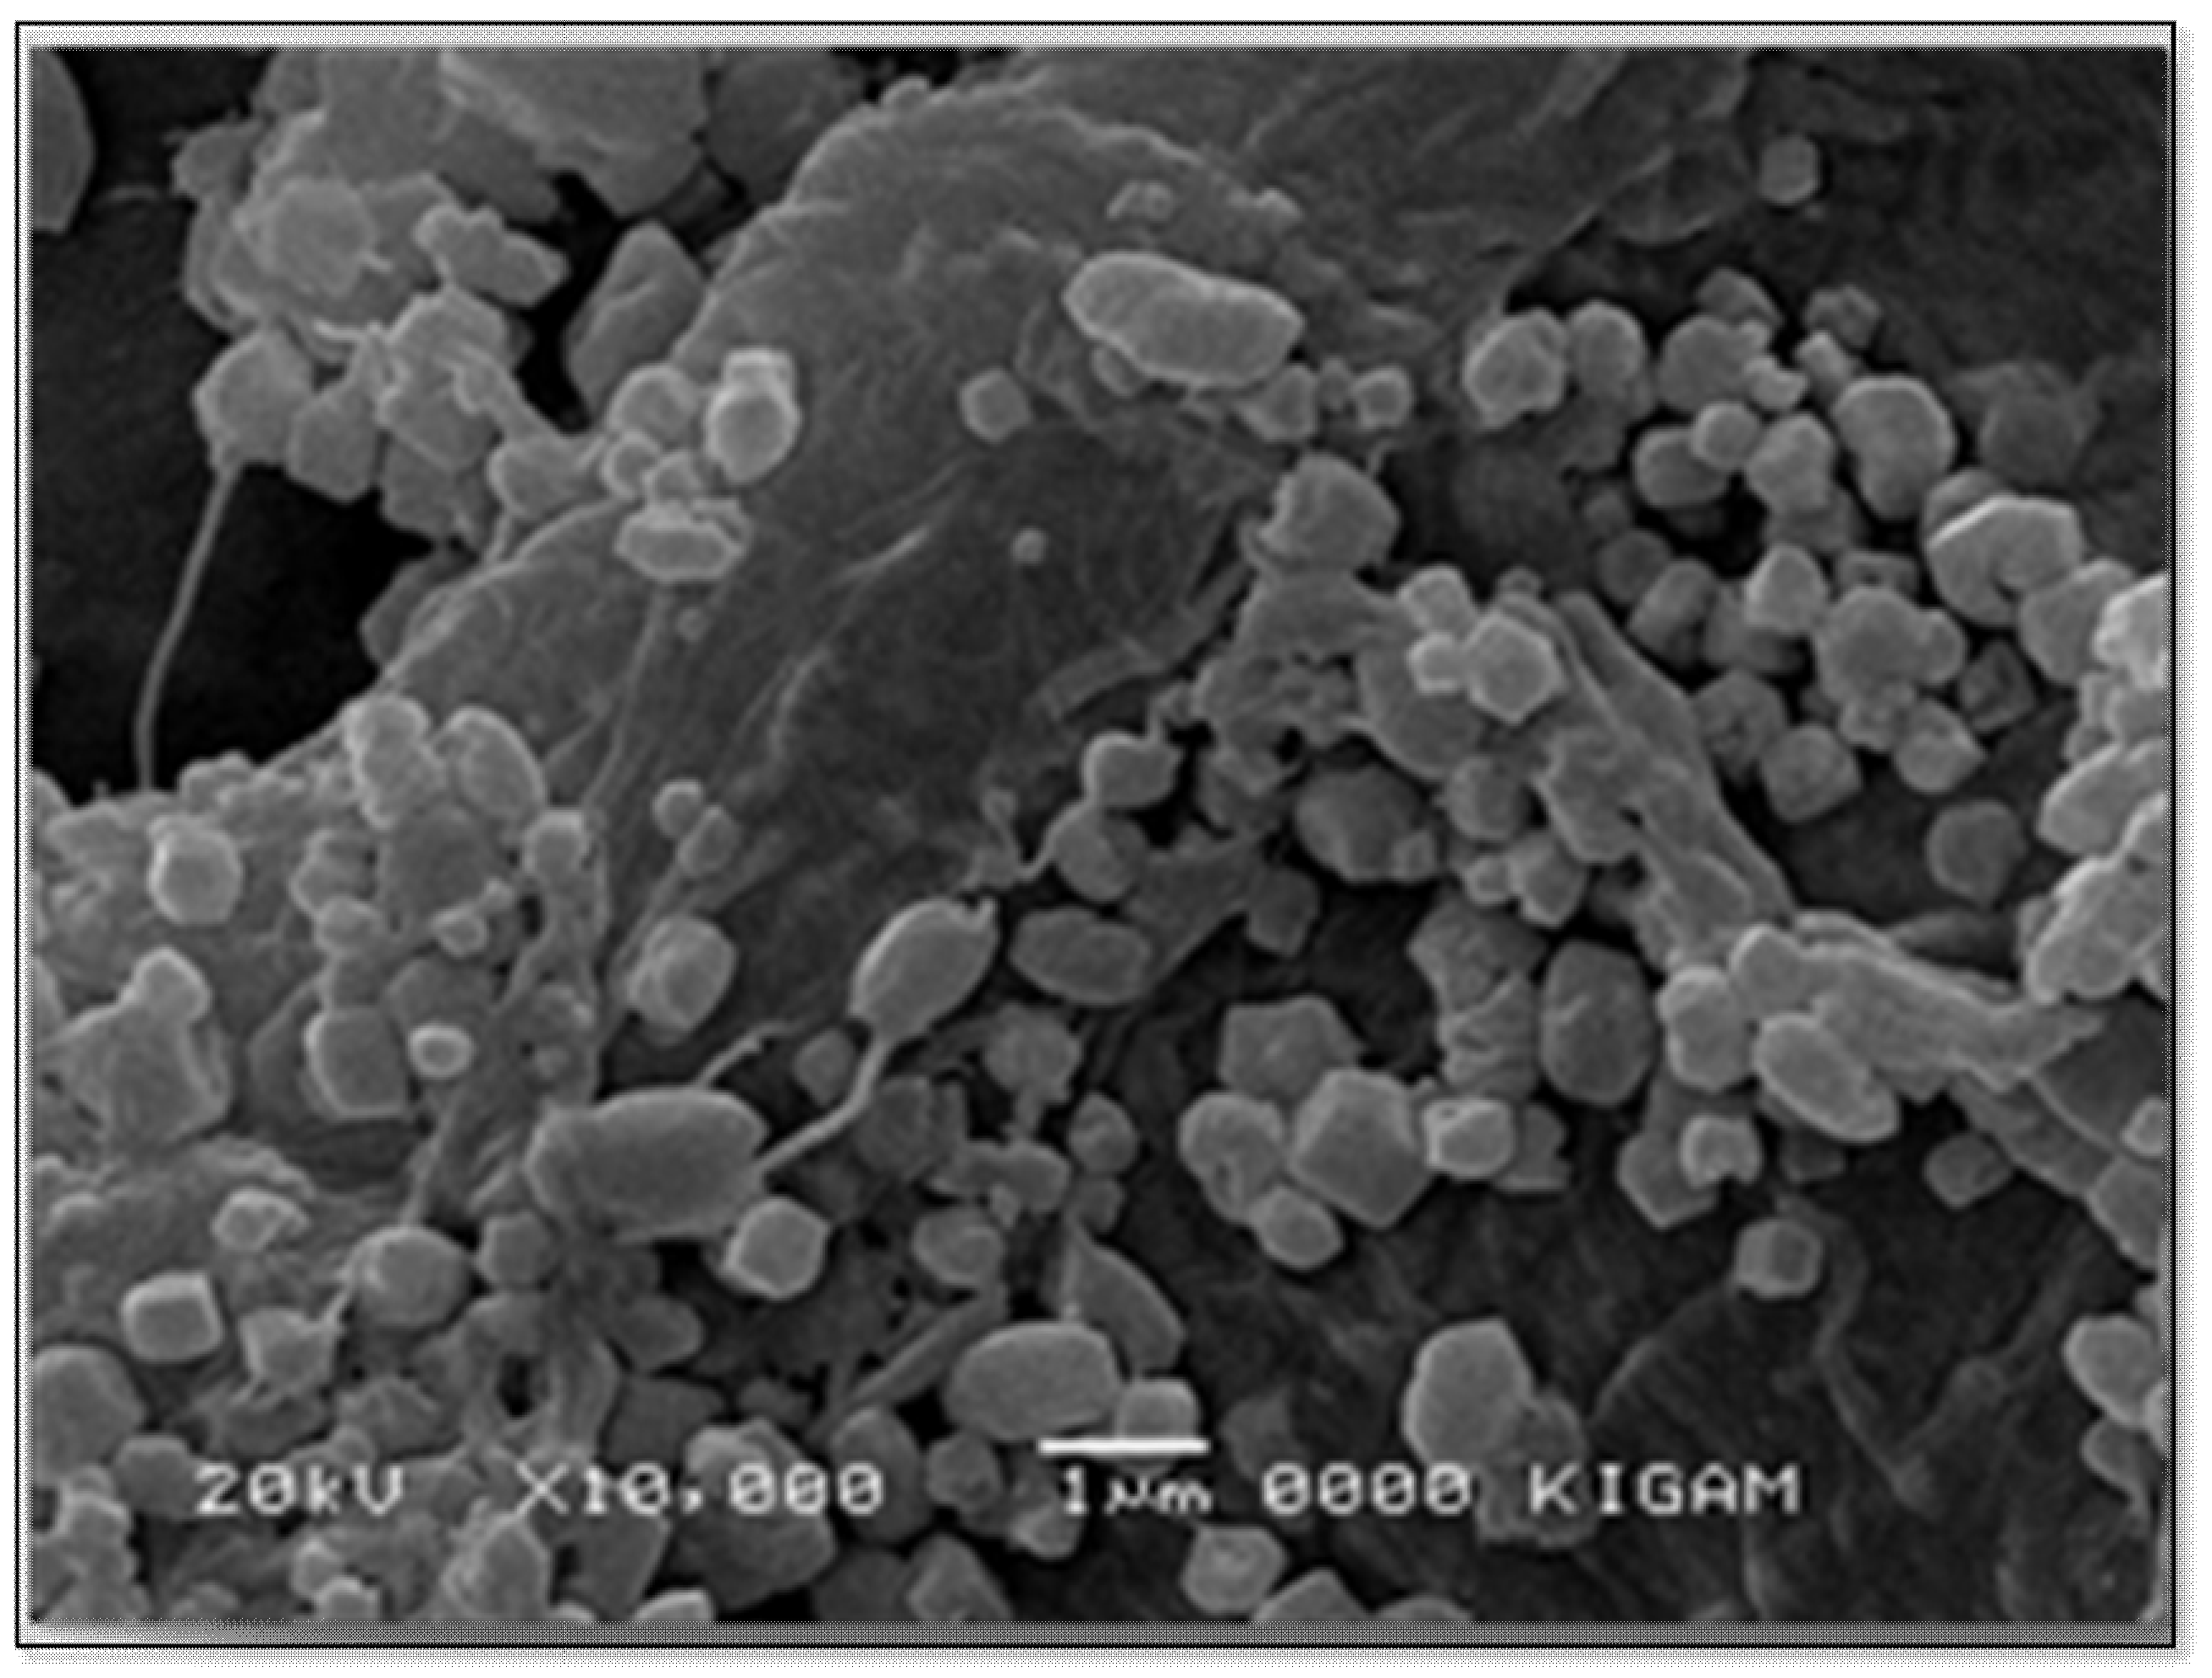
The brightness results indicate the reutilization of purified lime mud samples is more beneficial for papermaking industries. The results also suggest that the purified lime mud sample used for hand sheet with KP pulp can produce a greater brightness (82.03) of the paper, but in the combination treatment with commercial Ca(OH)
2 the paper brightness was gradually increased by increasing the Ca(OH)
2 concentration. The SEM images of hand sheets with lime mud presented in
Figure 8 indicate that the calcite form of CaCO
3 can be utilized as a filler to interact with pulp for improving the mechanical properties with paper brightness by the in-situ carbonation process.

 ,
, 


