Cobalt Catalyst Reduction Thermodynamics in Fischer Tropsch: An Attainable Region Approach


Institute for the Development of Energy for African Sustainability (IDEAS), College of Science, Engineering and Technology, University of South Africa (UNISA), Florida Campus, c/o Christiaan de Wet & Pioneer Avenue, Johannesburg 1710, South Africa
*
Authors to whom correspondence should be addressed.
Reactions 2020, 1(2), 115-129; https://0-doi-org.brum.beds.ac.uk/10.3390/reactions1020010
Submission received: 28 October 2020
/
Accepted: 13 November 2020
/
Published: 17 November 2020
Abstract
:A fundamental understanding of the precise reduction reaction pathway of cobalt-based catalysts is a crucial piece of knowledge in terms of the Fischer–Tropsch Synthesis (FTS) reaction. The use of hydrogen (H2) as the reduction agent results in a two-stage reduction of cobalt tetraoxide (Co3O4) to cobalt oxide (CoO) and then to metallic Co. The objective of the present work is to apply the Thermodynamic Attainable Region (TAR) to cobalt catalyst reduction using H2 so as to gain better insight regarding the thermodynamics of reduction reaction. TAR space diagrams suggest that complete Co3O4 reduction is feasible through two reaction pathways. Thus, the observed AR results suggest that the temperature programmed reduction’s (TPR) first reaction peak may be attributed to direct reduction of Co3O4 → Co and/or reduction to an intermediate compound Co3O4 → CoO. The second peak is a result of the reduction of either of the cobalt oxides to Co (Co3O4 → Co or CoO → Co).

1. Introduction
Catalyst reduction is an important process in Fischer Tropsch Synthesis (FTS) reactions. Fischer Tropsch practitioners perform a temperature programmed reduction (TPR) on a catalyst to establish the temperature at which reduction occurs [1]. The reduction temperature is usually a function of the metal used, the support and the catalyst synthesis method. Different approaches have been used to study catalysts during reduction reaction, and some researchers have used in situ characterization techniques to monitor cobalt catalyst phase changes during reduction.
Pioneering work done by Jacobs et al. [2] at the Center for Applied Energy (CAER) explored the chemical transformations occurring during cobalt based catalyst reduction in H2 using TPR-XANES/EXAFS [2]. The study gave insight into the nature of the cobalt species present along the trajectory of a standard TPR experiment, which showed the existence of a first peak between 200 °C and 400 °C, where reduction of Co3O4 to either CoO or Co occurs. The authors also reported that cobalt crystallite size changes during reduction as a function of temperature and the dependency on the strength of the catalyst support interaction with the cobalt oxide species [2]. Recently, several researchers have been using in-situ analysis to understand reaction pathways and behaviours, such as Kumar and fellow researchers who used a combined in-situ XRD and in situ XANES to study the reduction behaviour of a rhenium-promoted cobalt catalyst [3]. The study showed a typical two peak reduction profile, and indicated crystalline sizes and the Co-hcp/Co-fcc ratios at different temperatures. More advanced tools, which provide better penetration capability and brilliance with hard X-rays from a synchrotron source, are now employed to investigate catalyst reduction reaction under in-situ conditions and in a time-resolved manner.
Normal TPR experiments carried out with a Micromeritics Auto Chem II unit [4] or a Zeton-Altamira AMI-200 unit [2] (both of which employ a thermal conductivity detector (TCD)) only revealed two peaks, which correspond with Co3O4 reduction to CoO, and subsequently CoO to Co. This speciation happens as a function of reduction temperature.
The reduction performance of the heterogeneous cobalt catalyst in H2 could also be analyzed using a thermodynamic approach. A novel Thermodynamic Attainable Region (TAR) approach that has previously been applied to reactor optimization [5] was applied in this study, in order to predict catalyst speciation. The Gibbs free energy (G) minimization approach can be applied to show speciation direction in the TAR space. These TAR diagrams can be viewed as predictive tools that give insight into catalyst speciation in the reactor for any given conditions. In order to determine the optimum reduction condition, one needs to know how the changes in Gibbs free energy (∆G) affects the catalyst speciation with any given condition. The AR method is a technique that can help build and optimize phase changes in a cobalt reduction system. The TAR is defined as the set of all possible outcomes that can be achieved for the system under consideration, using the fundamental processes operating within the system and which satisfies all constraints placed on the system [6].
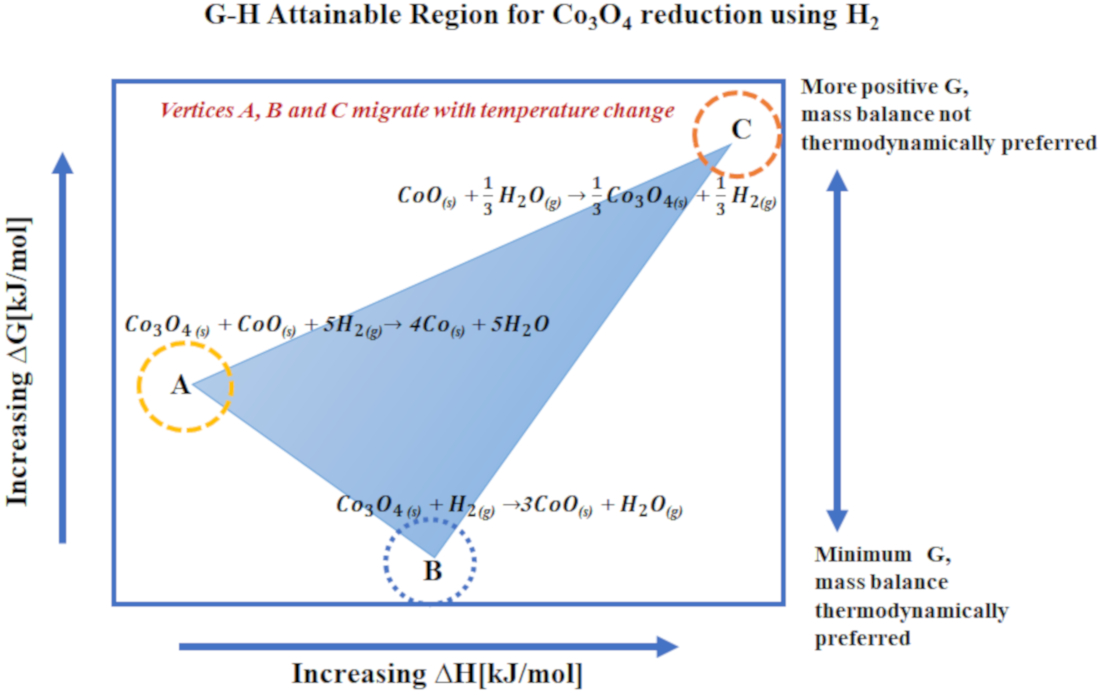
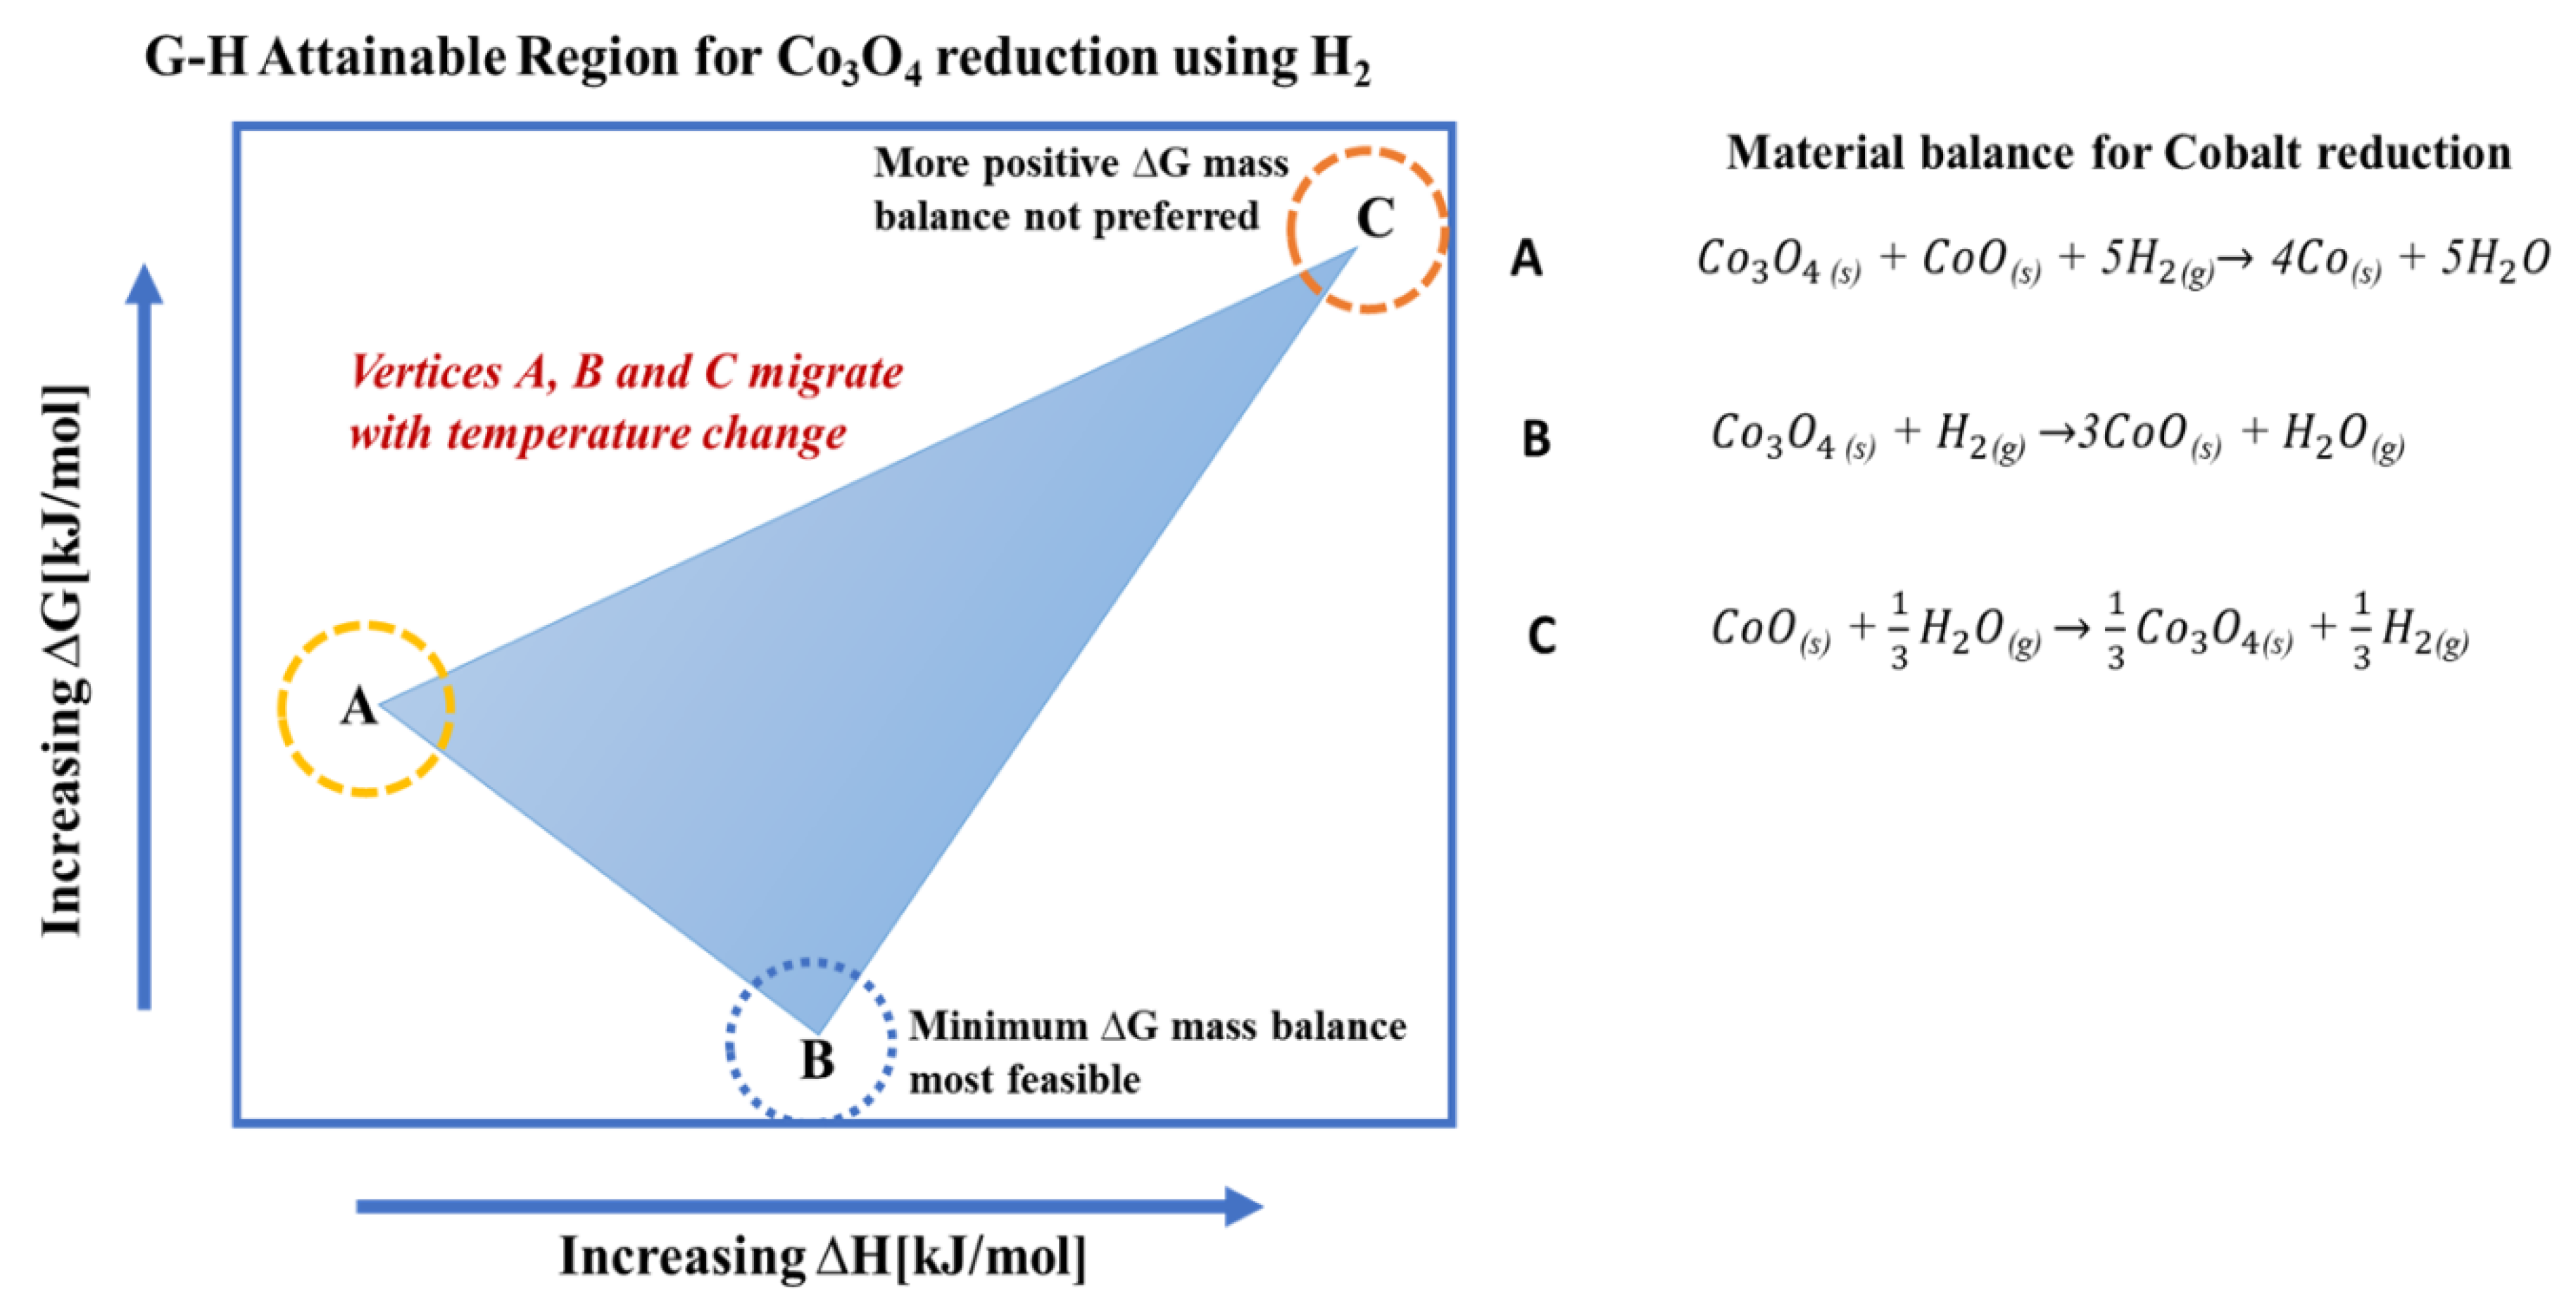
The AR has also been extended to processes (rather than only reactors), and feed and products can be specified to achieve a specific goal [7]. The technique has been used to develop high-level design process flow sheets that represent the limit of what is thermodynamically achievable. The resulting process flow sheets convert raw material to desired products with efficient energy consumption, while operating as close as possible to reversibility [8]. A set of independent material balances are determined, and the AR is found in the space of extents of reaction [9]. This region represents the set of all possible outputs from all possible processes and can be useful in identifying desired processes [5,8]. This TAR is referred to as the Material Balance-Attainable Region (MB-AR). The MB-AR is used to obtain a TAR in a G-H space; we call this the Gibbs free energy-Enthalpy Attainable Region (G-H AR), which defines the heat and work requirements for all possible reaction processes. A typical G-H AR is shown in Figure 1.
The method described in this research article for establishing optimum conditions for cobalt reduction thermodynamically is based on the determination of minimal G at different temperatures. This thermodynamic study should be useful for predicting optimum temperatures at ambient pressure for the desired phase. The thermodynamics of the precursor speciation is governed by the reduction gases used, and this tends to influence the activity, selectivity and catalyst life span.
2. Materials and Methods
2.1. Temperature Programmed Reduction (TPR)
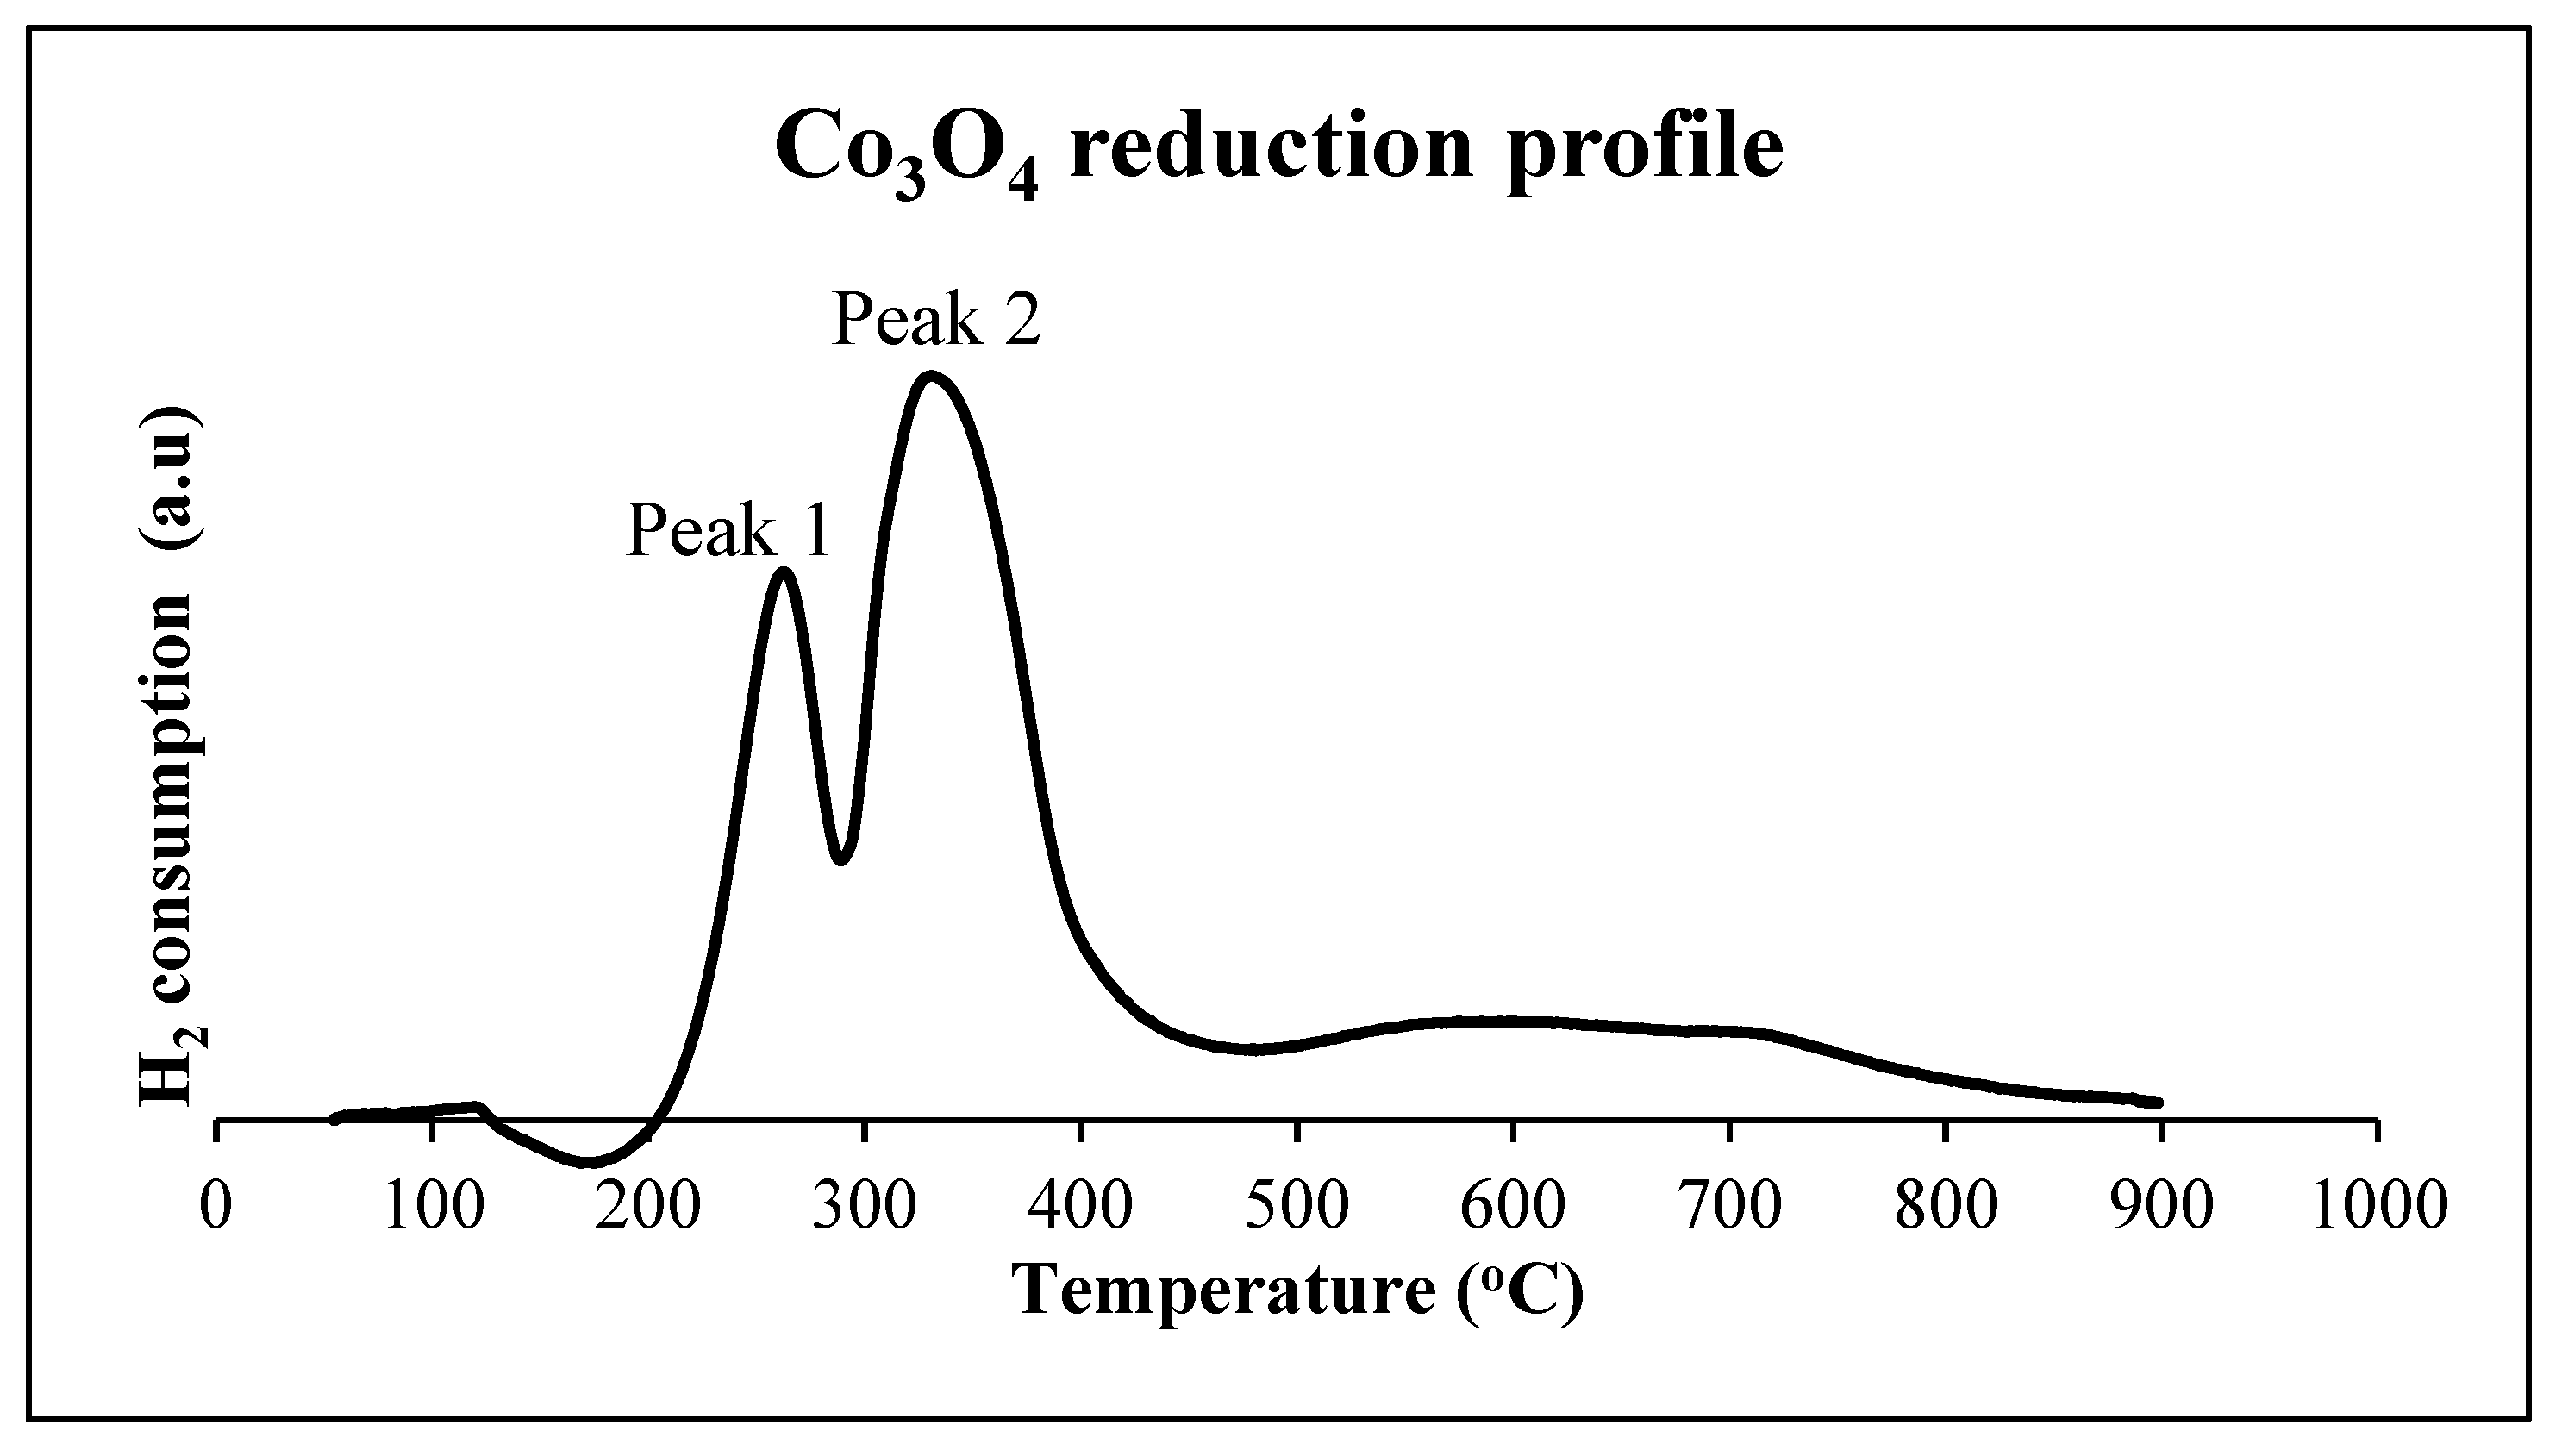
TPR experiments of the 10% Cobalt/Zeolite catalyst were carried out using a Micromeritics Auto Chem II unit (Norcross, GA, USA). The catalyst (approximately 50 mg) was placed in a quartz tubular reactor, fitted with a thermocouple for continuous temperature measurement. The reactor was heated in a furnace. Prior to the TPR measurement, the calcined catalyst was flushed with high-purity argon (99.999% from African Oxygen Limited South Africa (Afrox, South Africa), at 200 °C, for 30 min, to remove water and/or any impurities. It was then cooled to ambient temperature. Thereafter, 5% H2/Ar (African Oxygen Limited, South Africa) was introduced and the temperature was raised at a rate of 10 °C/min from 50 to 850 °C. The gas flow rate through the reactor was controlled by three Brooks mass flow controllers and maintained at 50 mL/min. The H2 consumption (TCD signal), as a function of temperature, was recorded. The results are shown in Figure 2. Generally, different catalyst supporters and promoters affect the TPR pattern.
For any given loading of cobalt on the catalyst, 1 mole of Co3O4 spinel will produce 4 moles of water during reduction—Equation (1).
The temperature programmed profile suggests the existence of two elementary reactions. The first corresponds to complete reduction of Co3O4 to CoO, which consumes one hydrogen molecule—Equation (2).
The predicted second elementary reaction involves the consumption of hydrogen molecules to make active Co—Equation (3).
The cobalt catalysts generally exhibit two peaks in TPR: a sharp first peak and a second broader peak at a higher temperature.
2.2. Attainable Region Approach (AR)
The method to obtain the MB-AR described here is similar to the one described by Okonye et al. for the methanol synthesis process [9]. In order to determine the MB-AR for the cobalt system, one should initially come up with three possible material balances, as given by Equations (1)–(3) and determine what the favoured products would be for a system involving these material balances under different conditions. These three material balances (reaction 1, 2 and 3) have traditionally been used to define the reactions taking place during the cobalt reduction process.
2.3. Achieving the MB-AR in Extent of Reaction Space
Material Balance-Attainable Region in the extent space is the plot of the region containing all possible sets of the extent of the reactions or material balances. Exact chemical reactions are not always known in a reactive system; thus, it is useful to use the concept of independent reactions or material balances. The cobalt system studied has five chemical species, namely Co3O4, H2, Co, H2O, CoO. These are used to determine the independent material balances. The independent material balances are obtained in a similar manner as that used to obtain the independent reactions. In fact, independent material balances and independent reactions can be used interchangeably for reactions. The matrix algebra method developed by Yin (1989) [10] to determine independent reactions was used in this work. The system is arranged into a matrix function (as shown in Table 1) and Gaussian elimination is applied (as shown in Table 2) to find the independent material balances. This is achieved by trying to obtain a single ‘1’ in each column (in any row, but not the same row) and making all other entries zero.
The two independent mass balances are obtained when all components (Co, H, and O) equal zero and are given by Equations (4) and (5), where ε is the extent of reaction. This means that, at any given point in time, the amount of product and the remaining reactant can be determined.
The above independent material balances can be expressed in terms of extent of reaction. This was used to determine the MB-AR in extent space.
Mole balances in terms of extent of reactions are used to determine the feasible region, where the number of moles of each component is either zero or a positive number. The obtained feasible region is thus the MB-AR in the extent space. Table 3 shows that the MB-AR is a function of initial conditions, i.e., initial moles of key components. The MB-AR for the ratios of feed and different species are provided. However, for the scope of this research analysis, two components are specified as feed: NoCo3O4 = 1 and NoH2 = (varied between 0 and excess).
We used the Matlab Mupad (Natick, MA, USA, Matlab version R2018a) functions to solve the inequalities in Table 3 and thus to obtain the MB-AR. The Mupad function also allows us to determine the vertices of the MB-AR in terms of extents (ε1, ε2). The vertices are crucial, because the minimum G in the G-H space at any given conditions is found at one of the vertices (Matlab scripts and further description of the methodology are given as supplementary material).
2.4. Plotting the AR in a G-H Space
The AR in a G-H space (G-H AR) can be constructed from the MB-AR, using the thermodynamic properties of Gibbs free energy and enthalpy at a specific temperature and pressure. Gibbs free energy and enthalpy represent work potential and minimum energy requirements of the process or reaction, respectively. Positive values mean work and energy need to be supplied to the process, while negative values mean work and energy are released from the process. The standard Gibbs free energy and enthalpy of formation for our two independent material balances are obtained at 25 °C and 1 bar [11,12], and are given by Equations (6) and (7).
The overall ΔG and ΔH as functions of extent of reactions shown in Equations (8) and (9) are simply the addition of ΔH and ΔG in relation to the respective extents of the two independent material balances at the given conditions of temperature and pressure.
ΔH = ε1ΔH1 + ε2ΔH2
ΔG = ε1ΔG1 + ε2ΔG2
The extents at the limit of the MB-AR will form the boundaries of the G-H AR. The ΔH at various temperatures were calculated using the heat capacity of the species involved, using Equation (10) and the respective heat capacity (Cp) function and constants, where provided by Chase (1998) [11].
ΔH = ΔHo + ΔCp (T − To)
Both CoO and Co3O4 compounds used in this analysis can be assumed to form by adding O2 to Co, according to Equations (11) and (12), as described by Holmes et al. [13].
The molar Gibbs free energy of an ideal gas is dependent on partial pressures, hence the ΔG as a function of temperature for the cobalt compounds (CoO and Co3O4) were obtained using Equation (13), where the partial pressure of O2 was used in the equation. Assuming ideal gas behavior: k is the equilibrium constant (which is a measure of the ratio of the concentrations of products to the concentrations of reactants); R is the ideal gas constant; T represents temperature; and n is the number of moles of gas.
ΔG = ΔGo + nRT * ln k
2.5. Importance of the G-H AR in Understanding Cobalt Reduction Reaction
Kinetics play an important role in achieving the active Co(S) state during the reduction processes from its respective cobalt oxides. However, understanding the thermodynamic limits of the reduction process can guide how kinetics can be altered/directed to achieve certain products. Many researchers focus their research on trying to improve the kinetics of the reduction process, but it is important to know that the extent to which the kinetics can be improved is governed by thermodynamic limits. The G-H AR helps to define these thermodynamic limits. The cobalt reduction process is a fast-continuous process and the researchers assumes that it reaches equilibrium quick enough that it can be related to the thermodynamic G-H AR at particular conditions. It must be clear that the G-H AR will help show the expected thermodynamic product composition and possible thermodynamic reaction pathway at specific conditions and not how fast it will get to the products. A reaction pathway can be thermodynamically feasible, but it may be kinetically difficult to follow the specific thermodynamic pathway. Thus, kinetics and catalysts have played an important role in using alternative routes to the preferred thermodynamically route to get to products. However, these alternative routes fall within the boundaries of the G-H ARs at the conditions applied and cannot be outside.
The more negative the Gibbs free energy the greater the driving forces to achieve products and the minimum Gibbs free energy point on a G-H AR shows the most thermodynamically favoured set of products. Different sets of products may be present at minimum G and at these conditions mixing becomes important in getting the final composition. This situation is important when designing a reacting system as it can allow one to understand the separation mechanism required to achieve a certain product composition. Because we assume that the cobalt reduction process is fast, a snapshot to mimic a specific state of the reaction at defined set of operating conditions can be defined by thermodynamics. The G-H ARs only show the thermodynamic limits that can be achieved at equilibrium. Most importantly the results of the cobalt system attainable region presented here was to determine the reduction alternatives routes on what is thermodynamically feasible and what is not, but not necessarily to include kinetics, cost measures etcetera. More so, these thermodynamic limits can be defined irrespective of whether the reaction is in a batch or continuous reactor because it is assumed fast kinetics to reach equilibrium have been assumed.
3. Results
3.1. Material Balance Attainable Region
The MB-AR is a function of initial feed composition. It is therefore crucial to investigate how initial composition affects MB-AR for our system. H2 is usually the common feed material used to reduce Co3O4 to make the active Co. The researchers are interested in a system with a feed of Co3O4 and H2, because this resembles the typical TPR process in FTS. This section will therefore explore these two compounds as feed, at different compositions. To start with, the different combinations of feed materials were investigated where a basis of 1 mole of Co3O4(s) was used for different amounts of H2(g) supplied. Figure 3a–d shows different results obtained by changing the H2 amount in the feed combination of the system. The initial/feed composition vector is represented by nox = [Co3O4; H2; H2O; CoO; Co].
Figure 3 also confirms that there are three vertices that form the boundaries of the MB-AR for the cobalt system, when two components are specified as feed. Each corner/vertex represents a different composition. This is true for the initial feed considered. However, it is possible for the same system to have four vertices if the initial amount is varied or if one of the components is limiting.
Figure 3 shows how changes in the amount of H2 fed affect the MB-AR: the amount of H2 was increased from 0.1 mole (Figure 3a) to 4 moles (Figure 3d). Increasing the H2 feed while maintaining a feed of 1 mole Co3O4 changes the shape of MB-AR, while also expanding its region. The MB-AR in Figure 3b–d shows the point at ε1 = 1, when all Co3O4 is reduced. Adding more than 4 moles of H2 does not change the shape of the mass balance MB-AR shown in Figure 3d.
Figure 4 is similar to Figure 3d and gives the MB-AR case that shows the overall reduction of the Co3O4 compound with H2 to Co. The three vertices in the respective MB-AR are obtained () = Feed (0, 0), A (1, 0) and B (1, −3), which form the limits of the MB-AR. These vertices are used together with the Gibbs free energy and enthalpies to plot the G-H AR in Figure 5.
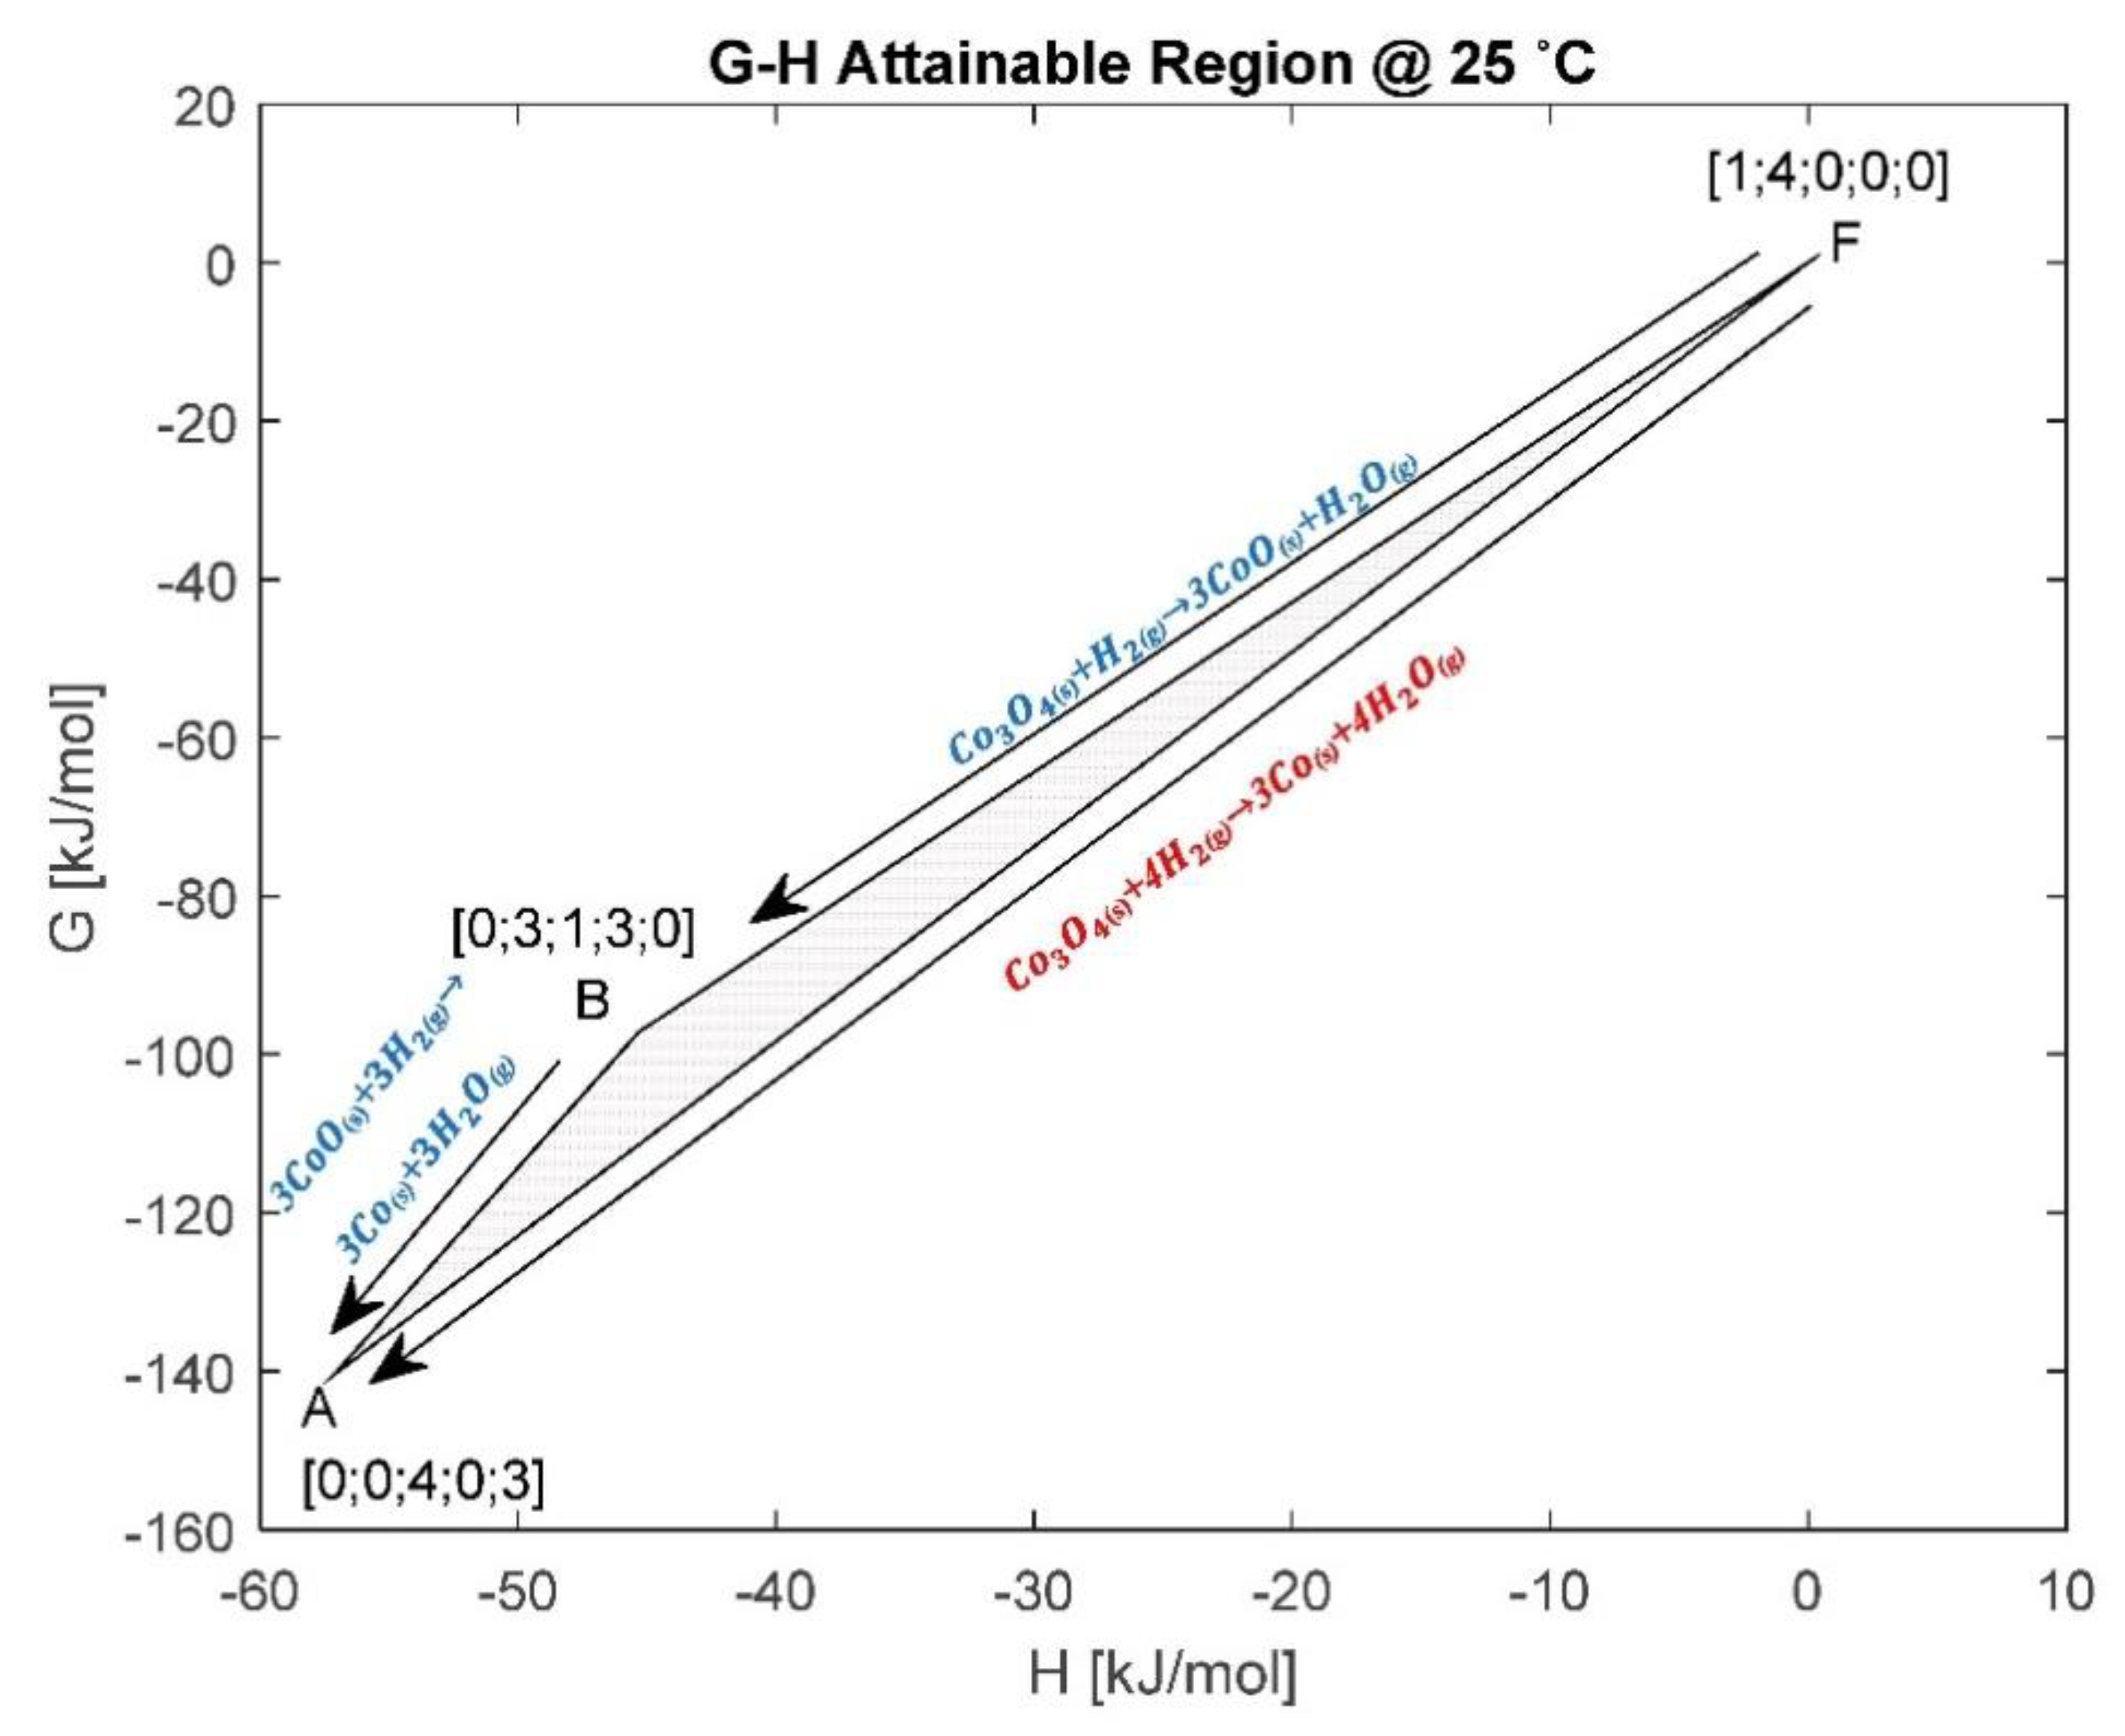
3.2. G-H Attainable Region at 25 °C
Figure 5 is obtained by transforming the MB-AR in Figure 4 to the G-H space. The composition at each vertex is represented as follows: ; ; . Figure 5 introduces the G-H AR and shows that it is bound by three vertices. The material balances are given in Equations (14)–(16). This also assumes that the zeolite support on the cobalt does not take part in the reactions. Gibbs free energy gives the energy associated with a chemical reaction that can be used to do work and form products in their most thermodynamically stable state. In Figure 4, the standard ΔG and ΔH for material balance A and B are negative, which means that the reactions produce work and are exothermic. The more negative the ΔG, the more spontaneous the reaction is. The reduction of Co3O4 with H2 to Co (Equation (14)) is more thermodynamically favourable, as it exists at minimum Gibbs free energy (minimum G) on the G-H AR at 25 °C. The G-H AR shows that Co3O4 can be thermodynamically reduced to Co or CoO without the need for work addition, as shown by reaction and , respectively, in Figure 5. The G-H AR suggest that the reduction to Co can take place at 25 °C when both cobalt species (CoO and Co3O4) are present in the reacting system. However, it is also important to note that a reaction may be thermodynamically feasible at 25 °C, but it may take a long time to occur due to kinetic barriers.
When comparing the ΔGs for the thermodynamic reactions and , it is clear that, thermodynamically, the products of reaction will dominate the system, despite the ΔG of material balance also being negative. This is because the ΔG for reaction is more negative and it exists at the system’s minimum G, where the products are more stable. However, it is important to note that the composition at A can be archived through two separate routes: (i) directly via , as shown in Equation (14); (ii) or via then , using Equations (15) and (16), respectively. According to Hess’ law, the energy requirements for a chemical process are the same, irrespective of the pathway or steps taken to make the product composition. This means that ∆H and ∆G for the composition at A will always be the same for the two routes. In other words, combining Equations (15) and (16) should give Equation (14). However, the choice of the specific route taken in the reacting system will be defined by reaction kinetics, available driving force to make the products at equilibrium, reactor type and the reaction temperature.
3.3. G-H Attainable Region at Higher Temperatures
Co3O4 is usually reduced to make active Co in the FTS at temperatures between 200–500 °C [14] depending on the type of catalyst and support used. Co3O4 is reduced with H2 in the reactor before the syngas is introduced. First, it is necessary to see how the G-H AR changes to show the respective thermodynamically feasible phases in this temperature range. It is also important to see how the product spectrum, heat and work requirements of the system change when the temperature is increased.
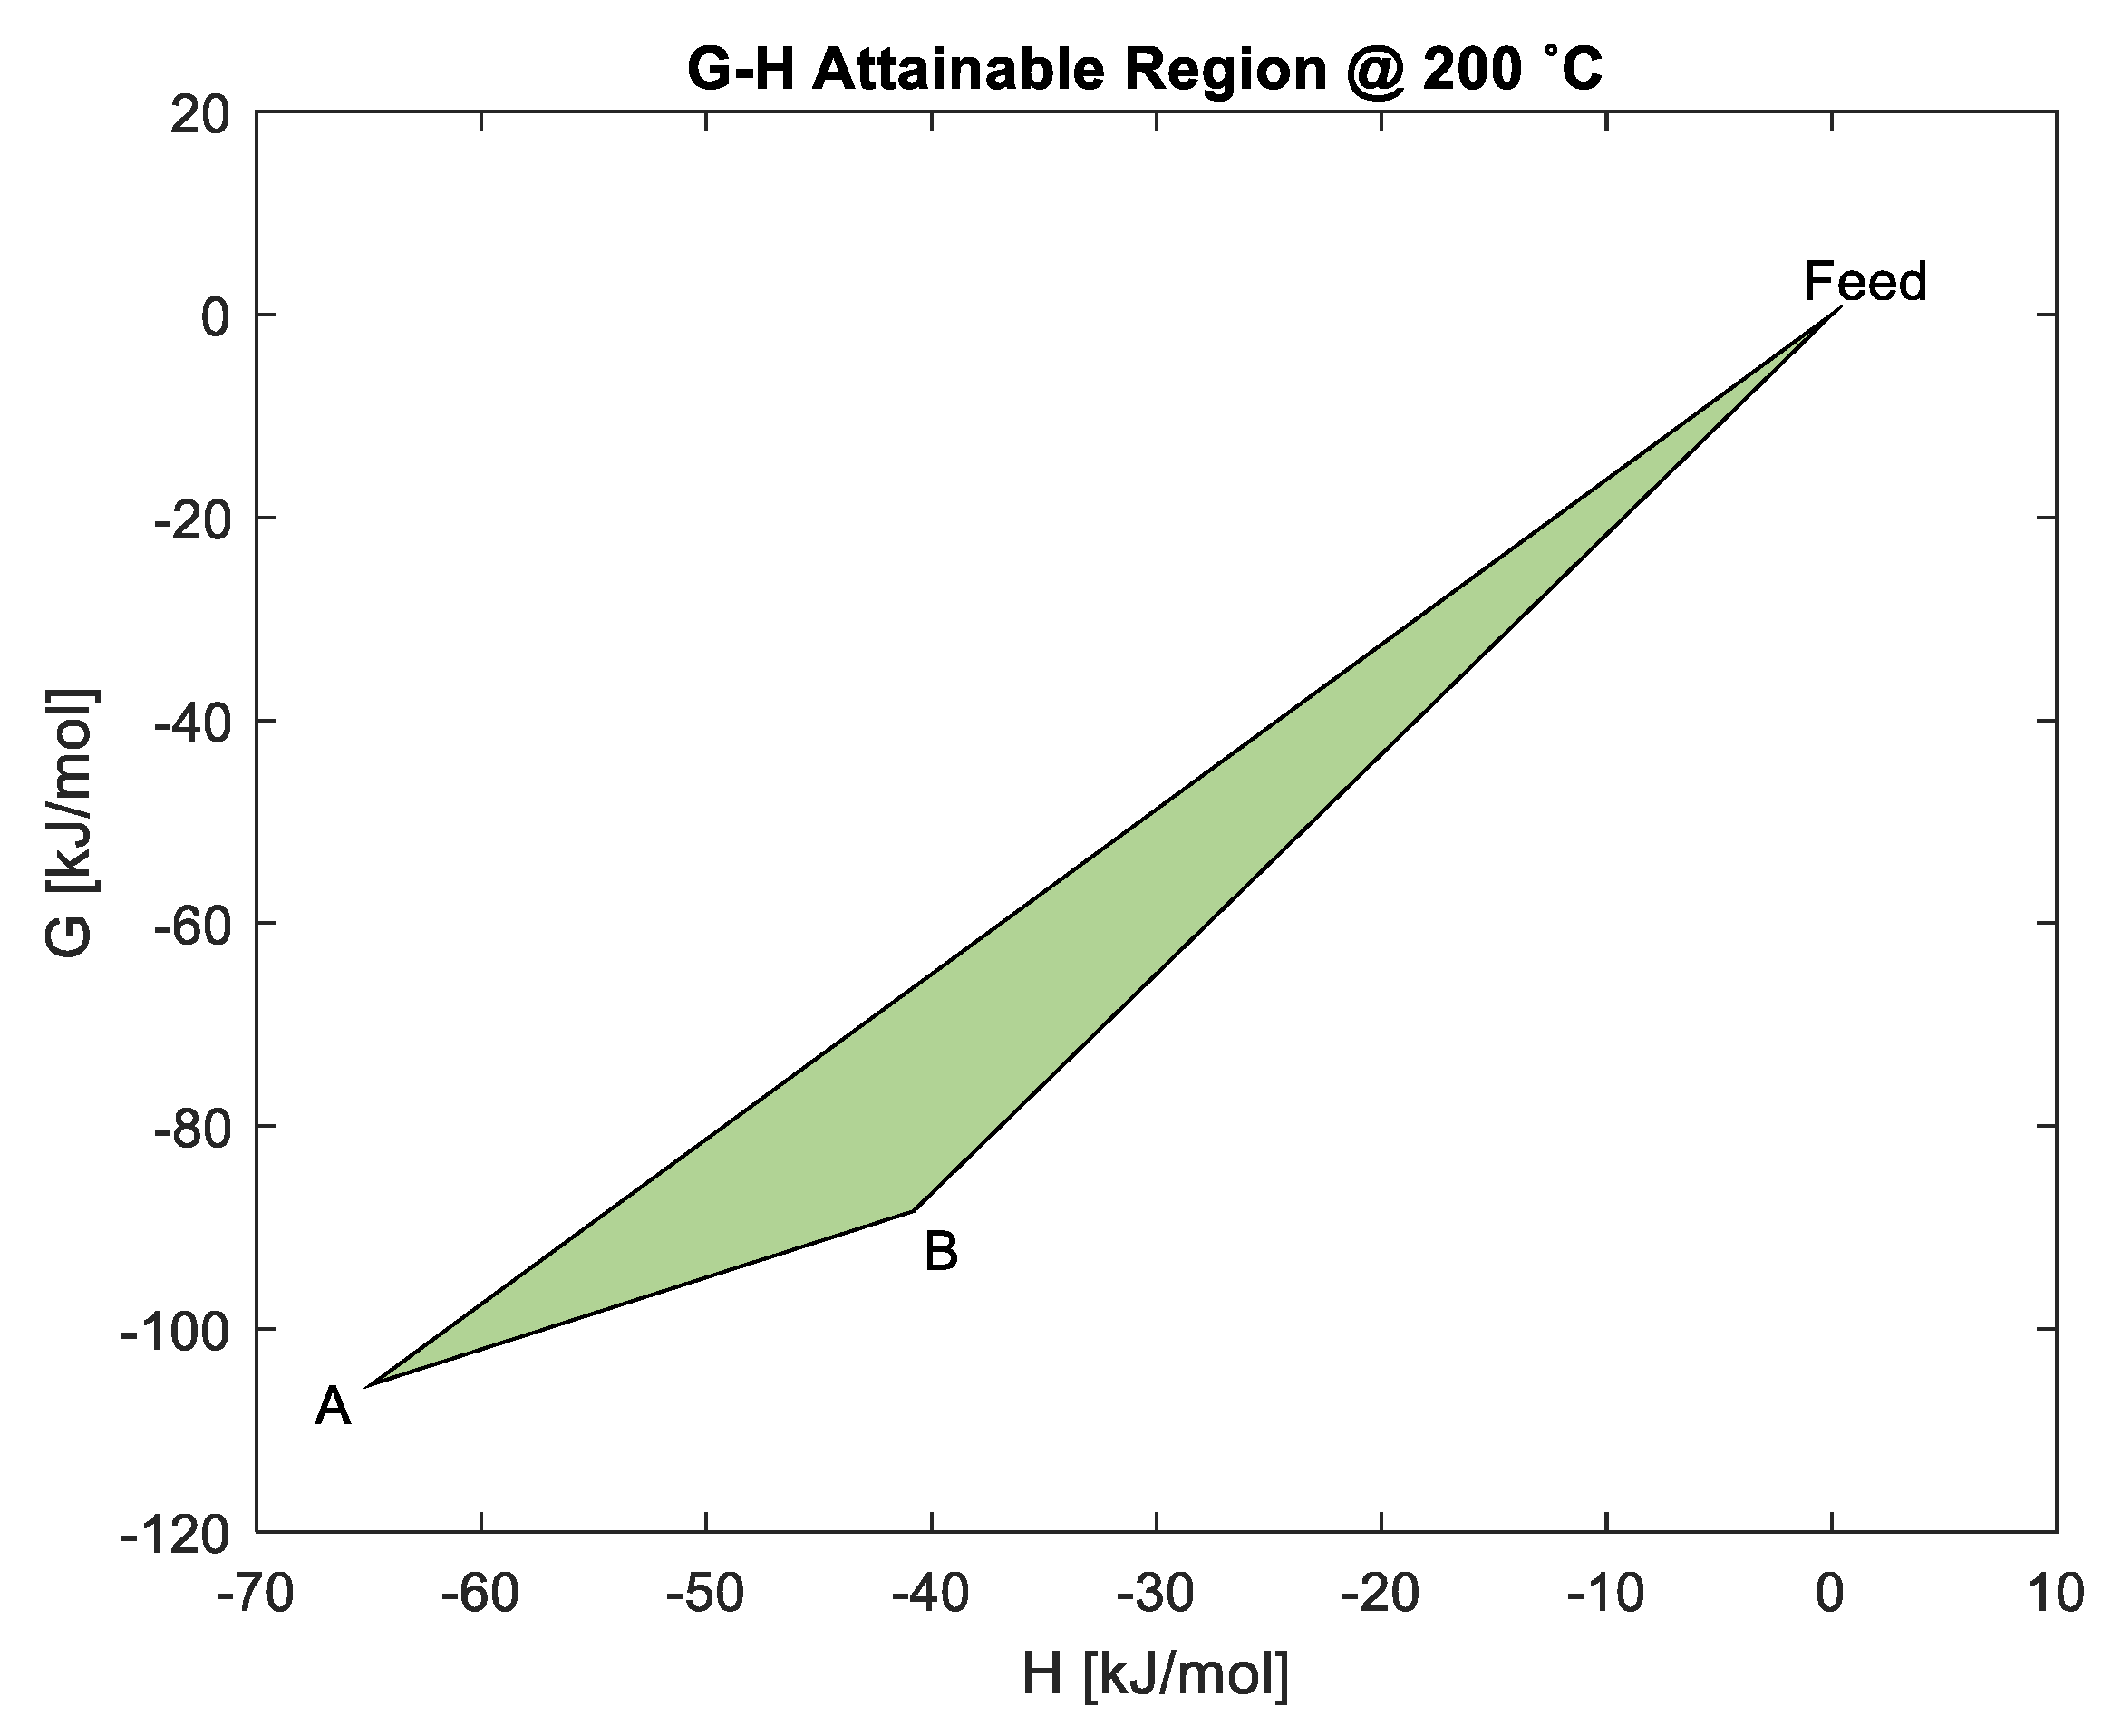
When the temperature is increased to 200 °C, as shown by the G-H AR in Figure 6, the first thing noted is that the possibility of making Co directly from Co3O4 reduction is still at the minimum G of the system. This does not require any work addition, and the respective ∆G values are shown in Table 4. This may be a possible explanation for the occurrence of the first peak observed in Figure 2 at about 250 °C, when Co3O4 can be kinetically reduced by H2 to Co. However, at about 200 °C, the ∆G for material balance also moves closer to minimum ∆G, which increases the likelihood of products for this material balance being present in the system (although not yet at minimum G). Thus, the observed AR results suggest that the first peak may be attributed to either: direct reduction of Co3O4 to Co through material balance in Equation (1); or reduction of Co3O4 to CoO through material balance in Equation (15). This is where the notion of reaction pathways comes in, where shows a steeper gradient, and it is hypothesized that it is the preferred route compared to . If we assume that the reaction follows the boundaries of the G-H AR as its pathway, the pathway that offers the steepest gradient from the feed is likely to be most favoured towards the minimum G. This is because a steeper gradient is hypothesized to be the route in which the system has the most available driving force to make products or intermediate products. Thus, route would most likely represent peak 1.
The scenario shown in Figure 7 shows that the ΔG for material balances and are the same, ΔG = −82 kJ/mole at 320 °C, as shown in Equations (17) and (18). Equation (19) shows the exothermic reaction , where CoO is directly reduced to Co with no work addition. All these reactions are at minimum ∆G and any of the two material balances is likely to happen directly from the feed in the system, and then influence the product spectrum. A mixture of products from the two material balances is possible. In typical systems such as gasification, separation of products can be achieved through mixing, where the ΔGs are similar.
During TPR, the second peak occurs at about 335 °C, which is close to G-H AR at 320 °C (as shown in Figure 7). It is observed that two possible boundary pathways that convert feed material to different products ( and ) show similar changes in Gibbs free energy; this implies that both reactions have the same driving force and can occur in parallel. The presence of two material balances/reactions (at minimum G) that occur at the same time at 335 °C may explain the broadness of the second peak. Three material balances (; ; ) can contribute to the uptake of H2 and/or the formation of active cobalt (Co): (; ) for FTS. TS. However, reaction may not occur if reactions and have occurred, since both reactions lead up to minimum G or state of energy. Alternatively, reaction implies that compositions at A and B are actually at the thermodynamic equilibrium, since ΔGBA = 0. This means that there is likely to be a mixture of products of and in the final product. Because of this scenario, the resulting reduction of the CoO to Co may be misunderstood, with researchers assuming that it is the only pathway to make Co during TPR. The G-H AR indicates that the second peak may be a result of the reduction of both cobalt oxides to Co through material balances and . This may justify the broadness of the second peak seen at about 335 °C in Figure 2, when both Co3O4 and CoO are simultaneously reduced to Co.
However, most researchers have predicted that the formation of active cobalt in the temperature range 200–500 °C is a result of the second peak during TPR via . It is observed that the ratio of the second peak to the first peak for the two-step reduction is generally close to 1:3 [2,16]. This is because, at about 250 °C, the reduction of Co3O4 to CoO through material balance , Equation (15), is possible and may result in Peak 1. At 335 °C, is now at about minimum G, which results in the spontaneous presence of CoO in the system. This simultaneously triggers the reaction in , Equation (16), which is also at minimum G-hence the possibility of Peak 2 occurring. The ratio of H2 consumption in : is 1:3, which correlates well with the observed ratios in literature, thus suggesting as the possible pathway. Again, in trying to decide which reaction pathway may be favoured-either or ()—we may apply Le-Chatelier’s principle that suggests a preference for reaction pathway to , because it is less exothermic. This then paves the way for the reaction to happen through pathway .
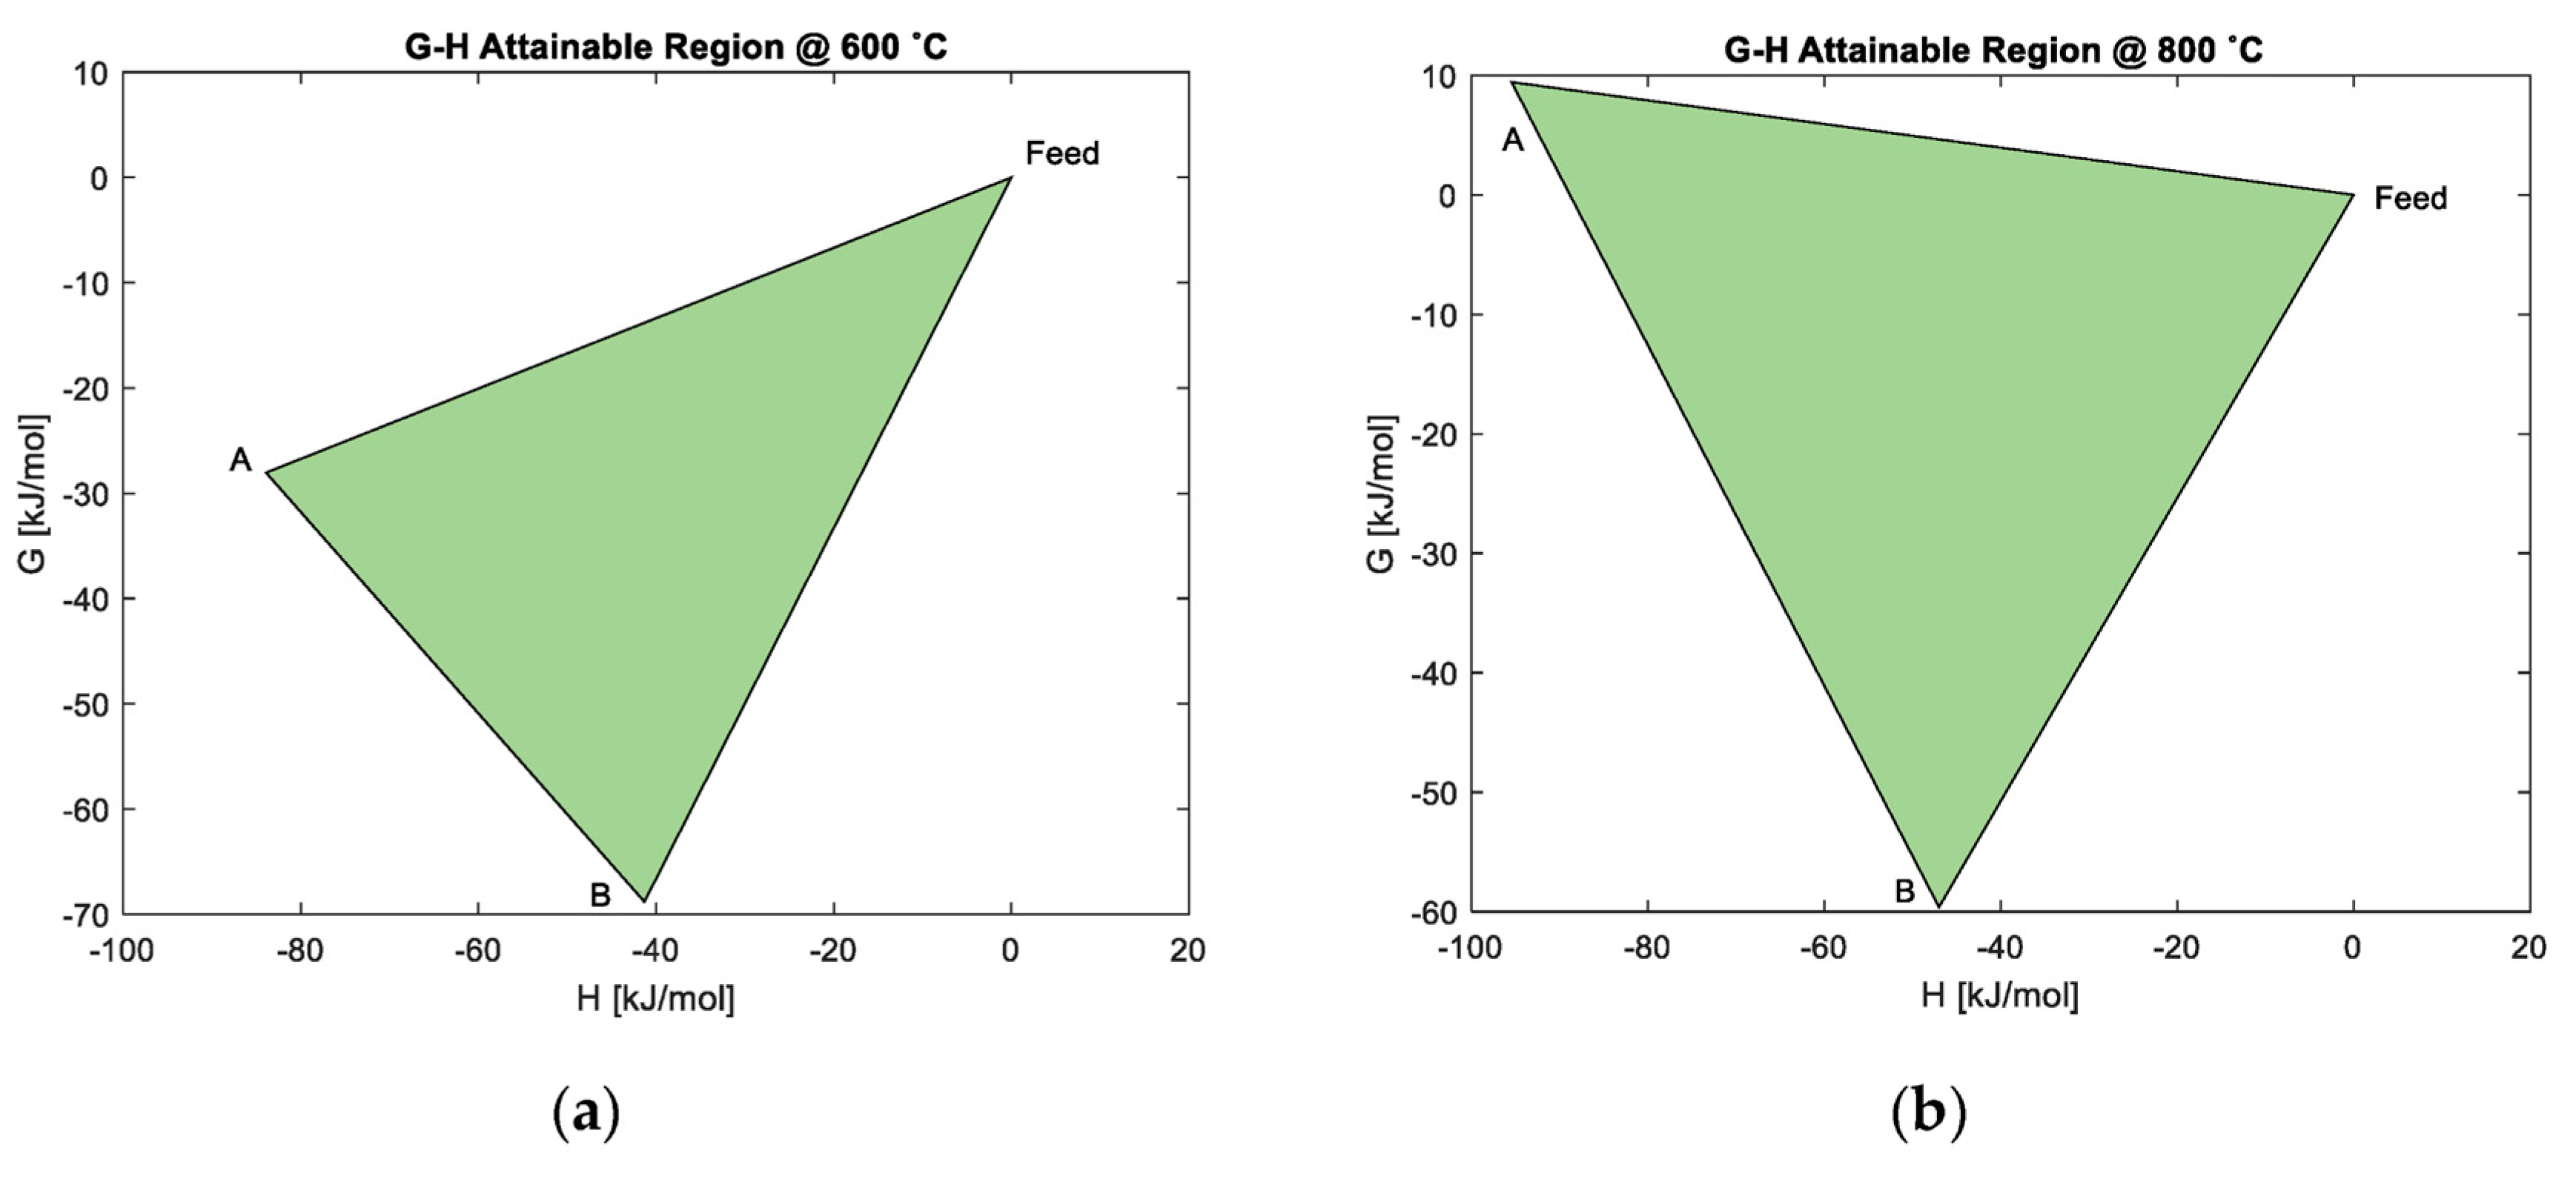
The G-H AR at 400 °C in Figure 8 shows that an increase in temperature continues to favour the reduction of Co3O4 to CoO, as shown by the material balance , as the ΔG is still negative at minimum G. The reduction of CoO to Co via reaction is no longer feasible, unless work (ΔG = 12.2 kJ/mol) is added to the process. Although reduction of Co3O4 to Co is still possible through , the reduction of Co3O4 to CoO becomes most favourable as the material balance now exists at minimum G. However, the ΔG has become less negative with the increase in temperature; this is also seen in Figure 9a,b, at 600 °C and 800 °C, respectively. At 600 °C, the ΔG for the material balance approaches ΔG = 0 kJ/mole, meaning that reduction to Co is unlikely to occur. This is not favourable for FTS.
In this study, the G-H AR showed that when H2 is used to reduce Co3O4 to Co, this reduction process is not feasible above 600 °C, unless work is added. As the temperature is increased above 400 °C, the formation of CoO will dominate the system at 800 °C and above. This may also suggest that CoO may be more stable at high temperatures.
Table 4 gives the thermodynamic data of ΔG and ΔH for the material balances that form the boundaries of the G-H AR at different temperatures studied at ambient pressure.
4. Discussion
What This Means in FTS Application
The AR has shown that the degree of reduction of Co3O4 to Co is a function of temperature. As temperature is increased, the reaction that reduces Co3O4 to CoO becomes increasingly more thermodynamic favourable. This is because the ΔG for this material balance remains negative as it approaches minimum ∆G. The ΔG for the reactions that form Co become more positive at temperatures above 600 °C. This means that the reduction of Co3O4 to active Co in the system occurs at a defined thermodynamic temperature range (about 25–500 °C). The AR shows that the TPR profile of Co3O4 using H2 is a characteristic of the two-stage reduction process, i.e., Co3O4 → CoO/Co (between 200 °C and 300 °C), then Co3O4/CoO → Co (between 300 °C and 400 °C). This occurs at a defined temperature range between (200–400 °C) using a 10% Co/Zeolite catalyst, as shown in Figure 2. This corroborates the H2 TPR profiles of unsupported Co3O4 catalyst calcinated at 350 °C obtained by Olusola and Sudip [17]. However, the AR results cannot reveal whether associated changes in the microstructure of cobalt phases can affect the G-H AR. In addition, the stability region of small metallic cobalt crystallites may differ from the stability region for bulk metallic cobalt, due to the contribution of the surface energy [18].
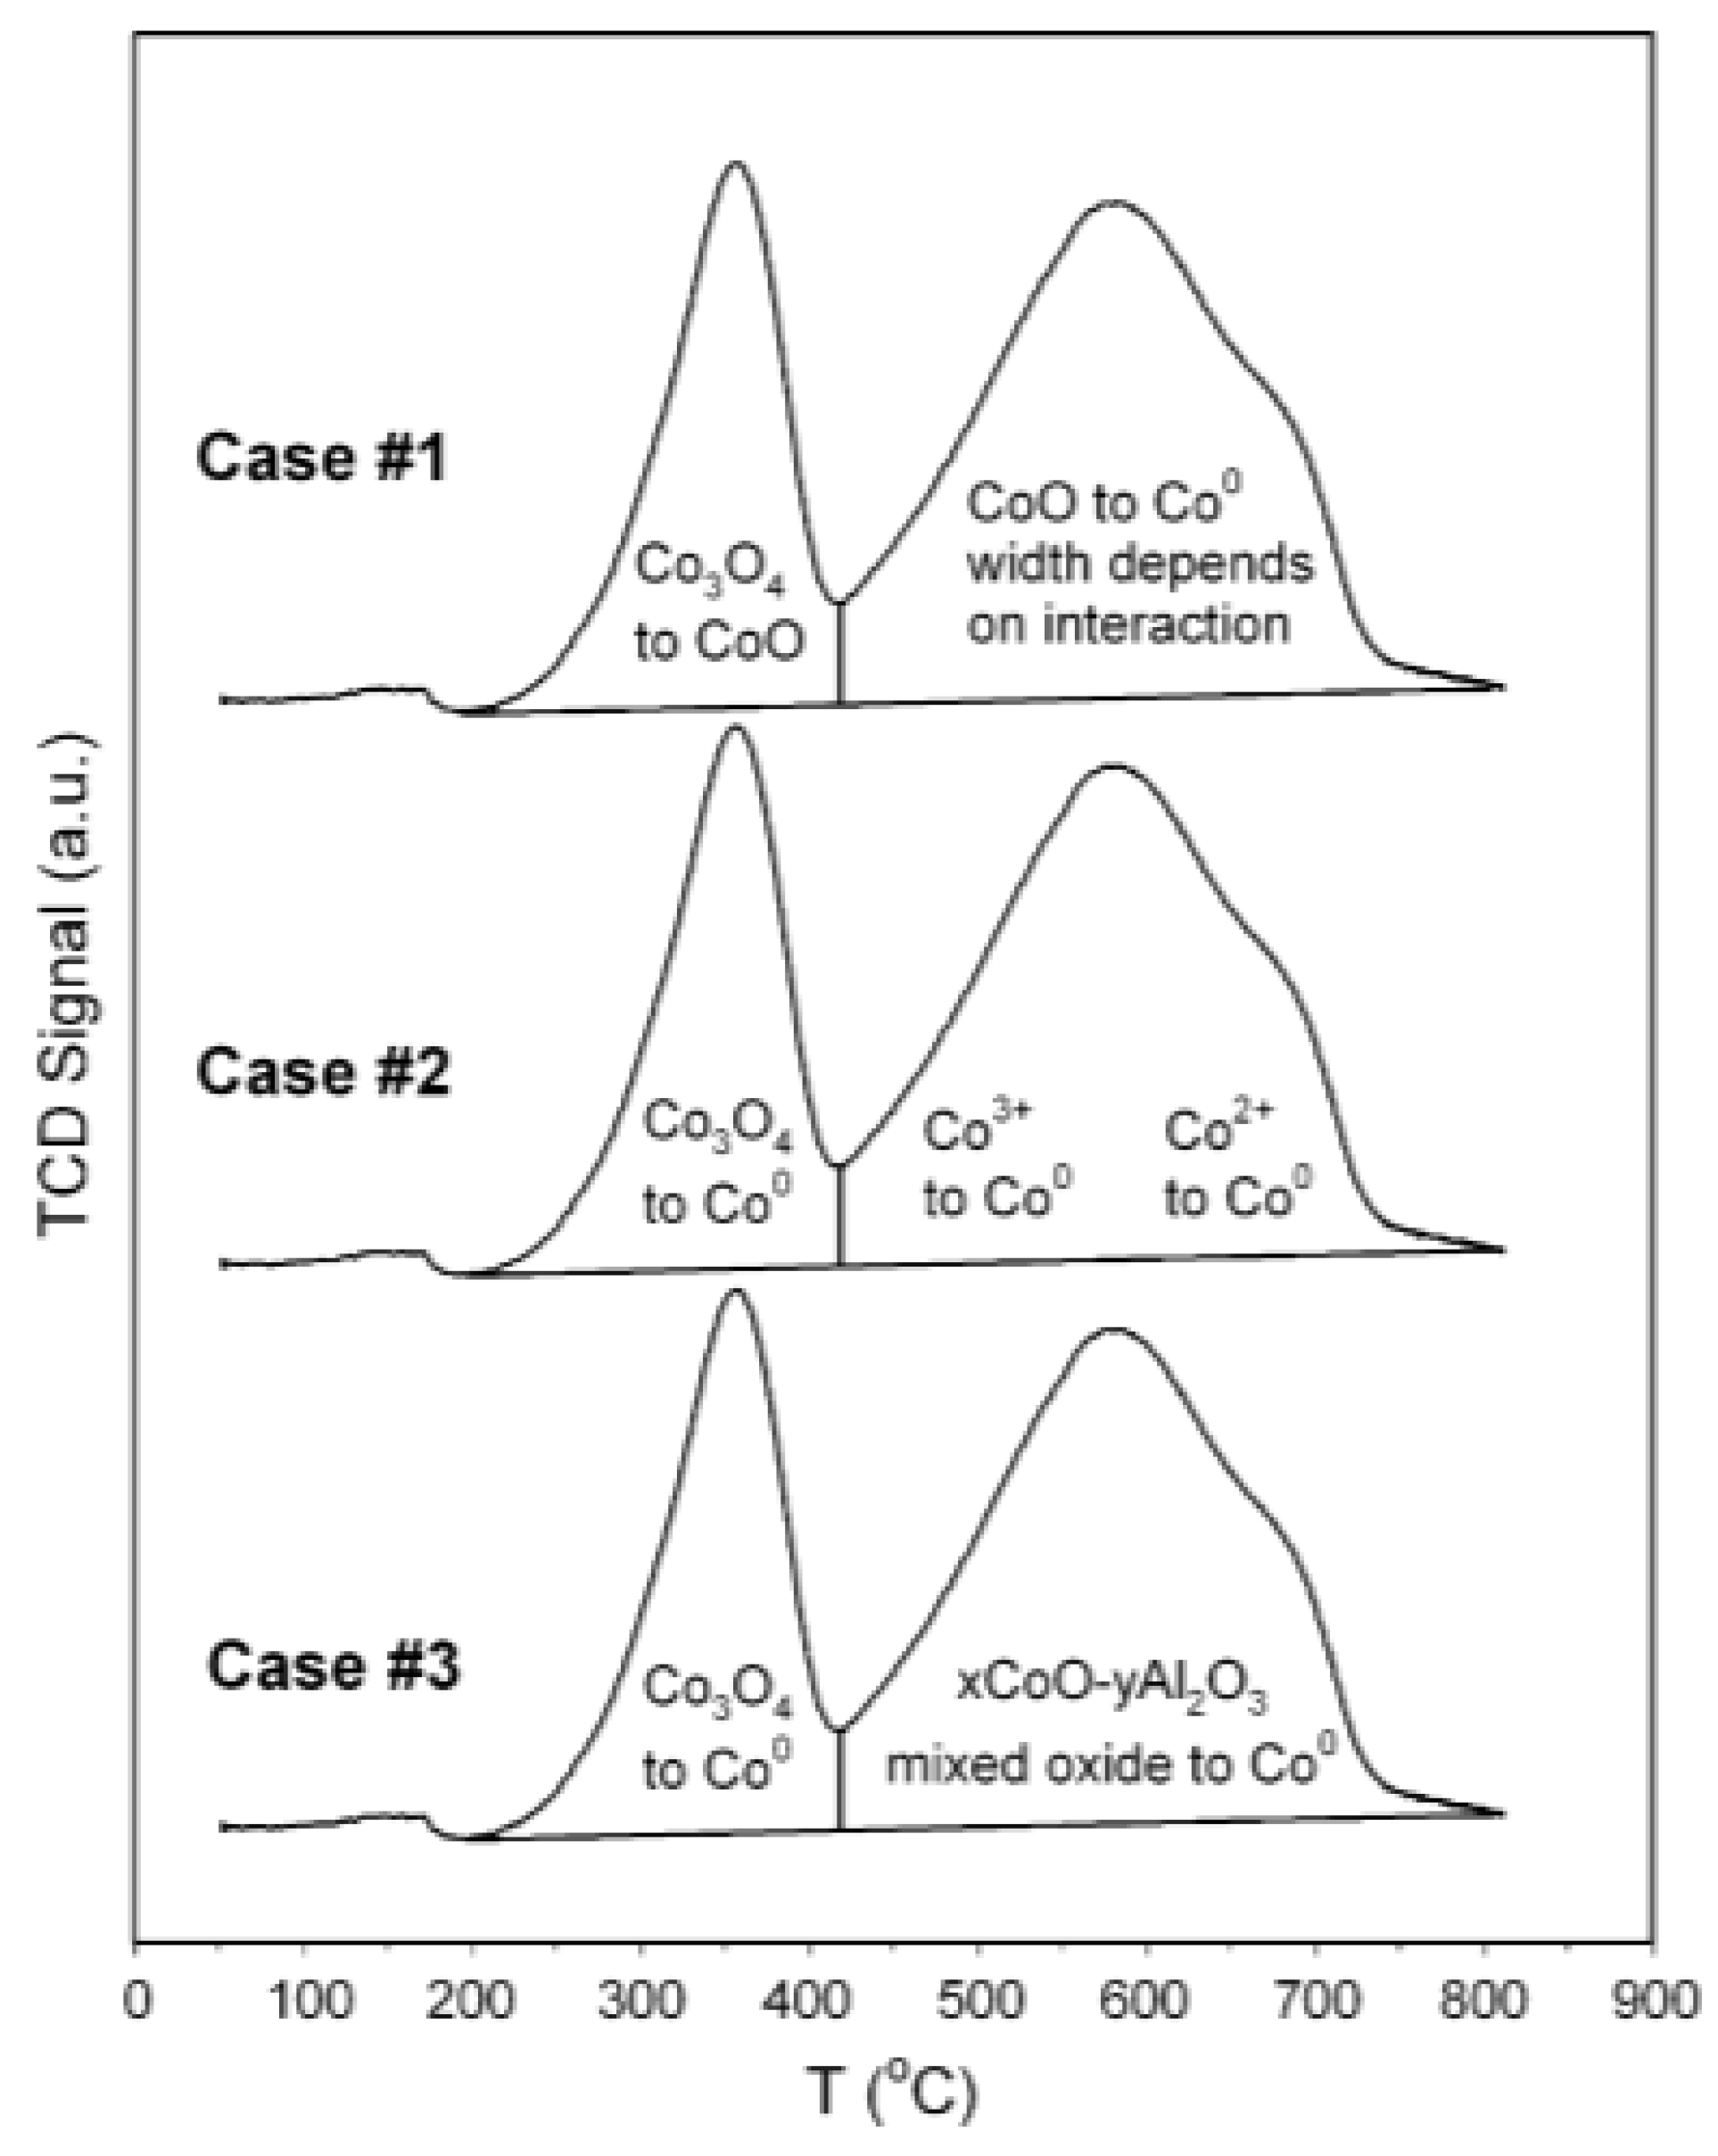
Thus, with the G-H AR results obtained, the AR can help further explain the analysis indicated by Case 1 and Case 2 in Figure 10 [2]. We see that, in both cases: the first peak ranges between 200 °C and 420 °C; the second peak ranges between 420 °C and 800 °C. These temperature ranges are also a function of the catalyst support used—hence, in this analysis, the research focused mainly on the reaction pathway mechanism explained. The first peak in Case 1 shows the reduction process occurring as Co3O4 → CoO, which is a possible pathway, as shown in the G-H AR obtained at these temperatures through . Once more, the results of this study agree with the second stage CoO → Co, () of the reduction process in Case 1, which was also observed by Khodakov et al. [19]. It is important to note that the thermodynamic AR tells us that the first peak may also be a result of the material balance in Equation (15), (Co3O4 → Co), as observed in Case 2. This observation agrees with the argument provided by Olusola and Sudip [17]. The second peak in Case 2 may result either through CoO → Co or Co3O4 → Co or by a combination of both reduction reaction pathways. Overall, the G-H AR has interpreted the TPR patterns to show reduction of either Co3O4 directly to Co, or the possibility of a series of reduction mechanisms with an intermediate CoO from Co3O4 → CoO → Co. However, it is necessary to investigate how promoters added to cobalt catalysts affect the AR, but the promoters can only influence the G-H AR if: they are involved in the reduction reactions; and if they change their initial form to an intermediate or new compound during the reduction process. The effect to which the G-H AR change will then depend on the type of metal/ compound making that promotor.
5. Conclusions
The AR technique was effectively applied to better understand catalyst reduction by applying the Gibbs free energy (G) minimization approach, as depicted in the AR space. These AR spaces can predict the cobalt phase for any given reduction condition in the reactor. This thermodynamic tool is useful for predicting optimum temperatures for a desired phase. This study of using AR has revealed a different interpretation of the hydrogen TPR mechanism of cobalt catalysts in FT. It has shown that there are two possible reaction pathways: one that reduces Co3O4 directly to Co, and another that has CoO as an intermediate step. The G-H AR tend to show that the reaction pathway Co3O4 → CoO → Co is thermodynamically favourable during the TPR process. This revelation of the cobalt reduction pathways using H2 can help improve the design of supported cobalt-based FTS catalysts, as researchers can work on a specific reaction pathway to achieve the Co active state.
Supplementary Materials
The following are available online at https://0-www-mdpi-com.brum.beds.ac.uk/2624-781X/1/2/10/s1. Document 1.
Author Contributions
Conceptualization: J.G. and R.M. Methodology: J.G., R.M. and E.L. Software: R.M. Validation: R.M., E.L. and D.H. Formal analysis, E.L. Investigation: D.H. Resources: D.H. Data curation: R.M. Writing—original draft preparation: R.M. and J.G. Writing—review and editing: J.G. Visualization: E.L. Supervision: D.H. Project administration: J.G. Funding acquisition: D.H. All authors have read and agreed to the published version of the manuscript.
Funding
This research received no external funding.
Acknowledgments
The authors are grateful for the support provided by the University of South Africa (UNISA), the National Research Foundation (NRF) of South Africa and the Institute for the Development of Energy for African Sustainability (IDEAS) at UNISA.
Conflicts of Interest
The authors declare no conflict of interest.
References
- Gorimbo, J. Use of Stability Diagrams to Predict Catalyst Speciation during Fischer Tropsch Reduction stage: A Mini-Review. Catal. Sci. Technol. 2018, 8, 2022–2029. [Google Scholar] [CrossRef]
- Jacobs, G.; Ji, Y.; Davis, B.H.; Cronauer, D.; Kropf, A.J.; Marshall, C.L. Fischer—Tropsch Synthesis: Temperature Programmed EXAFS/XANES Investigation of the Influence of Support Type, Cobalt Loading, and Noble Metal Promoter Addition to the Reduction Behavior of Cobalt Oxide Particles. Appl. Catal. A Gen. 2007, 333, 177–191. [Google Scholar] [CrossRef]
- Kumar, N.; Payzant, E.A.; Jothimurugesan, K.; Spivey, J.J. Combined in Situ XRD and in Situ XANES Studies on the Reduction Behavior of a Rhenium Promoted Cobalt Catalyst. Phys. Chem. Chem. Phys. 2011, 13, 14735–14741. [Google Scholar] [CrossRef]
- Phaahlamohlaka, T.N.; Kumi, D.O.; William, M.; Forbes, R.; Jewell, L.L.; Billing, D.G.; Coville, N.J. Effects of Co and Ru intimacy in Fischer-Tropsch Catalysts Using Hollow Carbon Sphere Supports: Assessment of the Hydrogen Spillover Processes Effects of Co and Ru Intimacy in Fischer-Tropsch Catalysts Using Hollow Carbon Sphere Supports: Assessment of. ACS Catal. 2016, 7, 1568–1578. [Google Scholar] [CrossRef] [Green Version]
- Sempuga, B.C.; Hausberger, B.; Patel, B.; Hildebrandt, D.; Glasser, D. Classification of Chemical Processes: A graphical Approach to Process Synthesis to Improve Reactive Process Work Efficiency. Ind. Eng. Chem. Res. 2010, 49, 8227–8237. [Google Scholar] [CrossRef]
- Hildebrandt, D.; Glasser, D.; Crowe, C.M. Geometry of the Attainable Region Generated by Reaction and Mixing: With and without Constraints. Ind. Eng. Chem. Res. 1990, 29, 49–58. [Google Scholar] [CrossRef]
- Patel, B. Fundamental Targets for the Synthesis and Evaluation of Chemical Processes. Ph.D. Thesis, University of the Witwatersrand, Johannesburg, South Africa, 2007. [Google Scholar]
- Qiao, Z.; Wang, Z.; Zhang, C.; Yuan, S.; Zhu, Y.; Wang, J. PVAm–PIP/PS Composite Membrane with High Performance for CO2/N2 Separation. AIChE J. 2012, 59, 215–228. [Google Scholar] [CrossRef]
- Okonye, L.U.; Hildebrandt, D.; Glasser, D.; Patel, B. Attainable Regions for a Reactor: Application of ΔH-ΔG Plot. Chem. Eng. Res. Des. 2012, 90, 1590–1609. [Google Scholar] [CrossRef]
- Yin, F. A Simpler Method for Finding Independent Reactions. Chem. Eng. Commun. 1989, 83, 117–127. [Google Scholar] [CrossRef]
- Chase, M.W., Jr. NIST-JANAF Themochemical Tables, 4th ed.; NIST: Gaithersburg, MD, USA, 1998. [CrossRef]
- UCDSB. Available online: http://Www2.Ucdsb.on.ca/Tiss/Stretton/Database/Inorganic_thermo.Htm (accessed on 27 September 2020).
- Holmes, R.D.; O’Neill, H.S.C.; Arculus, R.J. Standard Gibbs Free Energy of Formation for Cu2O, NiO, CoO, and FexO: High Resolution Electrochemical Measurements Using Zirconia Solid Electrolytes from 900–1400 K. Geochim. Cosmochim. Acta 1986, 50, 2439–2452. [Google Scholar] [CrossRef]
- Du Plessis, H.E.; Forbes, R.P.; Barnard, W.; Erasmus, W.J.; Steuwer, A. In Situ Reduction Study of Cobalt Model Fischer-Tropsch Synthesis Catalysts. Phys. Chem. Chem. Phys. 2013, 15, 11640–11645. [Google Scholar] [CrossRef]
- UCDSB. Inorganic Compounds: Physical and Thermochemical Data. Available online: http://www2.ucdsb.on.ca/tiss/stretton/database/inorganic_thermo.htm (accessed on 15 September 2020).
- Lin, H.Y.; Chen, Y.W. The Mechanism of Reduction of Cobalt by Hydrogen. Mater. Chem. Phys. 2004, 85, 171–175. [Google Scholar] [CrossRef]
- Olusola, O.J.; Sudip, M. Temperature Programme Reduction (TPR) Studies of Cobalt Phases in Alumina Supported Cobalt Catalysts. J. Pet. Technol. Altern. Fuels 2016, 7, 1–12. [Google Scholar] [CrossRef] [Green Version]
- Van Steen, E.; Claeys, M.; Dry, M.E.; Van De Loosdrecht, J.; Viljoen, E.L.; Visagie, J.L. Stability of Nanocrystals: Thermodynamic Analysis of Oxidation and Re-Reduction of Cobalt in Water/Hydrogen Mixtures. J. Phys. Chem. B 2005, 109, 3575–3577. [Google Scholar] [CrossRef] [PubMed]
- Khodakov, A.Y.; Lynch, J.; Bazin, D.; Rebours, B.; Zanier, N.; Moisson, B.; Chaumette, P. Reducibility of Cobalt Species in Silica-Supported Fischer-Tropsch Catalysts. J. Catal. 1997, 168, 16–25. [Google Scholar] [CrossRef]
Figure 1.
Typical G-H AR of the cobalt reduction system (points A, B and C show the boundary vertices of the G-H AR).
Figure 1.
Typical G-H AR of the cobalt reduction system (points A, B and C show the boundary vertices of the G-H AR).

Figure 2.
H2-Temperature programmed reduction profile for 10% Co/Zeolite. (Zeolite type used is Clinoptilolite.).
Figure 2.
H2-Temperature programmed reduction profile for 10% Co/Zeolite. (Zeolite type used is Clinoptilolite.).

Figure 3.
Change in MB-AR in extent space for a feed 1 mole Co3O4 when the H2 supplied is increased, (a) 0.1 moles, (b) 1 mole, (c) 2 mole, (d) 4 moles. (Figure 3d) was used to obtain the G-H AR.
Figure 3.
Change in MB-AR in extent space for a feed 1 mole Co3O4 when the H2 supplied is increased, (a) 0.1 moles, (b) 1 mole, (c) 2 mole, (d) 4 moles. (Figure 3d) was used to obtain the G-H AR.

Figure 4.
MB-AR in extent space for a feed 1 mole Co3O4 and 4 moles H2.

Figure 5.
G-H AR for the cobalt system at 25 °C.

Figure 6.
Analysis of predicted material balances using the G-H AR for the cobalt system at 200 °C.

Figure 7.
Analysis of predicted material balances using the G-H AR for the cobalt system at 320 °C.

Figure 8.
G-H AR for the cobalt system at 400 °C.

Figure 9.
G-H AR for the cobalt system at: (a) 600 °C; (b) 800 °C.

Figure 10.
Typical TPR cases analyzed by Jacobs et al. [2].
Figure 10.
Typical TPR cases analyzed by Jacobs et al. [2].


Table 1.
Atomic matrix form of the cobalt system compounds.
| Co | H | O | Compounds |
|---|---|---|---|
| 3 | 0 | 4 | Co3O4 |
| 1 | 0 | 0 | Co |
| 0 | 2 | 0 | H2 |
| 1 | 0 | 1 | CoO |
| 0 | 2 | 1 | H2O |
Table 2.
Gaussian elimination to get independent material balances for the cobalt system.
| Co | H | O | Compounds |
|---|---|---|---|
| 0 | 0 | 0 | Co3O4-3Co-4(H2O-H2) |
| 1 | 0 | 0 | Co |
| 0 | 1 | 0 | 1/2H2 |
| 0 | 0 | 0 | CoO-Co-(H2O-H2) |
| 0 | 0 | 1 | H2O-H2 |
Table 3.
Stoichiometric material balance showing extent of reactions.
| Initial Moles | Change | Moles |
|---|---|---|
| NoCo3O4 | −ε1 | NoCo3O4 − ε1 ≥ 0 |
| NoH2 | −4ε1 − ε2 | NoH2 − 4ε1 − ε2 ≥ 0 |
| NoCo | +3ε1 + ε2 | NoCo + 3ε1 + ε2≥ 0 |
| NoH2O | +4ε1 + ε2 | NoH2O + 4ε1 + ε2 ≥ 0 |
| NoCoO | −ε2 | NoCoO − ε2≥ 0 |
Table 4.
ΔG and ΔH for the material balances at various temperatures of the G-H AR (Thermodynamic data obtained from references 11 and 15.) [11,15].
| Material Balance | ∆H kJ/mol | ∆G kJ/mol | |
|---|---|---|---|
| 25 °C | A | −233.05 | −174.6 |
| B | −89.33 | −105.8 | |
| Feed | 0 | 0 | |
| 200 °C | A | −64.86 | −105.5 |
| B | −40.8 | −88.39 | |
| 320 °C | A | −70.58 | −82.34 |
| B | −39.59 | −82.5 | |
| 400 °C | A | −70.94 | −66.37 |
| B | −38.51 | −78.61 | |
| 600 °C | A | −83.91 | −28.04 |
| B | −41.31 | −68.81 | |
| 800 °C | A | −95.44 | 9.44 |
| B | −46.99 | −59.62 |
Publisher’s Note: MDPI stays neutral with regard to jurisdictional claims in published maps and institutional affiliations. |
© 2020 by the authors. Licensee MDPI, Basel, Switzerland. This article is an open access article distributed under the terms and conditions of the Creative Commons Attribution (CC BY) license (http://creativecommons.org/licenses/by/4.0/).
Share and Cite
MDPI and ACS Style
Gorimbo, J.; Muvhiiwa, R.; Llane, E.; Hildebrandt, D. Cobalt Catalyst Reduction Thermodynamics in Fischer Tropsch: An Attainable Region Approach. Reactions 2020, 1, 115-129. https://0-doi-org.brum.beds.ac.uk/10.3390/reactions1020010
AMA Style
Gorimbo J, Muvhiiwa R, Llane E, Hildebrandt D. Cobalt Catalyst Reduction Thermodynamics in Fischer Tropsch: An Attainable Region Approach. Reactions. 2020; 1(2):115-129. https://0-doi-org.brum.beds.ac.uk/10.3390/reactions1020010
Chicago/Turabian StyleGorimbo, Joshua, Ralph Muvhiiwa, Ephraim Llane, and Diane Hildebrandt. 2020. "Cobalt Catalyst Reduction Thermodynamics in Fischer Tropsch: An Attainable Region Approach" Reactions 1, no. 2: 115-129. https://0-doi-org.brum.beds.ac.uk/10.3390/reactions1020010