Soil–Water Retention Curves Derived as a Function of Soil Dry Density

Department of Hydraulic Engineering, Tsinghua University, Beijing 100084, China
GeoHazards 2020, 1(1), 3-19; https://0-doi-org.brum.beds.ac.uk/10.3390/geohazards1010002
Submission received: 18 June 2018
/
Revised: 20 August 2018
/
Accepted: 23 August 2018
/
Published: 27 August 2018
Abstract
:The soil–water retention curves (SWRC) of soil plays a key role in unsaturated soil mechanics, which is a relatively new field of study having wide applications particularly in geotechnical and geo-environmental engineering. SWRCs were used to evaluate the ability of unsaturated soils to attract water with various water contents and matric suctions. Drying and wetting SWRCs for a sandy soil with different dry densities were studied in a laboratory. Proton nuclear magnetic resonance, image processing technology, and mercury intrusion porosimetry were used to characterize the microscopic mechanisms of pore size distribution in the soil. Soil–water retention in the soil samples was strongly dependent on the dry density. With zero matric suction, soil samples with a higher dry density had a lower initial volumetric water content. Volumetric water content changed at a slower rate when values of matric suction increased in soils with a higher dry density. Soil samples had residual matric suction and a larger air-entry value with a smaller slope of the SWRC when they had a higher density. Dry density change is mainly responsible for the large pores. The number of large pores decreased as dry density increased. As the dry density increased, the area of macropores occupying the largest portion decreased, while the area of mesopores and micropores increased. Minipores accounted for the smallest proportion of total area and they were nearly constant. The proportion of large diameter pores decreased relative to pores with small diameters in the tested soils. The total pore volume was lower for soil specimens that had larger dry densities, as compared to relatively loose specimens. There was hysteresis between the drying and wetting curves for all soil samples. Hysteresis decreased as the dry density of the soil increased. The different liquid–solid contact angle was the main factor causing hysteresis of SWRC.
1. Introduction
The measurement of soil parameters for unsaturated soils requires complicated laboratory tests and it is always time consuming. To avoid cumbersome laboratory work, the soil-water retention curve (SWRC) is often used to estimate various unsaturated soil property functions, such as shear strength function, permeability function, and thermal property function. At present, many methods or soil property indexes have been adopted to estimate SWRC.
Geotechnical engineering problems associated with unsaturated soils can be classified into three general factors: stress, deformation, and flow. Most practical engineering solutions involve all three factors simultaneously. SWRCs involve flow phenomena, which mainly deal with capillary flow. A SWRC contains the basic information required to describe the mechanical behavior of unsaturated soil [1]. Therefore, SWRCs can play a significant role in determining the behavior of unsaturated soils. SWRCs have also been used to predict the hydraulic conductivity, shear strength, and volume changes of unsaturated soils [1,2,3,4,5,6].
A SWRC is typically a sigmoid and it illustrates the relationship between suction and the water content of a soil. The drying and wetting SWRCs of soils are a function of stress [7,8], temperature [9,10,11], grain-size distribution [12], and dry density [13,14]. It is well accepted that the initial dry density of soil has a significant influence on the SWRC. Rajkai et al. [15] studied the estimation of water retention characteristic from bulk density and particle size distribution parameters. Tarantino [16] proposed an SWRC equation for deformable soils based on an empirical power function of the water ratio. Gallage and Uchimura [17] investigated the effect of dry density and grain size distribution on SWRC’s parameters of sandy soils. Sheng and Zhou [18] studied the effect of deformation on the soil-water retention properties and found the influence of initial void ratio on the air-entry value and the slope of SWRC.
A number of theoretical or empirical models have been developed to describe a SWRC, but the related microscopic mechanisms underlying variations that result from dry density changes remain largely unknown. It is therefore useful to study ways to enhance the predictive methods of SWRCs. Due to efficiency and non-destructiveness, the nuclear magnetic resonance (NMR), image processing technique and mercury intrusion porosimetry have been used in the field of geotechnical engineering to characterize the structure of geomaterial matrices. In this study, drying and wetting SWRCs for sandy soils were determined in the laboratory using a pressure plate apparatus. In addition, the NMR technique was used to characterize water migration and the redistribution process at various matric suctions during drying and wetting. Image processing was applied to obtain the area of pores between particles by imaging the top surface of specimens with cutting ring. The pore size distribution and porosity of samples were investigated with a mercury porosimetry test. We discuss the results in the context of the influence of the dry density of soils on drying and wetting hysteresis.
2. Experimental Methodology
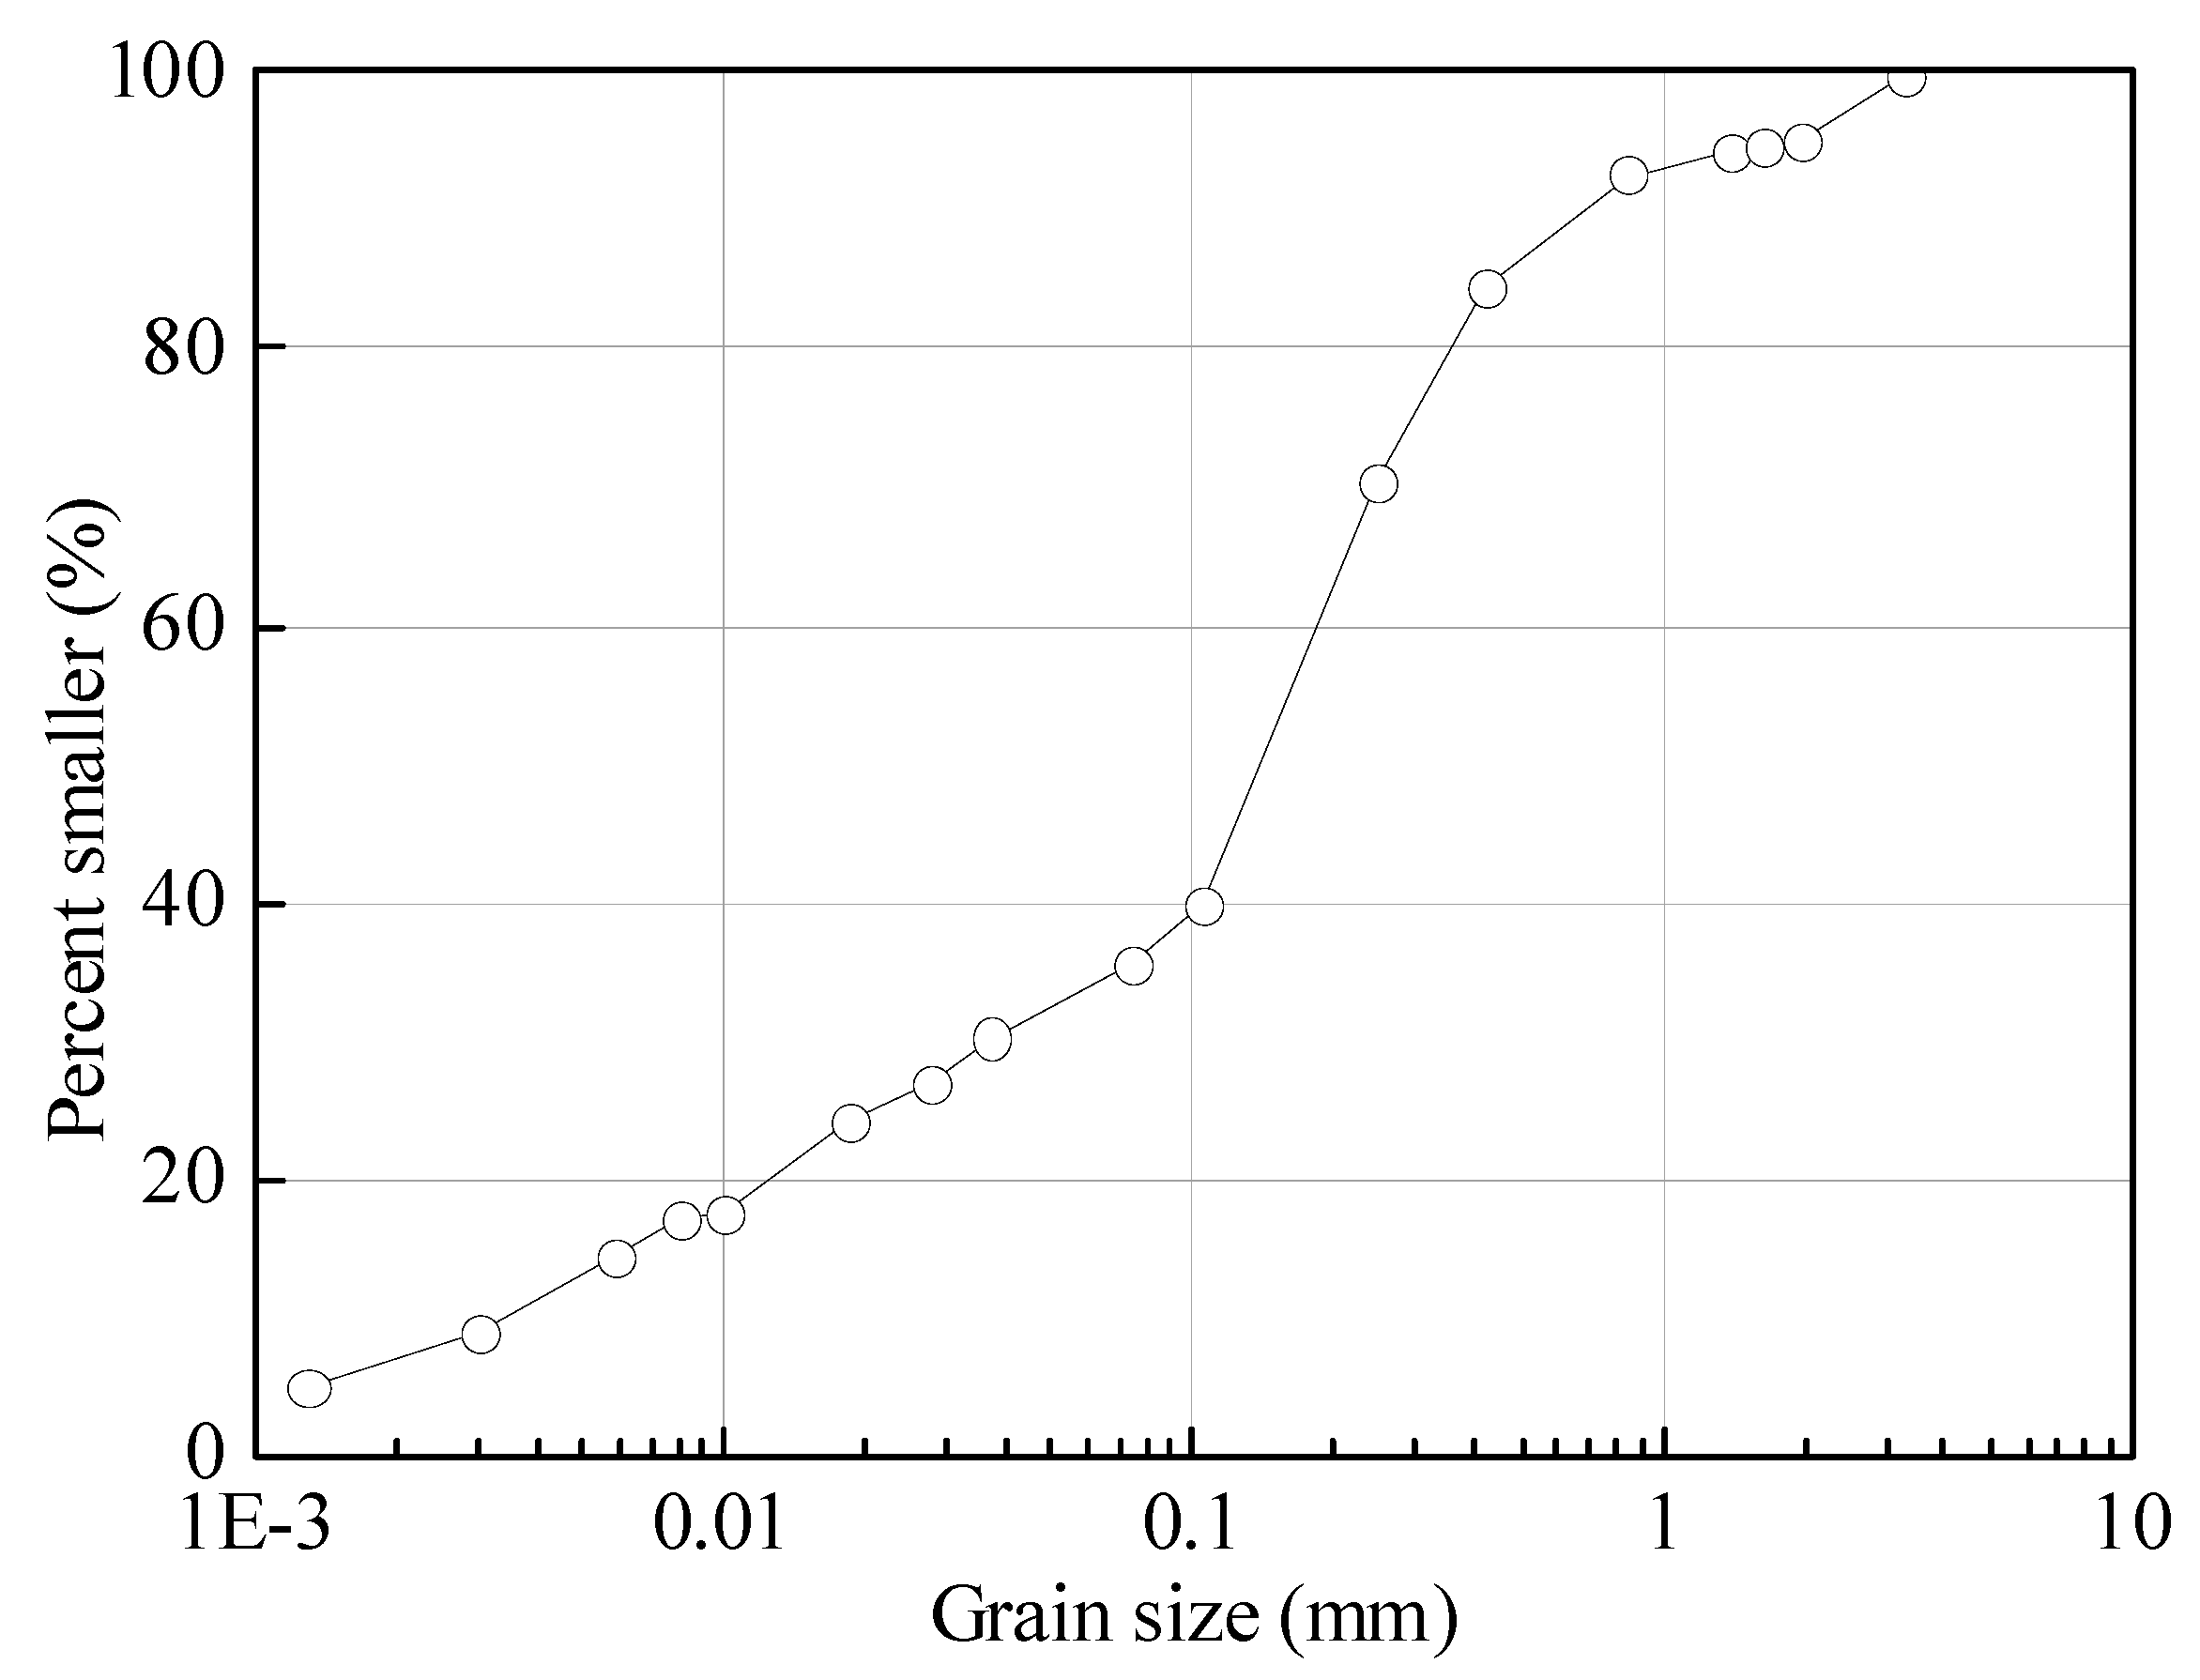
A soil sample was collected from a natural slope in Japan. The physical properties and grain size distribution curves for the test samples are shown in Table 1 and Figure 1, respectively. The soils were classified using the Unified Soil Classification System. The soil type was a silty sand.
A pressure plate apparatus was employed to establish the water content under certain matric suction levels [19]. The pressure plate was thoroughly saturated before use and was soaked in distilled water overnight prior to testing. A tube from the plate outlet extended through the water to the atmosphere to enable air to escape from the cavity between the ceramic and rubber backing as it was being wet.
The pressure plate was then placed in its apparatus. The plate outlet was connected with a piece of tubing to the pressure plate apparatus outlet which extended to the burette. The connecting surfaces of the pressure plate apparatus and its lid were wiped with methylated spirit to remove moisture and dust and the lid was secured in position on the pressure plate apparatus bowl. The release tap was closed and the regulator turned on gradually until the pressure reached levels lower than the desired pressure. We allowed a few hours for the pressure to equilibrate and adjusted the regulator as necessary. We did not allow for the pressure to exceed the desired pressure as this introduced problems with hysteresis. A check was made for leaking pressure plates by observing regular bubbles rising in burette. Leaking plates may result from plates that were inadequately saturated, developed a leak, or from gas that was leaking into the tube connecting the plate to the pressure plate apparatus outlet.
Pressure was sustained in the pressure place device until the water level in the burette becoming static. This process may require 7 days although more time was needed at low pressures. During this time, we ensured that the water level in the burette was maintained at the same level as the plate inside the apparatus to prevent adding an extra component of water potential from outside the apparatus. We allowed a few days of equilibrium before taking measurements.
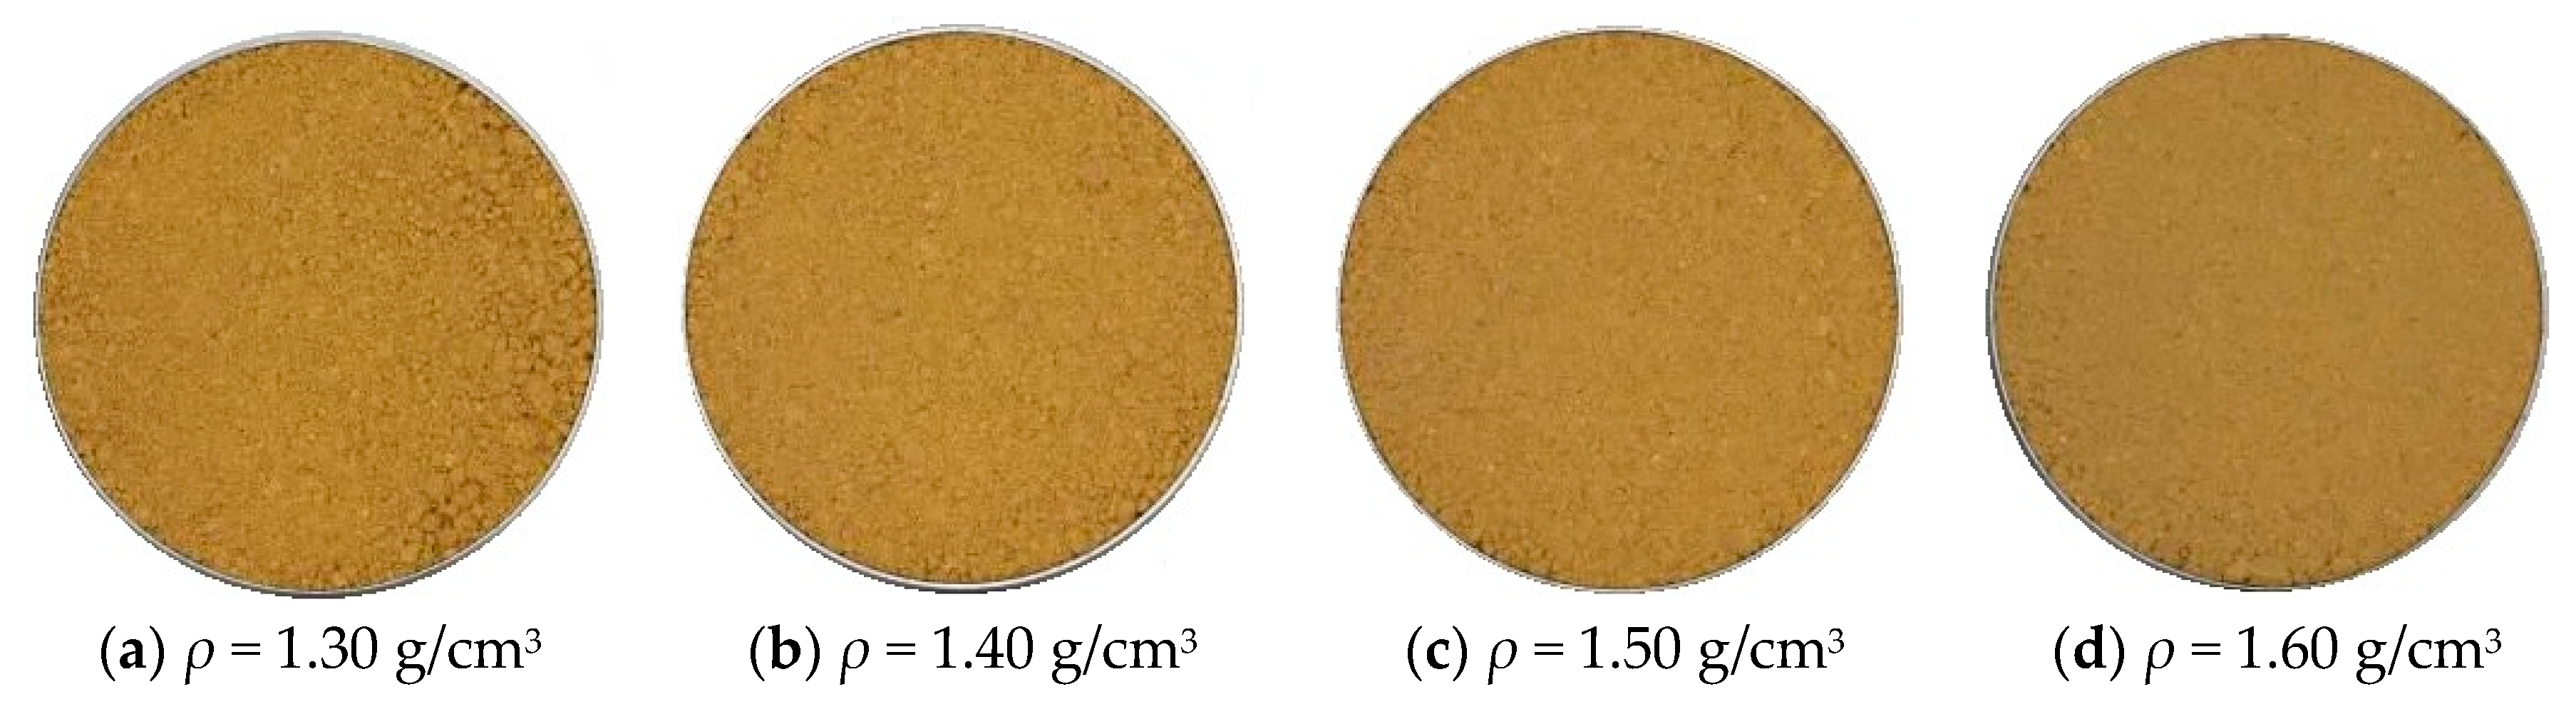
The experiment involved sample preparation, ceramic disk saturation, and recording drying and wetting SWRCs. The test was initiated by saturating the ceramic disk by immersion in water and subjecting it to negative pressure (−101.78 kPa). After 24 h, the disk was removed from the saturation tank, installed in the pressure plate apparatus. Weight of oven-dried sand, required to achieve target density was computed. Soil samples with dry densities of 1.30, 1.40, 1.50 and 1.60 g/cm3 were used in the experiment. Soils were mixed with water to achieve a gravimetric water content of 10% for all the experiments. To ensure that all the soil samples had the same structure for all tests, a predetermined sample mass was pressed into a 2 cm-high cutting ring with the 30 cm2-area, i.e., inner diameter of 61.8 mm (Figure 2). After a soil sample was compacted, it was then saturated using the vacuum saturation method. The sample was assembled on the saturated ceramic disk in the pressure plate apparatus.
The saturated soil sample underwent different amounts of matric suction in order to establish the SWRC in drying and wetting, and the correlating alteration in the sample moisture was noted. Afterwards, the sample was dried via strengthening matric suction to 0.5 kPa, 1.0 kPa, 2.0 kPa, 4.0 kPa, 7.0 kPa, 10.0 kPa, 15.0 kPa, 30.0 kPa, 50 kPa, 100 kPa, and 200 kPa. For matric suction, pore air pressure was increased. The magnitude of applied matric suction was thus equivalent to the applied pore air pressure.
On each increment of matric suction, water flowed out from the specimen until equilibrium was reached. Equilibrium was generally attained in 24–48 h. To determine the amount of water that was lost from the specimen, the soils were removed from the cell and weighed, which provided the water content. The specimen was then moved into the sample tube of the NMR apparatus and an NMR measurement was made. NMR tests were conducted on the treated specimens by the AniMR-150 NMR imaging system, which is manufactured by Niumag Electric Technology Company, Ltd. in the city of Suzhou. Acquisition parameters and sampling parameters were set before starting the NMR experiment. This process was repeated until all the suction steps were applied. Maximum matric suction that can be applied to the specimen is limited by the air entry value of the ceramic disk, which was 300 kPa for the present apparatus. The maximum matric suction applied to soil specimens was 200 kPa.
To simulate the wetting path, pore air pressure was reduced from 200 kPa, while still keeping the water pressure at the constant value of zero. After decreasing the pore air pressure, water flowed into the soil specimen through the ceramic disk until equilibrium was reached. Soils were removed from the cell and weighed again to determine the water content sucked by the specimen. The same procedure was repeated for lower matric suction values.
Upon the specimen achieving zero matric suction in the wetting process (i.e., pore air vented to the atmosphere and the water level kept at the center of the specimen), the soil sample was taken out and the correlating moisture content was established by oven-drying the specimen. The actual water content of the soil samples was calculated using the final moisture content of the various suction levels of soil samples.
The pore size distribution was measured with mercury intrusion porosimetry (MIP) in an AutoPore IV apparatus (Pmax = 400 MPa). This allowed study of pore radii ranging from 3.7 nm to 1000 μm. By measuring the volume of mercury that intruded into the sample with each pressure change, the volume of pores in the corresponding size class was calculated. The samples for the MIP test were carefully trimmed into pieces that had an approximately cubic shape and a volume of approximately 1 cm3. They were then vacuum dried with lyophilization using a Freeze Dryer apparatus (ALPHA 1–2 Ld Plus—Martin Christ Gefriertrocknungsanlagen GmbH, Osterode am Harz, Germany) to remove the pore water without damaging the original texture of the soil sample. MIP testing was conducted on the soil after SWRC test.
3. Experimental Results
3.1. SWRC Test
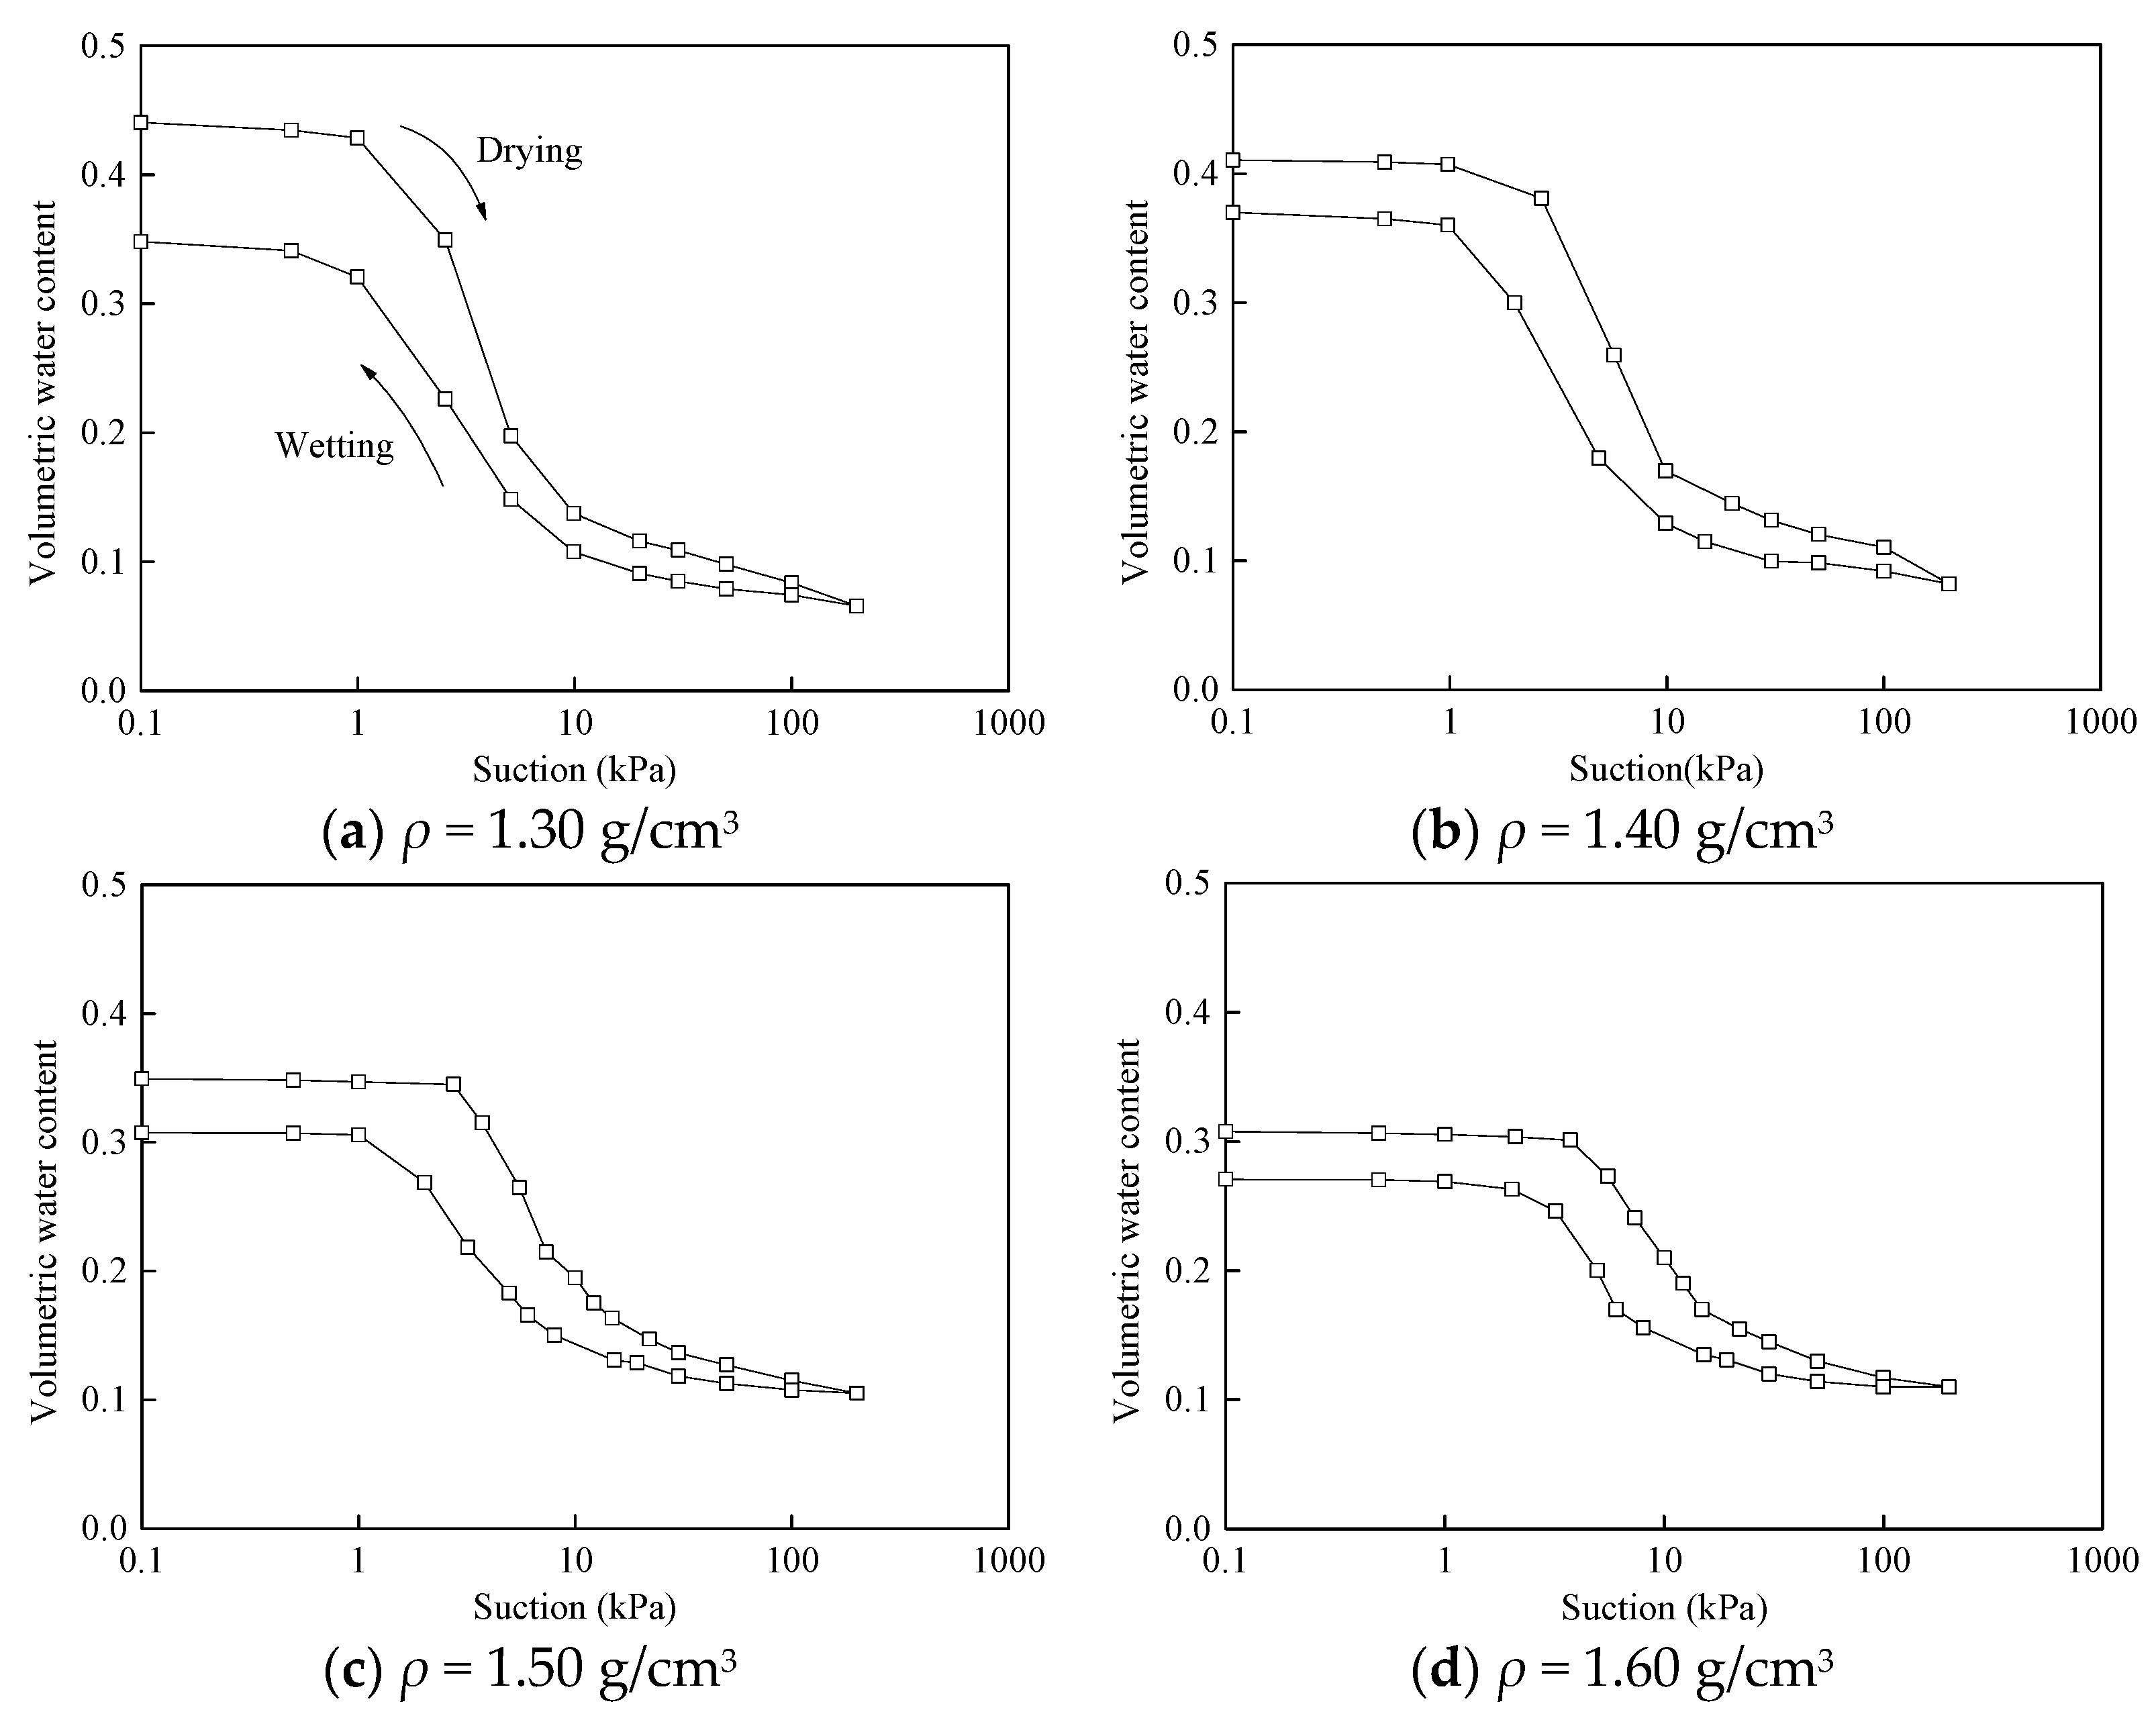
The experimental data of soils with different densities are presented in Figure 3. There were three stages in the process of desaturation of a soil. These are the transition stage, the boundary effect stage, and the residual stage of unsaturation. They are described as follows:
Boundary effect stage: At this stage, the pore water is in a state of tension. However, due to capillary force, the soil was still mostly saturated, and this phase continues to the entrance value of the soil.
Transition stage: The phase starts at the end of the inlet and residual water content. The soil begins to saturate with the air inlet value, and the water in the pores becomes greater with more airflow. When the suction increases, the flow of water is liquid. As the suction increases, the soil dries quickly. The connectedness of water in the pore or the void continues to decrease as the suction increases.
Residual stage of saturation: Big increases in suction result in very little change in water content (or degree of saturation). Water and soil are closely combined, and the water movement mainly occurs as vapor flow. There is a small amount of hydraulic flow through the pore; but, there is some water movement as film flow.
The air-entry value and the residual state (residual water content and residual suction) are normally determined by following this procedure: draw the tangent line through the inflection point, followed by a horizontal line through the initial point and another tangent line through the point where the curve starts to drop linearly in the high suction range. Finally, the intersections of these tangent lines indicate air-entry value (AEV) and the residual state.
Because of the impact of dry density, the dry SWRCs in the laboratory revealed the variations in SWRCs, which were established by the differences in SWRC parameters, for example, the air-entry value (ψa), residual matric suction (ψr), and slope of the SWRC (s). To examine the impact of preliminary density on SWRC parameters, SWRCs of unsaturated soil with various drying densities were reviewed.
The air-entry value, AEV or ψa, is characterized as the matric suction in which the air begins by going into the biggest pores in the soil throughout a drying process [20]. Thus, the air-entry value is the substrate suction force of the surface tension coming out of the surface tension of the water surface in the largest pore.
The volumetric water content of the soil was nearly constant as the matric suction increased from zero (corresponding to saturation state) to the AEV of the soil. Then the water content stably decreased to the residual water content, θr, as the matric suction increased beyond the AEV. The θr is the water content in a residual state. A large matric suction change is required to remove additional water from the soil and the water phase is discontinuous in this state. The soil matric suction corresponding to the residual water content is called the residual soil matric suction, ψr. The definitions of air-entry value (ψa), residual matric suction (ψr), and the slope of SWRC (s) are given by Vanapalli et al. [21]. The slope of the SWRC can be measured as [(ψa − ψr)/(logψr − logψa)].
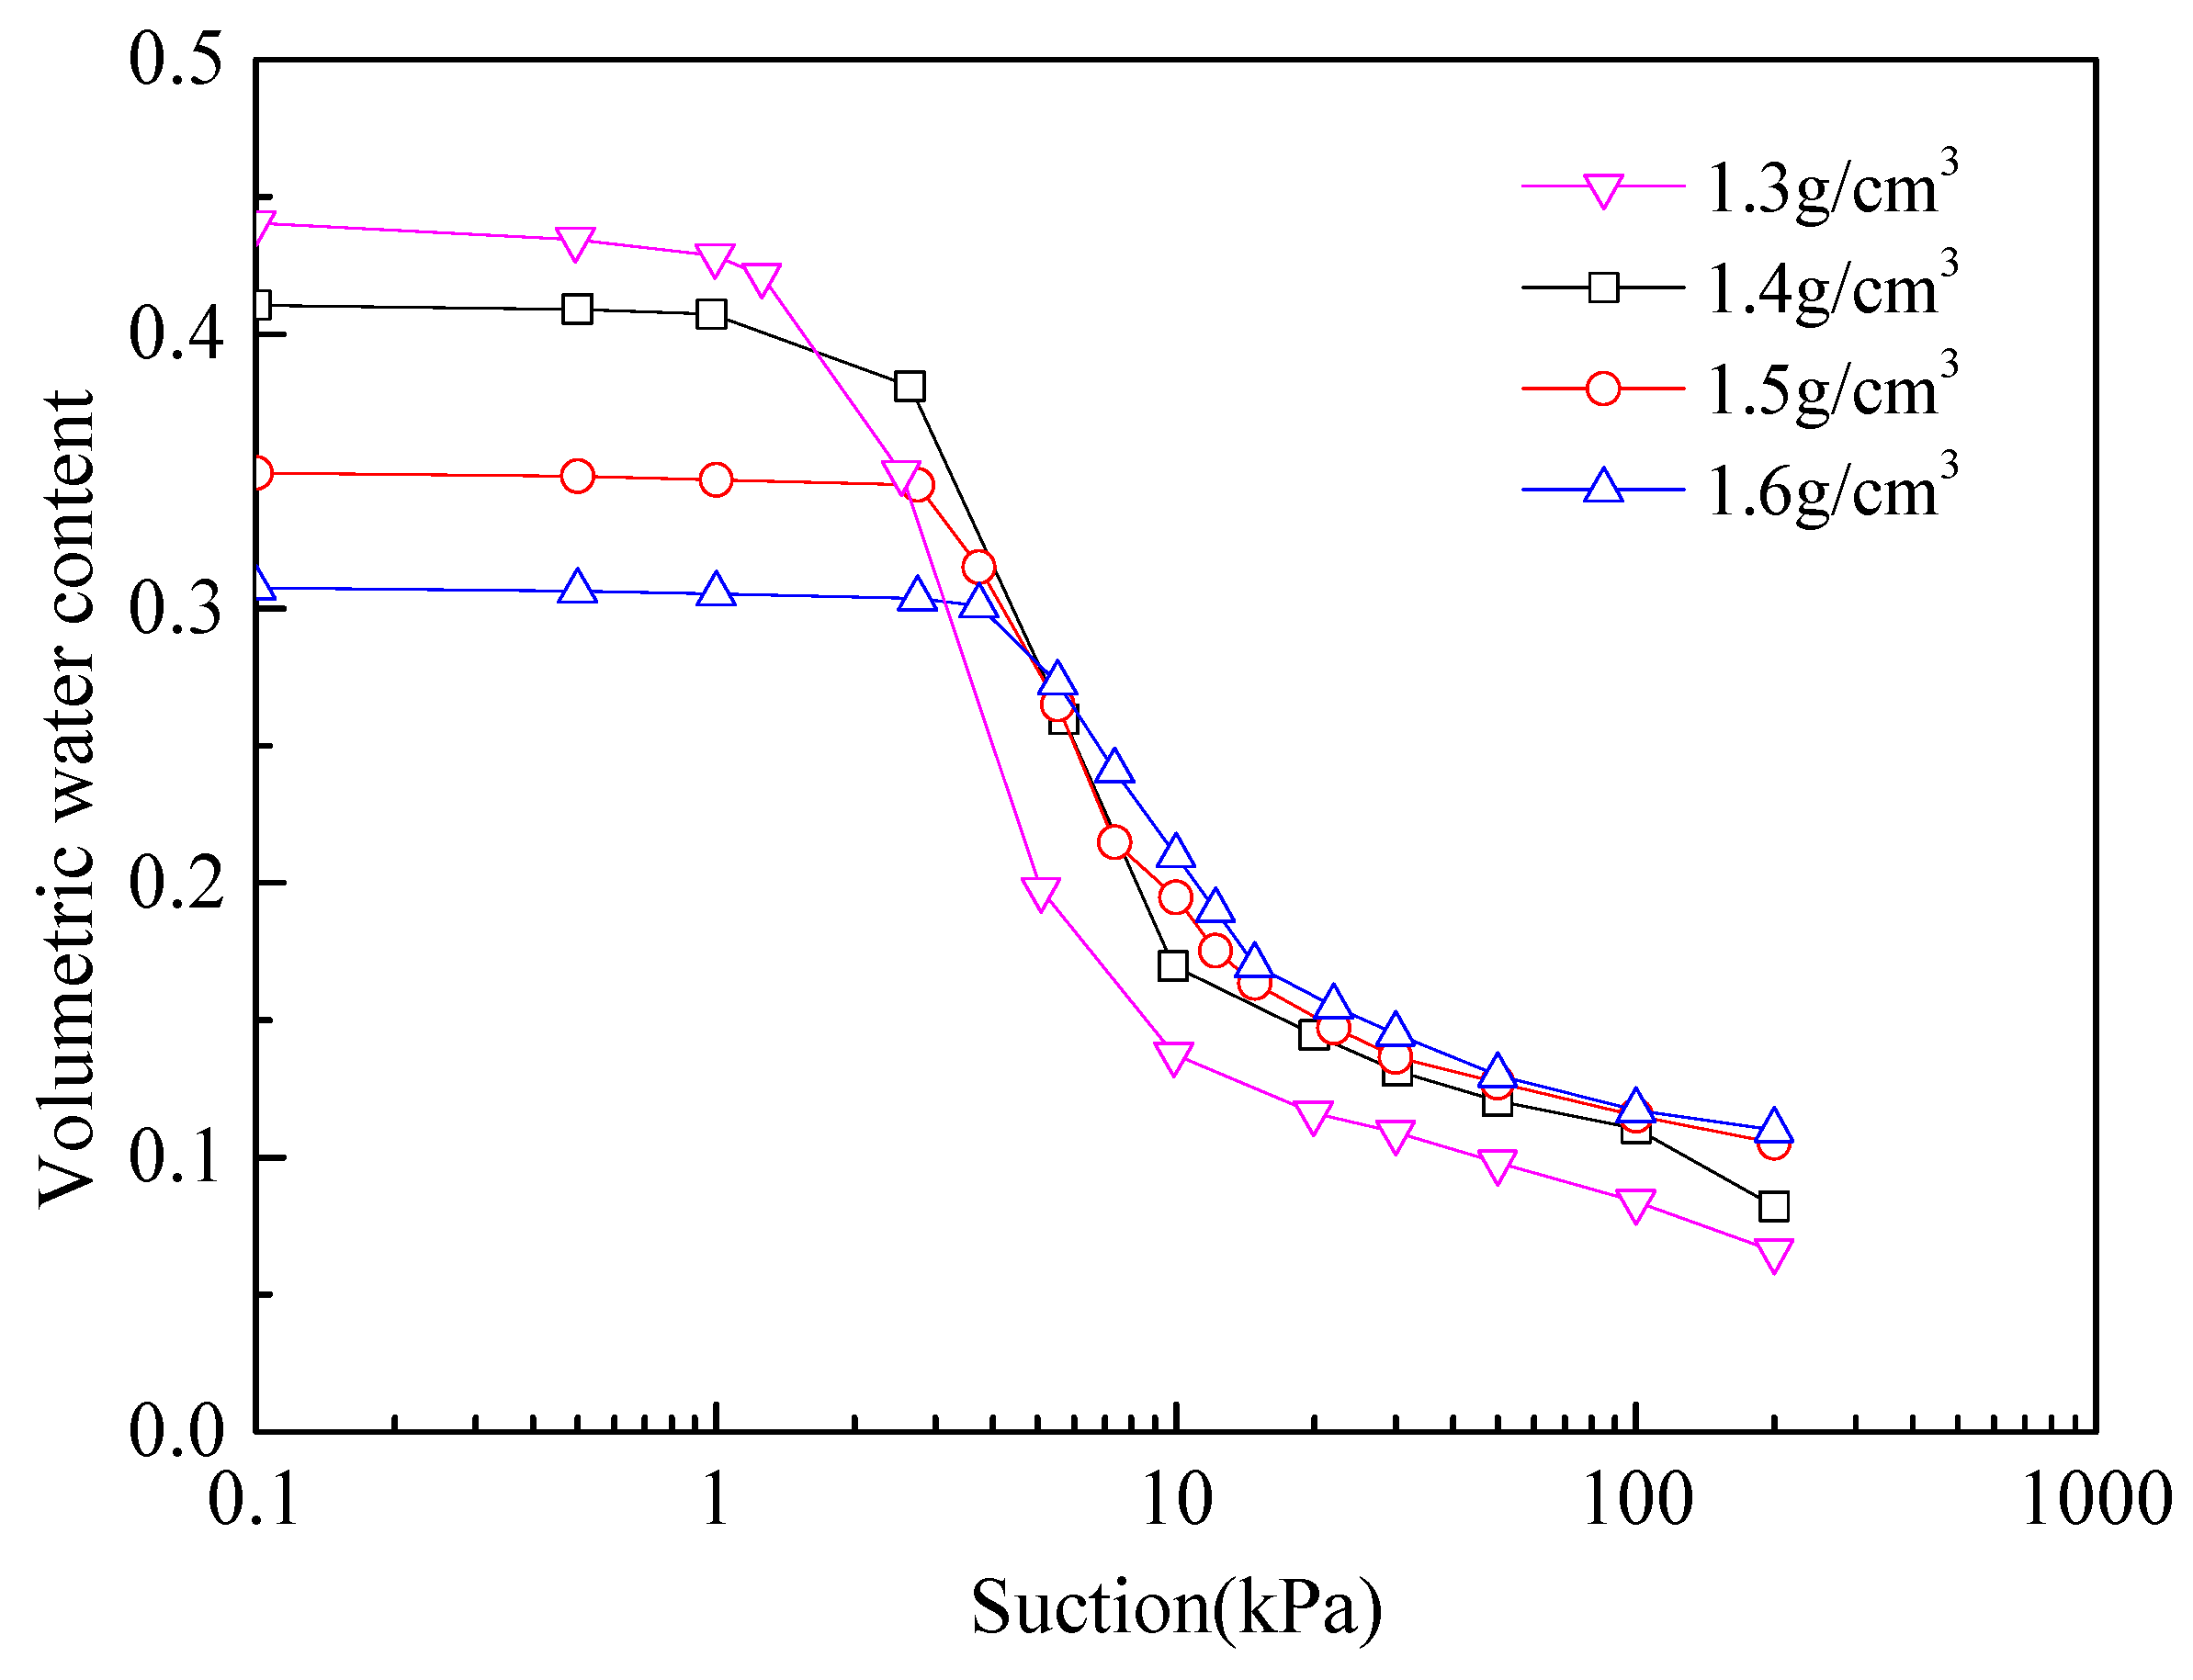
The initial dry density of soil samples has a significant effect on SWRCs (Figure 4). At the beginning of zero suction, the initial volume of the soil samples with high dry density was low. The decrease in the initial volumetric water content may be due to the reduction of the volume of the void in increased initial dry density. The volumetric water content of all of the soils decreased, as the suction increased, but they decreased at different rates. The increase of dry density of the sample produced a lower volumetric water content reduction rate.
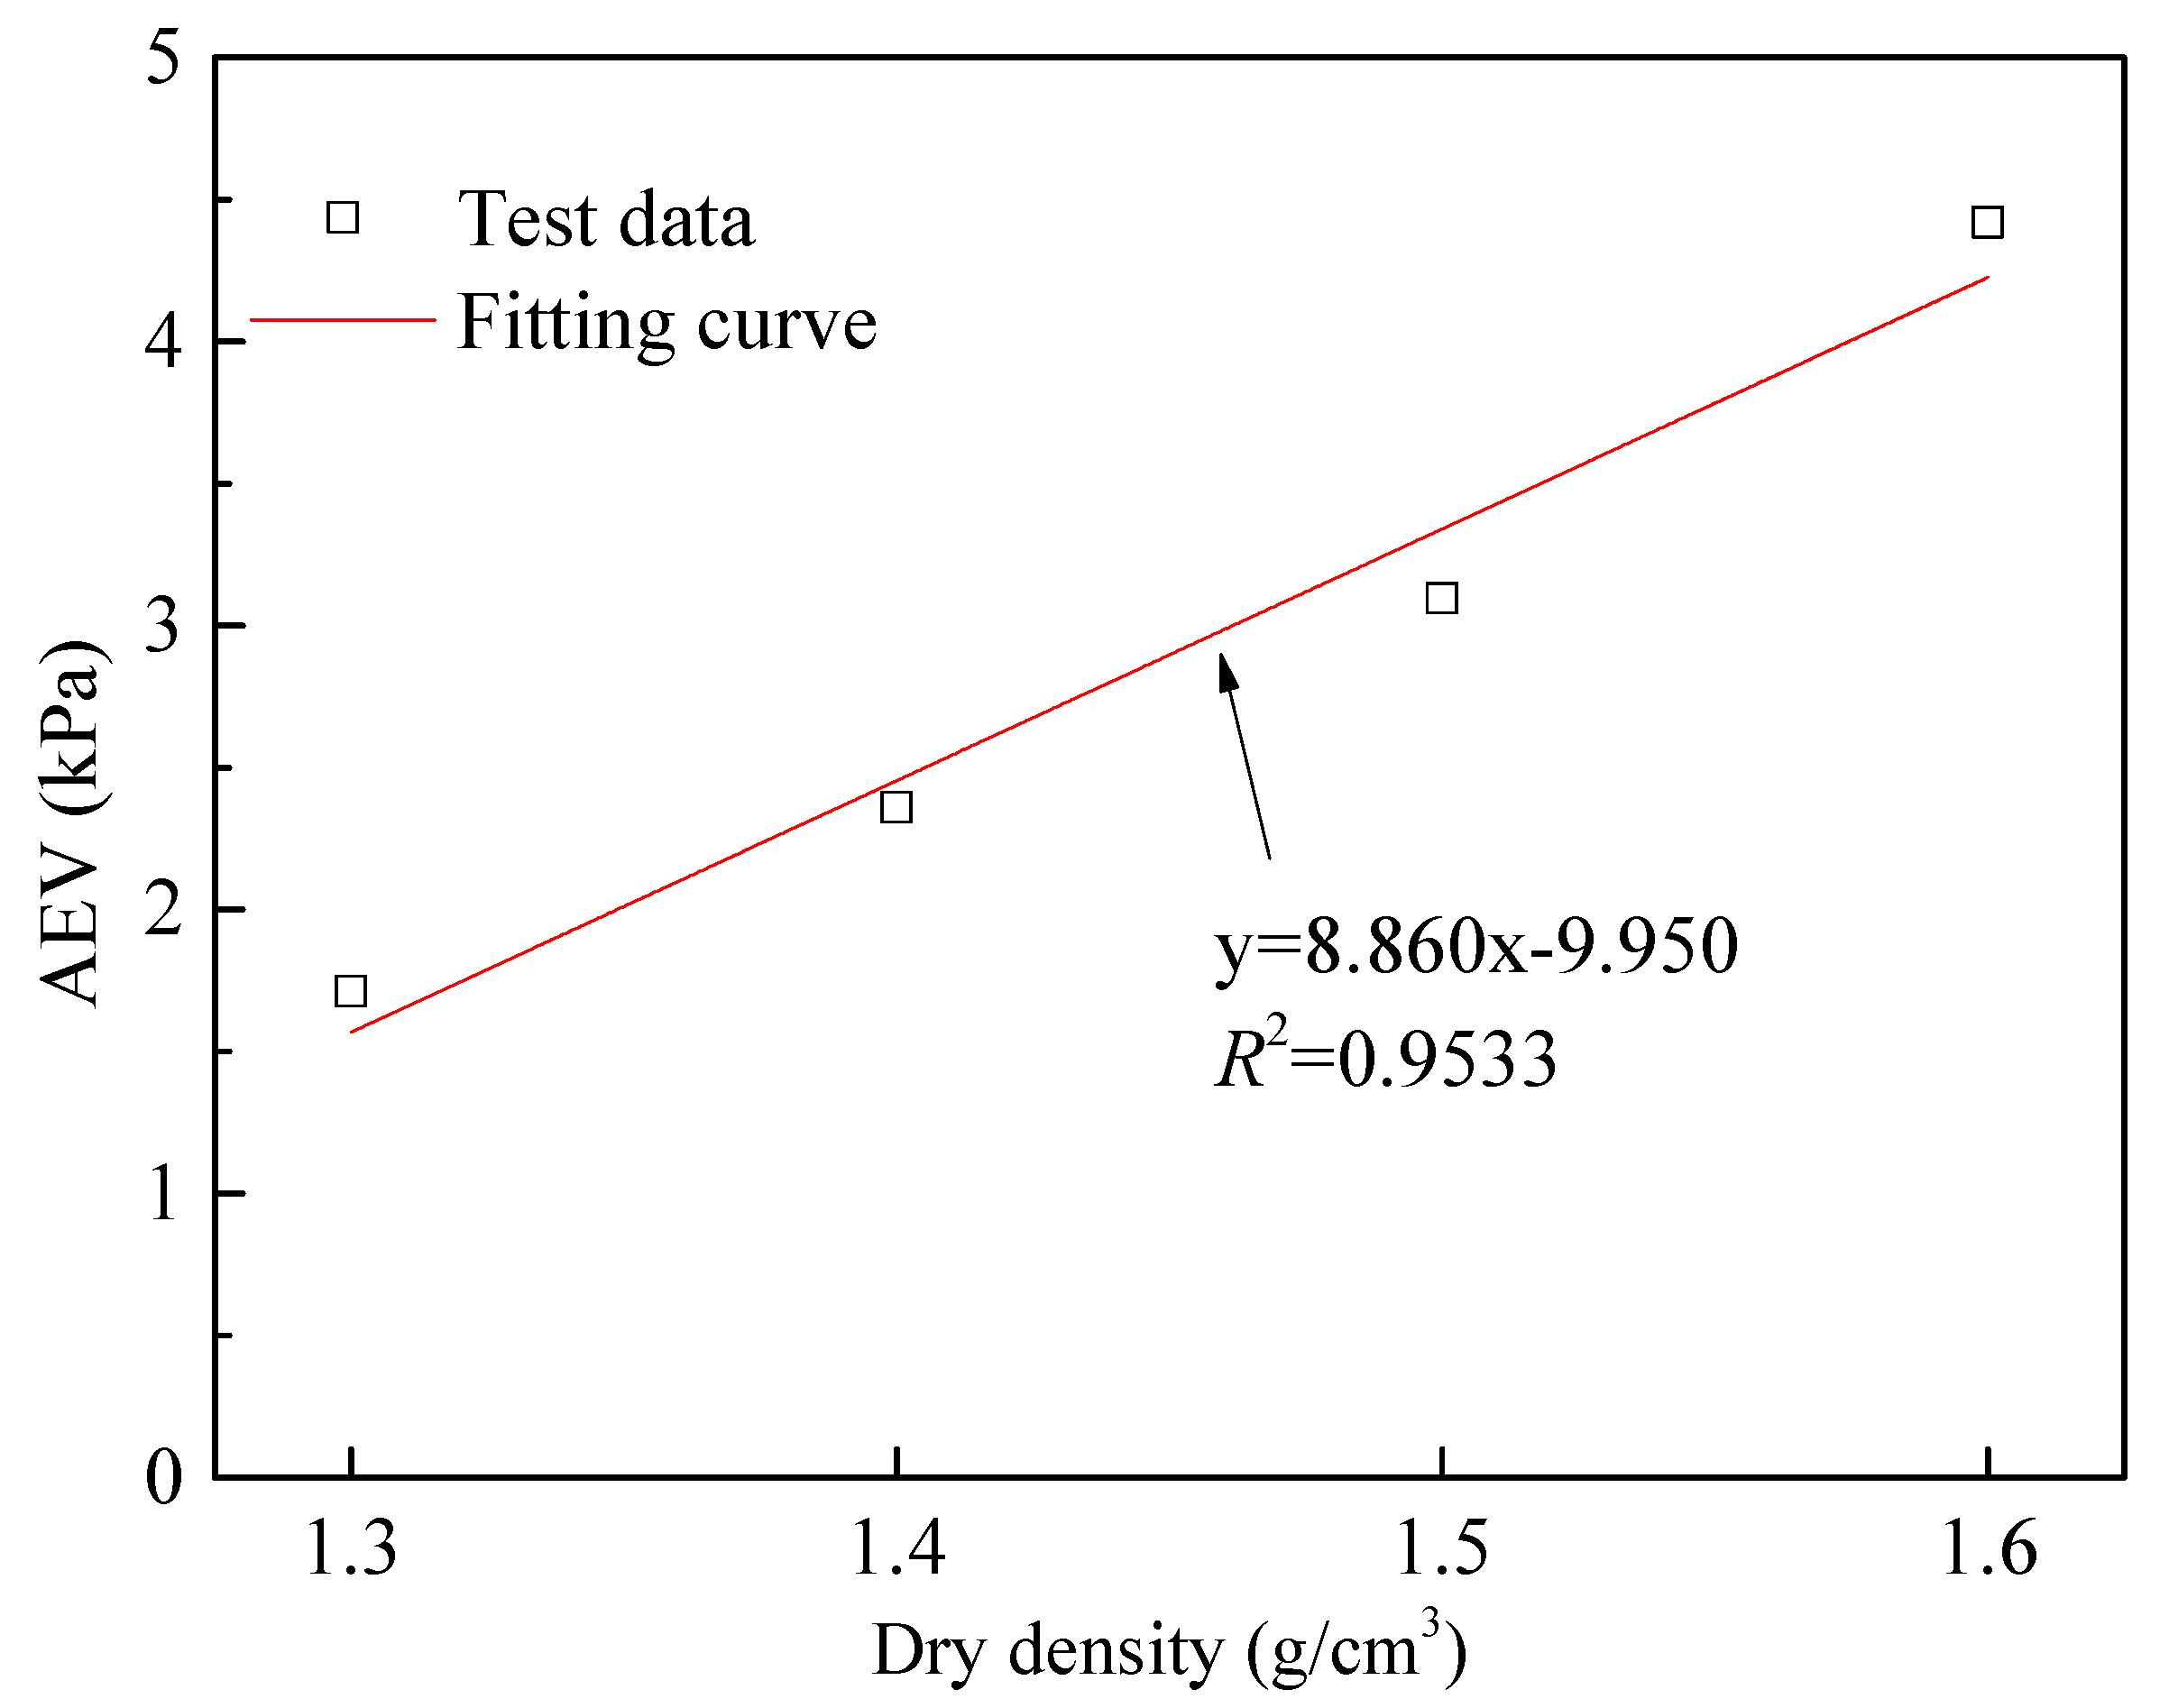
Figure 5 shows the propensity of soil samples with larger dry density to have greater air entry values. This may be due to the existence of the small mean pore size in soil samples caused by high dry density. According to Vanapalli et al. [21], the air-entry value from each sample was compared with the dry density, and the results showed that the entry value increased linearly with the dry density.
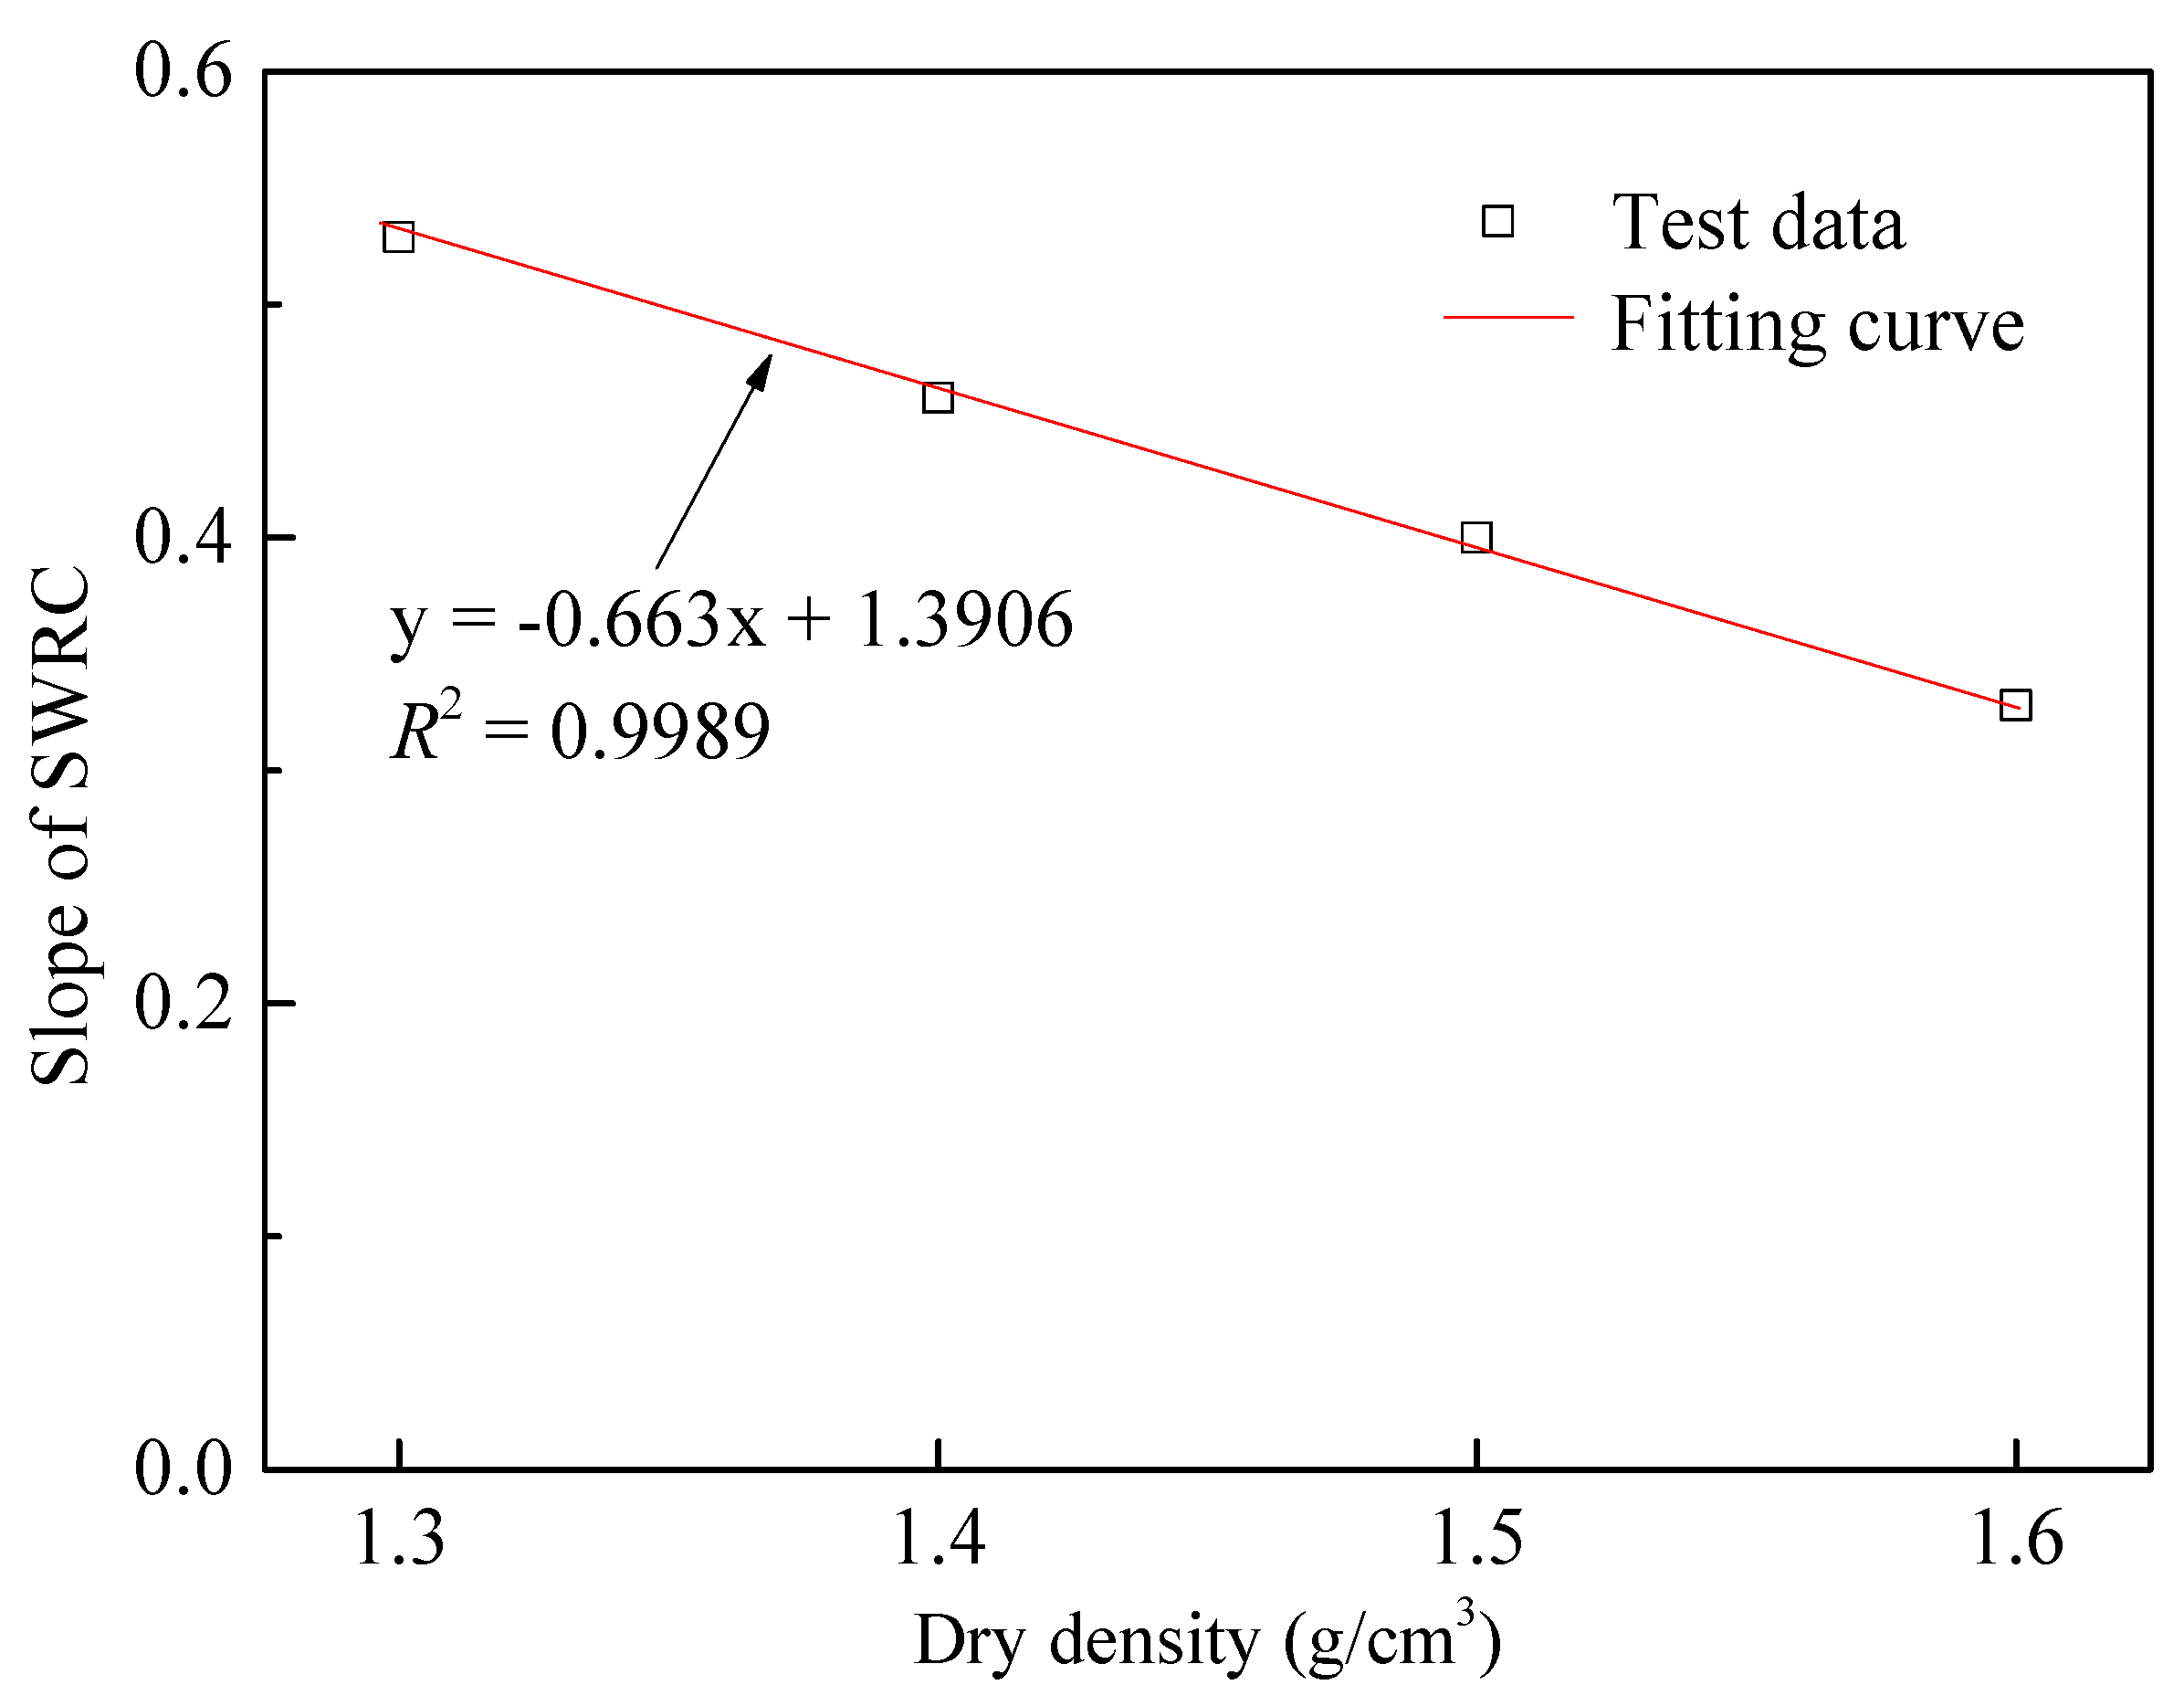
Compared with the sample with a low density, the sample with a high density loses water at a faster rate (Figure 4). Figure 6 reveals the slope of the SWRC with dry density. The greater the dry density, the lower the slope of the SWRC. Thus, the water content of the high-density soil is greater than the low-density soil at a matric suction beyond their air-entry values (see Figure 4).
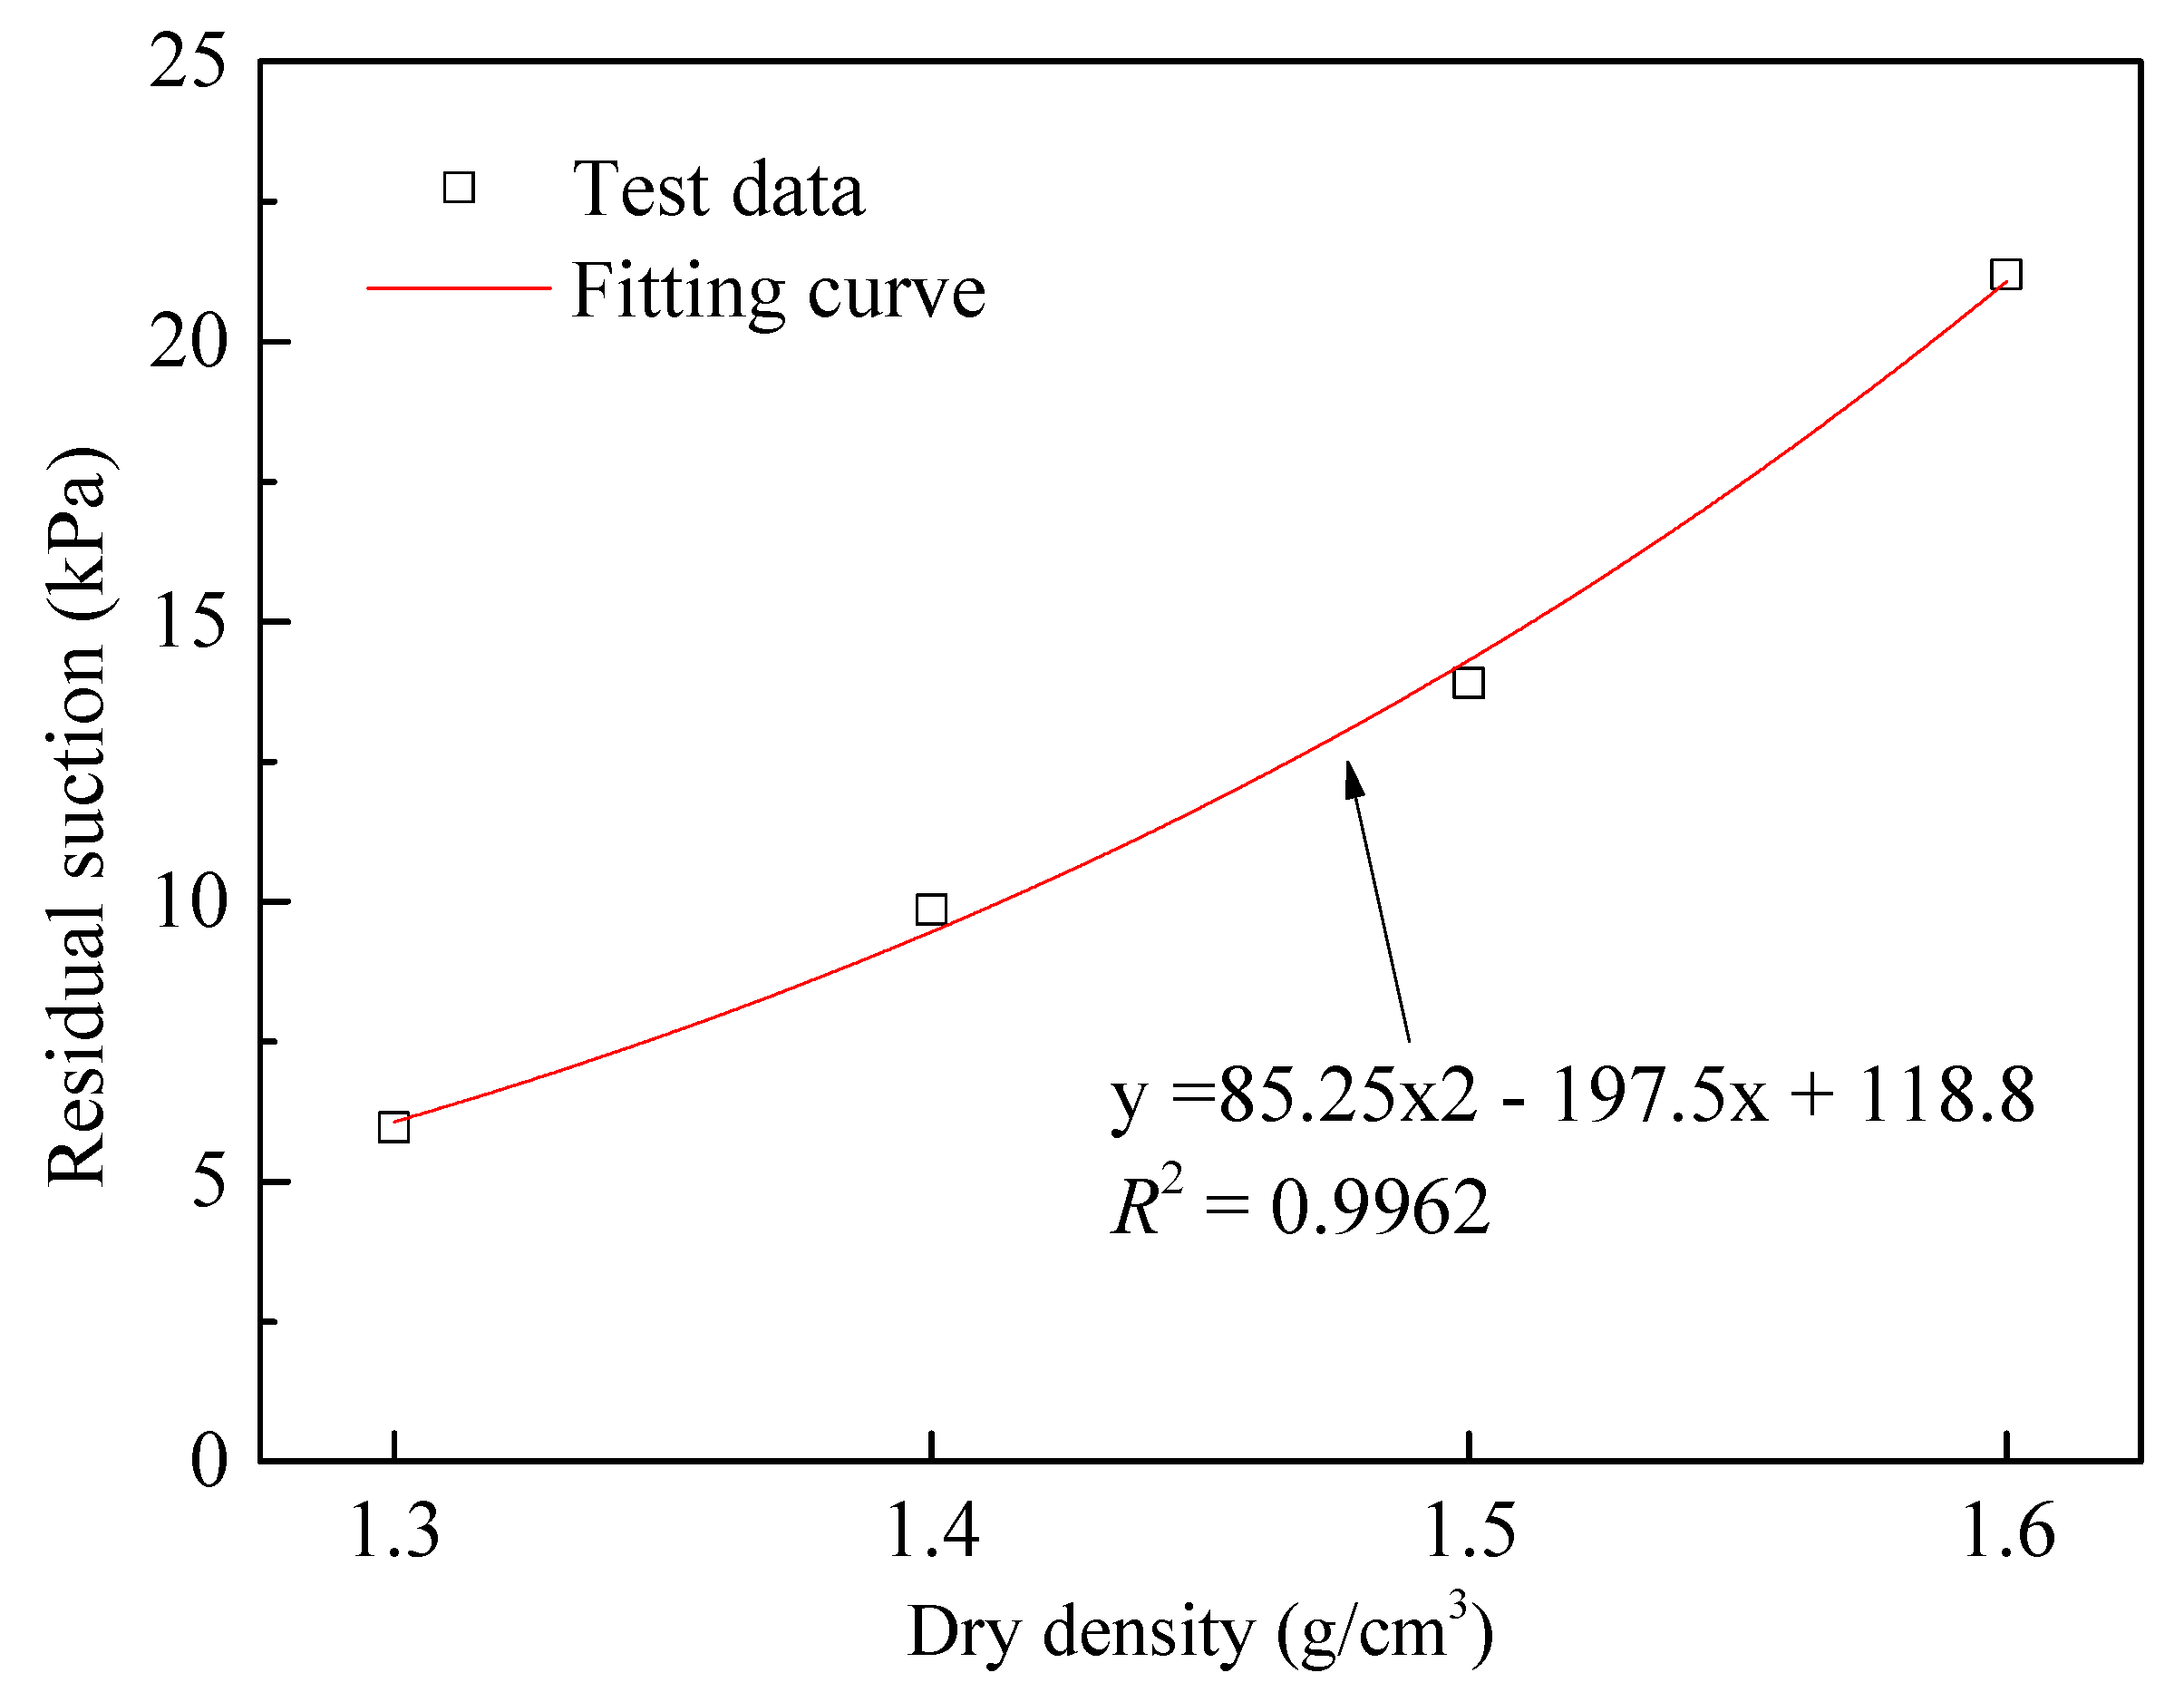
Figure 7 reveals the difference of residual matric suction in conjunction with the dry density of the soil specimen. An increase in preliminary dry density increases the residual matric suction (ψr). These findings agree with the results of Croney and Coleman [22].
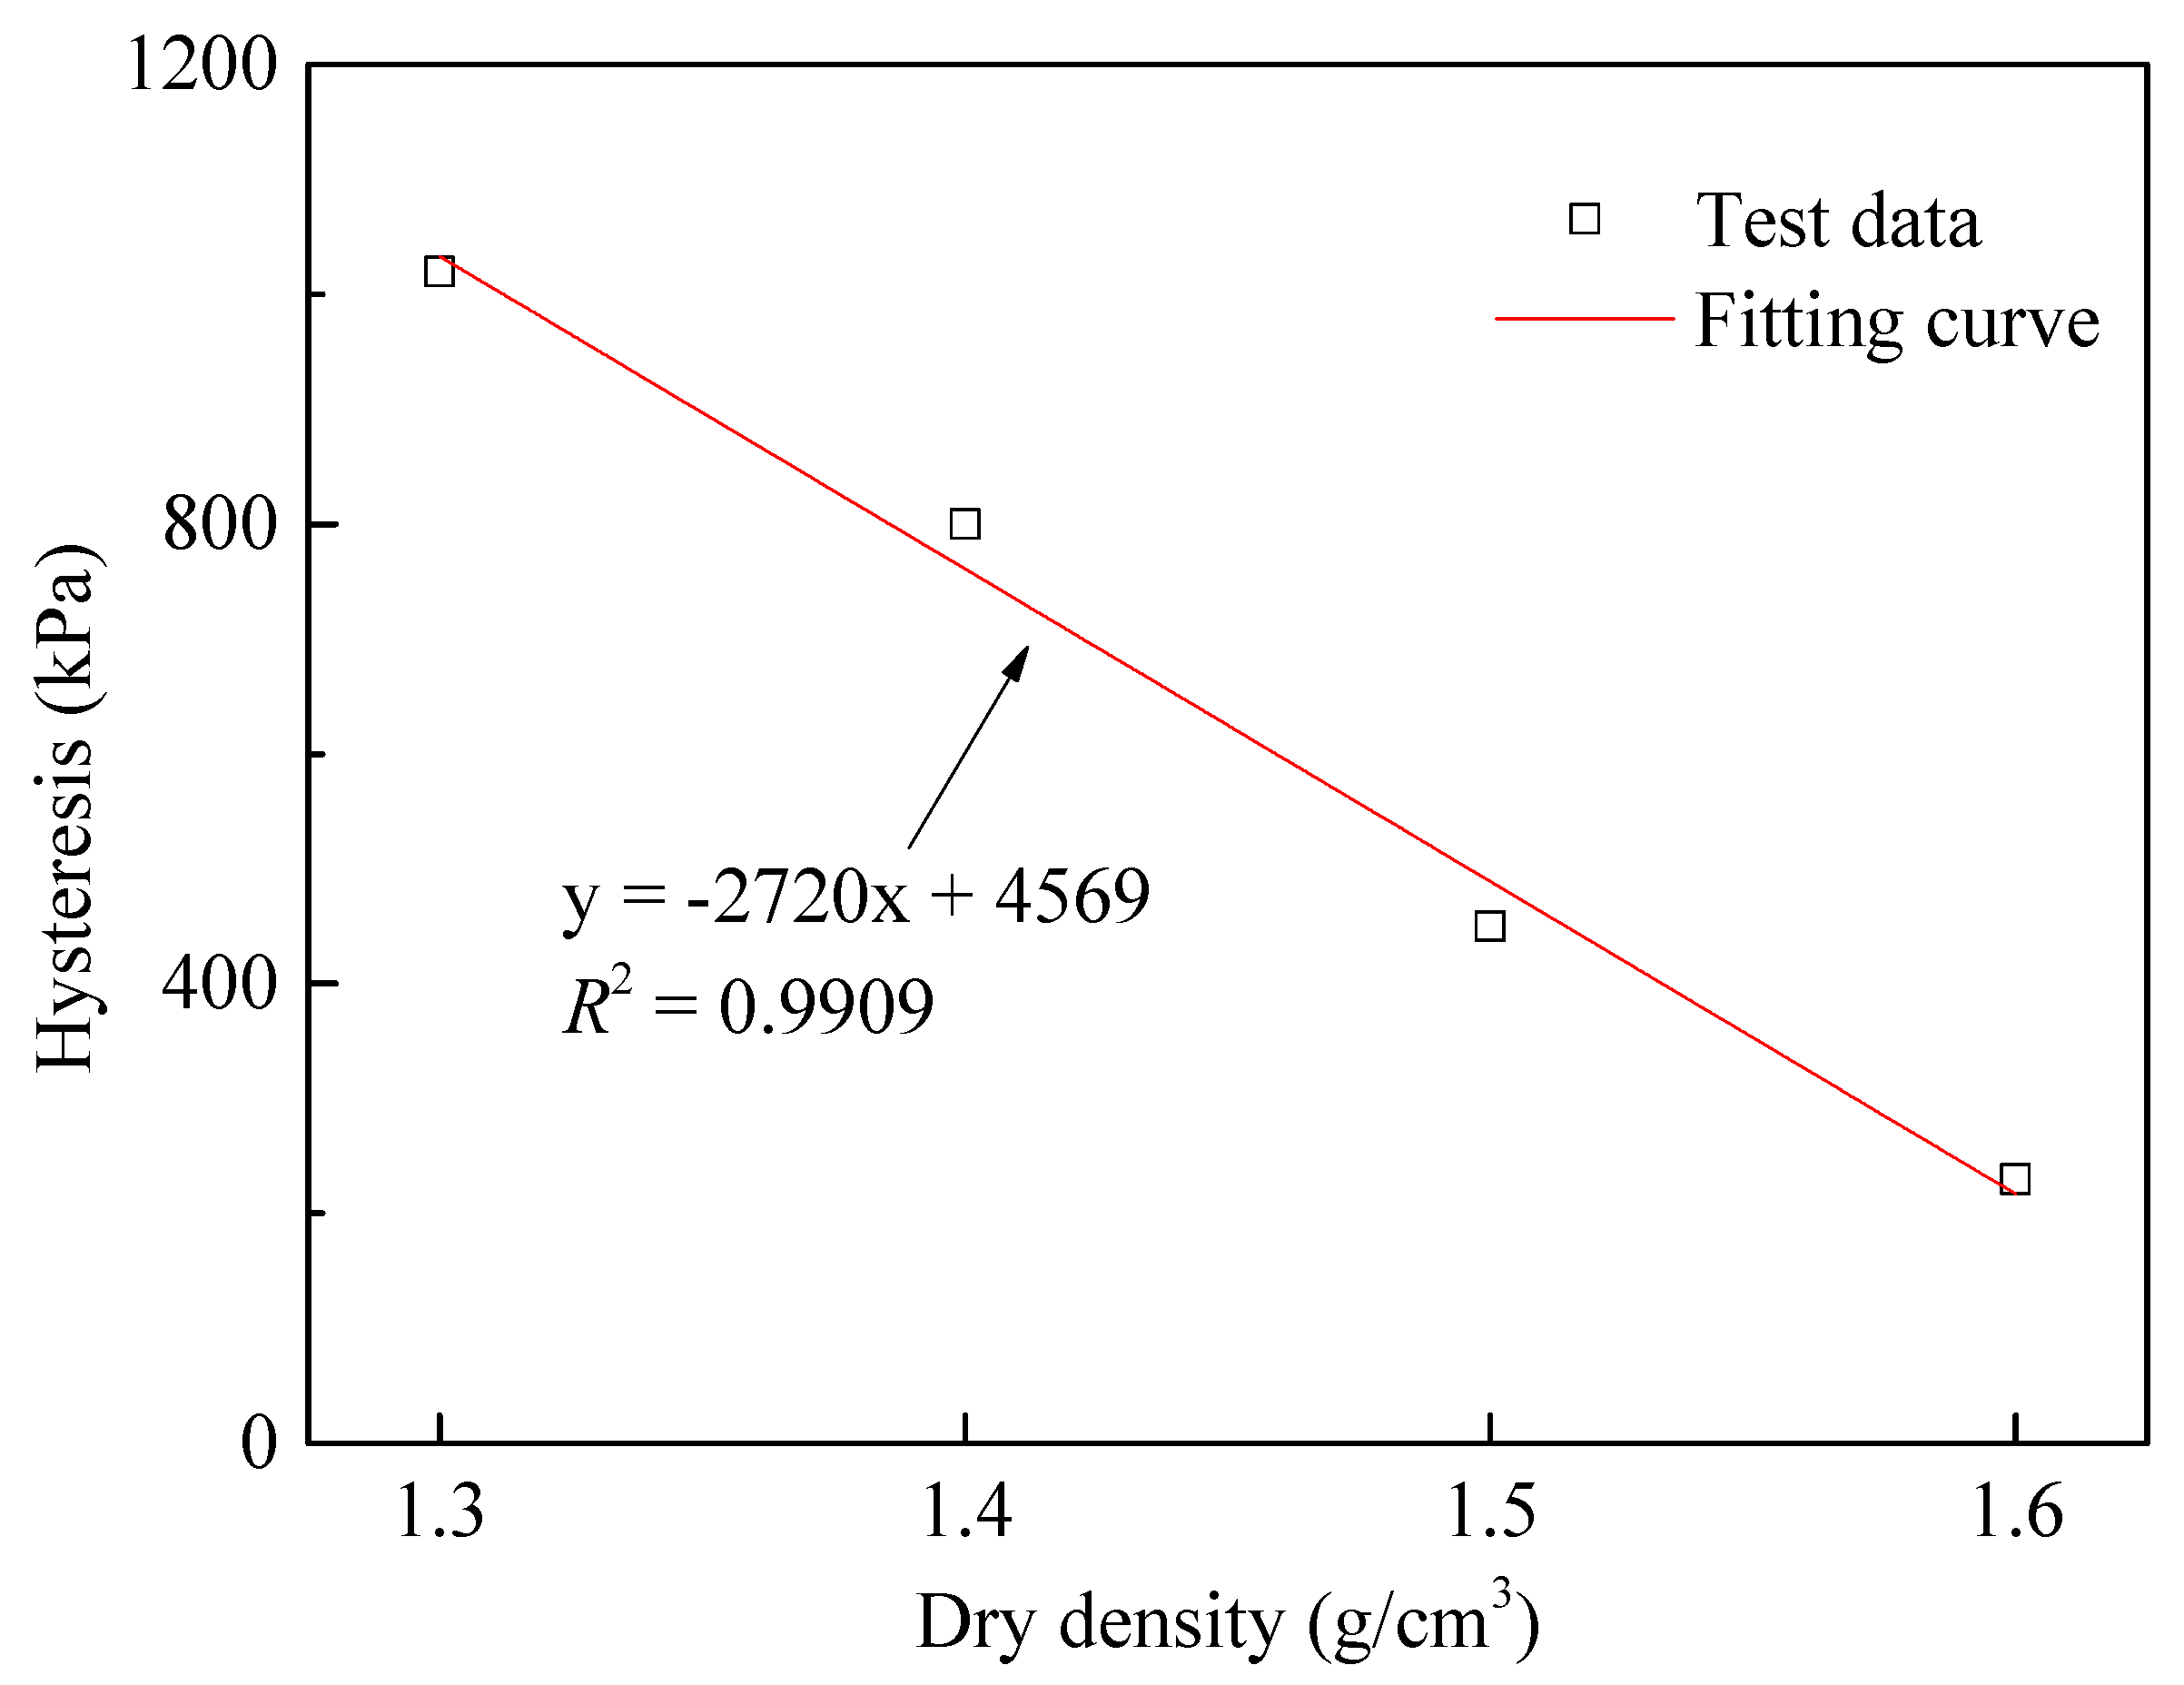
The water content of soil at a matric suction is not unique. The drying curve is always located above the wetting curve. The soil has different suction during the drying and wetting processes, which is called hysteresis. In this study, the hysteresis between the drying and wetting SWRCs was quantified (Figure 8). The area between the drying and wetting SWRCs was computed on a log scale over the matric suction range from 0.1 kPa to 200 kPa. The hysteresis from the high-density sample was less than that from the low-density sample (Figure 8). The possible reasons for this behavior may be less pore-volume and greater capillary potential created by the denser soil sample.
3.2. NMR Test
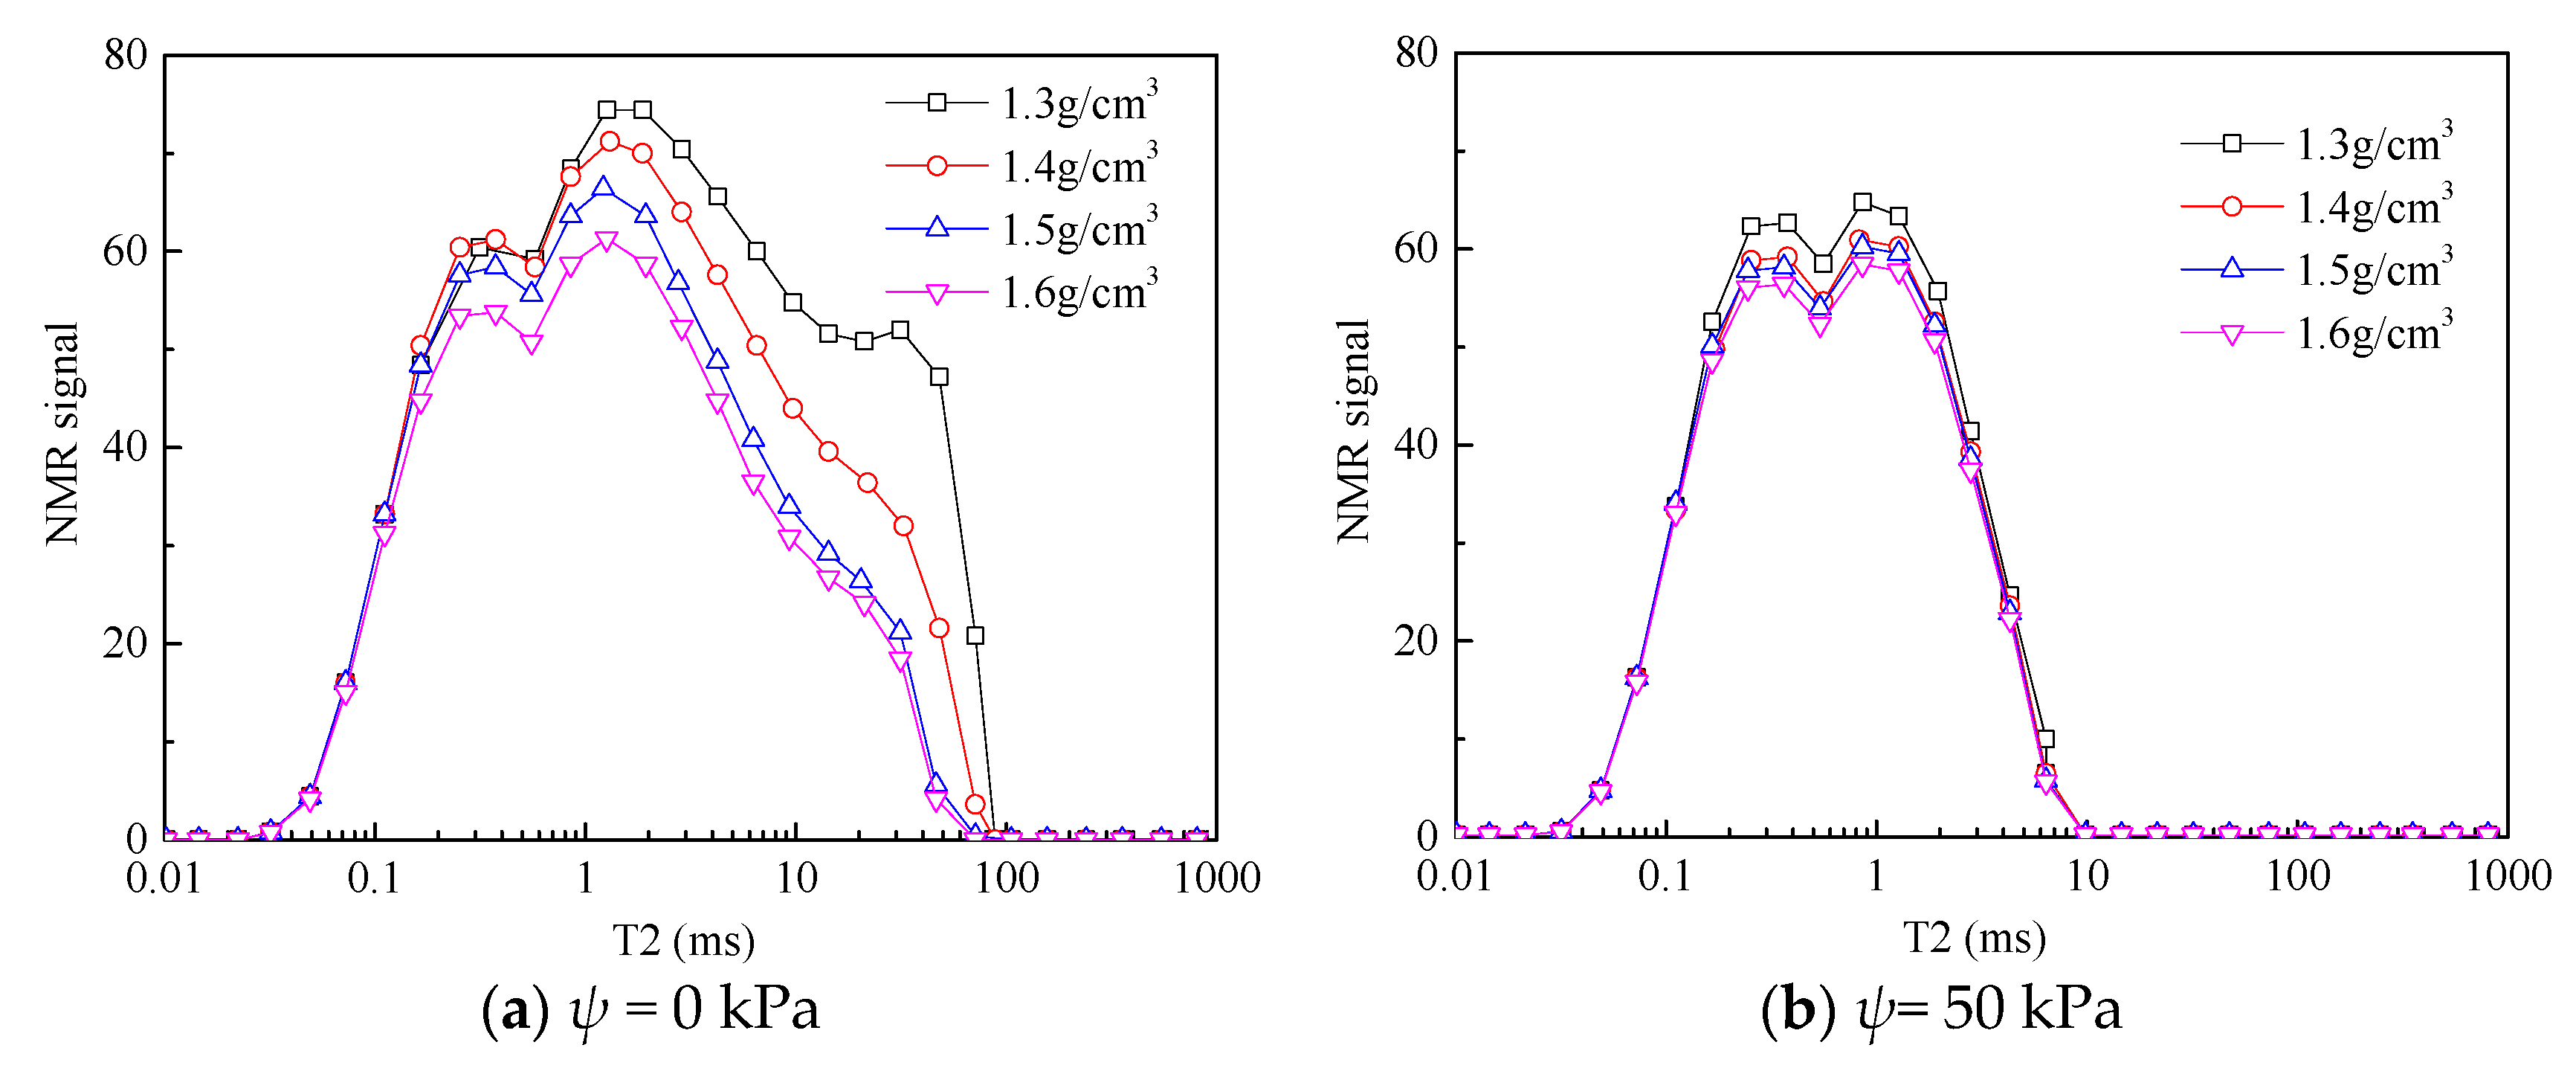
Transverse relaxation corresponds to transverse magnetization decay. Transverse magnetization decay is described by an exponential curve, characterized by the time constant T2. After time T2, transverse magnetization has lost 63% of its original value. The transverse relaxation time (T2) of pore fluid in the soil sample is proportional to the pore diameter [23]. Therefore, the T2 distribution reflects the characteristics of the soil pore structure. The T2 distribution curve of various dry densities is shown in Figure 9. The maximum T2 is the value of the largest NMR signal, indicating the optimal radius of the pore filled with water at the specified matric suction value.
The T2 distribution curve area and the maximum T2 decrease with the increase of the matric suction. This indicates that the pore water discharge occurs from the larger pores to the smaller pores. Also, we observed the same change trend for the T2 distribution curve area and the maximum T2 with dry density, indicating that the change of dry density is mainly responsible for the large pores. As dry density increases, the number of large pores decreases.
4. Discussion
4.1. Mechanism of Density Effect
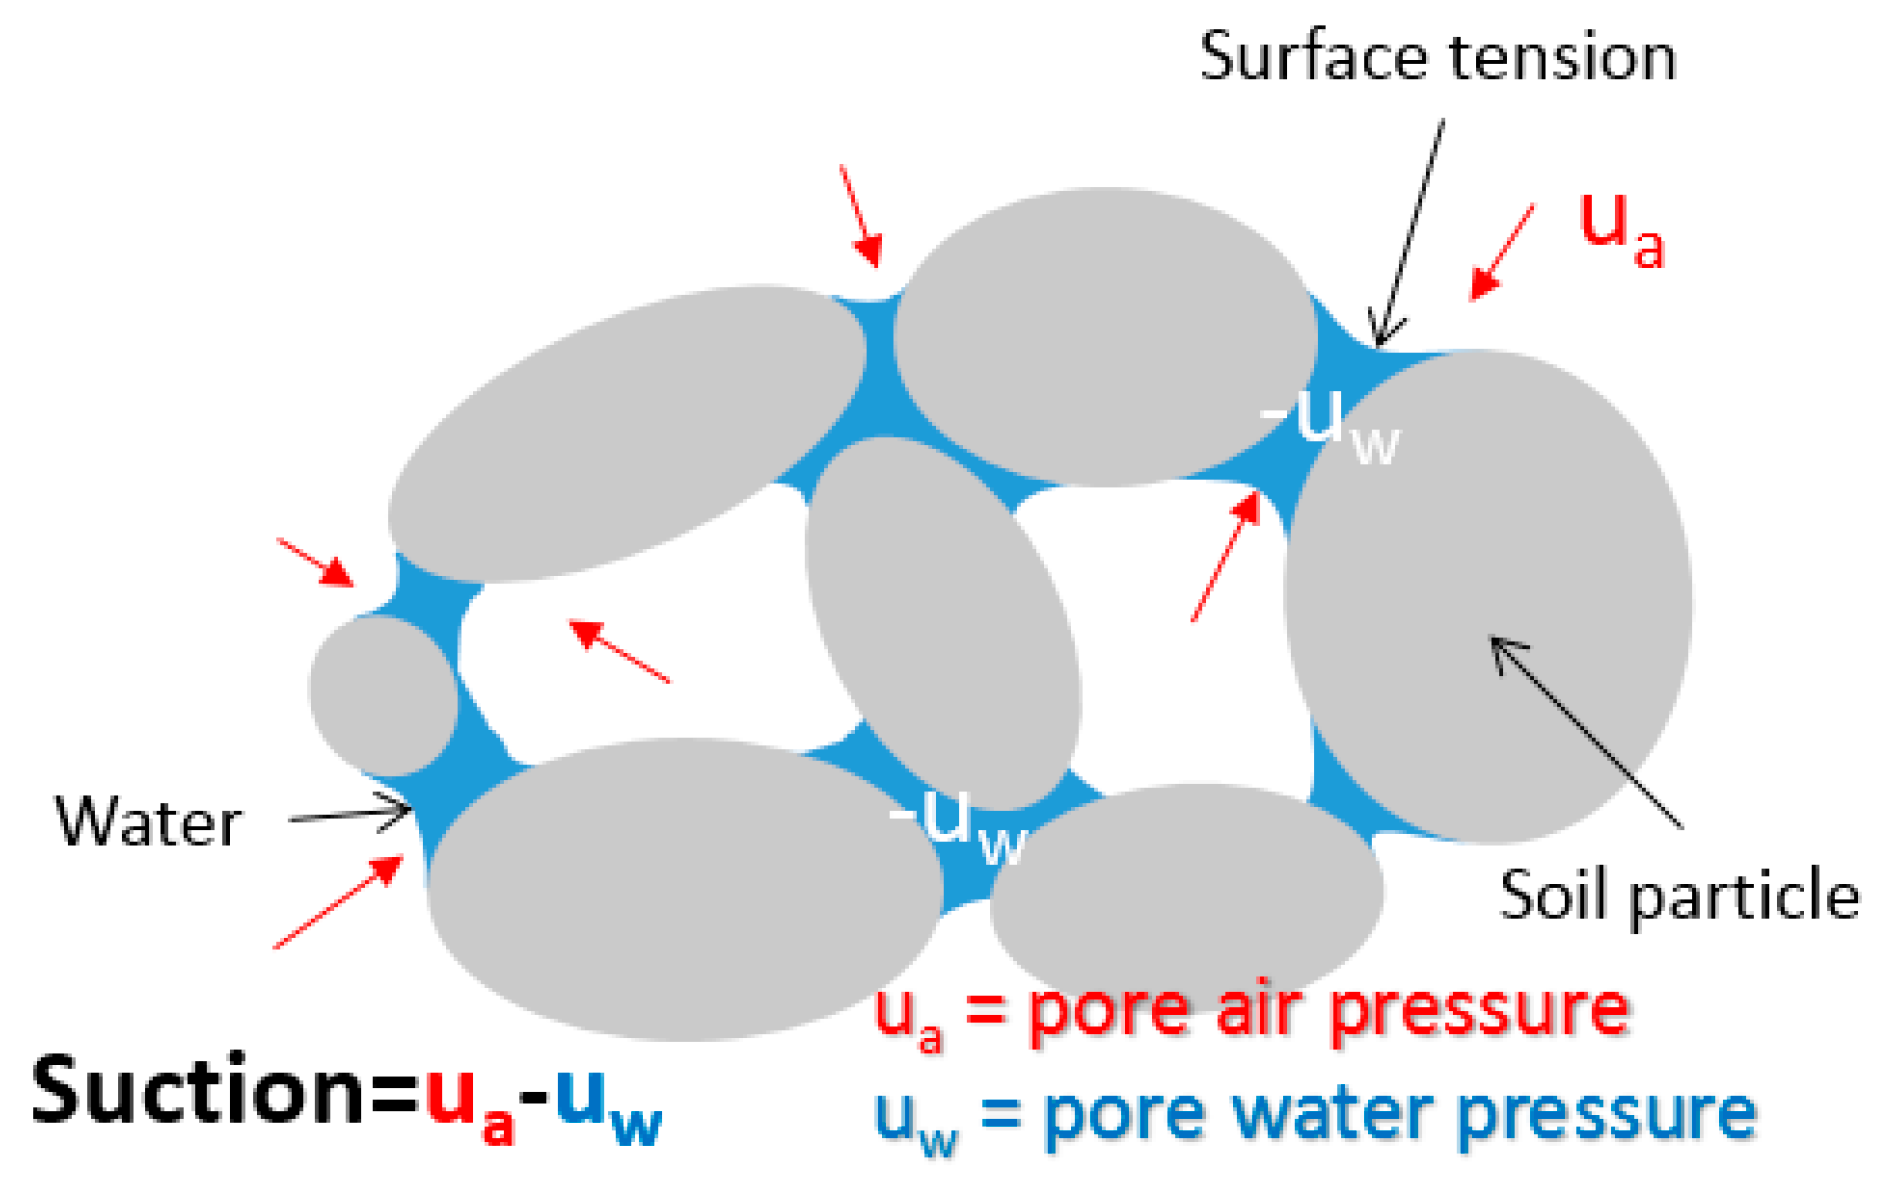
The presence of water creates surface tension in the unsaturated soil, and it cements the soil particles. The cement is defined as the matrix suction, and indicates that the water has a tension phenomenon shown by the meniscus between the two soil particles (see Figure 10).
Aitchison [24] determined that the matric suction (ua − uw) obeys the capillary model as follows:
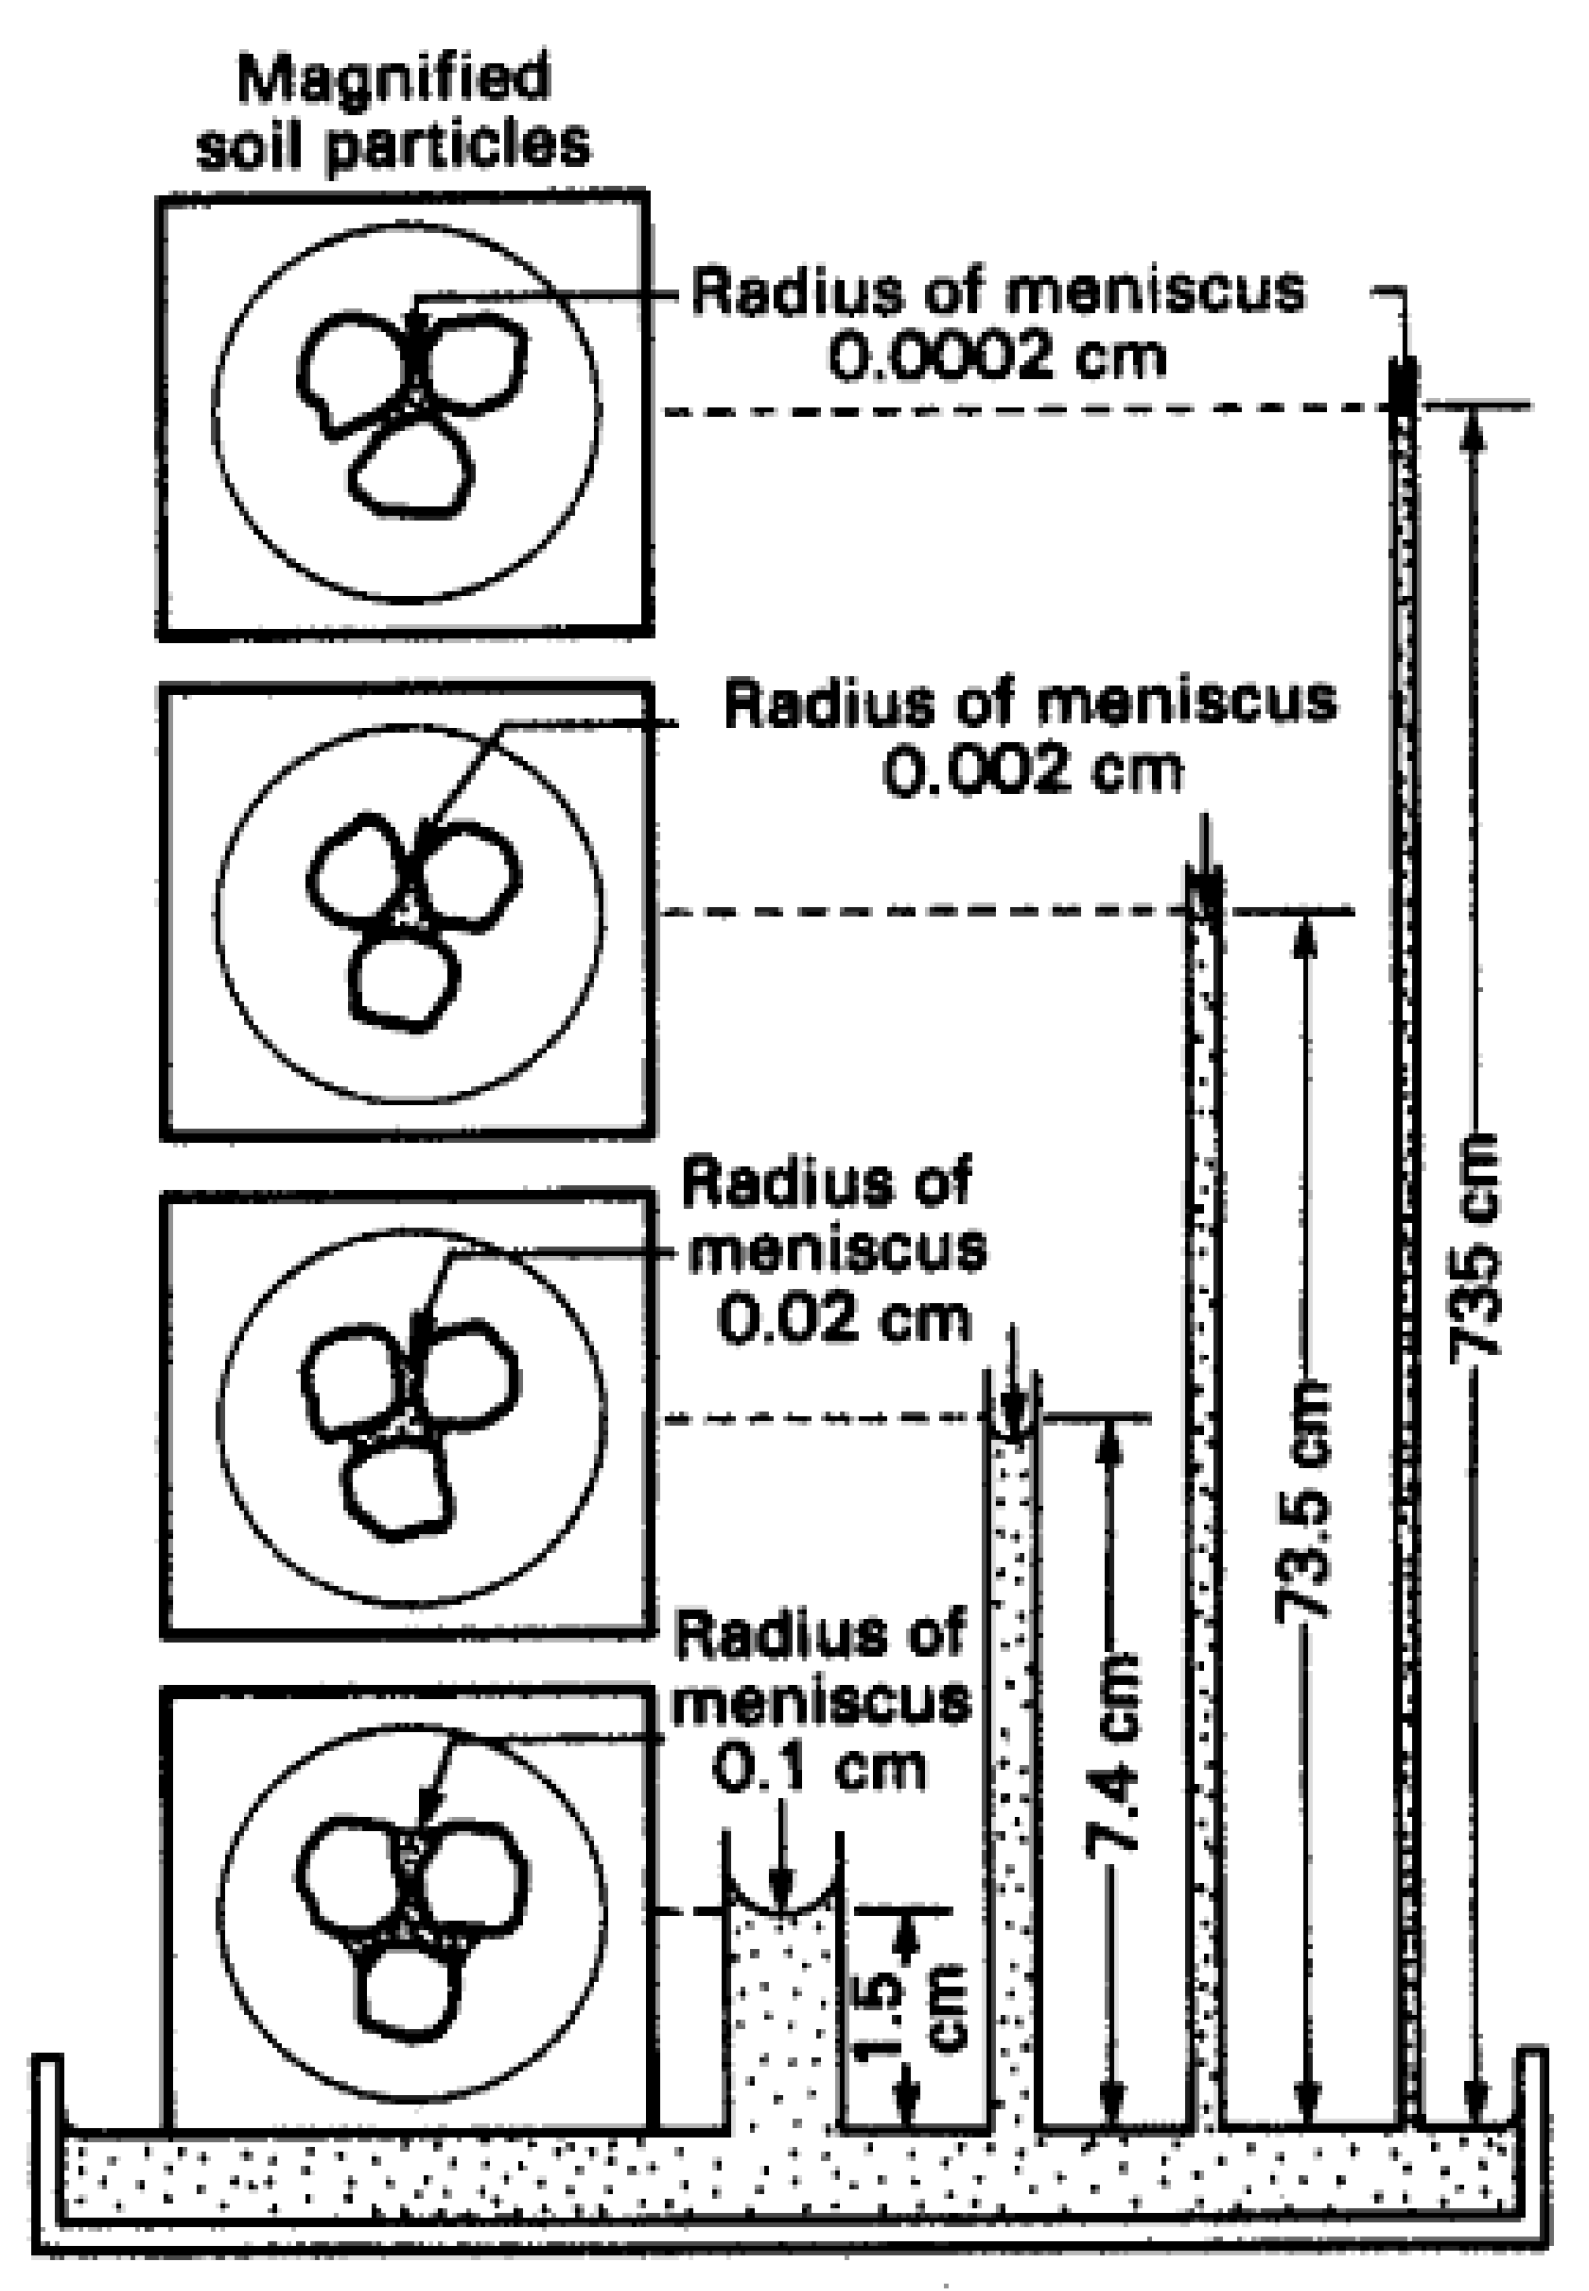
where Ts is the surface tension force of water, in units of N/m; Rs is the radius of curvature of the meniscus, in units of m; γ is the contact angle, in units of degree. From Equation (1), soil pores having small radii will have high suction because it corresponds to the rise of water level in capillary tubes with smaller radii. Figure 11 shows different air–water interfaces at different radii curvatures.
Soils are subjected to drying and wetting. In the drying stage, when air displaces water in the pore or when pore water pressure decreases, it will increase the strength of the soil as matric suction increases. When soil is in a wetting stage, as water infiltrates the soil structure and displaces pore air, pore water pressure will gradually increase. This diminishes soil matric suction and forces soil particles apart. In unsaturated soil this condition is defined as failure state.
Upon dry density increase of the soil specimen, the size and number of pores in the soil matrix is lowered. Thus, the radius of the curvature of the meniscus is lowered and the correlating suction is greater. As a result, the matric suction (AEV) required for air to enter into the soil matrix increases. Soils with small pore size drain slowly. Therefore, the water content in the soil with small pores is greater than that in soil with large pores at the matric suction that exceeds the air-entry value. For the same volumetric water content, the soil with higher dry density has a greater matric suction value. This is because the increase in the dry density of a soil sample results in decreased soil permeability leading to a slower de-saturation process and also to an increase in the AEV and the residual suction. The reduction of hysteresis with increasing dry density may result from the reduced pore-volume and greater capillary potential caused by the higher dry density of the soil sample.
To further document the mechanism of density effect, images with resolution of 3876 × 2584 were made of samples with different dry densities prior to SWRC tests. The area of the pores between particles is the crucial issue. The process is as follows: (1) convert the image to a grayscale image; (2) determine the differentiation between particles and pores; (3) establish the area of the pore (see Table 2). The important part of this process is to determine the exact threshold binarization value (eigenvalue) to distinguish particles and pores, and to evaluate the pore area. Using the intermediate color of the image, the threshold is applied to the concentration between the filter particle and the pore. The threshold can significantly influence the particle shape. The image processing program, Image J, was utilized for analysis of the images. This program can capture a binary image, transform a color image into a grayscale image, and compute the area of pores between particles based on Otsu algorithm. From the binary images, we observed that an increase in dry density caused a larger black portion area and a smaller white portion area.
The threshold values were determined artificially. The dark part in the image illustrates the particles while the light portion illustrates the pores. The area of the pores was computed by the program and was subtracted by the area of the cutting ring. Usually the pores in soils are sorted into micropores (d < 1 μm), minipores (d = 1–4 μm), mesopores (d = 4–16 μm) and macropores (d > 16 μm) [1]. The area ratio is introduced to relate dry density. The area ratio for each type of pores can be expressed as:
where Pi is the area ratio for each type of pore, dimensionless; Ai is the area of each sort of pores, in μm2, which is automatically provided by the image processing program. Figure 12 illustrates the relationship between the area ratio of the different types of pores in the image and dry density of the soil. As the dry density increases, the area of macropores occupying the largest portion decreases, while that of mesopores and micropores increases. Areas of minipores, always accounting for the least portion, are nearly constant. This outcome is in line with the SEM data of Zhao and Wang [26]. The increasing number of mesopores and micropores in higher dry density soil results in better water retention.
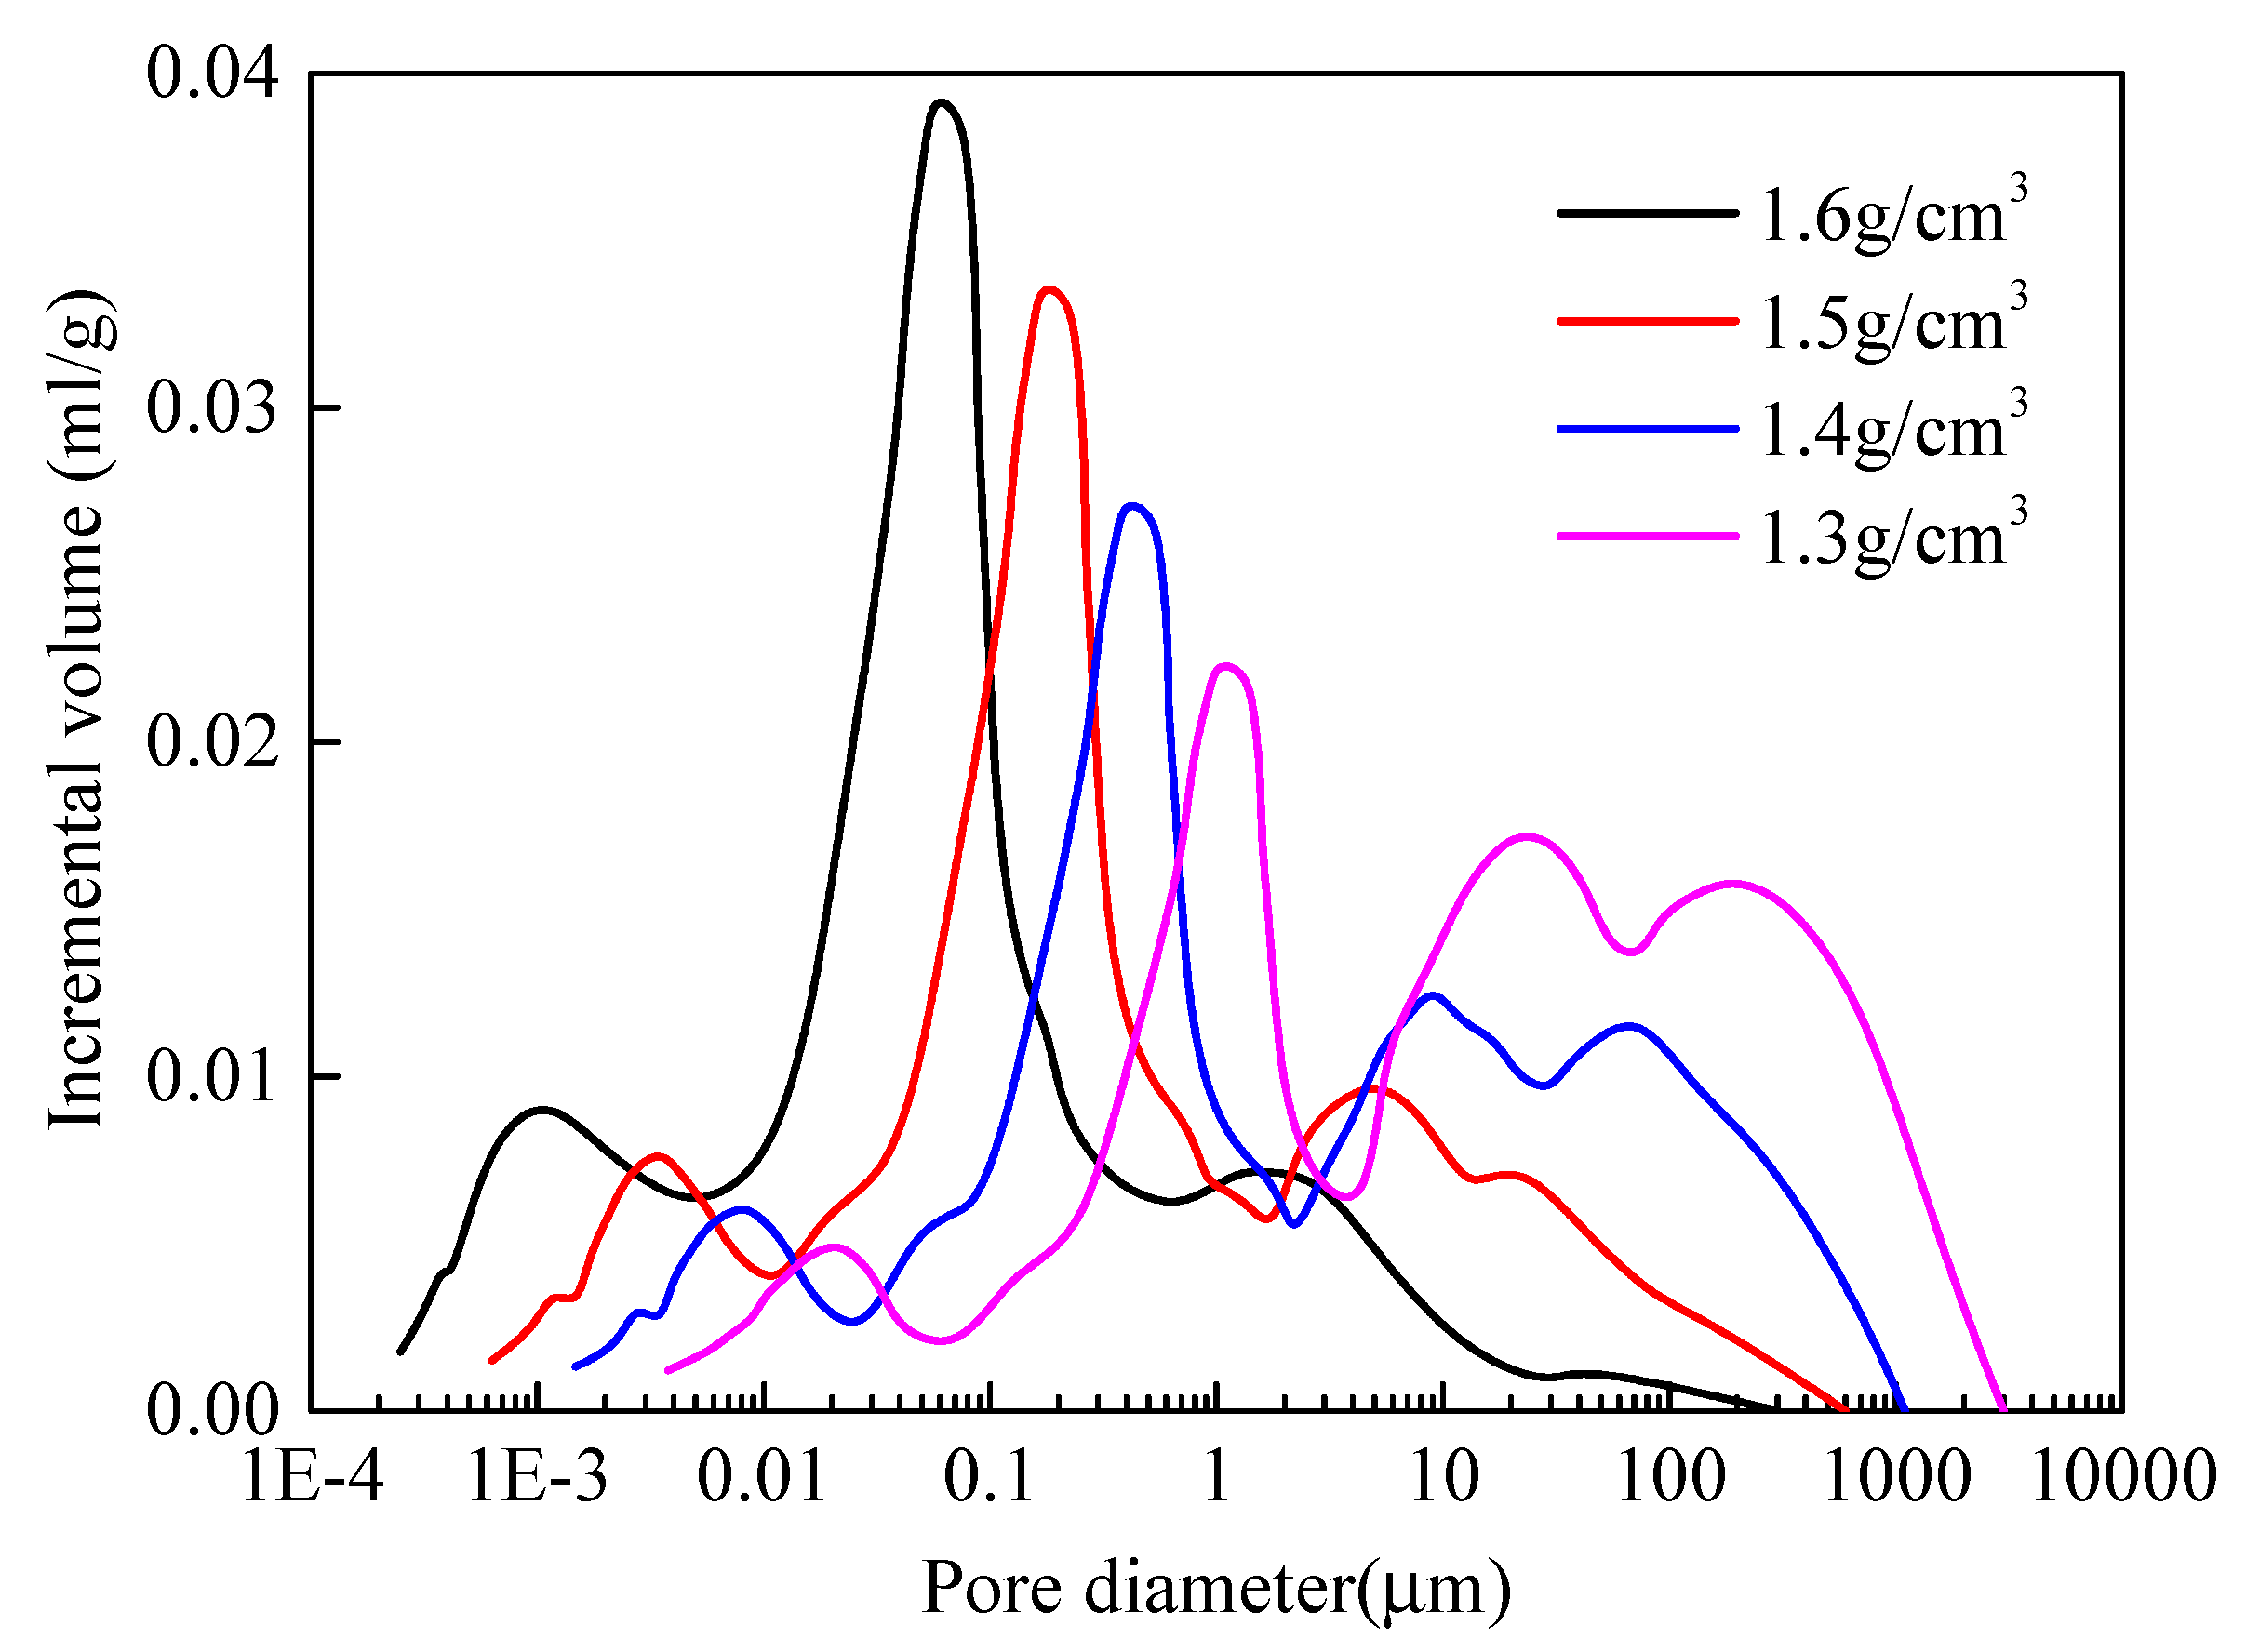
The primary variations of SWRCs verified by the mercury porosimetry test are induced by the pore size distribution of the soil. Figure 13 demonstrates the pore size distribution of numerous dry density soils after SWRC examination. When contrasting the outcomes of soil materials with various dry densities, the primary discovery is that the pore size distribution alters with the dry density in the soil. The ratio of bigger pores to smaller pores lowers. Compared with the relatively loose soil, the total pore volume of the soil with high dry density is lower. These results indicate that there is a correlation between pore volume caused by dry density and SWRCs.
4.2. Water–Air–Soil Particle System
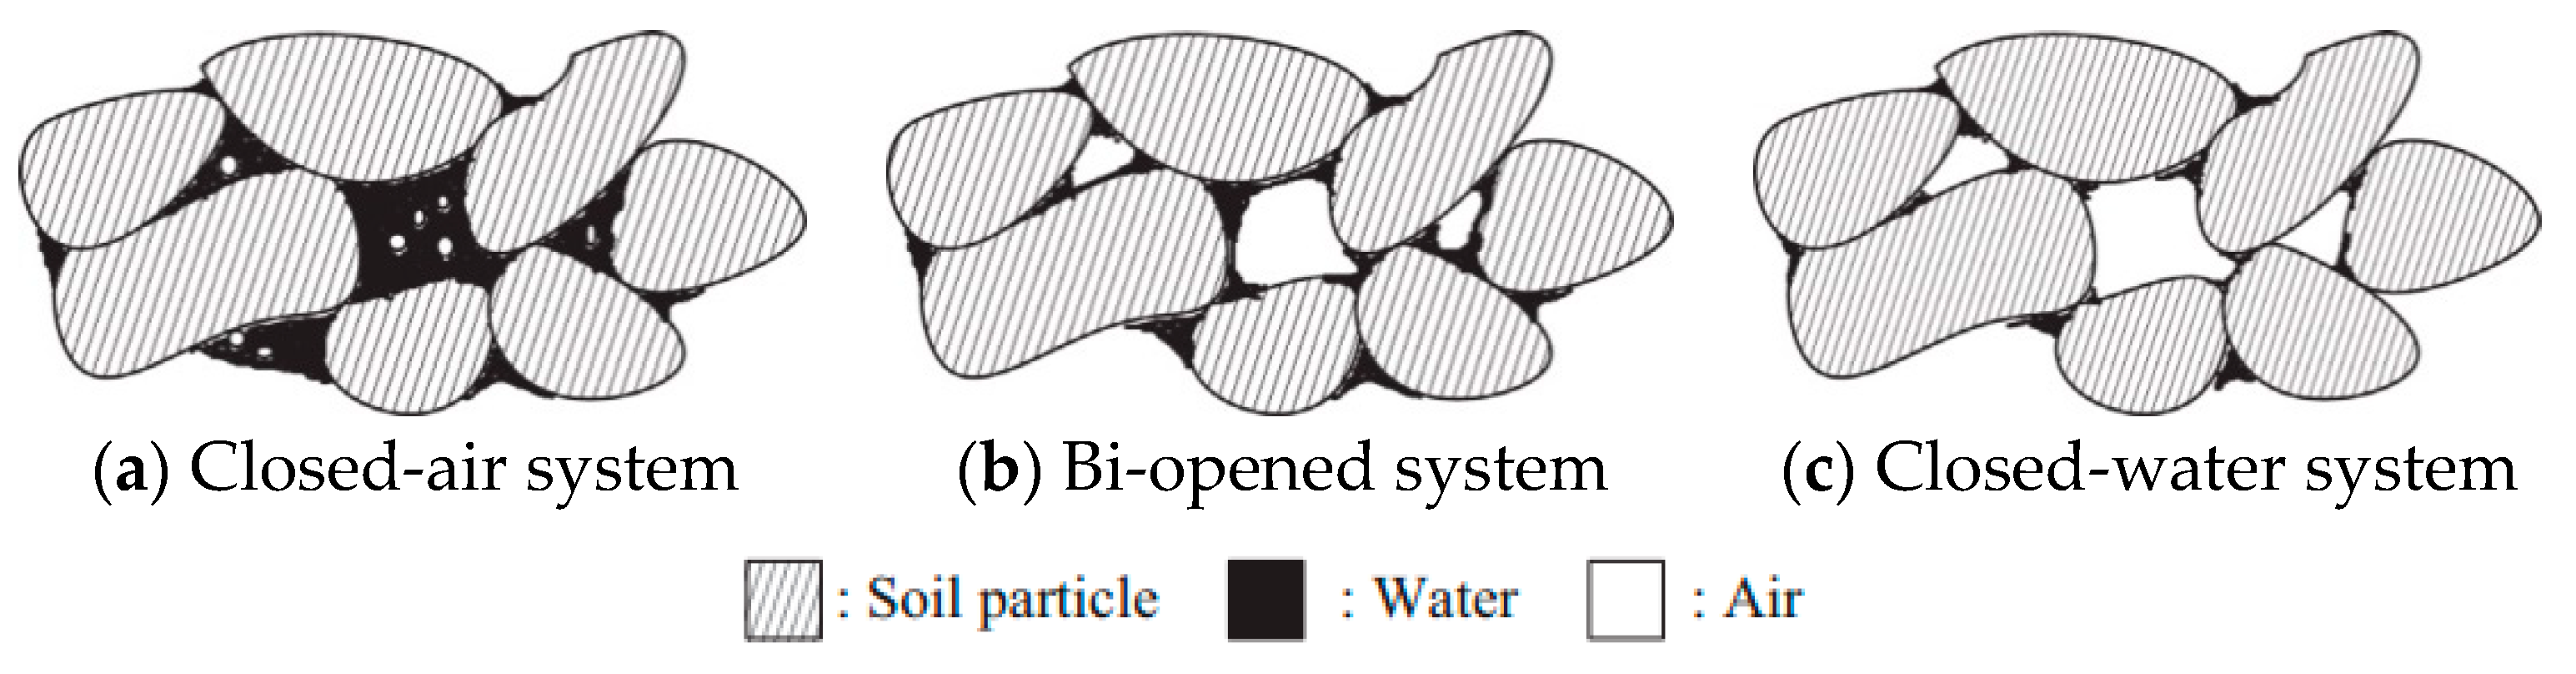
The water–air–soil particle system in a soil sample changes with the degree of saturation throughout a SWRC. Many studies have been conducted on the water–air–soil particle relationships of unsaturated soils [27,28,29]. Yu and Chen [28] described three basic water–air–soil particle systems in unsaturated soils: closed-air, bi-opened, and closed-water (Figure 14). Three partially saturated conditions were described by Kohgo et al. [29], as insular air saturation, pendular saturation, and fuzzy saturation. In the closed-air system (Figure 14a), which corresponds to a high degree of saturation, pore air is closely contained by pore water and exists in the form of an air bubble. The bi-opened system (Figure 14b) is the transition between a closed-air system and a closed-water system. In a closed-water system (Figure 14c), the pore water is discontinuous and separated by pore air and soils. These three systems in unsaturated soil can be distinguished by the AEV and residual matric suction value in the SWRC [30]. Kohgo et al. [31] summarized three influences of matric suction on the mechanical properties of unsaturated soils: (1) In the insular air saturation (closed-air) system, pore air exits in the form of air bubbles surrounded by water. An increase in matric suction therefore increases effective stresses; (2) In the pendular saturation (closed-water) system, matric suction can create capillary forces. This means an increase in matric suction enhances yield stresses and influences resistance to plastic deformations; (3) Both of the suction effects mentioned in (1) and (2) should be considered in the fuzzy saturation (bi-opened) system.
Oh and Vanapalli [32] divided typical SWRC into three zones: (i) saturation zone, (ii) transition zone, and (iii) residual zone. In the saturation zone, all the voids are completely filled with water, thus the matric suction is extremely low. In the transition zone, inter-particle voids are filled partially with water and partially with air, and changes in soil moisture are sharply reflected by variation of matric suction. In the residual zone, most of the voids are filled with air; water is only coating soil particles in the form of adsorbed water film.
4.3. Hysteresis
A SWRC depends on the pore-size distribution of the soil. This, in turn, has relations to the porosity and grain-size distribution. Many reports have shown the significance of hysteresis effects when analyzing problems involving solute transport, water transfer, multiphase flow, and/or microbial activities [33,34,35,36]. Neglecting hysteresis effects in calculations can result in significant discrepancies between measured and predicted results [37,38,39].
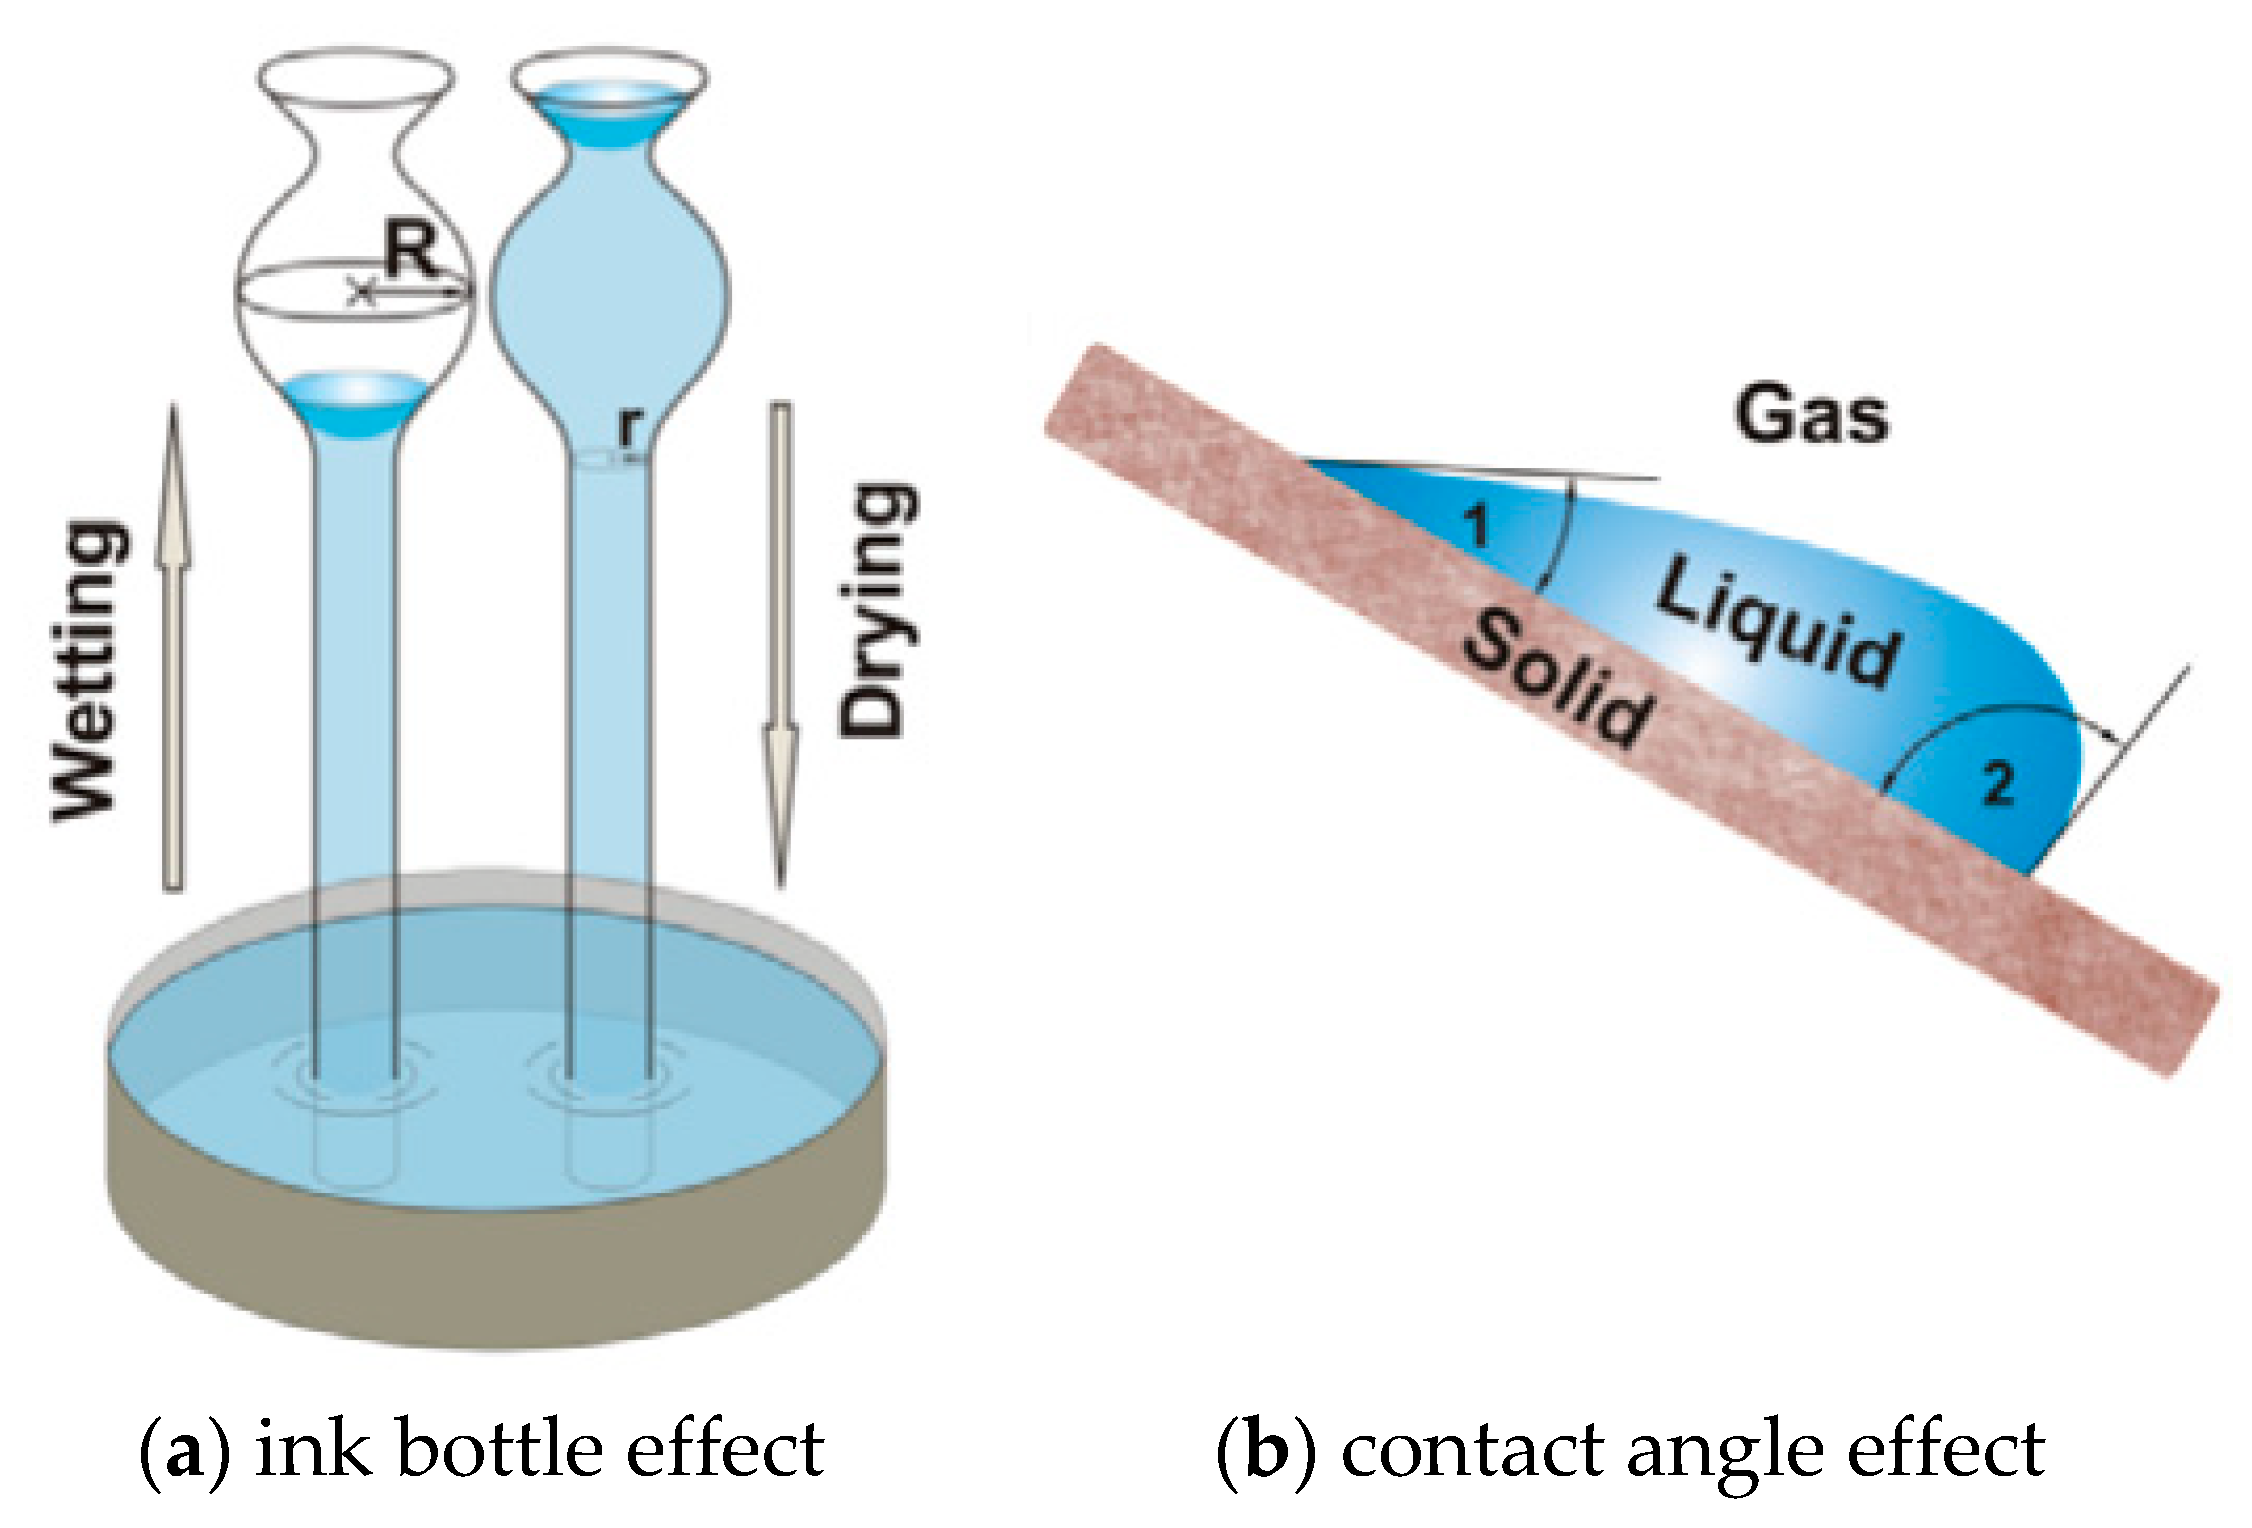
There may be several reasons for the hysteresis effect. These include: (1) the ink bottle effect caused by the inhomogeneity of the different shapes and sizes of the interconnected pores. Drying progress is controlled by the smaller pore radius, r, but wetting relies on the larger pore radius R (see Figure 15a); (2) various liquid–solid contact angles for advancing (wetting) and receding (drying) water meniscus (Figure 15b); (3) air trapped in the newly wet soil (e.g., pore doublet [40]); and (4) the shrinkage and expansion of soil under wetting and drying causes various alterations in the soil structure. By rearranging the aggregates and granules, volume change alters the pore size distribution.
In the wetting process, the ink-bottle effect leads to a delay that occurs at the residual state. Considering that the median curve part is the most significant part of SWRC, and because the ink-bottle effect occurs mostly at high matric suction, this factor is often considered negligible. Swelling and shrinking effects should be worth emphasizing for clayey soils, but can be neglected for typical granular soils with low plasticity. The air entrapped effect in the wetting process can also be neglected [42]. The effect of the contact angle is the most significant factor of hysteresis for many types of soils, particularly for soils with a relatively coarse texture. This assumption is in keeping with the discoveries of Wang et al. [43], Likos and Lu [44], Moseley and Dhir [45], and Ishakoglu and Baytas [46].
Some of the hysteresis phenomenon may be due to measurement artifacts. For example, it may be due to differences between tension-induced and pressure-induced desaturation [47]. A potentially important aspect of desorption methods under tension is liquid displacement (drainage) even in the absence of a continuous gaseous phase due to cavitation initiated by entrapped gas bubbles or the vapor pressure of the liquid [48]. Impurities and surface heterogeneity in soil and rock water are conducive to lowering the cavitation tension threshold.
4.4. Interpretation for Rainfall Induced Slope Failures
Most slope failures are caused by rainfall infiltration [49,50,51,52]. Before the rain, the soil near the slope is unsaturated. The matrix suction significantly contributes to the shear strength of the soil, thereby contributing to the stability of the slope. However, rainwater permeates the soil during the rainfall process, thus reducing the matrix suction. In these conditions, the shear strength of the soil may decrease, and the substrate suction may decrease. Therefore, the slope may lose its initial balance.
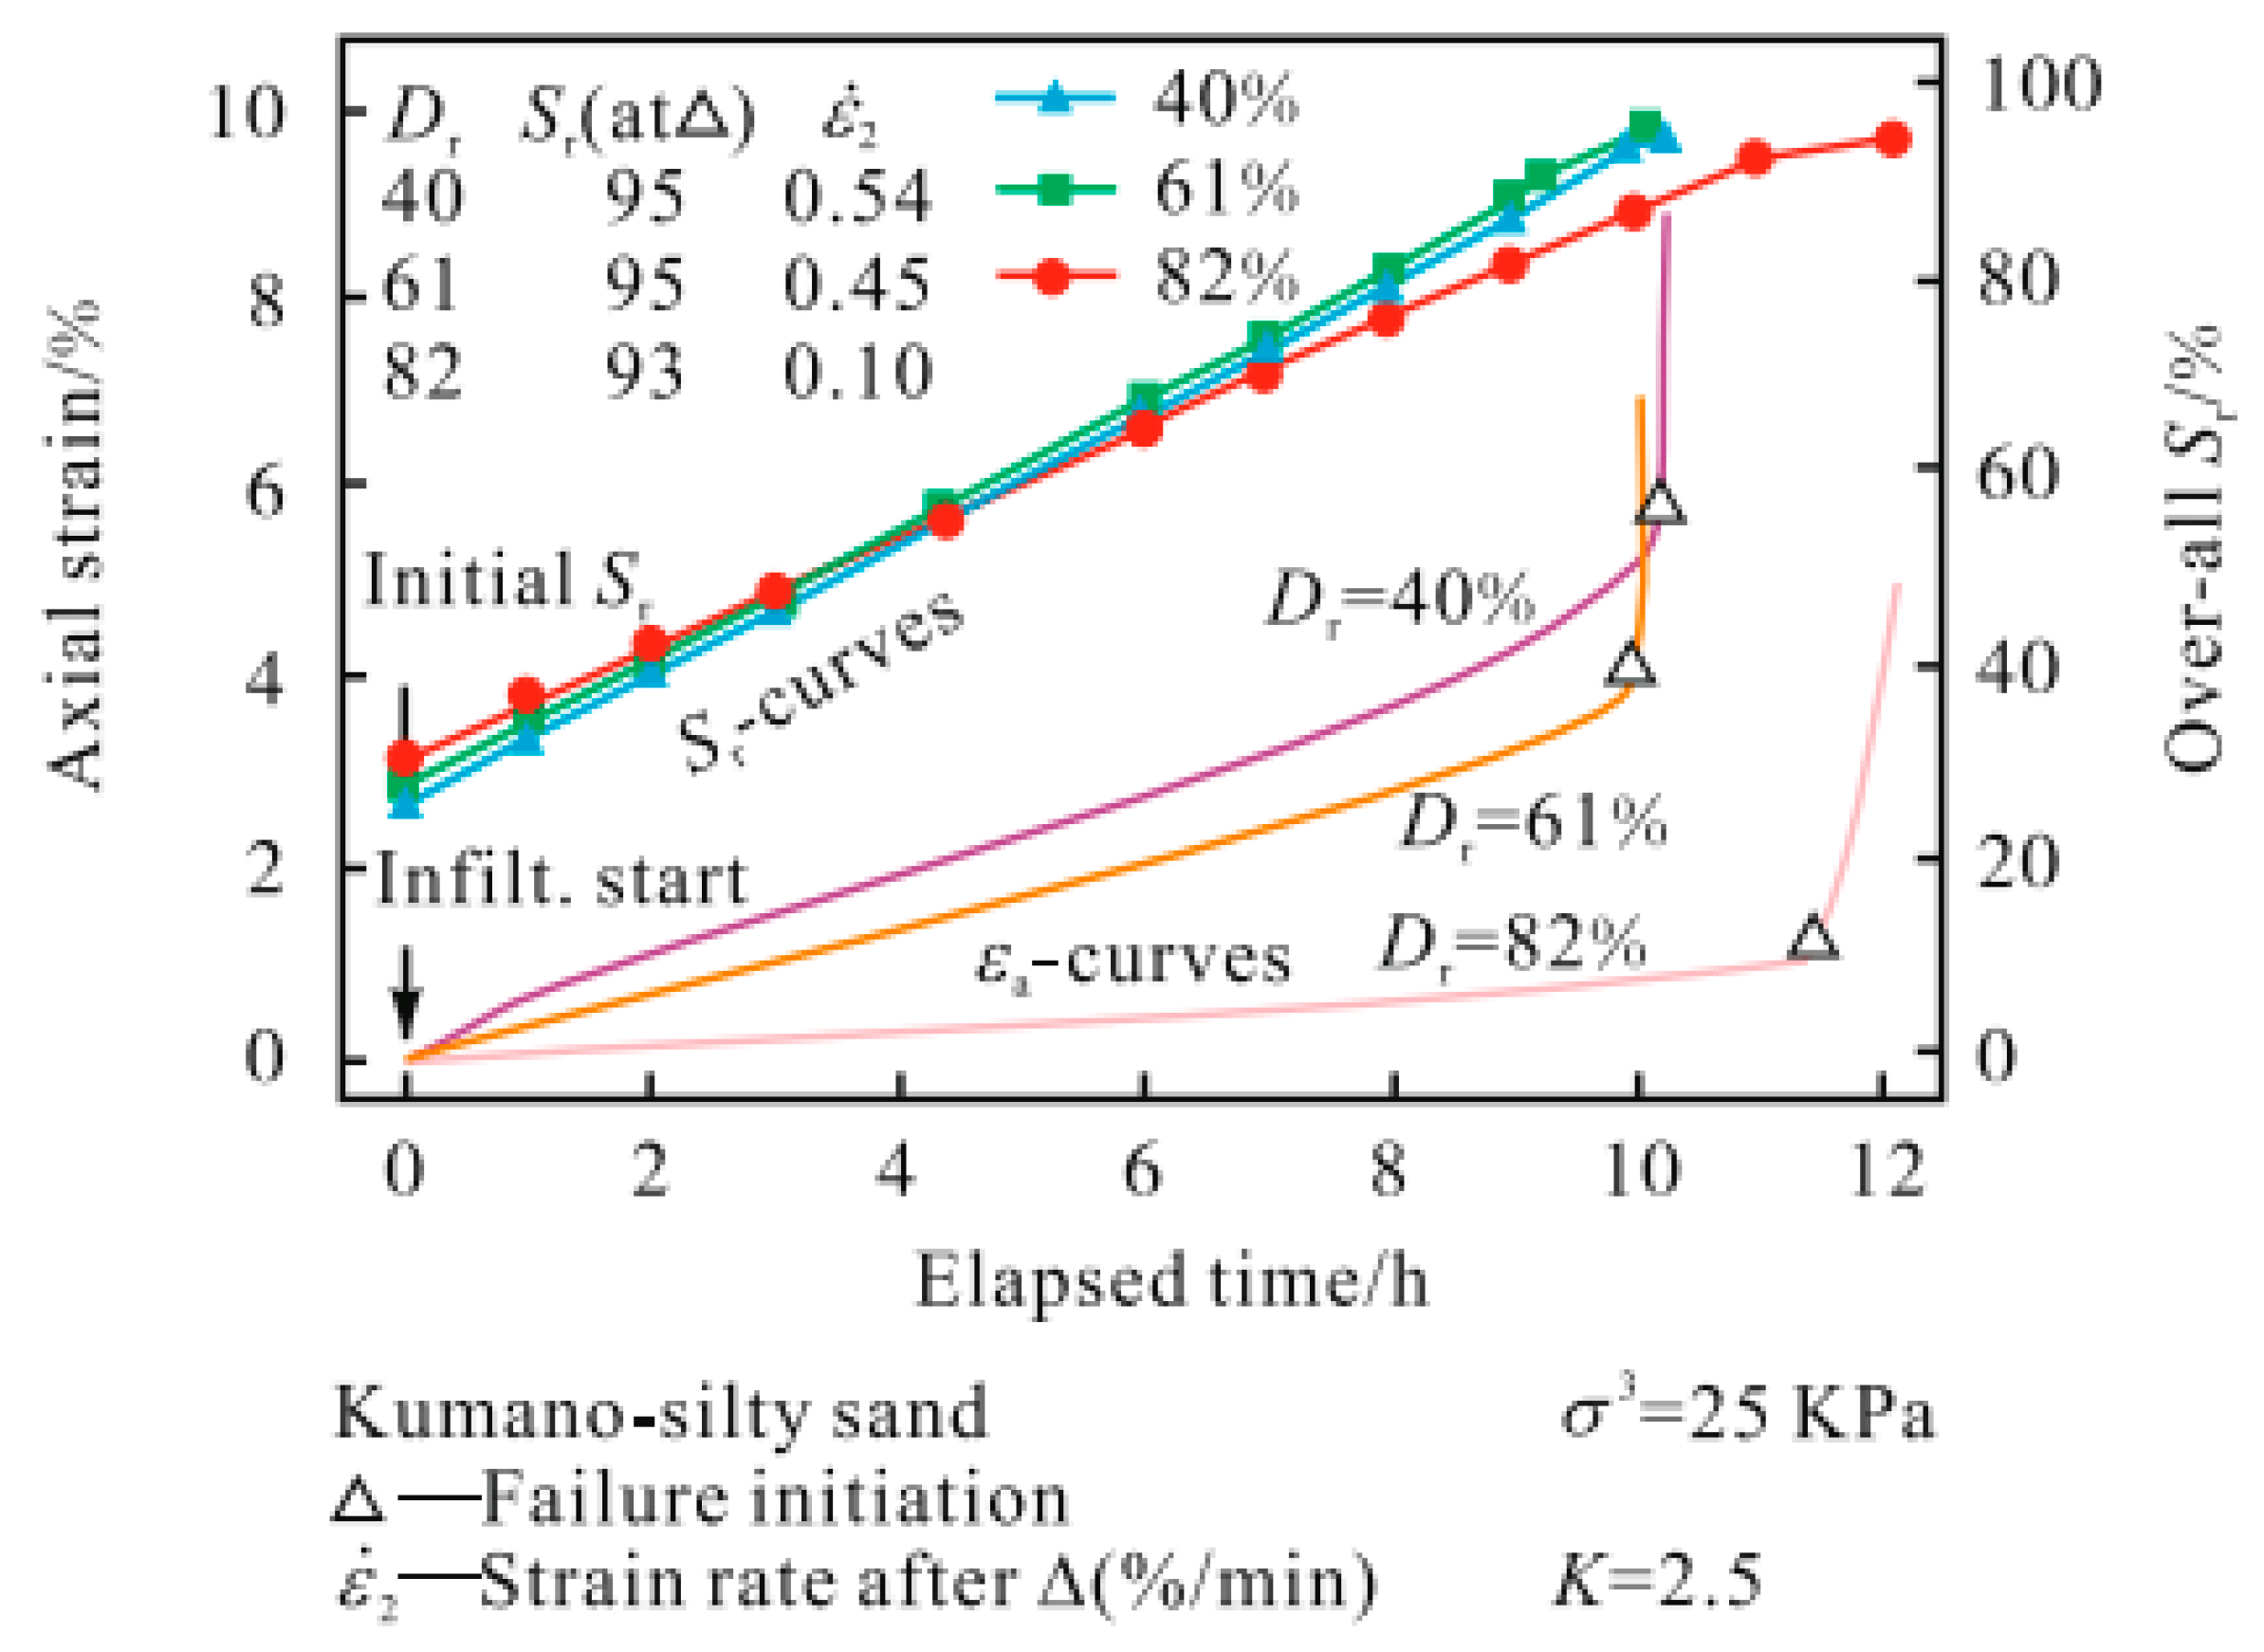
To examine the impacts of the preliminary relative density (Dr), Orense and Farooq [53,54] employed three materials (silt, gravel, and sand) in the advanced triaxial drainage device. Constant shear stress is applied to the sample, which indicates the slope condition and the water is injected to represent the precipitation. The pore water pressure is measured using only a small sensor that responds to positive pressure. Figure 16 shows how the sand responds to various relative densities. With the development of pore water pressure, the specimen did not succeed. After the failure, the loose sample has a faster strain rate, while the dense sample has a low strain rate. The low initial matrix suction of the loose sample can dissipate rapidly by water injection. As a result, loose samples tend to quickly lower the intensity and start to break.
5. Conclusions
- (1)
- The soil specimens having a dry density revealed decreased preliminary volumetric water content. A high density typically altered the volumetric water content at a protracted rate.
- (2)
- Higher density soil had a greater air-entry value and residual matric suction, with a decreased SWRC slope.
- (3)
- The change of dry density was mainly responsible for large pores. The number of large pores decreased as a consequence of dry density increment. As the dry density increased, the area of macropores occupying the largest portion decreased, while that of mesopores and micropores increases. Areas of minipores always accounted for the least portion and were nearly constant. The proportion of large diameter pores decreased compared with pores that had small diameters in the tested soil. The calculated total pore volume was lower for soil specimens possessing a higher dry density in comparison to the relatively loose soils.
- (4)
- There was an observable hysteresis between the drying and wetting curves for all of the tested soil samples. Hysteresis decreased while the soil’s dry density increased.
Funding
This research was funded by the China Postdoctoral Science Foundation (No. 2018T110103).
Conflicts of Interest
The author declares no conflicts of interest.
References
- Fredlund, D.G.; Rahardjo, H. Soil Mechanics for Unsaturated Soils; John Wiley & Sons: Hoboken, NJ, USA, 1993. [Google Scholar]
- Vanapalli, S.K.; Fredlund, D.G.; Pufahl, D.E.; Clifton, A.W. Model for the prediction of shear strength with respect to soil suction. Can. Geotech. J. 1996, 33, 379–392. [Google Scholar] [CrossRef]
- Mualem, Y. A new model for predicting the hydraulic conductivity of unsaturated porous media. Water Resour. Res. 1976, 12, 513–522. [Google Scholar] [CrossRef]
- Khalili, N.; Khabbaz, M.H. A unique relationship of chi for the determination of the shear strength of unsaturated soils. Geotechnique 1998, 48, 681–687. [Google Scholar] [CrossRef]
- Fredlund, D.G.; Xing, A.; Fredlund, M.D.; Barbour, S.L. The relationship of the unsaturated soil shear to the soil-water characteristic curve. Can. Geotech. J. 1996, 33, 440–448. [Google Scholar] [CrossRef]
- Ajdari, M.; Habibagahi, G.; Ghahramani, A. Predicting effective stress parameter of unsaturated soils using neural networks. Comput. Geotech. 2012, 40, 89–96. [Google Scholar] [CrossRef]
- Tavakoli Dastjerdi, M.H.; Habibagahi, G.; Nikooee, E. Effect of confining stress on soil water retention curve and its impact on the shear strength of unsaturated soils. Vadose Zone J. 2014, 13. [Google Scholar] [CrossRef]
- Ng, C.W.; Pang, Y.W. Influence of stress state on soil-water characteristics and slope stability. J. Geotech. Geoenviron. Eng. 2000, 126, 157–166. [Google Scholar] [CrossRef]
- Wilkinson, G.E.; Klute, A. The temperature effect on the equilibrium energy status of water held by porous media. Soil Sci. Soc. Am. J. 1962, 26, 326–329. [Google Scholar] [CrossRef]
- Peck, A.J. Change of moisture tension with temperature and air pressure: Theoretical. Soil Sci. 1960, 89, 303–310. [Google Scholar] [CrossRef]
- Chahal, R.S. Effect to temperature and trapped air on matric suction. Soil Sci. 1965, 100, 262–266. [Google Scholar] [CrossRef]
- Yang, H.; Rahardjo, H.; Leong, E.C.; Fredlund, D.G. Factors affecting drying and wetting soil-water characteristic curves of sandy soils. Can. Geotech. J. 2004, 41, 908–920. [Google Scholar] [CrossRef]
- Zhou, W.H.; Yuen, K.V.; Tan, F. Estimation of soil–water characteristic curve and relative permeability for granular soils with different initial dry densities. Eng. Geol. 2014, 179, 1–9. [Google Scholar] [CrossRef]
- Li, B.; Chen, Y.L. Influence of dry density on soil-water retention curve of unsaturated soils and its mechanism based on mercury intrusion porosimetry. Trans. Tianjin Univ. 2016, 22, 268–272. [Google Scholar] [CrossRef]
- Rajkai, K.; Kabos, S.; Genuchten, V.; Jansson, P.E. Estimation of water-retention characteristics from the bulk density and particle-size distribution of Swedish soils. Soil Sci. 1996, 161, 832–845. [Google Scholar] [CrossRef]
- Tarantino, A. A water retention model for deformable soils. Geotechnique 2009, 59, 751–762. [Google Scholar] [CrossRef]
- Gallage, C.P.K.; Uchimura, T. Effects of dry density and grain size distribution on soil–water characteristic curves of sandy soils. Soil Found. 2010, 50, 161–172. [Google Scholar] [CrossRef]
- Sheng, D.; Zhou, A.N. Coupling hydraulic with mechanical models for unsaturated soils. Can. Geotech. J. 2011, 48, 826–840. [Google Scholar] [CrossRef]
- Ford, E.J. Soil Water Retention Determination Using the ‘Wetlab’ Facility at CSIRO, Davies Laboratory; CSIRO Land and Water: Acton, Australia, 1997. [Google Scholar]
- Brooks, R.H.; Corey, A.T. Properties of porous media affecting fluid flow. J. Irrig. Drain. Div. 1966, 92, 61–90. [Google Scholar]
- Vanapalli, S.K.; Fredlund, D.G.; Pufahl, D.E. The influence of soil structure and stress history on the soil–water characteristics of a compacted till. Géotechnique 1999, 49, 143–159. [Google Scholar] [CrossRef]
- Croney, D.; Coleman, J.D. Soil structure in relation to soil suction (pF). J. Soil Sci. 1954, 5, 75–84. [Google Scholar] [CrossRef]
- Mohnke, O. Jointly deriving NMR surface relaxivity and pore size distributions by NMR relaxation experiments on partially desaturated rocks. Water Resour. Res. 2014, 50, 5309–5321. [Google Scholar] [CrossRef] [Green Version]
- Aitchison, G.D. Relationship of Moisture and Effective Stress Functions in Unsaturated Soils. Gold. Jubil. Int. Soc. Soil Mech. Found. Eng. 1961, 20, 47–52. [Google Scholar]
- Janssen, D.J.; Dempsey, B.J. Soil-moisture properties of subgrade soils. Transp. Res. Rec. 1981, 790, 61–66. [Google Scholar]
- Zhao, T.; Wang, J. Soil-water characteristic curve for unsaturated loess soil considering density and wetting-drying cycle effects. J. Central South Univ. Sci. Technol. 2012, 43, 2445–2453. [Google Scholar]
- Wu, S.; Gray, D.; Richart, F.E. Capillary effects on dynamic modulus of sands and silts. J. Geotech. Eng. 1984, 110, 1188–1203. [Google Scholar] [CrossRef]
- Yu, P.J.; Chen, Y.I. The pore air-water configuration and their effects on the mechanical properties of partially saturated soils. J. Hydraul. Eng. 1965, 1, 16–24. [Google Scholar]
- Kohgo, Y.; Asano, I.; Hayashida, Y. An elastoplastic model for unsaturated rockfills and its simulations of laboratory tests. Soils Found. 2007, 47, 919–929. [Google Scholar] [CrossRef]
- Zhang, Y.; Ishikawa, T.; Tokoro, T.; Nishimura, T. Influences of degree of saturation and strain rate on strength characteristics of unsaturated granular subbase course material. Transp. Geotech. 2014, 1, 74–89. [Google Scholar] [CrossRef]
- Kohgo, Y.; Asano, I.; Hayashida, Y. Mechanical properties of unsaturated low quality rockfills. Soils Found. 2007, 47, 947–959. [Google Scholar] [CrossRef]
- Oh, W.; Vanapalli, S. Relationship between Poisson’s Ratio and Soil Suction for Unsaturated Soils. In Proceedings of the 5th Asia-Pacific Conference on Unsaturated Soils, Pattaya, Thailand, 14–16 November 2011. [Google Scholar]
- Kaluarachchi, J.J.; Parker, J.C. An efficient finite element method for modeling multiphase flow. Water Resour. Res. 1989, 25, 43–54. [Google Scholar] [CrossRef]
- Whitmore, A.P.; Heinen, M. The effect of hysteresis on microbial activity in computer simulation models. Soil Sci. Soc. Am. J. 1999, 63, 1101–1105. [Google Scholar] [CrossRef]
- Si, B.C.; Kachanoski, R.G. Unified Solution for Infiltration and Drainage with Hysteresis Theory and Field Test. Soil Sci. Soc. Am. J. 2000, 64, 30–36. [Google Scholar] [CrossRef]
- Zhang, Q.; Werner, A.D.; Aviyanto, R.F.; Hutson, J.L. Influence of soil moisture hysteresis on the functioning of capillary barriers. Hydrol. Process. 2009, 23, 1369–1375. [Google Scholar] [CrossRef]
- Gillham, R.W.; Klute, A.; Heermann, D.F. Hydraulic properties of a porous medium: Measurement and empirical representation. Soil Sci. Soc. Am. J. 1976, 40, 203–207. [Google Scholar] [CrossRef]
- Kool, J.B.; Parker, J.C. Development and evaluation of closed-form expressions for hysteretic soil hydraulic properties. Water Resour. Res. 1987, 23, 105–114. [Google Scholar] [CrossRef]
- Mitchell, R.J.; Mayer, A.S. The significance of hysteresis in modeling solute transport in unsaturated porous media. Soil Sci. Soc. Am. J. 1998, 62, 1506–1512. [Google Scholar] [CrossRef]
- Dullien FA, L. Porous Media: Fluid Transport and Pore Structure; Academic Press: Cambridge, MA, USA, 2012. [Google Scholar]
- Tuller, M.; Or, D. Retention of water in soil and the soil water characteristic curve. Encycl. Soils Environ. 2004, 4, 278–289. [Google Scholar]
- Maqsoud, A.; Bussière, B.; Aubertin, M.; Mbonimpa, M. Predicting hysteresis of the water retention curve from basic properties of granular soils. Geotech. Geol. Eng. 2012, 30, 1147–1159. [Google Scholar] [CrossRef]
- Wang, X.D.; Peng, X.F.; Lu, J.F.; Liu, T.; Wang, B.X. Contact angle hysteresis on rough solid surfaces. Heat Transf. Asian Res. 2004, 33, 201–210. [Google Scholar] [CrossRef]
- Likos, W.J.; Lu, N. Hysteresis of capillary cohesion in unsaturated soils. In Proceedings of the 15th ASCE Engineering Mechanics Conference, New York, NY, USA, 2–5 June 2002; Volume 150, pp. 2–5. [Google Scholar]
- Moseley, W.A.; Dhir, V.K. Capillary pressure-saturation relations in porous media including the effect of wettability. J. Hydrol. 1996, 178, 33–53. [Google Scholar] [CrossRef]
- Ishakoglu, A.; Baytas, A.F. The influence of contact angle on capillary pressure–saturation relations in a porous medium including various liquids. Int. J. Eng. Sci. 2005, 43, 744–755. [Google Scholar] [CrossRef]
- Chahal, R.S.; Yong, R.N. Validity of the soil water characteristics determined with the pressurized apparatus. Soil Sci. 1965, 99, 98–103. [Google Scholar] [CrossRef]
- Tuller, M.; Or, D. Hydraulic conductivity of variably saturated porous media: Film and corner flow in angular pore space. Water Resour. Res. 2001, 37, 1257–1276. [Google Scholar] [CrossRef] [Green Version]
- Lim, T.T.; Rahardjo, H.; Chang, M.F.; Fredlund, D.G. Effect of rainfall on matric suctions in a residual soil slope. Can. Geotech. J. 1996, 33, 618–628. [Google Scholar] [CrossRef]
- Ng, C.W.; Zhan, L.T.; Bao, C.G.; Fredlund, D.G.; Gong, B.W. Performance of an unsaturated expansive soil slope subjected to artificial rainfall infiltration. Geotechnique 2003, 53, 143–157. [Google Scholar] [CrossRef]
- Huang, M.; Lee Barbour, S.; Elshorbagy, A.; Zettl, D.J.; Si, B.C. Infiltration and drainage processes in multi-layered coarse soils. Can. J. Soil Sci. 2011, 91, 169–183. [Google Scholar] [CrossRef]
- Oh, W.T.; Vanapalli, S.K. Influence of rain infiltration on the stability of compacted soil slopes. Comput. Geotech. 2010, 37, 649–657. [Google Scholar] [CrossRef]
- Farooq, K.; Orense, R.; Towhata, I. Response of unsaturated sandy soils under constant shear stress drained condition. Soils Found. 2004, 44, 1–13. [Google Scholar] [CrossRef]
- Orense, R.; Farooq, K.; Towhata, I. Deformation behavior of sandy slopes during rainwater infiltration. Soils Found. 2004, 44, 15–30. [Google Scholar] [CrossRef]
Figure 1.
Grain size distribution curve for test soil.

Figure 2.
Soil samples with different dry densities.

Figure 3.
Influence of dry density on the SWRC for unsaturated soil.

Figure 4.
Influence of dry density of soils on the SWRC during drying.

Figure 5.
Variation of air-entry values against dry density.

Figure 6.
Variation of the slope of drying SWRC with the dry density.

Figure 7.
Variation of the residual matric suction with the dry density.

Figure 8.
Variation of the hysteresis with the dry density.

Figure 9.
T2 distribution curves for various dry densities at different matric suctions.


Figure 10.
Condition of soil structure.

Figure 11.
Capillary tubes indicating the air–water interfaces at different radii curvatures [25].
Figure 11.
Capillary tubes indicating the air–water interfaces at different radii curvatures [25].

Figure 12.
Relationship between the area ratio of different types of pores and dry density.

Figure 13.
Effect of the dry density on the pore size distribution of soils.

Figure 14.
Three basic possible saturation conditions in unsaturated soils.

Figure 15.
Potential mechanisms for hysteresis [41].
Figure 15.
Potential mechanisms for hysteresis [41].

Figure 16.
Effect of specimen relative density (Dr) during failure under water infiltration [53].
Figure 16.
Effect of specimen relative density (Dr) during failure under water infiltration [53].


Table 1.
Physico-mechanical properties of soil.
| Properties | Value |
|---|---|
| Specific gravity, Gs | 2.71 |
| Effective grain size, D10 (mm) | 0.0035 |
| Mean grain size, D50 (mm) | 0.14 |
| Coefficient of uniformity, Cu | 54.40 |
| Coefficient of gradation, Cc | 1.95 |
| Maximum void ratio, emax | 1.59 |
| Minimum void ratio, emin | 1.01 |
| Optimum water content, wopt (%) | 16.01 |
| Maximum dry density, ρdmax (g/cm3) | 1.720 |
Table 2.
Calculation steps for determining the area of pores between particles.
| Step | Dry Density/(g/cm3) | |||
|---|---|---|---|---|
| 1.30 | 1.40 | 1.50 | 1.60 | |
| Original |  |  |  |  |
| Grayscale |  |  |  |  |
| Binary |  |  |  |  |
© 2018 by the author. Licensee MDPI, Basel, Switzerland. This article is an open access article distributed under the terms and conditions of the Creative Commons Attribution (CC BY) license (http://creativecommons.org/licenses/by/4.0/).
Share and Cite
MDPI and ACS Style
Chen, Y. Soil–Water Retention Curves Derived as a Function of Soil Dry Density. GeoHazards 2020, 1, 3-19. https://0-doi-org.brum.beds.ac.uk/10.3390/geohazards1010002
AMA Style
Chen Y. Soil–Water Retention Curves Derived as a Function of Soil Dry Density. GeoHazards. 2020; 1(1):3-19. https://0-doi-org.brum.beds.ac.uk/10.3390/geohazards1010002
Chicago/Turabian StyleChen, Yulong. 2020. "Soil–Water Retention Curves Derived as a Function of Soil Dry Density" GeoHazards 1, no. 1: 3-19. https://0-doi-org.brum.beds.ac.uk/10.3390/geohazards1010002