Mapping the Recovery Process of Vegetation Growth in the Copper Basin, Tennessee Using Remote Sensing Technology


Department of Biology, Geology and Environmental Science, The University of Tennessee at Chattanooga, Dept. 2653, 615 McCallie Avenue, Chattanooga, TN 37403, USA
*
Author to whom correspondence should be addressed.
GeoHazards 2020, 1(1), 31-43; https://0-doi-org.brum.beds.ac.uk/10.3390/geohazards1010004
Submission received: 14 May 2020
/
Revised: 14 June 2020
/
Accepted: 18 June 2020
/
Published: 22 June 2020
Abstract
:The Copper Basin (CB) of southeastern Tennessee, known as the Ducktown Mining District, is a classic example of forest and soil destruction due to extensive mining and smelting operations from the mid-1800s until 1987. The smelting operation released a sulfur dioxide by-product that formed sulfuric acid precipitation which, in combination with heavy logging, led to the complete denudation of all vegetation covering 130 km2 in CB. The area has since been successfully revegetated. This study used remote sensing technology to map the different episodes of this vegetation recovery process. A time series of Landsat imagery acquired from 1977 through 2017 at 10-year intervals was used to map and analyze the changes in vegetation cover in CB. These maps were used to generate a single thematic map indicating in which 10-year period each parcel of land was revegetated. Analysis shows that the extent of non-vegetated areas continuously decreased from about 38.5 to 2.5 km2 between 1977 and 2017. The greatest increase in vegetation regrowth occurred between 1987 and 1997, which was the period when all mining and smelting activities ceased. This research could be very useful to better understand the recovery process of areas affected by mining and smelting processes.
1. Introduction
The Copper Basin (CB) of southeastern Tennessee, known as the Ducktown Mining District, is a classic example of forest and soil destruction [1]. The basin, located in the highly metamorphic Appalachian Mountains of southeastern Tennessee, contains the towns of Copperhill and Ducktown. From the mid-1800s until 1987, Copperhill and Ducktown were the locations of extensive mining operations and eventually smelting to refine mined ore [1,2,3,4]. A sulfur dioxide by-product of smelting formed sulfuric acid precipitation that, in combination with heavy logging for fuel, led to an area of more than 130 km2 being completely without vegetation by the year 1876 [5]. The area was an expanse of red dirt that lay gullied and bare because of copper and sulfur mining operations [1,6,7,8]. Additional history of the region can be found by visiting the state-owned Ducktown Basin Museum in Ducktown, Tennessee, or by accessing the museum website at https://ducktownbasinmuseum.com/.
The Tennessee Valley Authority (TVA) was formed in 1933. An important part of its mission was to repair the damage done to the valley by erosion due to flooding, poor farming methods, and careless industry. The Copper Basin was one of TVA’s most challenging sites. It was a vast stretch of scorched earth in southeast Tennessee and north Georgia that represented some of the most severe environmental damage ever caused by human enterprise [9]. Most interestingly, it used to be described as a “bona fide desert” in moist, fertile southeastern Tennessee that covered an area of more than 130 km2, bigger than many cities. It was compared to the Dakota Badlands, the Gobi, and the moon [10]. The three man-made marks on the planet that were visible from space were said to be the Great Wall of China, the pyramids of Egypt, and the Copper Basin (CB) in Tennessee [10].
The Copper Basin contains the North Potato Creek and the Davis Mill Creek watersheds, and is part of the larger, Ocoee River watershed. The North Potato Creek and Davis Mill Creek watersheds received extensive environmental damage from the historic mining and smelting operations [7]. The lack of vegetation in the watersheds, heavy erosion of acidic topsoil, and leeched metals caused the surface water to be very turbid. Tributaries from throughout the watersheds drained the sites of various mine shafts and smelters in the basin. These tributaries fed into North Potato Creek and Davis Mill Creek, and were responsible for transporting this overland surface flow, in addition to acid mine drainage that seeped from abandoned mine shafts, into the Ocoee River [5,7,11].
Attempts to revegetate CB occurred throughout the mid-to-late 1900s, but most of the area remained barren until after all mining and smelting operations ceased. The Environmental Protection Agency (EPA) designated the basin a Superfund Site in 2001 [11]. A restoration effort, led by Glenn Springs Holdings (a subsidiary of Occidental Petroleum that became the site administrator), in combination with the EPA, TVA, and the Tennessee Department of Environment and Conservation has been ongoing since this time [6,7]. This remediation effort has been extremely successful, resulting in revegetation of nearly the entire affected area, and a significant improvement to the water quality of the Ocoee River [7,11].
The Copper Basin in southeastern Tennessee became the site of increasingly extensive and successful reforestation efforts [7,8]. To determine the effectiveness of more than 50 years of reforestation efforts, Mathew and Harden [12] compared rainfall infiltration, sediment detachment, and soil organic matter of the reforested sites to those properties of unvegetated sites and forested reference sites outside the basin. They contributed an historical perspective to the growing geographical literature on environmental restoration.
Remote sensing technology has been used successfully to study vegetation recovery processes related to forest fire [13,14,15] and mining-related [16,17,18] incidents for many years. This study investigated the potential use of remote sensing technology to map the growth of vegetation involved in the restoration and recovery process of this superfund site, which was damaged by historic mining and smelting operations. A time series analysis of NASA’s Landsat imagery over a period of 40 years, acquired from 1977 through 2017 at 10-year intervals, was used to map and assess the changes in the vegetative cover of CB. The Normalized Difference Vegetation Index (NDVI) was used to detect and classify vegetation for each year, which was compiled into maps, to visualize and quantify the extent of non-vegetated areas for each year. This information was used to determine in what 10-year period vegetation grew back the fastest. It was also used to calculate the percentage of vegetation growth for each period.
2. Materials and Methods
2.1. Study Site
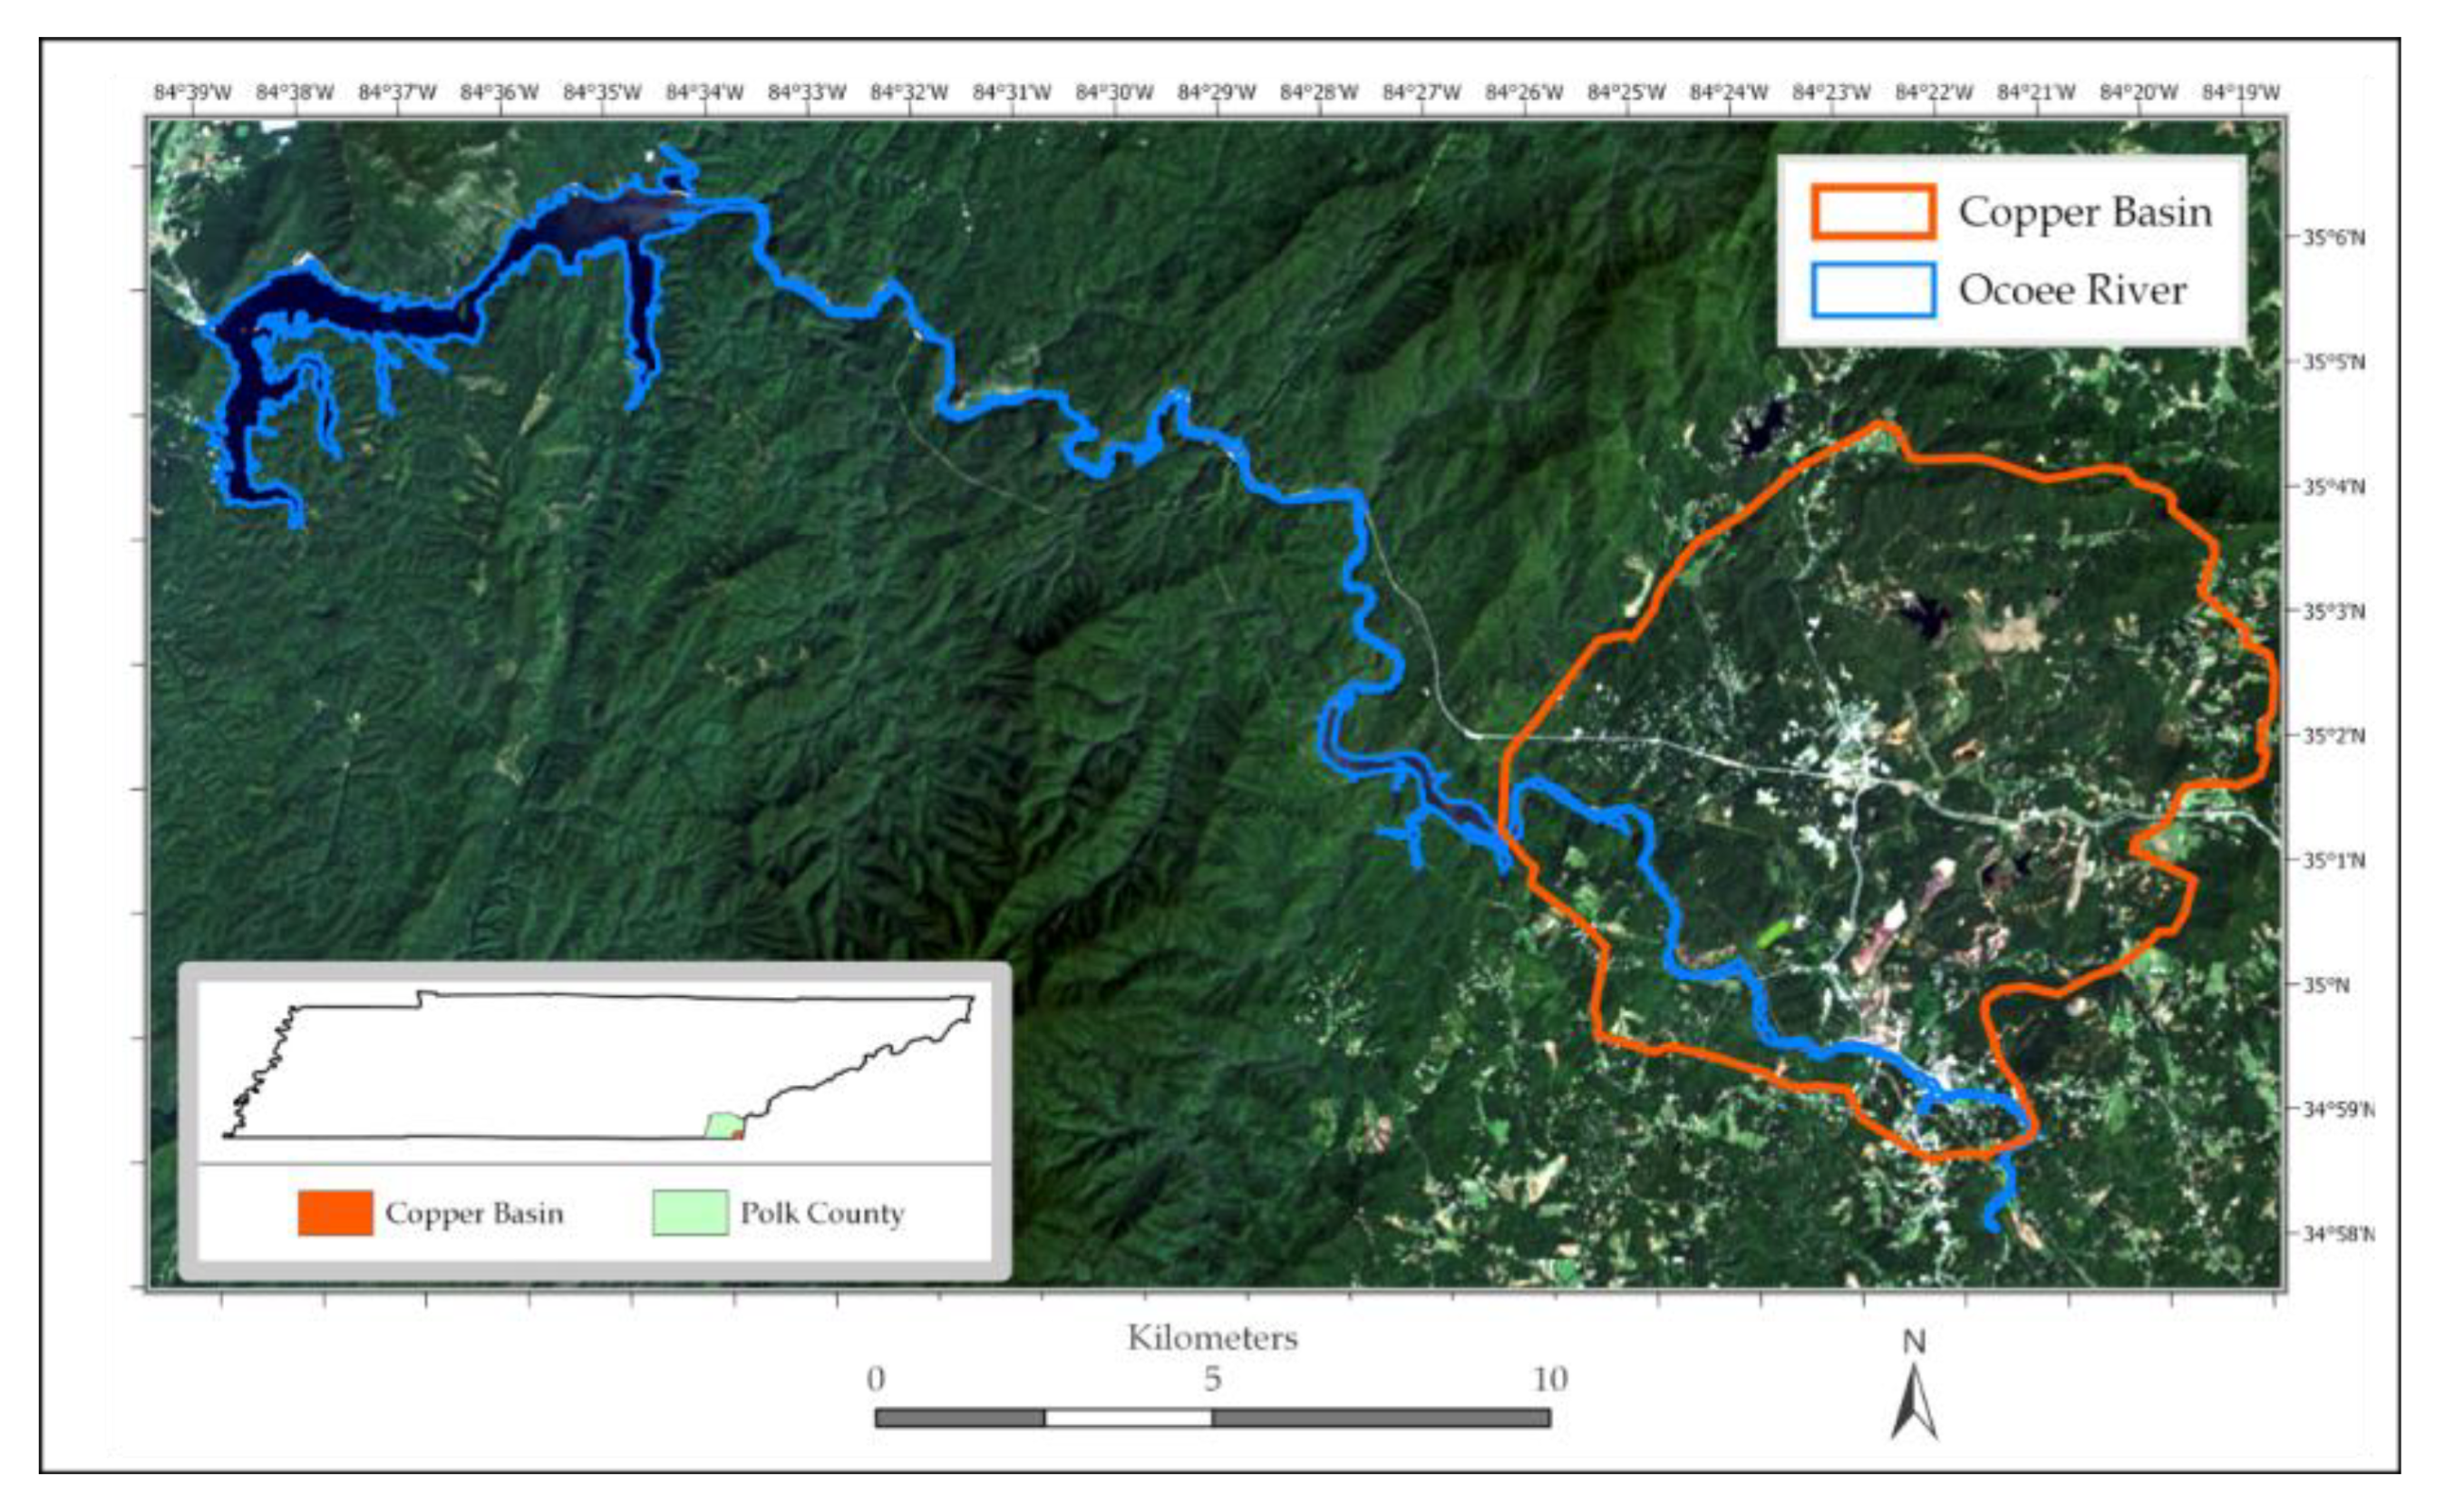
The Copper Basin, primarily located in Polk County, Tennessee (Figure 1), lies in an intermontane erosional depression within the Unaka Mountains of the Blue Ridge physiographic province. It is ringed by mountains on three sides and by the Ocoee River along its southern border. The Ocoee River enters the basin from Georgia, where it is called the Toccoa, then descends past the basin, dropping 209 m to its confluence with the Hiwassee River 56 km downstream.
The topography of CB is characterized by low rolling hills and broad ridges. Most elevations in the basin range from 480 to 540 m, but surrounding mountains rise to 1250 m. The topography is heavily influenced by geologic structure; for example, the drainage pattern follows a pattern of faults [19].
2.2. Data Collection and Processing
Landsat imagery, with a spectral range of visible-to-mid infrared (excluding thermal infrared), was used. It was selected primarily for its temporal range. Landsat provides data every 16 days, which is ideal for a time series analysis study. This also allowed a greater certainty to find datasets from clear days.
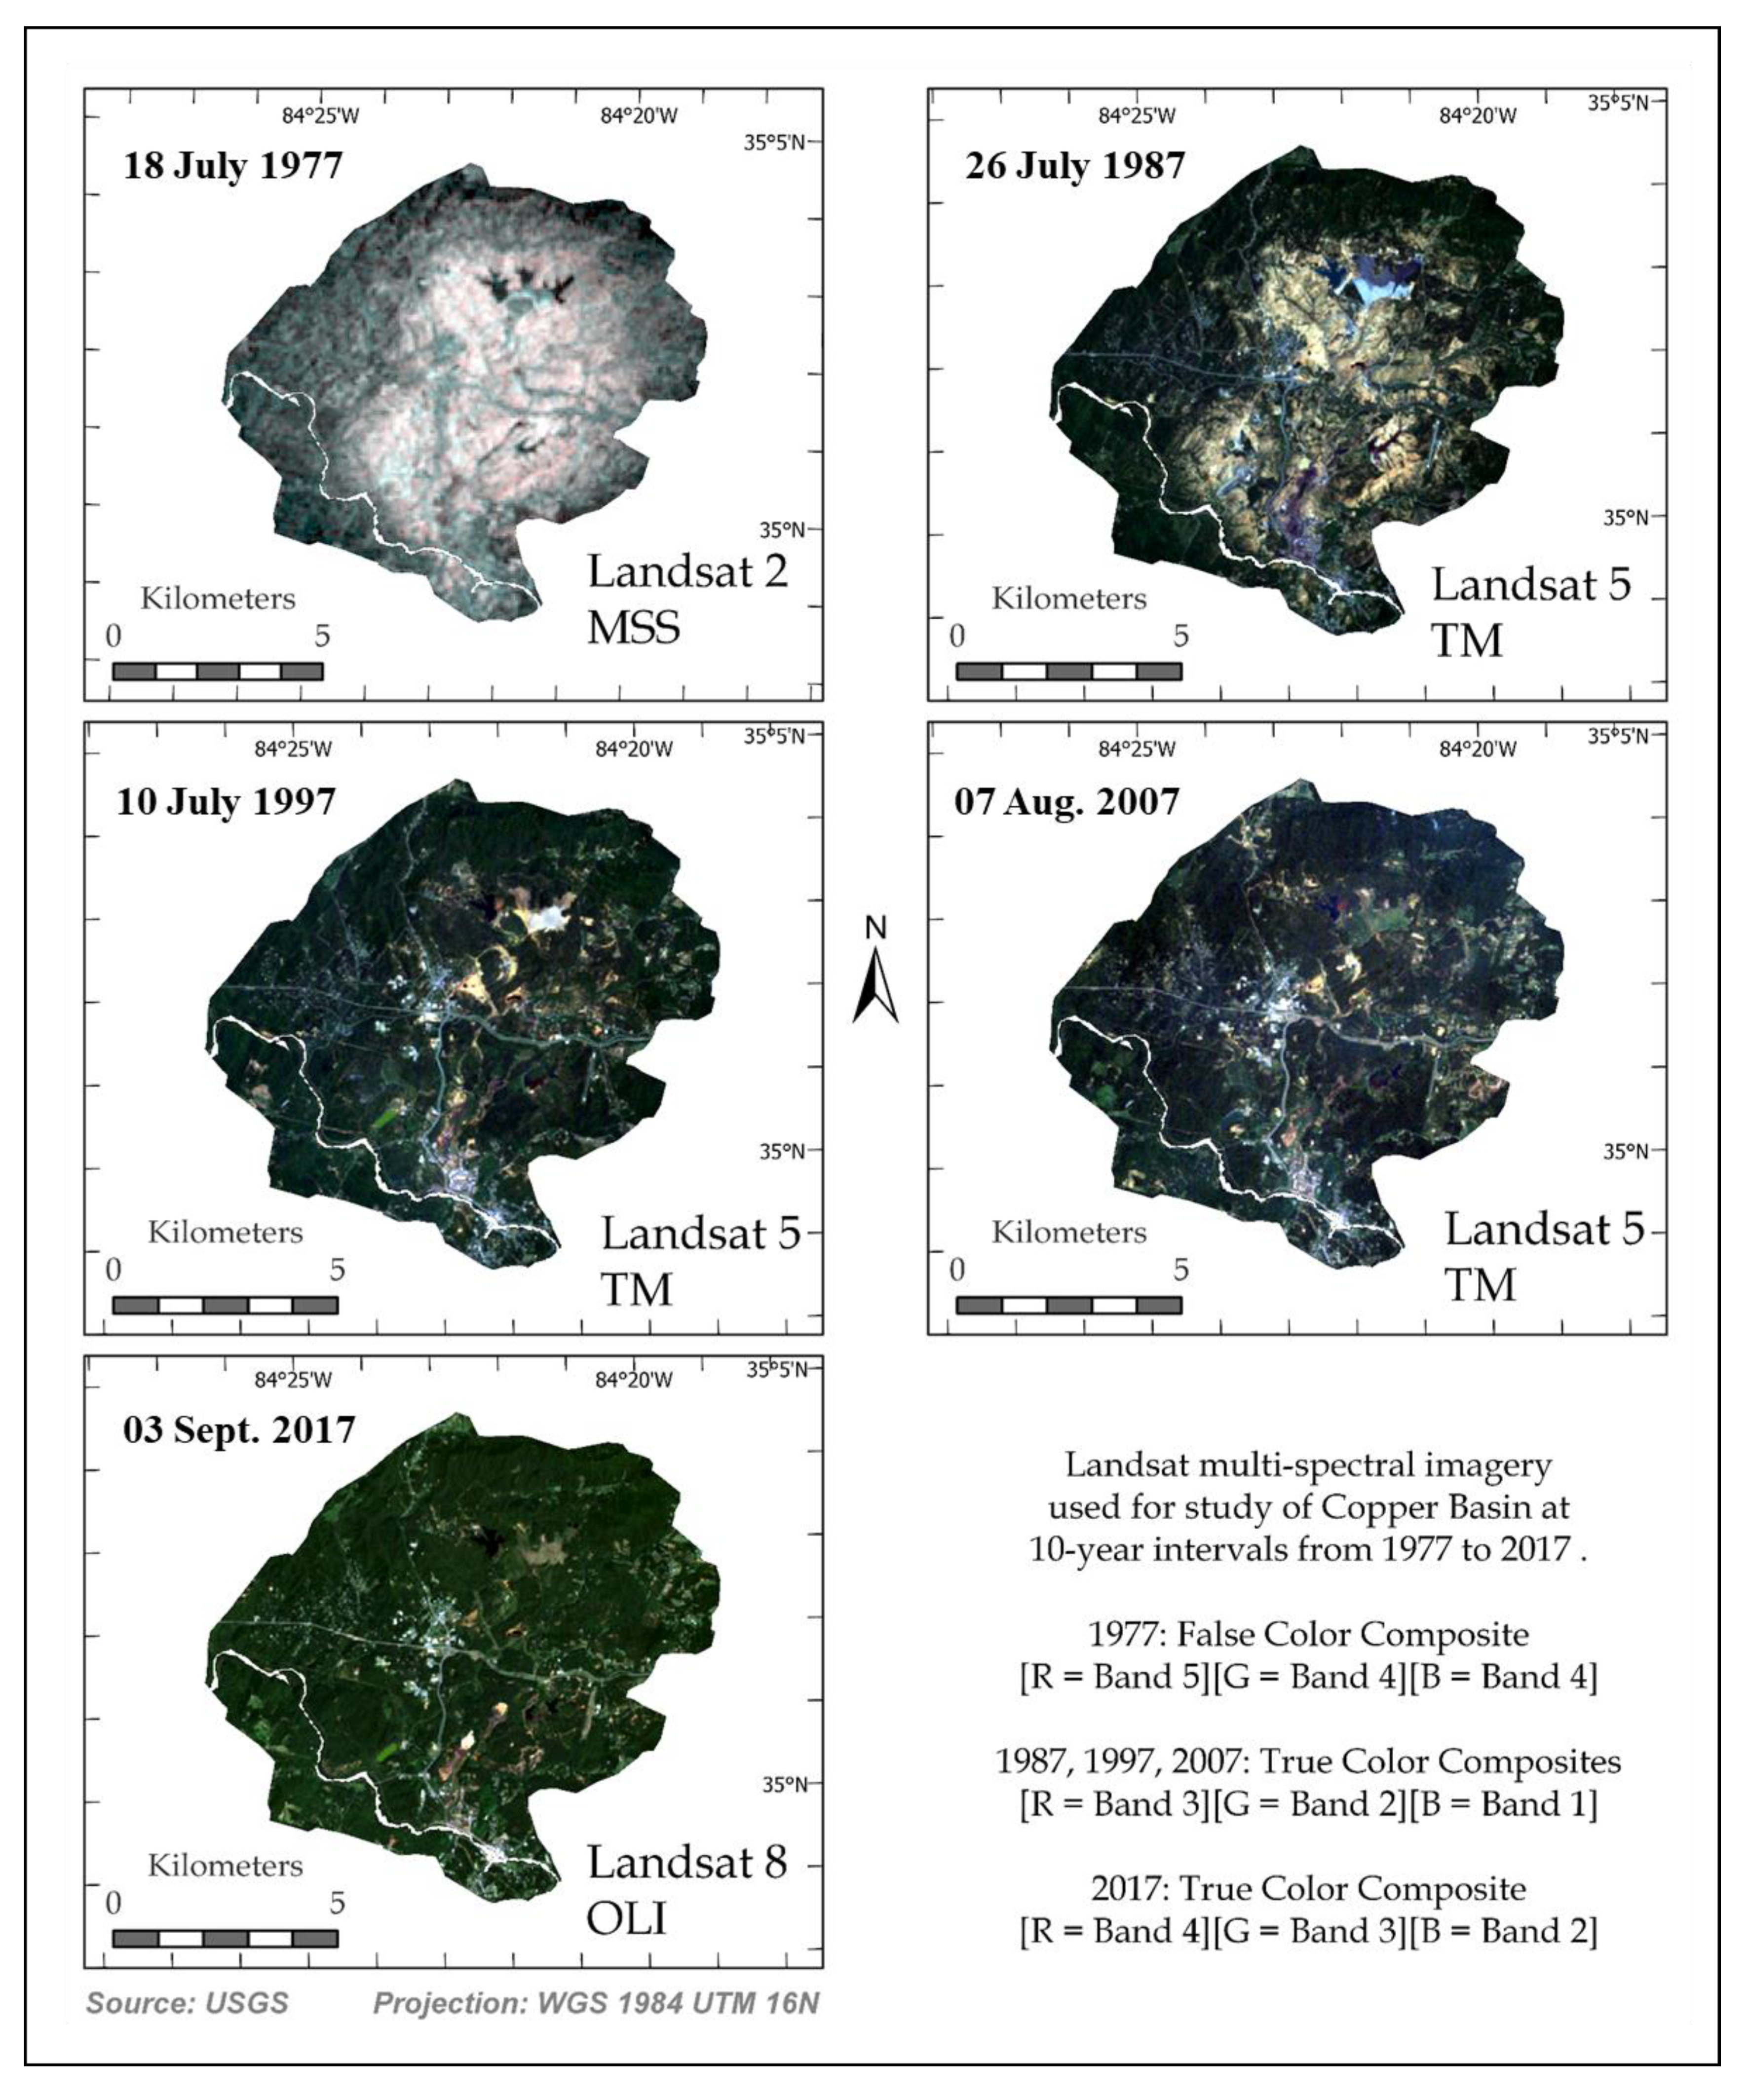
Additionally, the Landsat program has continual data from 1972 and provides the earliest multispectral remote sensing data of the study site. Some revegetation efforts were partially successful by this time. Landsat scenes over the 40-year temporal period were selected at 10-year intervals from 1977 to 2017. All Landsat datasets were obtained from the United States Geological Survey (USGS) Global Visualization Viewer (GloVis) (https://glovis.usgs.gov/). For each year of analysis, Landsat scenes were found from cloudless days during summer months when vegetation was green (Figure 2). Table 1 lists the image acquisition dates along with the characteristics of each Landsat scene selected and used.
After acquiring the imagery, the bands were stacked for each date. They were then subset to include the Copper Basin and the Ocoee River, including Parksville Lake, upstream of TVA Ocoee Dam 1. Landsat 2 Multispectral Scanner (MSS) scenes were resampled to 30 m to be consistent with the spatial resolution of the other imagery. Each scene was then geo-rectified to correct for any non-systematic distortions that may have occurred and ensure continuity between images. Figure 2 shows the time series of the processed Landsat imagery used for this study.
2.3. Digital Image Processing
The primary aspect of this analysis was using the Normalized Difference Vegetation Index (NDVI) to analyze the extent of non-vegetated areas of the Copper Basin for each scene.
The Normalized Difference Vegetation Index [21,22] is one of the most widely accepted and utilized vegetation indices [23,24]. It can be used as an indicator of relative biomass and greenness [25,26,27]. It uses the high and low reflectance values of vegetation in the near infrared (NIR) and the red (R) regions of the electromagnetic spectrum. It is based on a ratio of the NIR and the R bands, eliminating any discrepancies that may occur in the imagery due to sensor differences or image quality issues, such as brightness, or other interferences. The NDVI can be computed for a wide variety of sensors [28,29] using Equation (1).
The NDVI for this study was calculated on the basis of the low reflectance of vegetation in the red spectral wavelengths (Landsat 2 MSS band 5, Landsat 5 TM band 3, Landsat 8 OLI band 4) and the very high reflectance in the near infrared (NIR) spectral wavelengths (Landsat 2 MSS band 6, Landsat 5 TM band 4, Landsat 8 OLI band 5) as shown in Equations (2)–(4). This high NIR reflectance is attributed to the chlorophyll in green vegetation.
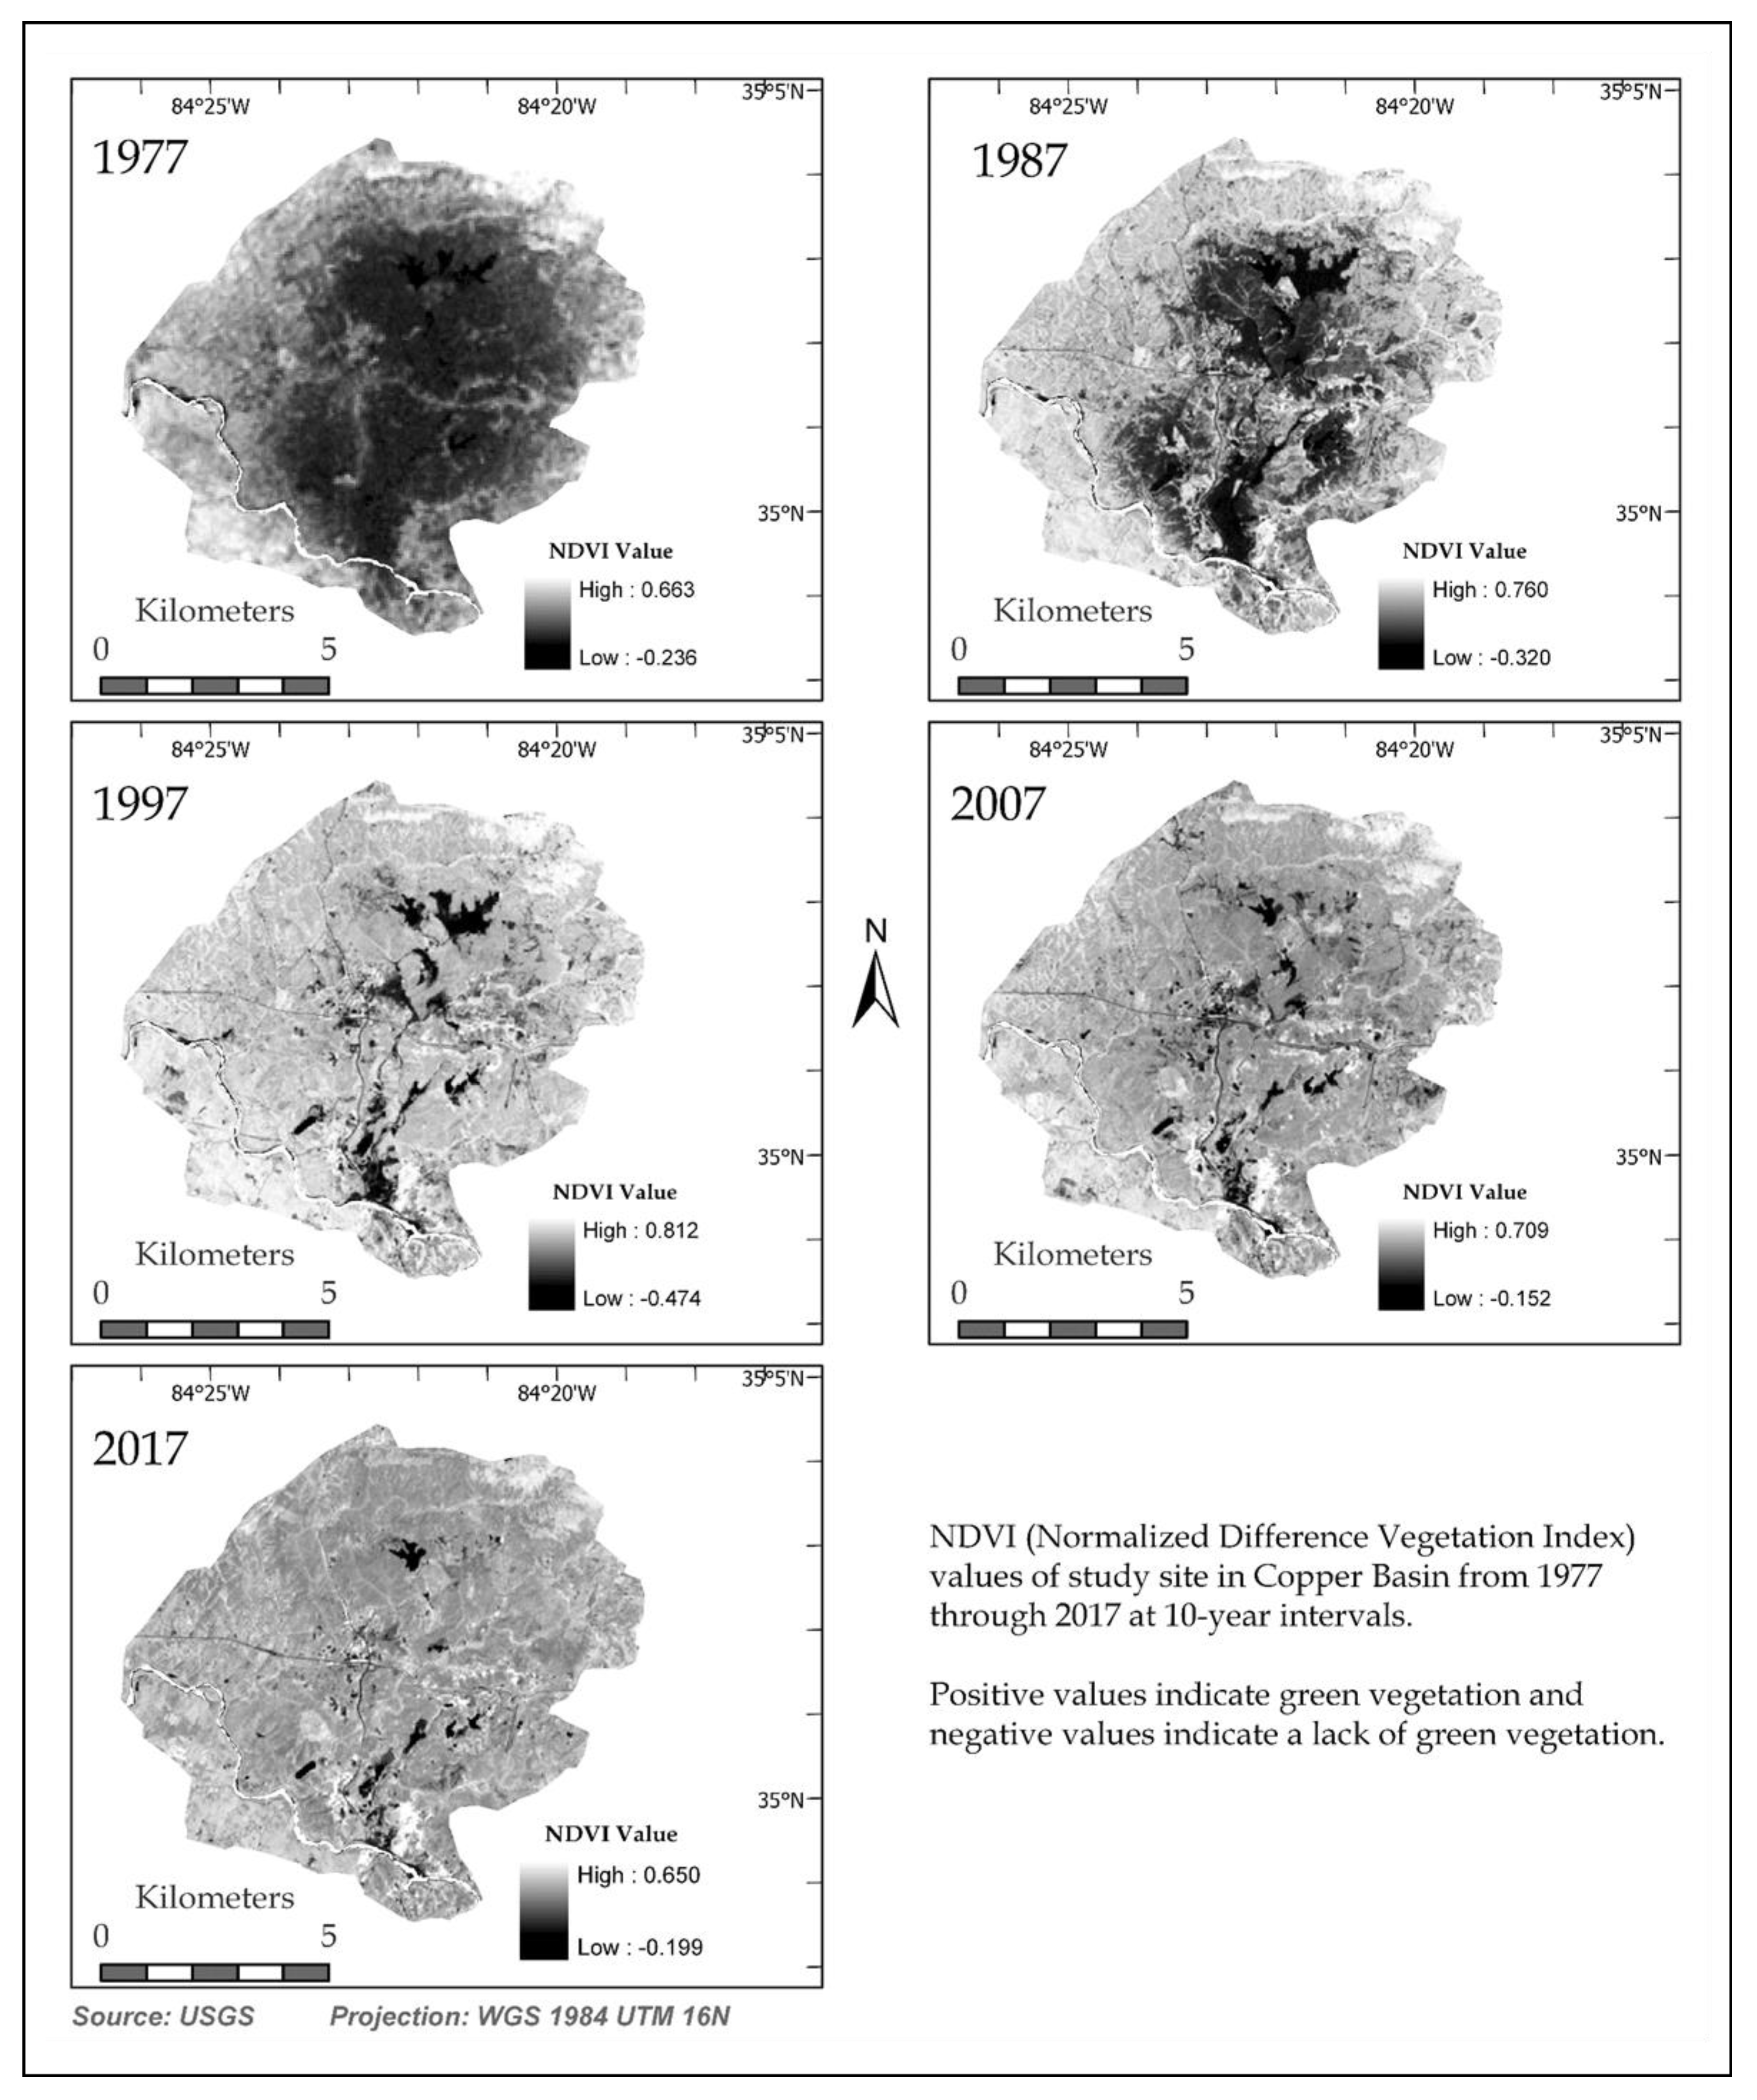
The values of NDVI can fall between +1 and −1, with a positive relationship to vegetation leaf density. A zero means no vegetation and close to +1 (0.8 to 0.9) indicates the highest possible density of green leaves. Since the contrast between vegetation and bare ground was found to be very high for the current study site it is assumed that there should not be any problem separating green vegetation from the bare ground using NDVI.
2.4. Analysis of Vegetation
The boundary of the study site in the Copper Basin (CB) was delineated using the NDVI imagery obtained from the scene from 1977, to show the extent of non-vegetated areas at that time. This was used to create a vector GIS data (polygon shapefile) around the basin and included a buffer of vegetation, to ensure the inclusion of all non-vegetated areas. This shapefile was then converted to a raster thematic image. The raster image of the extent of CB was then used to mask each Landsat scene, leaving only pixel values within the area of the study site as seen in Figure 2.
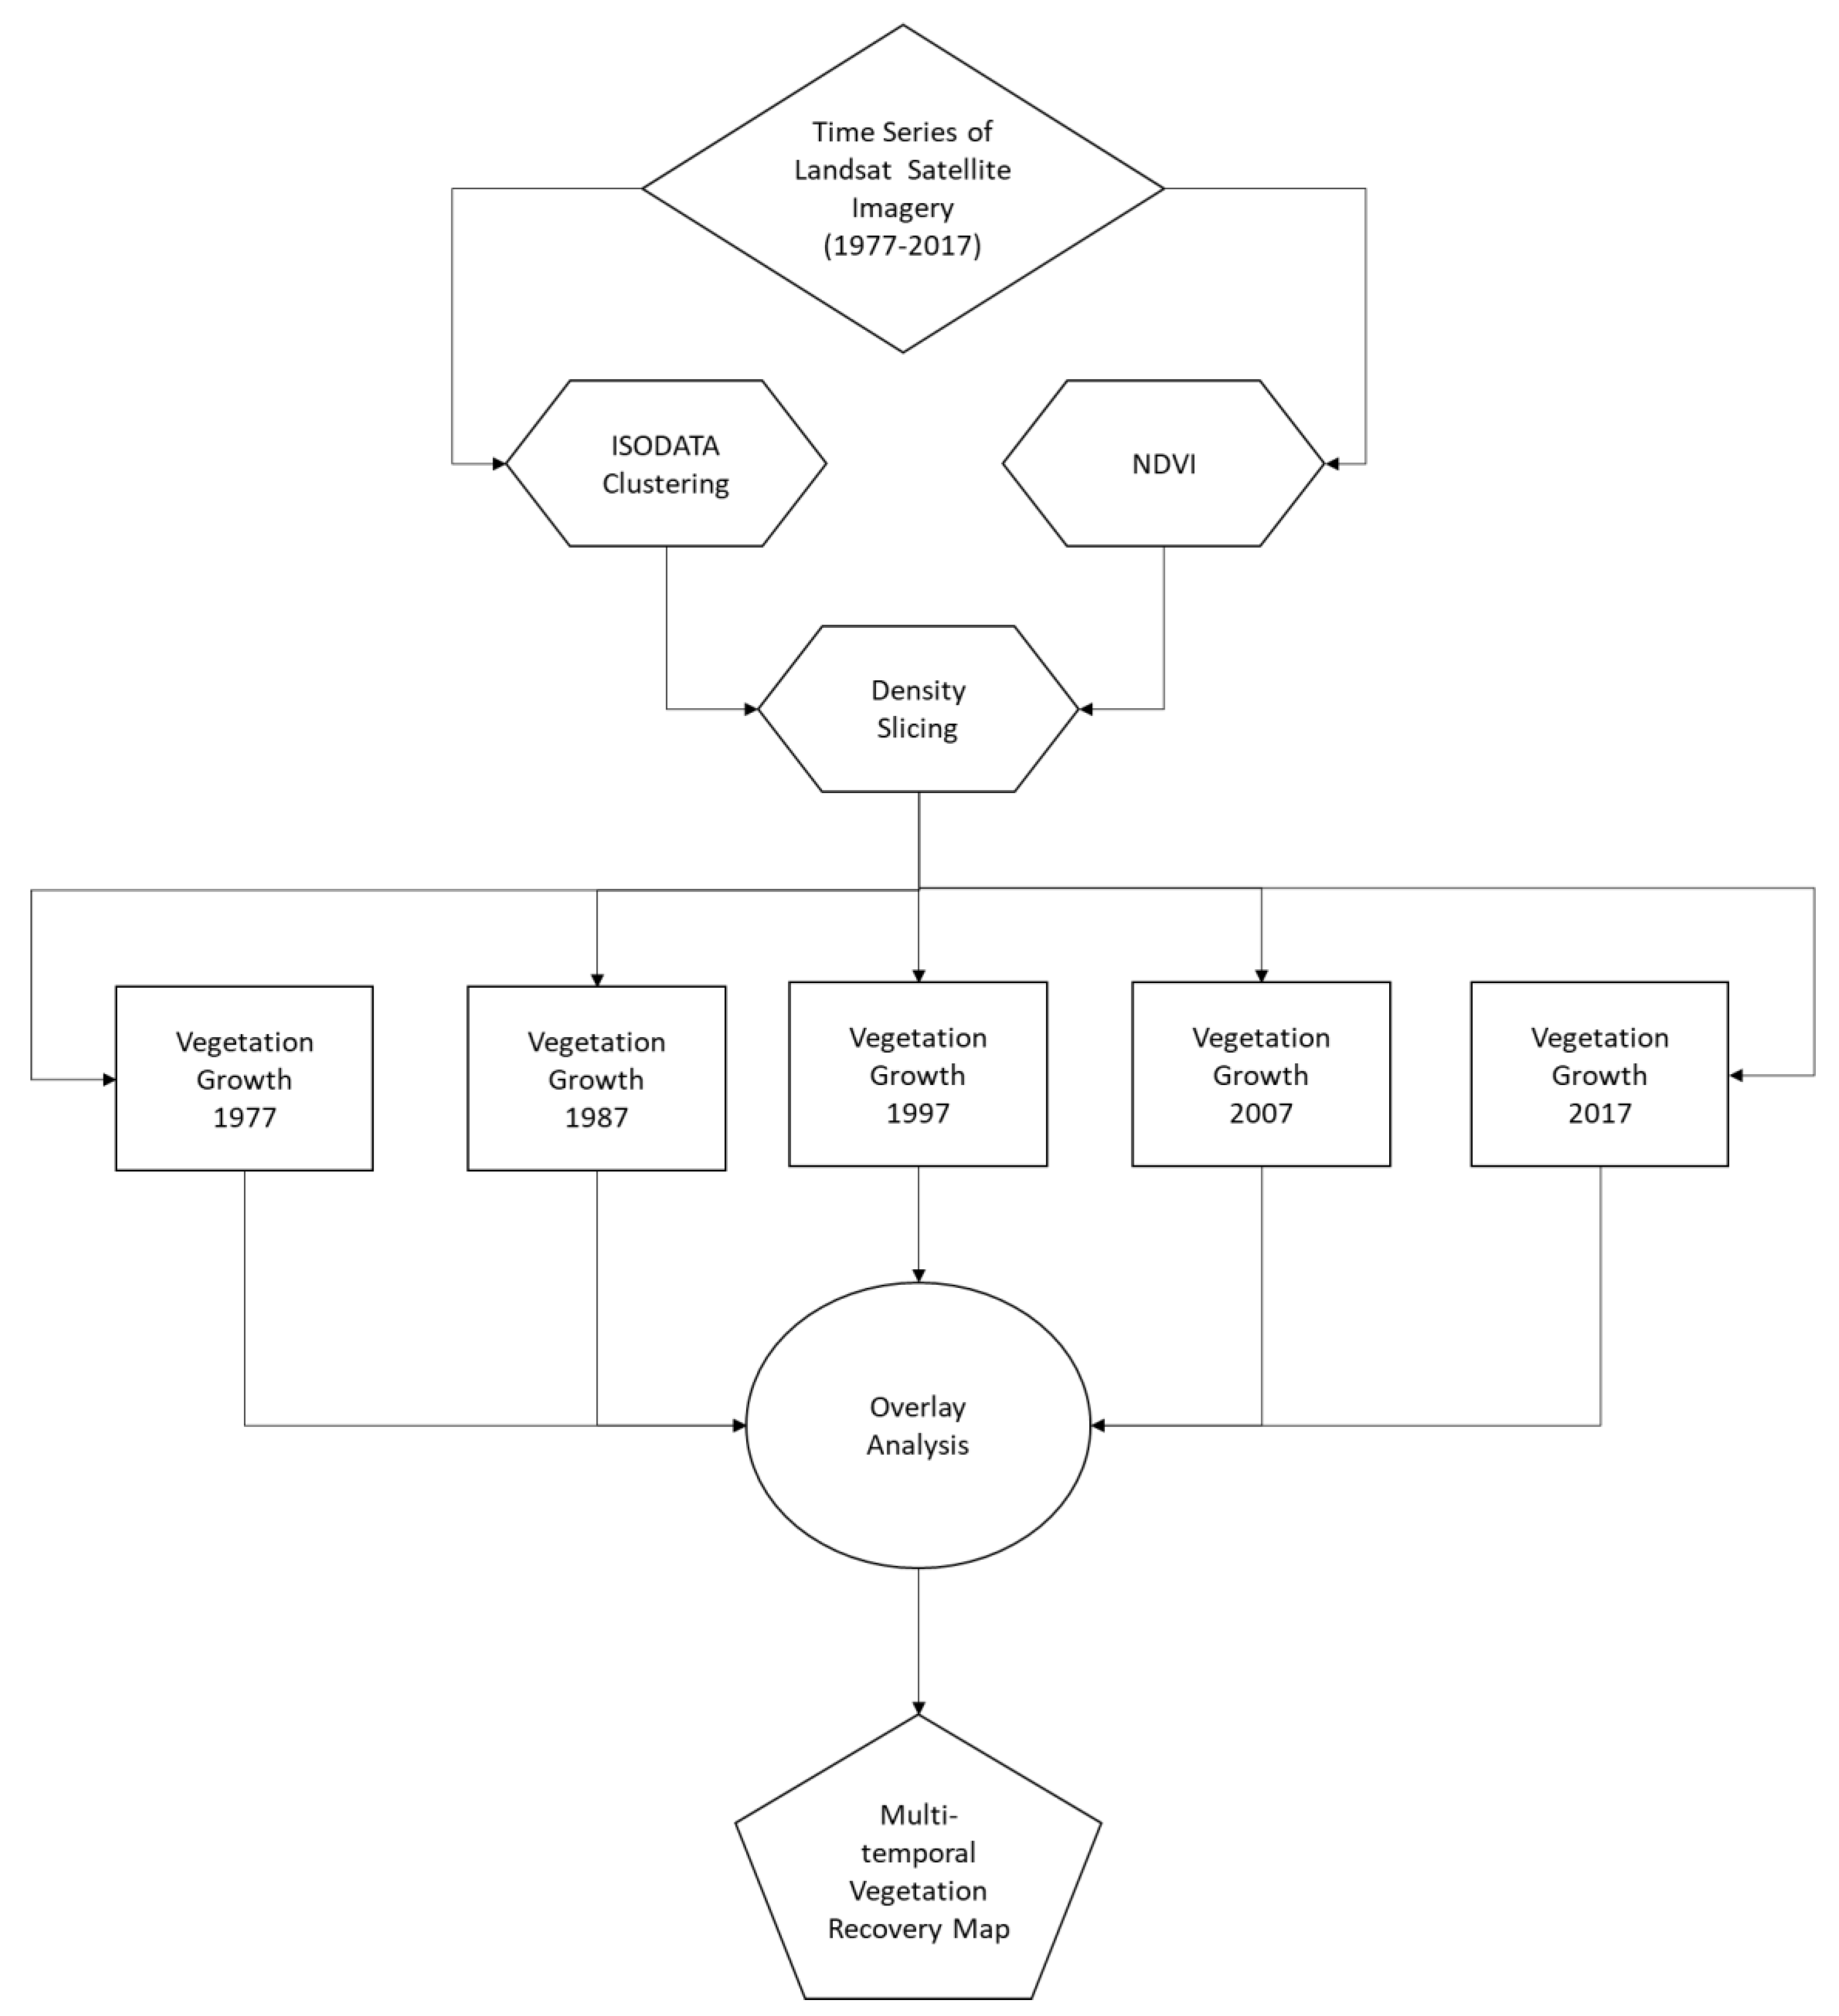
Figure 3 shows the flowchart that summarizes the overall methodology used for the analysis of vegetation. To determine the extent of vegetated and non-vegetated areas in CB, the NDVI was calculated for the masked Landsat scenes for each date (Figure 4). An unsupervised classification scheme using the Iterative Self-Organizing Data Analysis Technique (ISODATA) was used to determine the threshold (cut-off) values needed to classify the NDVI images into vegetated and non-vegetated areas. ISODATA [28,30,31] is an iterative unsupervised classification algorithm, which minimizes the within cluster variability and categorizes the pixels into different number of classes based on statistics. The classification of the NDVI images was finally done for each year using the density slicing technique. Density slicing is a digital data interpretation technique, which is used in analysis of remotely sensed imagery to enhance the information gathered from an individual brightness band [32]. It is done by dividing the range of brightness in a single band into intervals, then assigning each interval to a color [33,34,35]. Table 2 provides the threshold values used to classify the NDVI images using the density slicing technique.
3. Results
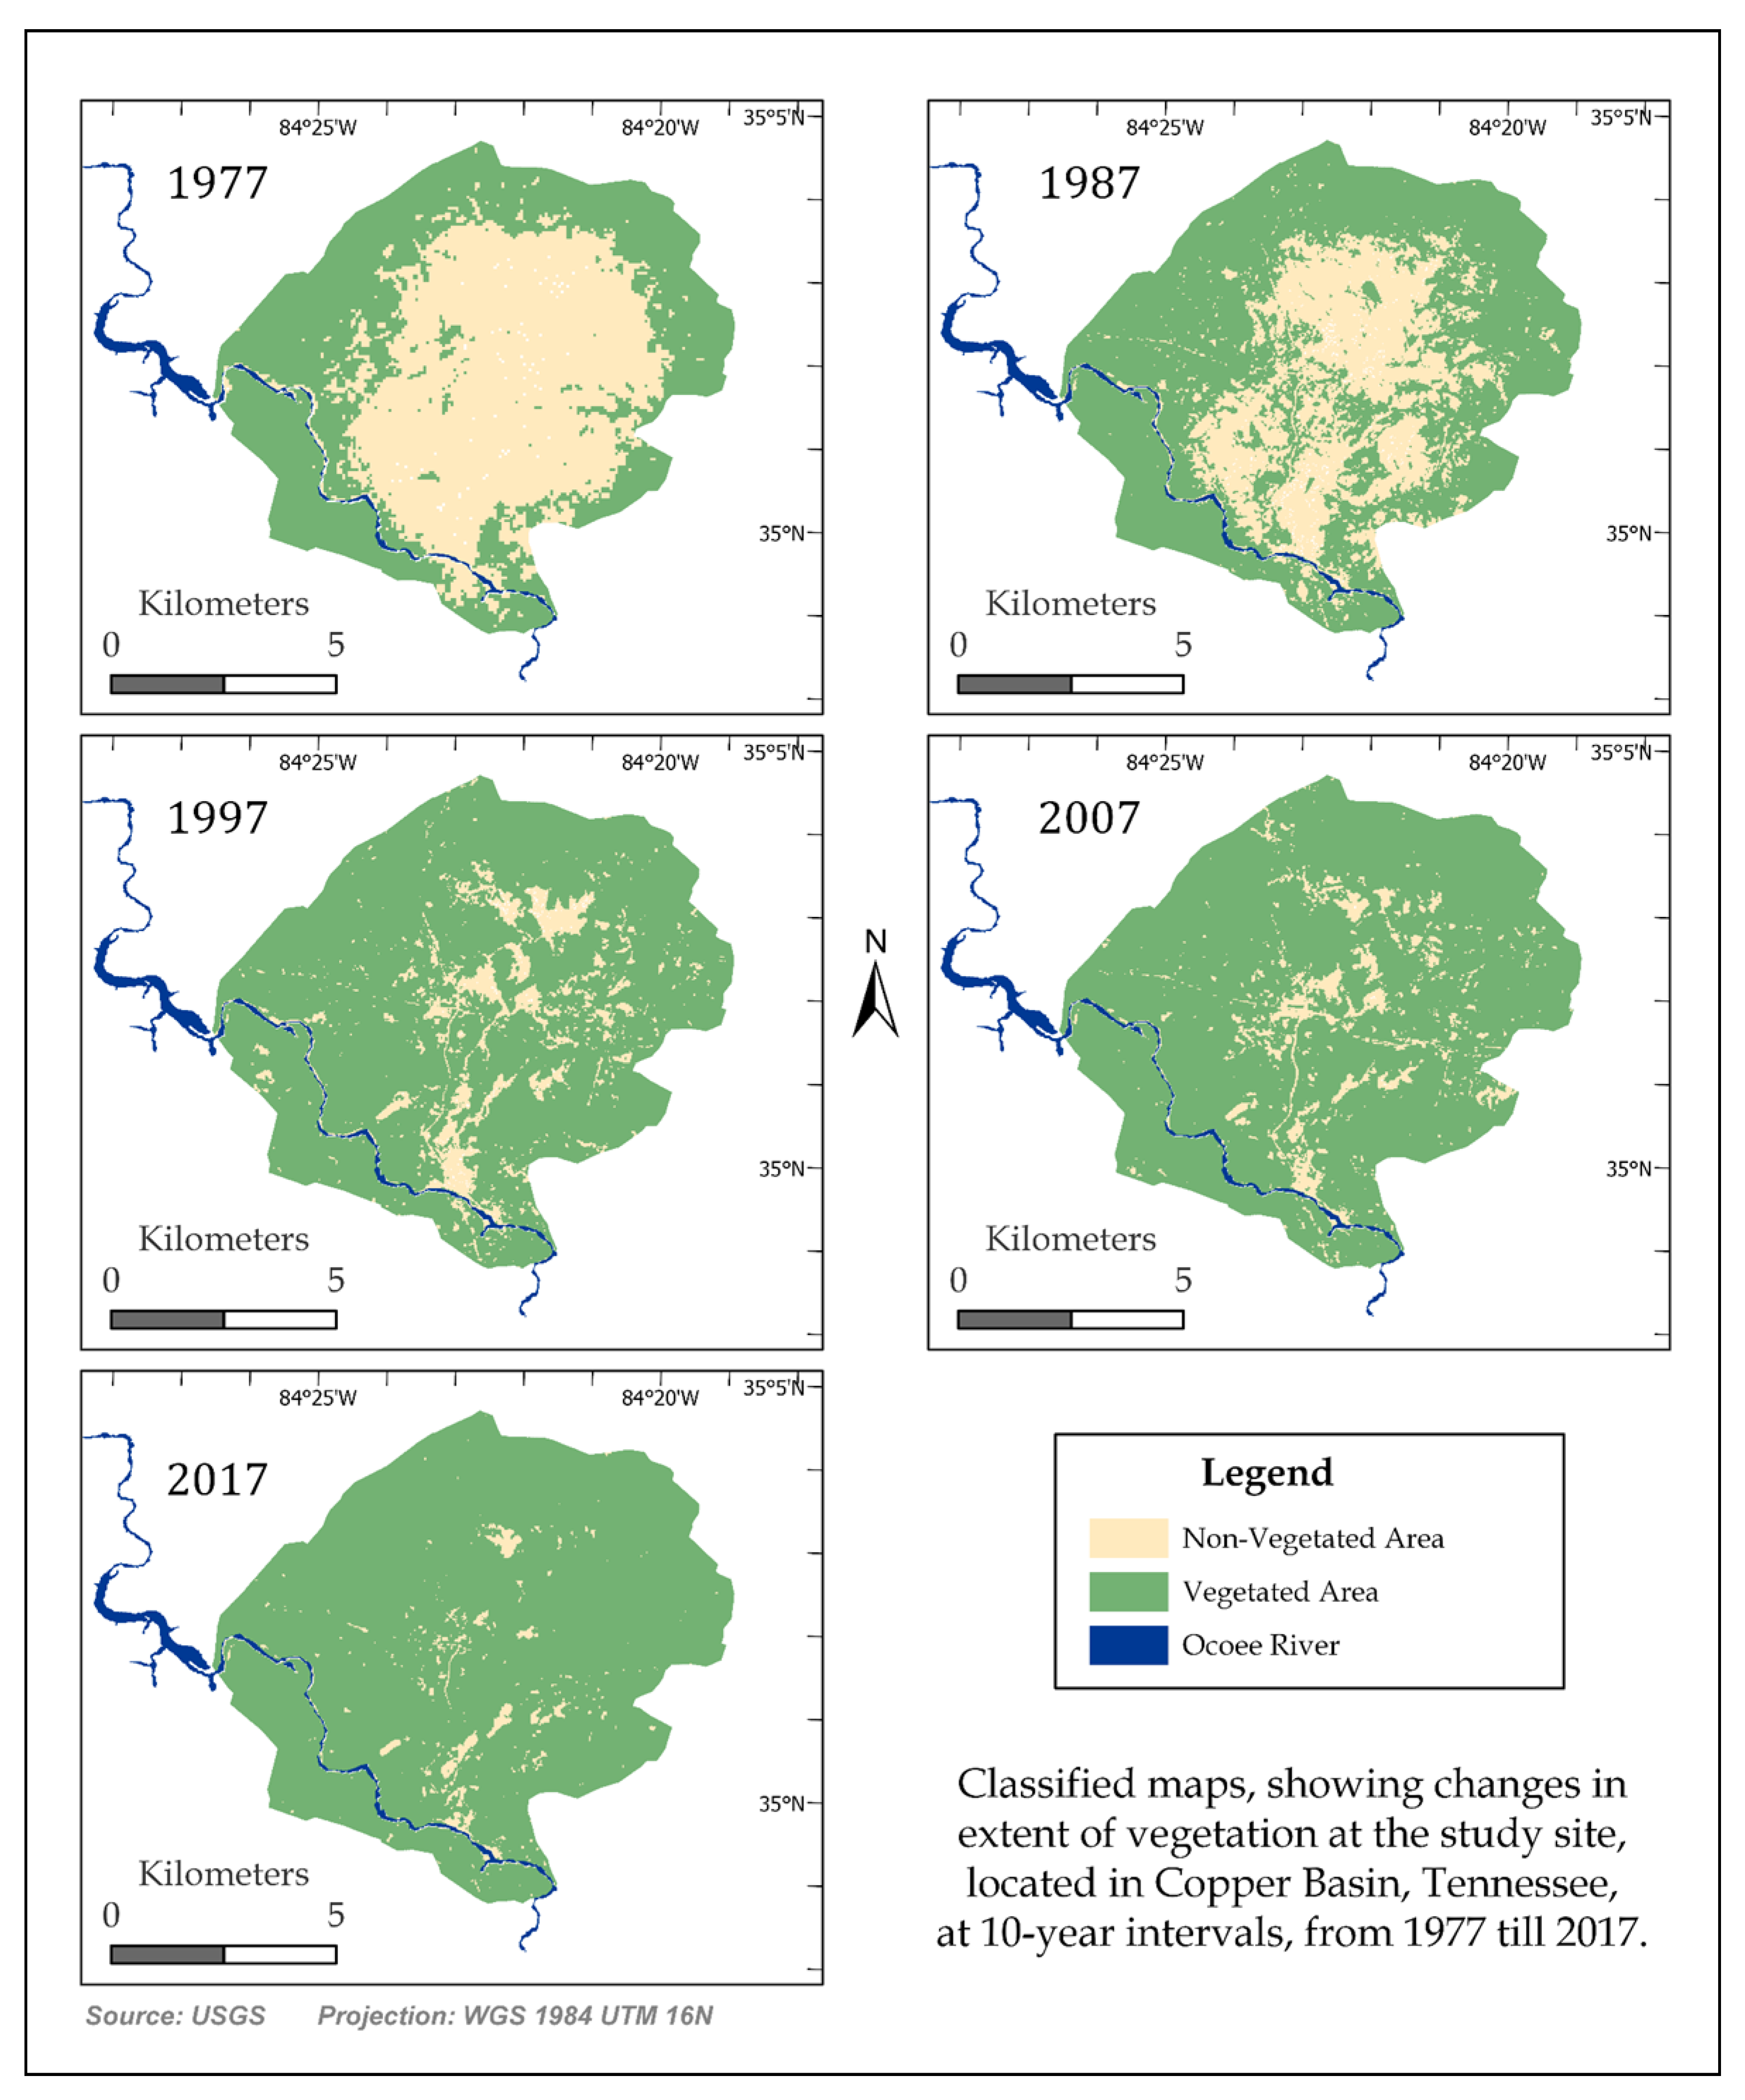
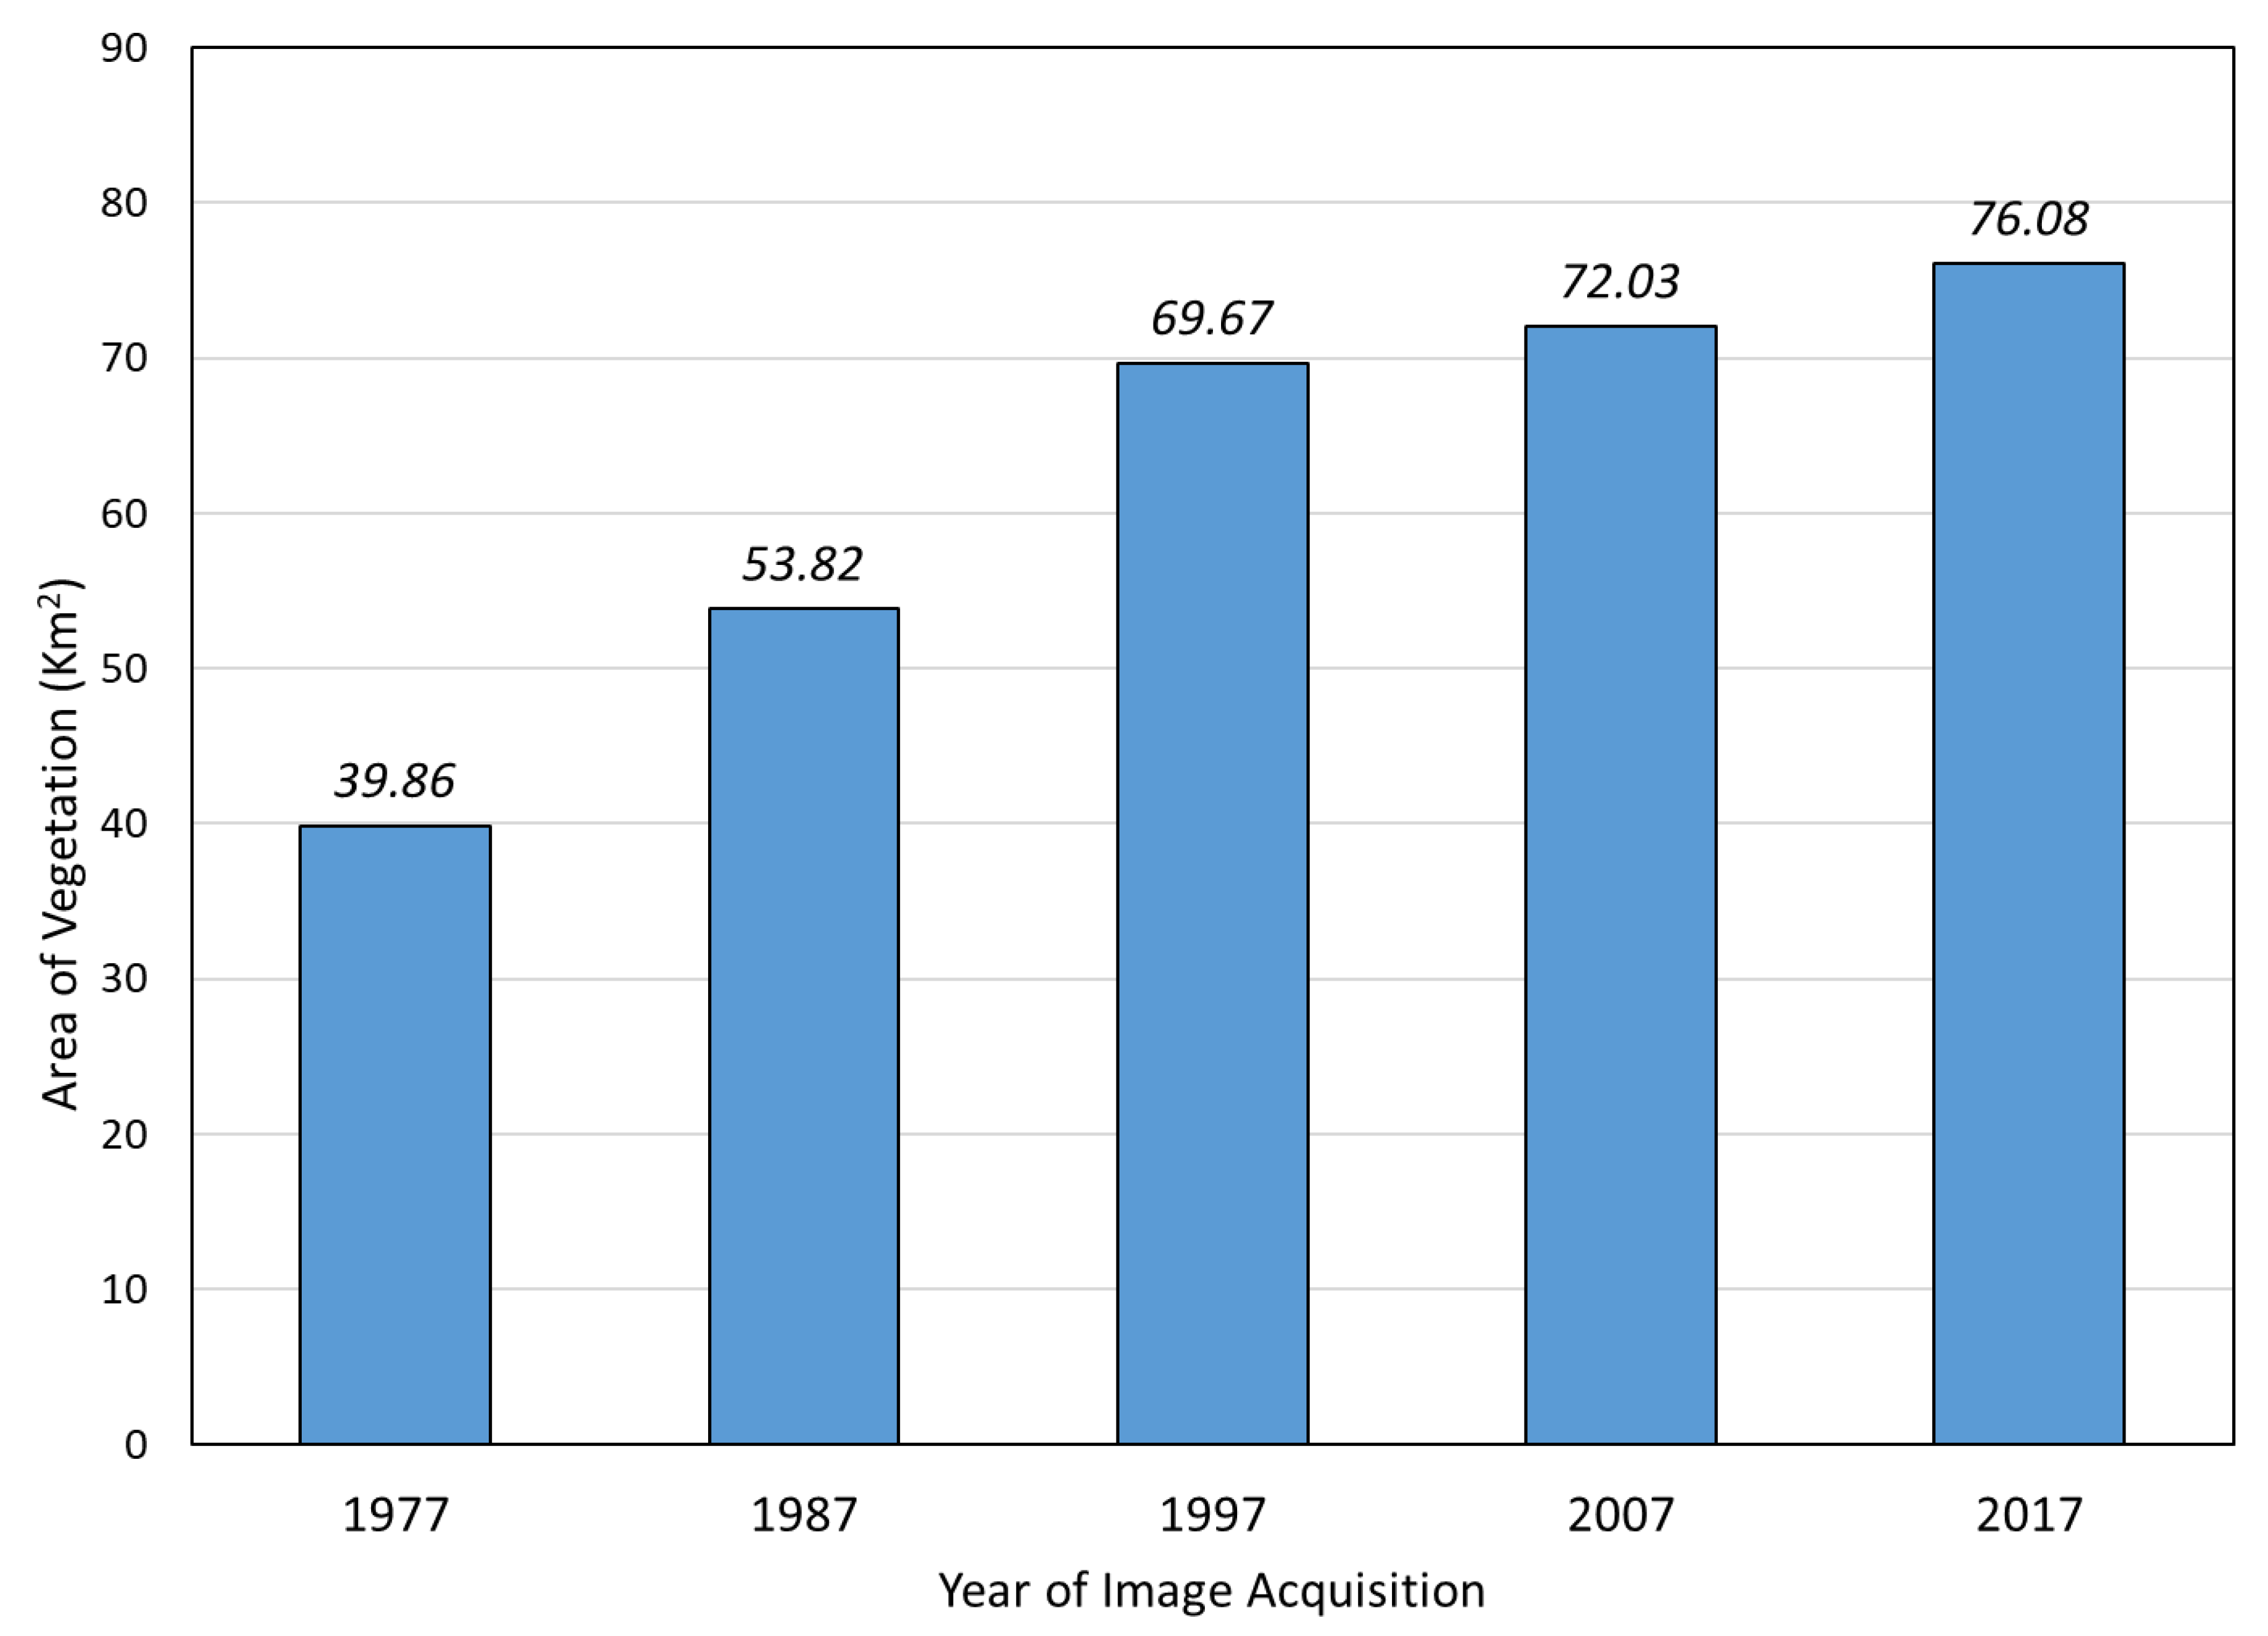
Classified thematic maps were generated from the NDVI data, for each 10-year scene, that showed the extent of non-vegetated areas and vegetated areas, as shown in Figure 5. These maps were used to calculate the total spatial extent of area with vegetation and area without vegetation for each year of imagery, as shown in Table 3 and Figure 6.
Analysis of vegetation in the Copper Basin for each year shows a steady increase in the extent of vegetated areas during the time of analysis (Figure 6). However, there are still non-vegetated areas that remain, as shown in Figure 5, which includes mostly water and impervious surfaces. The extent of vegetation increased the most between 1977 and 1997, then less after 1997. From 1977 through 2017, the vegetated area nearly doubled from 40 to 76 km2. Most of this had occurred by 1997, with a total vegetated area of approximately 70 km2.
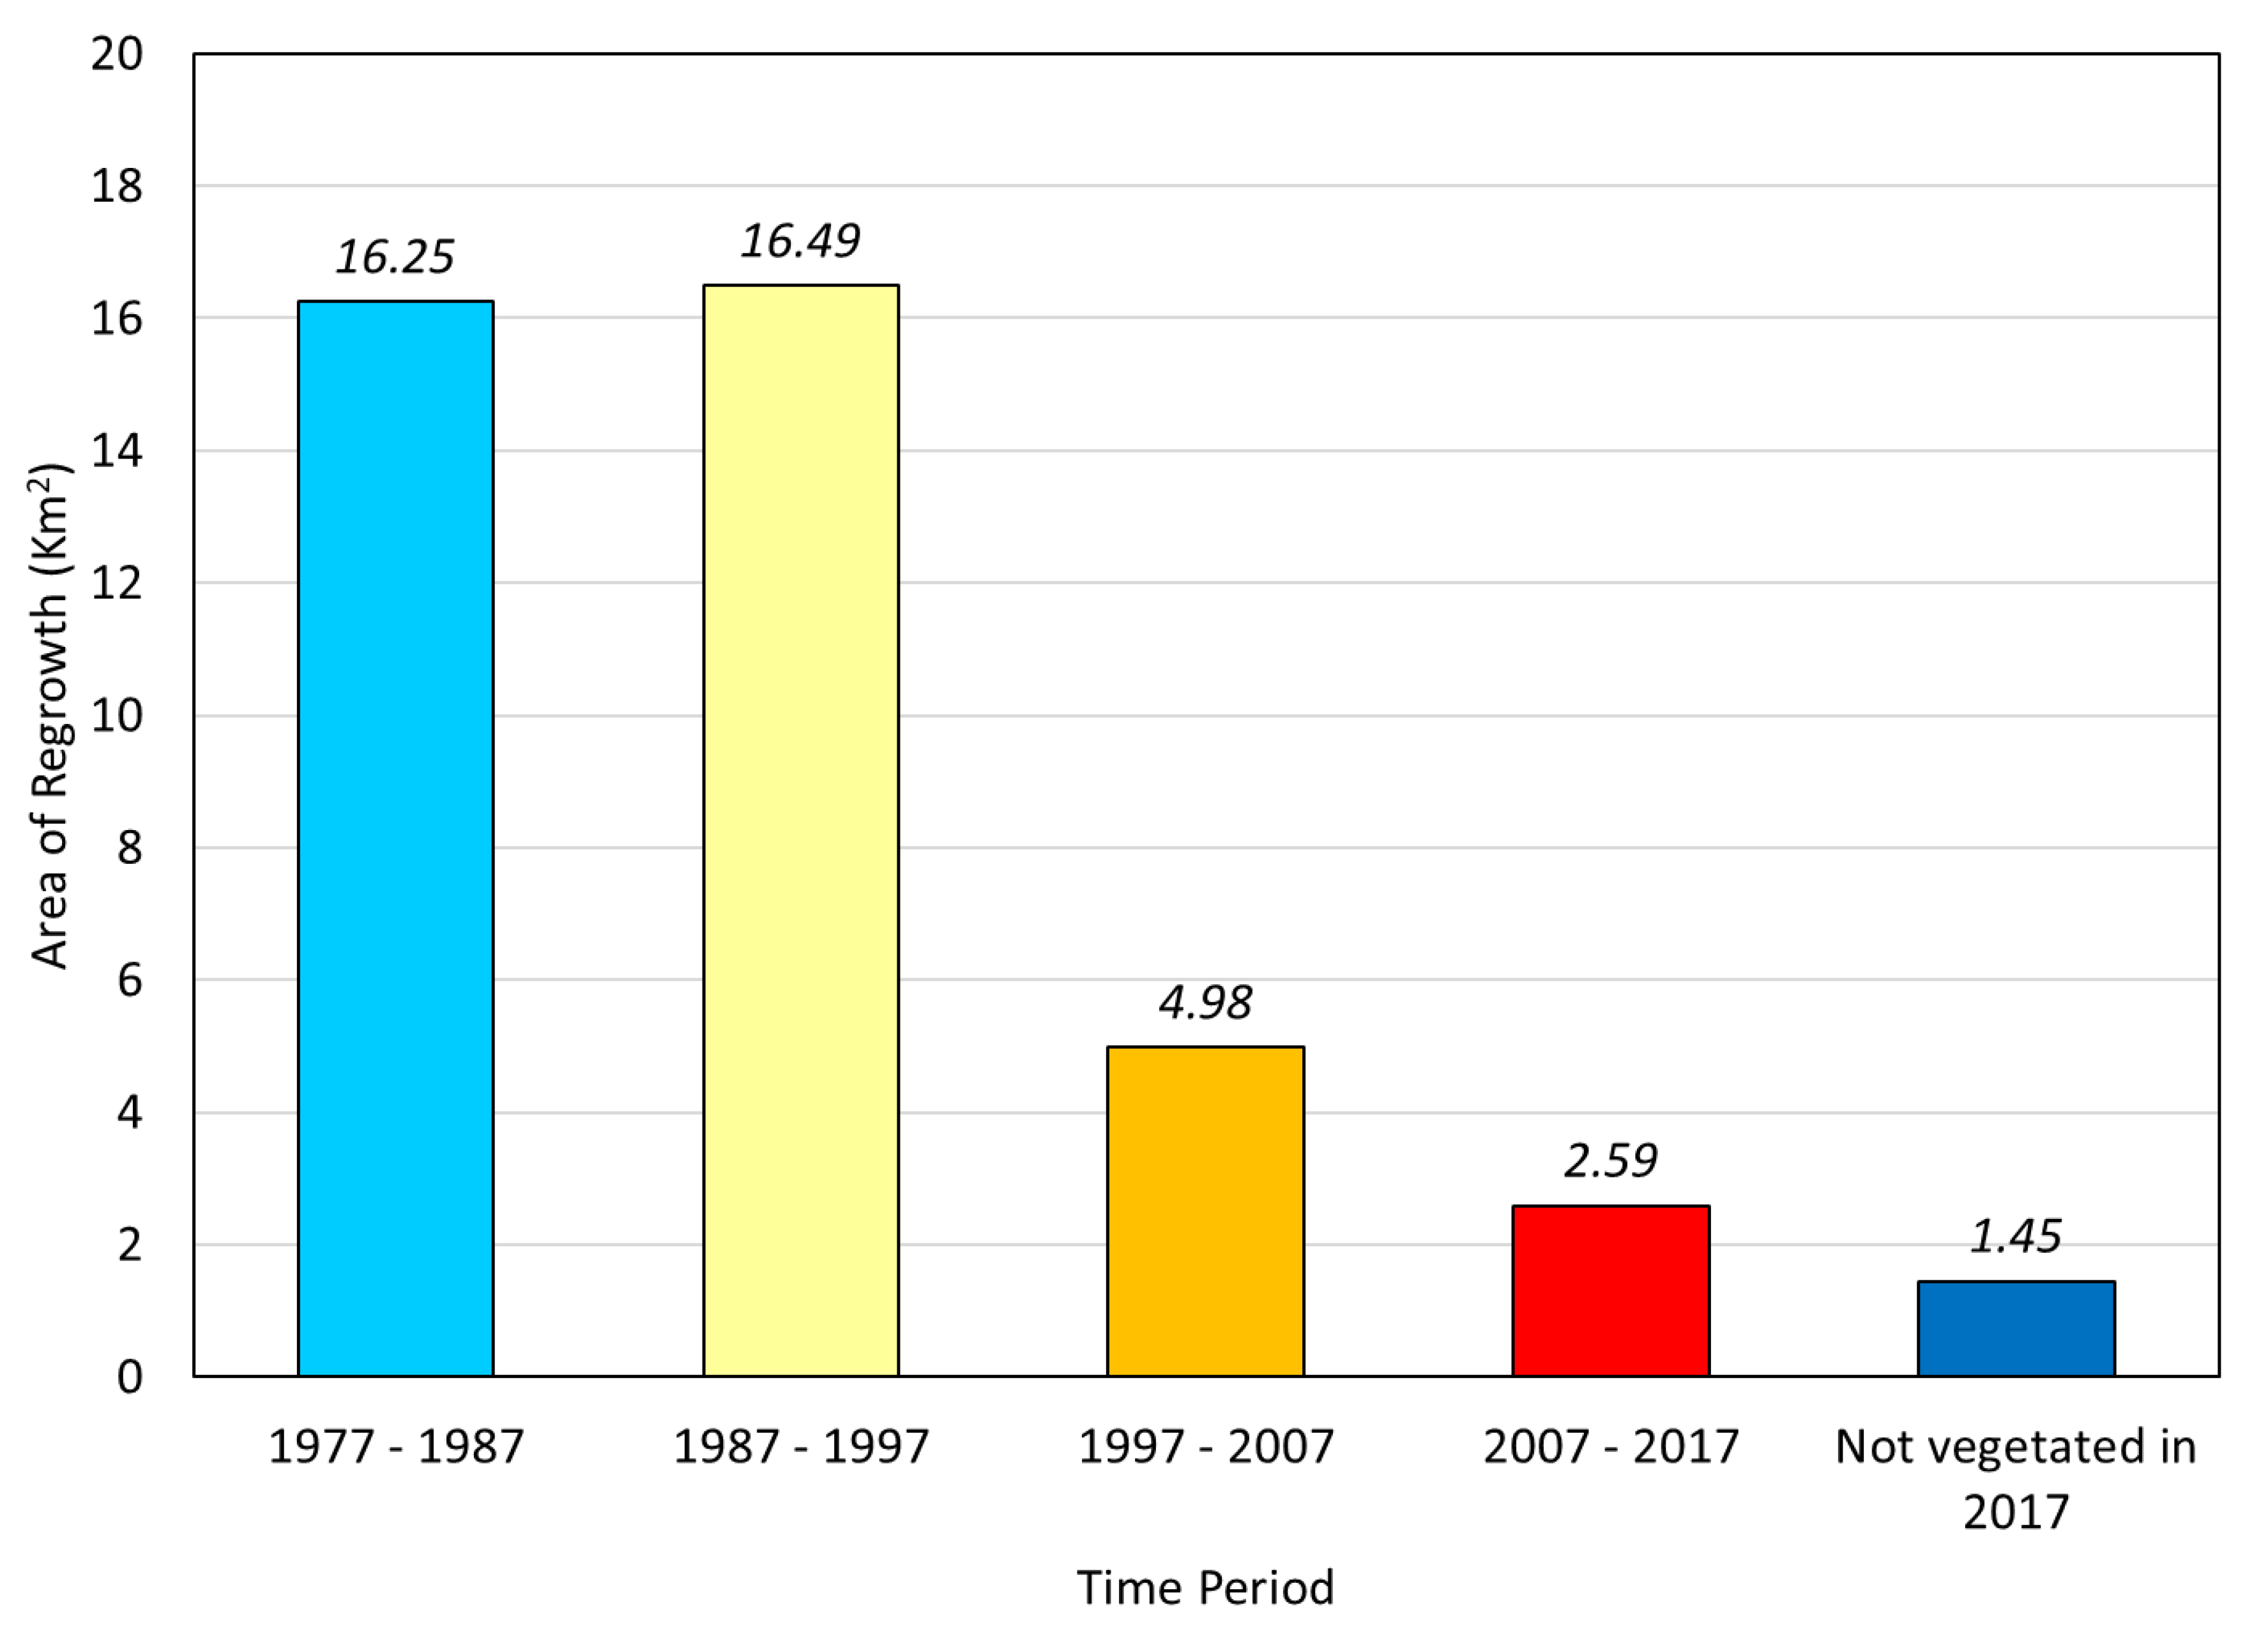
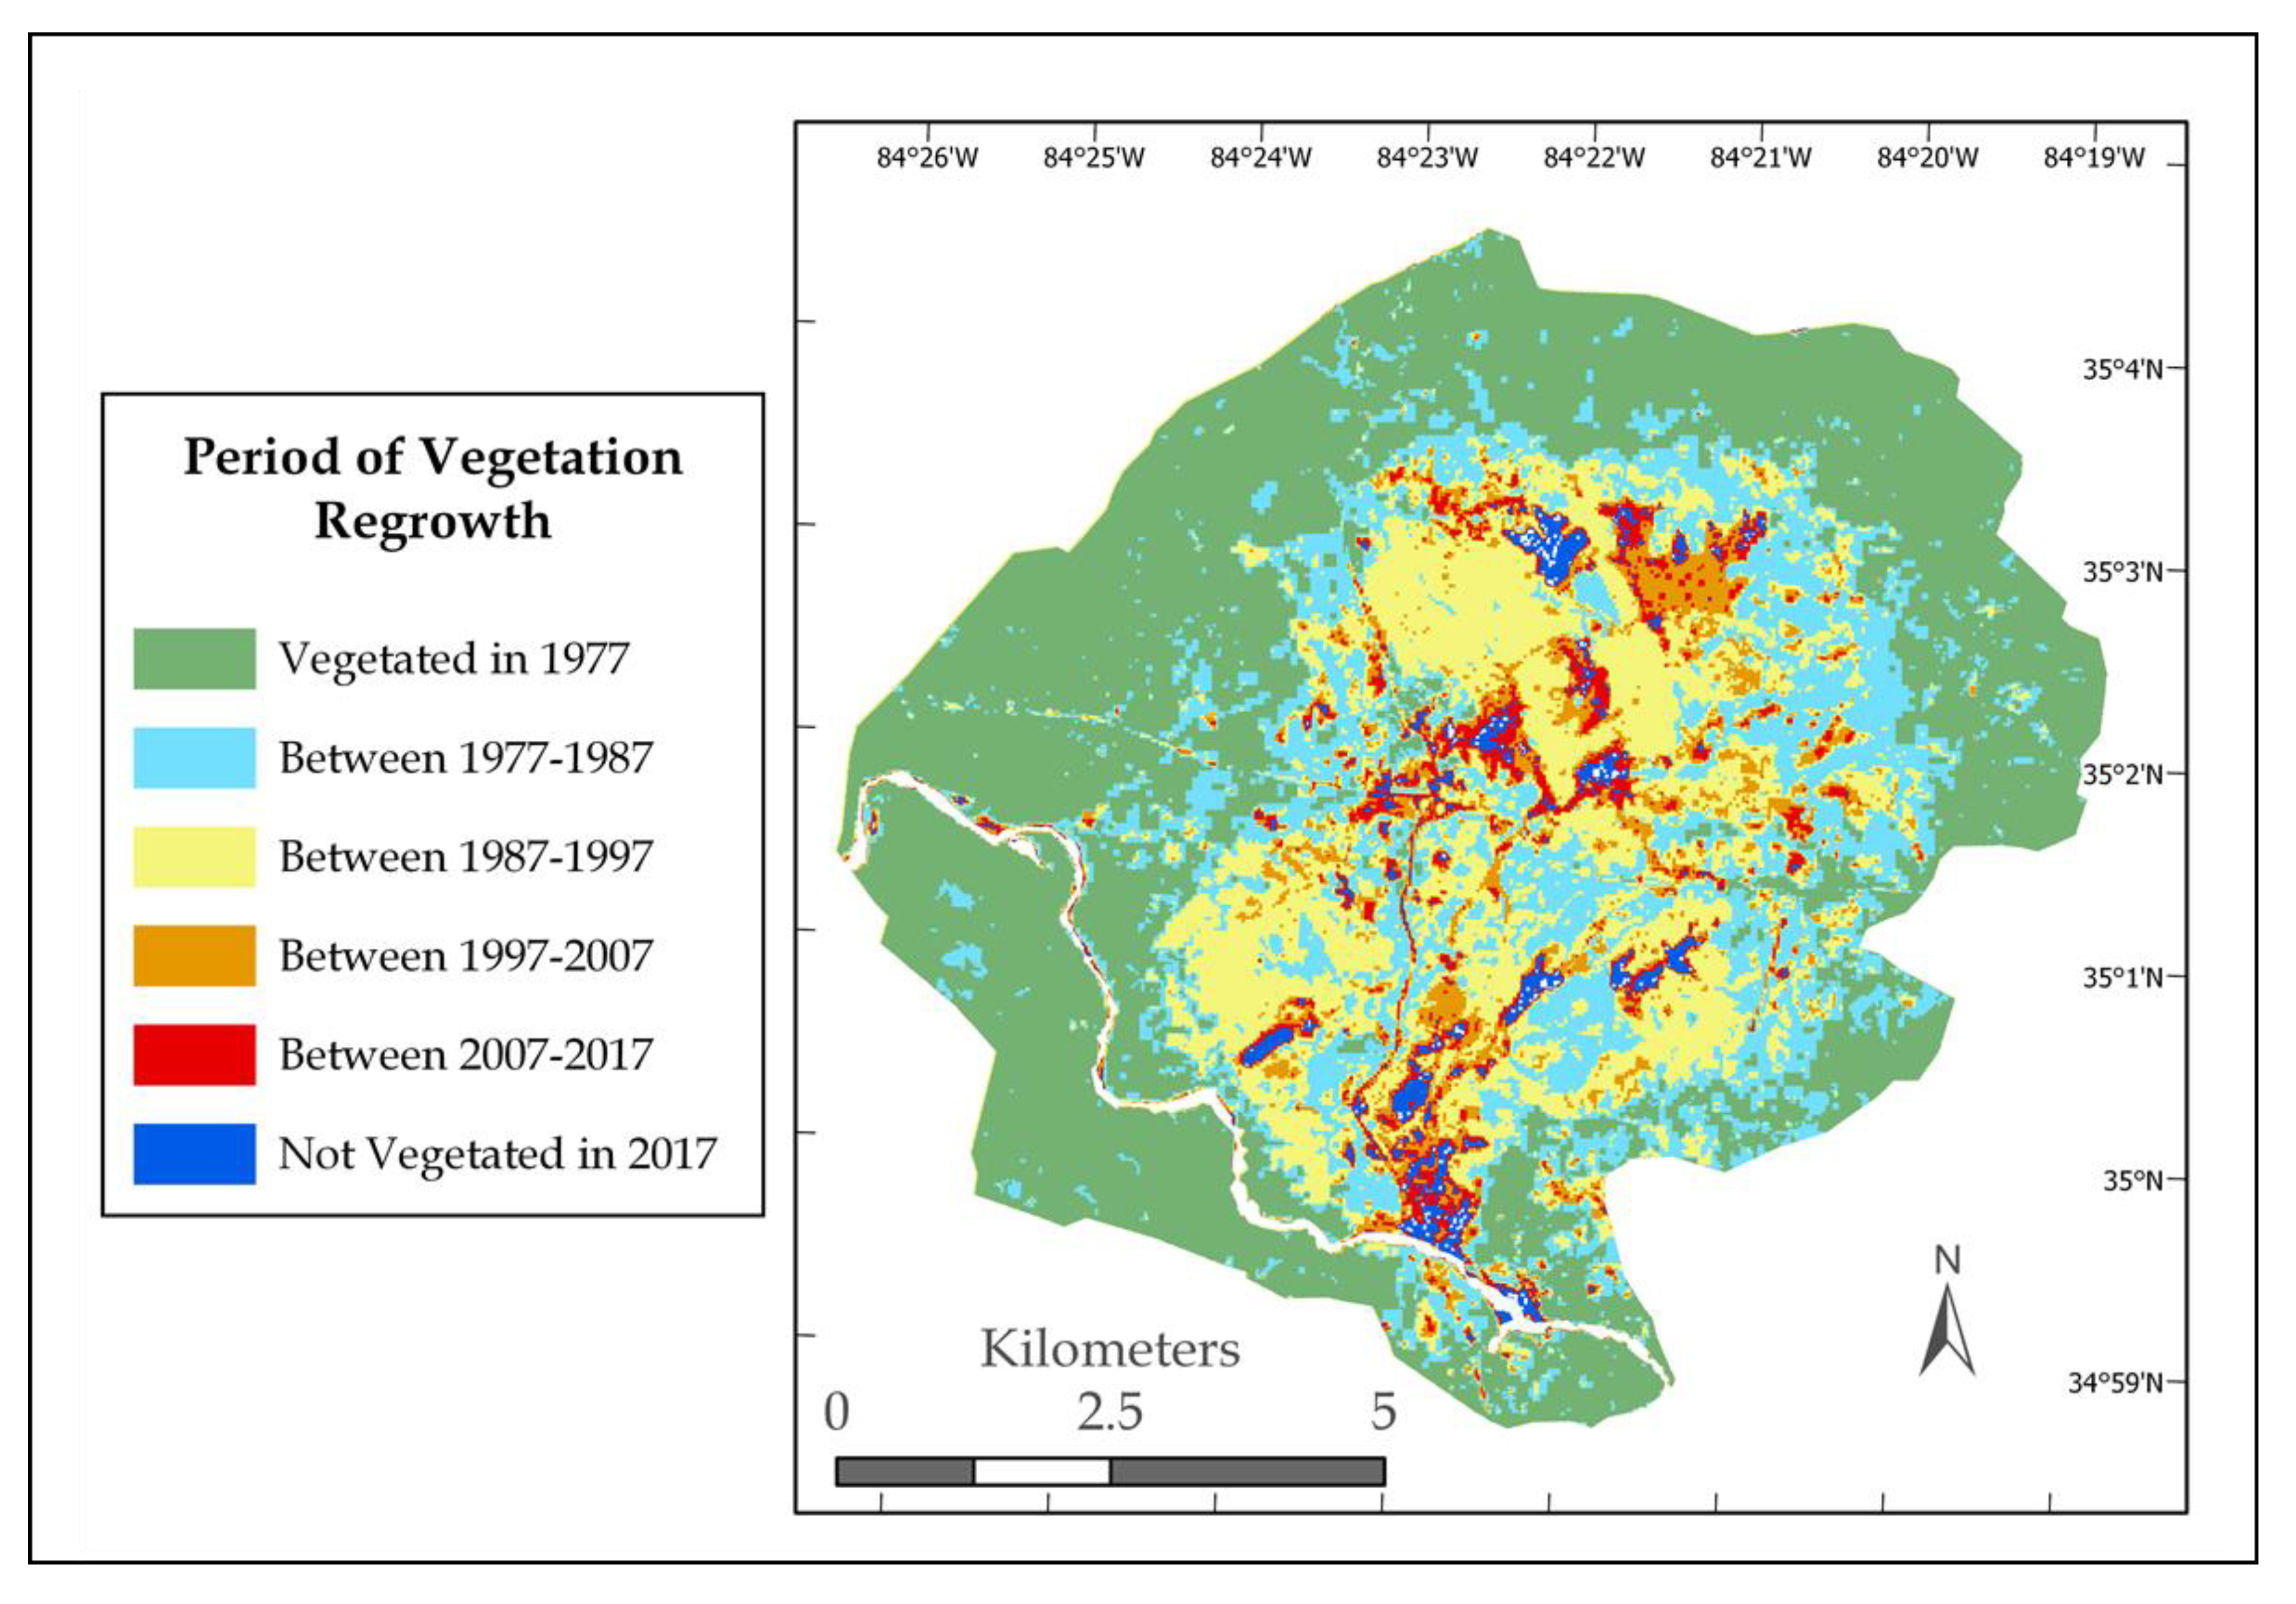
The time series of the obtained vegetation extent thematic maps were further analyzed using overlay analysis in GIS to produce a single thematic map indicating during which 10-year period each parcel of land was revegetated. The Model Maker in ERDAS Imagine software was used to complete this task. Figure 7 shows the obtained thematic map and Figure 8 shows the calculation of the areas of vegetation regrowth in the Copper Basin, for each 10-year period between 1977 and 2017. According this analysis, the 10-year period between 1987 and 1997 contributed the most vegetation regrowth with the addition of 16.49 km2 of new vegetation.
4. Accuracy Assessment
Since this study was based on historical data it was not possible to obtain ground truth data to perform detailed accuracy assessment of the obtained results. However, we used the true color imagery of the Landsat 8 OLI sensor to acquire image-derived reference data for accuracy assessment of NDVI image classification for one date of the time series. We selected the imagery acquired in 2017 for this purpose. Two sets of random reference polygons were created for vegetated and non-vegetated (barren) areas. Each set of reference data included five polygons. Each polygon covered 10 pixels of confirmed vegetated and non-vegetated areas. These polygons were used to extract the pixels from 2017 classified NDVI data in ArcGIS Pro software. Table 4 shows the data obtained for accuracy assessment.
The extracted pixel types and counts were used to calculate classification accuracy using Equation (5).
where
Oa = Overall accuracy of image classification
Pv = Total number of Classified NDVI pixels matched with the obtained reference pixels covered vegetated areas
Pnv = Total number of Classified NDVI pixels matched with the obtained reference pixels covered non-vegetated areas
RPT = Total number of reference pixels (vegetated and non-vegetated areas)
The obtained overall classification accuracy value was 96%. This indicates that the obtained results should be well representative of the reality for which the study was conducted.
5. Discussion and Conclusions
This study aimed to explore the potential of remote sensing technology to map the growth of vegetation involved in the restoration and recovery process of the Copper Basin, Tennessee. It was damaged by historic mining and smelting over a period of 40 years from 1977 through 2017. The obtained results clearly indicate that a time series analysis of NASA’s Landsat mission’s imagery can be used successfully to accomplish this. The Normalized Difference Vegetation Index (NDVI) along with the Iterative Self-Organizing Data Analysis Technique (ISODATA), and density slicing technique were found very useful to detect and map vegetation growth in the Copper Basin, Tennessee.
Some of the areas classified as non-vegetated land include impervious urban areas and water bodies that are used as settling ponds and artificial wetlands to treat acid mine drainage from the old shafts. For future research it would be prudent to classify those pixels as urban areas, water, etc., to get a more accurate representation of non-vegetated areas. The obtained results could be further spatially assessed to yield additional information. For example, spatially mapped mining and smelting activities, including shafts and tailings flats, could provide additional insight into the revegetation process.
The final thematic map generated shows when each part of the Copper Basin recovered, divided into 10-year periods. This could be divided into five-year periods using additional scenes and processing, which would provide an increase in temporal resolution of regrowth. Incorporation of higher spatial resolution imagery along with more sophisticated image processing algorithms could be useful for detecting the types vegetation in the revegetated areas.
This research could be combined with in-situ or remotely sensed water quality data of the Ocoee River, to determine if there is any correlation between the extent of denuded areas and downstream water quality. Upon request, the processed and analyzed data may be accessible from the authors for further extension of this study.
Remote sensing technology has been used successfully to study vegetation recovery processes related to both forest fire and mining-related incidents for many years. This study clearly demonstrates how the Landsat satellite mission can be used successfully to study the vegetation restoration and recovery process involving damage caused by historic mining and smelting operations for a significantly long time span (~40 years) as seen in the Copper Basin, Tennessee.
Author Contributions
R.B. acquired, processed, and analyzed all the satellite imagery. He also wrote most of the manuscript. A.K.M.A.H. supervised the research, wrote parts of the manuscript, revised the manuscript, and served as the corresponding author. All authors have read and agreed to the published version of the manuscript.
Funding
This research received no external funding.
Acknowledgments
Thanks are due to the USGS Global Visualization Viewer (GloVis) for providing the required satellite imagery for the study at no cost. Thanks are also due to the UTC Integrated Geospatial Laboratory (IGT Lab) and the UTC Geological and Environmental Remote Sensing Laboratory (GERS Lab) for providing access to geospatial software for this research.
Conflicts of Interest
The authors declare no conflict of interest.
References
- Seigworth, K.J. Ducktown—A postwar challenge. Am. For. 1943, 49, 521–523. [Google Scholar]
- Quinn, M.L. The Appalachian Mountains’ Copper Basin and the concept of environmental susceptibility. Environ. Manag. 1991, 15, 79–194. [Google Scholar] [CrossRef]
- Quinn, M.L. Industry and environment in the Appalachian Copper Basin, 1890–1930. Technol. Cult. 1993, 34, 575–612. [Google Scholar] [CrossRef]
- Wolt, J.D. Sulfate retention by acid sulfate-polluted soils in the Copper Basin area of Tennessee. Soil Sci. Soc. Am. J. 1981, 45, 283–287. [Google Scholar] [CrossRef]
- Emmons, W.H.; Laney, F.B. Geology and Ore Deposits of the Ducktown Mining District, Tennessee, United States Geological Survey Professional Paper 139; Government Printing Office: Washington, DC, USA, 1926; pp. 1–159.
- United States Department of Justice, Office of Public Affairs, Press Release 16–485. Available online: https://www.justice.gov/opa/pr/department-justice-and-epa-announce-50-million-settlement-clean-contamination-eastern (accessed on 7 November 2019).
- United States Environmental Protection Agency, Abandoned Mine Lands Innovative Technology Case Study. Available online: https://frtr.gov/costperformance/pdf/20070522_397.pdf (accessed on 8 November 2019).
- Harden, C.; Mathews, L. Rainfall response of degraded soil following reforestation in the Copper Basin, Tennessee, USA. Environ. Manag. 2000, 26, 163–174. [Google Scholar] [CrossRef]
- Tennessee Valley Authority. Available online: https://www.tva.gov/Environment/Environmental-Stewardship/Land-Management/The-Greening-of-Copper-Basin (accessed on 8 November 2019).
- Tennessee Valley Authority. Available online: https://www.tva.gov/About-TVA/Our-History/Built-for-the-People/The-Global-View (accessed on 7 November 2019).
- United States EPA Superfund Site: Copper Basin Mining District, Copperhill, TN. Available online: https://cumulis.epa.gov/supercpad/SiteProfiles/index.cfm?fuseaction=second.Cleanup&id=0406638 (accessed on 8 November 2019).
- Mathews, L.; Harden, C. 150 years of environmental degradation and reclamation in the Copper Basin, Tennessee. Southeast. Geogr. 1999, 39, 1–21. [Google Scholar] [CrossRef]
- Meng, R.; Dennison, P.E.; D’Antonio, C.M.; Moritz, M.A. Remote sensing analysis of vegetation recovery following short-interval fires in southern California shrublands. PLoS ONE 2014, 9, 1–12. [Google Scholar] [CrossRef] [Green Version]
- Shvetsov, E.G.; Kukavskaya, E.A.; Buryak, L.V.; Barrett, K. Assessment of post-fire vegetation recovery in Southern Siberia using remote sensing observations. Environ. Res. Lett. 2019, 14, 1–13. [Google Scholar] [CrossRef]
- Chu, T.; Guo, X. Remote sensing techniques in monitoring post-fire effects and patterns of forest recovery in boreal forest regions: A review. Remote Sens. 2014, 6, 470–520. [Google Scholar] [CrossRef] [Green Version]
- Almeida-Filho, R.; Shimabukuro, Y.E. Digital processing of a Landsat-TM time series for mapping and monitoring degraded areas caused by independent gold miners, Roraima State, Brazilian Amazon. Remote Sens. Environ. 2002, 79, 42–50. [Google Scholar] [CrossRef]
- Yang, Y.; Erskin, P.D.; Lechnerc, A.M.; Mulligan, D.; Zhang, S.; Wang, W. Detecting the dynamics of vegetation disturbance and recovery in surface mining area via Landsat imagery and LandTrendr algorithm. J. Clean. Prod. 2018, 178, 353–362. [Google Scholar] [CrossRef]
- Su, W.; Sun, Z.; Li, D.; Ramsankaran, R.; Zhu, X.; Guo, X. Vegetation recovery monitoring over the waste dump in Haizhou opencast coalmine area, China, during 1975–2000 using NDVI and VF index. J. Indian Soc. Remote Sens. 2009, 37, 631–645. [Google Scholar] [CrossRef]
- Nwadiolo, B.S. Morphological, Chemical, and Mineralogical Properties of Soils and the Effects of Acid Sulfate Weathering in the Copper Basin of Tennessee. Ph.D. Dissertation, University of Tennessee, Knoxville, TN, USA, 1982. [Google Scholar]
- Hursh, C.R. Local Climate in the Copper Basin of Tennessee as Modified by the Removal of Vegetation, Circular 774; U.S. Department of Agriculture: Washington, DC, USA, 1948; pp. 1–38.
- Rouse, J.W.; Haas, R.H.; Schell, J.A.; Deering, D.W. Monitoring vegetation systems in the Great Plains with ERTS. NASA Spec. Publ. 1974, 1, 309–317. [Google Scholar]
- Kriegler, F.; Malila, W.A.; Nalepka, R.F.; Richardson, W. Preprocessing, transformations, and their effects on multispectral recognition. In Proceedings of the Sixth International Symposium on Remote Sensing of Environment, University of Michigan, Ann Arbor, MI, USA, 13–16 October 1969; pp. 97–131. [Google Scholar]
- Hossain, A.; Easson, G. Predicting shallow surficial failures in the Mississippi River levee system using airborne hyperspectral imagery. Geomat. Nat. Hazard. Risk 2012, 3, 55–78. [Google Scholar] [CrossRef]
- Ahmed, M.R.; Hassan, Q.K.; Abdollahi, M.; Gupta, A. Processing of near real time land surface temperature and its application in forecasting forest fire danger conditions. Sensors 2020, 20, 984. [Google Scholar] [CrossRef] [PubMed] [Green Version]
- Boone, R.B.; Galvin, K.A.; Lynn, S.J. Generalizing El Nino effects upon Maasai livestock using hierarchical clusters of vegetation patterns. Photogramm. Eng. Remote Sens. 2000, 66, 737–744. [Google Scholar]
- Hassan, Q.K.; Rahman, K.M. Applicability of remote sensing-based surface temperature regimes in determining the deciduous phenology over boreal forest. J. Plant. Ecol. 2013, 6, 84–91. [Google Scholar] [CrossRef] [Green Version]
- Hassan, Q.K.; Bourque, C.P.-A. Spatial enhancement of MODIS-based images of leaf area index: Application to the boreal forest region of northern Alberta. Remote Sens. 2010, 2, 278–289. [Google Scholar] [CrossRef] [Green Version]
- Jensen, J.R. Introductory Digital Image Processing: A Remote Sensing Perspective, 3rd ed.; Prentice-Hall: Upper Saddle River, NJ, USA, 2004; pp. 1–544. [Google Scholar]
- Ahmed, M.R.; Hassan, Q.K.; Abdollahi, M.; Gupta, A. Introducing a new remote sensing-based model for forecasting forest fire danger conditions at a four-day scale. Remote Sens. 2019, 11, 2101. [Google Scholar] [CrossRef] [Green Version]
- Lillesand, T.M.; Kiefer, R.W. Remote Sensing and Image Interpretation, 4th ed.; John Willey and Sons, Inc.: Hoboken, NJ, USA, 2000; pp. 1–724. [Google Scholar]
- Afrin, S.; Gupta, A.; Farjad, B.; Ahmed, M.R.; Achari, G.; Hassan, Q.K. Development of land-use/land-cover maps using Landsat-8 and MODIS data, and their integration for hydro-ecological applications. Sensors 2019, 19, 4891. [Google Scholar] [CrossRef] [Green Version]
- Hossain, A.; Jia, Y.; Chao, X. Estimation of Manning’s roughness coefficient distribution for hydrodynamic model using remotely sensed land cover features. In Proceedings of the 17th International Conference on Geoinformatics 4 (IEEE), Fairfax, VA, USA, 12–14 August 2009; pp. 1–4. [Google Scholar]
- Hossain, A.; Easson, G. Mapping small reservoirs in semi-arid region using optical and microwave remote sensing. In Proceedings of the 2007 ASPRS Annual Conference, Tampa, FL, USA, 7–11 May 2007. [Google Scholar]
- Campbell, J.B. Introduction to Remote Sensing, 3rd ed.; Taylor and Francis: London, UK, 2002. [Google Scholar]
- Hall, J.; Hossain, A. Mapping urbanization and evaluating its possible impacts on stream water quality in Chattanooga, Tennessee, using GIS and remote sensing. Sustainability 2020, 12, 1980. [Google Scholar] [CrossRef] [Green Version]
Figure 1.
The location of the Copper Basin and the Ocoee River (referenced to Polk County and to the State of Tennessee).
Figure 1.
The location of the Copper Basin and the Ocoee River (referenced to Polk County and to the State of Tennessee).

Figure 2.
The time series of Landsat multispectral imagery used for the study of the Copper Basin at 10-year intervals from 1977 to 2017.
Figure 2.
The time series of Landsat multispectral imagery used for the study of the Copper Basin at 10-year intervals from 1977 to 2017.

Figure 3.
The summary of the overall methodology of the study.

Figure 4.
Normalized Difference Vegetation Index (NDVI) of the study site in the Copper Basin from 1977–2017 at 10-year intervals.
Figure 4.
Normalized Difference Vegetation Index (NDVI) of the study site in the Copper Basin from 1977–2017 at 10-year intervals.

Figure 5.
Classified Normalized Difference Vegetation Index (NDVI) imagery of the study site in the Copper Basin from 1977–2017 at 10-year intervals.
Figure 5.
Classified Normalized Difference Vegetation Index (NDVI) imagery of the study site in the Copper Basin from 1977–2017 at 10-year intervals.

Figure 6.
Area of vegetation within the study site, as determined from each year of Landsat imagery studied.
Figure 6.
Area of vegetation within the study site, as determined from each year of Landsat imagery studied.

Figure 7.
Classified time series analysis displaying during which 10-year period each part of the Copper Basin was revegetated. It also includes areas that were vegetated at the start of analysis in 1977, and still non-vegetated following the end of analysis in 2017.
Figure 7.
Classified time series analysis displaying during which 10-year period each part of the Copper Basin was revegetated. It also includes areas that were vegetated at the start of analysis in 1977, and still non-vegetated following the end of analysis in 2017.

Figure 8.
Calculated area of vegetation regrowth, as determined from Landsat imagery, within the study site in the Copper Basin over each 10-year period between 1977 and 2017 (note: color-coded to correspond with the map from Figure 7).
Figure 8.
Calculated area of vegetation regrowth, as determined from Landsat imagery, within the study site in the Copper Basin over each 10-year period between 1977 and 2017 (note: color-coded to correspond with the map from Figure 7).

Table 1.
Summary of Landsat imagery used for each selected date.
| Image Acquisition Date | Satellite Mission | Sensor Type | Spectral Bands | Wavelength (µm) | Spatial Resolution (m) |
|---|---|---|---|---|---|
| 18 July 1977 | Landsat 2 | Multispectral Scanner (MSS) | Green (B4) Red (B5) NIR (B6) | 0.5–0.6 0.6–0.7 0.7–0.8 | 60 |
| 26 July 1987 | Landsat 5 | Thematic Mapper (TM) | Blue (B1) Green (B2) Red (B3) NIR (B4) | 0.45–0.52 0.52–0.60 0.63–0.69 0.76–0.90 | 30 |
| 10 July 1997 | |||||
| 7 August 2007 | |||||
| 3 September 2017 | Landsat 8 | Operational Land Imager (OLI) | Blue (B2) Green (B3) Red (B4) NIR (B5) | 0.45–0.51 0.53–0.59 0.64–0.67 0.85–0.88 | 30 |
Table 2.
Threshold values for Normalized Difference Vegetation Index (NDVI) image classification.
| Year | Non-Vegetated Area | Vegetated Areas |
|---|---|---|
| 1977 | −0.236 to 0.254 | 0.255 to 0.663 |
| 1987 | −0.320 to 0.341 | 0.342 to 0.760 |
| 1997 | −0.474 to 0.394 | 0.395 to 0.812 |
| 2007 | −0.151 to 0.331 | 0.332 to 0.709 |
| 2017 | −0.199 to 0.232 | 0.233 to 0.650 |
Table 3.
Total extent of area with vegetation and without vegetation, sorted by year of image acquisition.
Table 3.
Total extent of area with vegetation and without vegetation, sorted by year of image acquisition.
| Year of Image Acquisition | Area Vegetated (km2) | Area without Vegetation (km2) |
|---|---|---|
| 1977 | 39.86 | 38.48 |
| 1987 | 53.82 | 24.34 |
| 1997 | 69.67 | 8.69 |
| 2007 | 72.03 | 6.49 |
| 2017 | 76.08 | 2.46 |
Table 4.
Accuracy assessment data.
| Reference Pixels | Classified NDVI Pixels | Total Pixels | |
|---|---|---|---|
| Vegetated Area | Non-Vegetated Area | ||
| Vegetated Area | 50 | 0 | 50 |
| Non-vegetated Area | 4 | 46 | 50 |
| Total | 54 | 46 | 100 |
© 2020 by the authors. Licensee MDPI, Basel, Switzerland. This article is an open access article distributed under the terms and conditions of the Creative Commons Attribution (CC BY) license (http://creativecommons.org/licenses/by/4.0/).
Share and Cite
MDPI and ACS Style
Blanton, R.; Hossain, A.K.M.A. Mapping the Recovery Process of Vegetation Growth in the Copper Basin, Tennessee Using Remote Sensing Technology. GeoHazards 2020, 1, 31-43. https://0-doi-org.brum.beds.ac.uk/10.3390/geohazards1010004
AMA Style
Blanton R, Hossain AKMA. Mapping the Recovery Process of Vegetation Growth in the Copper Basin, Tennessee Using Remote Sensing Technology. GeoHazards. 2020; 1(1):31-43. https://0-doi-org.brum.beds.ac.uk/10.3390/geohazards1010004
Chicago/Turabian StyleBlanton, Richard, and A.K.M. Azad Hossain. 2020. "Mapping the Recovery Process of Vegetation Growth in the Copper Basin, Tennessee Using Remote Sensing Technology" GeoHazards 1, no. 1: 31-43. https://0-doi-org.brum.beds.ac.uk/10.3390/geohazards1010004