Article

Multiscale Quantification of Tsunami Hazard Exposure in a Pacific Small Island Developing State: The Case of Samoa

1
National Institute of Water and Atmospheric Research (NIWA), Christchurch 8011, New Zealand
2
School of Geography, Environment and Geosciences, University of Portsmouth, Portsmouth, Hampshire PO1 2UP, UK
3
Ascot Underwriting Ltd., London EC3M 3BY, UK
4
Disaster Management Office, Ministry of Natural Resources and Environment, Apia WS1339, Western Samoa
5
Project Unit, Samoa Green Climate Fund Project, Ministry of Finance, Apia WS1339, Western Samoa
6
GNS Science, Lower Hutt 5011, New Zealand
*
Author to whom correspondence should be addressed.
Submission received: 9 April 2021 / Revised: 3 May 2021 / Accepted: 10 May 2021 / Published: 11 May 2021
(This article belongs to the Special Issue Modelling and Numerical Simulation of Tsunami)

Abstract

:
This study presents a scenario-based approach for identifying and comparing tsunami exposure across different sociopolitical scales. In Samoa, a country with a high threat to local tsunamis, we apply scenarios for the 2009 South Pacific tsunami inundation at different grid resolutions (50 and 10 m) to quantify building and road exposure at the national, district and village levels. We show that while the coarser 50 m model is adequate for use in the rapid identification of exposure at the national and district levels, it can overestimate exposure by up to three times more at the village level. Overestimation typically occurs in areas characterized by flat, low-lying, gentle-rising terrain. Overall, a 35% increase in buildings exposed to the 50 m model is observed compared with the 10 m scenario on southeast Upolu island. Similarly, a 31% increase in road exposure is observed for the 50 m scenario. These observations are discussed within the context of tsunami evacuation planning and logistics. Notwithstanding the variability in exposure, a precautionary approach leads us to conclude that while higher-resolution models are recommended where available data and/or financial resources permit, the absence of such datasets should not preclude the use of coarser hazard datasets in risk assessments. Finer-resolution models provide more credence in detailed local-level exposure evaluation. While the results of this study are specific to the Samoan context, the results can be applied to the multiscale assessment of tsunami risk exposure in similar hazard contexts.

1. Introduction

Tsunami hazard and risk assessments provide crucial decision-support tools to inform disaster resilience in coastal locations, particularly in the context of preparedness, evacuation and land-use planning [1,2,3,4,5,6]. Indeed, with global tsunami-related casualties and damages estimated to be one hundred times greater between 1998 and 2017 compared to the preceding 20 year period, due largely to the 2004 Indian Ocean and 2011 Tohoku-oki tsunamis [7], the need for hazard risk information in tsunami-prone regions is essential (e.g., [8,9]).
In the Small Island Developing States (SIDS) of the Pacific, tsunami resilience planning is guided by the Framework for Resilient Development in the Pacific (FRDP) [10]. Aligned with the Sendai Framework for Disaster Risk Reduction 2015–2030 (SFDRR) [3], the FRDP provides recommendations on integrative approaches to address climate change and disaster risk management within Pacific Island country contexts. This includes enhancing adaptative capacity and resilience to tsunami hazards.
A significant proportion of SIDS populations and business hubs in the central Pacific are in coastal low-lying areas which are vulnerable to the impacts of tsunamis [10]. This was clearly demonstrated by the 2009 South Pacific tsunami (SPT) which impacted the Independent State of Samoa (herein Samoa) [11,12,13,14], causing widespread loss of life and infrastructure damage along the southern shores of Upolu and Savaii islands [15,16,17,18,19] (Figure 1). While planning tools to support tsunami resilience in Samoa have been developed, such as identifying evacuation and hazard mitigation zones (e.g., [20,21]), these were purposefully designed to be conservative and derived using relatively coarse datasets. Consequently, they may not necessarily be representative of onshore hazard risk characteristics at local village levels.
Similarly, detailed exposure data representing built environments is limited in Pacific SIDS. The distribution of built elements, particularly buildings and roads for example, provide useful indicators for population clusters (e.g., [19]). Building and road exposure to the physical characteristics of tsunamis (e.g., flow depth, extent, distance from coast, shielding) can support the identification of vulnerable clusters or ‘risk hotspots’ (e.g., [8]), whereby mitigation and risk reduction strategies could be targeted (e.g., identifying compromised structures and routes where evacuation might be impeded).
In general, there is a dearth in country specific tsunami hazard and exposure information to inform coastal risk management and preparedness planning in Pacific SIDS. However, tsunami inundation and runup characteristics along with exposure and vulnerability data are key requirements in the risk quantification process (e.g., [22]). This would enable the comparison of risk characteristics between communities and the identification of areas where prevention and/or adaptation interventions should be prioritized.
The aim of this study is to quantify and assess the influence which tsunami inundation model resolution has on multiscale exposure distributions of built elements at risk. We apply representations of the 2009 SPT hydrodynamic model developed in [14], as well as digital representations of buildings and roads to quantify risk exposure distributions across multiple sociopolitical levels. The key objectives are to: (1) apply a scenario-based approach to assess building and road exposure to model 2009 SPT inundation at 50 and 10 m grid resolution as developed by [14]; and (2) to demonstrate the influence of inundation model resolution on exposure distributions at national, district, and village levels, and how these can support preparedness planning. We discuss the suitability of model resolution in rapid tsunami risk exposure analysis as well as the implications of our findings within the context of tsunami preparedness and evacuation planning.

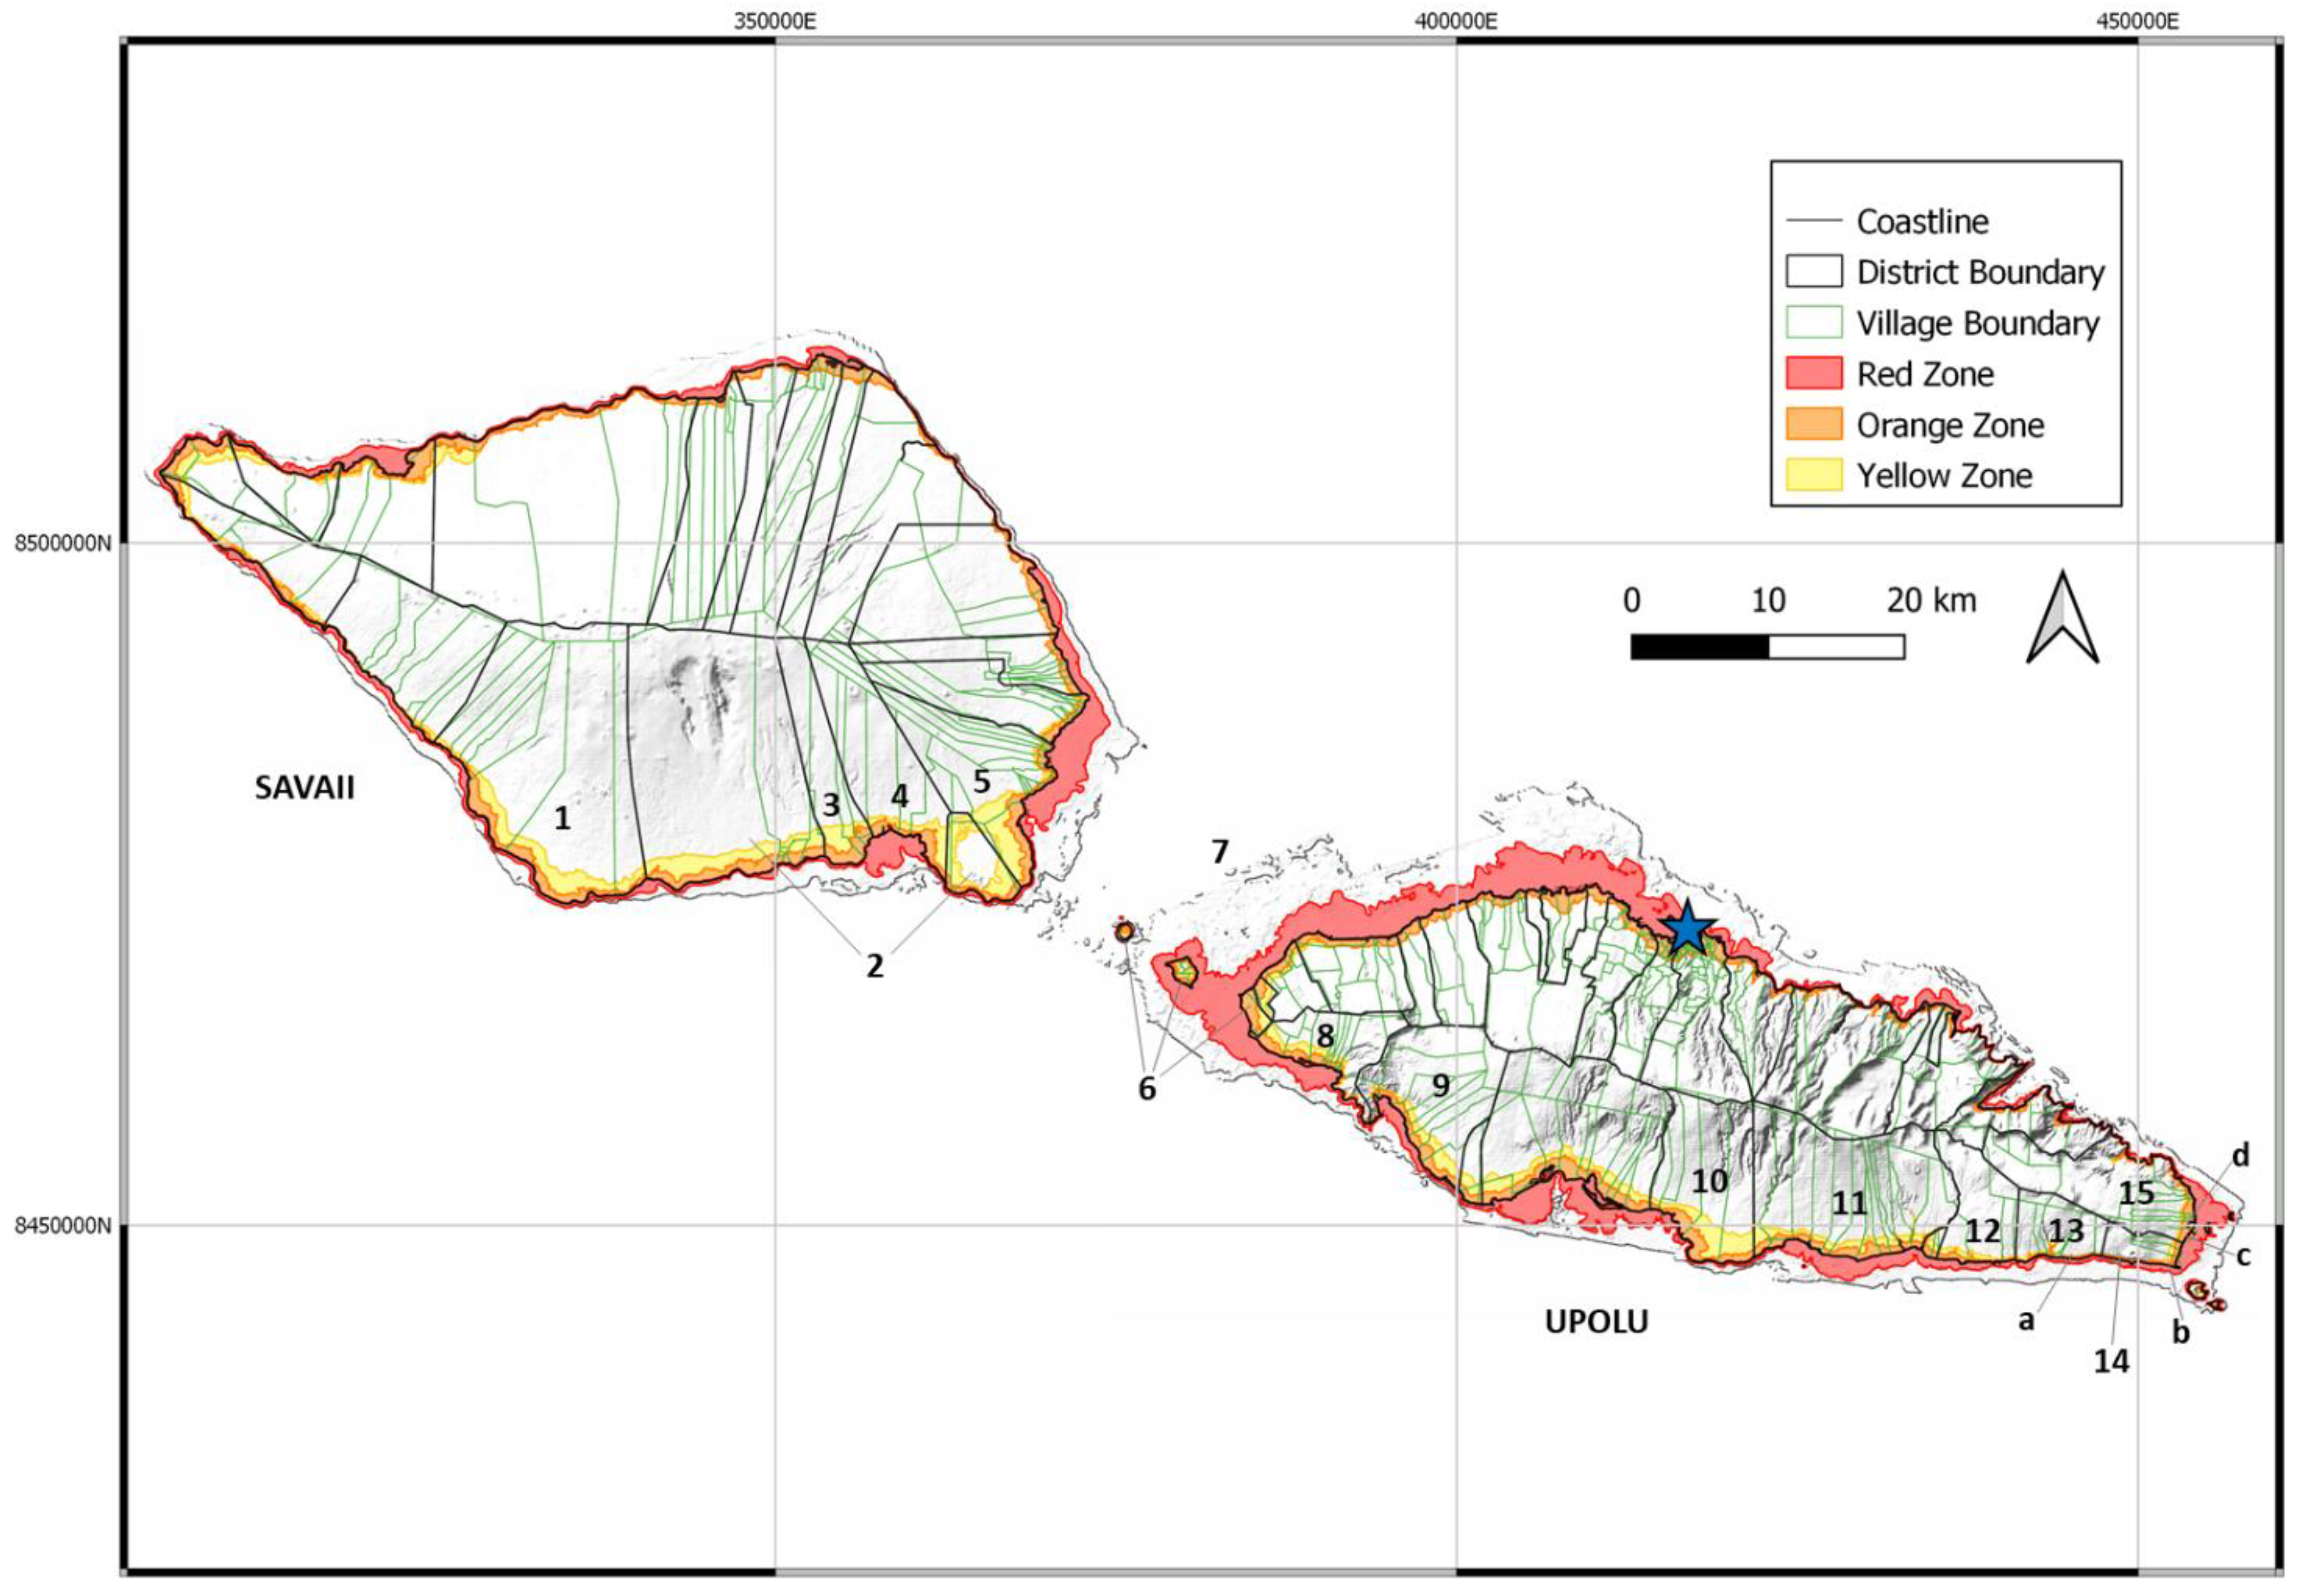
2. Study Location and Tsunami Hazard Context

Samoa is located between 13°–15° S and 171°–173° W and has a population of approximately 200,000 spread across 41 districts comprising 310 villages [23,24]. The capital, Apia, comprises approximately 18% of the population and is located in north Upolu island, itself containing close to 75% of the total population. Salelologa in the Faasaleleaga-I district is the central business area on Savaii island to the west.
Given that approximately 70% of Samoa’s total population and human environments are within coastal zones, the threats to inundation-related hazards, which includes tsunami, are extreme [25,26]. This was emphasized by the 2009 SPT which originated from a Mw 8.1 earthquake sequence involving complex near-simultaneous normal and reverse faulting at the Northern Tonga Trench (NTT) [11,12,27]. The 2009 SPT represents a maximum likely local event and was the second most devastating disaster in this region over the preceding century in terms of loss of life and trauma, i.e., second only to the 1918 influenza pandemic disaster [28]. While Samoa is known to have experienced far-field tsunamis such as that from the 1960 Valdivia event [29], the overall threat to safety from far-field tsunamis is much lower compared with local events which can impact the shores of Samoa in less than 20 min (e.g., [14,30]).
Recent studies have revealed an apparent long-term local tsunami hazard in Samoa associated with the NTT source region [31]. Indeed, the most recent predecessor to the 2009 SPT was the 1917 Mw 8.3 Samoa–Tonga earthquake and tsunami, which is known to have inundated the southern coasts of Savaii and Upolu [28,32] (Figure 1). Detailed historical records on the built environment’s damage and loss of life from the 1917 event are scant (e.g., [28,31]). Available sedimentary and anecdotal evidence suggests that inundation was more geographically widespread than the 2009 SPT, extending west from Falealupo on Savaii eastward to Lalomanu on Upolu (e.g., [31]). However, there does not appear to be evidence of impacts comparable to the magnitude of the devastation experienced due to the 2009 event, which was focused on southeast Upolu. Nevertheless, both the 2009 and 1917 events reinforce the high hazard potential posed by tsunamis sourced at the NTT, providing analogies to inform and assist with planning.
In 2011, tsunami evacuation zones were developed for Samoa [20], providing baselines to identify built features that are located in areas which could be inundated in a tsunami event and which might require a rapid evacuation response. These zones are characterized as red, orange and yellow and denote areas at potential threat to varying levels of hazard risk. For example, the yellow zone denotes the maximum area at potential threat to tsunami inundation after a strongly-felt (or ‘local’) earthquake, while the orange zone encompasses areas believed to be at risk following regional/distant earthquakes which are not locally felt. On the other hand, the red zone denotes areas at potential threat to small tsunami which might only pose a marine threat (e.g., strong hazardous currents).
Such tools can support the identification and setting of risk reduction objectives in local mitigation and resilience planning (e.g., identifying evacuation routes and safe centres, or critically exposed locations and assets) [2,33,34,35]. These zones were developed using conservative attenuation-based (‘bath-tub’) models and are largely based on coarse elevation models (e.g., 90 m Shuttle Radar Topography Mission (SRTM) or greater), apart from Apia and Faleolo airport, which were the only locations with onshore Light Detection and Ranging (LiDAR) data at the time. The recent acquisition of 1 and 5 m gridded LiDAR topography and near-shore bathymetry for the whole of Samoa [36] now enables the development of more detailed hazard and risk assessments. For example, the work presented in [14] provides a characteristic set of 2009-type tsunami analogies (or hazard models), which can be applied to scenario-based exposure assessments (e.g., [37,38,39]), a key focus of this study.

3. Methods and Data

The components of the exposure model assessment approach used in this study are described in three sections. The tsunami inundation layers representing the ‘hazard’ component in the analysis are outlined in Section 3.1. The ‘exposure’ data layers capturing the distribution of buildings and roads in coastal areas are described in Section 3.2, with the exposure analysis framework described in Section 3.3.

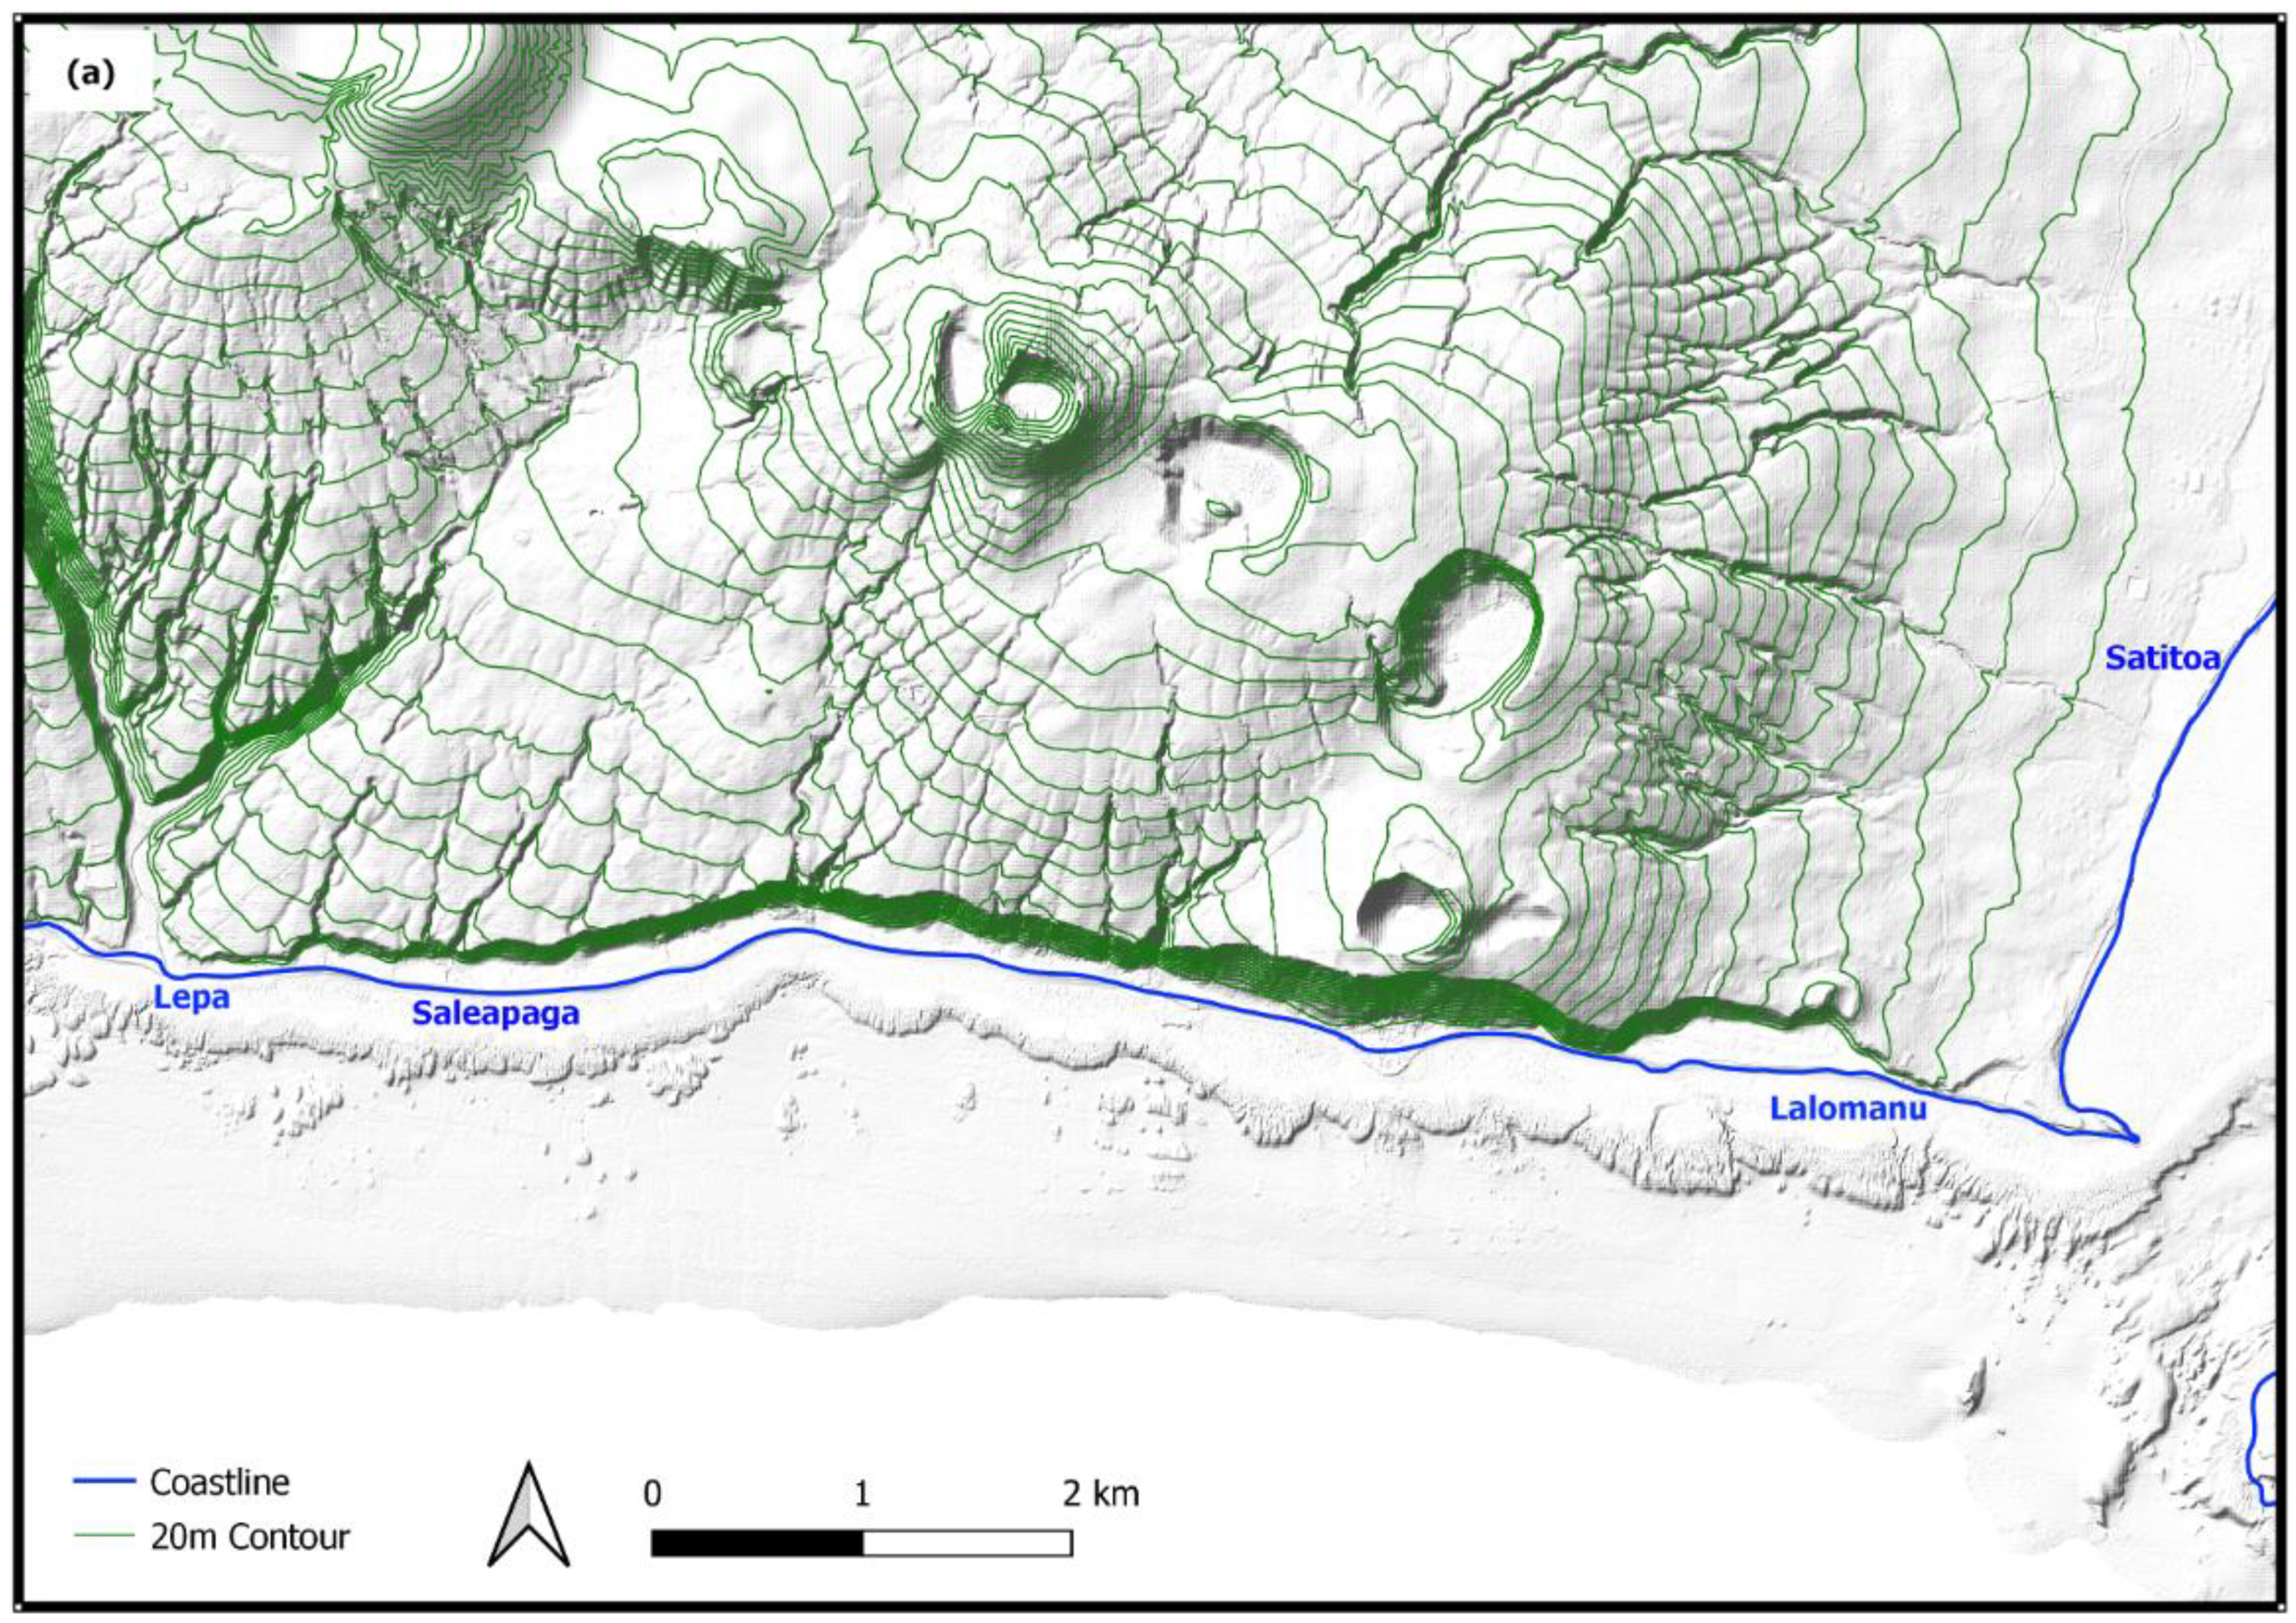
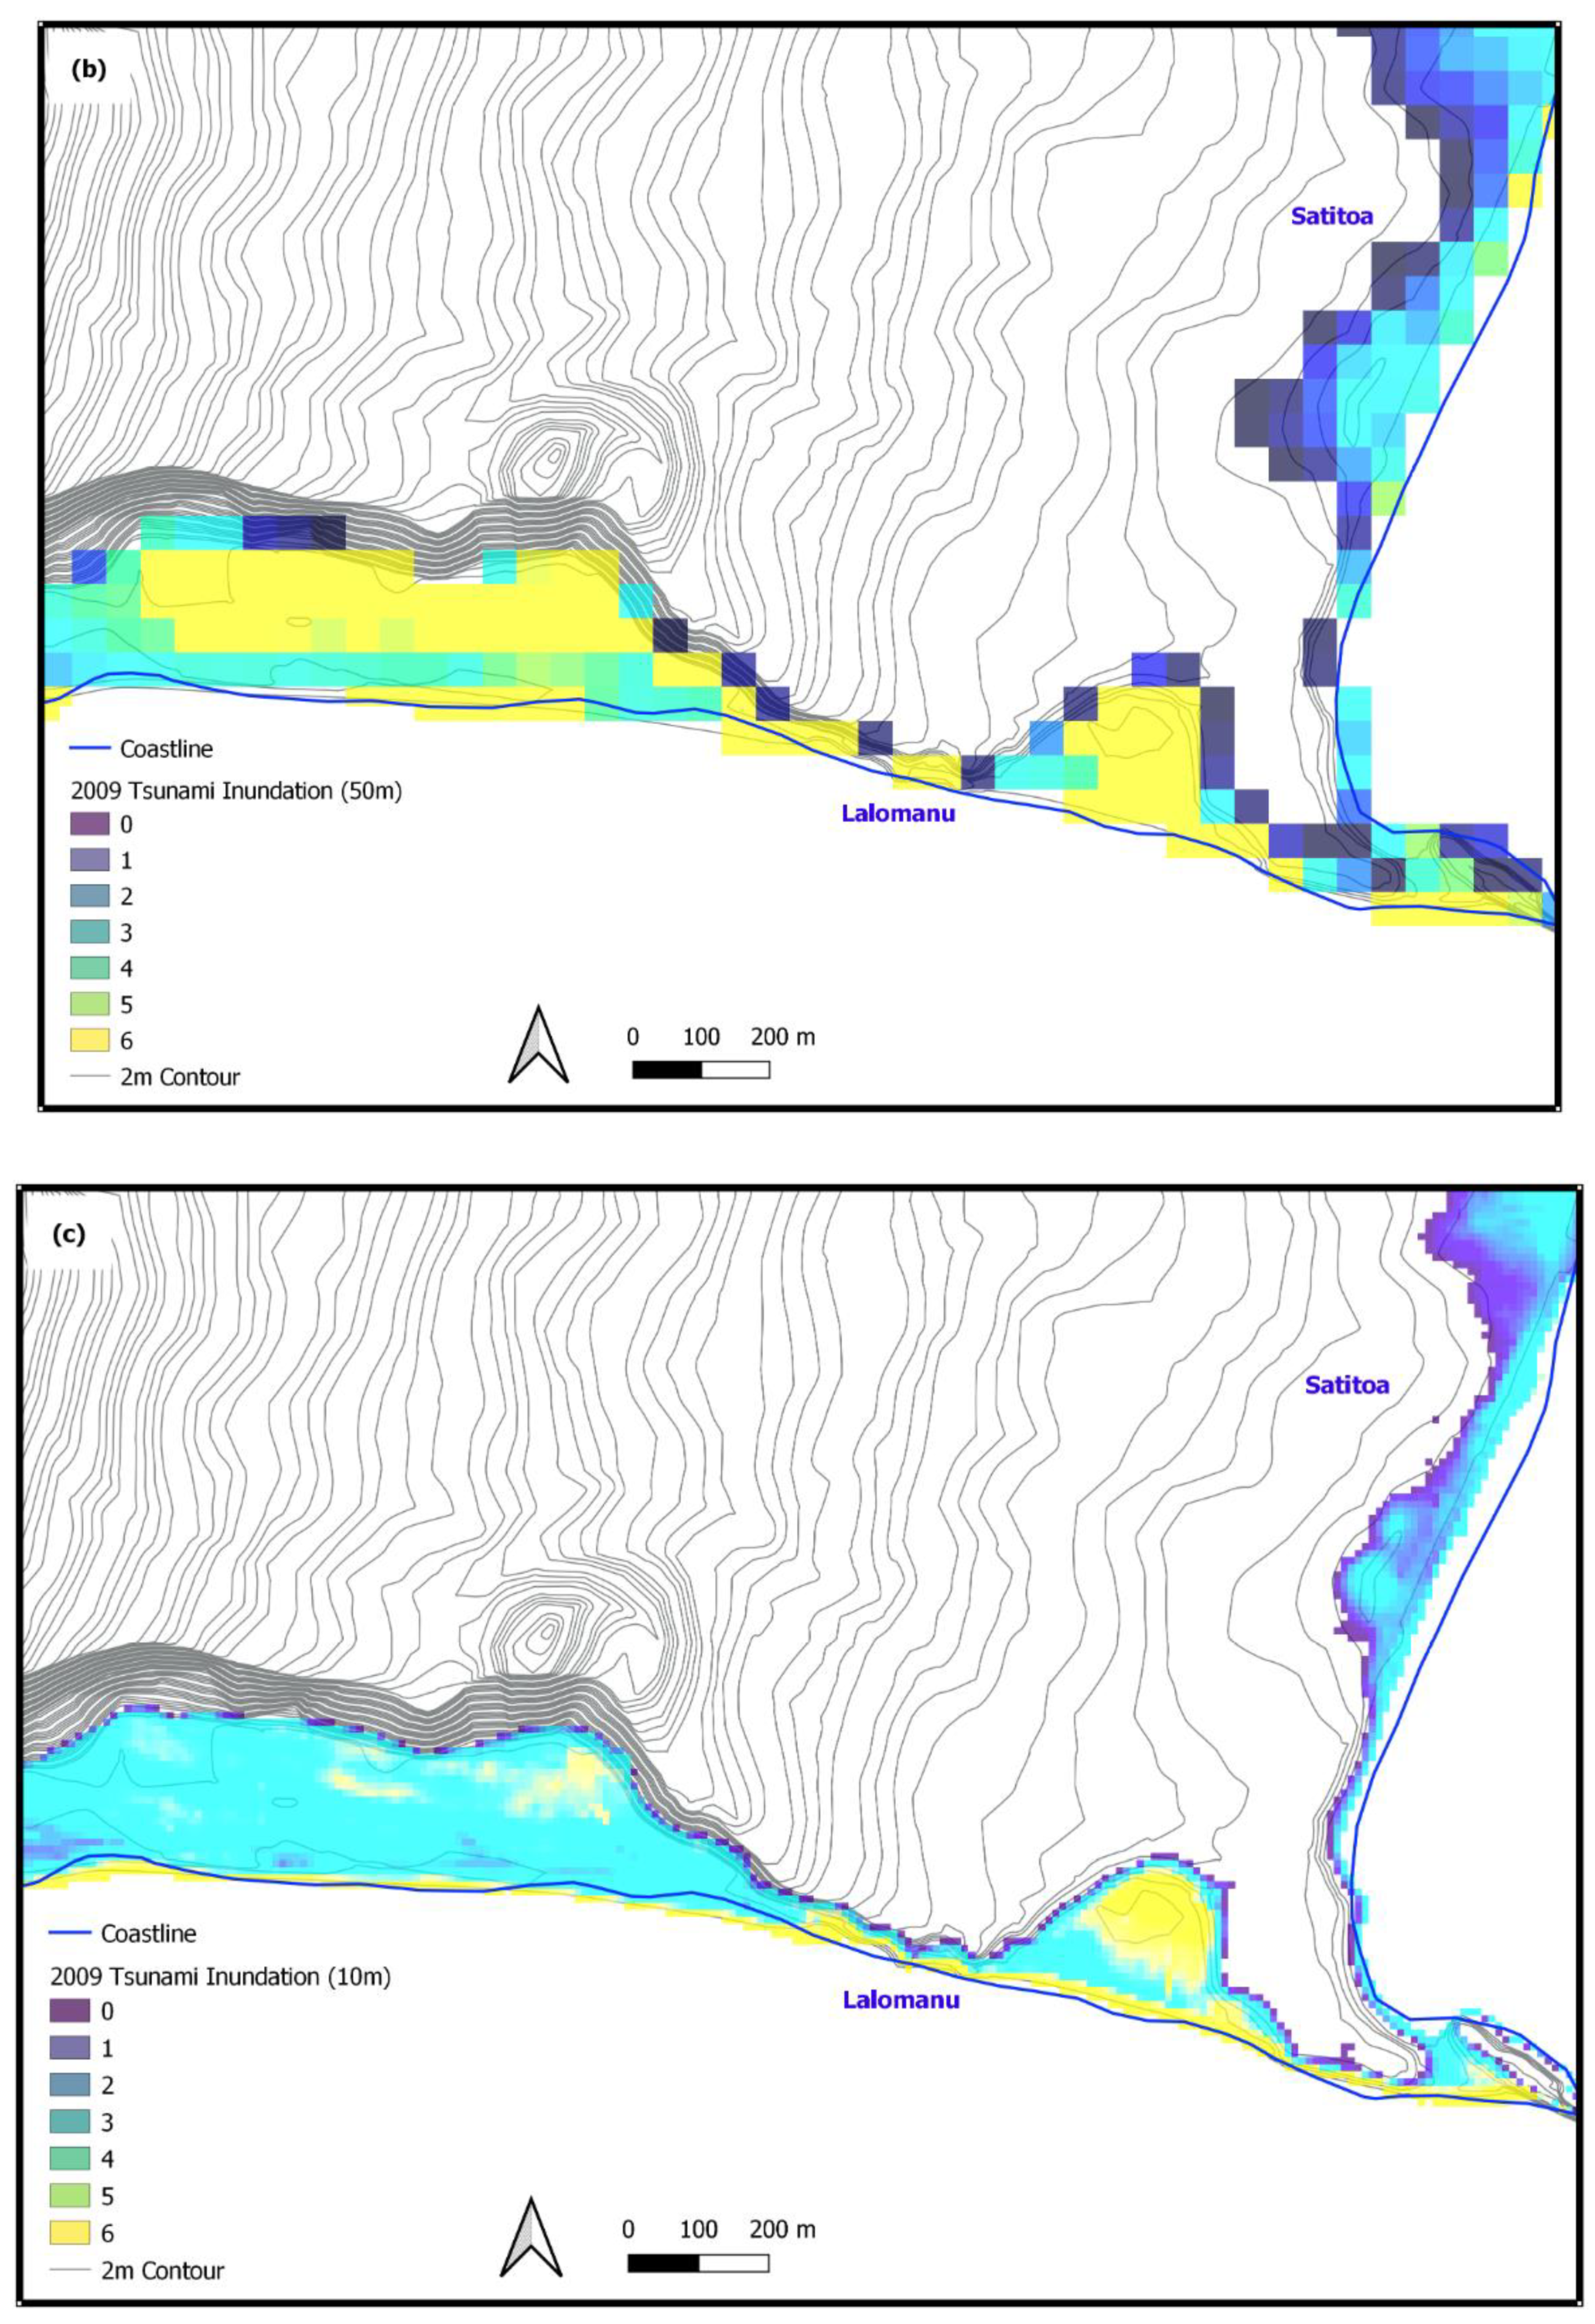
3.1. Tsunami Hazard Layers

Numerical models for the 2009 SPT inundation in Upolu and Savaii [14] provide a characteristic set of maximum likely local event scenarios to quantify and compare the exposure characteristics at different sociopolitical levels. The models developed in [14] were simulated using BG-Flood (Block-adaptive on Graphics processing unit Flood model) [40]. BG-Flood was configured with a nested grid scheme to simulate tsunami initiation from the near-simultaneous earthquake sequence through to propagation and inundation. LiDAR topography and nearshore bathymetry with a spatial grid resolution of 5 m [36], provided the digital elevation model (DEM) used in simulating the inundation and runup.
Twenty-three scenarios of maximum runup and inundation were the output for the whole country at 50 m grid resolution, with thirty-four scenarios output at 10 m grid resolution for southeast Upolu. The individual scenarios represent the range of different proposed source configurations available in the published literature as synthesized by [14]. Each scenario differed in terms of slight variations to the source parameters such as rise time and rupture dimensions, with a uniform quadratic bottom roughness (cf = 0.0001) applied for the 50 m inundation grid. A spatially variable roughness formulation was applied to the higher-resolution 10 m inundation grid, whereby a high roughness length (z0 = 0.01 m) was applied to all areas higher than 15 m below mean sea level, which included coral reefs as well as onshore built and vegetation features [14]. A low roughness length (z0 = 0.0001 m) was used for all other areas lower than 15 m below mean sea level [14]. Since the 50 m model results were used to force the 10 m model (i.e., nested grid scheme), the tsunami waveform is quite similar in both grids. The main difference between the two model suites are due to roughness, as well as topographic representation which denotes the average elevation over each grid cell.
Model outputs of inundation extent and flow depth in digital raster format for both the 10 and 50 m resolution models showed good agreements between modelled-to-observed tsunami water level records (e.g., DART buoys and Apia Tide Gauge), as well as physical observations of runup and inundation (e.g., [14,16,17,41,42]). The maximum envelope for all 23 inundation scenarios at 50 m resolution provided the hazard layer for the whole country, with maximum flow depth providing the intensity parameter in the exposure analysis. For southeast Upolu, the maximum envelope and associated flow depths for all 34 inundation scenarios at 10 m resolution was used (Figure 2).
Using the maximum envelope for both the 50 and 10 m resolution model suites was necessary for the purposes of this study to provide an overall, albeit conservative, representation of the 2009 SPT hazard given that no single scenario adequately produced consistent modelled-to-observed matches between the DART buoys, tide gauge, and runup) [14]. In addition, the tsunami evacuation zones developed in [20] were used as a benchmark for identifying and comparing built features located on land which could potentially be exposed to inundation associated with a range of potential tsunamigenic sources.

3.2. Buildings, Roads and Sociopolitical Boundary Layers

The sum of building and road features used in the analysis are shown in Table 1. Buildings at risk to tsunami comprised of an amalgamated dataset based on: (1) the 2009 building outlines for the Apia area obtained from the Pacific Catastrophe and Risk Financing Initiative (PCRAFI) database; (2) Open Street Maps (OSM) building outlines for the rest of the country (current as of October 2020); and (3) manually digitized/updated buildings outlines based on 2020 Google satellite imagery. A composite of these datasets was required for the optimal coverage of the whole country, as no single dataset adequately captured the full distribution of buildings in Samoa. For example, the PCRAFI dataset covers the Apia urban area only, with the OSM data covering much of rural Samoa, but not Apia. Manual digitization and/or updating of coastal building outlines located within the maximum envelope of the 50 m resolution tsunami model was carried out using the QGIS 3.10.4 package using similar digitization techniques as presented in [19]. Physical attributes of building shape/outline and location were assigned. Importantly, the exposure analysis considers all building types without compartmentalization into specific typologies and/or use categories. This is due to the difficulties in assigning such attributes remotely without ground-truthing.
A road centerline dataset incorporating the physical attributes of length and location was obtained from the OSM database (accessed in October 2020). These were visually checked for consistency with Google satellite imagery and then split into 10 m road lengths using the split-by-distance function in QGIS 3.10.4. Buildings and roads, respectively, were spatially joined to district and village boundary polygons obtained from the Samoa Ministry of Natural Resources and Environment (MNRE). This enabled individual features to be labelled with the districts and villages corresponding to their physical location.

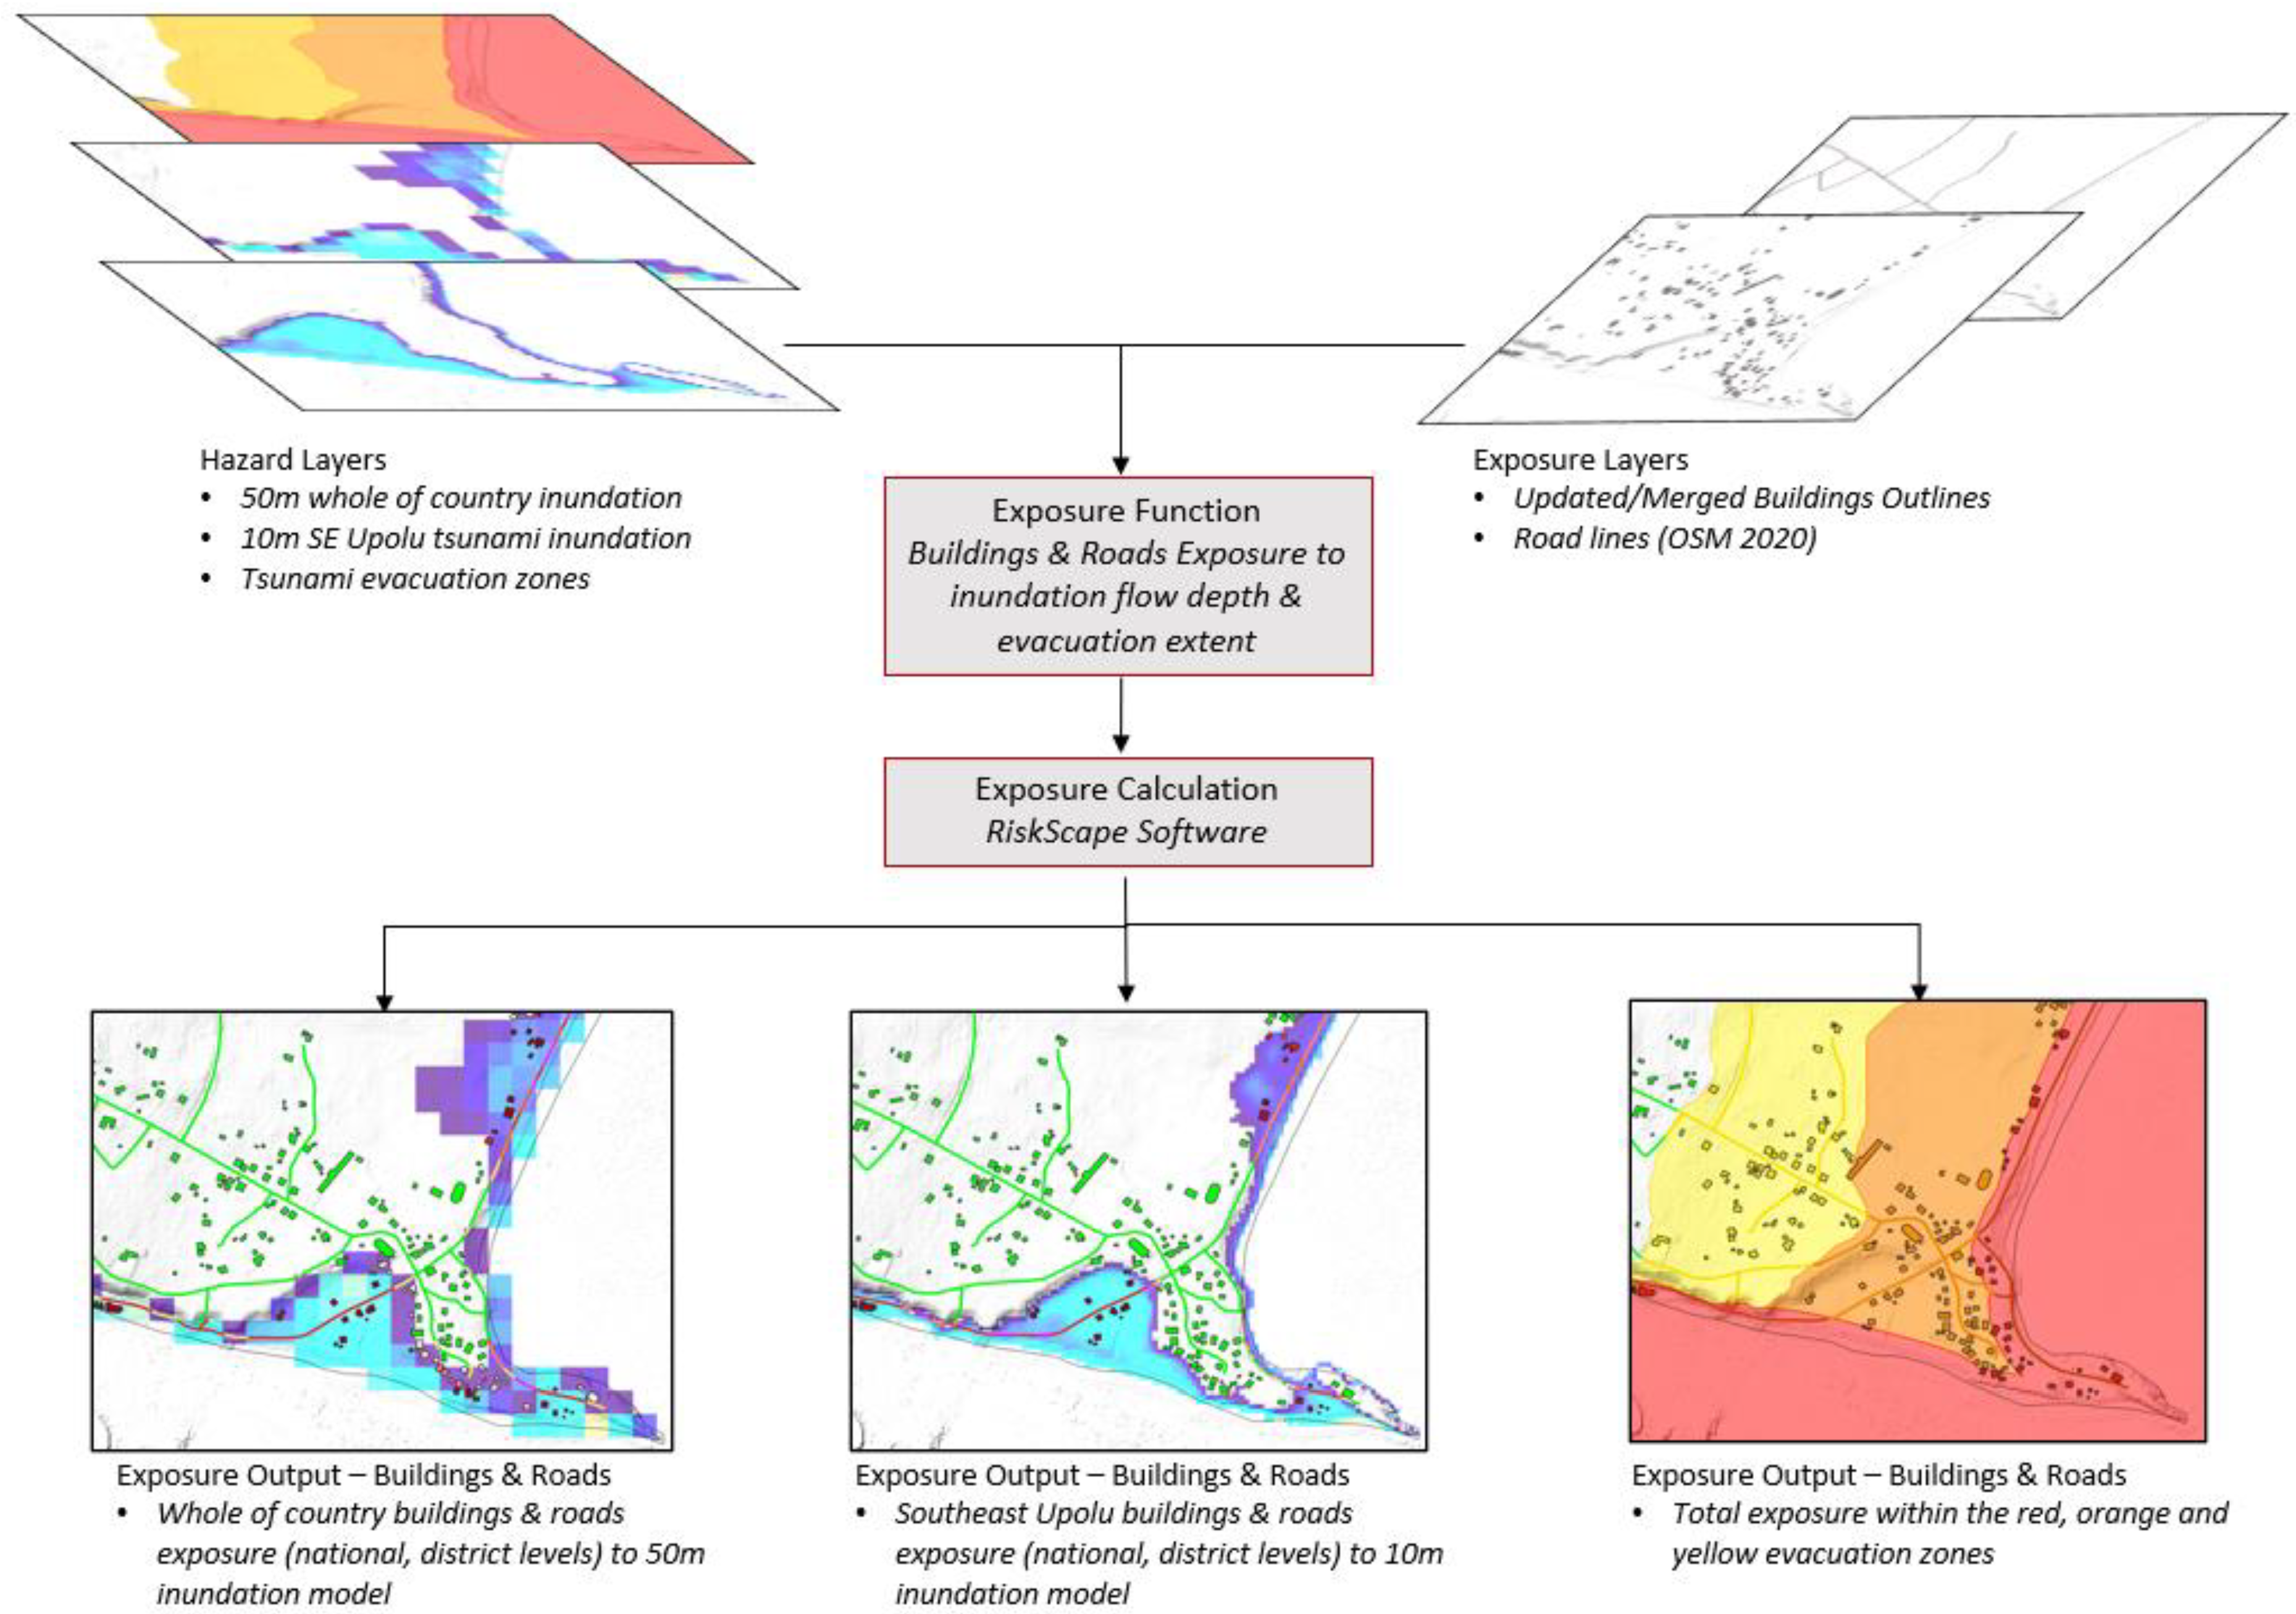
3.3. Exposure Analysis

The natural hazards impact and loss modelling software, RiskScape [22] was configured to enumerate building and road exposure to tsunami flow depths for both the 10 and 50 m resolution model representations (Figure 3). RiskScape has been applied in several tsunami exposure and impact analyses in Samoa and internationally (e.g., [6,19]). In this study, the RiskScape framework combines hazard intensity (e.g., flow depth), with building and road exposure information to determine the spatial distribution of tsunami hazard exposure. Flow depth increments of 0.5 m ranging from 0.0 to >3.0 m were defined. Buildings and roads intersecting inundated grid-cells were classed as exposed (i.e., grid cell > 0.0 m flow depth). Building and road exposure were enumerated at 0.5 m incremental flow depths at national, district and village levels. While higher resolution increments (e.g., 0.1 m) can particularly be useful for land-use or mitigation planning, the results are presented in 0.5 m increments which denote a minimum likely threshold, whereby evacuation potential begins to be severely compromised (e.g., [44,45]). Features/clusters exposed to >1.0 m flow depth are typically indicative of critical areas, whereby evacuation potential is mostly fully compromised (e.g., [44,45]). In addition, the sum of the buildings and road features exposed within the tsunami evacuation zones is presented for comparison for the 50 and 10 m scenarios for the 2009 SPT.

4. Results and Interpretations

Our results are presented in four sections: (1) national- or island-level overview of the total exposure of buildings and roads to the 2009 SPT scenario relative to the total number of buildings/roads within the tsunami evacuation zones; (2) district-level exposure based on the 50 m grid tsunami inundation; (3) village-level exposure based on the 10 m grid tsunami inundation; and (4) comparisons of district- and village-level exposure for 50 and 10 m inundation grids.

4.1. National Building and Road Exposure

A total of 12,040 buildings are located within the inundation extent of the 50 m grid tsunami model, of which approximately 74% are located on Upolu (which also includes Manono island in the Aiga o le Tai district) (Table 2). In comparison, 25,483 buildings are located within the maximum extent of all tsunami evacuation zones; approximately 111% greater than the number of buildings exposed in the 2009 scenario. Savaii has a slightly greater proportion of buildings within the tsunami evacuation zones (51%) compared to Upolu, and approximately 314% more buildings within evacuation zones compared to the total number exposed in the 2009 scenario.

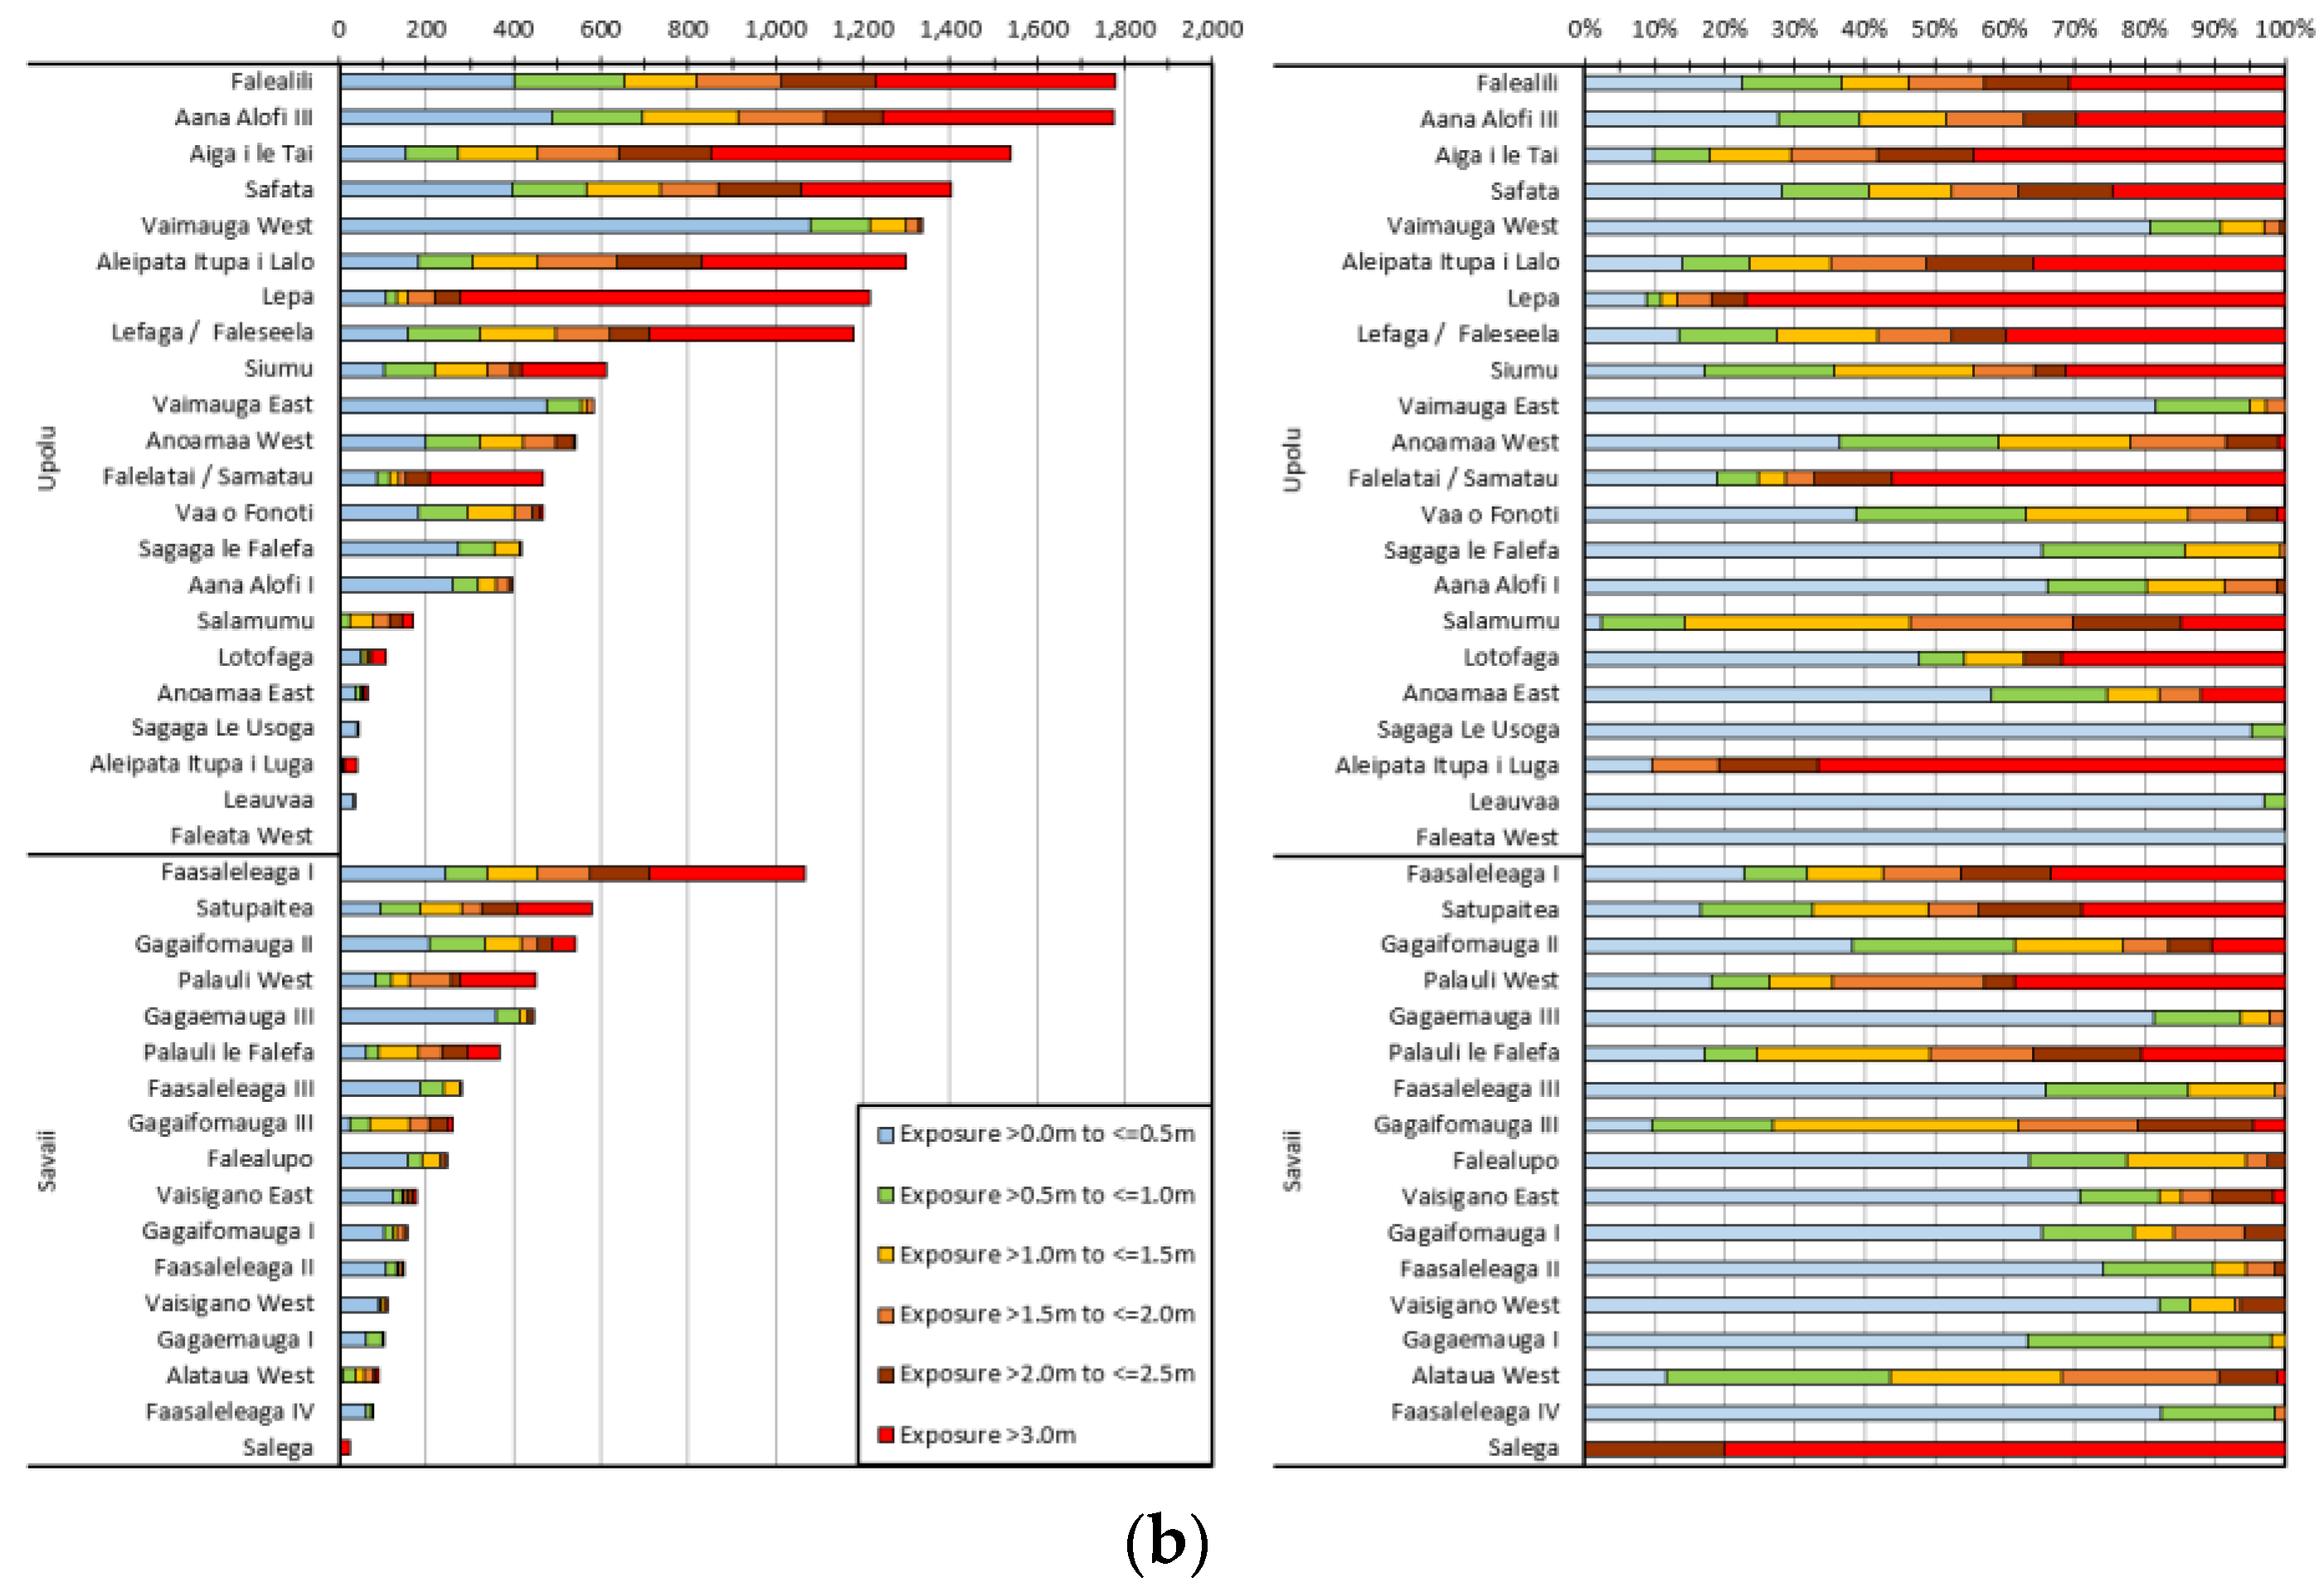
4.2. District Building and Road Exposure

The distribution of buildings exposed to different flow depths within each district using the 50 m grid inundation model are shown in Figure 4a. The Aiga I le Tai and Falelatai/Samatau districts in southwest Upolu exhibit the greatest numbers of exposed buildings. These districts, along with Lefaga/Faleseela and Siumu in south central Upolu, and Falealili, Lotofaga, Lepa and Aleipata Itupa I Lalo in southeast Upolu, exhibit the highest proportionate exposure distributions relative to the total number of exposed buildings per district. That is, >80% of the total building exposure in each of these districts is exposed to flow depths of more than 0.5 m. On Savaii, districts located in the southeast have the greatest numbers of exposed buildings, with >80% of the total number of buildings exposed in Palauli East, Palauli West, Palauli i le Falefa, and Satupiatea subjected to flow depths >0.5 m.
Districts on Upolu showing the longest lengths of exposed roads include Falealili in the southeast of the island, followed by Aana Alofi III and Aiga I le Tai in the southwest (Figure 4b). In several districts along Upolu’s south coast, >80% of the exposed road lengths are at risk to flow depths >0.5 m, with >90% at risk in Lepa. On Savaii, districts located on the southeast of the island in general exhibit the longest lengths of exposed roads. Faasaleleaga-I has the longest length of exposed roads, with between 75 and 80% exposed to flow depths >0.5 m.

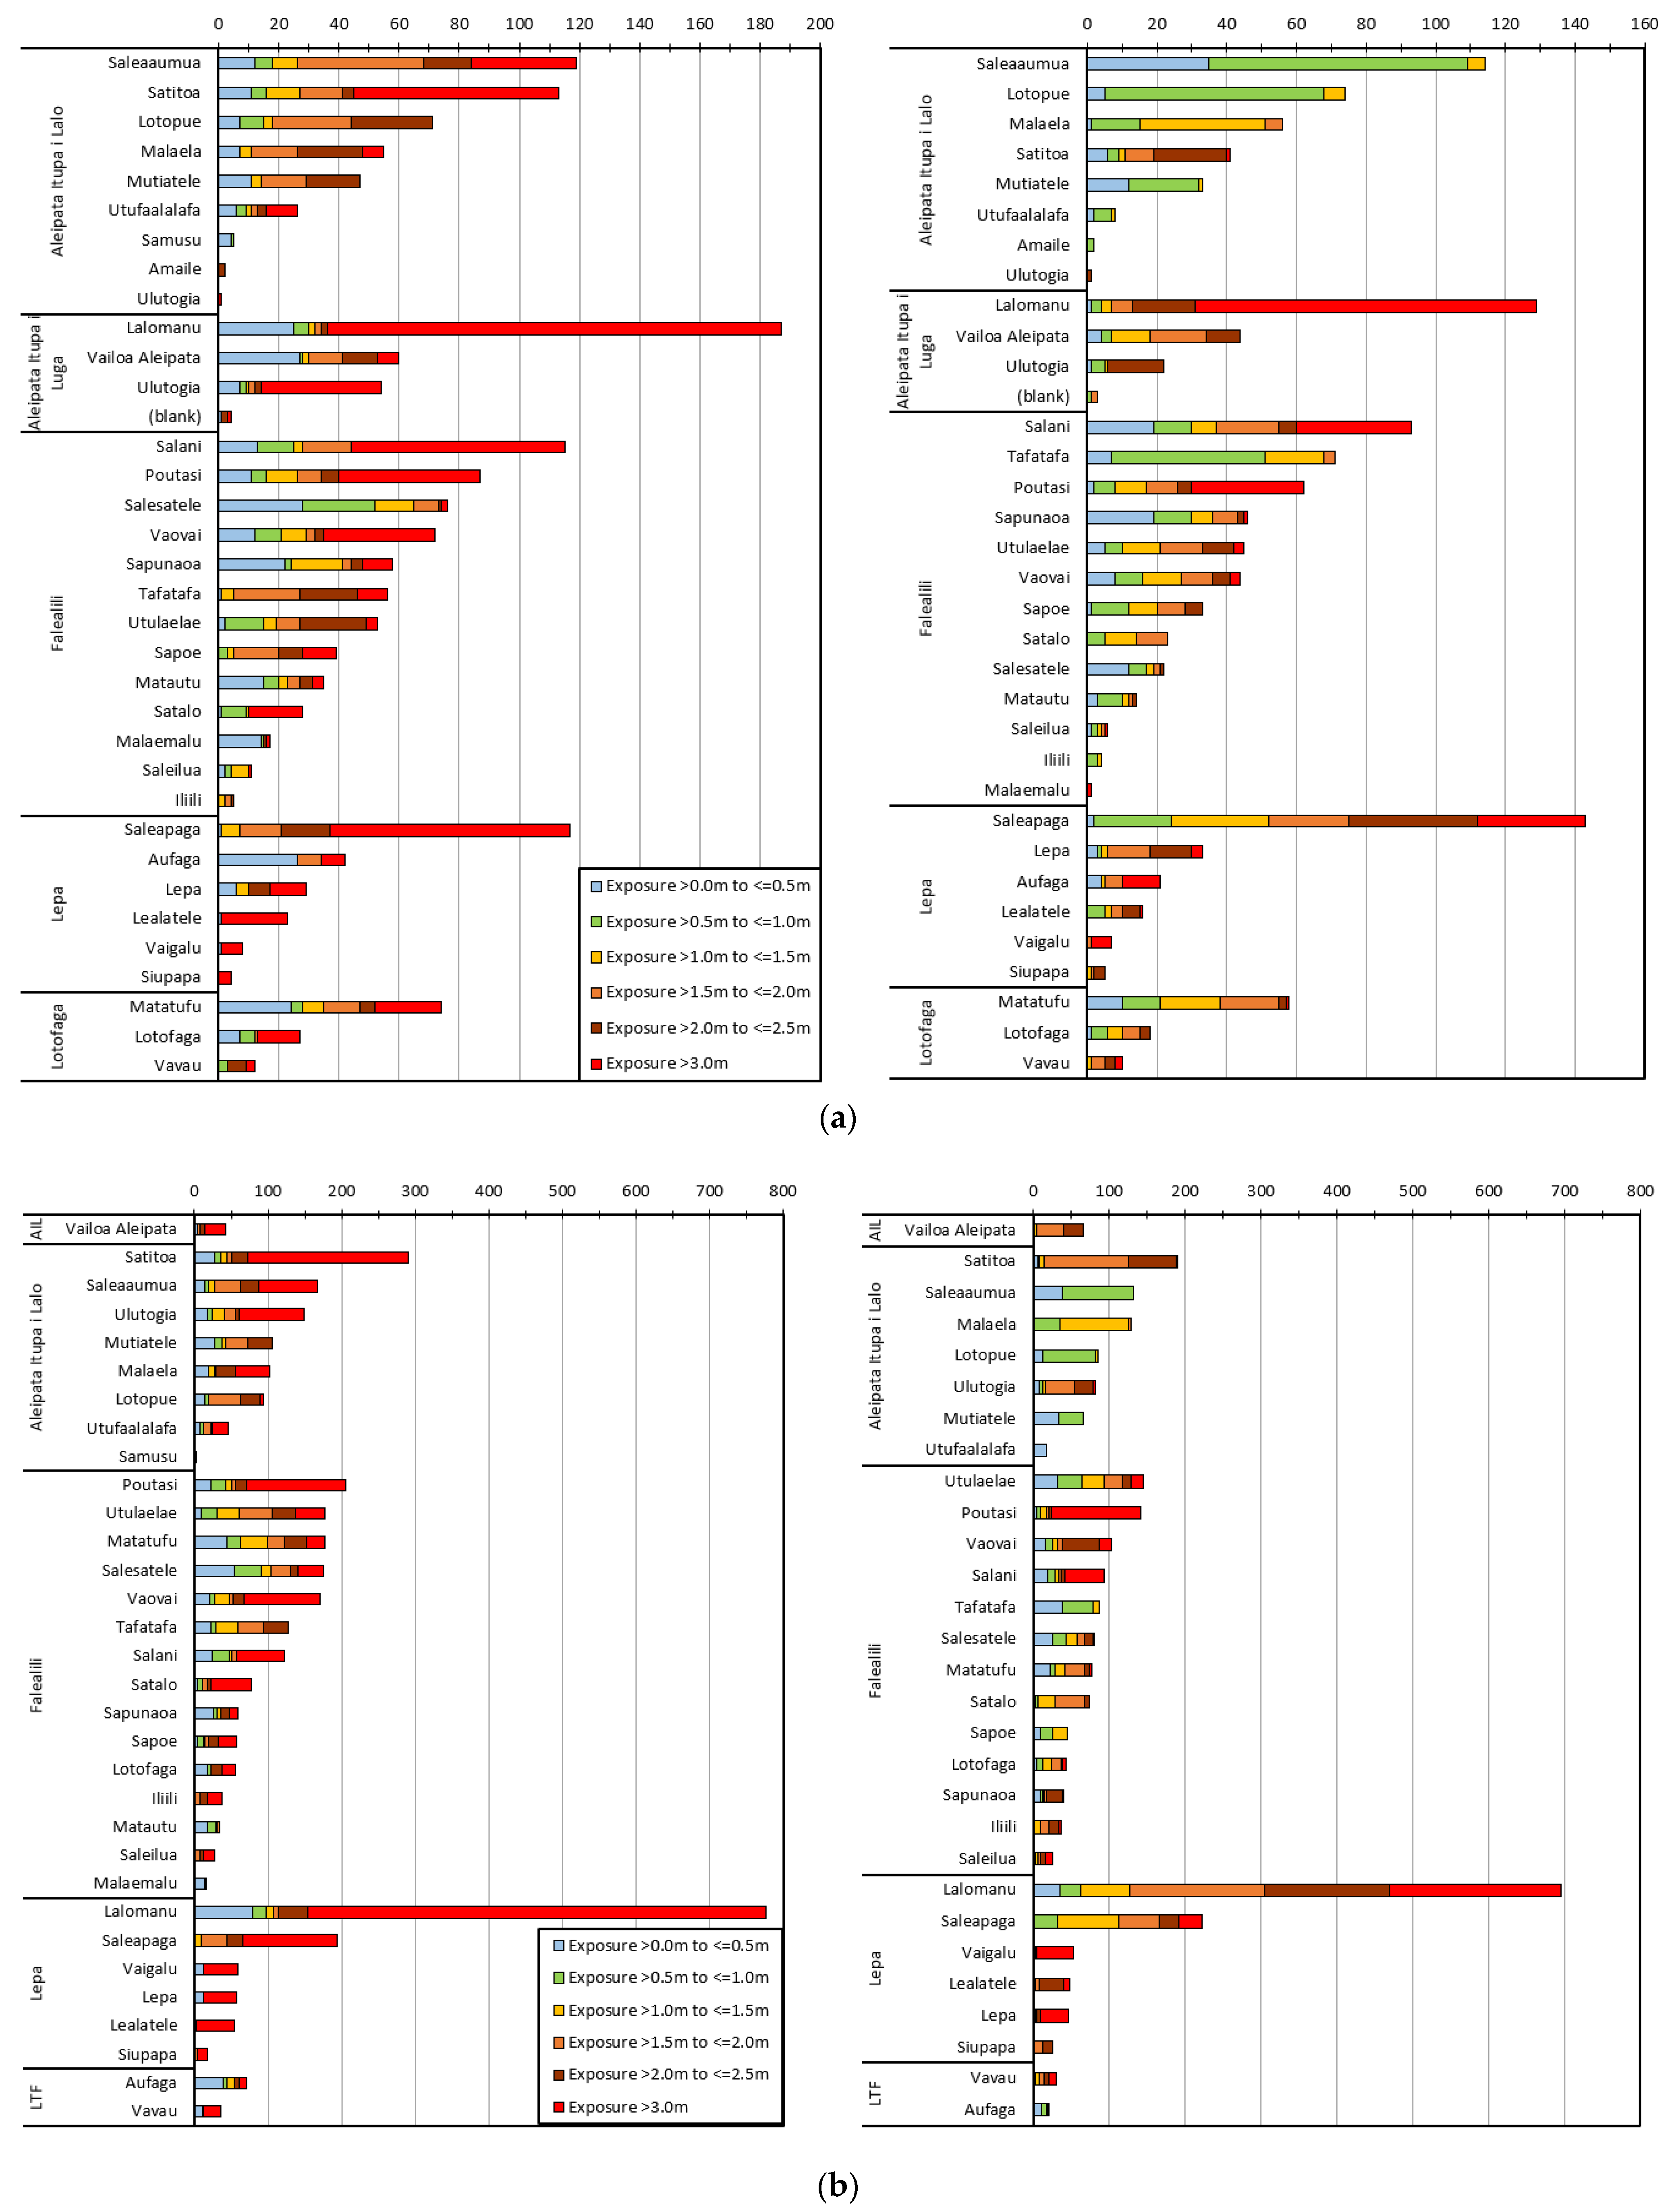
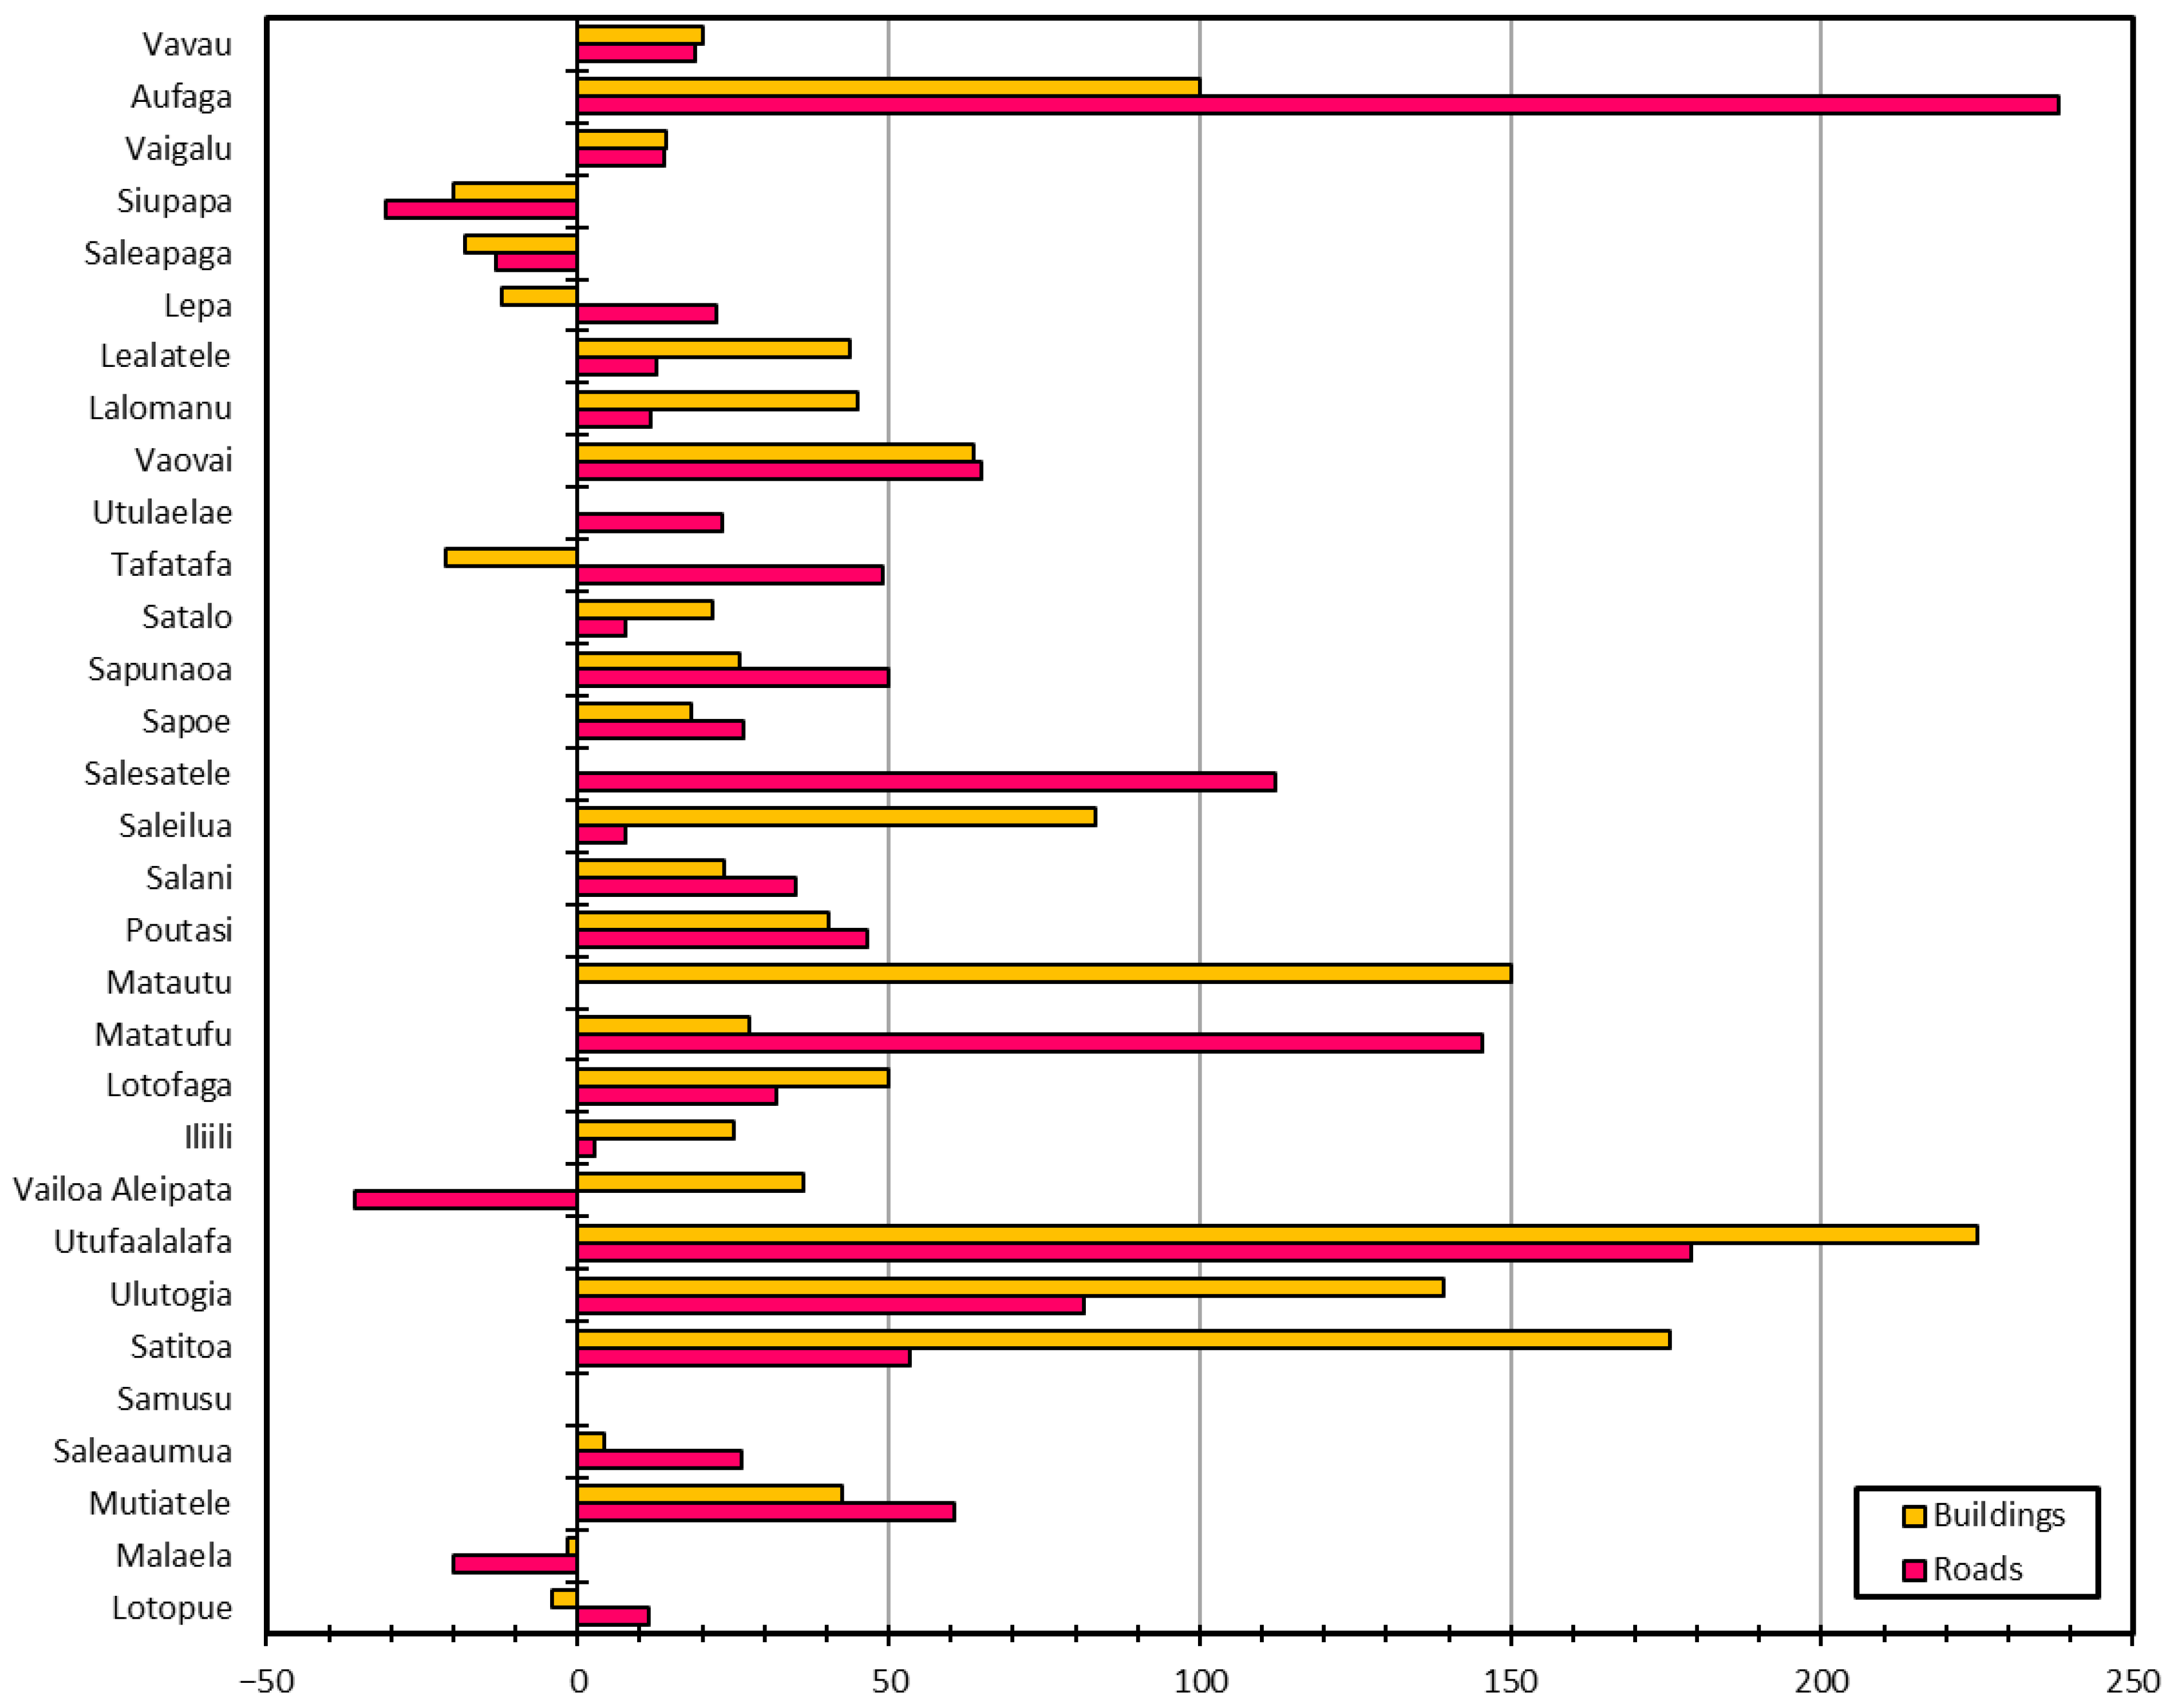
4.3. Village Building and Road Exposure in Southeast Upolu

The variability in the total exposure distributions between the 10 and 50 m grid inundations models relative to the total number of features within evacuation zones on southeast Upolu are shown in Table 3. Compared with the total number of buildings exposed in the 10 m grid scenario, approximately 520 more are exposed in the 50 m scenario (35% increase) and 1380 (128% increase) located within the maximum evacuation zone limit. Similar trends are observed for the exposed roads, with a 32% increase in exposure observed in the 50 m grid scenario and 116% increase within the evacuation zones.
Differences are observed between the 10 and 50 m grid scenarios for each village (Figure 5), with notable variations in the proportionate distribution of features exposed to different flood depths. For example, some villages exhibit a greater number of exposed buildings in the 50 m scenario (e.g., Lalomanu), some exhibit less (e.g., Saleapaga), while in others the difference is negligible (e.g., Malaela) (Figure 5a). Similarly, villages located in the Aleipata Itupa I Lalo district exhibit greater numbers of buildings exposed to flow depth >1.0 m in the 50 m compared with the 10 m scenario. Overall, a total of 1138 buildings are exposed to flow depth >0.5 m in the 10 m grid scenario compared with 1427 exposed in the 50 m scenario—an approximate 25% difference. Comparable exposure differences between the 10 and 50 m grid scenarios are also observed for roads (Figure 5b), with an overall difference of approximately 26%.

5. Discussion

The analysis performed in this work has demonstrated the practicality of using a combination of available information tools to perform a rapid multiscale tsunami exposure analysis. In Samoa, integrating modelled tsunami inundation from the BG-Flood tool with open building and road datasets with the RiskScape exposure model demonstrates the ability of risk tools to quantify exposure at multiple sociopolitical scales. However, observed variability in exposure distributions due to hazard model resolution poses several questions regarding the use and suitability of such information in planning contexts.

5.1. Exposure Vairability

The variability in building and road exposure distributions between the 10 and 50 m grid scenarios on southeast Upolu demonstrates the effect of model resolution on maximum inundation extent and subsequent risk exposure. Furthermore, they highlight the influence of model resolution on inundation flow depth and consequent distribution of proportionate exposure for each village. For this case, the 50 m grid scenario with inundation extent further inland and coarser representation of flow depth exposes up to 35% and 31% more buildings and roads, respectively, compared with the 10 m grid scenario (Figure 6). Villages exhibiting minimal differences between the 50 and 10 m grid scenarios (e.g., Lepa and Saleapaga) are typically characterized by narrow coastal areas backed by steep cliffs. In contrast, villages with notable differences (e.g., Satitoa) are generally located in wider/flat low-lying coastal regions. This likely indicates the influence of terrain/topographical gradient on the model grid and subsequent representation of inundation extent, implying that the 50 m grid scenario is more likely to overestimate the exposure in low-lying, flat coastal terrain compared to the 10 m scenario (e.g., in parts of southern and southwestern Upolu).
Despite these variabilities, the general consistency in the relative exposure of villages in each district for both scenarios suggests that the 50 m representation does provide a suitable, while conservative, level of detail to facilitate a comparison of exposure at the island/district scale. That is, it does provide a rapid identification of representative high-risk clusters/areas where targeted mitigation interventions might be required. This can also facilitate assessments of the differences in exposure characteristics which might influence differential response (e.g., such as during an evacuation) or recovery among districts (e.g., longer-term land development/use plans).
However, the differences do pose challenges for tsunami preparedness and response planning at the village (or community) level. For example, in Satitoa, an additional 50 buildings are exposed in the 50 m grid scenario compared with the 10 m scenario. Such situations could translate into an additional 100 or more people being threatened and requiring evacuation, which will have direct implications on logistics planning and resourcing in evacuation centres. Similar challenges are apparent when comparing the total number of buildings and roads exposed in the 2009 local scenario with the total features located within tsunami evacuation zones (Figure 6 and Figure 7). For example, in a warning situation to a local event, such as the 2009 tsunami, people will be required to evacuate outside of the maximum evacuation zone extent (i.e., yellow or orange zone in areas where the yellow zone is not present).
Nevertheless, with the increasing availability of finer resolution global DEMs (e.g., 30 m SRTM) as well as decreasing trends in the costs to acquire LiDAR data, the multiscale tsunami risk screening approach presented in this study can be adapted for other Pacific SIDS which are currently lacking whole-of-country LiDAR topography. Furthermore, the presented framework provides a potentially rapid method for assessing tsunami exposure in other countries to assist with preparedness and mitigation planning.

5.2. Applications in Tsunami Risk Management

While the variability in exposure distributions discussed above provide useful tools in understanding some of the uncertainty and subsequent challenges this might have on planning, these should be treated with caution and within the context of acceptable risk. For example, the overall difference of approximately 25% between the total number of buildings exposed in the 10 m grid compared with the 50 m grid scenario on southeast Upolu could be considered as an acceptable level of uncertainty. That is, the coarser 50 m scenario would provide a more conservative estimate suitable for application in preparedness and scenario-based evacuation planning.
Indeed, the general consistency in the total exposure trends between districts and villages for both scenarios corroborates this. High risk areas which are represented here by the total number of building and road features exposed in each district/village in the 50 m scenario are consistent with high risk areas identified in the 10 m scenario. However, the variability in proportionate exposure to different flow depths in each village suggests that the finer resolution is desired for more localized evaluations (e.g., at the village/community scales). For example, the total number of buildings and length of road in each village exposed to flow depth >0.5 m which could significantly impede/compromise evacuation ability are more accurately represented in the 10 m scenario.
While the choice of using a specific model resolution is influenced by other factors, such as computational costs relative to available resources, it should be informed and treated within the context of the desired application. The results in this study suggest that the 50 m grid scenario provides an acceptable level of detail required to identify and compare the characteristics of exposure risk hotspots around the country, including vulnerable locations where targeted interventions might be required to reduce vulnerability. On the other hand, the variability observed between the two scenarios suggests that the 50 m grid would not provide the level of detail required in localized, property- or feature-scale, assessments (e.g., insurance planning). In addition, limitations in the known attributes of the feature data (buildings and roads) in this study highlight the need for continual updating and ground validation of asset datasets in relation to planning requirements. For example, while the exposure of an individual building can be determined based on its outline/shape feature, its usage (e.g., commercial, residential) and criticality (e.g., health centres, schools) in tsunami preparedness is not known. Future work should consider the attribution of such parameters to infrastructure datasets including detailed ground-truthing to improve the level of detail and application of future exposure and impacts analysis.
Over the longer-term, the application of these types of information analysis tools in tsunami risk reduction and planning should be complemented with updated asset stocks to monitor and factor changing risk patterns in tsunami risk reduction plans (e.g., updating of building stock/features in line with 5- or 10-yearly census updates) (e.g., [19]). Longer-term planning should also incorporate future SLR and land-subsidence projections (e.g., [47,48,49,50,51]) to account for the effects these pose to the range of potential tsunami inundation and associated risk distributions (e.g., [52]).

6. Summary and Conclusions

This study examined the influence of grid model resolution on tsunami inundation arising from an event such as the 2009 SPT and subsequent variability in exposure distributions in Samoa, as well as the implications these pose to tsunami hazard and risk reduction planning. Overall, a 35% and 31% difference in the total exposure of buildings and roads, respectively, is observed between the 50 and 10 m grid inundation representations for southeast Upolu. The coarser model is more likely to overestimate exposure by up to three times or more in wide low-lying flat terrain at the village scale. In contrast, the differences in exposure between villages along narrow coastal stretches backed by steep cliffs is minimal (i.e., up to approximately 200 m or less inland of the coastline). Nevertheless, the overall consistency in the relative distribution of exposure between districts in both the 10 and 50 m scenarios suggests that the observed variability is minor. That is, the 50 m scenario does provide the necessary level of detail for comparing the risk characteristics between districts and identifying regions where targeted risk mitigation/reduction interventions might be prioritized in national/district-level planning. The observed variability in exposure at the village scale, particularly regarding differential exposure of features to different flow depths, indicates the need for using fine resolution models in detailed evacuation and response plans at the community level.
These observations lead us to infer that while higher-resolution models are recommended where data/resources permit (e.g., LiDAR, financial resources), the absence of such datasets should not preclude the application of coarser hazard resolutions in risk assessments. This is particularly relevant in regions where the costs of producing high resolution models might exceed the available resources to produce them (i.e., within SIDS contexts). We suggest the suitability of model resolution should be treated within the scope and scale of the desired decision-support application. While the observations presented in this study are specific to the Samoan context, particularly in relation to the distribution of the exposed human environment, the results could be applied to similar risk exposure assessments for other inundation hazards, such as coastal or fluvial flooding in analogous SIDS contexts.

Author Contributions

Conceptualization, S.W., R.P. and T.S.; methodology, S.W., R.P. and C.B.; software, C.B., R.P. and S.W.; validation, R.W., J.C.T., T.S., K.W. and F.S.; formal analysis, T.S. and J.C.T.; investigation, S.W., R.W. and K.W.; resources, S.W., R.P., C.B., T.S. and J.C.T.; data curation, C.B., K.W., T.S., J.C.T. and F.S.; writing—original draft preparation, S.W.; writing—review and editing, R.P., R.W., C.B., J.C.T., K.W., T.S. and F.S.; visualization, S.W., R.P., C.B. and K.W.; supervision, S.W.; project administration, S.W., R.P., T.S. and J.C.T.; funding acquisition, R.P., S.W., T.S. and J.C.T. All authors have read and agreed to the published version of the manuscript.

Funding

This research was supported by the New Zealand National Institute of Water and Atmospheric Research (NIWA) Taihoro Nukurangi via Strategic Science Investment Fund (SSIF) Project No: CARH2106 and PRAS2101; and the Samoa Ministry of Natural Resources and Environment via partnership initiated through the Pacific Risk Tools for Resilience Project (PARTneR), NZ-MFAT Project No: PF6-484.

Institutional Review Board Statement

Not applicable.

Informed Consent Statement

Not applicable.

Data Availability Statement

The LiDAR data, 2009 tsunami inundation models, evacuation zones, buildings outlines and risk exposure datasets discussed in this study are accessible through the Samoa Ministry of Natural Resources and Environment via formal request. The roads data presented are available via the Open Street Map (OSM) database.

Acknowledgments

The authors thank Amituana’i Lameko Simanu, Ta’inau Mulipola Ausetalia Titimaea, and Ulu Bismarck Crawley for their helpful advice on various aspects of this research. The editor is thanked for the invitation to contribute this paper. Two anonymous reviewers are thanked for their helpful comments which improved the paper.

Conflicts of Interest

The authors declare no conflict of interest.

References

  1. Shibayama, T.; Esteban, M.; Nistor, I.; Takagi, H.; Thao, N.G.M.; Matsumaru, R.; Mikami, T.; Aranguiz, R.; Jayaratne, R.; Ohira, K. Classification of Tsunami and Evacuation Areas. Nat. Hazards 2013, 67, 365–386. [Google Scholar] [CrossRef]
  2. Okumura, N.; Jonkman, S.N.; Esteban, M.; Hofland, B.; Shibayama, T. A method for tsunami risk assessment: A case study for Kamakura, Japan. Nat. Hazards 2017, 88, 1451–1472. [Google Scholar] [CrossRef] [Green Version]
  3. UNISDR (United Nations Office for Disaster Risk Reduction). Sendai Framework for Disaster Risk Reduction 2015–2030; UNISD: Geneva, Switzerland, 2015. [Google Scholar]
  4. Aguirre-Ayerbe, I.; Sánchez, J.M.; Aniel-Quiroga, Í.; González-Riancho, P.; Merino, M.; Al-Yahyai, S.; González, M.; Medina, R. From tsunami risk assessment to disaster risk reduction—The case of Oman. Nat. Hazards Earth Syst. Sci. 2018, 18, 2241–2260. [Google Scholar] [CrossRef] [Green Version]
  5. Maly, E.; Suppasri, A. The Sendai Framework for Disaster Risk Reduction at Five: Lessons from the 2011 Great East Japan Earthquake and Tsunami. Int. J. Disaster Risk Sci. 2020, 11, 167–178. [Google Scholar] [CrossRef] [Green Version]
  6. Paulik, R.; Craig, H.; Popovich, B. A National-Scale Assessment of Population and Built-Environment Exposure in Tsunami Evacuation Zones. Geoscience 2020, 10, 291. [Google Scholar] [CrossRef]
  7. Imamura, F.; Boret, S.P.; Suppasri, A.; Muhari, A. Recent occurrences of serious tsunami damage and the future challenges of tsunami disaster risk reduction. Prog. Disaster Sci. 2019, 1, 100009. [Google Scholar] [CrossRef]
  8. González-Riancho, P.; Aliaga, B.; Hettiarachchi, S.; González, M.; Medina, R. A contribution to the selection of tsunami human vulnerability indicators: Conclusions from tsunami impacts in Sri Lanka and Thailand (2004), Samoa (2009), Chile (2010) and Japan (2011). Nat. Hazards Earth Syst. Sci. 2015, 15, 1493–1514. [Google Scholar] [CrossRef]
  9. Marras, S.; Mandli, K. Modeling and Simulation of Tsunami Impact: A Short Review of Recent Advances and Future Challenges. Geoscience 2020, 11, 5. [Google Scholar] [CrossRef]
  10. SPC; SPREP; PIFS; UNDP; UNISDR; USP. Framework for Resilient Development in the Pacific: An integrated Approach to Address Climate Change and Disaster Risk Management (FRDP); Pacific Community (SPC): Suva, Fiji, 2017; ISBN 978-982-00-1034-5. [Google Scholar]
  11. Beavan, J.; Wang, X.; Holden, C.; Wilson, K.; Power, W.; Prasetya, G.; Bevis, M.; Kautoke, R. Near-simultaneous great earthquakes at Tongan megathrust and outer rise in September 2009. Nat. Cell Biol. 2010, 466, 959–963. [Google Scholar] [CrossRef]
  12. Lay, T.; Ammon, C.J.; Kanamori, H.; Rivera, L.; Koper, K.D.; Hutko, A.R. The 2009 Samoa–Tonga great earthquake triggered doublet. Nat. Cell Biol. 2010, 466, 964–968. [Google Scholar] [CrossRef] [Green Version]
  13. Goff, J.; Dominey-Howes, D. The 2009 South Pacific Tsunami. Earth-Sci. Rev. 2011, 107. [Google Scholar] [CrossRef]
  14. Bosserelle, C.; Williams, S.; Cheung, K.F.; Lay, T.; Yamazaki, Y.; Simi, T.; Roeber, V.; Lane, E.; Paulik, R.; Simanu, L. Effects of Source Faulting and Fringing Reefs on the 2009 South Pacific Tsunami Inundation in Southeast Upolu, Samoa. J. Geophys. Res. Ocean. 2020, 125. [Google Scholar] [CrossRef]
  15. Ministry of Natural Resources and Environment (MNRE). Samoa Post Disaster Needs Assessment: Following the Earthquake and Tsunami of 29th September 2009; Government of Samoa: Apia, Samoa, 2009.
  16. Okal, E.A.; Fritz, H.M.; Synolakis, C.E.; Borrero, J.C.; Weiss, R.; Lynett, P.J.; Titov, V.V.; Foteinis, S.; Jaffe, B.E.; Liu, P.L.-F.; et al. Field Survey of the Samoa Tsunami of 29 September 2009. Seism. Res. Lett. 2010, 81, 577–591. [Google Scholar] [CrossRef]
  17. Wendt-Young, L. The Pacific Tsunami “Galu Afi”: The Story of the Greatest Natural Disaster Samoa Has Ever Known; Marfleet Printing & Publishing: Apia, Samoa, 2010; ISBN 9780615398402. [Google Scholar]
  18. Reese, S.; Bradley, B.A.; Bind, J.; Smart, G.; Power, W.; Sturman, J. Empirical building fragilities from observed damage in the 2009 South Pacific tsunami. Earth-Sci. Rev. 2011, 107, 156–173. [Google Scholar] [CrossRef]
  19. Paulik, R.; Williams, S.; Simi, T.; Bosserelle, C.; Ting, J.C.; Simanu, L. Evaluating building exposure and economic loss changes after the 2009 South Pacific Tsunami. Int. J. Disaster Risk Reduct. 2021, 56, 102131. [Google Scholar] [CrossRef]
  20. Leonard, G.; Power, W.; Lukovic, B.; Wang, X. Stage 4: Inundation Modelling and Evacuation Mapping Report for Samoa—Filling a Critical Gap in End-to-End Tsunami Warning in the Southwest Pacific: A Pilot Project in Samoa to Create Scientifically Robust, Community-Based Evacuation Maps; GNS Science: Wellington, New Zealand, 2011. [Google Scholar]
  21. Samoa Community Integrated Management Plans. Available online: https://pacific-data.sprep.org/dataset/community-integrated-management-plans (accessed on 24 February 2021).
  22. Schmidt, J.; Matcham, I.; Reese, S.; King, A.; Bell, R.; Henderson, R.; Smart, G.; Cousins, J.; Smith, W.; Heron, D. Quantitative multi-risk analysis for natural hazards: A framework for multi-risk modelling. Nat. Hazards 2011, 58, 1169–1192. [Google Scholar] [CrossRef]
  23. Samoa Bureau of Statistics—Population & Demographic Indicator Summary. Available online: https://www.sbs.gov.ws/population (accessed on 9 March 2021).
  24. Samoa. Available online: https://www.samoagovt.ws/about-samoa/ (accessed on 26 March 2021).
  25. DMO (Disaster Management Office). National Disaster Management Plan. 2017—2020; Ministry of Natural Resources and Environment, Government of Samoa: Apia, Samoa, 2017.
  26. DMO (Disaster Management Office). Samoa National Action Plan. for Disaster Risk Management 2017—2021; Ministry of Natural Resources and Environment, Government of Samoa: Apia, Samoa, 2017.
  27. Lay, T.; Ye, L.; Wu, Z.; Kanamori, H. Macrofracturing of Oceanic Lithosphere in Complex Large Earthquake Sequences. J. Geophys. Res. Solid Earth 2020, 125, 125. [Google Scholar] [CrossRef]
  28. Okal, E.A.; Borrero, J.C.; Chagué-Goff, C. Tsunamigenic predecessors to the 2009 Samoa earthquake. Earth-Sci. Rev. 2011, 107, 128–140. [Google Scholar] [CrossRef]
  29. Keys, J.G. The tsunami of 22 May 1960, in the Samoa and Cook Islands. Bull. Seismol. Soc. Am. 1963, 53, 1211–1227. [Google Scholar]
  30. Williams, S.; Leavasa, A.M. Exploring the status of tsunami early warning systems in Samoa. In Proceedings of the Samoa National Environment Forum 2005, Apia, Samoa, 25 November 2005; pp. 52–58. [Google Scholar]
  31. Williams, S.; Titimaea, A.; Bosserelle, C.; Simanu, L.; Prasetya, G. Reassessment of Long-Term Tsunami Hazards in Samoa Based on Sedimentary Signatures. Geoscience 2020, 10, 481. [Google Scholar] [CrossRef]
  32. Pararas-Carayannis, G.; Dong, B. Catalog of Tsunamis in the Samoan Islands; International Tsunami Information Center: Honolulu, HA, USA, 1980. [Google Scholar]
  33. Garside, R.; Johnston, D.; Saunders, W.; Leonard, G. Planning for tsunami evacuations: The case of the Marine Education Centre, Wellington, New Zealand. Aust. J. Emerg. Manag. 2009, 24. [Google Scholar] [CrossRef]
  34. Barnhill, D. Tsunami Evacuation Dynamics Following the 2016 Kaikōura Earthquake in Christchurch and Banks Peninsula, New Zealand, to Inform Tsunami Evacuation Modelling for Banks Peninsula. Master’s Thesis, University of Canterbury, Christchurch, New Zealand, 2020; 395p. [Google Scholar]
  35. Tilley, L. Assessing Tsunami Evacuation Behaviour and Dynamics of a Near-Source Threat—The Case Study of Kaikōura Township Following the 2016 Kaikōura Earthquake. Master’s Thesis, University of Canterbury, Christchurch, New Zealand, 2020; 199p. [Google Scholar]
  36. FUGRO. Report of Survey: Airborne Lidar Bathymetric and Topographic Survey of Samoa 2015, Contract: ECRCR-LIB 2.1, Fugro LADS Document Reference No: TLCS00.047.008; Issue No: 1.00; Fugro LADS Corporation Pty Ltd.: Adelaide, Australia, 2015. [Google Scholar]
  37. Nguyen, P.H.; Bui, Q.C.; Vu, P.H.; Pham, T.T. Scenario-based tsunami hazard assessment for the coast of Vietnam from the Manila Trench source. Phys. Earth Planet. Inter. 2014, 236, 95–108. [Google Scholar] [CrossRef]
  38. Schneider, B.; Hoffmann, G.; Reicherter, K. Scenario-based tsunami risk assessment using a static flooding approach and high-resolution digital elevation data: An example from Muscat in Oman. Glob. Planet. Chang. 2016, 139, 183–194. [Google Scholar] [CrossRef]
  39. Harnantyari, A.S.; Takabatake, T.; Esteban, M.; Valenzuela, P.; Nishida, Y.; Shibayama, T.; Achiari, H.; Rusli; Marzuki, A.G.; Marzuki, M.F.H.; et al. Tsunami awareness and evacuation behaviour during the 2018 Sulawesi Earthquake tsunami. Int. J. Disaster Risk Reduct. 2020, 43, 101389. [Google Scholar] [CrossRef]
  40. Bosserelle, C. BG-Flood. Available online: https://github.com/CyprienBosserelle/BG_Flood (accessed on 1 April 2021).
  41. Dudley, W.C.; Whitney, R.; Faasisila, J.; Fonolua, S.; Jowitt, A.; Chan-Kau, M. Learning from the victims: New physical and social science information about tsunamis from victims of the 29 September 2009 event in Samoa and American Samoa. Earth-Sci. Rev. 2011, 107, 201–206. [Google Scholar] [CrossRef]
  42. Fritz, H.M.; Borrero, J.C.; Synolakis, C.E.; Okal, E.A.; Weiss, R.; Titov, V.V.; Jaffe, B.E.; Foteinis, S.; Lynett, P.J.; Chan, I.-C.; et al. Insights on the 2009 South Pacific tsunami in Samoa and Tonga from field surveys and numerical simulations. Earth-Sci. Rev. 2011, 107, 66–75. [Google Scholar] [CrossRef]
  43. OpenStreetMap Wiki. OSM Map Features: Summary of Commonly Used Tags for Main Elements Used to Describe Features within OSM. Available online: http://wiki.openstreetmap.org/wiki/Map_Features (accessed on 13 August 2012).
  44. Cox, R.J.; Shnd, T.D.; Blacka, M.J. Australian Rainfall & Runoff Revision Project 10: Appropriate Safety Criteria for People, Stage 1 Report; Report No. P10/S1/006; UNSW Australia Report; Water Research Laboratory: UNSW, Australia; Sydney, Australia, 2010; ISBN 978-085825-9454. [Google Scholar]
  45. Takagi, H.; Mikami, T.; Fujii, D.; Esteban, M.; Kurobe, S. Mangrove forest against dyke-break-induced tsunami on rapidly subsiding coasts. Nat. Hazards Earth Syst. Sci. 2016, 16, 1629–1638. [Google Scholar] [CrossRef] [Green Version]
  46. Paulik, R.; Lane, E.; Williams, S.; Power, W. Changes in Tsunami Risk to Residential Buildings at Omaha Beach, New Zealand. Geoscience 2019, 9, 113. [Google Scholar] [CrossRef] [Green Version]
  47. Aucan, J. Effects of Climate Change on Sea Levels and Inundation Relevant to the Pacific Islands. In Pacific Marine Climate Change Report Card: Science Review; Commonwealth Marine Economies Programme: London, UK, 2018; pp. 43–49. [Google Scholar]
  48. Esteban, M.; Jamero, M.L.; Nurse, L.; Yamamoto, L.; Takagi, H.; Thao, N.D.; Mikami, T.; Kench, P.; Onuki, M.; Nellas, A.; et al. Adaptation to sea level rise on low coral islands: Lessons from recent events. Ocean. Coast. Manag. 2019, 168, 35–40. [Google Scholar] [CrossRef]
  49. Han, S.; Sauber, J.; Pollitz, F.; Ray, R. Sea Level Rise in the Samoan Islands Escalated by Viscoelastic Relaxation After the 2009 Samoa-Tonga Earthquake. J. Geophys. Res. Solid Earth 2019, 124, 4142–4156. [Google Scholar] [CrossRef] [Green Version]
  50. Crichton, R.N.; Esteban, M.; Onuki, M. Understanding the preferences of rural communities for adaptation to 21st-century sea-level rise: A case study from the Samoan islands. Clim. Risk Manag. 2020, 30, 100254. [Google Scholar] [CrossRef]
  51. Grinsted, A.; Christensen, J.H. The transient sensitivity of sea level rise. Ocean. Sci. 2021, 17, 181–186. [Google Scholar] [CrossRef]
  52. Nagai, R.; Takabatake, T.; Esteban, M.; Ishii, H.; Shibayama, T. Tsunami risk hazard in Tokyo Bay: The challenge of future sea level rise. Int. J. Disaster Risk Reduct. 2020, 45, 101321. [Google Scholar] [CrossRef]
Figure 1. Samoan Islands showing district and village boundaries, as well as the extents of the red, orange, and yellow tsunami evacuation zones [20]. Red zone denotes areas at potential threat to small tsunami which pose only a marine threat. Orange zone encompasses all areas at potential threat to tsunami inundation from regional/distant earthquakes which are not locally felt. Yellow zone denotes all areas at potential threat to tsunami inundation following a long and strongly felt earthquake. Districts located along southeast Upolu experienced the greatest losses in terms of casualties, damage to property and the built environment from the 2009 tsunami. Districts cited in text: 1 = Palauli West; 2 = Palauli I le Falefa; 3 = Satupaitea; 4 = Palauli East; 5 = Faasaleleaga-I; 6 = Aiga I le Tai; 7 = Aana Alofi-III; 8 = Falelatai/Samatau; 9 = Lefaga/Faleseela; 10 = Siumu; 11 = Falealili; 12 = Lotofaga; 13 = Lepa; 14 = Aleipata Itupa I Luga; 15 = Aleipata Itupa I Lalo. Villages cited in text: a = Saleapaga; b = Lalomanu; c = Satitoa; d = Malaela. Star = Apia city.
Geohazards 02 00004 g001
Figure 2. 2009 tsunami inundation models derived from [14]: (a) Southeast Upolu terrain showing the area between Lepa and Lalomanu which is characterized by a narrow coastal flat (approximately <5 m above m.s.l.) and backed by steep cliffs up to 200 m or less landward of the shore, which rapidly rise to >100 m above mean sea level. (b) Example of maximum envelop of flow depth for twenty-three 2009 tsunami inundation scenarios at 50 m grid resolution. (c) Example of maximum envelop of flow depth for thirty-four 2009 tsunami inundation scenarios at 10 m grid resolution for southeast Upolu.
Geohazards 02 00004 g002aGeohazards 02 00004 g002b
Figure 3. Schematic representation of the RiskScape exposure model framework and workflow applied in this study. Hazard layers depicting maximum extent and flow depths at 50 and 10 m grid resolution [14] and evacuation zones [20] are combined with exposure layers (distribution of buildings and road features in districts and villages) to enumerate the sum of the exposed features. The RiskScape analysis framework is described by [22] and has been previously demonstrated in several inundation-related impacts and exposure analyses (e.g., [6,19,46]).
Geohazards 02 00004 g003
Figure 4. Number of buildings and proportionate distribution (a), and length of roads and proportionate distribution (b), exposed to different flow depths for each district of the whole country for a 2009 SPT 50 m scenario.
Geohazards 02 00004 g004aGeohazards 02 00004 g004b
Figure 5. (a) Comparison of the sum of buildings exposed in Southeast Upolu: 50 m exposure results (left) and 10 m exposure results (right). (b) Comparison of road lengths (m) exposed: 50 m exposure results (left) and 10 m exposure results (right). AIL = Aleipata Itupa I Luga; LTF = Lotofaga.
Geohazards 02 00004 g005
Figure 6. Comparison of exposure distributions between the 10 m, 50 m, and total evacuation zones for selected villages along SE Upolu. (a) Buildings. (b) Roads (km).
Geohazards 02 00004 g006
Figure 7. Percentage difference of the 50 m exposure model distributions for buildings and roads relative to the 10 m results for villages in southeast Upolu. A positive difference suggests overestimation whereas a negative difference suggests underestimation of the 50 m resolution scenario compared to the 10 m resolution scenario.
Geohazards 02 00004 g007
Table 1. Distribution of total buildings and road features in Upolu and Savaii.
IslandBuildingsRoads 1
Upolu43,6881553
Savaii19,324924
Total63,0122477
1 This includes the total number of 10 m road lengths/segments for all road feature classes in the Open Street Map (OSM) classification [43].
Table 2. Comparison of buildings’ and road exposure between the 2009 tsunami scenario inundation and existing tsunami red, orange, and yellow evacuation zones for the whole country.
ScenarioUpolu IslandSavaii Island Total (National Level)
BuildingsRoad (km)BuildingsRoad (km)BuildingsRoad (km)
2009 SPT (50 m)8884152.5315650.612,040203.1
Evacuation zones 12,424468.213,059262.125,483730.3
Red Zone2272107.1214849.24420156.3
Orange Zone8606281.38314130.616,920411.9
Yellow Zone154679.7259782.34143162.0
Table 3. Comparison of total features exposed along southeast Upolu based on different hazard layers.
Hazard LayerBuildingsRoad (km)
10 m grid inundation148728.5
50 m grid inundation200737.4
Evacuation Zones338786.68
Publisher’s Note: MDPI stays neutral with regard to jurisdictional claims in published maps and institutional affiliations.

