Article

Reduction of Bias and Uncertainty in Regional Seismic Site Amplification Factors for Seismic Hazard and Risk Analysis

by
Mohammad Kamruzzaman Talukder
1,*,
Philippe Rosset
2 and
Luc Chouinard
2,*
1
Department of Civil Engineering, East West University, Dhaka 1212, Bangladesh
2
Department of Civil Engineering and Applied Mechanics, McGill University, Montreal, QC H3A 0G4, Canada
*
Authors to whom correspondence should be addressed.
Submission received: 29 May 2021 / Revised: 21 August 2021 / Accepted: 25 August 2021 / Published: 3 September 2021
(This article belongs to the Special Issue Recent Applications of Seismic Hazard Assessment)

Abstract

:
Site amplification factors in National Building Codes are typically specified as a function of the average shear wave velocity over the first 30 m (Vs30) or site class (A, B, C, D and E) for defined ranges of Vs30 and/or ranges of depth to bedrock. However, a single set of amplification factors may not be representative of site conditions across the country, introducing a bias in seismic hazard and seismic risk analyses. This is exemplified by significant differences in geological settings between East and West coast locations in North America. Western sites are typically characterized by lower impedance contrasts between recent surface deposits and bedrock in comparison to Eastern sites. In North America, site amplification factors have been derived from a combination of field data on ground motions recorded during West Coast earthquakes and numerical models of site responses that are meant to be representative of a wide variety of soil profiles and ground motions. The bias on amplifications and their impact on seismic hazards is investigated for the Montreal area, which ranks second for seismic risks in Canada in terms of population and hazard (PGA of 0.25 g for a 2475 years return period). Representative soil profiles at several locations in Montreal are analyzed with 1-D site response models for natural and synthetic ground motions scaled between 0.1 to 0.5 g. Since bedrock depths are typically shallow (<30 m) across the island, bedrock shear wave velocities have a significant influence on the impedance contrast and amplifications. Bedrock shear wave velocity is usually very variable due to the differences in rock formations, level of weathering and fracturing. The level of this uncertainty is shown to be greatly decreased when rock quality designation (RQD) data, common information when bore hole data are logged, is available since it is highly correlated with both shear and compression wave velocities. The results are used to derive region-specific site amplification factors as a function of both Vs30 and site fundamental frequency and compared to those of the National Building Code of Canada (2015). The results of the study indicate that there are large uncertainties associated with these parameters due to variability in soil profiles, soil properties and input seismic ground motions. Average and confidence intervals for the mean and for predictions of amplification factors are calculated for each site class to quantify this uncertainty. Amplifications normalized relative to class C are obtained by accounting for the correlation between site class amplifications for given ground motions. Non-linearity in the analysis of equivalent linear 1-D site response is taken into account by introducing the non-linear G/Gmax and damping ratios curves. In this method, it is assumed that the shear strain compatible shear modulus and damping ratio values remains constant throughout the duration of the seismic excitation. This assumption is not fully applicable to a case when loose saturated soil profile undergo heavy shaking (PGA > 0.3 g). In this study, all simulations with input motion PGA >0.3 g have been performed by using the EL method instead of the NL method considering that cohesive soils (clay and silt) at Montreal sites are stiff and cohesionless soils (sand and gravel) are considerably dense. In addition, the field and laboratory data required to perform NL analyses are not currently available and may be investigated in future works.

1. Introduction

The region of Montreal, Canada, is the second city at risk in Canada for its population and seismic hazard [1]. However, no damaging events have been recorded to provide insight on site response and structural performance. The most significant recent event in Montreal occurred in 1988 (M 5.7) in the Saguenay region, approximately 350 km NE of the city and caused structural damaged to the Montreal East city hall built on a 17 m soft clay layer that may have amplified the ground motions [2,3]. Zones with similar soft soil are found in the downtown area and along the south east shore of the island [4,5]. Site effects that are currently used in design codes may not reflect the amplification to be expected for site conditions and ground motions that are typical to eastern Canada as well as the uncertainty associated with these factors. Given the lack of historical data, an approach based on simulation of ground motions is proposed here to investigate site effects.
The equivalent linear 1-D ground response analysis method (later named 1-D EL) is often used to estimate site effects and provides the seismic motion at the ground surface of the soil column. For this purpose, the site amplification factor for a given period is defined as the ratio of the spectral acceleration computed at the ground surface to the spectral acceleration of the input motion applied at the rock interface. The site amplification factors of the 2015 National Building Code of Canada (NBCC-2015) are specified for site classes A, B, C, D and E (as defined in NHERP, 1994) as a function of structural periods. They are largely derived from analyses performed by Choi and Stewart [6] using 1828 recordings from 154 shallow crustal earthquakes and provide factors for NEHRP Vs30 soil classes inferred from geotechnical data at 209 strong motion stations. They presented the 1-D dynamic response analyses for typical soil profiles for rock motions scaled to 0.16 g using the equivalent linear model of SHAKE2000 [7] and developed an empirical relation between amplification of rock motions and site periods. In our study, results from the most recent seismic surveys are used to characterize shear wave velocity profiles in Montreal for soil classes B, C and D and to estimate site amplification factors from the 1-D ground response analysis using Strata [8] for a range of ground motion intensities.
Soft soil deposits in Montreal consist mainly of Leda clay, sand, silt and gravel and range in thickness from 1 to 33 m. The shear wave velocity of bedrock is highly variable (from 1000 m/s to 4000 m/s), whereas the Vs profiles of the soft soil deposits vary between 150 m/s and 450 m/s [5]. Consequently, the high variability in the impedance contrast between surface deposits and bedrock can produce larger amplifications than those specified in the NBCC-2015.
Similar studies have been performed in various parts of the world. Aaquib et al. [9] used the 1D site response analysis program DEEPSOIL to calculate the ground motion amplification factor for shallow sites in moderate to low seismicity regions such as Korea, Central and Eastern North America (CENA), and Australia. They noted that peak shear strains occurred at a depth immediately above the interface between the alluvial and weathered soil and that the high impedance contrast at the interface between the alluvial and weathered soil caused the largest amplifications of ground motion. The ratio of maximum amplification factors was shown to generally increase with an increase in the site period [9].
Ciancimino et al. [10] generated a sample of Vs profiles by Monte Carlo simulation and calculated site amplifications with the 1-D Equivalent Linear (EQL) seismic response analysis. The standard deviation of soil amplification factors are estimated as a function of Vs30 and site fundamental frequency for ground motions scaled to PGA 0.1 g. The long period amplification factors do not show significant dispersion (coefficient of variation around 10–20%) and increases with decreasing Vs30 and then decreases when nonlinearity effects become predominant (Vs30 around 200 m/s).
Hashhash et al. [11] developed response spectrum site amplifications by using ten representative Vs profiles for CENA site conditions and a randomization scheme for the shear wave velocity profiles, modulus reduction and damping curves, and rock outcrop ground motions. A high reference rock shear velocity (3000 m/s) was used throughout to account for typical high impedance contrasts in CENA. Both synthetic and rock ground motion records with magnitudes ranging from 4.5 to 7.5 and epicentral distances from 5 to 250 km were used in the simulations.
Harmon et al. [12] used a similar 1-D ground response analysis procedure as in [11] to estimate site amplification functions for CENA and the Western US (WUS). They noted the large stiffness of the bedrock across the CENA. They also noted that the variability in soft soil stratigraphy for a given Vs30 is generally larger for CENA than for WUS sites due to a higher velocity contrast between soft soil layers and bedrock. It is noteworthy that in both papers [11,12] a constant bedrock Vs was used in all the analyses.
Site amplifications in Pistrino di Sotto in Italy were investigated by Sextos et al. [13] to determine how site conditions, such as ancient riverbeds, are related to higher levels of damage observed during a recent earthquake. Rodriquez-Marek et al. [14] used a logic tree approach to evaluate the uncertainties in amplifications. The nodes of the logic trees include shallow Vs profiles, deeper Vs profiles, depth of impedance contrasts, uncertainty on the depth of the rock surface, and uncertainty on the thickness of the weathered rock zone. Falcone et al. [15] analyzed the amplification factors for peak ground acceleration and for the velocity spectrum for a site in Northern Italy (Dovadola). Falcone et al. [16] also performed numerical simulations of seismic site response to produce maps of seismic shaking amplification factors.
Boudghene et al. [17] used an artificial neural network to investigate the correlation between the average amplification factor and various site parameters such as the depth to bedrock, average shear velocity (Vsm) to bedrock, Vs30, shear wave velocity of bedrock (Vbedrock), velocity contrast, and soil fundamental frequency (f0). They concluded that site fundamental frequency f0, and Vs30 are the best predictors of site amplification factors Fa and Fv. Zhu et al. [18] also evaluated site effects to obtain the best site parameters in a complement to the Vs30 parameter.
Gobbi et al. [19] performed 1D simulation of site response analysis with a set of 40 earthquake records for stochastically generated horizontally layered soil profiles. They concluded that amplification factors are best predicted as a function of Vs30 in conjunction with the dominant period of the site and the shear wave velocity gradient. Fayjaloun et al. [20] investigated the damage scenario of residential buildings shaken by moderate ground acceleration (200 cm2/s) with and without consideration for the site amplification factor of 1.5. It is noted from Régnier et al. [21,22] that the EQL analysis should be considered reliable with reference to PGA lower than 0.2–0.3 g.
In our study, 1-D EL ground response analyses are performed to investigate the influence of ground motions, nonlinear dynamic soil properties, Vs profiles and impedance contrast on the amplification factors for typical sites in the Greater Montreal area. The results are presented as a function of PGA at rock site for periods of 0.01 s, 0.2 s, 0.5 s and 1.0 s for site classes C and D profiles. The results obtained are compared to the corresponding site factors from NBCC (2015) and from other CENA sites.

2. Methodology of Equivalent Linear 1-D Analysis

Equivalent linear one-dimensional modeling of site response approximates the nonlinear cyclic response of soil through the use of a degradation curve for the shear modulus and a damping ratio curve (e.g., [23,24,25,26,27,28,29,30]). Seismic ground motion propagating through soft soil deposits generates shear waves and Raleigh waves in the subsurface zones of the earth. In practice, shear wave propagation from the bedrock to the ground surface is approximated as 1-D vertically propagating waves from the underlying rock formation.
For layered soil deposits, the first step is to set initial estimates for the shear modulus G and damping for each layer. Then, the transfer function between bedrock and each layer for all major frequencies of the rock motion are computed. Using the product of the Fourier spectra of the bedrock accelerograms and transfer function at various frequencies of the motions, an updated Fourier response spectra is computed for each layer. Next, acceleration, displacement and shear strain time histories are computed for each layer using the inverse fast Fourier technique [31]. After the shear strain time histories are obtained for a layer, an estimate of an effective shear strain (65% of peak strain as proposed in [31]) is determined for the layer. The modulus reduction and damping curves of each layer were then used to obtain the updated values of shear modulus and damping ratio compatible with the current effective strain. Subsequent iterations continue with the updated values until convergence is achieved for the strain levels between two consecutive runs [31].
In our study, it is assumed that the soil layer at each site is underlain by elastic rock. In Montreal, predicted site fundamental frequencies using 1-D EL are in accordance with field measurements [4]. The 1-D Equivalent linear analysis in the frequency domain is used to carry out parametric studies on the effect of ground motion characteristics, dynamic soil properties and impedance contrast ratio for typical soil profiles.

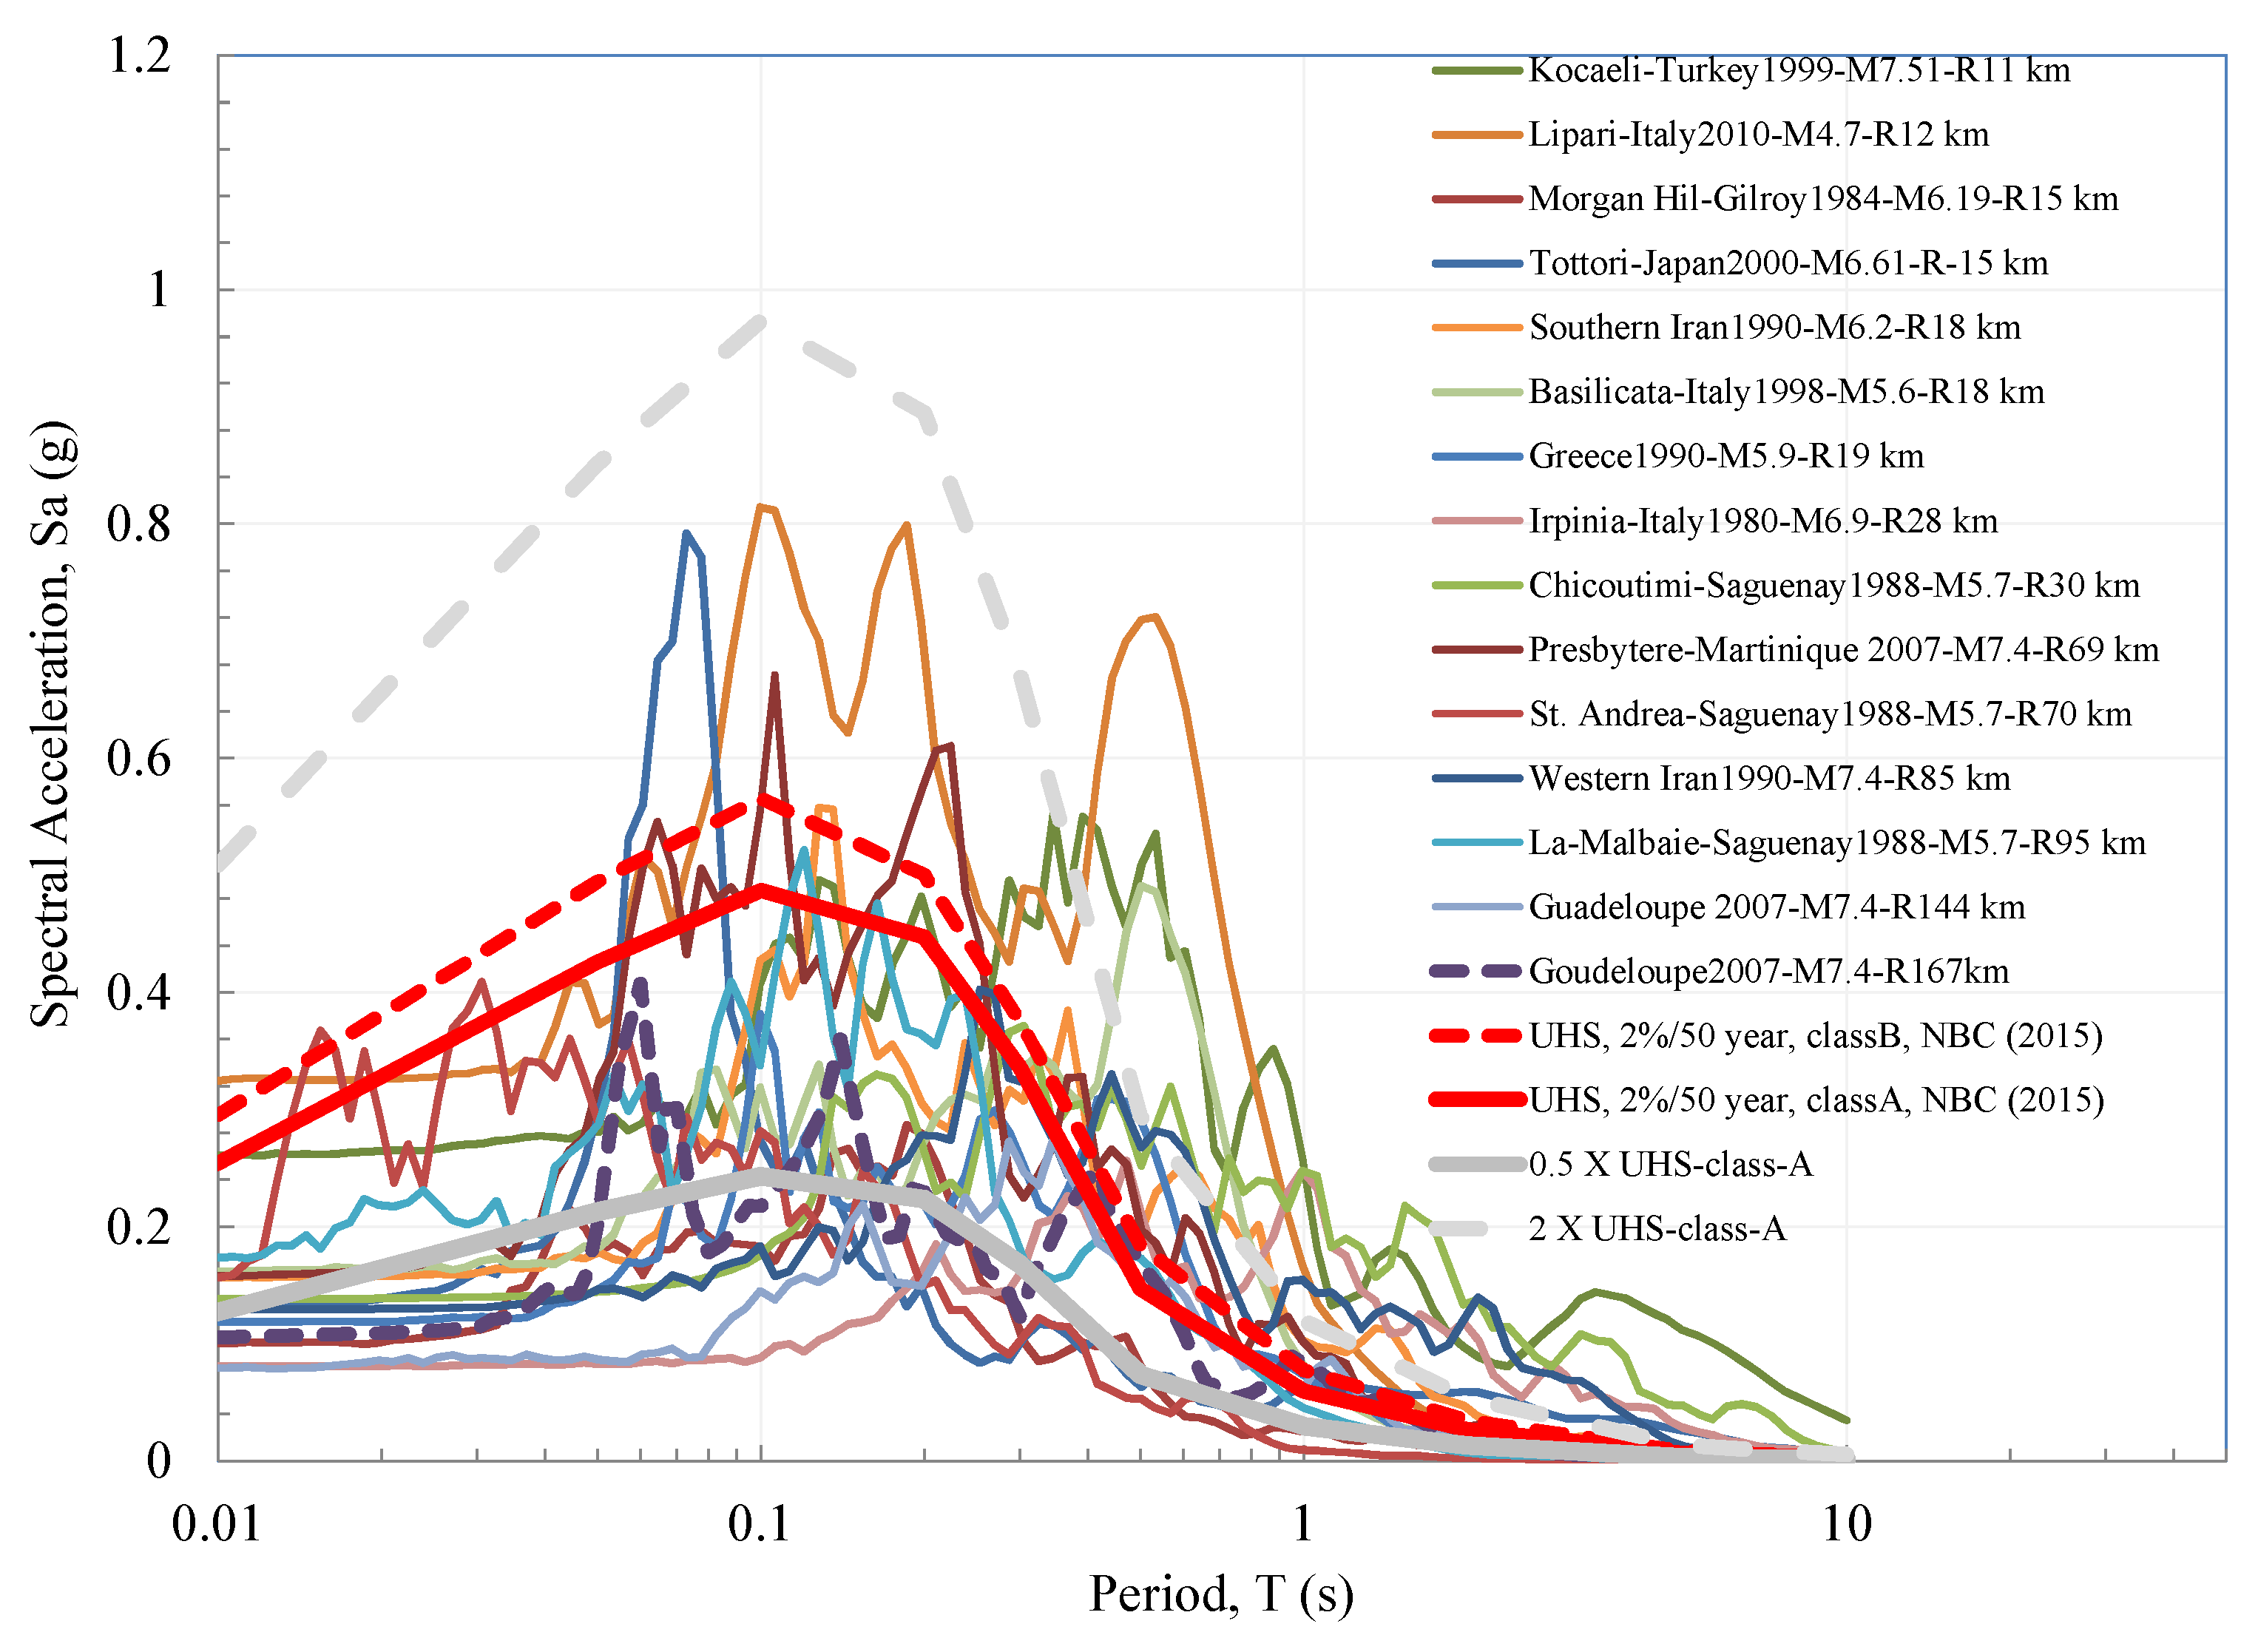
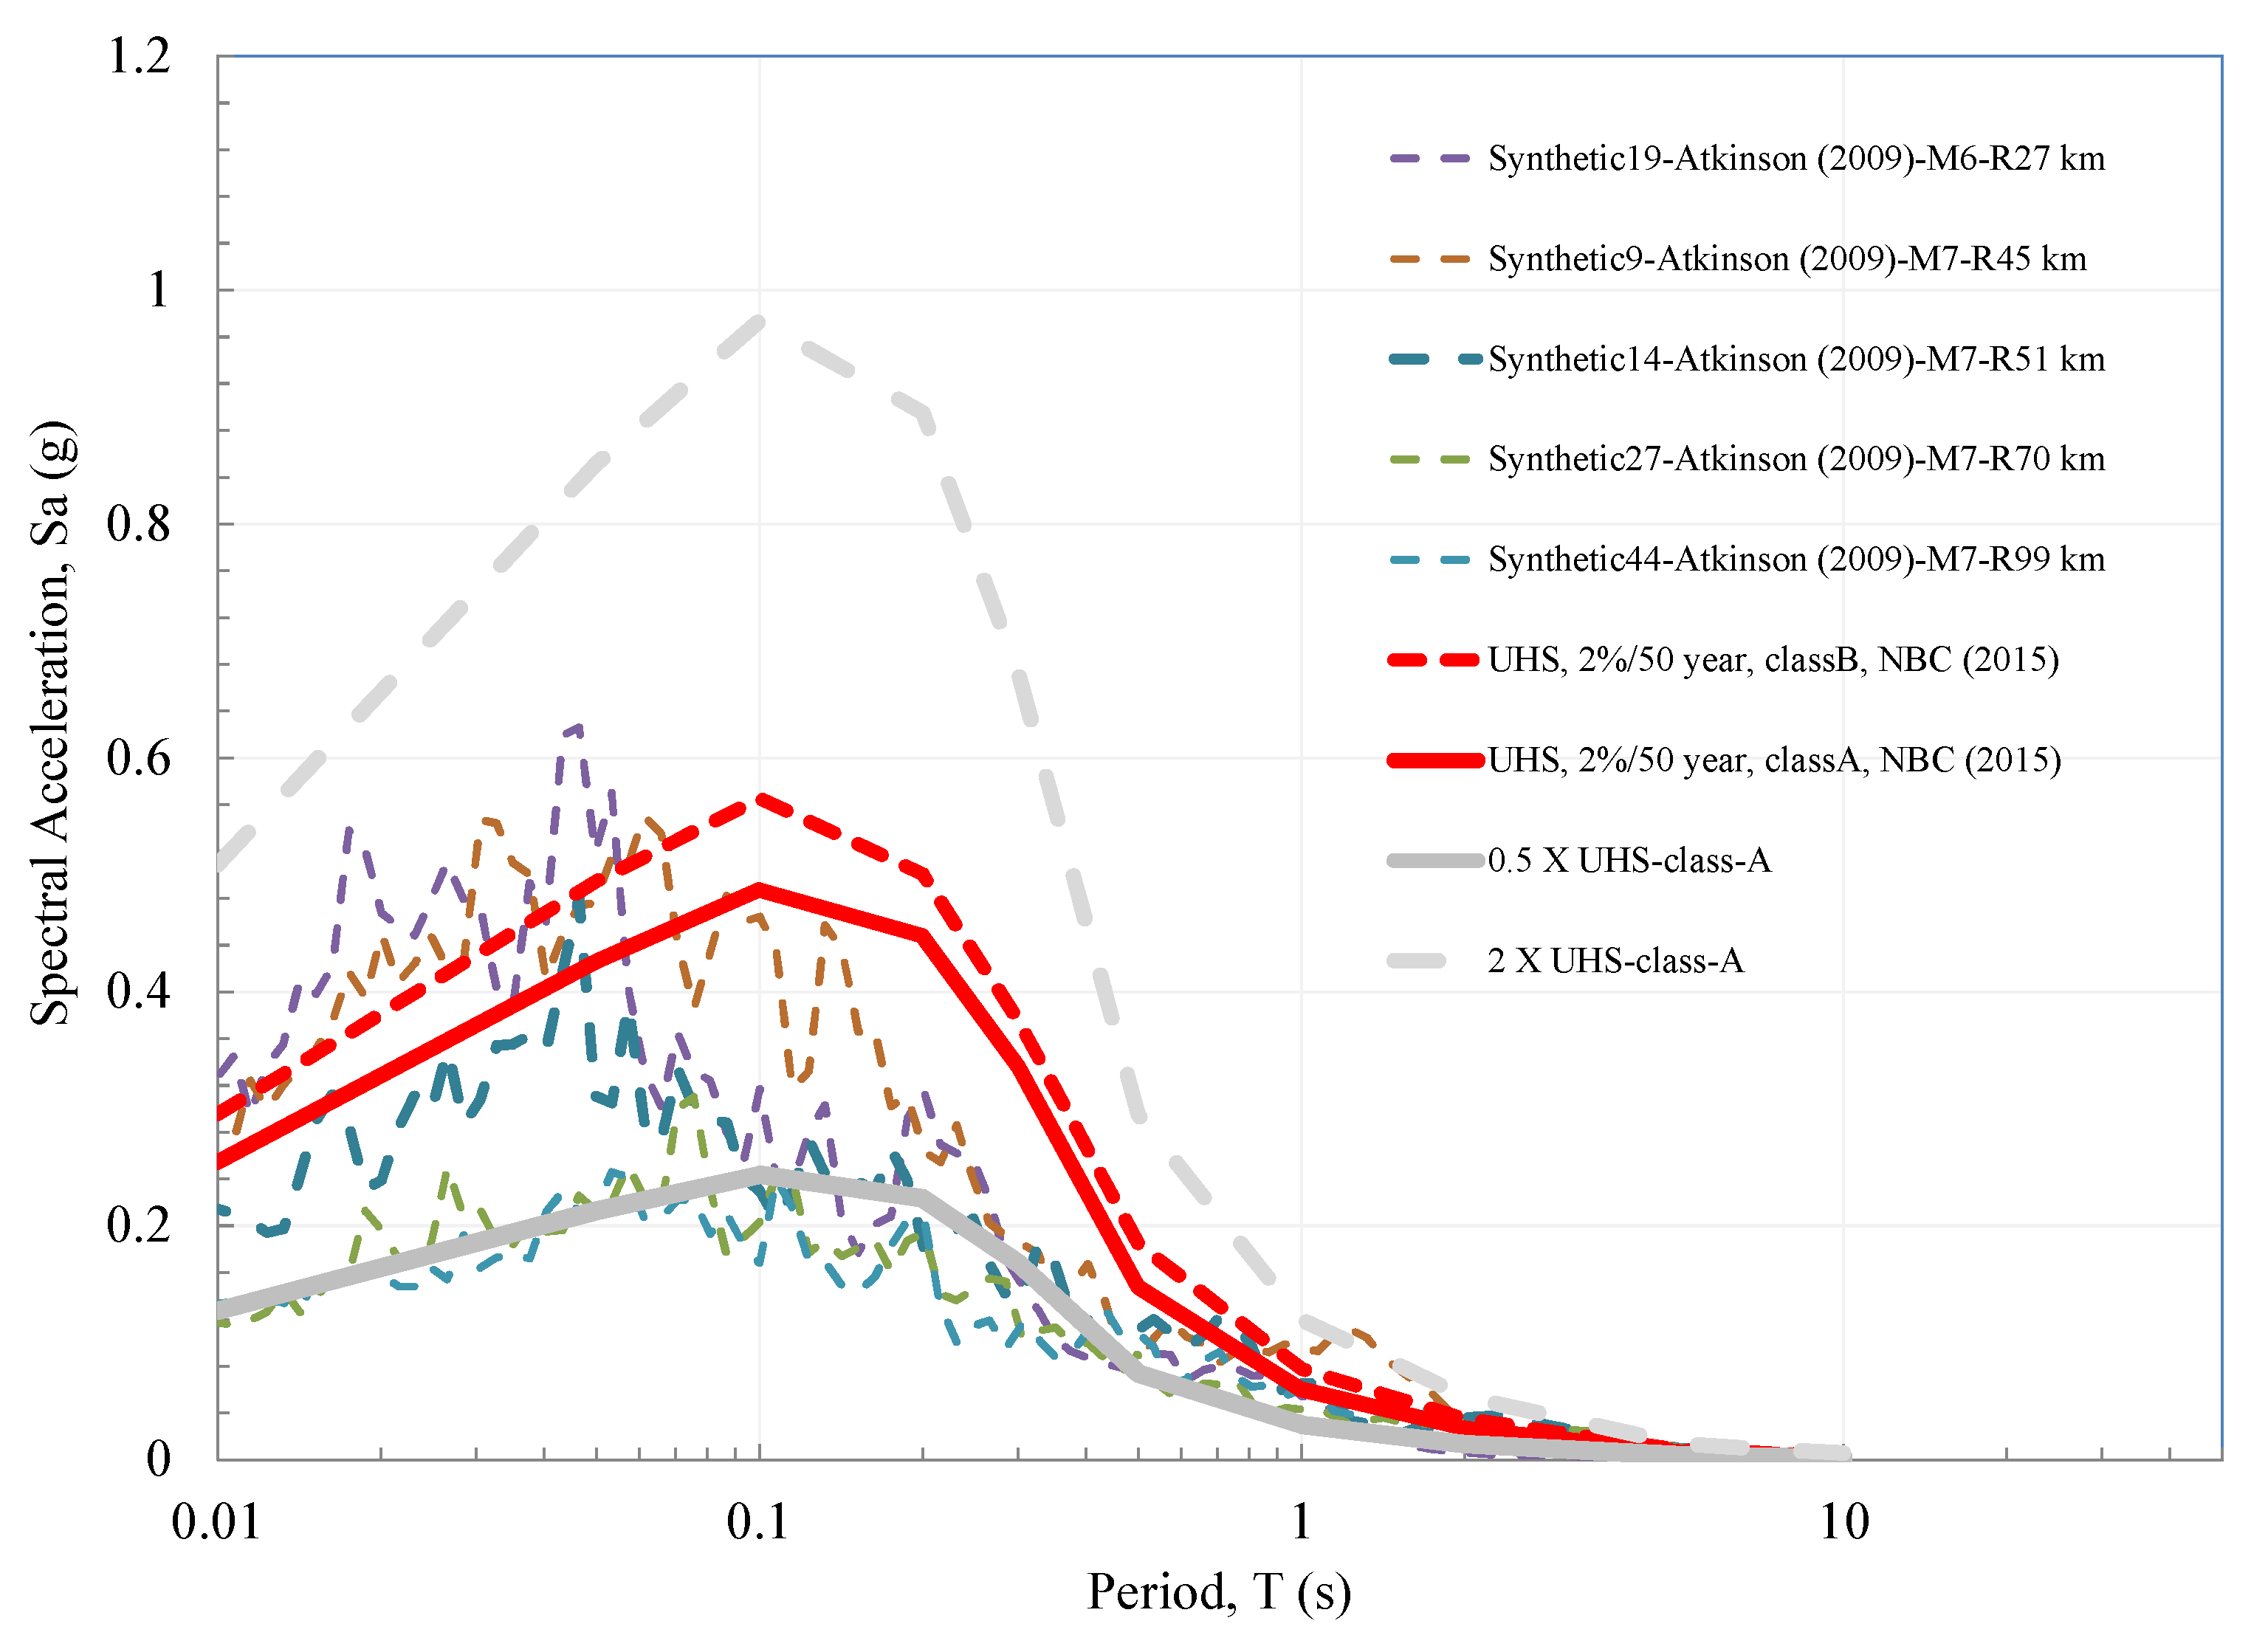
2.1. Selection of Input Rock Ground Motions

A set of 15 records of rock motions, listed in Table 1, is selected from the databases of the Pacific Earthquake Engineering Research Center (PEER), the Engineering Strong-Motion database and the Center for Engineering Strong Motion [32]. An additional five synthetic ground motions are selected from [33] that provide a good fit to short periods of the Uniform Hazard Spectra (UHS) for Eastern Canada, which are important for amplification at sites with shallow deposits. The ground motions are selected to match the 2% in 50 years spectrum for Montreal for moment magnitudes between 4.5 and 7.5 and epicentral distances from 10 to 170 km on strike-slip and normal faults recorded at class B and A sites (Figure 1 and Figure 2). The accelerograms are selected to ensure an approximate match to the UHS PGA of 0.25 g, and an overall match with the shape of the UHS for periods from 0.1 s to 2 s.
The recorded ground motions that are selected in Table 1 have a high energy content at short periods, as shown in the spectrum of Figure 1 and Figure 2, which is characteristic for Eastern North America and important for the shallow sites with fundamental frequency between 3 and 20 Hz which are prevalent in Montreal.
The site factors are first computed relative to ground motions on rock obtained at class A and B sites. Since the NBCC-2015 site factors are provided for sites with Vs30 of 760 m/s corresponding to the boundary between soil classes C and B, the site factors for Class D sites calculated in this study are normalized relative class C site factors to be consistent with the NBCC.

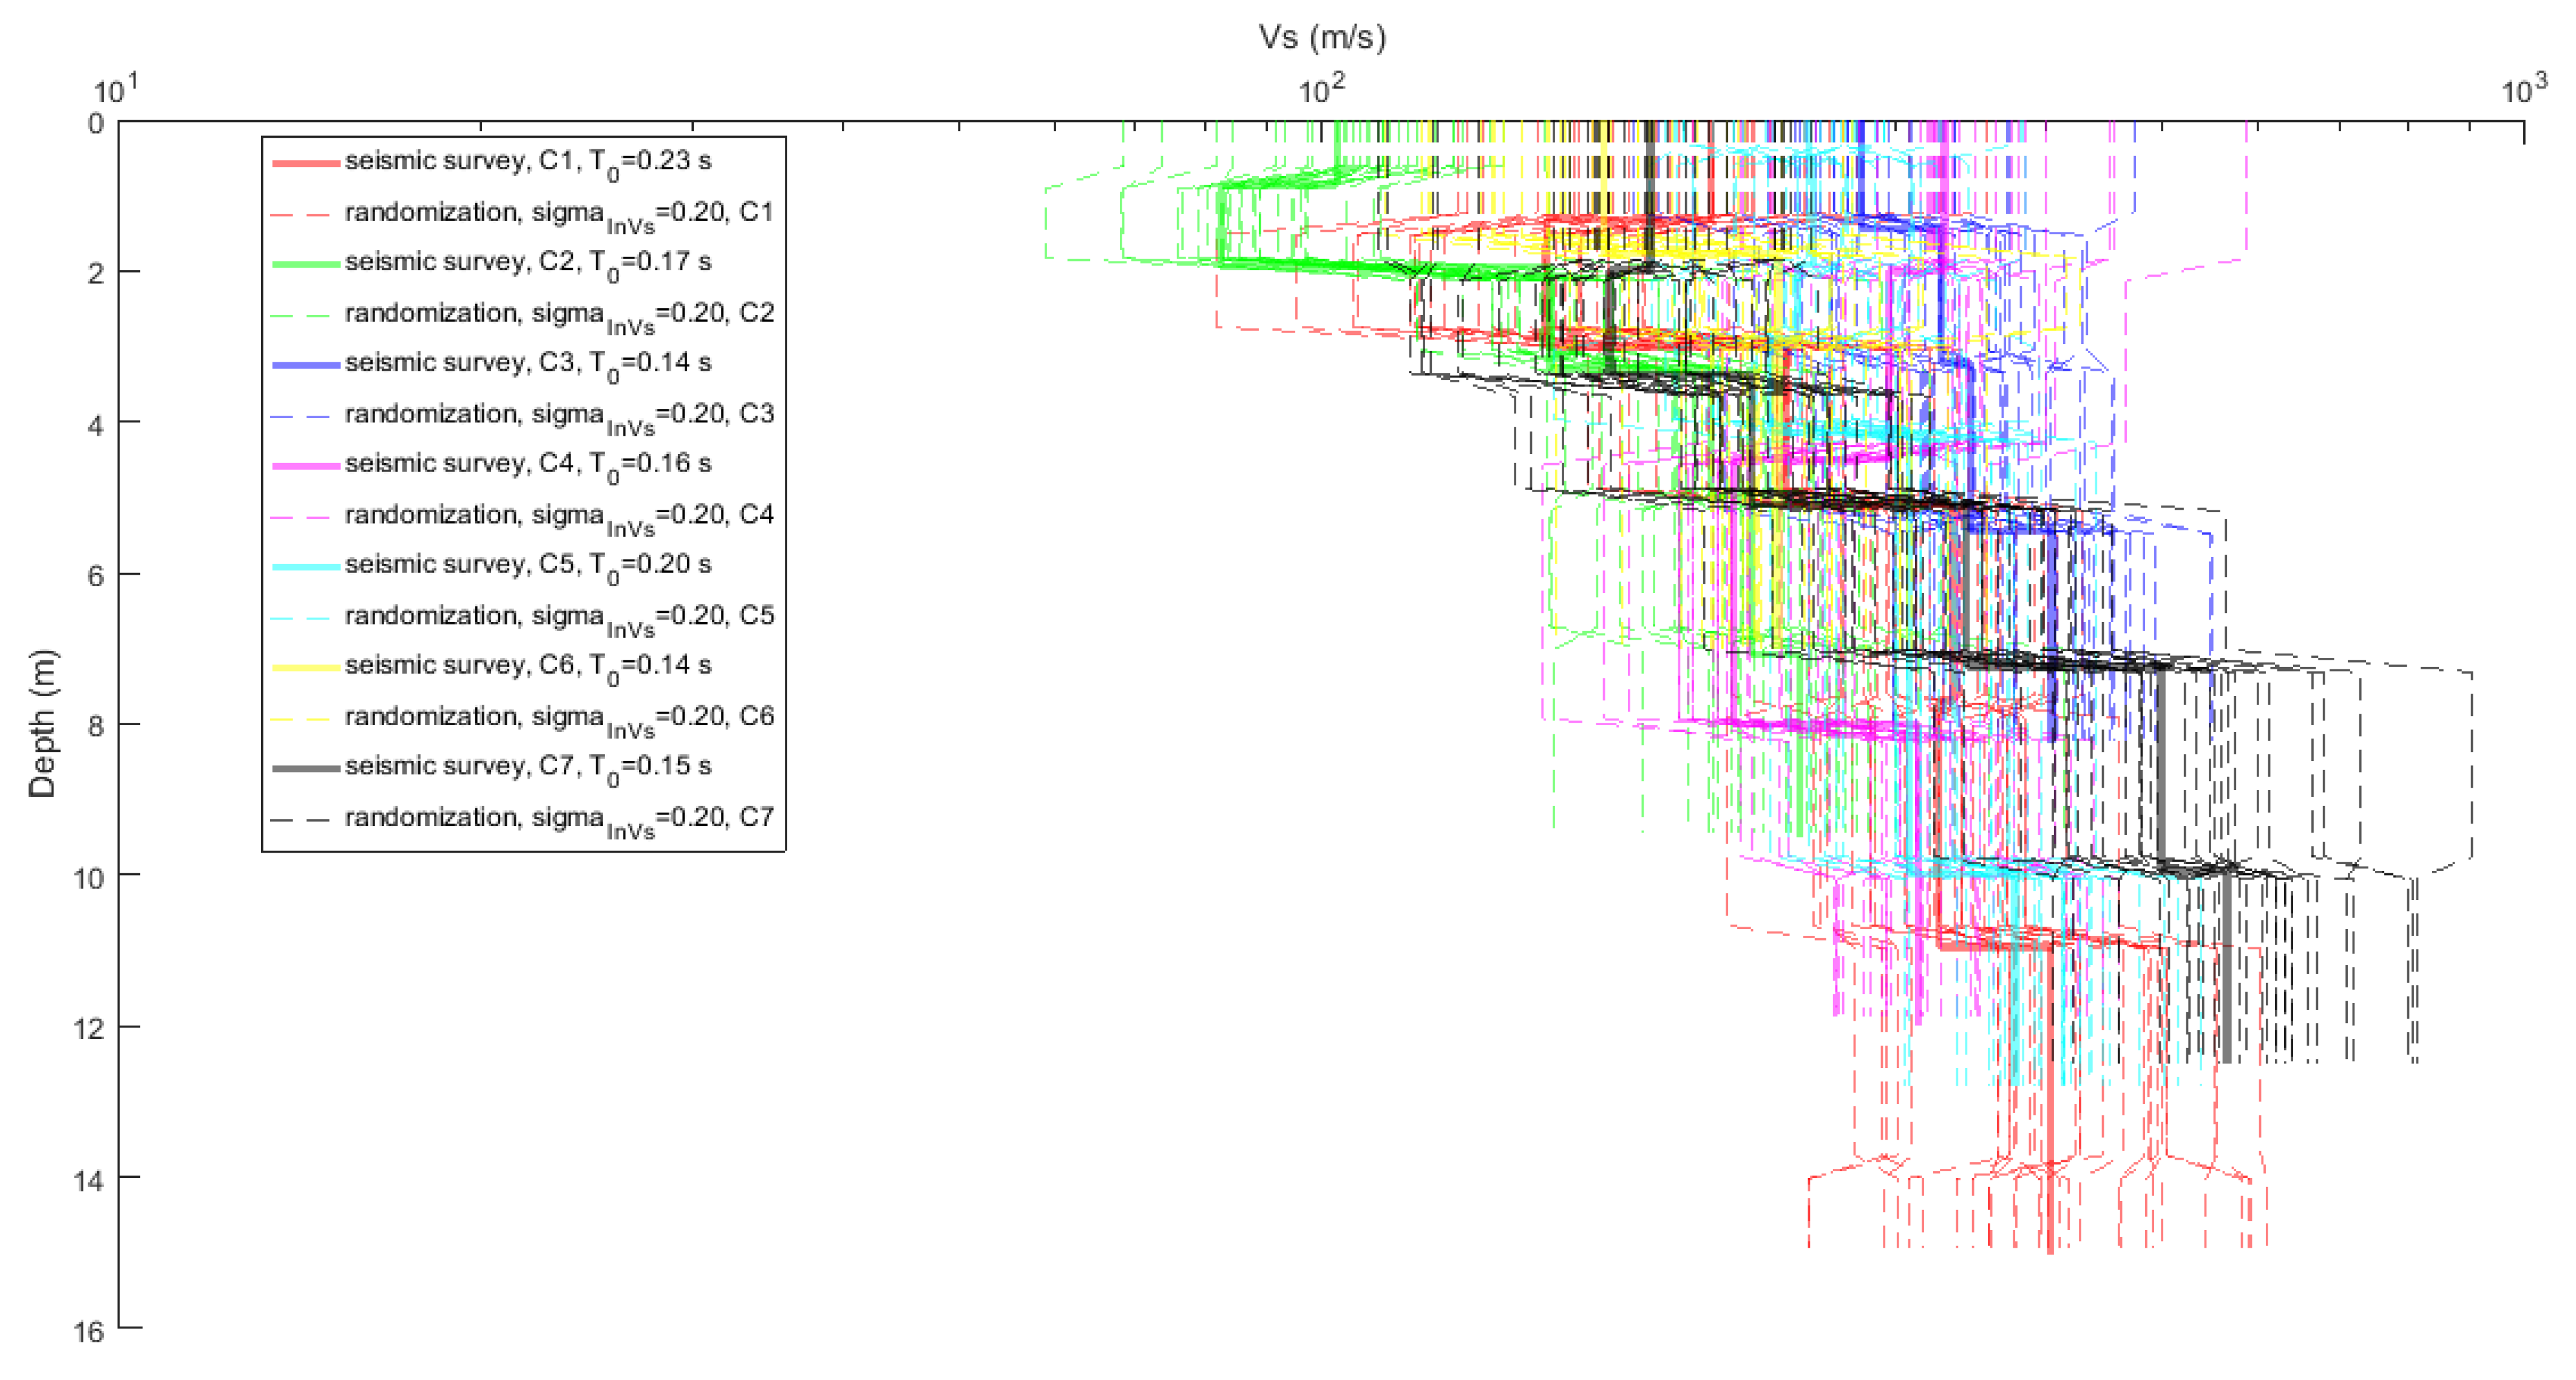
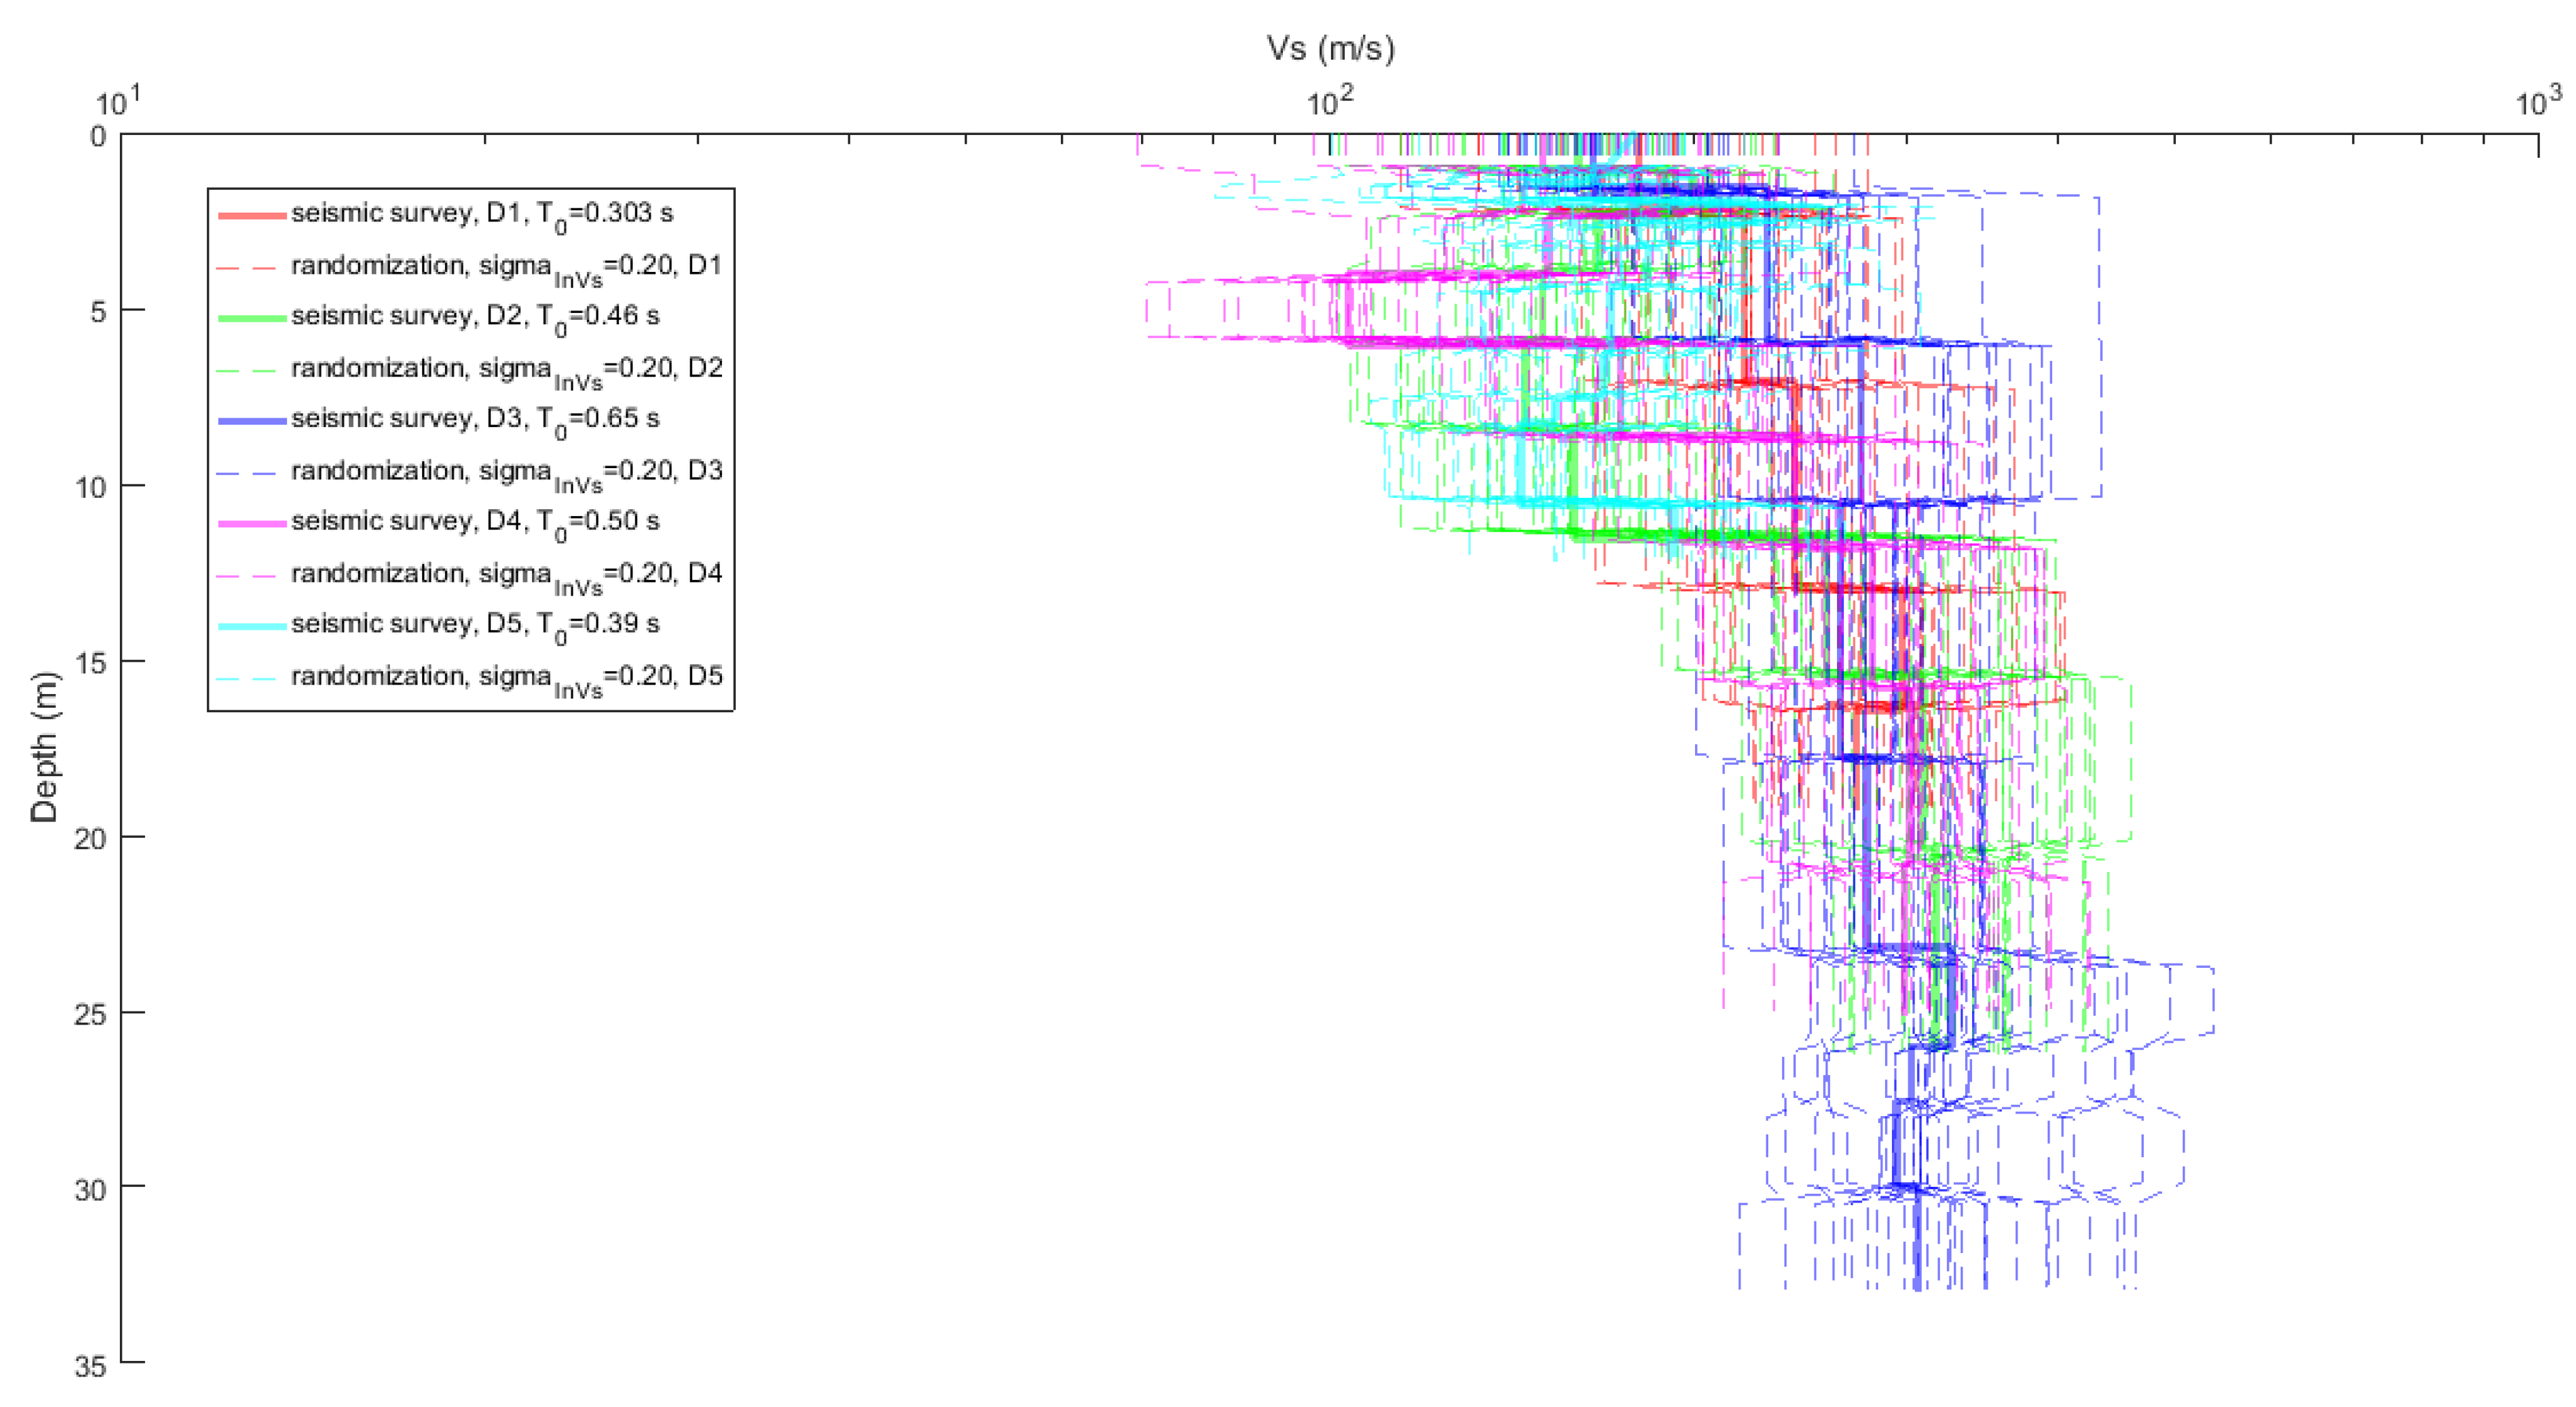
2.2. Randomization of Vs Profiles Obtained from Seismic Surveys

The surface geology of Montreal is an interlayered deposit with clay, silt and dense sand overlying till or rock and is the result of several alternating periods of glaciation followed by the emergence of the Champlain Sea and channeling by the St. Lawrence River and its tributaries [34]. Equivalent linear 1-D analyses of ground response are performed for a set of 12 sites representative of soil classes C and D (Figure 3). Their location is shown on Figure 3 with the probabilistic microzonation maps produced by Talukder and Chouinard [35].
The selected sites are representative of the variability in the stratigraphy and depth to bedrock for each site class. Figure 4a,b show the Vs profiles obtained from seismic surveys for 7 sites selected in class C and 5 sites in class D, respectively. The variability of Vs profiles is larger at shallow depths (0 to 10 m) and can be attributed to the heterogeneity of soil deposits compared to deeper layers that consist mainly of clay. The Vs profiles for Montreal are significantly different from the USGS Class C and D profiles [36] and other CENA sites [37] such that sites with similar Vs30 values will have different fundamental frequencies and amplification factors.
Bedrock in Montreal consists mainly of Ordovician limestone, dolomite, shale and Cambrian sandstone and can vary widely in quality [34]. Boyer [38] notes that average Vs for shale and limestone are 967 and 2900 m/s, respectively with high coefficient of variation. The surface geology of Montreal is an interlayered deposit with clay, silt and dense sand overlying till or rock. The unit weight of the soils is listed in Table 2. It is noted from Table 2 that the density of Leda clay is lowest among other soil types.
One of the important sources of variability for amplification factors for a given site class is the variability in soil profiles [39,40,41]. The procedure proposed by Silva et al. [36] is used to generate random soil profiles that account for trends and variability as a function of depth as well as the spatial correlation between shear wave velocities. Shear wave velocities are assumed to be lognormally distributed and interlayer correlation coefficients as a function of depth and layer thickness are proposed from the analysis of over 900 velocity profiles. The soil column is divided in layers and the shear wave velocity for the layer is normalized such that,
Z i = ln ( V i ) ln ( V median ( h i ) ) σ lnV
where, Vi is the shear-wave velocity of the ith layer, Vmedian(hi) is the median shear-wave velocity at mid-depth of the layer and σlnV is the standard deviation of ln(Vi). The normalized values Zi are correlated with the layer above (i − 1) using a first order auto-regressive relation:
Z i = ρ · Z i 1   ±   ε i · ( 1 ρ 2 ) ;   i   >   1
where εi is a normal random variable with zero mean and unit standard deviation; and ρ is the interlayer correlation coefficient which is a function of the depth (h) and thickness (t) of the layer.
ρ ( h ,   t ) = [ 1 ρ ( h ) ] ρ t ( t ) + ρ ( h )
where ρ(h) is a depth dependent interlayer correlation coefficient, and ρt(t) is a thickness dependent correlation coefficient:
ρ ( h ) = ρ 200 ( h 200 ) b ;   h     200   m
where, ρ200 is the correlation coefficient at 200 m depth.
The variability (σlnVs) of shear wave velocities for each soil class for sites in California is between 0.27 and 0.37. The correlation functions are considered to be valid for other locations and have been used by several other authors for randomizing soil profiles for the Eastern and Central United States [40,41,42]. Since the Vs profiles for Montreal do not exceed 30 m, Equation (4) can be used to calculate the correlation coefficient of the Vs randomization. As a result, the information required to develop randomized shear-wave velocity profiles consists of the baseline shear-wave velocity profiles, the standard deviation of the natural log of the shear-wave velocity σlnV, and the interlayer correlation model parameter ρ(h) [36]. The software Strata [8] is used to randomly generate soil profiles using this method for site classes C (Figure 5) and D (Figure 6). A set of 30 Vs profiles were generated for each site class. A total of 210 Vs profiles were generated for the 7 sites in class C (Figure 5) and 150 Vs profiles were generated for the 5 sites in class D (Figure 6). In Figure 5 and Figure 6, the site fundamental frequency T0 is referred to the target Vs profile. The T0 for each site is obtained directly from the Microtremor H/V measurements.

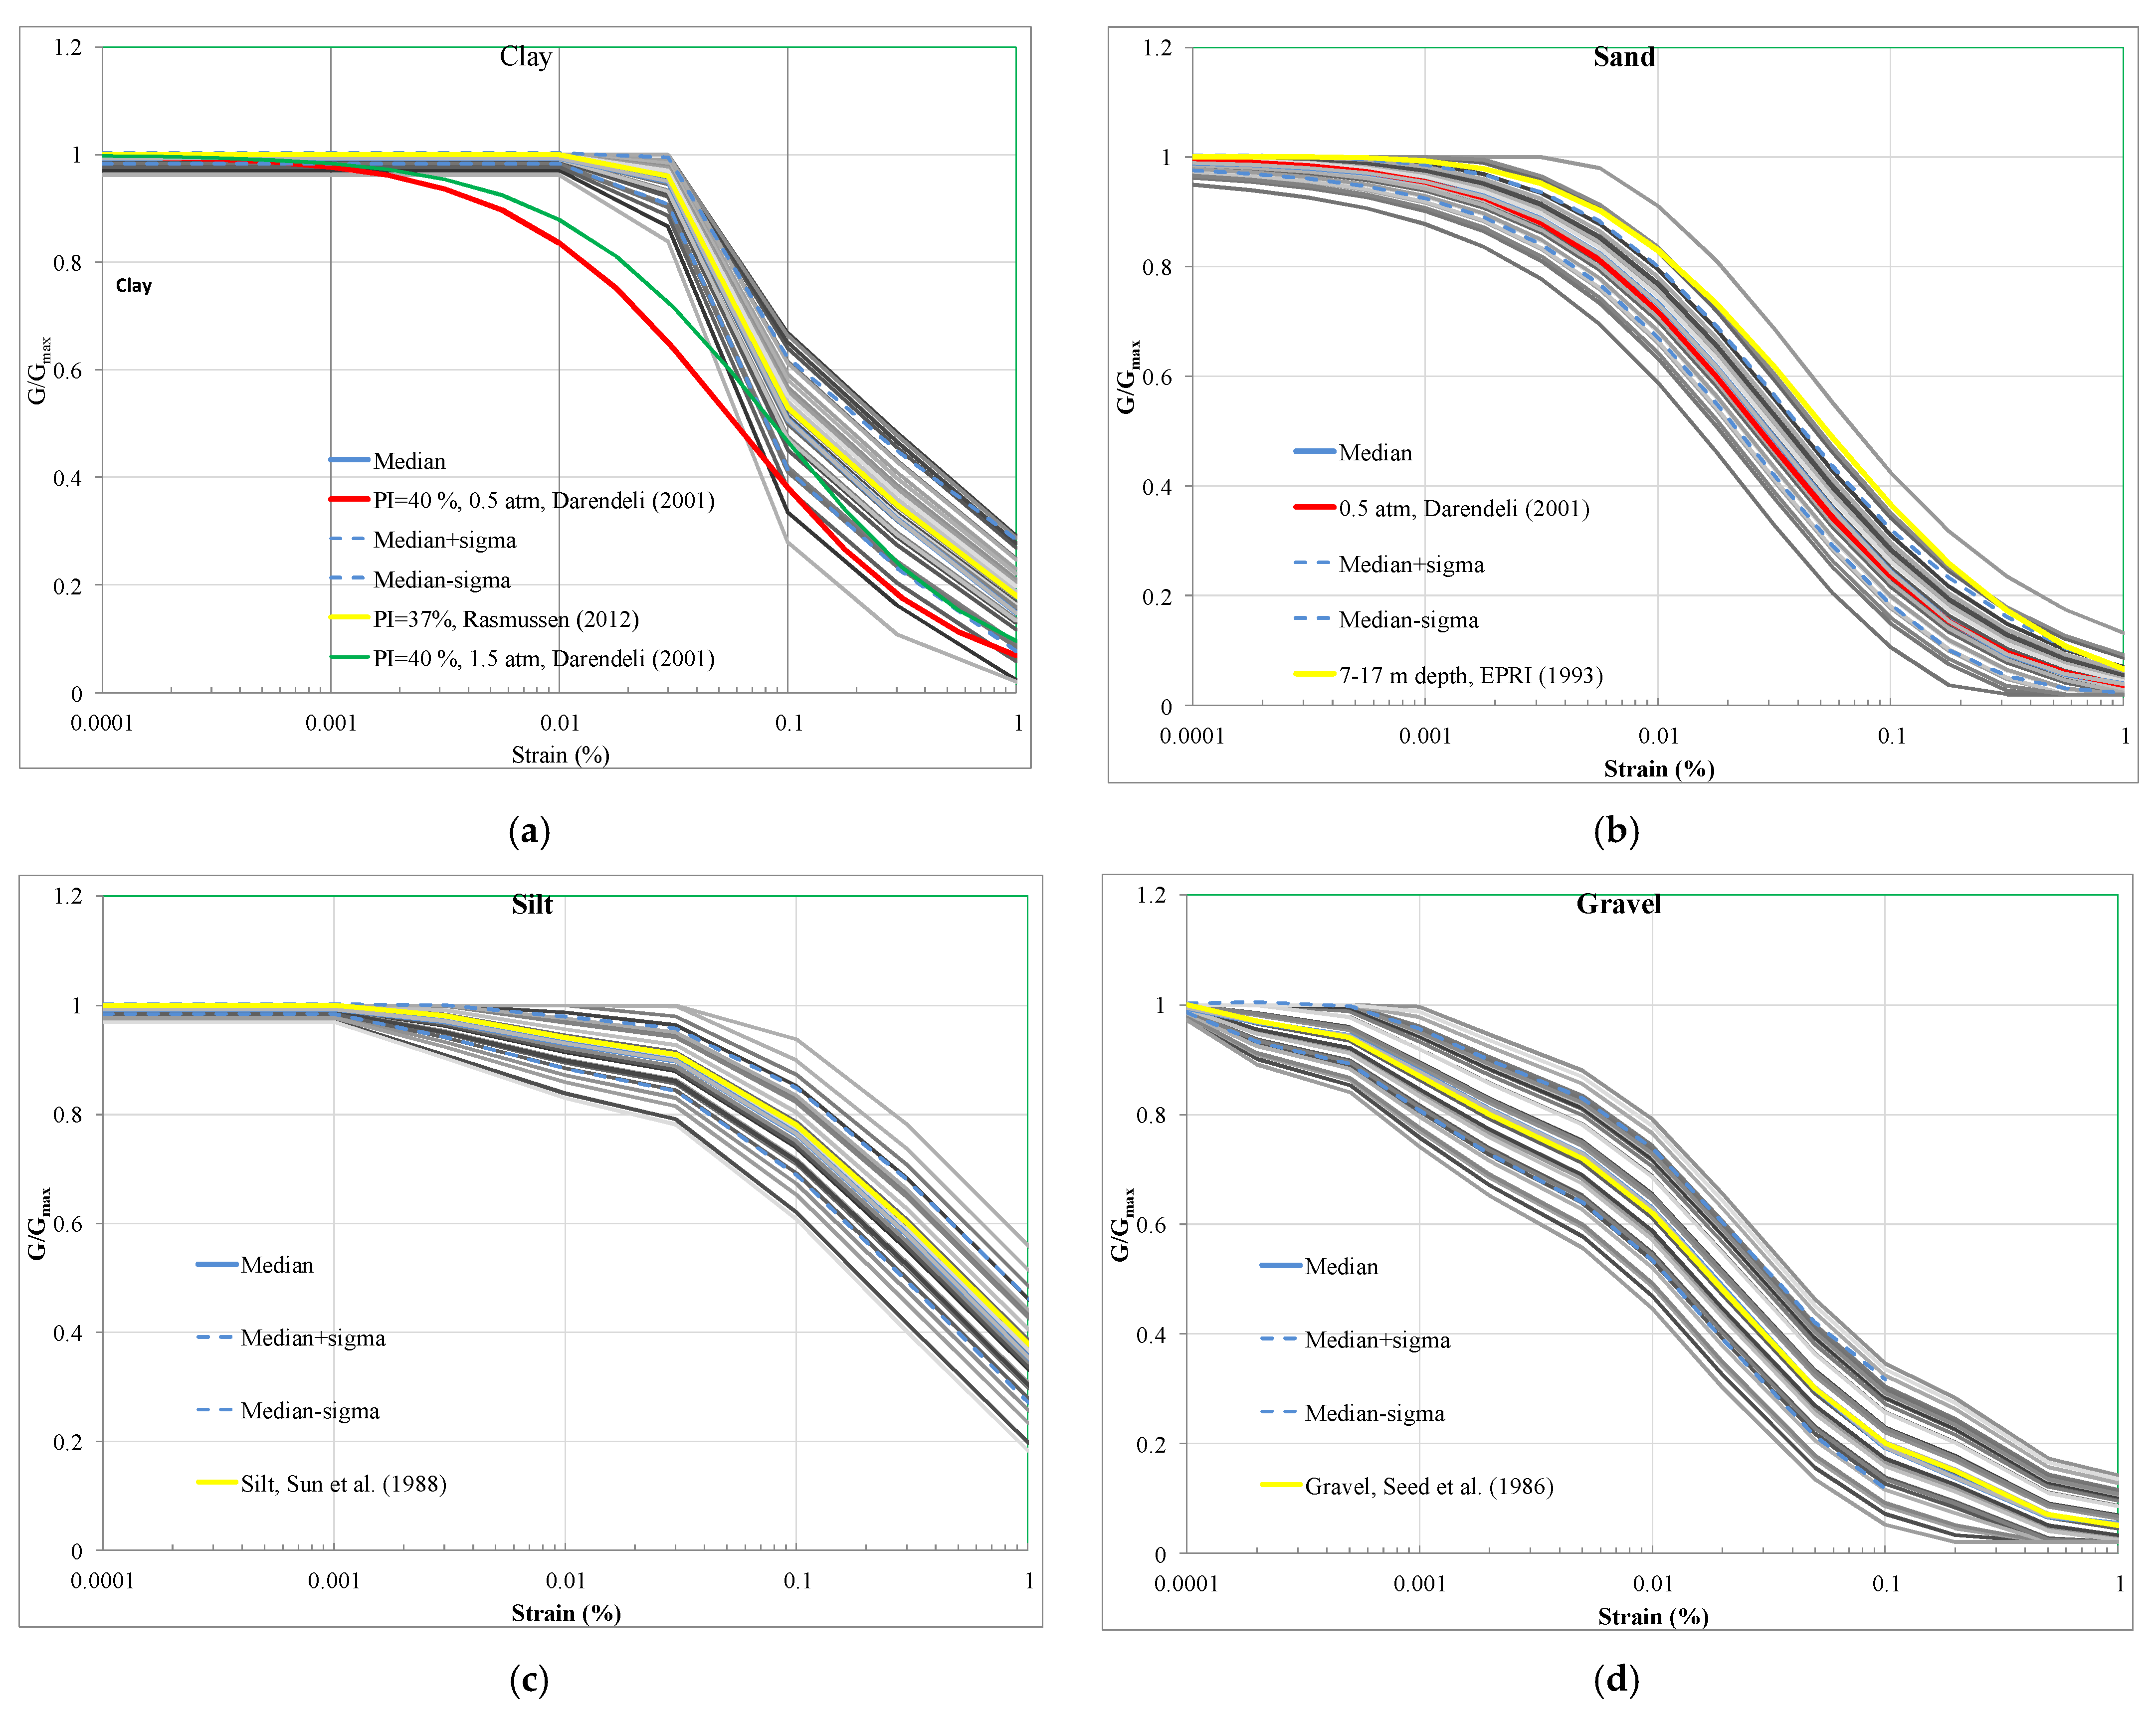
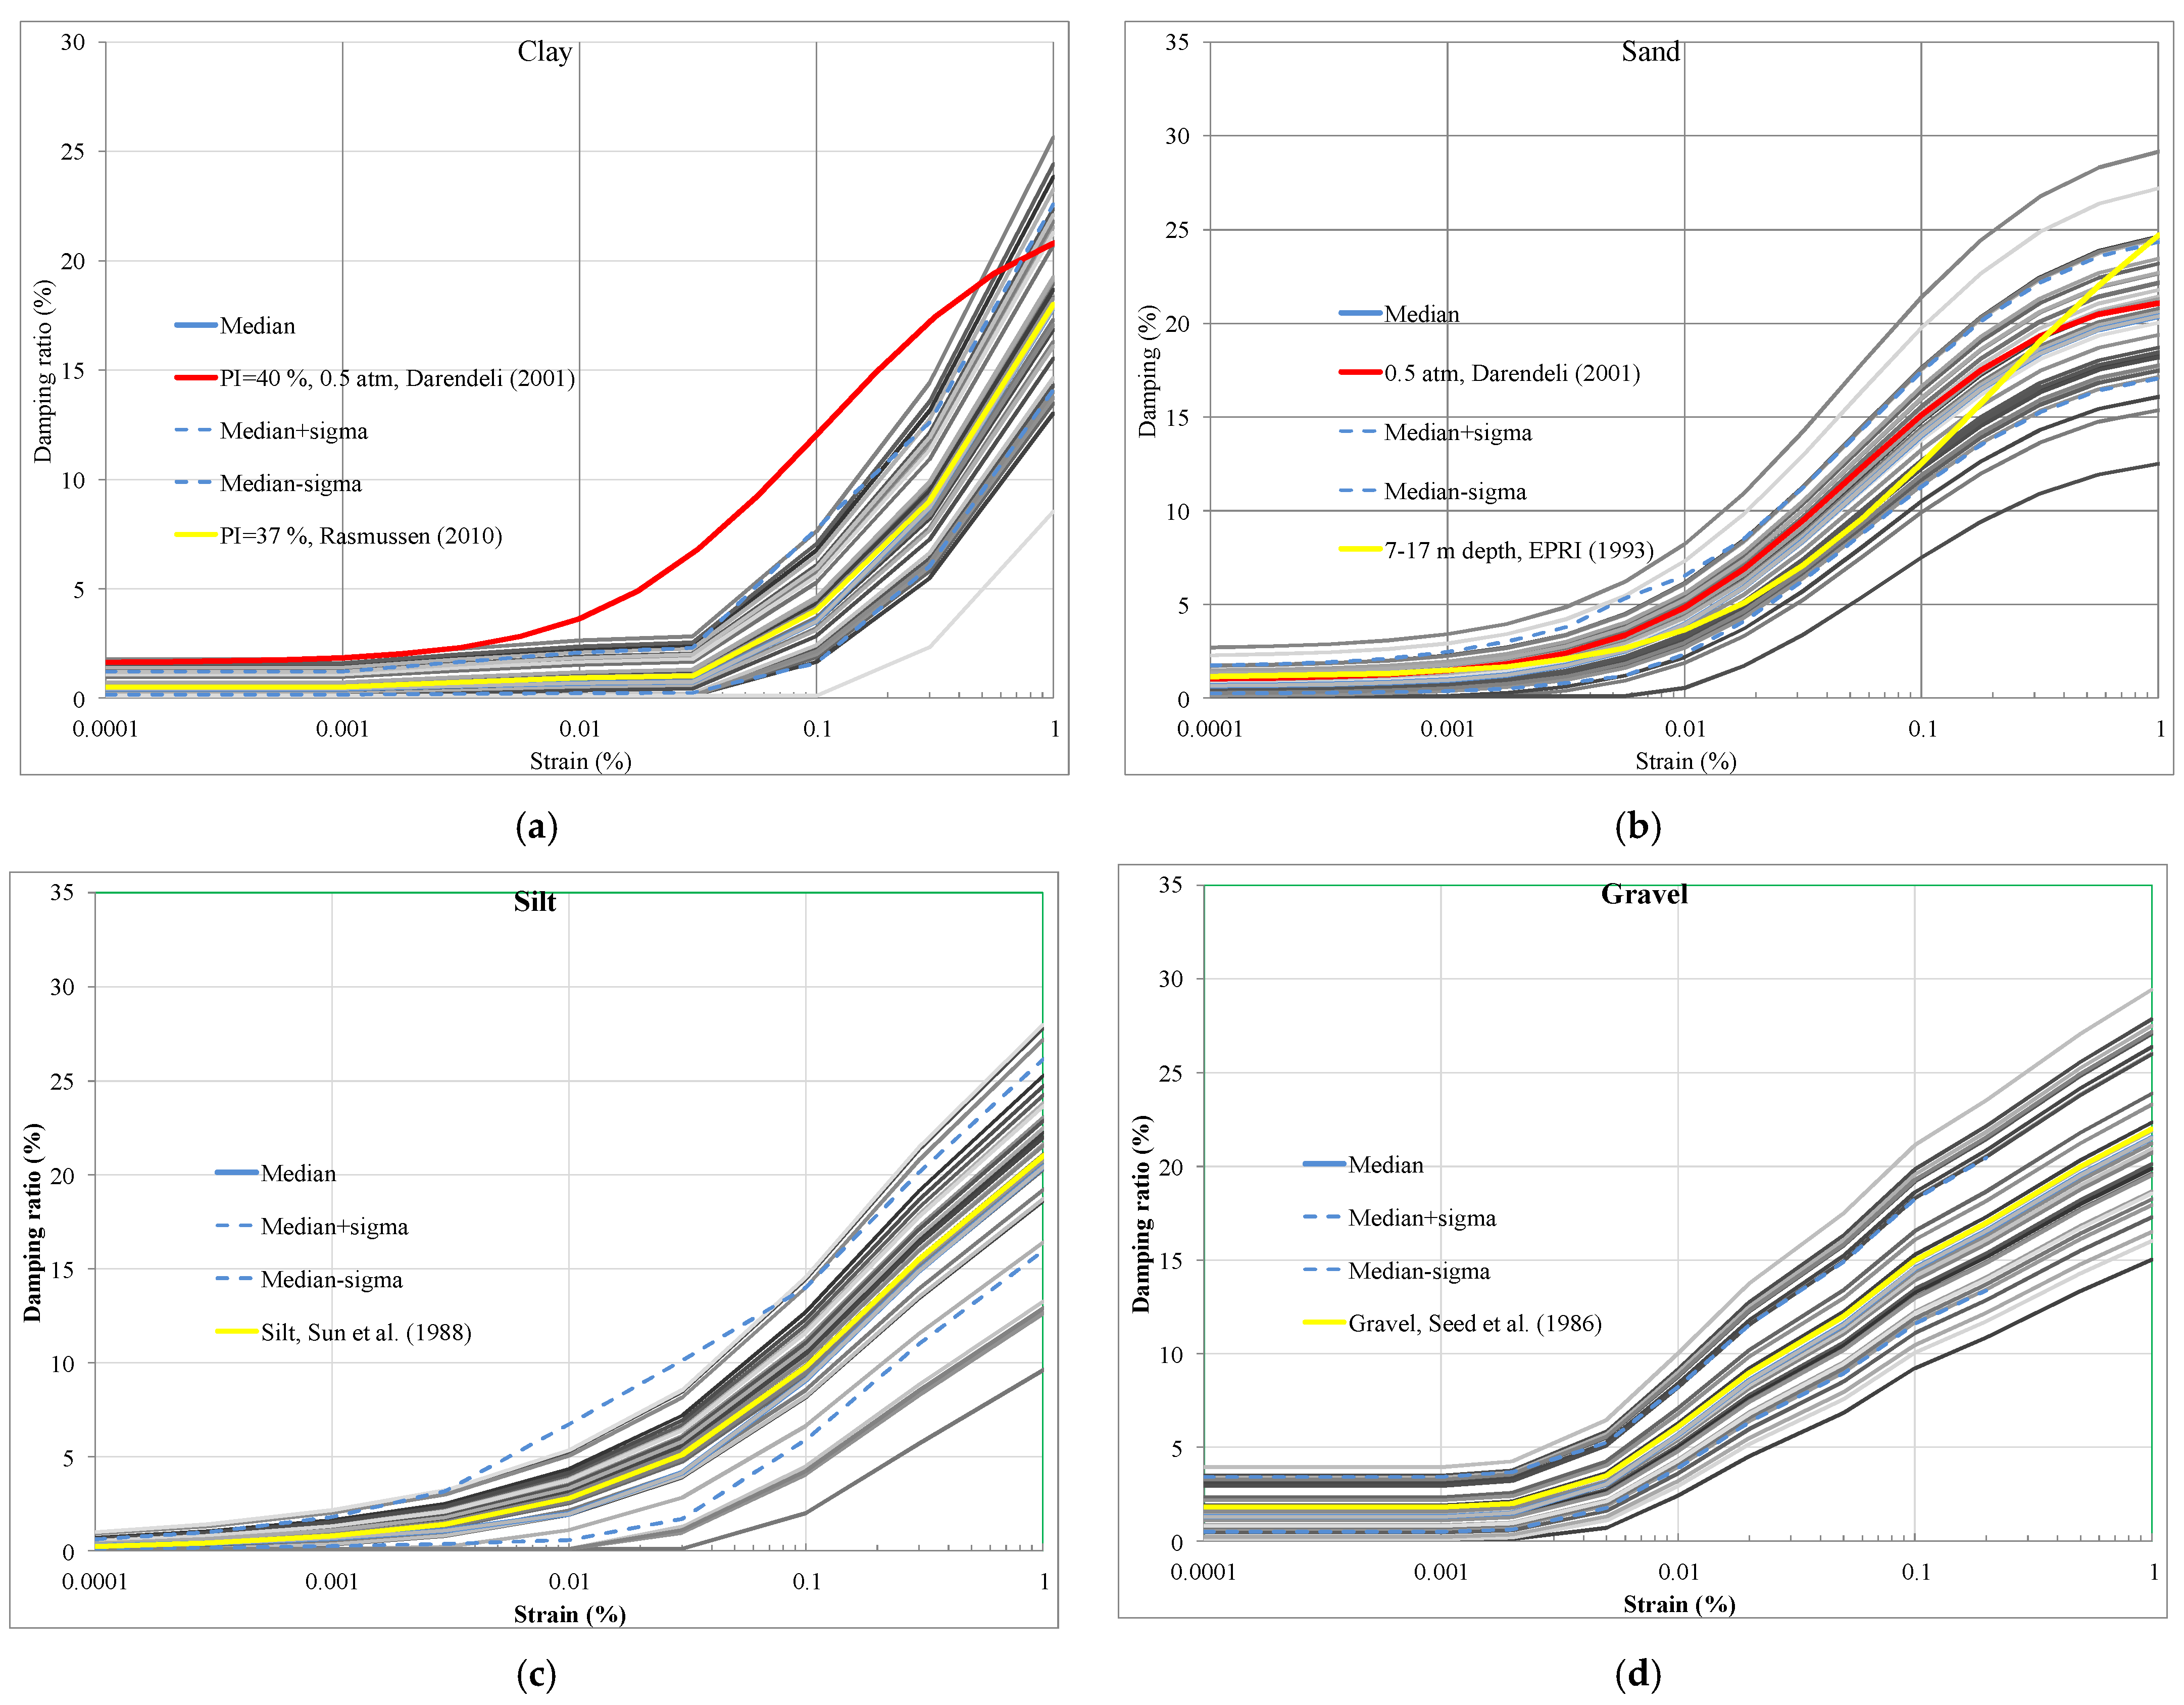
2.3. Randomization of G/Gmax and Damping Ratios Curves

A randomization procedure is used to account for the uncertainty associated with the dynamic properties of each soil type. In the case of the normalized modulus, the uncertainty is maximum in the middle range since the curve is asymptotic to 0 and 1 at the ends. A normal distribution and the parameters proposed by Darendeli [29] for G/Gmax and the damping ratio D are used in this application:
σ G / Gmax = 0.015 + 0.16 · ( 0.25 ( G / G max 0.5 ) 2 )
σ D % = 0.0067 + 0.78 · D ( % )
The non-linear properties G/Gmax and damping ratios as a function of shear strain γ (%) are negatively correlated and pairs of randomized curves are obtained with the following expressions as a function of shear strain [1]:
[ G / G max ( γ ) D ( γ ) ] = [ σ G / Gmax 0 ρ G / Gmax , D σ G / Gmax 1 ( ρ G / Gmax , D ) 2 ] [ ε 1 ε 2 ] + [ m G / G max ( γ ) m D ( γ ) ]
where ε1 and ε2 are uncorrelated standard normal random variables with ρG/Gmax,D = −0.5. Results for G/Gmax and the damping ratios are presented respectively in Figure 7 and Figure 8 for clay, sand, silt and gravel.
The shear modulus G/Gmax and damping ratio curves for clay [30], sand [29], silt [26] and gravel [24] used in this study are shown in Figure 7 and Figure 8, respectively. Each Vs profile is associated with specific G/Gmax and damping ratio curves that are related to the stiffness of the soil layers. For example, the stiffest Vs profile is associated with the highest G/Gmax curve and the lowest damping ratio curve.

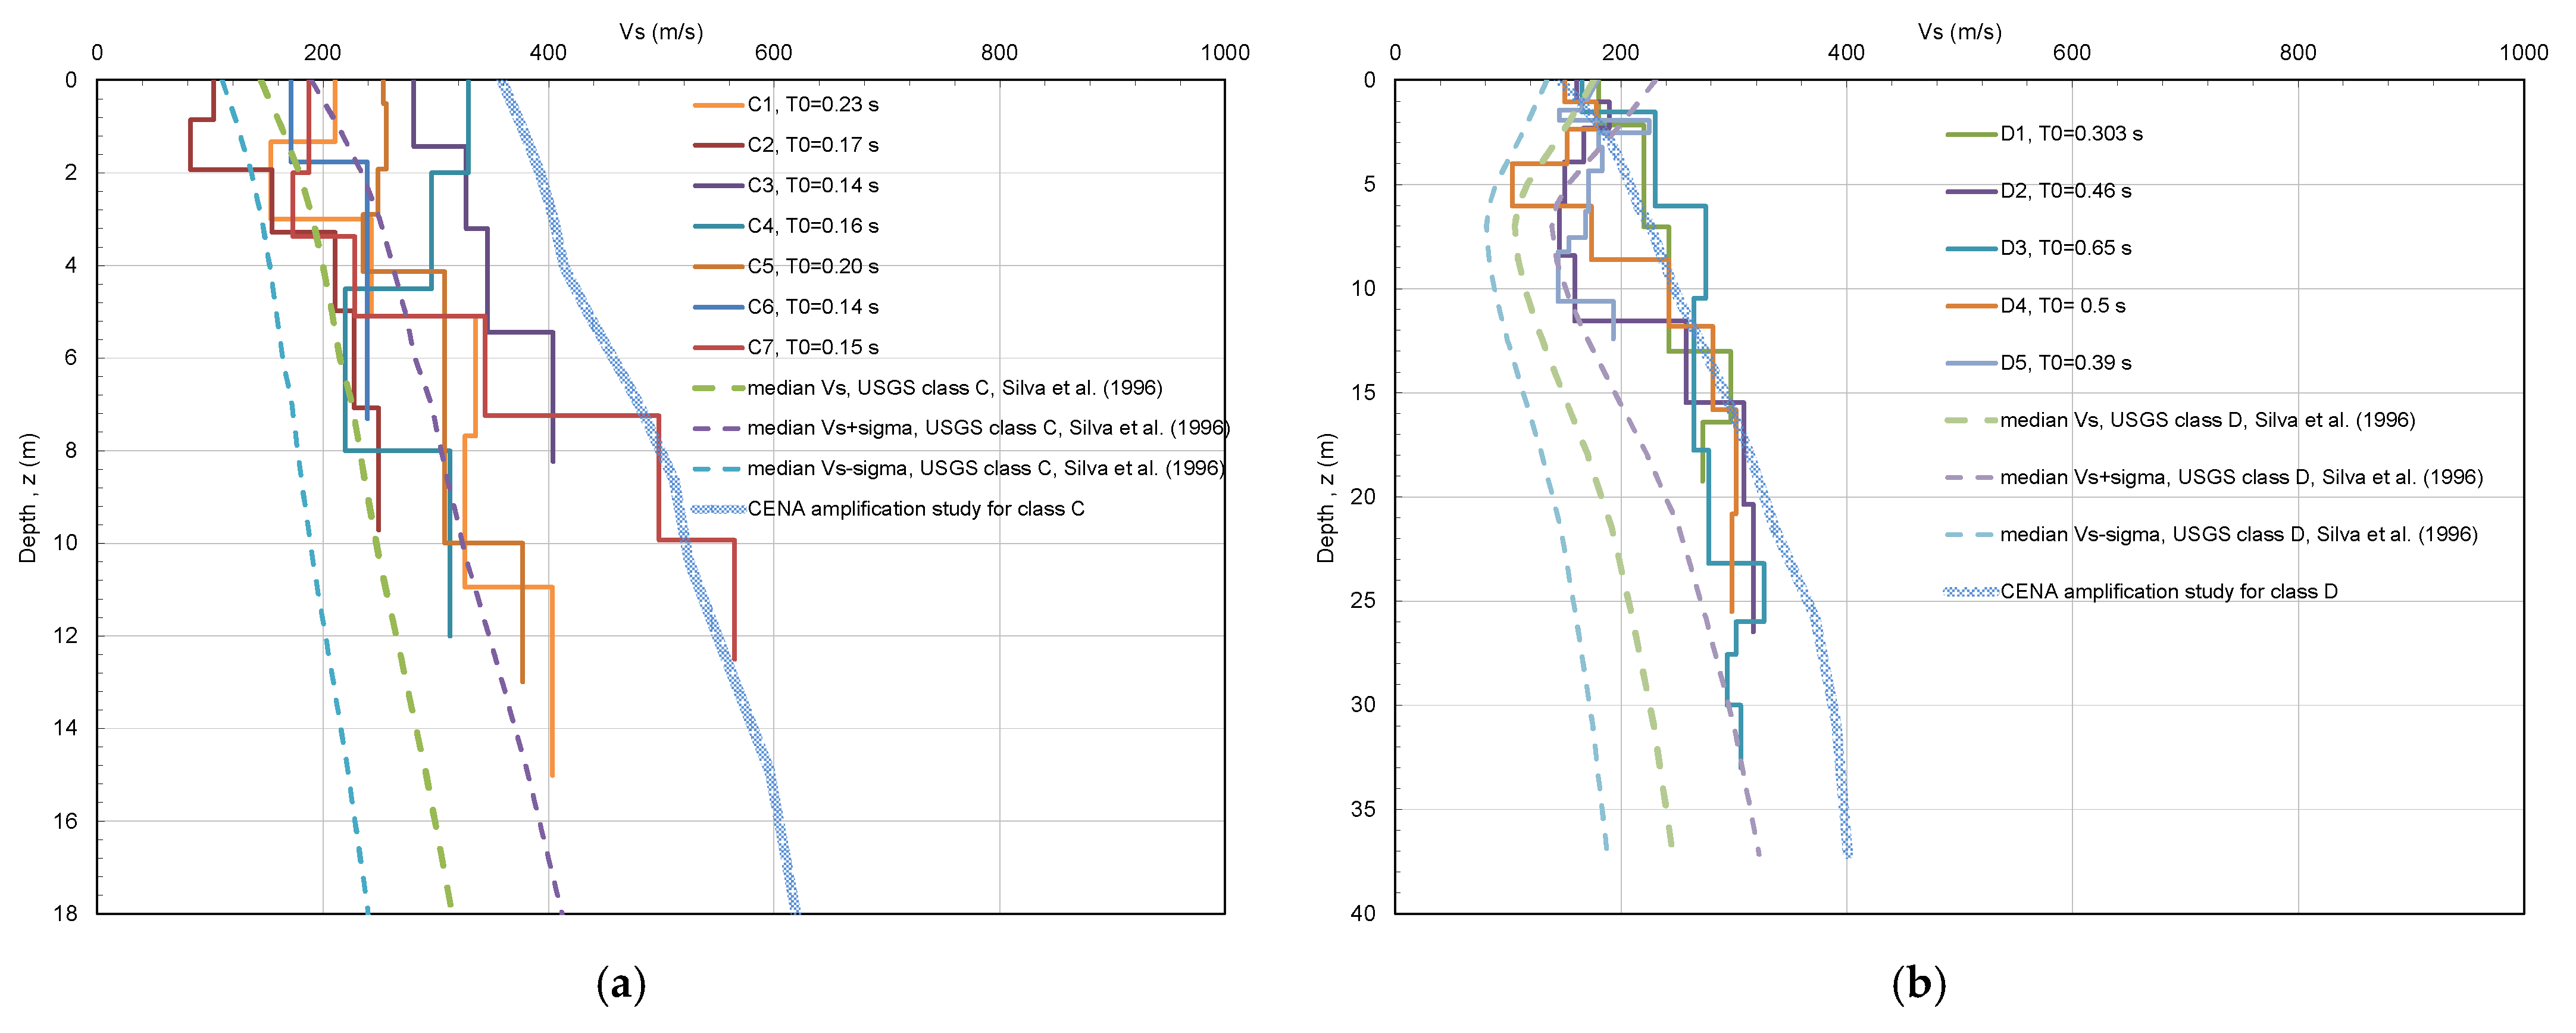
2.4. Relationship between Bedrock Vs versus Rock Quality Designation (RQD)

The rock quality designation is a standard parameter in drill core logging and is a leading indicator for low-quality rock zones [43]. Data on the rock shear wave velocity at various sites where the RQD was also available show a strong correlation between the two measures (Figure 9):
Vs rock = 816.12 + 422 F ;     σ = 322   m / s ;     R 2 = 0.72
where F is the category from 1 to 5 corresponding to the standard five ranges of RQD (0–25%, 25–50%, 50–75%, 75–90%, 90–100%). Rosset et al. [5] considered the average and standard deviation for the rock shear velocity in Montreal of 2300 m/s and 590 m/s, respectively without the RQD information. Here, Vs for rock depends on RQD and the standard deviation is reduced to 322 m/s (Figure 9). This information is used to obtain more precise estimates of site amplifications given the strong influence of the impedance ratio [9,11,12]. Consequently, site amplification factors are obtained in the following sections for RQD classes 1, 3 and 5 (0–25%, 50–75% and 90–100%, respectively). Falcone et al. [44] estimates the effect of stiffness and thickness of soft bedrock (Vs ≤ 800 m/s) on surface ground motion modifications.

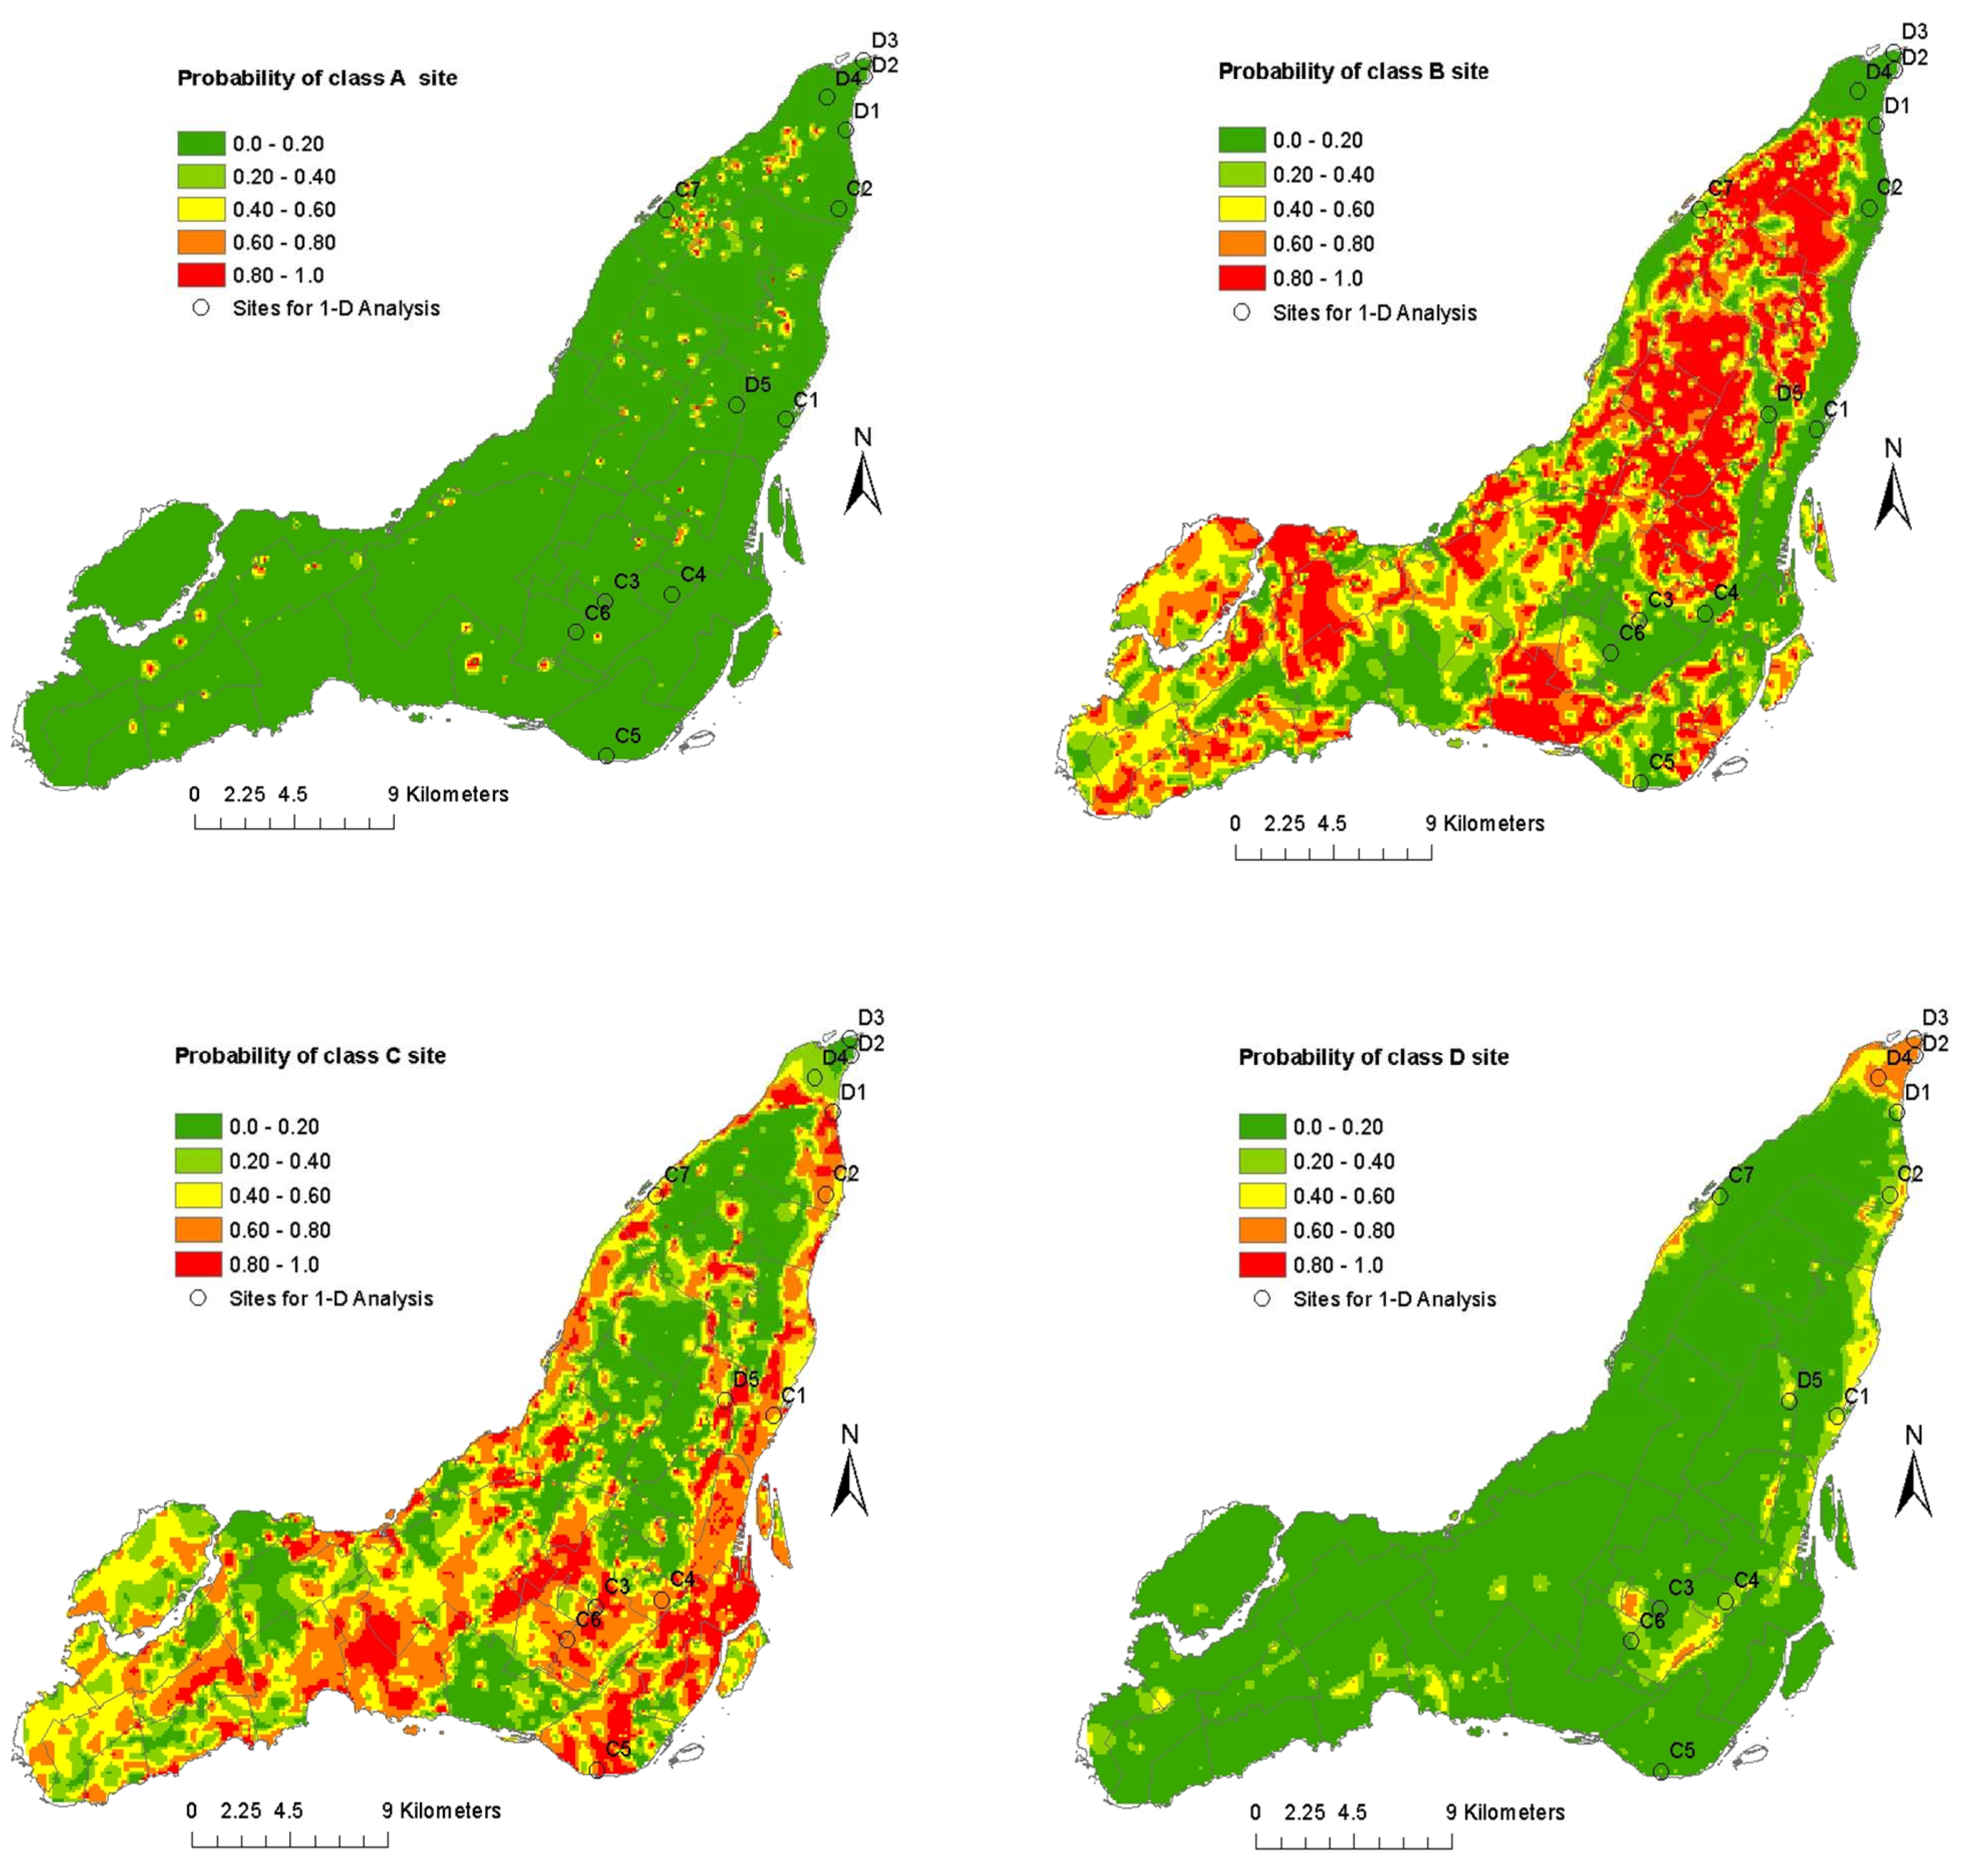
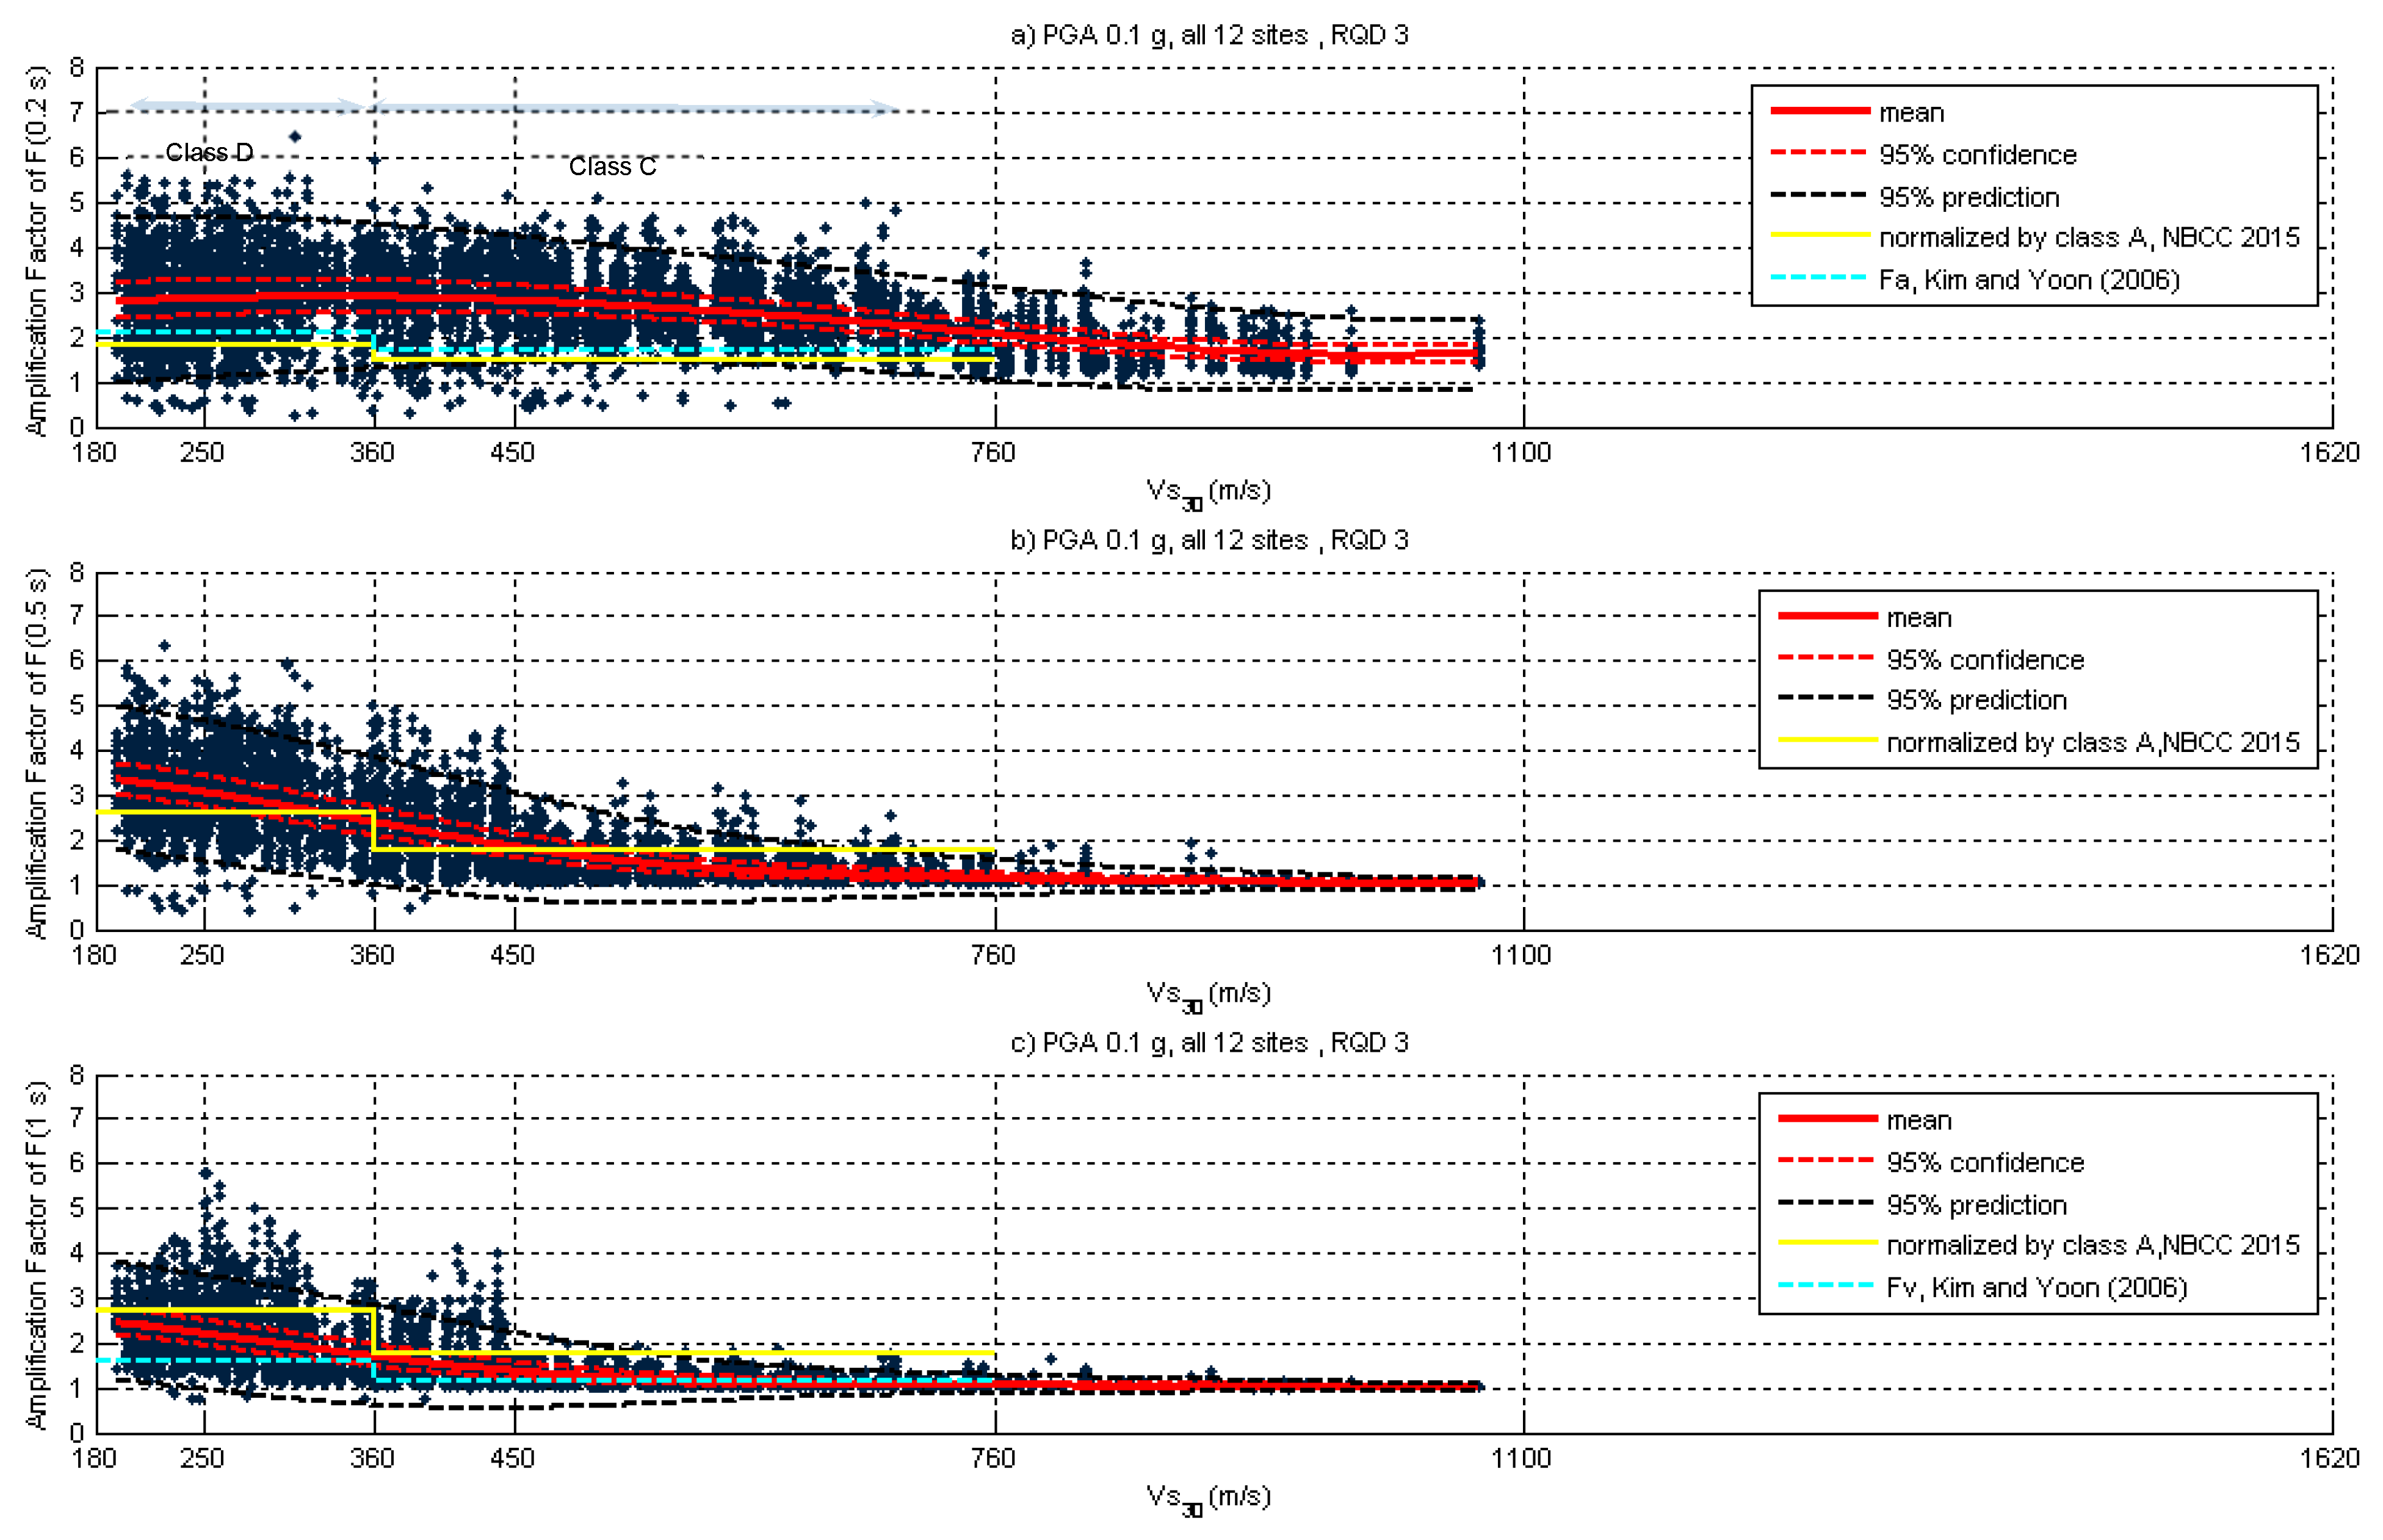
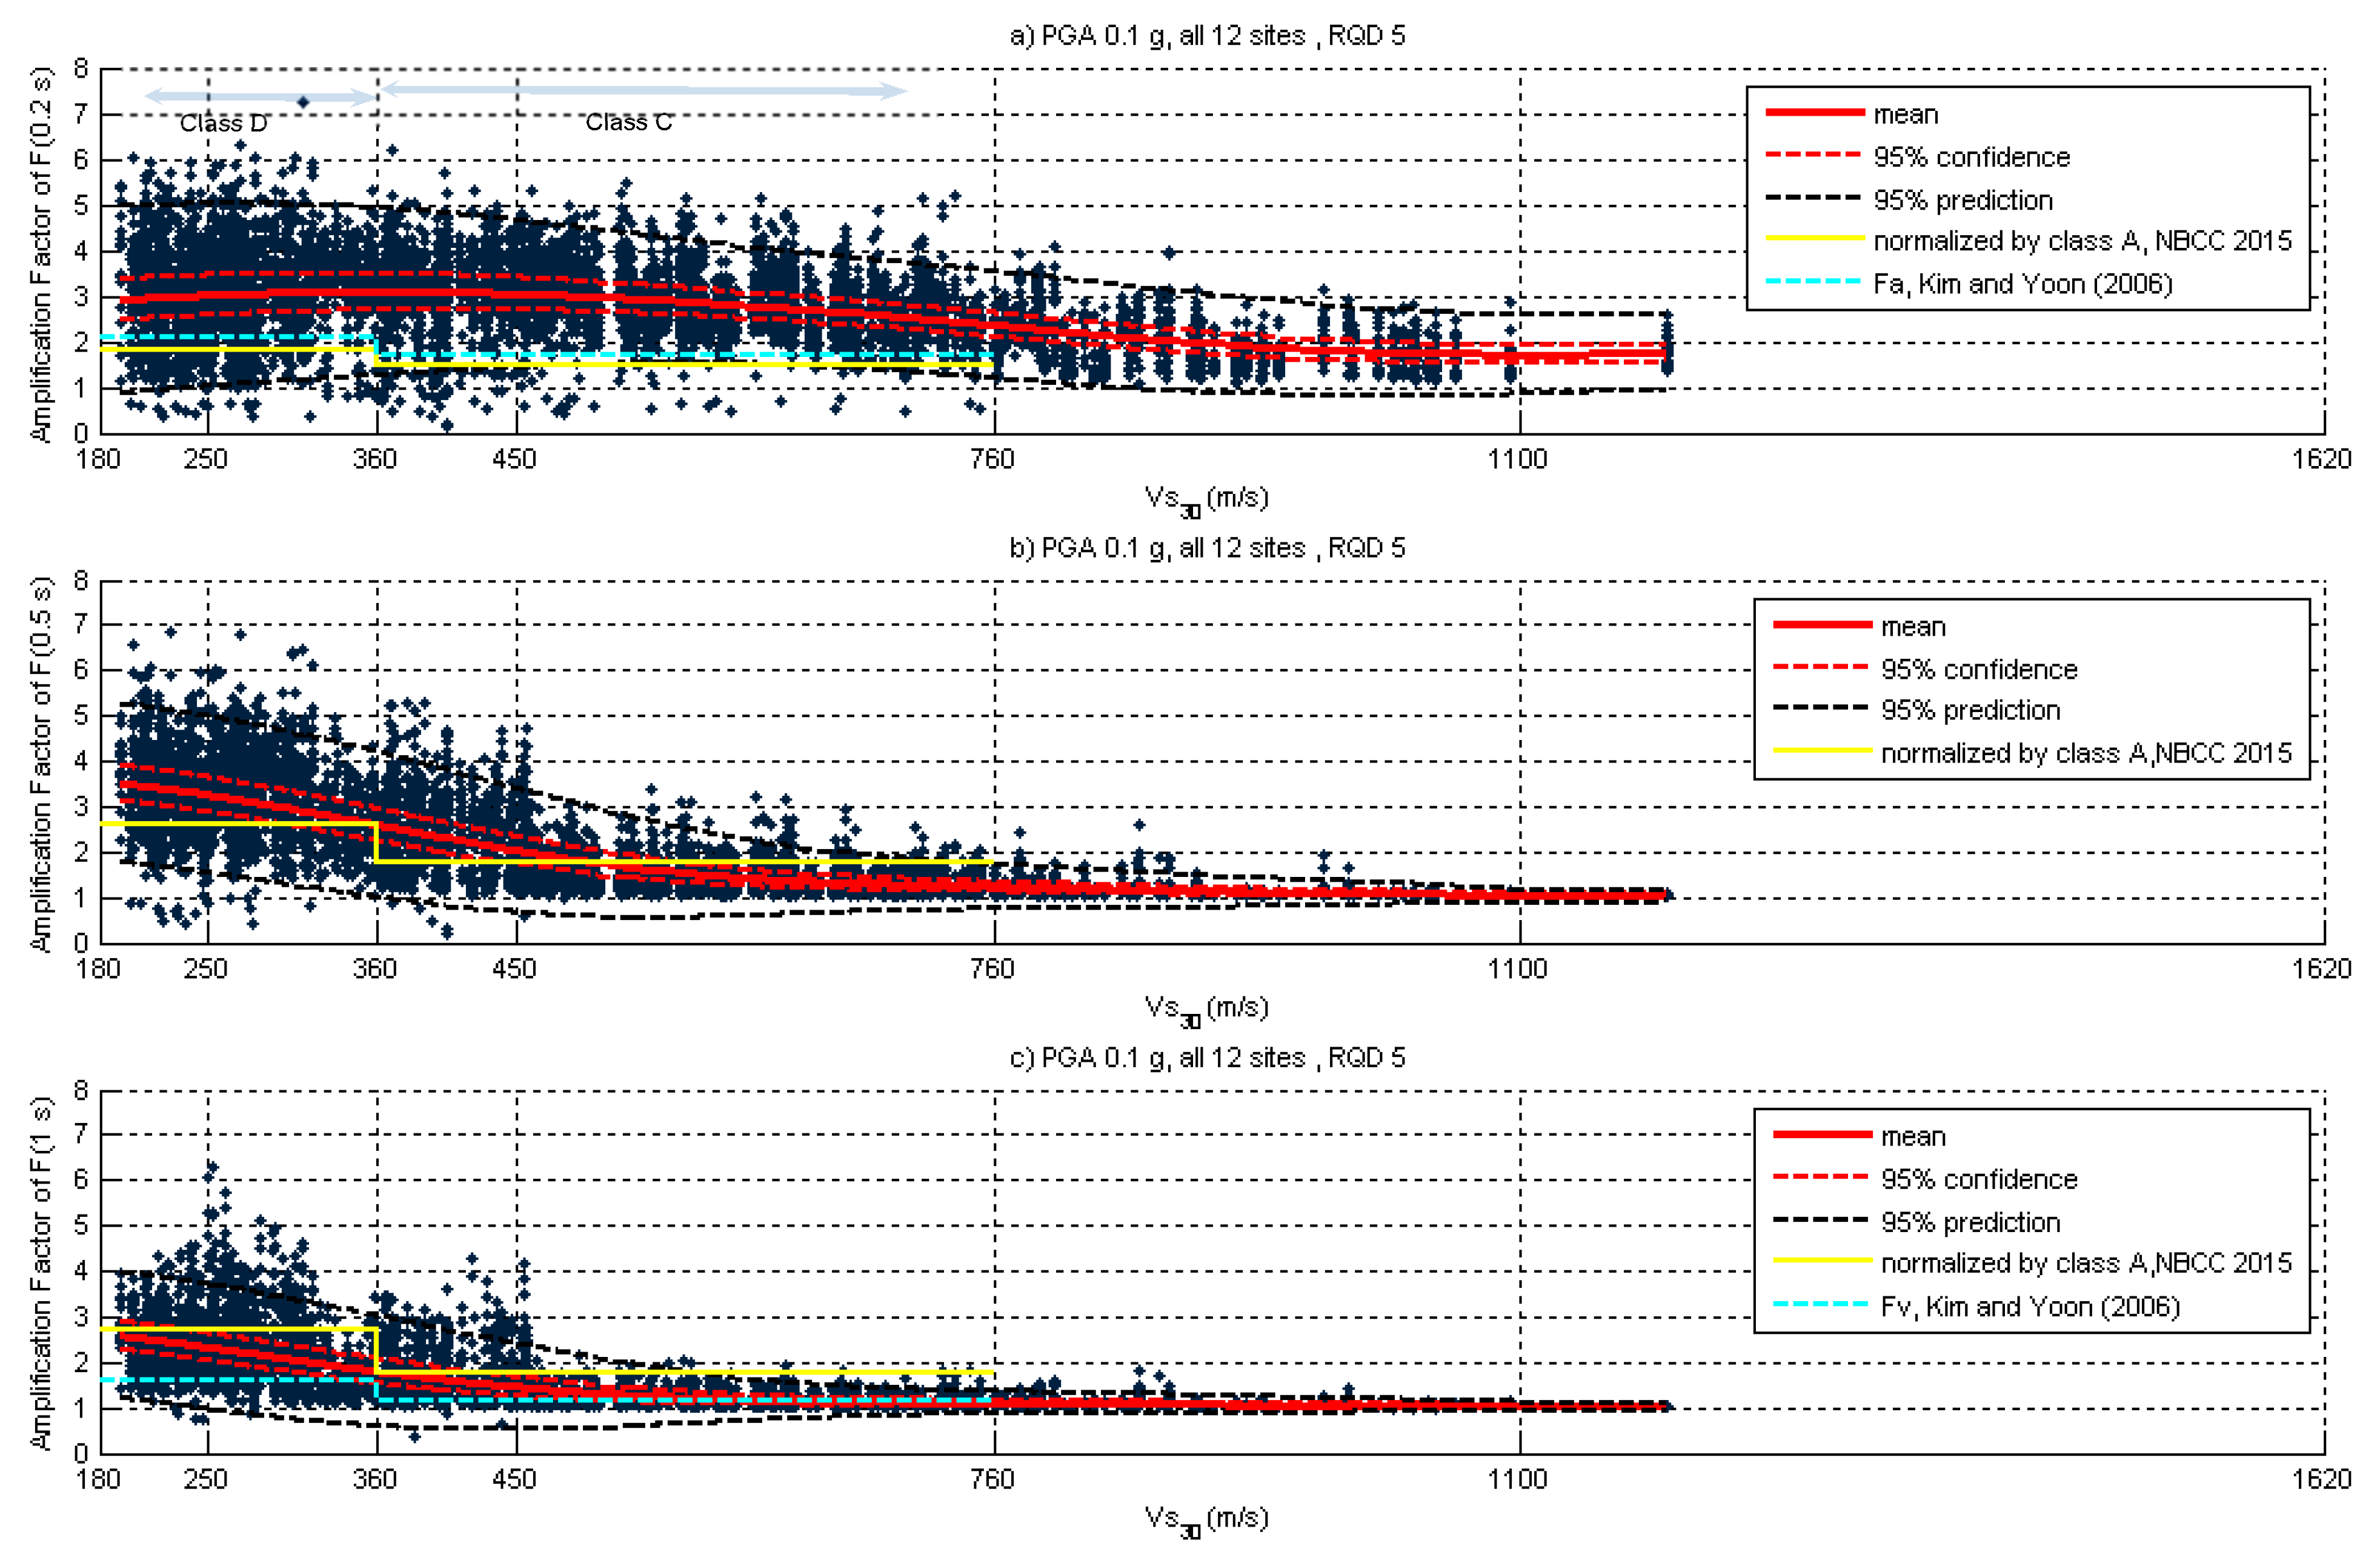
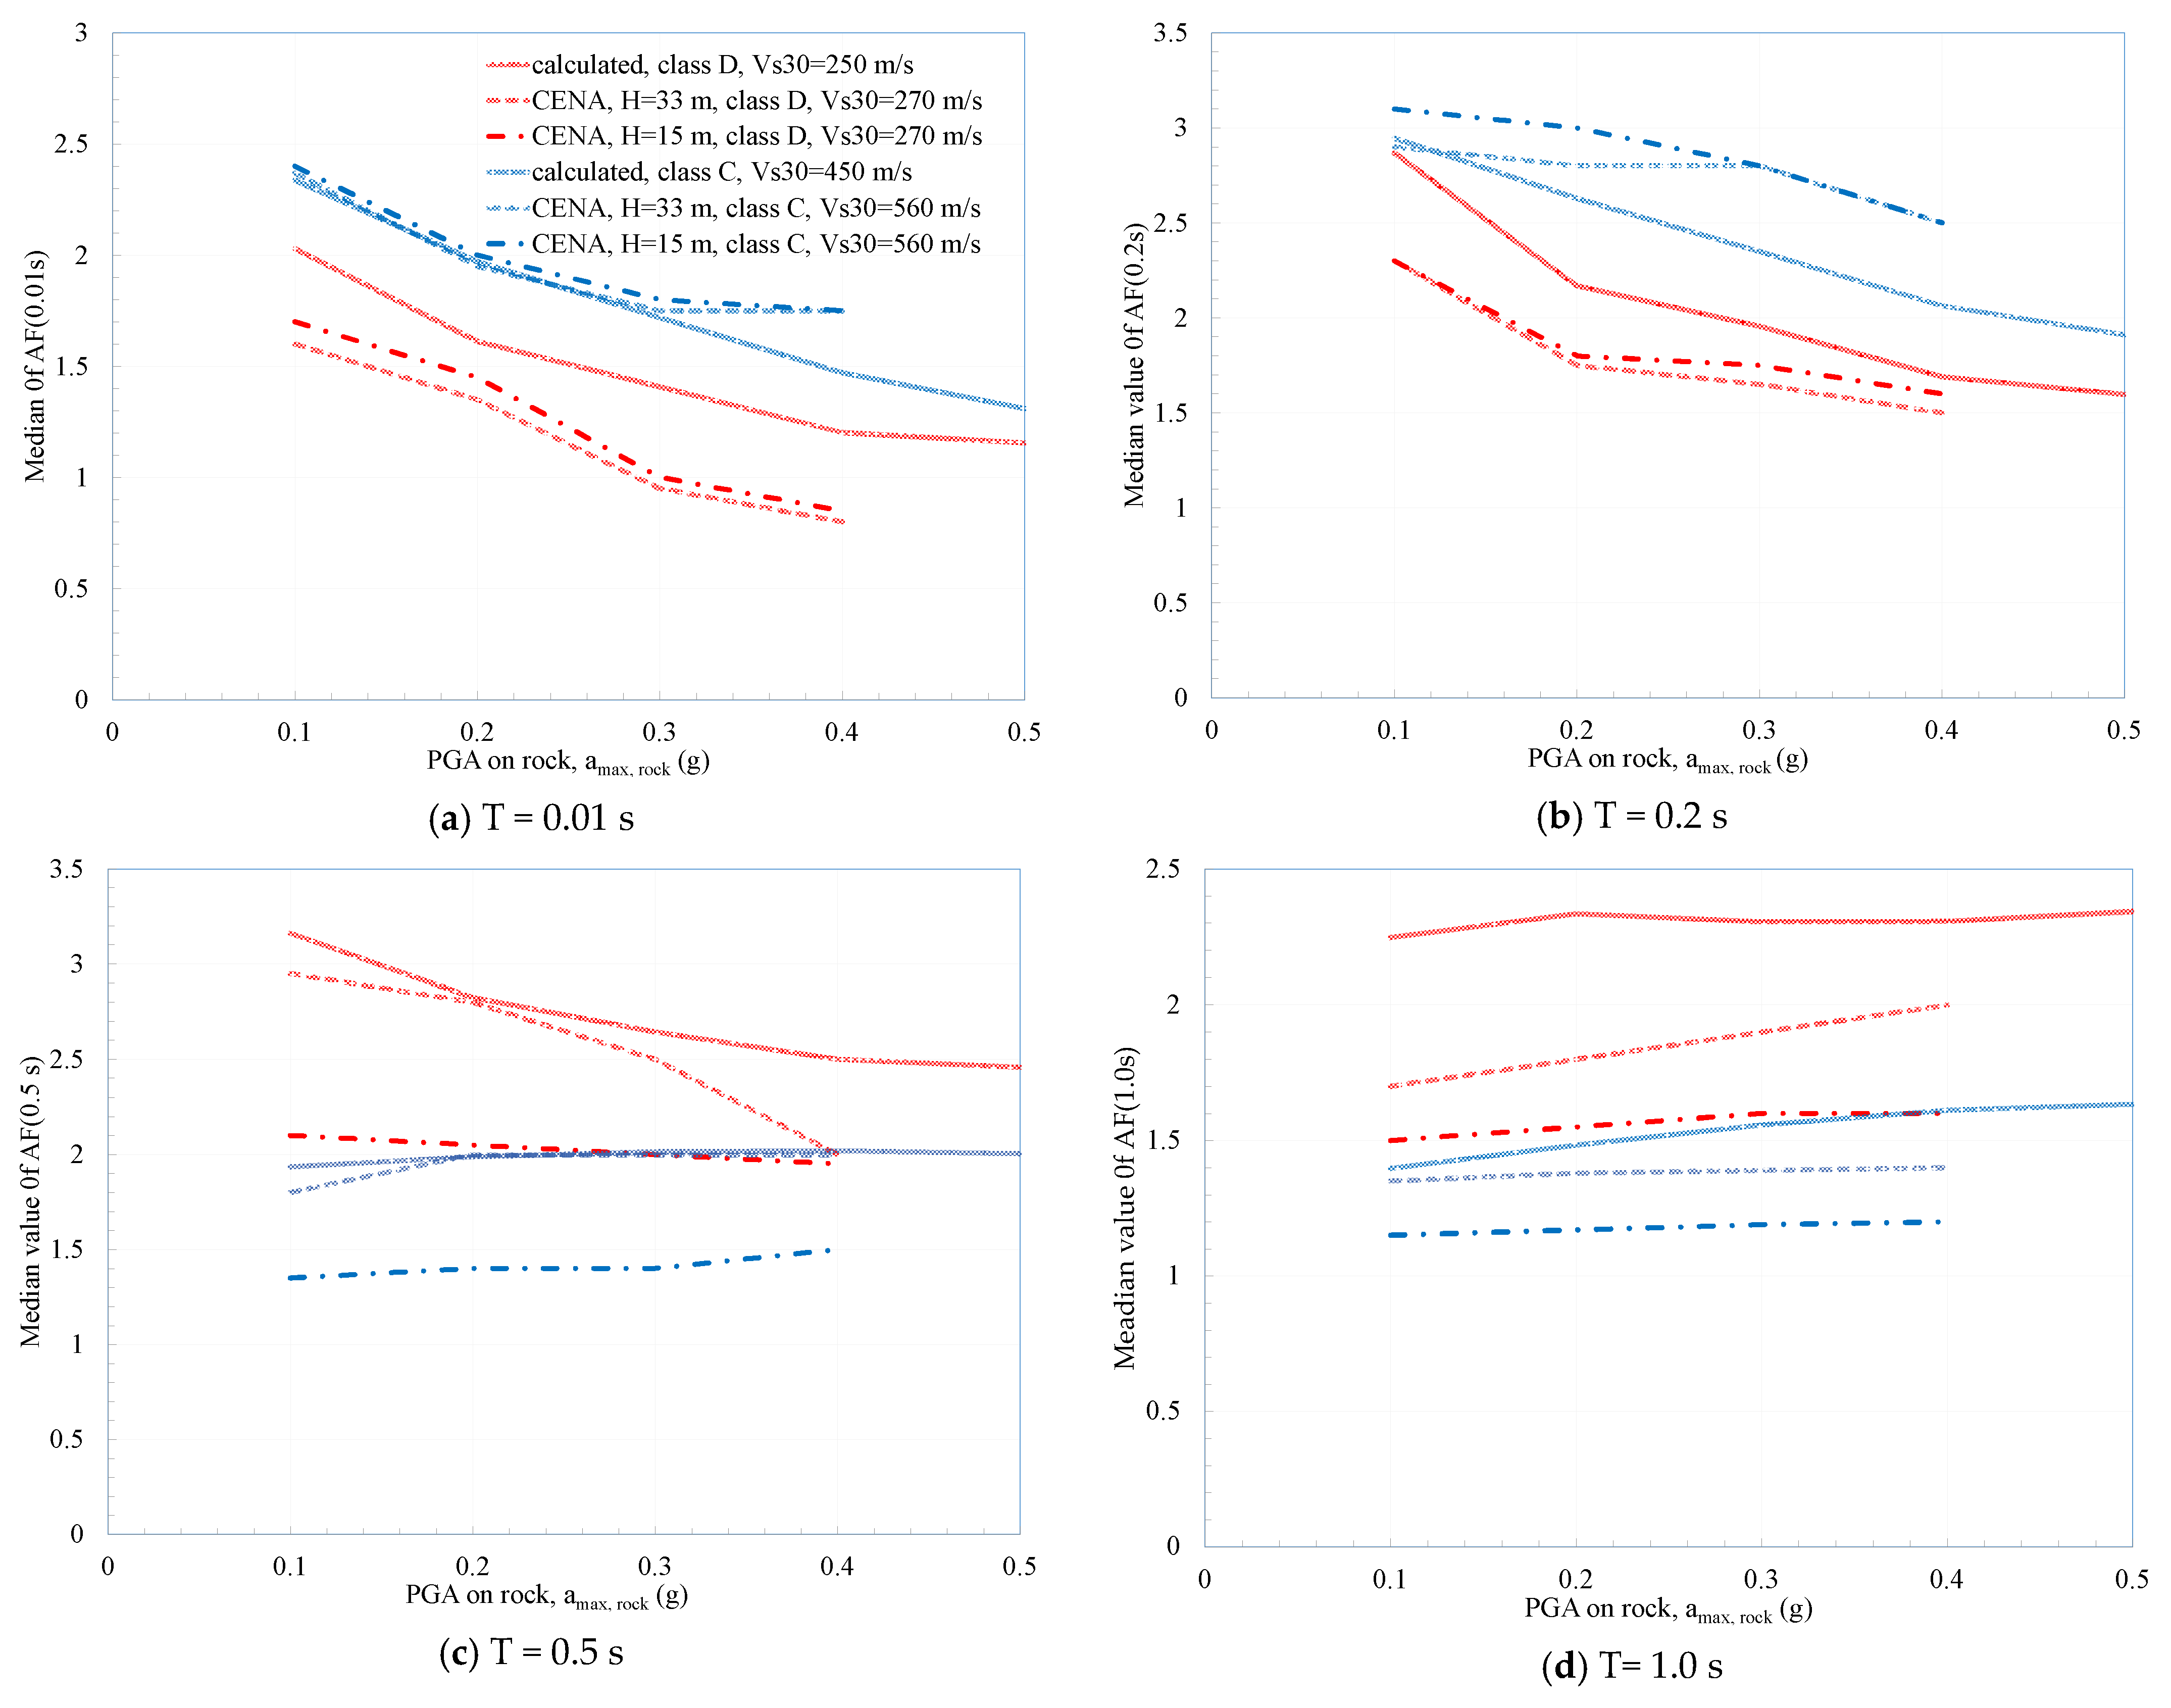
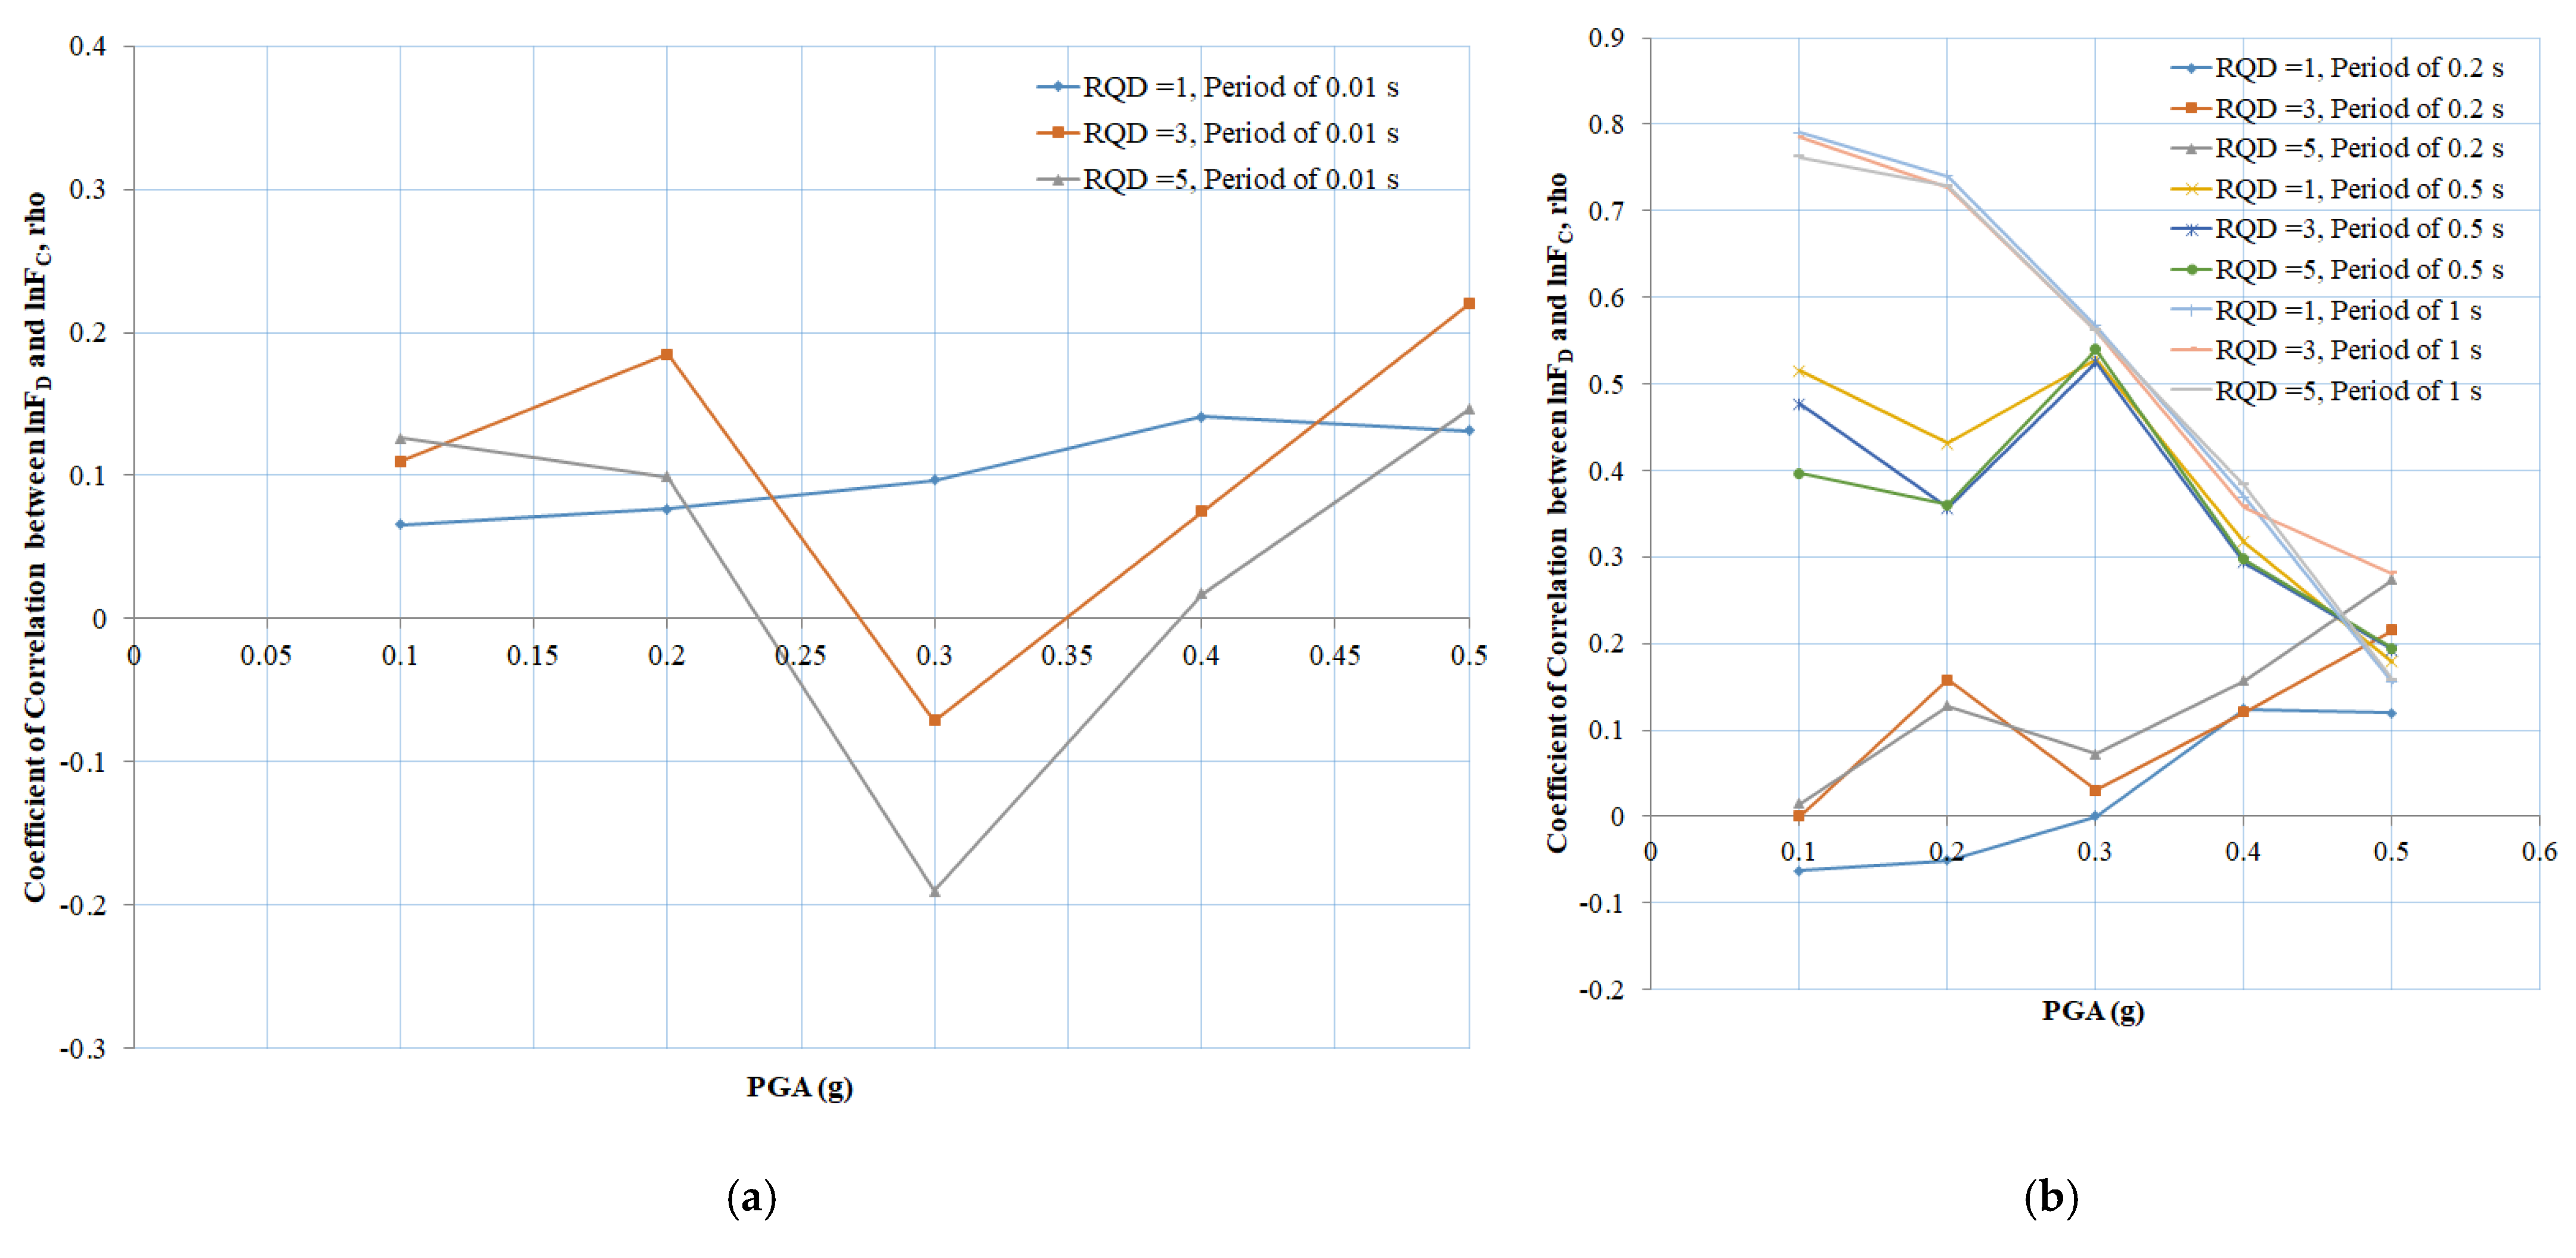
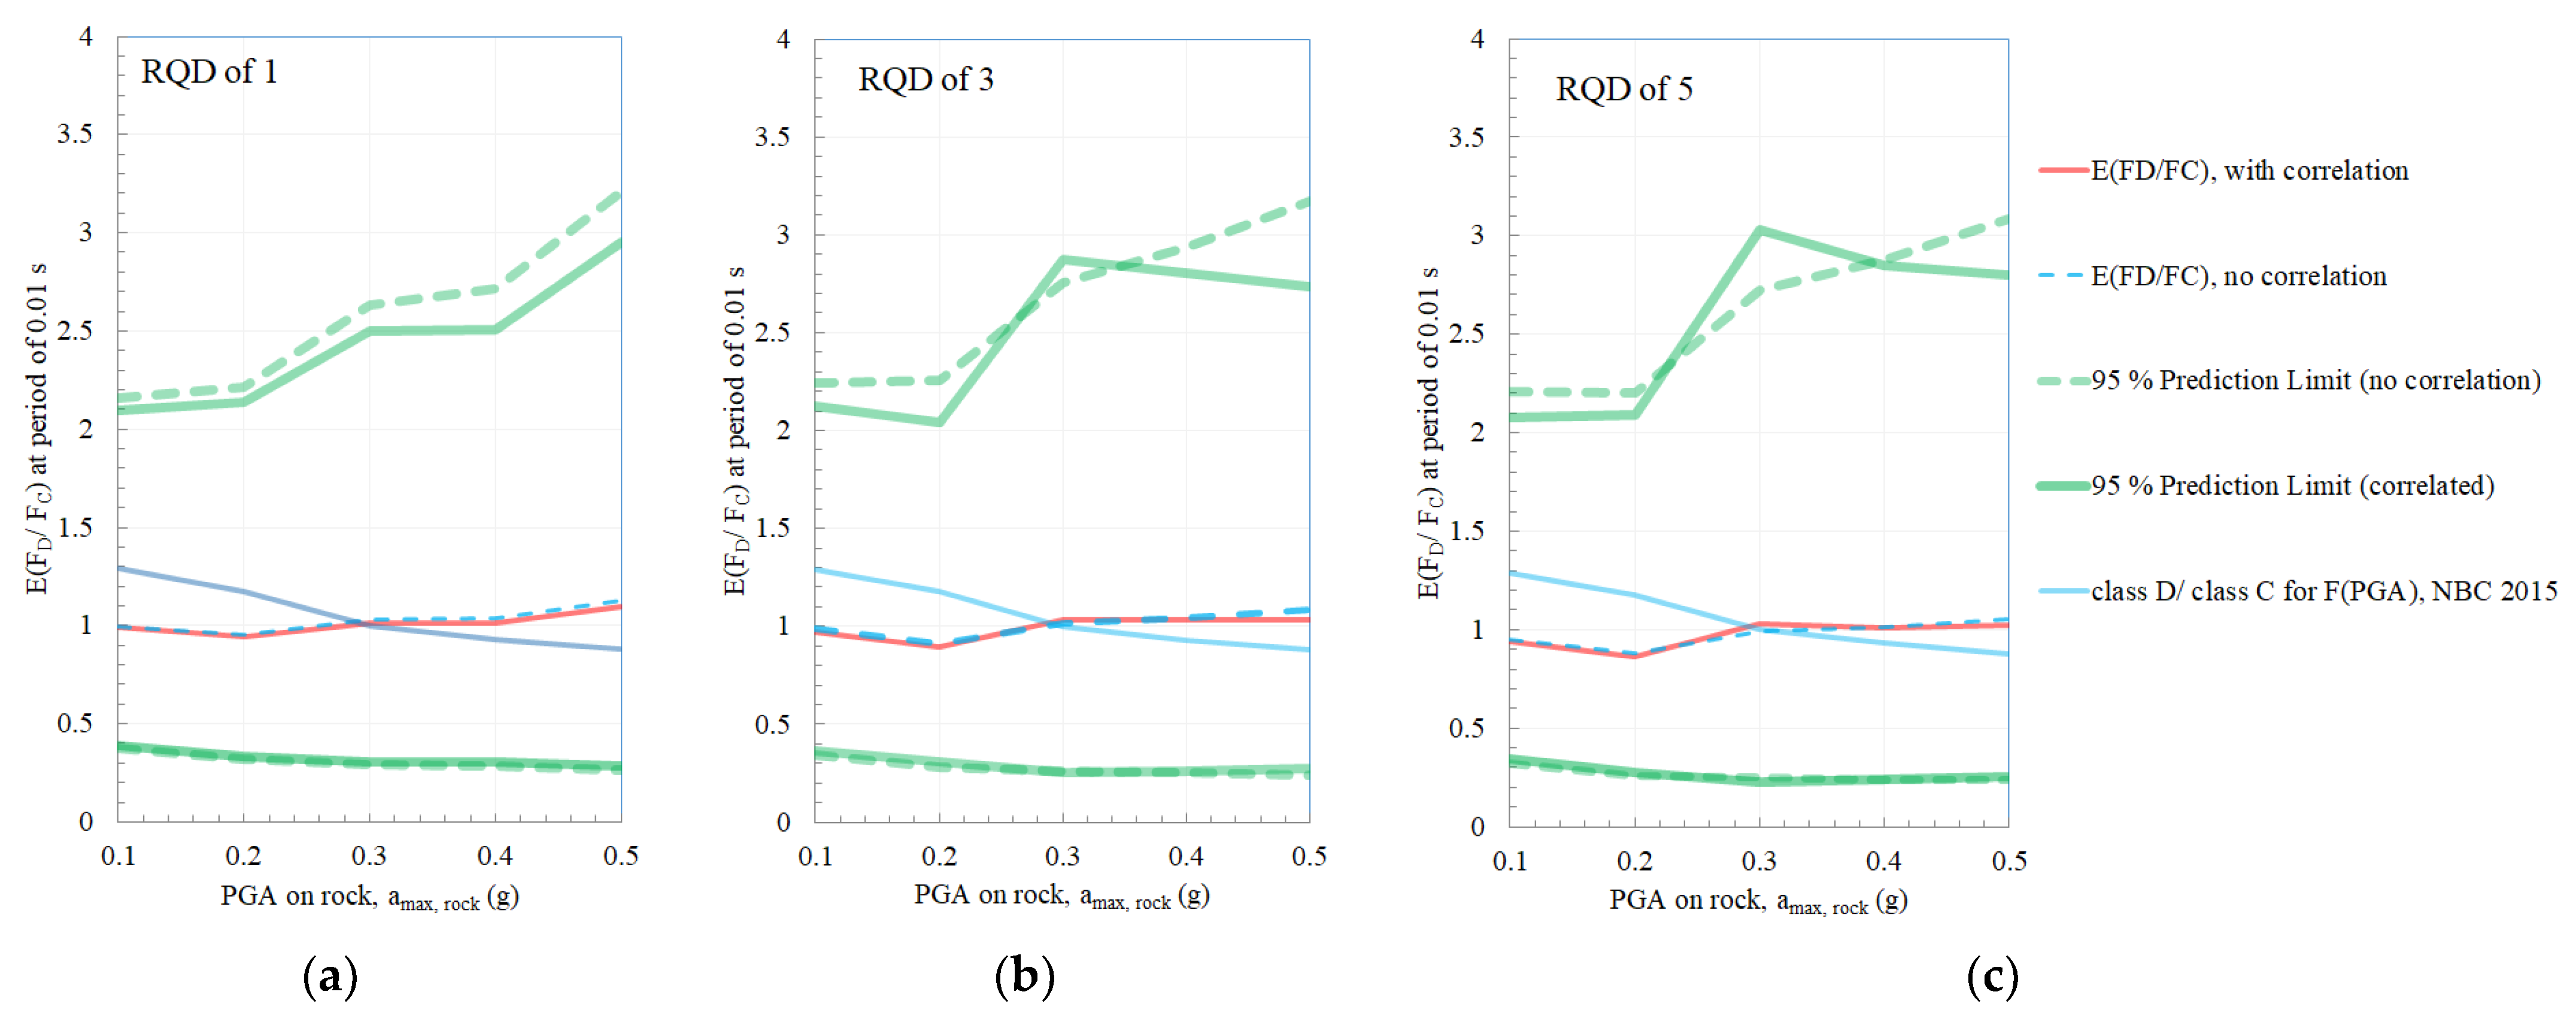
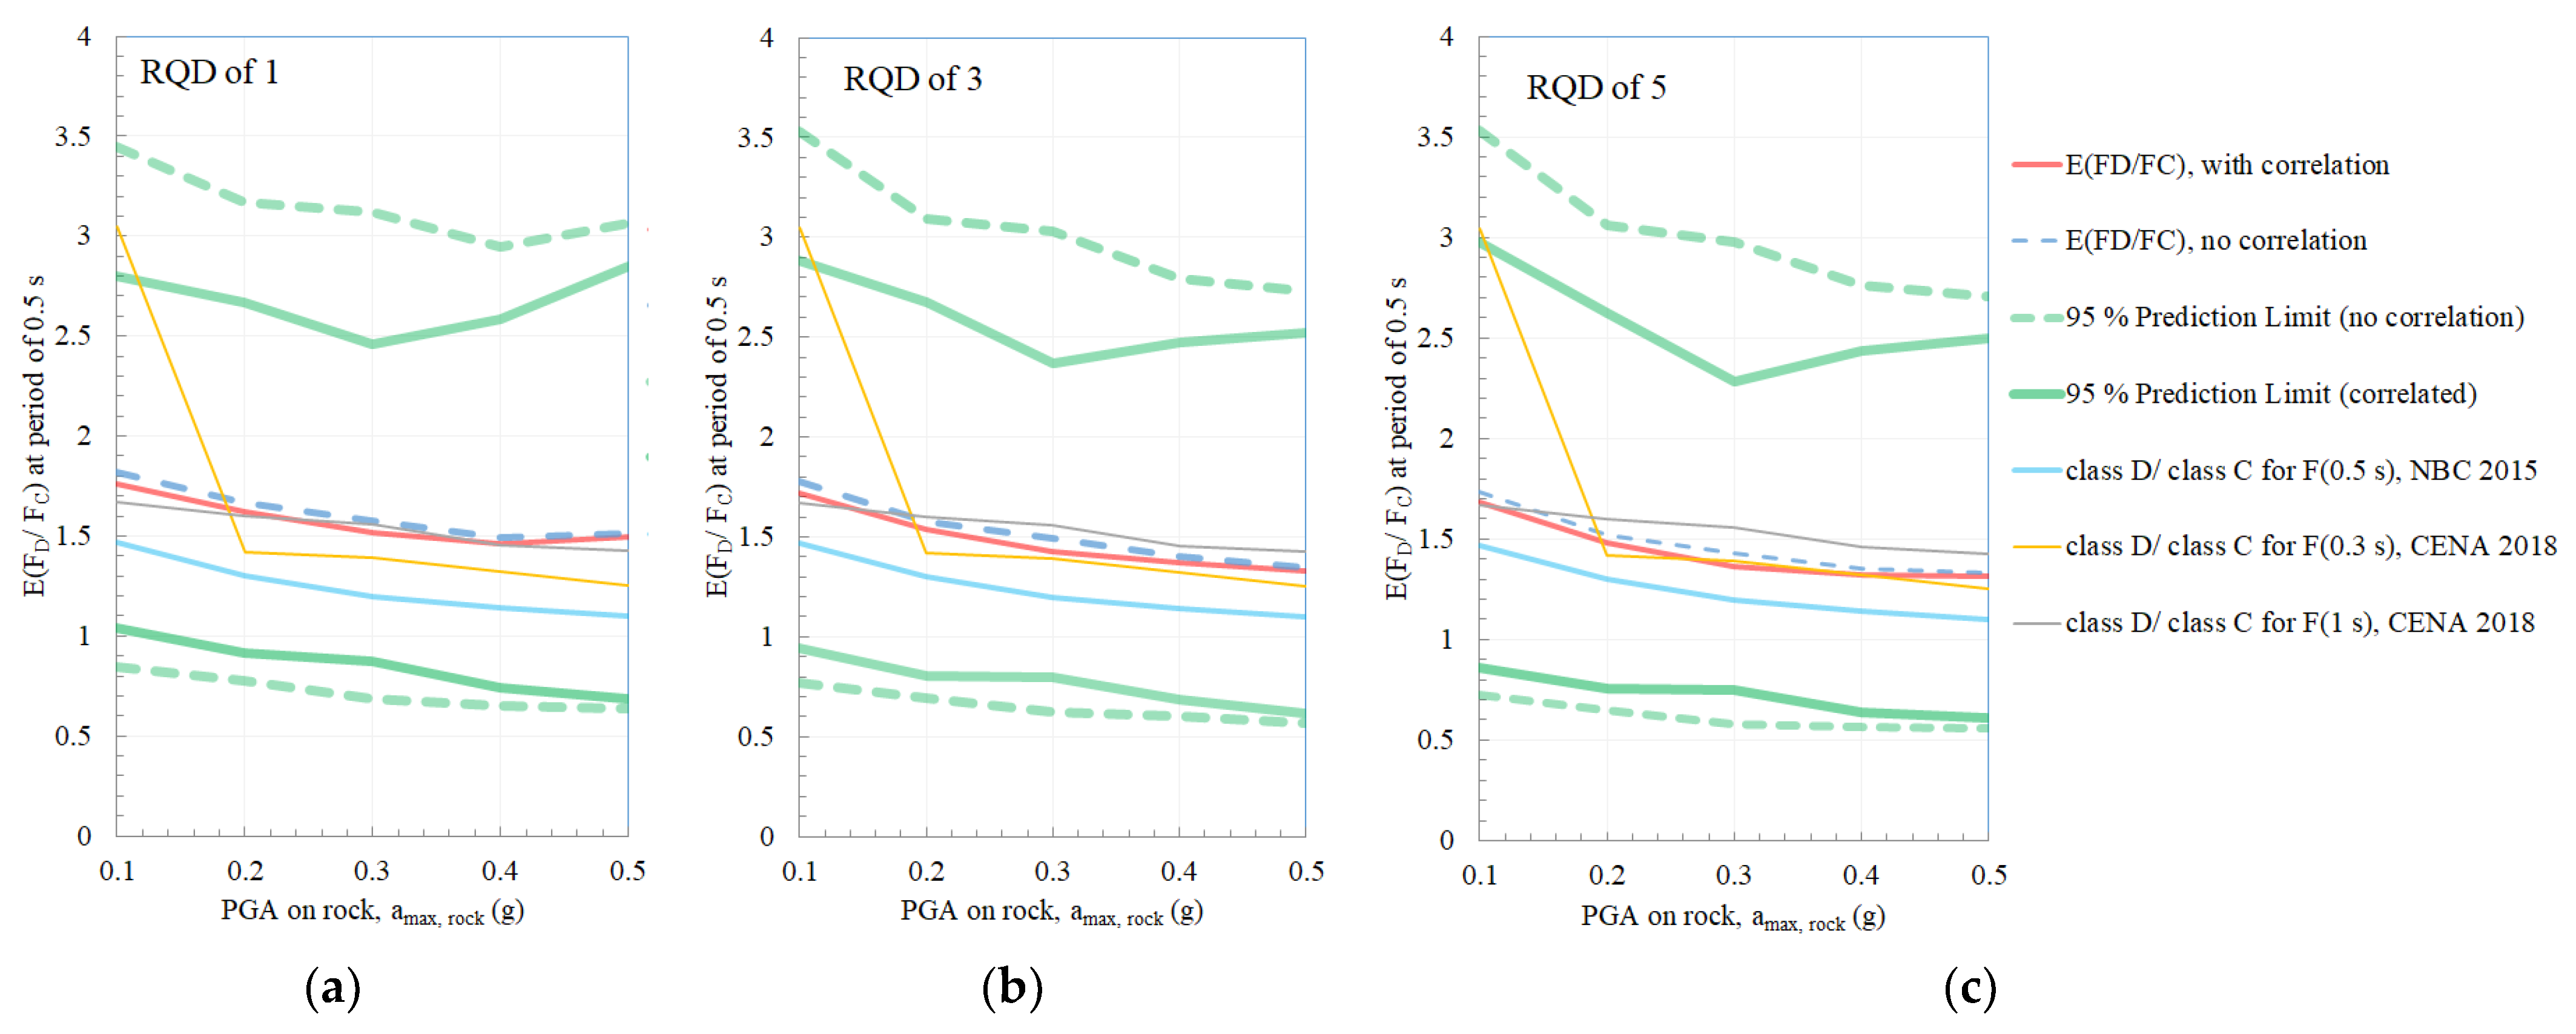
3. Site Amplification Sensitivity Analysis

The 1-D ground response of the 12 soil profiles in class C and D with the randomized Vs profiles (Figure 5 and Figure 6) are evaluated by the EL 1D method using Strata [8] under total stress conditions. The set of 20 rock motions are scaled from 0.1 to 0.5 g by increments of 0.1 g. Spectral acceleration response calculations are performed for 5% damping to be consistent with NBCC (2015). The uncertainty associated with the RQD classification is estimated by applying the Rosenblueth point estimation procedure [45,46] in combination with Monte Carlo simulation to reduce the total number of simulations performed. A total of 63,000 and 45,000 simulations have been performed for site classes C and D, respectively.
Figure 10, Figure 11 and Figure 12 show the amplification factor at low period (T = 0.01 s) as a function of Vs30 and site fundamental frequency F0 for different RQDs of 1, 3 and 5, and PGA of 0.1 g. Amplifications for other PGA values are provided in [47]. They are compared with those obtained previously by Chouinard and Rosset [48] and show good agreement. It is observed from Figure 10, Figure 11 and Figure 12 that for all 3 RQDs, a peak is observed in the non-linear relation between F(0.01 s) and Vs30 when Vs30 is in the range of 360–550 m/s.
Tempa et al. [49] conducted a parametric study with 1-D EL method to investigate how the bedrock characteristics influence the surface ground motions for various depths of soil profiles in Bhutan. The PGA values near ground surface are in the range between 0.191 and 0.221 g for 30 m thick soil profiles [49]. To identify the amplification characteristics due to geotechnical uncertainty in site classification for South Korean sites, Sun et al. [50] proposed a dual framework: firstly, a site classification method by using depth to bedrock, Vs30 and site period, secondly, a site classification method by using digital elevation, SPT-N values and slope of surface soil (topography). Kim et al. [51] investigated the correlation between the earthquake damage mechanism and site effects by evaluating spatial comparison earthquake damage and seismic hazard. GIS-based method consisting of borehole logs, a digital elevation model (DEM), an administrative division map, and geological maps was used by Kim et al. [52] in order to present site-specific surface and subsurface conditions in Daejeon city. Chieffo et al. [53] evaluated the influence of site amplification on the seismic vulnerability of historical structure in the Molise Region of Italy by analyzing distributions of earthquake intensities and seismogenic-faults.
Confidence intervals are provided for the mean amplification factor F(0.01 s) as well as for predicted amplification factor. The latter corresponds to the uncertainty expected for single events and highlights the possibility of amplifications significantly larger than mean amplifications specified in design codes for specific earthquakes.
Figure 13, Figure 14 and Figure 15 show the amplification factors at the periods of 0.2 s, 0.5 s and 1.0 s as a function of Vs30 for RQDs of 1, 3, and 5, and PGA of 0.1 g. Amplifications for PGAs from 0.2 g to 0.5 g are provided in Talukder [47]. The amplification factors for the structural periods of 0.2 s, 0.5 s and 1.0 s increase as a function of RQD, which is consistent with an increase in the impedance contrast [9,11,12,54]. Site amplification factors are compared with those recommended in NBCC (2015) values and those obtained previously by Kim and Yoon [54]. In the NBCC (2015), site factors are normalized relative to site class C amplifications (FC = 1).
For comparison purposes, the NBCC site factors for class A site (FA) and class B site (FB) have been normalized relative to rock amplifications (FA for RQD of 3 and 5 and FB for RQD of 1). It is noted from Figure 13a, Figure 14a and Figure 15a that the results show higher amplifications than those of [54] and NBCC 2015 for a short period (T = 0.2 s), especially for high RQD categories. The results show amplifications similar to those of [54] and NBCC (2015) for longer periods (T = 0.5 s and 1.0 s) for all RQD categories (Figure 13a,b, Figure 14a,b and Figure 15a,b).
Figure 16 compares median amplifications at periods of 0.01 s, 0.2 s, 0.5 s and 1.0 s for Montreal to CENA median site factors [37]. The CENA site factors are obtained for soil deposits of 15 and 33 m, site classes C and D, and bedrock velocity of 2900 m/s [37], which corresponds to a RQD of 5 in Montreal. The results show good agreement with the results for site class C for low periods of 0.01 s and 0.2 s (15 m deposits are typical for site class C sites in Montreal). For class D sites, the amplifications for Montreal are higher than those for CENA and the agreement is closer for high periods and 33 m deposits, which are typical for class D sites in Montreal. Higher amplifications can be explained by the low damping ratio of Leda clay in comparison to other soft soils.
Non-linear effects are more important for sites with low Vs30 and smaller amplifications can be observed, specially for larger PGA values (Figure 16). It can be noted from Figure 16c,d that for softer soils (class D sites), higher amplification factors are obtained at longer periods of T = 0.5 s and 1.0 s. By contrast, for stiffer soils (class C sites), relatively lower amplification factors are obtained for shorter periods of T = 0.01 s and 0.2 s. Similar variation of the amplification factors as a function soil site class are reported in recent literature [44,55,56,57]. Akkar et al. [55] formulated new ground motion prediction equations for Europe and Middle East by including non-linear site amplification function that is a function of Vs30 values from 150 to 1200 m/s and reference peak ground acceleration. Bindi et al. [56] observed it from their 1-D ground response analyses that site class A (rock) dominates the site-to-site variability for short site fundamental periods while for long periods the difference among the classes is less pronounced, with soil sites (classes C and D). Kotha et al. [57] presented nonlinear curves site amplification factors for periods of T = 0.01, 0.1, 1 s as a function of with Vs30. They observed that short-period site response at rock sites shows high variability compared to softer soils but the long-period site-response of rock sites show less variability than that of softer soils (e.g., 180 m/s ≤ Vs30 < 800 m/s).
The amplification factors FD and FC corresponding to Vs30 = 250 m/s and 450 m/s are used to define representative values for soil classes D and C, respectively, in NBCC (2015). The amplification factors FD and FC are assumed to be log-normally distributed and uncorrelated.
( lnF D lnF C )   ~   N [ ( μ lnF D μ lnF C ) , ( σ lnF D 2 0 0 σ lnF C 2 ) ]
where,
σ lnF C 2 = ln [ 1 + σ F C 2 μ F C 2 ] ;   μ lnF C = ln [ μ F C ] 0.5 σ lnF C 2
σ lnF D 2 = ln [ 1 + σ F D 2 μ F D 2 ] ;   μ lnF D = ln [ μ F D ] 0.5 σ lnF D 2
The mean value of the ratios FD/FC, FA/FC and FB/FC are used in NBCC (2015) to normalize the short period and long period site factors (formerly Fa and Fv), which are also lognormally distributed. The mean value and variance of the ratios can be derived from the distributions of FD and FC as:
μ F D / F C = exp ( μ lnF D μ lnF C + 0.5 ( σ lnF D 2 + σ lnF C 2 ) )
σ F D / F C 2 = exp ( 2 · ( μ lnF D μ lnF C ) + σ lnF D 2 + σ lnF C 2 ) · ( exp ( σ lnF D 2 + σ lnF C 2 ) 1 )
and the 95% confidence interval on FD/FC as:
exp [ ( μ lnF D μ lnF C )   ±   1.96 ( σ lnF D 2 + σ lnF C 2 ) ]
A feature of amplifications obtained by simulation as opposed to observed data is that each scaled ground motion record is applied to a set of randomized soil profiles and dynamic soil properties. This introduces positive correlation between amplifications obtained for different soil classes that are not present in field observations of amplifications. This correlation is a result of using the same input ground motion for each randomized profile. Considering the correlations, the mean value and the variance for the amplifications normalized relative to site class are as follows:
( lnF D lnF C ) ~ N [ ( μ lnF D μ lnF C ) , ( σ lnF D 2 ρ σ lnF D σ lnF C ρ σ lnF D σ lnF C σ lnF C 2 ) ]
μ F D / F C = exp ( μ lnF D     μ lnF C + 0.5 ( σ lnF D 2 2 ρ σ lnF D σ lnF C + σ lnF C 2 ) )
σ F D / F C   2 = exp ( 2 · ( μ lnF D   μ lnF C ) + σ lnF D 2 + σ lnF C 2 2 ρ σ lnF D σ lnF C ) · ( exp ( σ lnF D 2 + σ lnF C 2 2 ρ σ lnF D σ lnF C ) 1 )
where ρ is the correlation coefficient between lnFD and lnFC. The coefficient of correlation coefficient as a function of PGA for RQDs of 1, 3 and 5 and a period of T = 0.01 s, 0.2 s, 0.5 s, 1.0 s are shown in Figure 17.
The correlation coefficient is not very significant for a period of 0.01 s (Figure 17a) corresponding to RQD = 1 and decreases as a function of PGA. The correlation coefficient is more significant for longer periods of 0.5 s and 1.0 s (Figure 17b) and tends to decrease with increasing PGA. The correlation is largest for higher periods due to similarities in soil responses for the two site classes at small PGA, decreases with increasing ground motions due to non-linear effects. Figure 18 presents the site factor E(FD/FC) for a period of 0.01 s as a function of PGA as well as the 95% confidence interval. Figure 19, Figure 20 and Figure 21 compare the site factor for RQD of 1, 3 and 5 with the 2015 NBCC site factors for periods of 0.2 s, 0.5 s, and 1.0 s.
The ratio of E(FD/FC) for T = 0.01 s is slightly less than unity and is generally in agreement with the 2015 NBCC site factors (Figure 18). The amplification factors at periods of 0.01 s (Figure 18) and 0.2 s (Figure 19) are of the same order of magnitude as those of the NBCC 2015 with a slight positive trend as a function of PGA. The differences are much more significant for periods of 0.5 s (Figure 20) and 1.0 s (Figure 21) and indicate that NBCC 2015 underestimates amplifications in this range. The 95% confidence intervals on the amplification factors are fairly wide and indicate that there is a high probability of much larger amplifications that those specified in design codes, which could increase the level of damage and expected losses in seismic risk analyses given the asymmetry of damage as a function of amplification.

4. Discussion

Average site amplification factors for PGA of 0.1 g are presented in order to characterize linear site amplifications. For this level of ground motions, the results indicate that the average amplifications increase with RQD (or the impedance contrast). Another feature of the results for a period of 0.2 s (Figure 13a, Figure 14a and Figure 15a) is that the average amplifications do not monotonically decrease as a function of Vs30 and that for some class D sites; the average amplifications can be smaller than for class C sites. Similar results have been reported in the recent literature of NGA-East [58,59].
Figure 13, Figure 14 and Figure 15 compare the calculated site amplification factors as a function of Vs30 to the site factors of NBCC (2015) and with the mean amplifications from [54] for Korean sites. Results indicate again that NBCC (2015) underestimates the mean amplifications and that the best agreement corresponds to a RQD of 1 or lower impedance ratios. This result is consistent with the general observation that impedance ratios are smaller for western sites that form the basis for NBCC (2015). Good agreement is obtained with the results of Kim and Yoon [54]. The calculated site factors for T = 0.2 s, 0.5 s and 1.0 s for ground motion records scaled to 0.2, 0.3, 0.4 and 0.5 g show similar tendencies but with lower site factors and better agreement with NBCC due to non-linear effects.
As presented in Figure 16, the comparison of the results for RQD = 5 with those of [37] for shallow soil class C and D sites (15 m and 33 m) in CENA shows comparable trends for short period (T = 0.01 s and 0.2 s). Amplification factors for class C sites are slightly higher than for class D sites and the effect of the deposit thickness has a limited influence for the range of depths considered. For longer periods (T = 0.5 s and 1.0 s), amplification factors for class D sites are higher than those for class C sites and an increase in the thickness of the deposits increases the amplification. Results are shown for a RQD of 5 since the rock velocities for this category is 2900 m/s, which is similar to the velocity assumed in the CENA study (3000 m/s). CENA results are slightly smaller than those obtained with the current study, which could be partially explained by the lower degree of damping for Leda clay and differences in shear wave velocity profiles in the CENA site profiles (Figure 4). The soil profile for class D sites in the CENA study (Figure 4a) is similar to the median profile for sites in Montreal. Conversely, the soil profile for class C sites in the CENA study (Figure 4b) is stiffer than all of the class C site profiles used in this study, which explains partially the higher amplification factors obtained due to a higher impedance ratio.
The comparison of normalized amplification factors of FD/FC (Figure 18, Figure 19, Figure 20 and Figure 21) with NBCC (2015) indicates that the normalized factors are similar for short periods (T = 0.01 s and 0.2 s) and significantly larger for longer periods (T = 0.5 s and 1.0 s). The uncertainty on the ratio of FD/FC can be large due to uncertainties in ground motions, soil profiles and non-linear dynamic properties, which induce a wide range of site amplification values for individual earthquake occurrences.
The normalized amplification factors of FD/FC (Figure 19, Figure 20 and Figure 21) are also compared with the site factors of Hashash et al. [11]. For PGA from 0.1 to 0.5 g and for RQD of 1 to 5, the normalized factors calculated at T = 0.2 s (Figure 19) are greater than the site factors calculated by [11] at T = 0.1 s but smaller for the short period T = 0.3 s. The normalized mean factor FD/FC calculated at T = 0.2 s for PGA of 0.1 g is significantly smaller than the one in [11] for T = 0.3 s. For the range of rock PGA of 0.15 to 0.5 g, the site factors in [11] are found to be within the 95% prediction interval calculated for the mean FD/FC. The mean FD/FC at T = 0.5 s (Figure 20) and the ones in [11] for periods of T = 0.3 s and 1.0 s are similar with increasing PGA, except for PGA values less than 0.2 g. It is observed from Figure 21 that the mean factor FD/FC at T = 1.0 s is similar to the site factor in [11] for the same period. Figure 20 and Figure 21 show that the site factors calculated in [11] are within the 95% prediction interval of the mean FD/FC for PGA between 0.1 and 0.5 g. Major sources of difference between the amplifications calculated in this study and those by Hashash et al. [11] are the variation of impedance contrast between soil and rock interface, the frequency content of input rock motions, and Vs profiles.

5. Conclusions

The 1-D EL modeling of the propagation of seismic ground motions was performed for a collection of soil profiles that are classified as site classes C and D using the Vs30 criterion. Uncertainty in site responses was investigated by randomizing each of the soil profiles, bedrock properties, non-linear dynamic properties and by selecting a set of representative ground motions. Results were summarized such that they can be compared to currently site factors specified in the NBCC (2015) and other published results. For this purpose, amplifications were obtained for periods of 0.01 s, 0.2 s, 0.5 s and 1.0 s and for ground motions scaled at 0.1 to 0.5 g by increment of 0.1 g. The results were presented for site classes based on the Vs30 classification. Data on seismic velocities in bedrock for Montreal indicate a strong correlation between the degree of defects in the rock (measured by the rock quality designation) and shear wave velocity through rock, which affects the impedance contrast. To analyze this effect, results were obtained for the full range of RQD categories (i.e., 1, 3 and 5).
The results indicate that average site amplification factors based on the Vs30 classification are underestimated in the NBCC (2015). This finding is consistent with results obtained for sites along the CENA (e.g., South Carolina) and other regions of the world (e.g., South Korea) that exhibit similar characteristics (shallow soil layers on bedrock of high Vs) of soil layers. The calculated site amplification factors also indicate that there are large uncertainties associated with the site amplifications, which are also consistent with the degree of uncertainty reported for empirically derived amplifications from seismic observations. These uncertainties are typically neglected when performing seismic hazard analyses which may underestimate expected and extreme levels of damage.
Non-linearity in the analysis of Equivalent Linear 1-D site response is taken into account by introducing the nonlinear G/Gmax and damping ratios curves. In this method, it is assumed that the shear strain compatible Shear Modulus and Damping ratio values remains constant throughout the duration of the seismic excitation. This assumption is not fully applicable to a case when loose saturated soil profiles undergo heavy shaking (PGA > 0.3 g). A complete loss of effective stress may occur in loose saturated deposit of sand during earthquakes with PGA > 0.3 g. For earthquakes with PGA >0.3 g, the adoption of a stress-strain hysteretic nonlinear (NL) model in time domain may be considered. It is to be noted that cohesive soils (clay and silt) at Montreal sites are stiff and cohesionless soils (sand and gravel) are very dense (Table 2). In this study, all simulations with input motion PGA >0.3 g have been performed by using the EL method instead of the NL method because the preparation of input data to the EL method requires only experimental G/Gmax and damping ratio curves that are obtained from literature. On the other hand, the parameters that describe the NL models could not be obtained because of the unavailability of substantial field and laboratory data on the Montreal sites. This makes the use of the EL method of analysis for PGA >0.3 g more practical.
The most significant finding of the study is that the published site factors for CENA are shown in this study to be within the 95% prediction interval calculated for the normalized amplification factors of FD/FC. It is shown in the study that positive correlation between lnFD and lnFC due to ground motion and that the 95% prediction intervals on the normalized mean amplification that are calculated with correlation coefficients for PGA of 0.1 to 0.5 g are seen to be smaller than the 95% prediction intervals calculated without the correlation coefficients of FD/FC.

Author Contributions

Conceptualization, M.K.T. and L.C.; methodology, M.K.T. and P.R.; software, M.K.T.; validation, M.K.T.; formal analysis, M.K.T.; investigation, M.K.T.; resources, M.K.T., P.R. and L.C.; data curation, M.K.T.; writing—original draft preparation, M.K.T., P.R. and L.C.; writing—review and editing, M.K.T., P.R. and L.C.; visualization, M.K.T.; supervision, L.C.; project administration, L.C.; funding acquisition, L.C. All authors have read and agreed to the published version of the manuscript.

Funding

This research was funded through a NSERC Discovery Grant and a McGill International Doctoral Award.

Institutional Review Board Statement

Not applicable.

Informed Consent Statement

Not applicable.

Data Availability Statement

The data presented in this study are available on request from the corresponding author.

Conflicts of Interest

The authors declare no conflict of interest.

References

  1. Lamontagne, M. Description and Analysis of the Earthquake Damage in the Quebec City Region between 1608 and 2008. Seism. Res. Lett. 2009, 80, 514–524. [Google Scholar] [CrossRef]
  2. Mitchell, D.; Tinawi, R.; Law, T. Damage caused by the 25 November 1988, Saguenay earthquake. Can. J. Civ. Eng. 1990, 17, 338–365. [Google Scholar] [CrossRef]
  3. Chouinard, L.; Rosset, P. On the Use of Single Station Ambient Noise Techniques for Microzonation Purposes: The Case of Montreal. In Shear Wave Velocity Measurement Guidelines for Canadian Seismic Site Characterization in Soil and Rock; Hunter, J.A., Crow, H.L., Eds.; Geological Survey of Canada: Ottawa, ON, Canada, 2012; pp. 85–93. [Google Scholar]
  4. Rosset, P.; Chouinard, L.E. Characterization of site effects in Montreal, Canada. Nat. Hazards 2008, 48, 295–308. [Google Scholar] [CrossRef]
  5. Rosset, P.; Bour-Belvaux, M.; Chouinard, L. Estimation and Comparison of Vs30; Microzonation Maps for Montreal Using Multiple Sources of Information. Bull. Earthq. Eng. 2015, 13, 2225–2239. [Google Scholar] [CrossRef]
  6. Choi, Y.; Stewart, J.P. Nonlinear Site Amplification as Function of 30 m Shear Wave Velocity. Earthq. Spectra 2005, 21, 1–30. [Google Scholar] [CrossRef] [Green Version]
  7. Ordonez, G.A. SHAKE 2000. A Computer Program for the I-D Analysis of Geotechnical Earthquake Engineering Problems; University of California: Los Angeles, CA, USA, 2000. [Google Scholar]
  8. Kottke, A.R.; Rathje, E.M. Technical Manual for Strata; PEER: Saint Paul, MN, USA, 2008. [Google Scholar]
  9. Aaqib, M.; Sadiq, S.; Park, D.; Hashash, Y.M.A.; Pehlivan, M. Importance of Implied Strength Correction for 1D Site Response at Shallow Sites at a Moderate to Low Seismicity Region. In Geotechnical Earthquake Engineering and Soil Dynamics V: Seismic Hazard Analysis, Earthquake Ground Motions, and Regional-Scale Assessment; American Society of Civil Engineers: Reston, VA, USA, 2018; pp. 445–453. [Google Scholar] [CrossRef]
  10. Ciancimino, A.; Fotia, S.; Lanzob, G. Stochastic analysis of seismic ground response for site classification methods verifica-tion. Soil Dynamics and Earthquake Engineering. Soil Dyn. Earthq. Eng. 2018, 111, 169–183. [Google Scholar] [CrossRef]
  11. Hashash, Y.M.A.; Harmon, J.; Ilhan, O.; Stewart, J.P.; Rathje, E.M.; Campbell, K.W.; Silva, W.J.; Goulet, C.A. Modelling of Site Amplification via Large Scale Nonlinear Simulations with Applications to North America. In Geotechnical Earthquake Engineering and Soil Dynamics V: Seismic Hazard Analysis, Earthquake Ground Motions, and Regional-Scale Assessment; American Society of Civil Engineers: Reston, VA, USA, 2018; pp. 523–537. [Google Scholar] [CrossRef]
  12. Harmon, J.; Hashash, Y.M.A.; Stewart, J.P.; Rathje, E.M.; Campbell, K.W.; Silva, W.J.; Xu, B.; Musgrove, M.; Ilhan, O. Site Amplification Functions for Central and Eastern North America—Part I: Simulation Data Set Development. Earthq. Spectra 2019, 35, 787–814. [Google Scholar] [CrossRef]
  13. Sextos, A.; De Risi, R.; Pagliaroli, A.; Foti, S.; Passeri, F.; Ausilio, E.; Cairo, R.; Capatti, M.C.; Chiabrando, F.; Chiaradonna, A.; et al. Local Site Effects and Incremental Damage of Buildings during the 2016 Central Italy Earthquake Sequence. Earthq. Spectra 2018, 34, 1639–1669. [Google Scholar] [CrossRef] [Green Version]
  14. Rodriguez-Marek, A.; Bommer, J.J.; Youngs, R.R.; Crespo, M.J.; Stafford, P.J.; Bahrampouri, M. Capturing epistemic uncertainty in site response. Earthq. Spectra 2020, 37, 921–936. [Google Scholar] [CrossRef]
  15. Falcone, G.; Boldini, D.; Martelli, L.; Amorosi, A. Quantifying local seismic amplification from regional charts and site specific numerical analyses: A case study. Bull. Earthq. Eng. 2019, 18, 77–107. [Google Scholar] [CrossRef]
  16. Falcone, G.; Acunzo, G.; Mendicelli, A.; Mori, F.; Naso, G.; Peronace, E.; Porchia, A.; Romagnoli, G.; Tarquini, E.; Moscatelli, M. Seismic amplification maps of Italy based on site-specific microzonation dataset and one-dimensional numerical ap-proach. Eng. Geol. 2021, 289, 106170. [Google Scholar] [CrossRef]
  17. Stambouli, A.B.; Zendagui, D.; Bard, P.-Y.; Derras, B. Deriving amplification factors from simple site parameters using generalized regression neural networks: Implications for relevant site proxies. Earth Planets Space 2017, 69, 99. [Google Scholar] [CrossRef] [Green Version]
  18. Zhu, C.; Pilz, M.; Cotton, F. Which is a better proxy, site period or depth to bedrock, in modelling linear site response in addition to the average shear-wave velocity? Bull. Earthq. Eng. 2019, 18, 797–820. [Google Scholar] [CrossRef]
  19. Gobbi, S.; Lenti, L.; Santisi d’Avila, M.P.; Semblat, J.-F.; Reiffsteck, P. Influence of the variability of soil profile properties on weak and strong seismic response. Soil Dyn. Earthq. Eng. 2020, 135, 106200. [Google Scholar] [CrossRef]
  20. Fayjaloun, R.; Negulescu, C.; Roullé, A.; Auclair, S.; Gehl, P.; Faravelli, M. Sensitivity of Earthquake Damage Estimation to the Input Data (Soil Characterization Maps and Building Exposure): Case Study in the Luchon Valley, France. Geosciences 2021, 11, 249. [Google Scholar] [CrossRef]
  21. Régnier, J.; Bonilla, L.F.; Bard, P.; Bertrand, E.; Hollender, F.; Kawase, H.; Sicilia, D.; Arduino, P.; Amorosi, A.; Asimaki, D.; et al. International Benchmark on Numerical Simulations for 1D, Nonlinear Site Response (PRENOLIN): Verification Phase Based on Canonical Cases. Bull. Seismol. Soc. Am. 2016, 106, 2112–2135. [Google Scholar] [CrossRef]
  22. Régnier, J.; Bonilla, L.; Bard, P.; Bertrand, E.; Hollender, F.; Kawase, H.; Verrucci, L. PRENOLIN: International Benchmark on 1D Nonlinear Site-Response Analysis—Validation Phase Exercise. Bull. Seismol. Soc. Am. 2018, 108, 876–900. [Google Scholar] [CrossRef]
  23. Stewart, J.P.; Afshari, K. Epistemic Uncertainty in Site Response as Derived from One-Dimensional Ground Response Analyses. J. Geotech. Geoenviron. Eng. 2020, 147, 04020146. [Google Scholar] [CrossRef]
  24. Seed, H.B.; Idriss, I.M. Soil Moduli and Damping Factors for Dynamic Response Analyses; Earthquake Engineering Research Center, University of California: Berkeley, CA, USA, 1970. [Google Scholar]
  25. Seed, H.B.; Wong, R.T.; Idriss, I.M.; Tokimatsu, K. Moduli and Damping Factors for Dynamic Analyses of Cohesionless Soils. J. Geotech. Eng. 1986, 112, 1016–1032. [Google Scholar] [CrossRef]
  26. Sun, J.I.; Golesorkhi, R.; Seed, H.B. Dynamic Moduli and Damping Ratios for Cohesive Soils; Report No UCB/EERC-88/15; Earthquake Engineering Research Center, University of California: Berkeley, CA, USA, 1988. [Google Scholar]
  27. Cao, Y.L.; Rainer, J.H.; Chidiac, S.E. Études Sismiques au Poste Port-Alfred Region du Saguenay; National Research Council Canada Report to Hydro-Quebec: Ottawa, ON, Canada, 1992; Volume 1, pp. 1–113. [Google Scholar]
  28. EPRI, E.P.R.I. Guidelines for Determining Design Basis Ground Motions; Report TR-102293; EPRI: Palo Alto, CA, USA, 1993. [Google Scholar]
  29. Darendeli, M.B. Development of a New Family of Normalized Modulus Reduction and Material Damping Curves. Ph.D. Thesis, The University of Texas at Austin, Austin, TX, USA, 2001. [Google Scholar]
  30. Rasmussen, K.K. An Investigation of Monotonic and Cyclic Behavior of Leda Clay. Master’s Thesis, The University of Western Ontario, London, ON, Canada, 2012. [Google Scholar]
  31. Kramer, S.L. Geotechnical Earthquake Engineering; Prentice Hall: Hoboken, NJ, USA, 1996; ISBN 10 0133749436. [Google Scholar]
  32. Luzi, L.; Puglia, R.; Russo, E.; Orfeus, W. Engineering Strong Motion Database; Version 1.0; Istituto Nazionale di Geof-isica e Vulcanologia, Observatories & Research Facilities for European Seismology: GA De Bilt, The Netherlands, 2016. [CrossRef]
  33. Atkinson, G.M. Earthquake time histories compatible with the 2005 National building code of Canada uniform hazard spectrum. Can. J. Civ. Eng. 2009, 36, 991–1000. [Google Scholar] [CrossRef]
  34. Prest, V.K.; Hode-Keyser, J. Geology and Engineering Characteristics of Surficial Deposits; Montreal Island and Vicinity: Montreal, QC, Canada, 1977. [Google Scholar] [CrossRef]
  35. Talukder, M.K.; Chouinard, L. Probabilistic methods for the estimation of seismic Fa and Fv maps—Application to Montreal. Bull. Earthq. Eng. 2015, 14, 345–372. [Google Scholar] [CrossRef]
  36. Silva, W.J.; Abrahamson, N.; Toro, G.; Costantino, C. Description and Validation of the Stochastic Ground Motion Model; Brookhaven National Laboratory, Associated Universities Inc.: Upton, NY, USA, 1996. [Google Scholar]
  37. Darragh, B.; Silva, W. Development of Amplification Factors (5% Damped Response Spectra) For NEHRP Categories in CENA. In Proceedings of the Conference Call on Seismic Site Amplification in Central and Eastern North America, PEER, Berkeley, CA, USA, 7–10 February 2016. [Google Scholar]
  38. Boyer, L. Geology of Montreal, Province of Quebec, Canada. Bull. Assoc. Eng. Geol. 1985, 22, 329–394. [Google Scholar] [CrossRef]
  39. Aboye, S.A.; Andrus, R.D.; Ravichandran, N.; Bhuiyan, A.H.; Harman, N. Seismic Site Factors and Design Response Spectra Based on Conditions in Charleston, South Carolina. Earthq. Spectra 2015, 31, 723–744. [Google Scholar] [CrossRef]
  40. Kamai, R.; Abrahamson, N.A.; Silva, W.J. Nonlinear Horizontal Site Amplification for Constraining the NGA-West2 GMPEs. Earthq. Spectra 2014, 30, 1223–1240. [Google Scholar] [CrossRef]
  41. Rathje, E.M.; Kottke, A.R.; Trent, W.L. Influence of Input Motion and Site Property Variabilities on Seismic Site Response Analysis. J. Geotech. Geoenviron. Eng. 2010, 136, 607–619. [Google Scholar] [CrossRef]
  42. Hashash, Y.; Moon, S. Site Amplification Factors for Deep Deposits and Their Application in Seismic Hazard Analysis for Central U.S.; University of Illinois at Urbana-Champaign: Urbana, IL, USA; Champaign, IL, USA, 2011. [Google Scholar]
  43. Deere, D.E.; Deere, W.D. The Rock Quality Designation Index in Practice. In Rock Classification Systems for Engineering Purposes; ASTM STP 984; American Society for Testing and Materials: West Conshohocken, PA, USA, 1988; pp. 91–101. [Google Scholar]
  44. Falcone, G.; Romagnoli, G.; Naso, G.; Mori, F.; Peronace, E.; Moscatelli, M. Effect of bedrock stiffness and thickness on numerical simulation of seismic site response. Italian case studies. Soil Dyn. Earthq. Eng. 2020, 139, 106361. [Google Scholar] [CrossRef]
  45. Rosenblueth, E. Point estimates for probability moment. Proc. Natl. Acad. Sci. USA 1975, 72, 3812–3814. [Google Scholar] [CrossRef] [Green Version]
  46. Rosenblueth, E. Two-point estimates in probabilities. Appl. Math. Model. 1981, 5, 329–335. [Google Scholar] [CrossRef]
  47. Talukder, M.K. Seismic Site Effects for the Island of Montreal. Ph.D. Thesis, McGill University, Montréal, QC, Canada, 2018. [Google Scholar]
  48. Chouinard, L.; Rosset, P. Seismic site effects and seismic risk in the Montreal urban area. The influence of marine clays. In Proceedings of the Ninth Canadian Conference on Earthquake Engineering, Ottawa, ON, Canada, 26–29 June 2007; pp. 26–29. [Google Scholar]
  49. Tempa, K.; Sarkar, R.; Dikshit, A.; Pradhan, B.; Simonelli, A.; Acharya, S.; Alamri, A. Parametric Study of Local Site Response for Bedrock Ground Motion to Earthquake in Phuentsholing, Bhutan. Sustainability 2020, 12, 5273. [Google Scholar] [CrossRef]
  50. Sun, C.-G.; Kim, H.-S.; Cho, H.-I. Geo-Proxy-Based Site Classification for Regional Zonation of Seismic Site Effects in South Korea. Appl. Sci. 2018, 8, 314. [Google Scholar] [CrossRef] [Green Version]
  51. Kim, H.-S.; Sun, C.-G.; Cho, H.-I. Geospatial Assessment of the Post-Earthquake Hazard of the 2017 Pohang Earthquake Considering Seismic Site Effects. ISPRS Int. J. Geo-Inf. 2018, 7, 375. [Google Scholar] [CrossRef] [Green Version]
  52. Kim, H.-S.; Sun, C.-G.; Kim, M.; Cho, H.-I.; Lee, M.-G. GIS-Based Optimum Geospatial Characterization for Seismic Site Effect Assessment in an Inland Urban Area, South Korea. Appl. Sci. 2020, 10, 7443. [Google Scholar] [CrossRef]
  53. Chieffo, N.; Formisano, A. Induced Seismic-Site Effects on the Vulnerability Assessment of a Historical Centre in the Molise Region of Italy: Analysis Method and Real Behaviour Calibration Based on 2002 Earthquake. Geosciences 2020, 10, 21. [Google Scholar] [CrossRef] [Green Version]
  54. Kim, D.S.; Yoon, J.K. Development of new site classification system for the regions of shallow bedrock in Korea. J. Earthq. Eng. 2006, 10, 331–358. [Google Scholar] [CrossRef]
  55. Akkar, S.; Sandıkkaya, M.A.; Bommer, J.J. Empirical ground-motion models for point- and extended-source crustal earth-quake scenarios in Europe and the Middle East. Bull. Earthq. Eng. 2014, 12, 359–387. [Google Scholar] [CrossRef] [Green Version]
  56. Bindi, D.; Massa, M.; Luzi, L.; Ameri, G.; Pacor, F.; Puglia, R.; Augliera, P. Pan-European ground-motion prediction equa-tions for the average horizontal component of PGA, PGV, and 5%-damped PSA at spectral periods up to 3.0 s using the RESORCE dataset. Bull. Earthq. Eng. 2014, 12, 391–430. [Google Scholar] [CrossRef] [Green Version]
  57. Kotha, S.; Weatherill, G.; Bindi, D.; Cotton, F. A Regionally-Adaptable Ground-Motion Model for Shallow Crustal Earth-quakes in Europe. Bull. Earthq. Eng. 2020, 18, 4091–4125. [Google Scholar] [CrossRef]
  58. Hashash, Y.M.A.; Harmon, J.A.; Ilhan, O. Recommendation for Ergodic Nonlinear Site Amplification in Central and Eastern North America; PEER Report No. 2017/05; University of California: Berkeley, CA, USA, 2017. [Google Scholar]
  59. Stewart, J.P.; Parker, G.A.; Harmon, J.A.; Atkinson, G.M.; Boore, D.M.; Darragh, R.B.; Silva, W.J.; Hashash, Y.M.A. Expert Panel Recommendations for Ergodic Site Amplification in Central and Eastern North America; PEER Report No. 2017/04; University of California: Berkeley, CA, USA, 2017. [Google Scholar]
Figure 1. Response spectra (damping ratio of 5%) of selected recorded accelerograms and Uniform Hazard Spectra (UHS) for site classes A and B (National Building Code of Canada (NBCC) 2015).
Geohazards 02 00015 g001
Figure 2. Response spectra (damping ratio of 5%) of synthetic accelerograms for hard rock site condition proposed in [33] and UHS for site classes A and B (NBCC 2015).
Geohazards 02 00015 g002
Figure 3. Locations of the 12 representative sites on the probabilistic microzonation maps derived from the method proposed by Talukder and Chouinard [35] for site classes A, B, C and D.
Geohazards 02 00015 g003
Figure 4. (a) Vs profiles for selected class D, and (b) Vs profiles for selected C sites in Montreal compared with the median Vs profiles from Silva et al. [36] and the median Vs profile for Central and Eastern North America (CENA) sites [37].
Geohazards 02 00015 g004
Figure 5. Randomized Vs profiles for sites C1 to C7. T0 is the fundamental period of the site.
Geohazards 02 00015 g005
Figure 6. Randomized Vs profiles for the sites D1 to D5. T0 is the fundamental period of the site.
Geohazards 02 00015 g006
Figure 7. Randomized G/Gmax and strain (%) curves for (a) clay, (b) sand, (c) silt, and (d) gravel. The curves in gray in the above figures are generated from the randomization.
Geohazards 02 00015 g007
Figure 8. Thirty random damping ratio versus strain (%) curves for (a) clay, (b) sand, (c) silt, and (d) gravel. The curves in gray in the above figures are generated from the randomization.
Geohazards 02 00015 g008
Figure 9. Variation of bedrock Vs (m/s) within the five rock quality designation (RQD) categories. The blue circles indicate the Vs values corresponding to each RQD.
Geohazards 02 00015 g009
Figure 10. Amplification factors at T = 0.01 s for rock quality designation (RQD) of 1 (Vs = 1200 m/s) and PGA of 0.1 g: (a) as a function of Vs30, (b) as a function of site fundamental frequency F0.
Geohazards 02 00015 g010
Figure 11. Amplification factors at T = 0.01 s for RQD of 3 (Vs = 2100 m/s) and PGA of 0.1 g: (a) as a function of Vs30, (b) as a function of site fundamental frequency F0.
Geohazards 02 00015 g011
Figure 12. Amplification factors at T = 0.01 s for RQD of 5 (Vs = 2950 m/s) and PGA of 0.1 g: (a) as a function of Vs30, (b) as a function of site fundamental frequency F0.
Geohazards 02 00015 g012
Figure 13. Amplification factors as a function of Vs30 for periods of (a) 0.2 s, (b) 0.5 s, and (c) 1.0 s (RQD = 1, PGA = 0.1 g).
Geohazards 02 00015 g013
Figure 14. Amplification factors as a function of Vs30 for periods of (a) 0.2 s, (b) 0.5 s, and (c) 1.0 s (RQD = 3, PGA = 0.1 g).
Geohazards 02 00015 g014
Figure 15. Amplification factors as a function of Vs30 for periods of (a) 0.2 s, (b) 0.5 s, and (c) 1.0 s (RQD = 5, PGA = 0.1 g).
Geohazards 02 00015 g015
Figure 16. Median amplification factors as a function of PGArock for site classes C and D at periods of (a) 0.01 s, (b) 0.2 s, (c) 0.5 s and (d) 1.0 s (RDQ = 5, Vs = 2900 m/s) for Montreal sites and CENA [37] sites.
Geohazards 02 00015 g016
Figure 17. Correlation coefficient between lnFD and lnFC as a function of PGA and RQD (a) for a period of 0.01 s, (b) for periods of 0.2, 0.5 and 1.0 s.
Geohazards 02 00015 g017
Figure 18. Comparison between (FD/FC) at T = 0.01 s and the site factors in NBCC (2015) for RQD of 1 (a), 3 (b) and 5 (c).
Geohazards 02 00015 g018
Figure 19. Comparison between (FD/FC) at T = 0.2 s and the NBCC (2015) and the site factors in NBCC (2015) and the CENA site factors published by Hashash et al. [11] for RQD of 1 (a), 3 (b) and 5 (c).
Geohazards 02 00015 g019
Figure 20. Comparison between (FD/FC) at T = 0.5 s and the site factors in NBCC (2015) and the CENA site factors published by Hashash et al. [11] for RQD of 1 (a), 3 (b) and 5 (c).
Geohazards 02 00015 g020
Figure 21. Comparison between (FD/FC) at T = 1.0 s and the site factors in NBCC (2015) and the CENA site factors published by Hashash et al. [11] for RQD of 1 (a), 3 (b) and 5 (c).
Geohazards 02 00015 g021
Table 1. Characteristics of ground input motions selected for the equivalent 1-D analysis in Montreal.
Input MotionYearEarthquake
Mechanism
Site ClassPGA
(g)
Moment
Magnitude
Epicentral
Distance (km)
Irpinia, Italy1980Normal FaultingB0.0806.928
Morgan Hil, Gilroy1984Strike-slipA0.1006.1915
Saguenay (Chicoutimi)1988Strike-slipA0.1305.730
Saguenay (St-Andrea)1988Strike-slipA0.1605.770
Saguenay (La Malbaie) 1988Strike-slipA0.1705.795
Southern Iran1990Strike-slipB0.1606.218
Greece1990Normal FaultingB0.1205.919
Western Iran1990Strike-slipB0.1307.485
Basilicata, Italy1998Normal FaultingB0.1605.618
Kocaeli, Turkey1999Strike-slipB0.267.5111
Tottori, Japan2000Strike-slipB0.1306.6115
Presbytere, Martinique2007Normal FaultingB0.1607.469
Guadeloupe2007Normal FaultingB0.0807.4144
Goudeloupe, France2007Strike-slipB0.1107.4167
Lipari, Italy2010Strike-slipB0.324.712
Synthetic-44N/AStrike-slipA0.133799
Synthetic-27 *N/AStrike-slipA0.120770
Synthetic-9 *N/AStrike-slipA0.280745
Synthetic-14 *N/AStrike-slipA0.210751
Synthetic-19 *N/AStrike-slipA0.330627
* the number corresponds to the identification value given to the synthetic accelerogram in [33].
Table 2. Characteristics of soil properties of Montreal sites.
Soil TypeSoil Unit Weight (kN/m3)Reference
Leda clay16.5[30]
Sand20[34]
Silt21[34]
Till24[34]
Bedrock27.3[5]
Publisher’s Note: MDPI stays neutral with regard to jurisdictional claims in published maps and institutional affiliations.

