
Seismic Liquefaction Risk Assessment of Critical Facilities in Kathmandu Valley, Nepal


1
Department of Civil Engineering, Pulchowk Campus, IoE, Tribhuvan University, Lalitpur 44700, Nepal
2
BGC Engineering Inc., Fredericton, NB E3C 0A9, Canada
*
Author to whom correspondence should be addressed.
GeoHazards 2021, 2(3), 153-171; https://0-doi-org.brum.beds.ac.uk/10.3390/geohazards2030009
Submission received: 29 March 2021
/
Revised: 10 July 2021
/
Accepted: 13 July 2021
/
Published: 15 July 2021
Abstract
:Kathmandu Valley lies in an active tectonic zone, meaning that earthquakes are common in the region. The most recent was the Gorkha Nepal earthquake, measuring 7.8 Mw. Past earthquakes caused soil liquefaction in the valley with severe damages and destruction of existing critical infrastructures. As for such infrastructures, the road network, health facilities, schools and airports are considered. This paper presents a liquefaction susceptibility map. This map was obtained by computing the liquefaction potential index (LPI) for several boreholes with SPT measurements and clustering the areas with similar values of LPI. Moreover, the locations of existing critical infrastructures were reported on this risk map. Therefore, we noted that 42% of the road network and 16% of the airport area are in zones of very high liquefaction susceptibility, while 60%, 54%, and 64% of health facilities, schools and colleges are in very high liquefaction zones, respectively. This indicates that most of the critical facilities in the valley are at serious risk of liquefaction during a major earthquake and therefore should be retrofitted for their proper functioning during such disasters.
1. Introduction
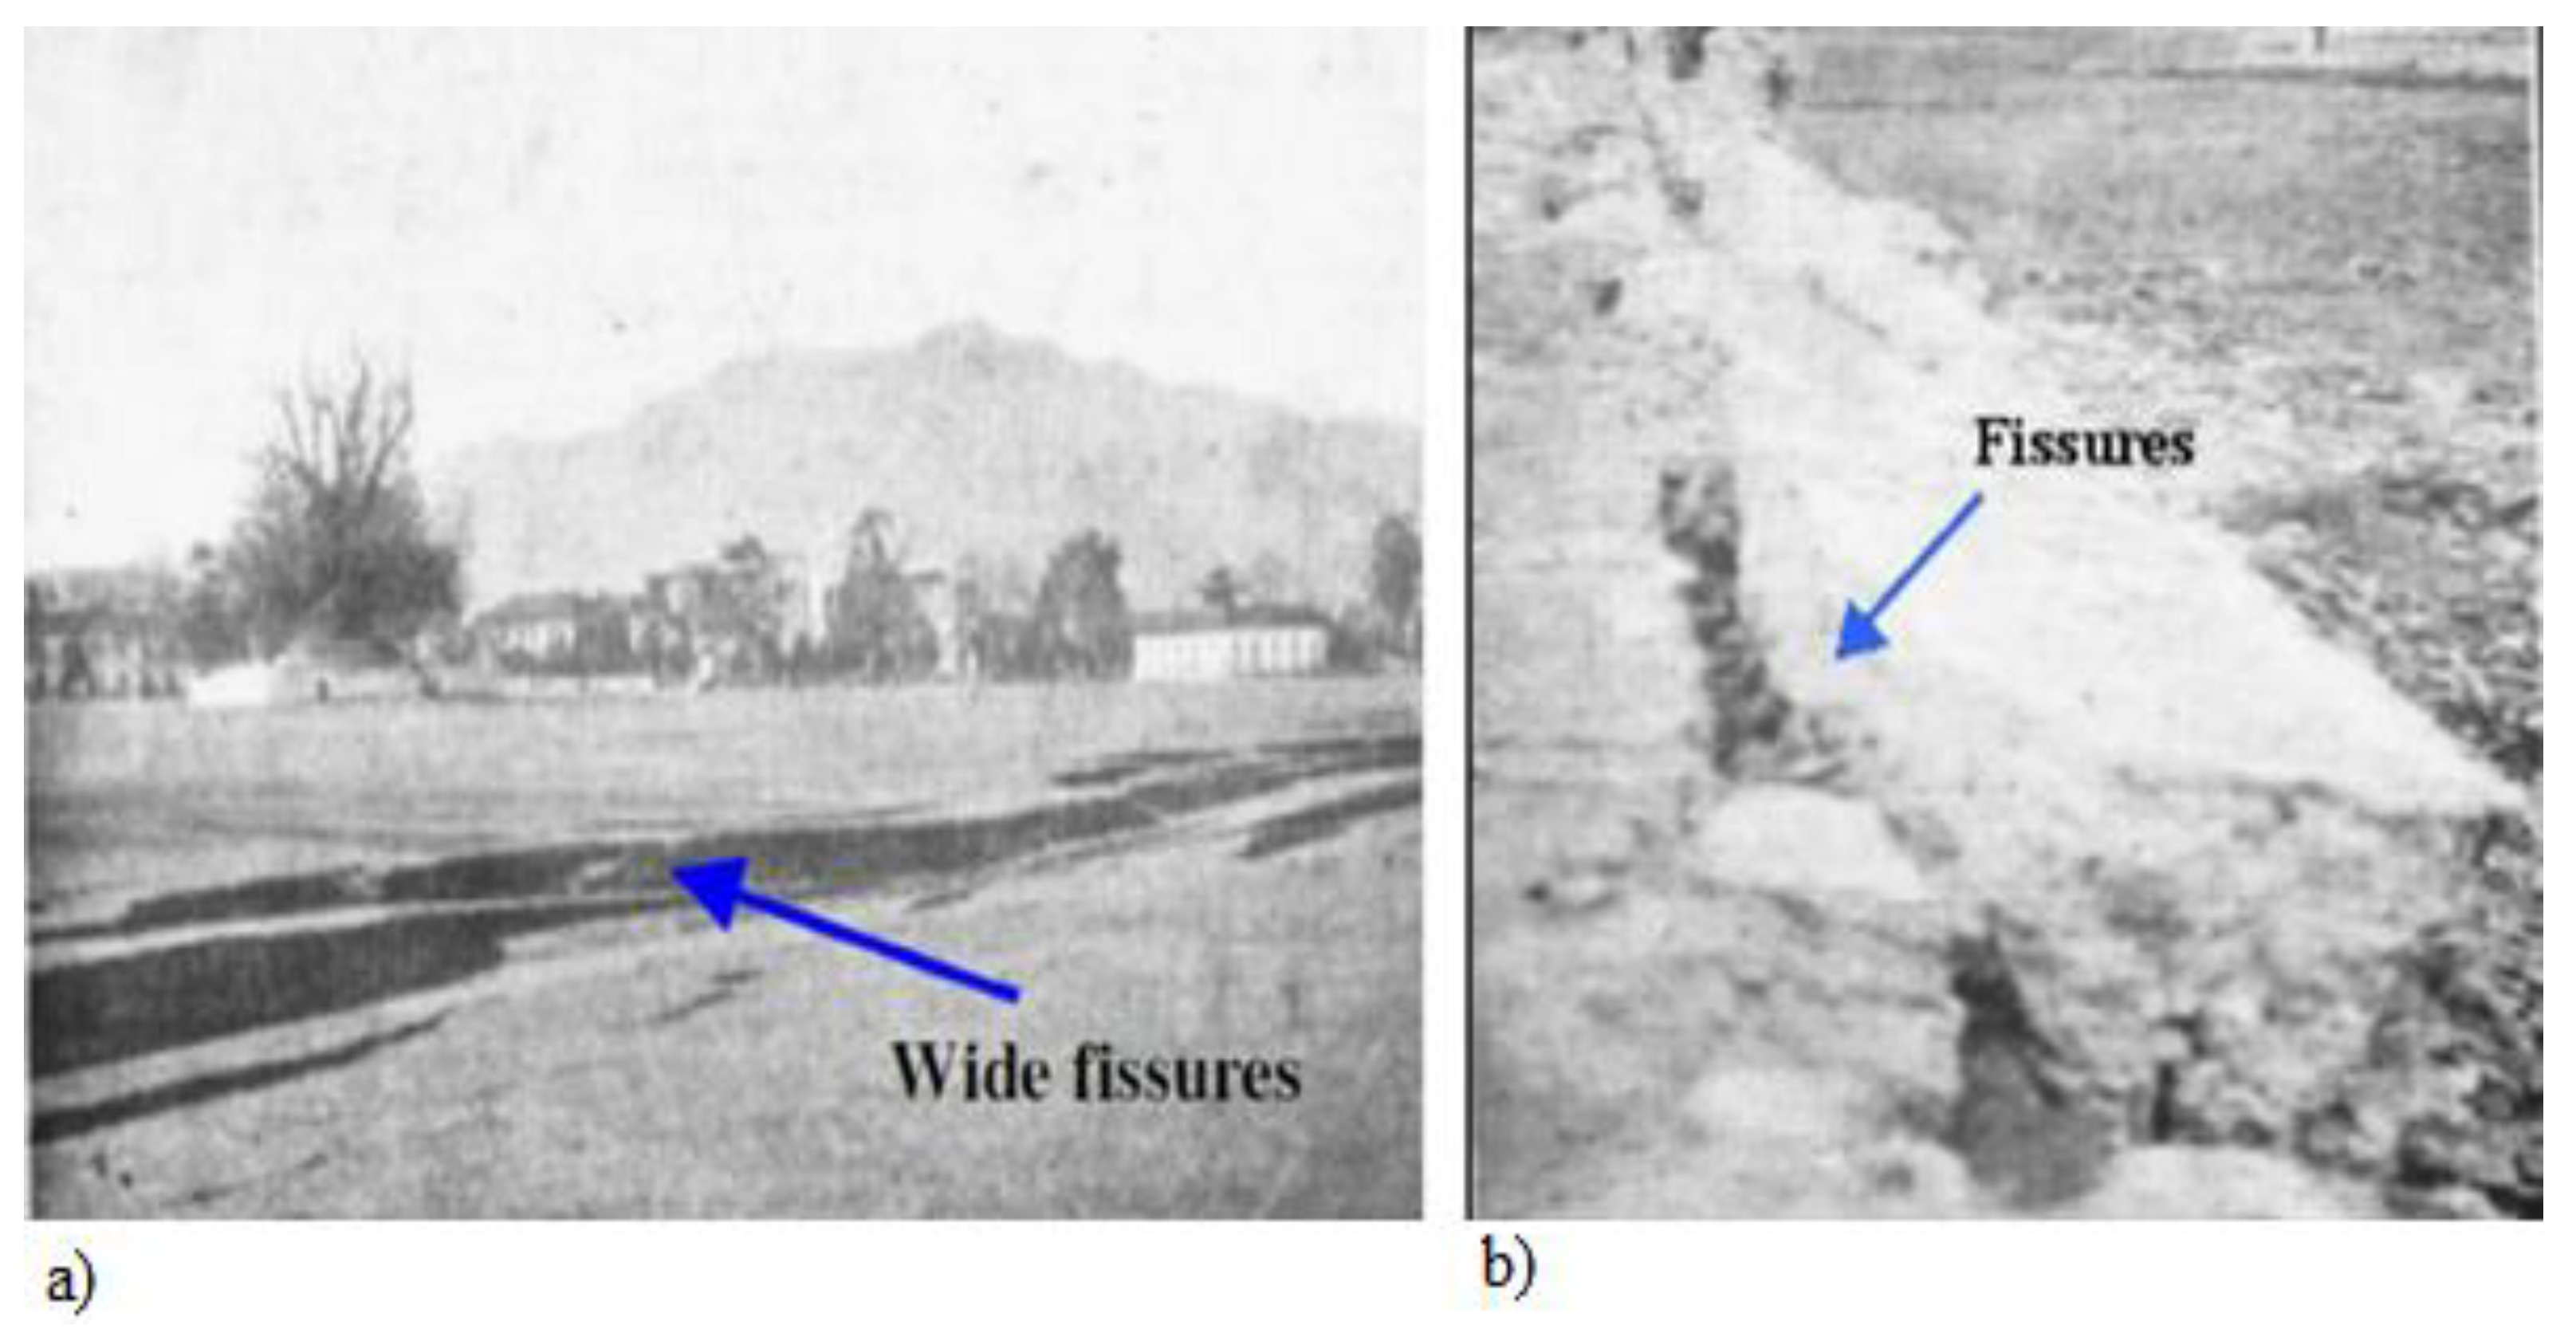
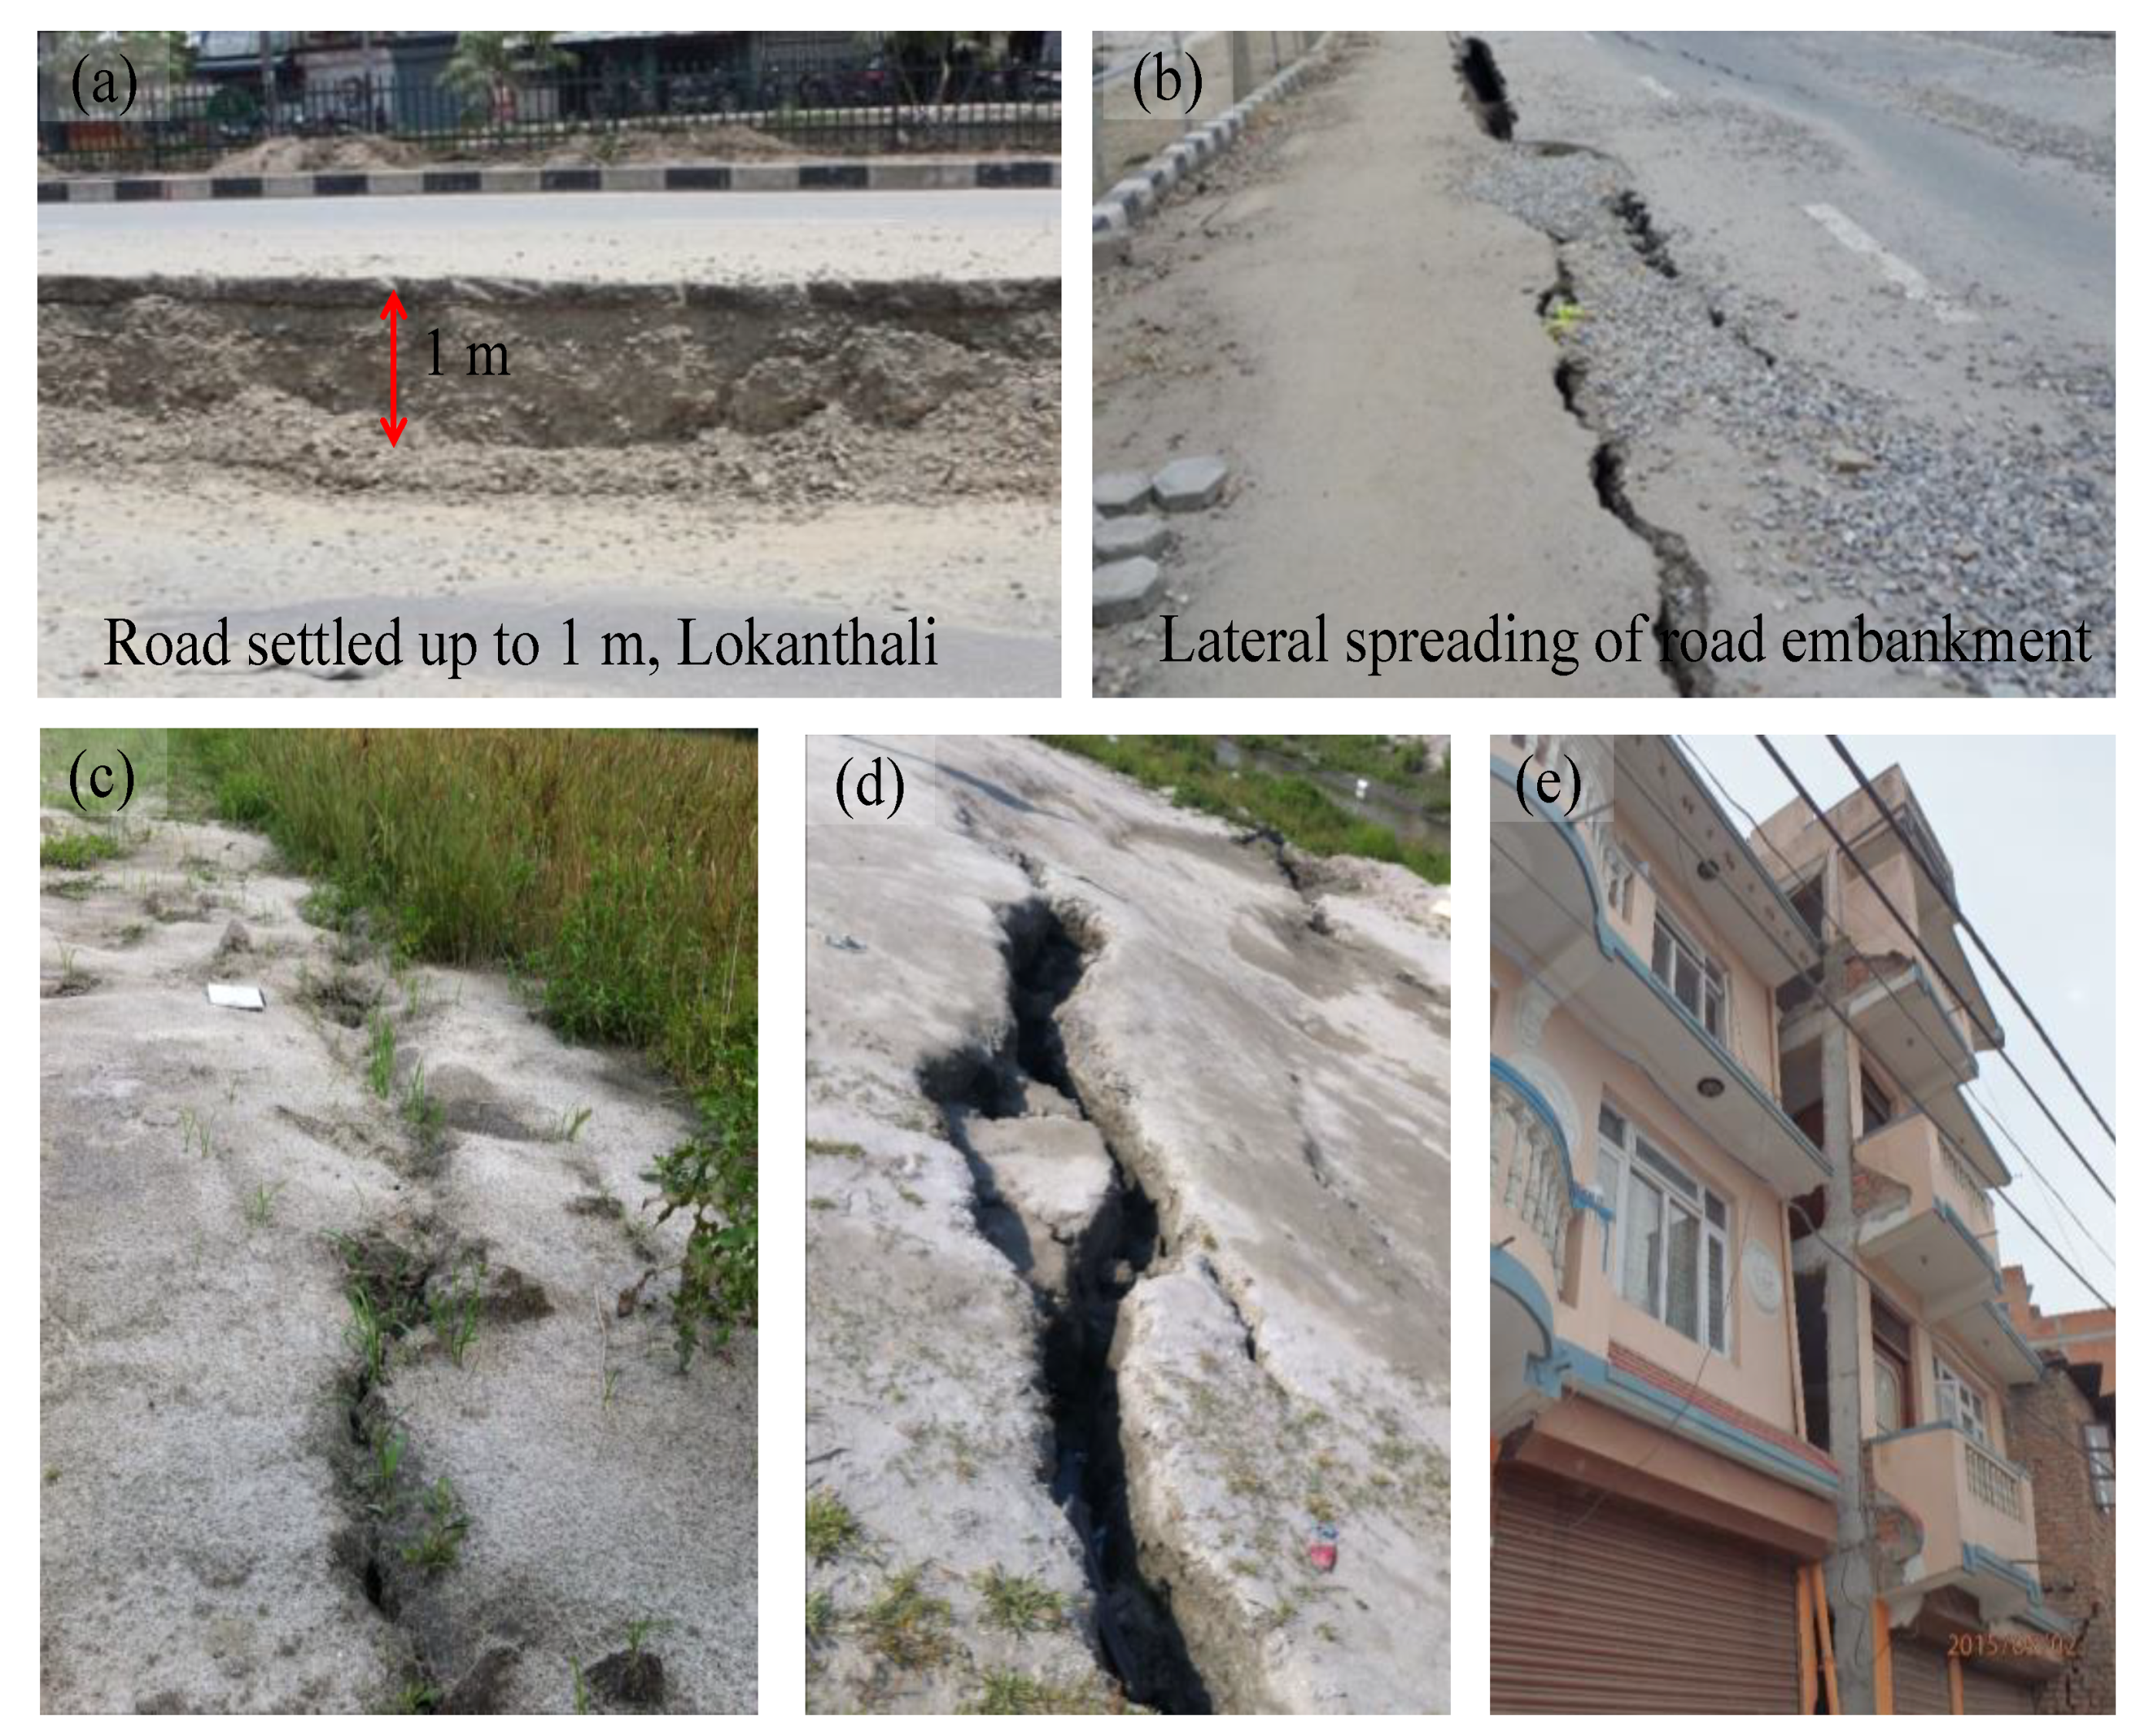
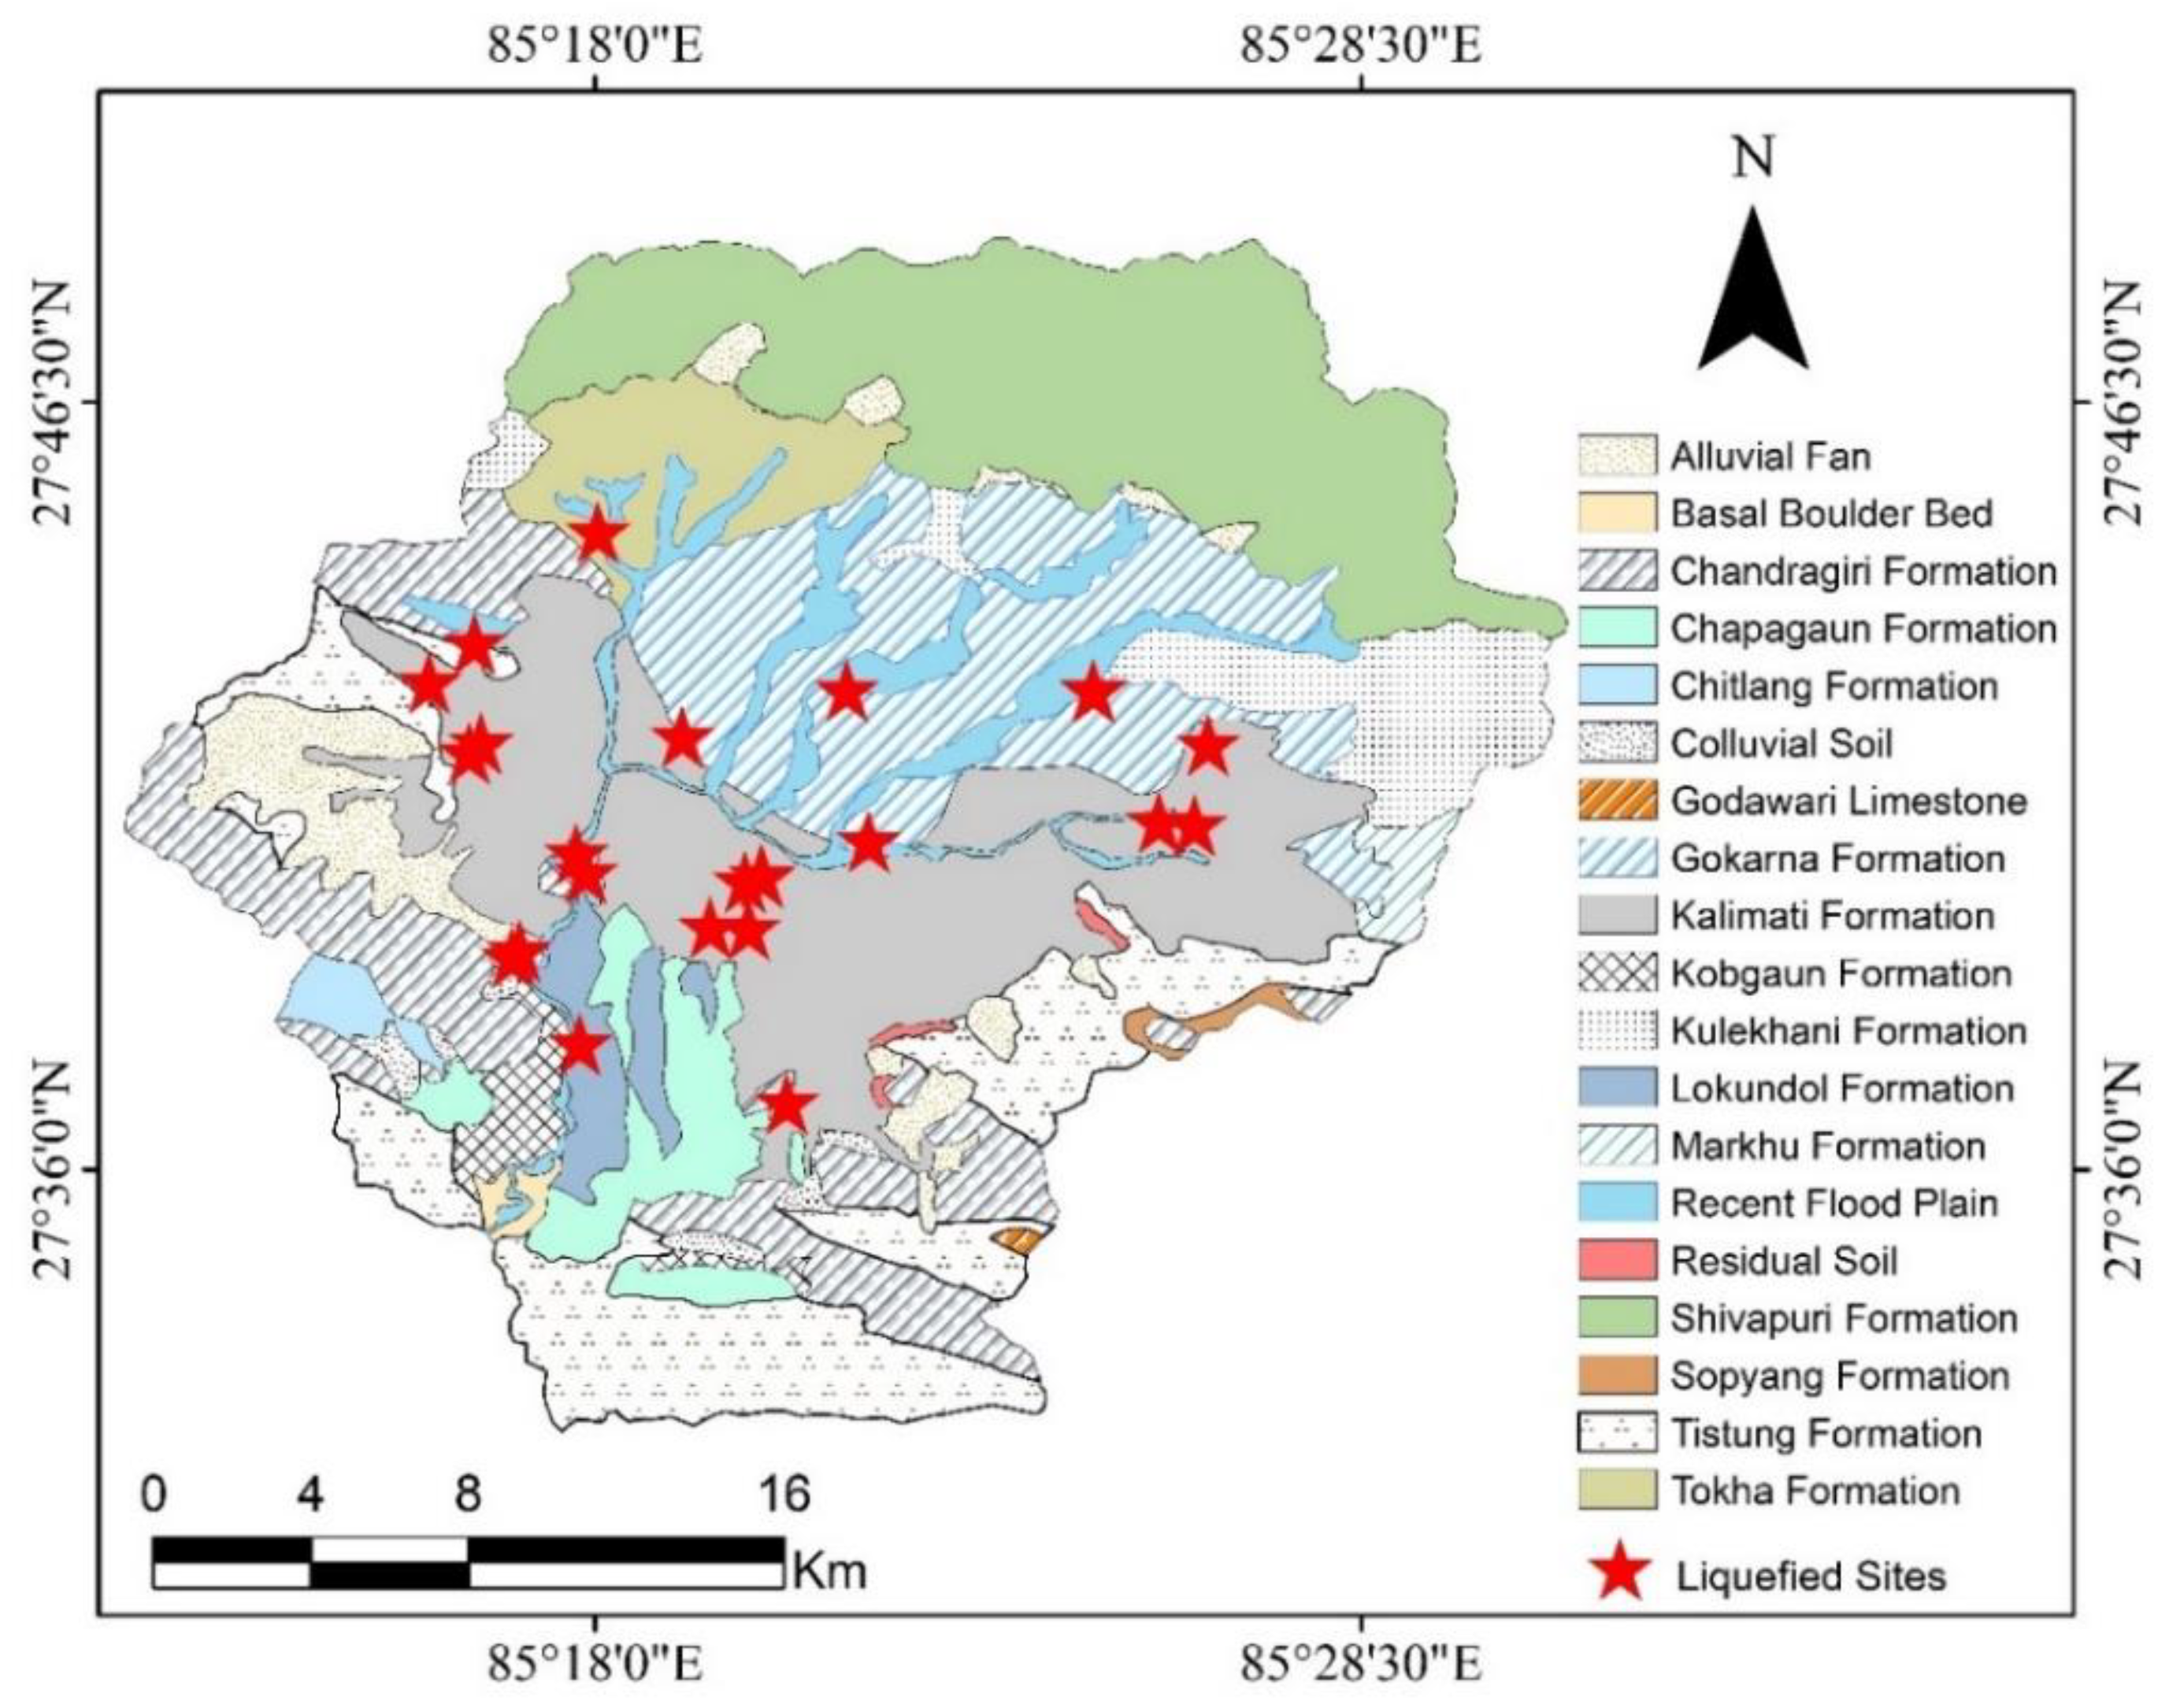
Nepal lies in one of the most active tectonic zones of the world, making the region extremely vulnerable to earthquakes. The Gorkha Nepal earthquake showed that the country experiences an earthquake of more than 7.0 Mw every 80–100 years [1]. Kathmandu, the capital city, also forming the central part of the country, is regarded as one of the most seismically vulnerable zones [2], prone to liquefaction. In recent times, the first liquefaction was reported during the 1934 Nepal–Bihar earthquake (Figure 1) in the form of ground fissures, cracks, subsidence, and sand boil up to the height of 4 to 5 m in Kathmandu Valley [3]. The most recent one, manifested in 2015 by the Gorkha, Nepal earthquake resulted in minor to major liquefaction in various locations of the valley (Figure 2 and Figure 3). Liquefaction occurred in several parts of the valley, the surface manifestations of which were visible (Figure 2) at more than 20 sites in the form of sand boils, cracks on the ground surface, and bearing capacity failure in buildings [4,5,6,7,8,9]. The liquefied sites are presented in Figure 3. Herein, it is important to note that the 2015 Gorkha earthquake occurred in the dry season, wherein the peak ground acceleration (PGA) recorded was 0.18 g, much lower than expected (i.e., 0.30 g) [4,5,8,10,11,12,13]. However, the liquefaction suggested that the soil in the valley is highly prone to it, and the situation could have been worse if an earthquake with higher PGA had occurred in the rainy season (monsoon period). Several studies (e.g., [14,15,16]) reported a significant increment of the ground water table in the rainy season.
The world at large has witnessed several pieces of evidence of liquefaction during some of the most devastating earthquakes [17,18]. For instance, the liquefaction due to the Niigata, Japan, earthquake in 1964 resulted in severe foundation failure of buildings and bridges, while also damaging roads, railroads, and airport areas [19]. As another example, one may consider the Tangshan earthquake in China in July 1976, whereby the liquefaction recorded covered over 2400 km2 area, resulting in a large-scale ground unsettlement, deformation, sliding, and sand boiling, coupled with severe damages to buildings, roads, farmlands, and bridges [20]. The liquefaction during the 1998 Adana–Ceyhan earthquake in Turkey displaced and fractured the foundations of several homes, ruptured sewers, water pipelines, and irrigation canals, and damaged small concrete bridges and pavements [21]. The widespread liquefaction during the 2001 Bhuj, India, earthquake in the meizoseismal area resulted in sand boils, craters, and lateral spreading [22]. Further, Ayothiraman et al. [23] in this regard reported that the liquefaction covered an area of more than 15,000 m2 during the 2001 Bhuj earthquake, causing significant damage. Later, in 2011, the liquefaction recorded in the Tohoku region and Kanto region covered an area of over 70 km2, including Ibaragi, Chiba, and Tokyo due to the great east Japan earthquake [24,25,26]. Even the Christchurch earthquake in 2011 resulted in ground distortion, fissures, large settlements, and lateral ground movements, severely disrupting the city’s lifelines such as road networks [27]. Most of the damage during the 2018 Sulawesi earthquake, Indonesia, was due to a liquefaction-induced lateral spreading event [28].
The liquefaction potential index (LPI) has been widely adopted in liquefaction hazard mapping, urban planning, and assessing liquefaction risk to infrastructures [29,30,31]. Liquefaction can affect and cause damage to infrastructures such as buildings, pipelines, roads in many different ways. In this regards, liquefaction potential analysis of soil using available geotechnical information is imperative to mitigate the potential damage caused by liquefaction. Several studies have been carried out to evaluate the seismic liquefaction risk for critical infrastructures by using a various simplified method. Mian et al. [32], Tang et al. [31], Maurer et al. [33] and Meslem et al. [34] evaluated liquefaction-induced loss at the critical infrastructure scale by using several parameters such as LPI, Liquefaction Severity Number (LSN), and Probability of Liquefaction (PL). Phule and Choudhury [35] and D’Apuzzo et al. [36] conducted a liquefaction risk assessment of transportation systems by using a simplified approach. Similarly, Paolella et al. [37], Mosavat et al. [38], and Coelho and Costa [39] assessed the liquefaction risk to building structures. As most of the buildings in Nepal have been constructing with shallow foundations [12], the same simplified approach can be used to evaluate the liquefaction risk to roads, airports, and buildings. Past studies showed that liquefaction is highly vulnerable to shallow foundations [37,40].
Figure 3.
Engineering geological map of Kathmandu Valley (modified after Sakai (Adapted from ref. [41])).
Figure 3.
Engineering geological map of Kathmandu Valley (modified after Sakai (Adapted from ref. [41])).

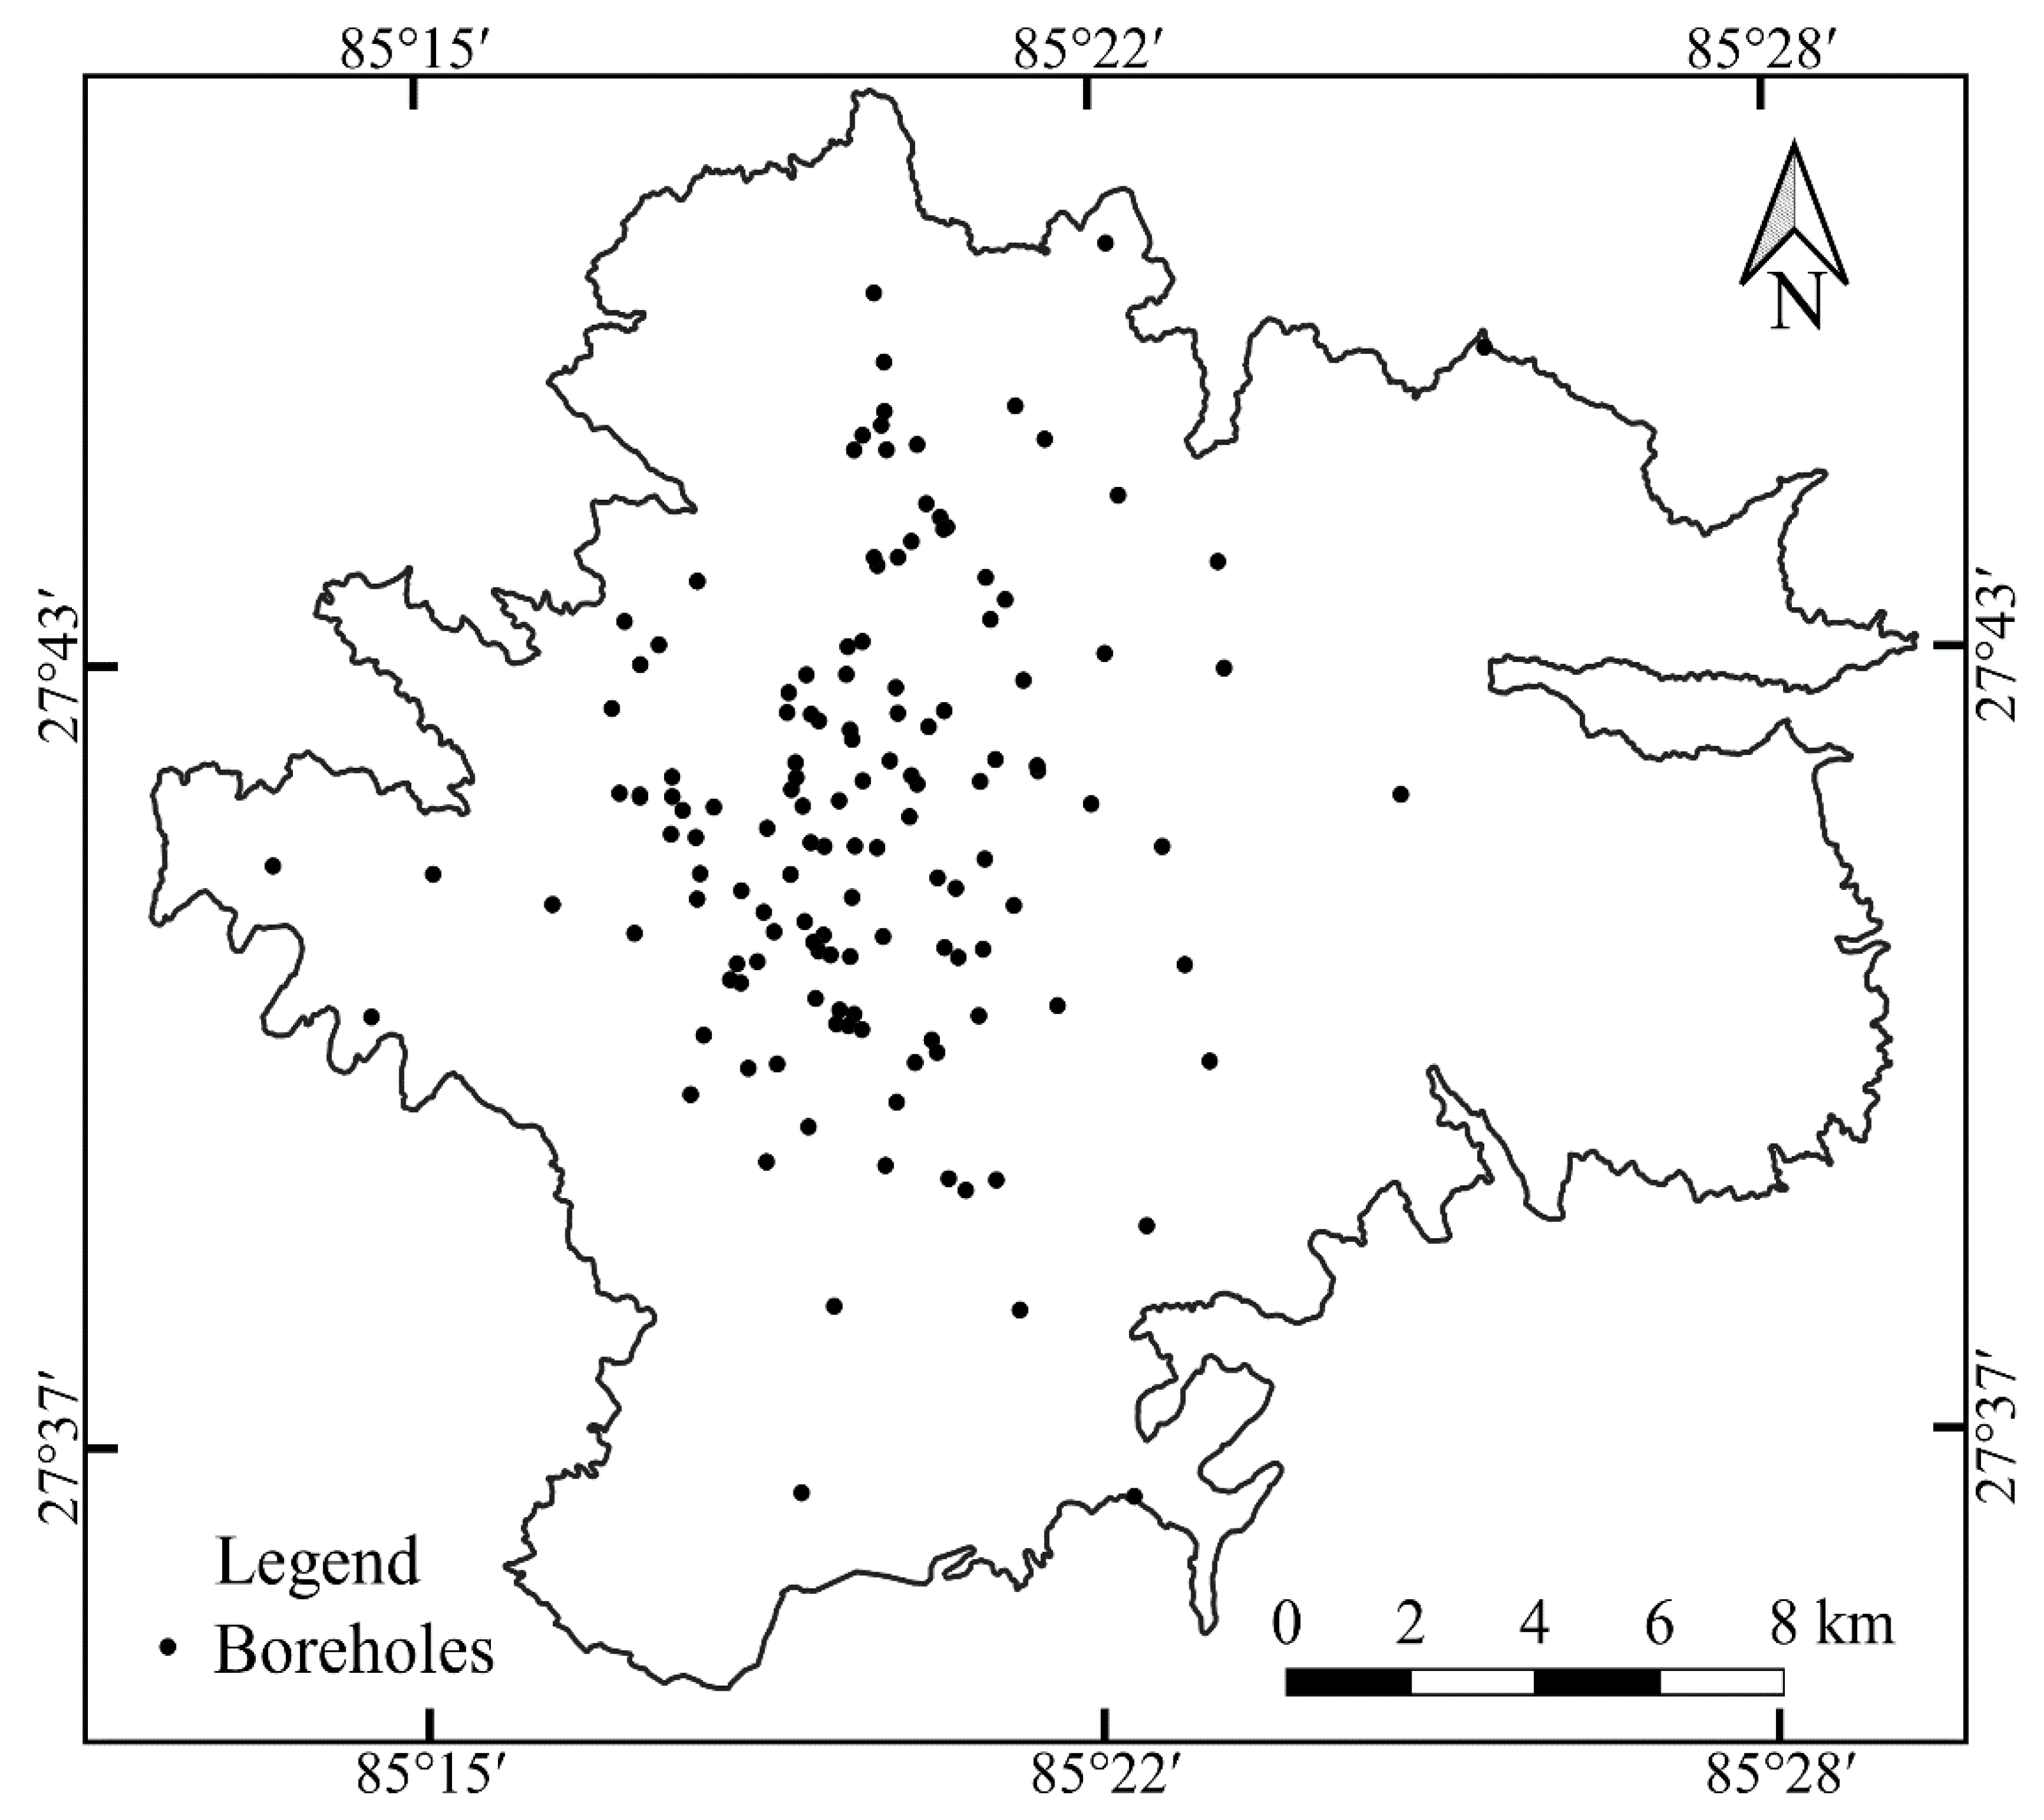
Kathmandu Valley has many perennial rivers flowing through it, and most parts have a young sandy silt to silty sand layer in the upper bound. The presence of a young loose saturated sand deposit makes the valley’s soil vulnerable to liquefaction even in earthquakes during the dry season, such as those of 1934 and 2015. Soil liquefaction potential in the valley has been determined in the past by different researchers [9,42,43]; however, the effects of liquefaction on critical facilities of the valley have not been studied yet. The ability to respond and recover from a disaster such as an earthquake is directly related to the condition of critical facilities during those disasters. Moreover, in earlier studies, limited borehole data were used, while in this study more than 500 boreholes up to depths of 20.0 m from 143 locations were considered (Figure 4). Furthermore, most of the previous studies were confined to determining the safety factor against liquefaction, rather than the liquefaction potential index (LPI). Notably, the factor of safety against liquefaction at a given depth does not necessarily provide any clear information on the severity of liquefaction; however, in this study, we calculated LPI at each borehole site.
Thus, the objective of this study is to predict the effects of liquefaction on selected critical facilities of Kathmandu Valley using LPI. Further, the critical facilities chosen for this study include road networks, health facilities, airports, schools, and colleges. This study would be beneficial in city planning, as well as for mitigation activities for critical infrastructures in the valley, making it better prepared to tackle such disasters in the future. The results from this study can be used only for desk, preliminary and feasibility studies. Similar studies can be carried out for other critical facilities such as fire and emergency response systems, police and other security stations, electrical facilities, etc., and also in other major cities of the country such as Pokhara and Butwal.
2. Earthquake History and Scenario
Kathmandu Valley is located in the center of the Himalayan concave chain. The Himalayan arc, which marks an active boundary between the Indian and Eurasian plates, has caused numerous large earthquakes, both in recent and historical times. Kathmandu Valley is surrounded by three major tectonic zones, namely the Main Central Thrust (MCT), Main Boundary Thrust (MBT) and Main Frontal Thrust (MFT) [10,44]. Many active faults are distributed along these major tectonic boundaries, clearly highlighting the seismic hazard in this region. The first documented earthquake event in the country dates back to 7 June 1255. Over recent centuries, earthquakes in 1803, 1833, 1897, 1905, 1934, 1950, 2001, and 2005 have occurred in the Himalayan region and resulted in a large number of casualties and extensive damages to structures [17,18,45,46]. The most recent major earthquake in Nepal is the 2015 Gorkha earthquake. Though there have been numerous earthquakes larger than Mw 7.0 in the past, the 2015 Gorkha earthquake is the most recent and well-documented earthquake in the region.
Several probabilistic seismic hazard assessments have been conducted for Kathmandu Valley. Seismic hazard analysis for Kathmandu Valley has been largely confined to similar sources and resulted from similar earthquake scenarios, i.e., magnitude and PGA [13,47]. Probabilistic seismic hazard assessments conducted by JICA [13] considering seismic source zone models based on improved earthquake catalogues and modern ground motion models have been widely used [10,12]. JICA [13] estimated the ground motion of Kathmandu Valley after analyzing three different scenario earthquakes. Three scenario earthquakes (Central Nepal South Scenario Earthquake, Far-Mid Wester Nepal Scenario Earthquake, and Western Nepal Scenario Earthquake) were selected considering the fault, seismo-tectonic and geological condition around Kathmandu Valley. The 1934 Bihar–Nepal earthquake was considered as a verification earthquake. One-dimensional ground response analysis was carried out for the ground amplification. The ground model for response analysis was prepared from typical column data by conducting several field investigations for soil type and shear wave velocity (Vs). An attenuation formula was considered to get the peak ground acceleration at the bedrock. The bedrock was considered to be the layer at which the minimum Vs is 400 m/s, which exists almost at a depth of 100 m from the ground surface. JICA [13] reported a PGA of 0.30 g for scenario earthquake of 8.0 Mw with a 10% probability of exceedance in 50 years (i.e., return period of 475 years) in Kathmandu Valley.
3. Study Area
The critical facilities of Kathmandu Valley, the capital of Nepal, were studied, and the effects of liquefaction were predicted. The region around the valley has high hills with steep slopes; shallow bedrocks were also noted in areas around the hills. The geological map of the valley is shown in Figure 3. The study area was decided on after excluding the area with bedrock in shallow depth from the specific areas of the valley. Generally, the most common soils in the valley are clayey silt and grey to dark silty sand. Additionally, poorly graded, and silty sands can be observed along the river, which is highly susceptible to liquefaction. Organic clay, fine sand beds, and peat layers may also be found in the surface layer up to 1 m [48]. Many perennial rivers flow through the valley, which effectively helps the groundwater table to remain high.
4. Critical Facilities
The objective of this research is to predict the effects of liquefaction on critical facilities of Kathmandu Valley. The data of critical facilities of Kathmandu Valley were collected from the department of survey (Nepal), available topographical sheets, google earth images, and open street map (OSM) data. Though there are several critical facilities in the region, the ones considered include the road networks, airport, hospitals, schools, and colleges, the details of which are presented below.
4.1. Road Network
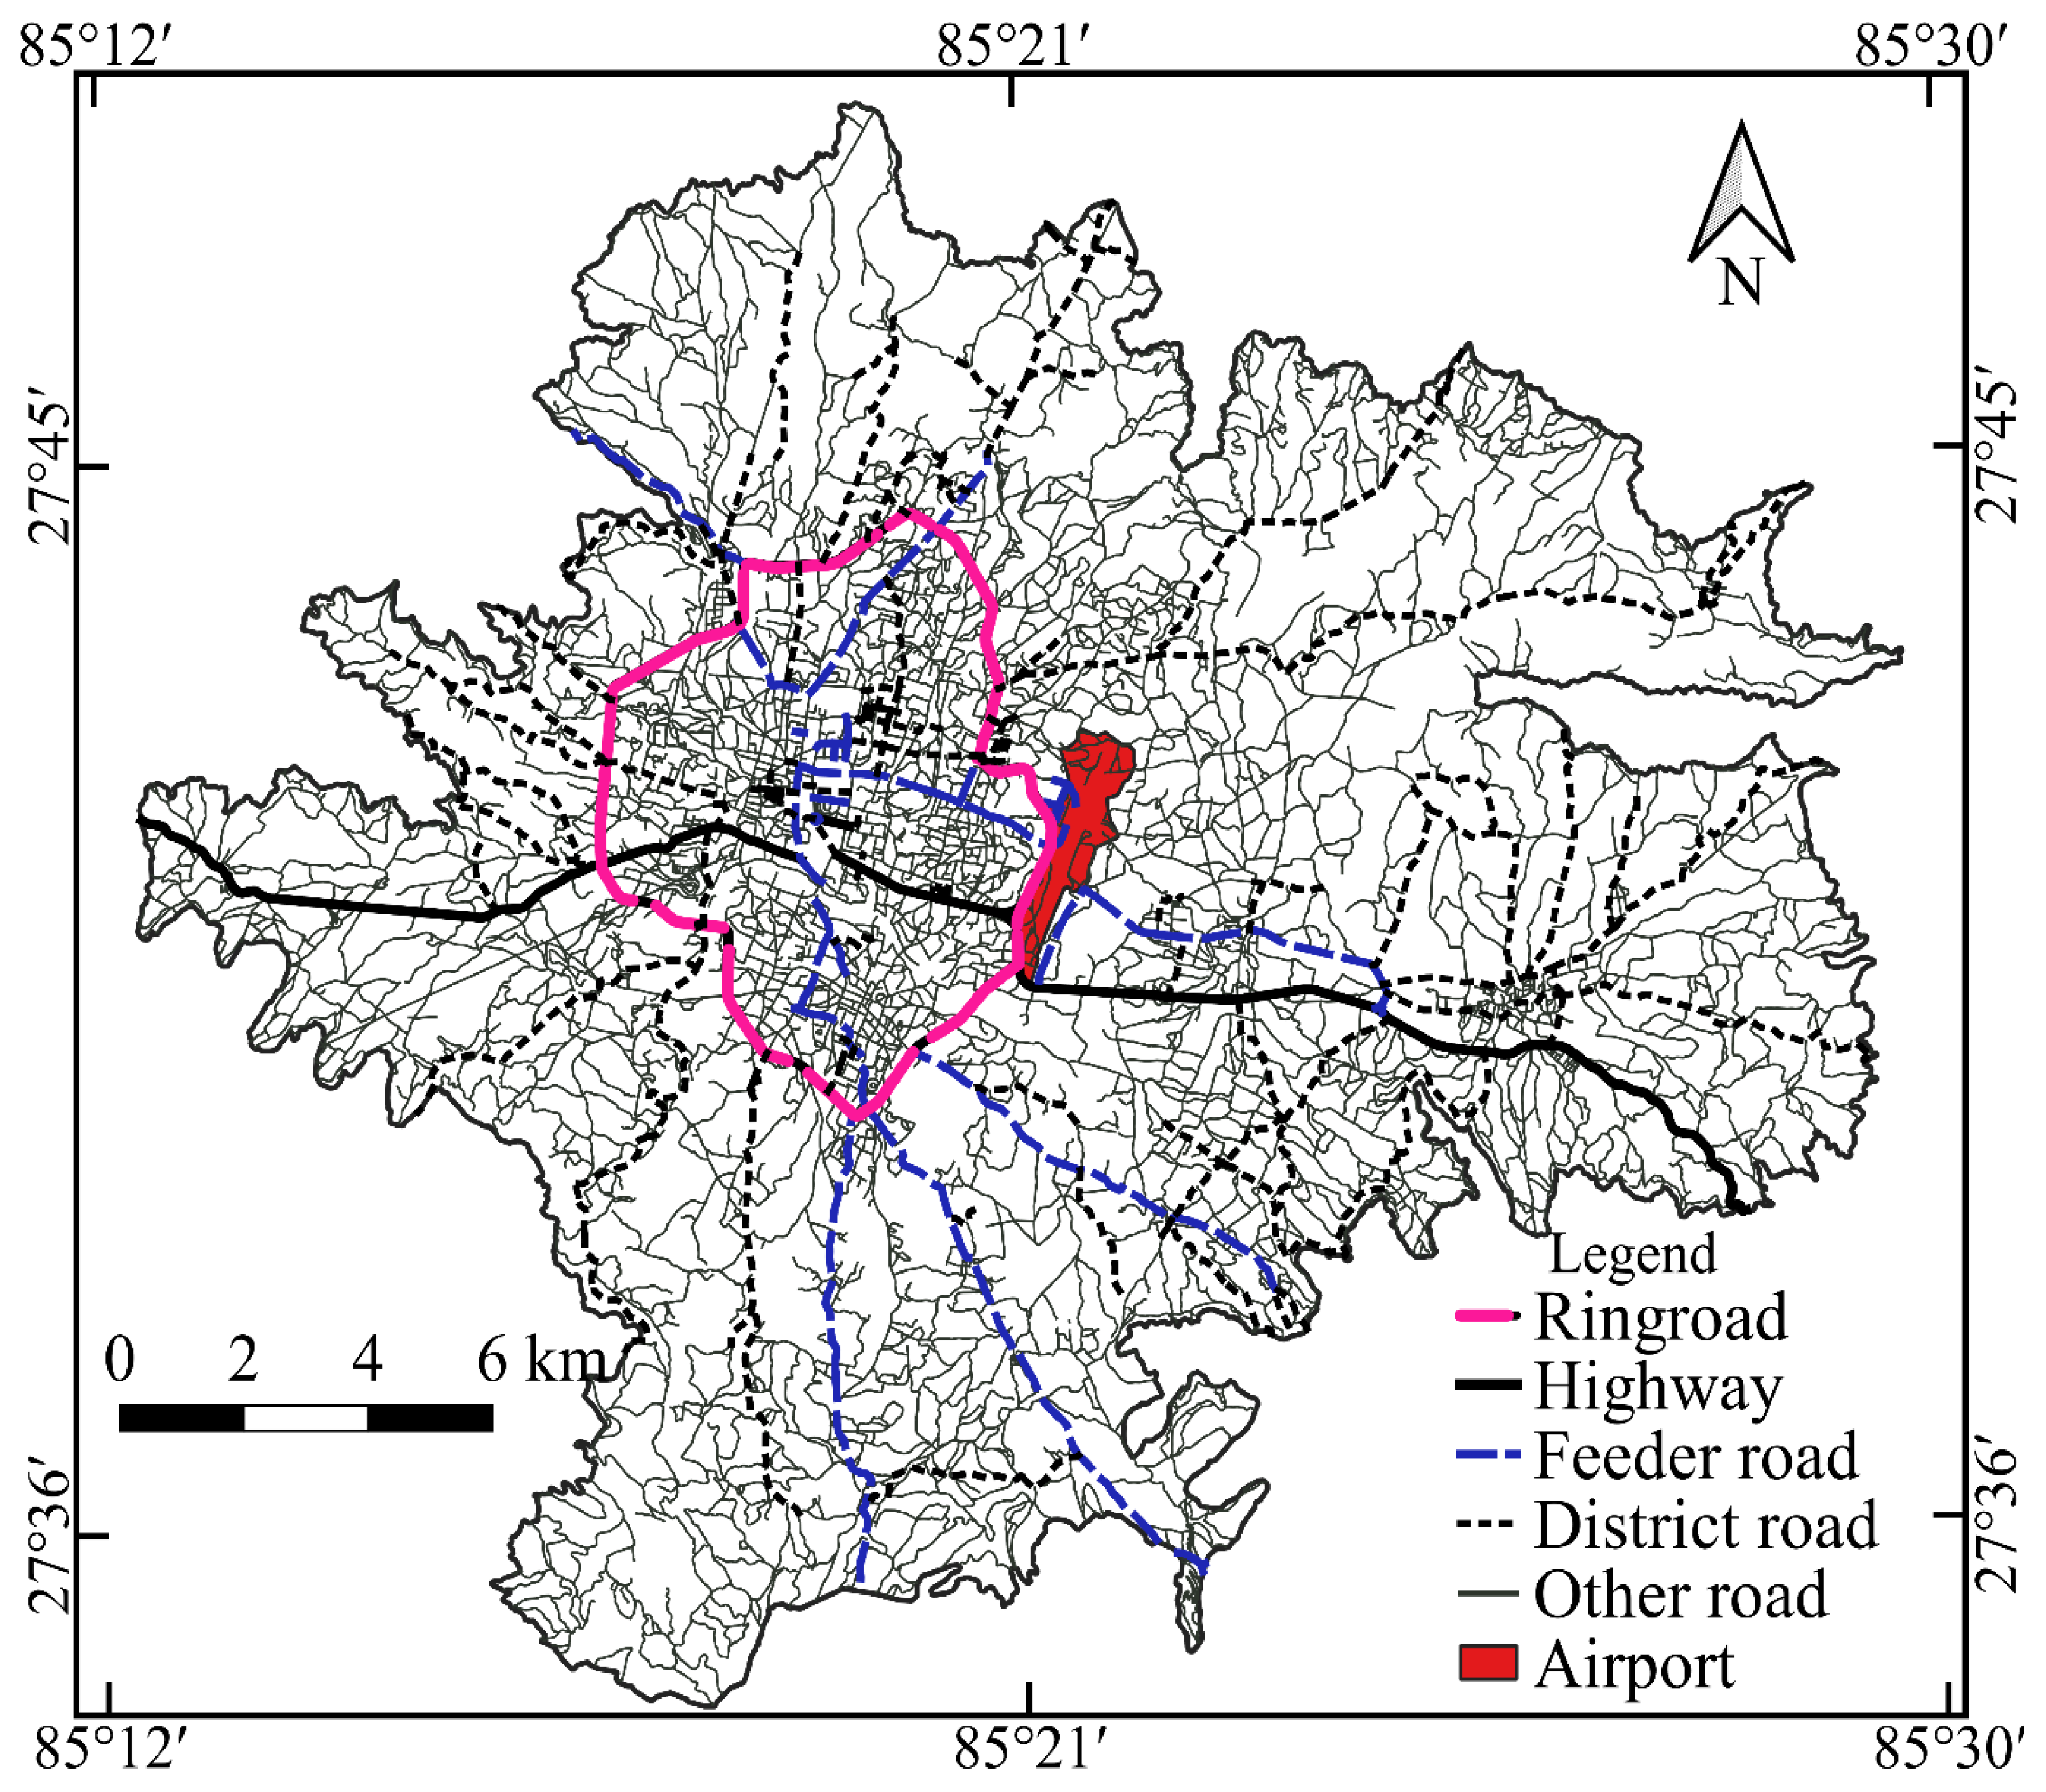
The roadway is the only means of transport within Kathmandu Valley; under normal circumstances, the airway is not used for goods transport, which effectively makes roadways the only means to import goods required for Kathmandu. Road networks are thereby critical structures that need to withstand disasters such as earthquakes, particularly seismic hazards such as liquefaction. The Nepal Road Standard [49] has classified roads into four categories; these include (i) the national highway, (ii) feeder roads, (iii) district roads, and (iv) urban roads. For simplicity, we have renamed the urban roads and smaller streets as ‘other roads’. The total length of the entire road network (Figure 5) used in this study is about 1974.1 km, out of which the length of the national highway is 55.6 km, the feeder road is 58.1 km, the district road is 189.3 km, and other road is 1671.0 km. The national highways are the main roads that connect the entire country, while the feeder roads are more localized in nature, serving the community’s interest, and connecting district headquarters, major economic centers, and tourism centers. District roads serve the production and market areas, while urban roads serve to connect the people within the urban municipalities.
4.2. Airport
Tribhuvan International Airport (TIA) is the only international airport in the country and the only airport in the capital city. This makes the TIA a pivotal center to receive a rapid response from the international community and reach regions outside the valley during disasters such as earthquakes. The total area of TIA (shown in Figure 5) used for zoning in this study is 2.768 Sq. km.
4.3. Health Facility
Health facilities need to withstand disasters and serve people during emergencies; in effect, these infrastructures need to be extra strong, and special attention during construction should be given. The health facilities include hospitals, critical care facilities, clinics, and other facilities that provide emergency health responses, especially during a disaster. A total of 263 health facilities (Figure 6) inside the valley have been categorized according to their locations in the liquefaction susceptibility zone.
4.4. School and College
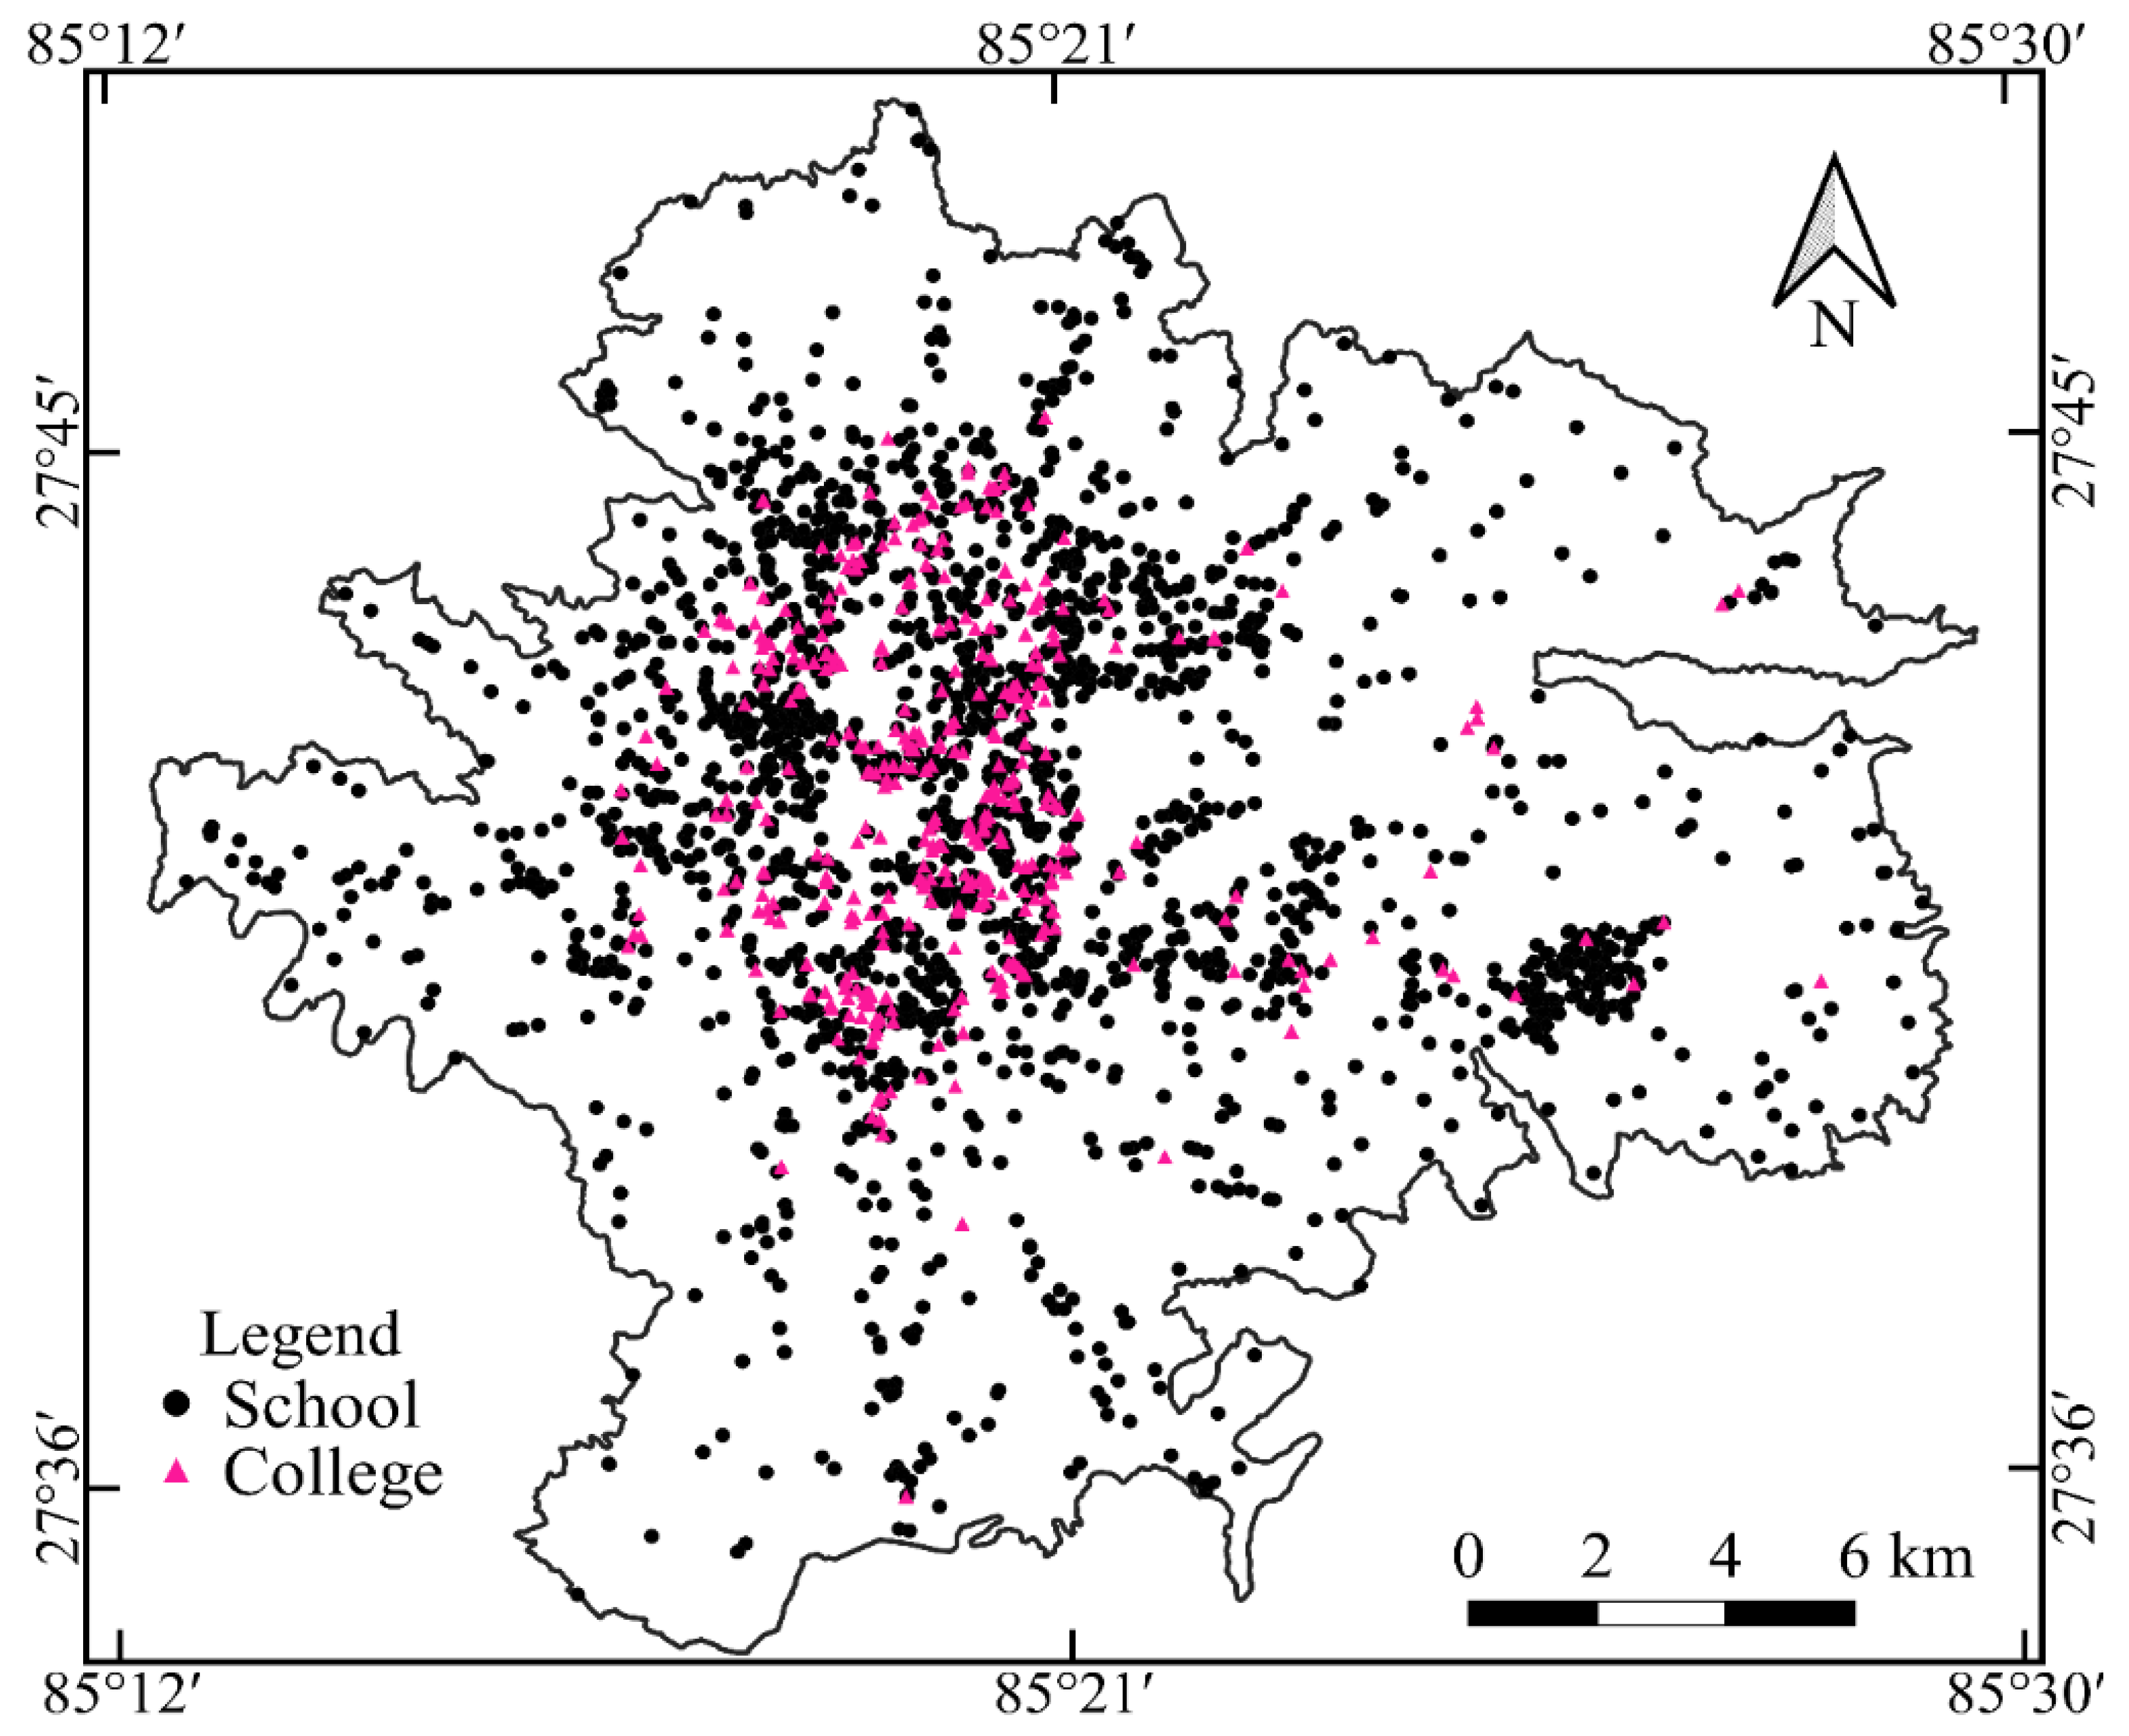
Under normal circumstances, schools and colleges are not considered critical facilities. However, there is minimal open land in Kathmandu, which is very critical during an emergency. In that regard, schools and colleges in the valley have been considered critical, often serving as a temporary shelter during disasters. A total of 1973 schools and 404 colleges (Figure 7) of Kathmandu have been considered for this research. It is seen that the density of schools and colleges in the central part of Kathmandu Valley is high while this value is quite low in the countryside of the valley.
5. SPT-Based Liquefaction Assessment
In Nepal, most of the geotechnical investigations thus far have been limited to standard penetration tests to a depth of 15 to 20 m because other in situ geotechnical investigations, such as cone penetration tests (CPTs) and shear wave velocity tests, have been sparsely used. Although more modern approaches for liquefaction analysis using the CPT, shear wave velocity, and cyclic loading tests have been developed and provide more accurate results, the liquefaction potential assessment in the valley has mostly relied on SPT-N values and borehole data [9,42]. Several methods are available for liquefaction assessment of soil (e.g., [50,51,52,53,54,55,56,57]) and estimating settlement and lateral displacement of soil (e.g., [56,58]) due to liquefaction. In this study, the method suggested by Idriss and Boulanger [50] was adopted to perform an analysis of the factor of safety (FS) with respect to liquefaction. This method has been modified several times, as per the liquefaction case studies from the past earthquakes, and uses the SPT data and geotechnical properties of the soil profile to predict the factor of safety against the liquefaction for each layer [50]. Additionally, we also adopted Iwasaki et al.’s [59] method to calculate the Liquefaction Potential Index (LPI) of the sites, using FS against liquefaction on each layer. As already mentioned, the liquefaction analysis was performed considering an earthquake scenario of 8.0 Mw with a PGA of 0.30 g.
In this method, the FS with respect to liquefaction can be calculated using Equation (1) [50]. The property of the soils to resist liquefaction is defined as the cyclic resistance ratio (CRR), and the stress (loading) that results in liquefaction is termed the cyclic stress ratio (CSR).
where CRR7.5 is the cyclic resistance ratio calibrated for the earthquake of magnitude 7.5. The CRR7.5 can be modified using the magnitude scaling factor (MSF) for an earthquake having different magnitudes; MSF accounts for the effects of the number of cycles during the earthquake or earthquake duration. The value of MSF for the considered scenario earthquake was calculated using Equation (2) [50]:
Equation (3) [50] was used for determining the CRR for a cohesionless soil with any fines content.
where (N1)60cs is an equivalent clean-sand SPT blow count. The following equations (Equations (4) and (5)) are used to calculate (N1)60cs [50]:
where (N1)60 is the corrected SPT-N value and FC is the fines content in the soils obtained from sieve analysis of soil collected using a split spoon.
The measured SPT-N value was corrected using Equation (6):
where (N1)60 is the SPT blow count normalized to the atmospheric pressure of 100 kPa and a hammer efficiency of 60%, N is the measured SPT blow count, and CN, CE, CB, CR and CS are the correction factors for the overburden stress, hammer energy ratio, borehole diameter, rod length and samplers with or without liners, respectively.
The CSR is calculated by Equation (7) [50]:
where is the earthquake-induced maximum shear stress, amax is the peak horizontal acceleration at the ground surface, g is the gravitational acceleration, σvc and σ’vc are the total overburden stress and effective overburden stress, respectively, and rd is the stress reduction coefficient given by Equation (8) [50]:
where z is the depth of the soil layer in meters.
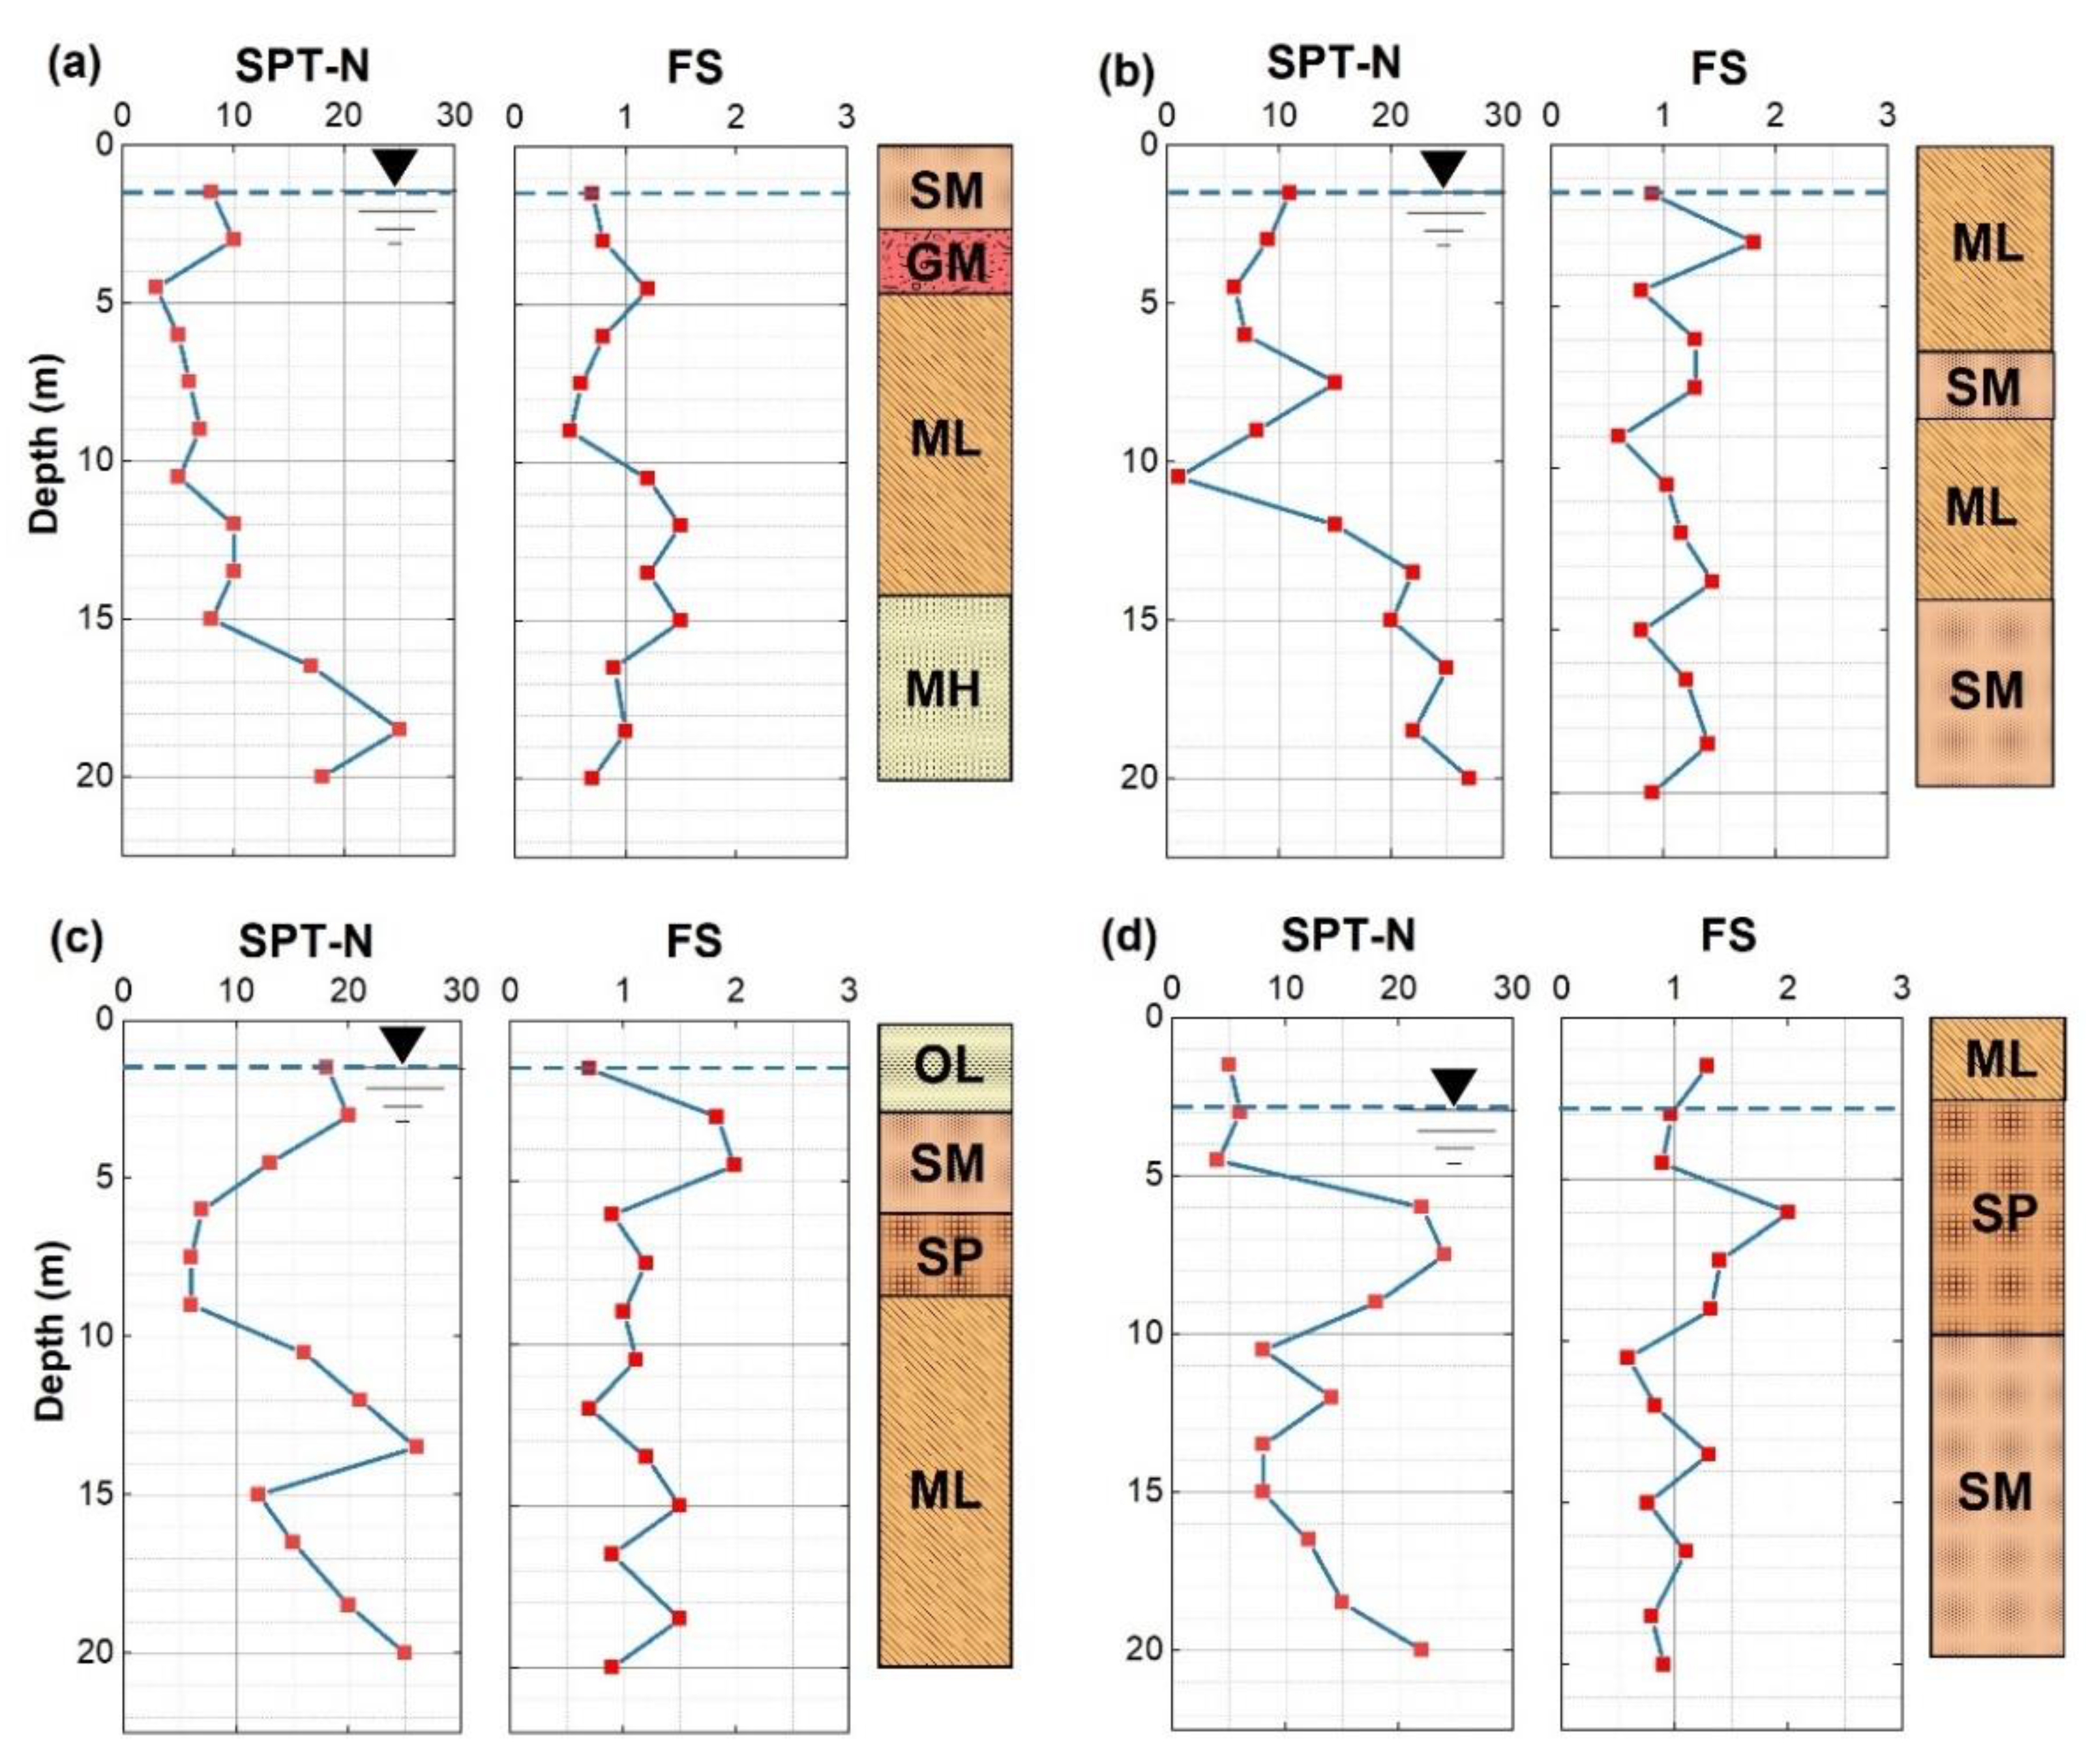
A typical soil profile, SPT-N value, and FS is shown in Figure 8. A sample calculation of FS and LPI is shown in Table 1.
Liquefaction Potential Index (LPI)
The factor of safety against liquefaction at a given depth does not provide clear information on the severity of the potential ground deformation. For predicting the severity of liquefaction at a site through considering the soil profile in the top 20 m, the LPI was calculated using Equations (9)–(13) [59]:
where
F(z) = 1 − FS For FS < 1
F(z) = 0 For FS ≥ 1
W(z) = 10 − 0.5z For z < 20
W(z) = 0 For z ≥ 20
6. Results and Discussion
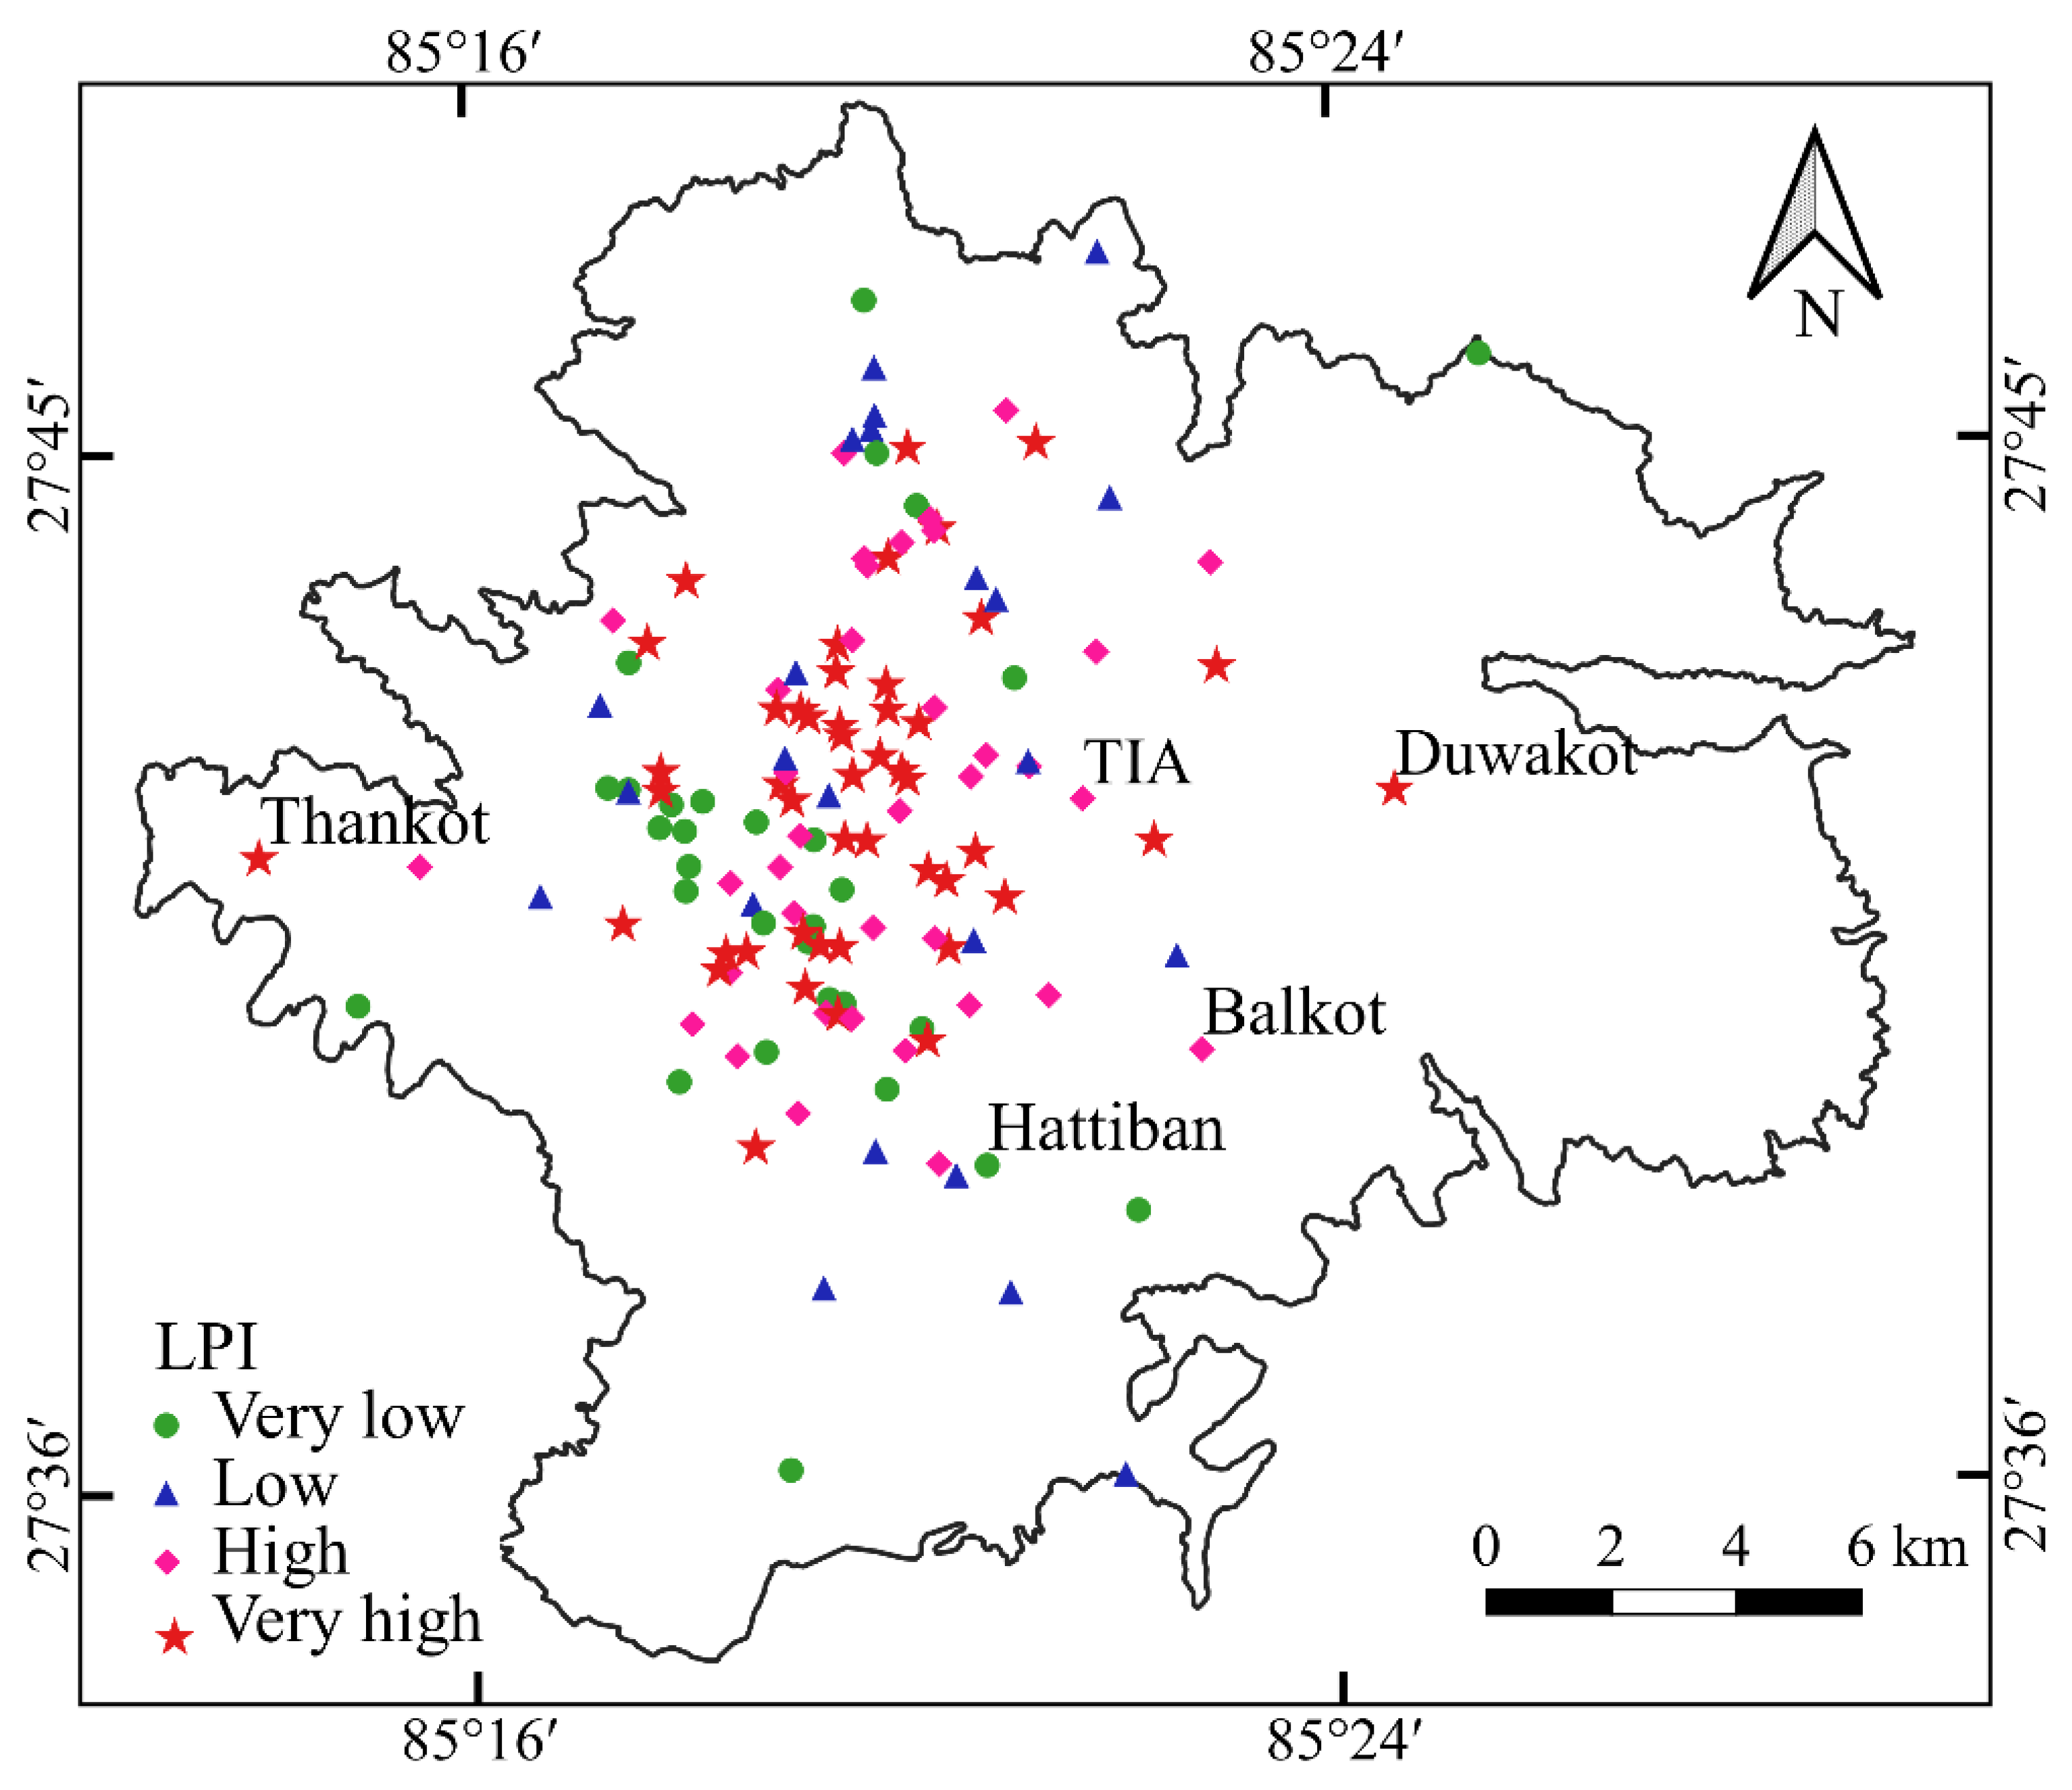
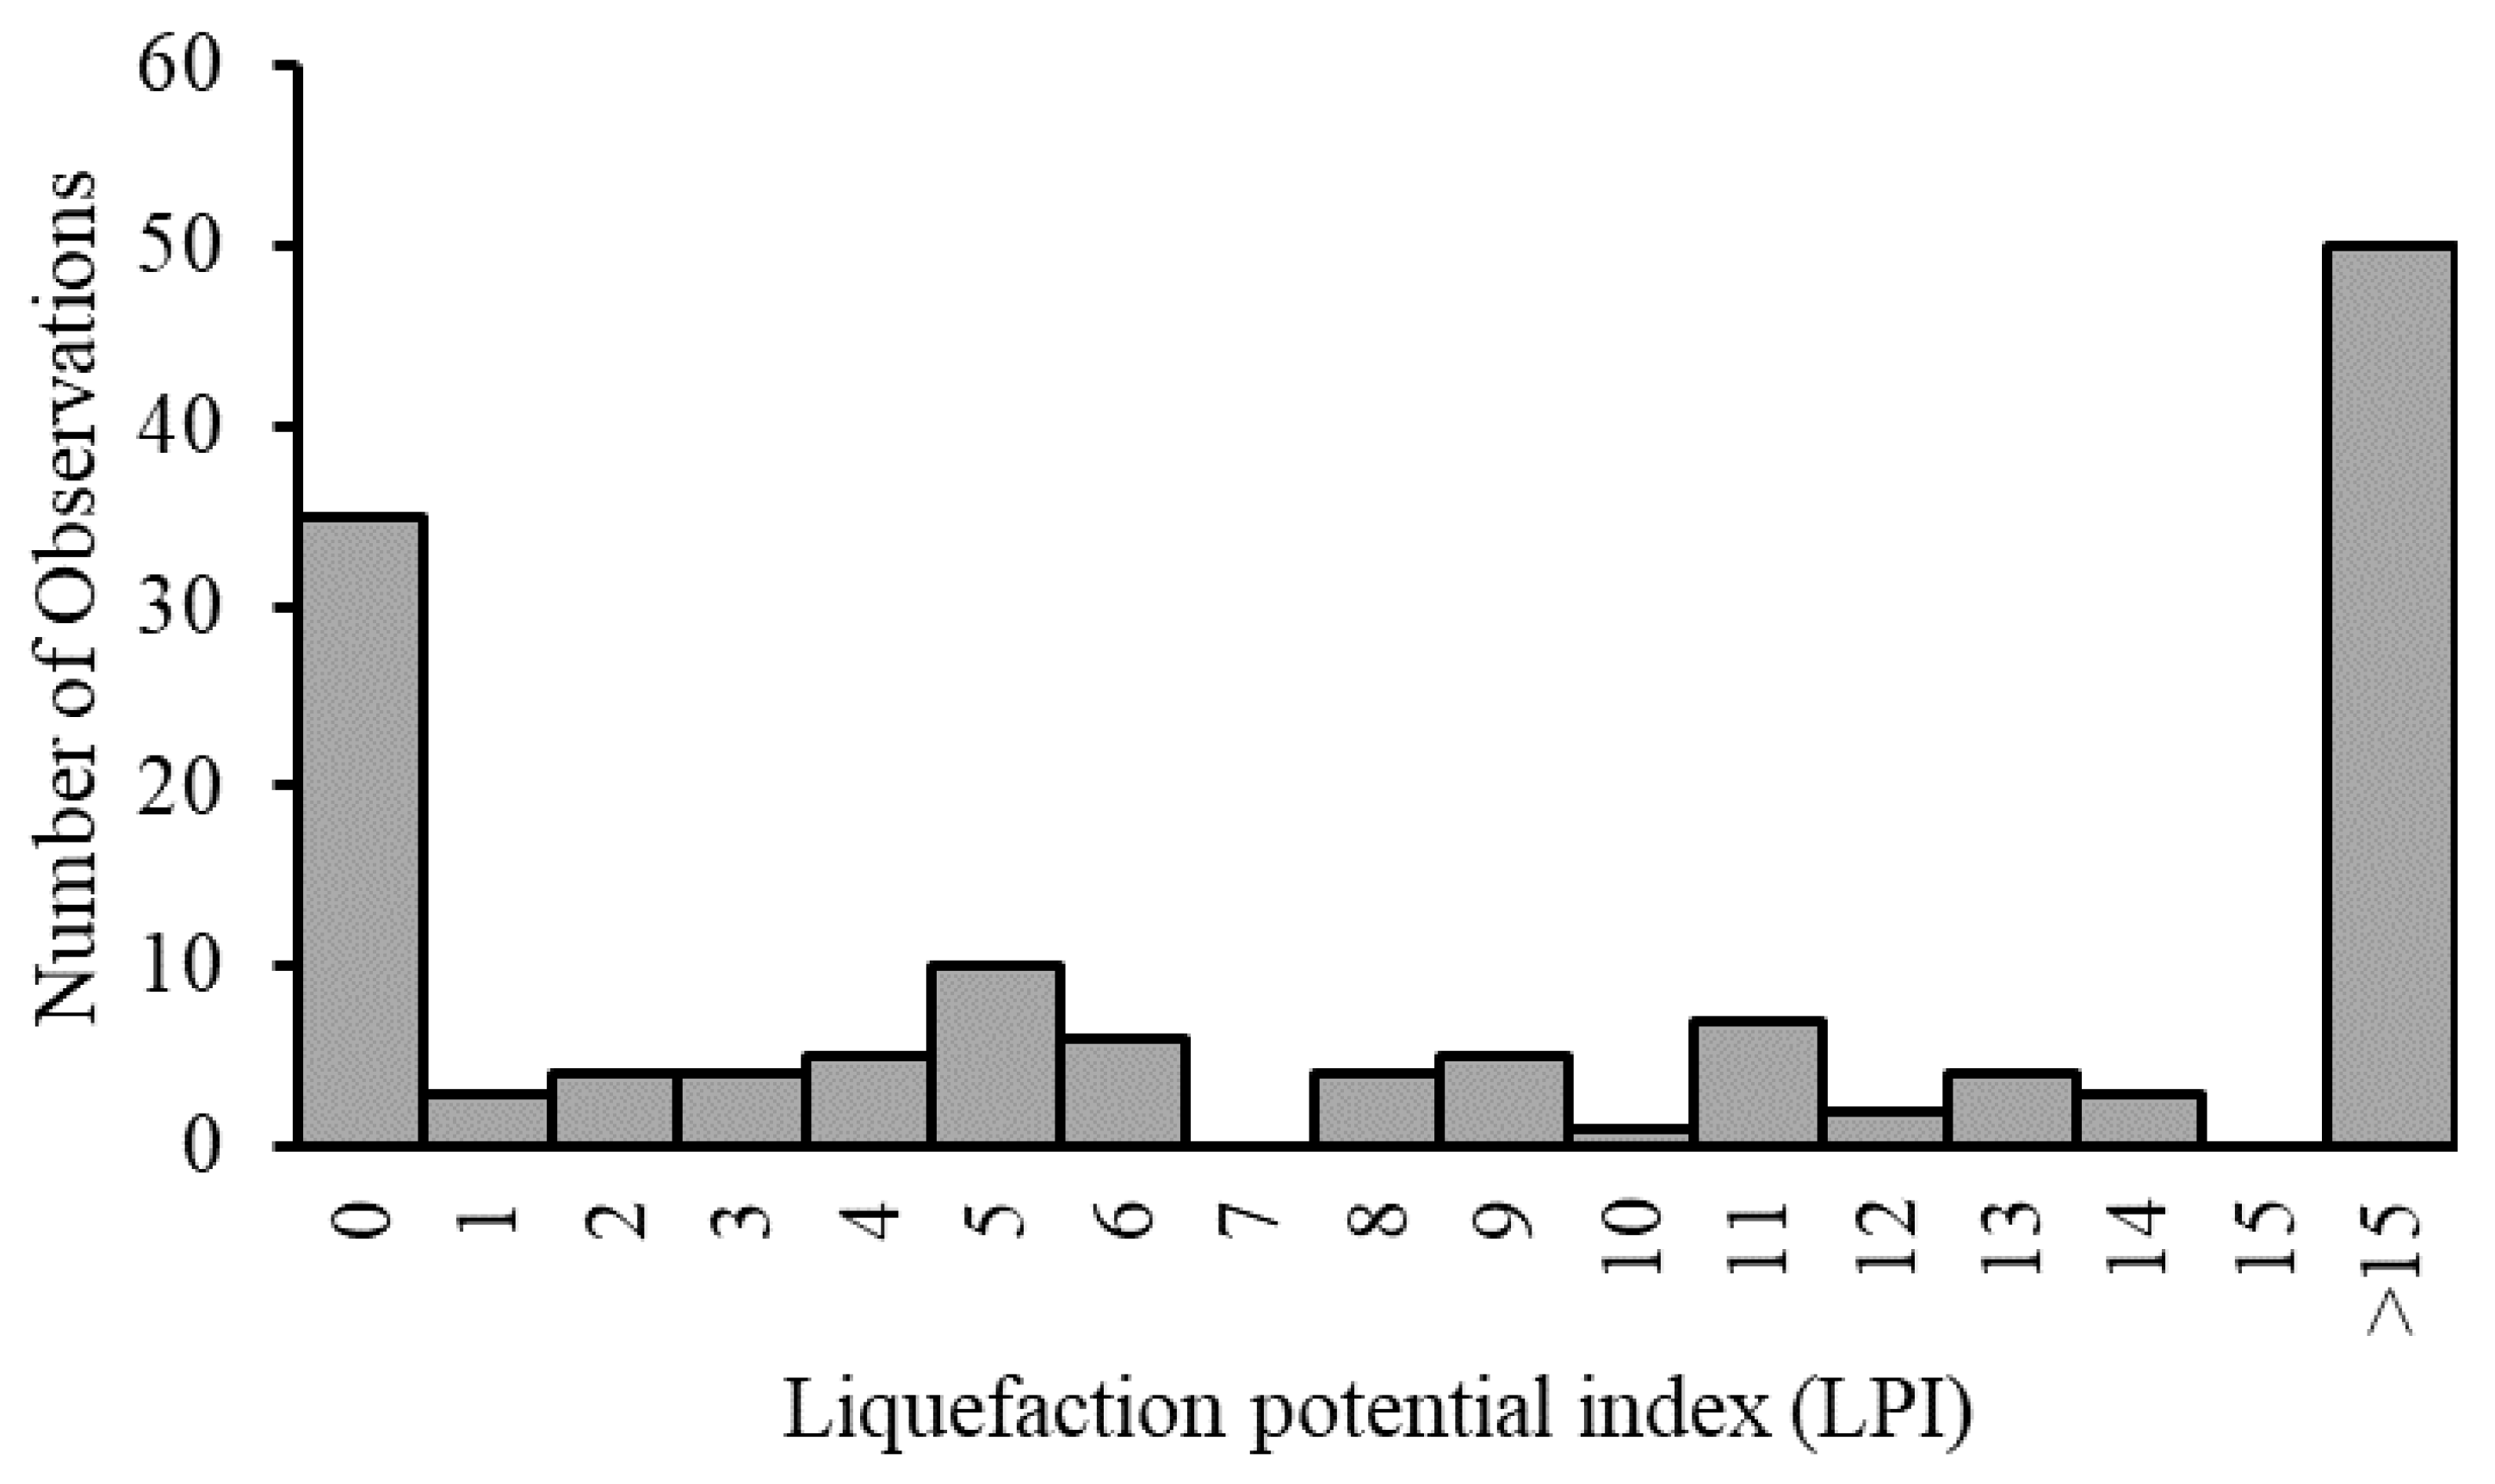
The occurrence of liquefaction vis a vis its severity was evaluated based on the classification proposed by Iwasaki et al. [59]. According to Iwasaki et al. [59], no evidence of liquefaction phenomena is expected where LPI is zero, while low and high liquefaction potential is expected where LPI values range between 0 and 5, and 5 and 15, respectively. Notably, a very high potential of liquefaction is expected when the LPI is greater than 15. Figure 9 shows the distribution of liquefaction susceptibility based on the LPI value at each borehole considered in this study. The LPI histogram shown in Figure 10 reveals that significant portions of the area in the valley are susceptible to liquefaction. The liquefaction hazard map based on LPI is shown in Figure 11, which reflects that about 60% of Kathmandu Valley is highly susceptible, while about 24% is not susceptible to an earthquake scenario of 8.0 Mw with PGA 0.30 g during the monsoon period (rainy season). Importantly, the increase in the thickness of soft soil deposits and shallow groundwater tables at the center of the valley was observed to be more susceptible to liquefaction, while low to very low potential of liquefaction was observed at the edges of the valley.
In addition, the effects of liquefaction on critical facilities, as discussed in Section 4, were thoroughly analyzed using the liquefaction susceptibility map (Figure 11). The critical facilities were overlaid in the map, and the corresponding number or area falling under each category of liquefaction susceptibility was found. As mentioned earlier, the liquefaction susceptibility of the site, where the critical infrastructures are located, were classified into four categories such as very low, low, high, and very high based on the LPI value. Moreover, the critical facilities that can be affected by liquefaction were quantified and have been discussed below.
6.1. Road Network
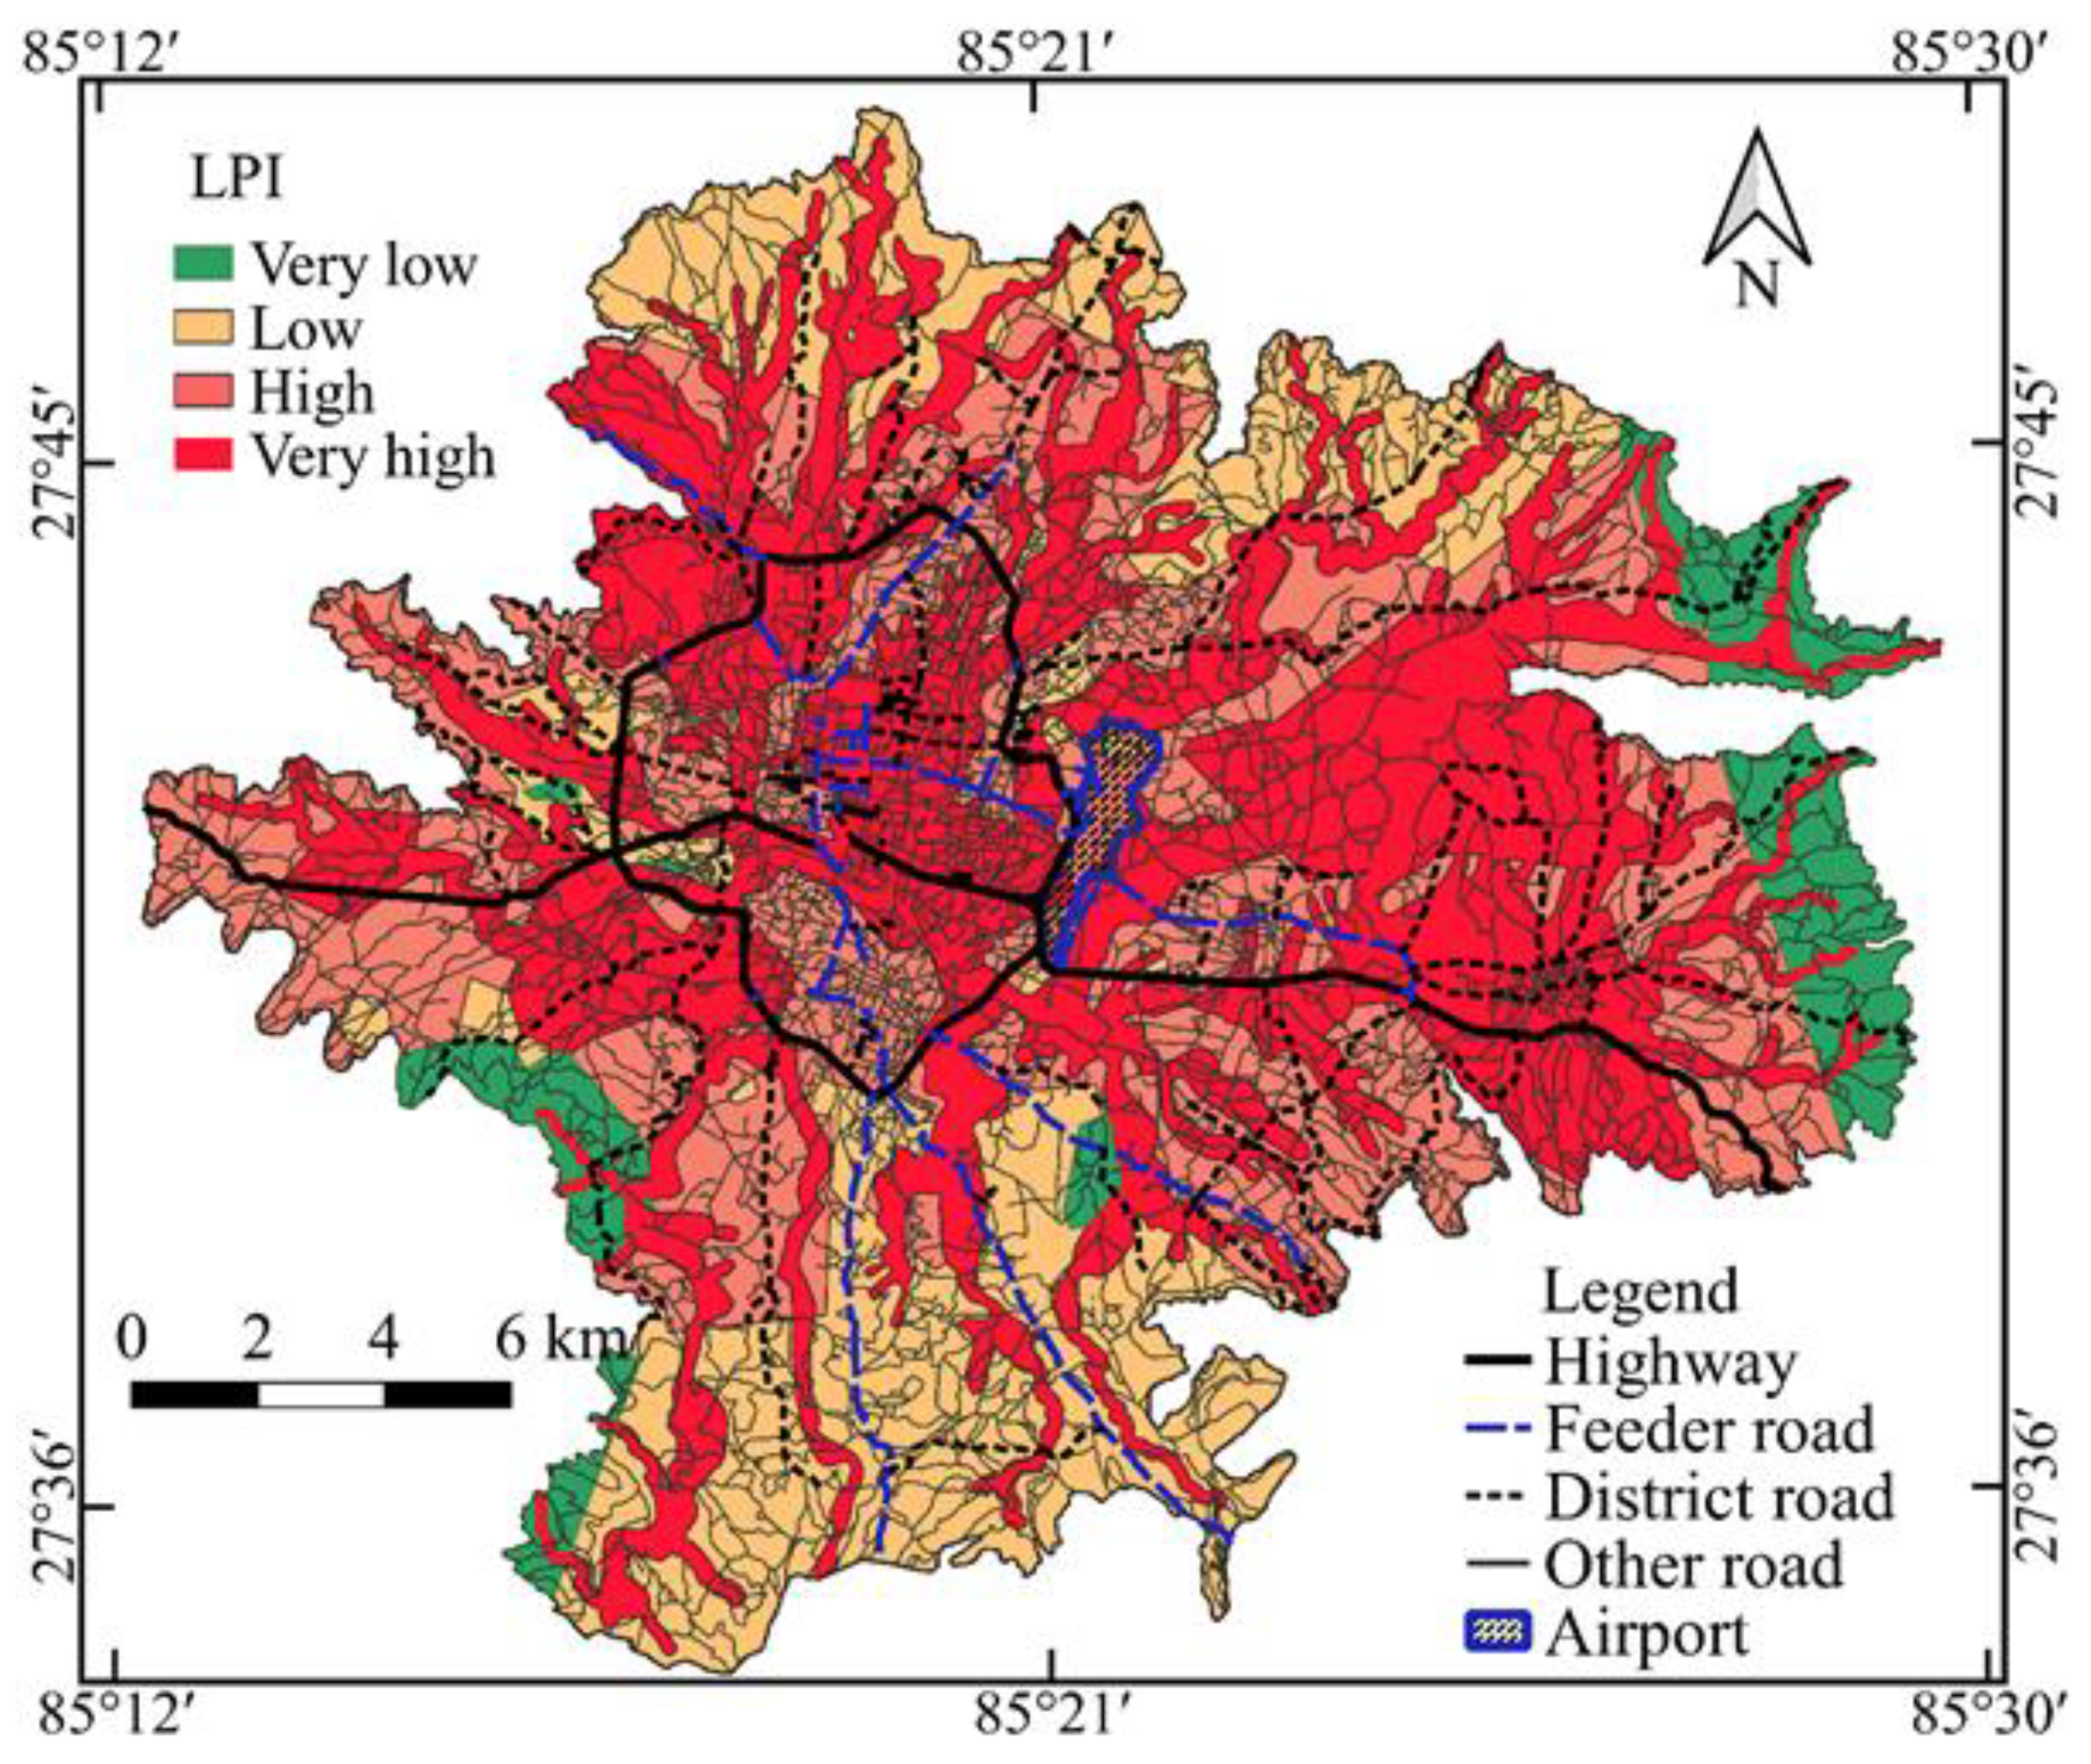
The spatial distribution of liquefaction along the road network was computed using GIS. The results obtained are shown in Figure 12 and Table 3. A total of 1974.1 km of the roads in the valley were analyzed. The total length of the highway within the study area was found to be 55.6 km, out of which only 0.2% of the highway was found to be in no liquefaction zone, while 61% was in a very high liquefaction susceptible zone. Out of the remaining length of highways, 32% was found in a highly susceptible zone, whereas 7% of the road network was in a low liquefaction zone. The second category of roads studied were feeder roads. Out of 58.1 km of feeder roads in the valley, 1%, 28%, 37%, and 34% of the feeder roads were found to be in very low, low, high, and very high liquefaction susceptibility zones, respectively. Similarly, about 43% of district roads and 41% of other roads were found to be in a very high liquefaction zones. Importantly, if we are to consider the total length of roads in the valley, 42% of the roads are estimated to be in very high liquefaction risk zones, whereas about 5% are in very low liquefaction zones.
Figure 12 shows that most of the roads in the study area were in high to very high liquefaction susceptible zones, thereby indicating that a larger road network is liable to be affected due to liquefaction during a major earthquake. It is notable that the central part of the valley has a higher liquefaction potential and the road network in the central region is also higher. It was also found that major road networks of the valley that have higher importance and major roles in rapid response during a disaster are also centrally located. This goes on to suggest that major roads in the valley in high to very high susceptible zones need to be specially strengthened to minimize liquefaction effects.
6.2. Airport
The liquefaction susceptibility of the Tribhuvan International Airport (TIA) located in the central part of the valley covering nearly a 3 sq. km area is shown in Figure 12. The percentage of the area falling under each category of liquefaction was estimated and is presented in Table 4.
It can be seen that out of the total area of TIA, no portion of the airport was in a very low liquefaction zone. Only a small portion (i.e., about 6%) of the airport area on the northern part was estimated to have a low liquefaction zone. On the other hand, 78% of the airport’s area is in the high liquefaction zone and 16% is in the very high susceptibility zone. This indicates that the risk of liquefaction during a major earthquake in and around the airport area is on the higher side; thus, a detailed soil investigation and countermeasures of soil liquefaction are needed for the proper functioning of the airport during a major earthquake.
6.3. Health Facility
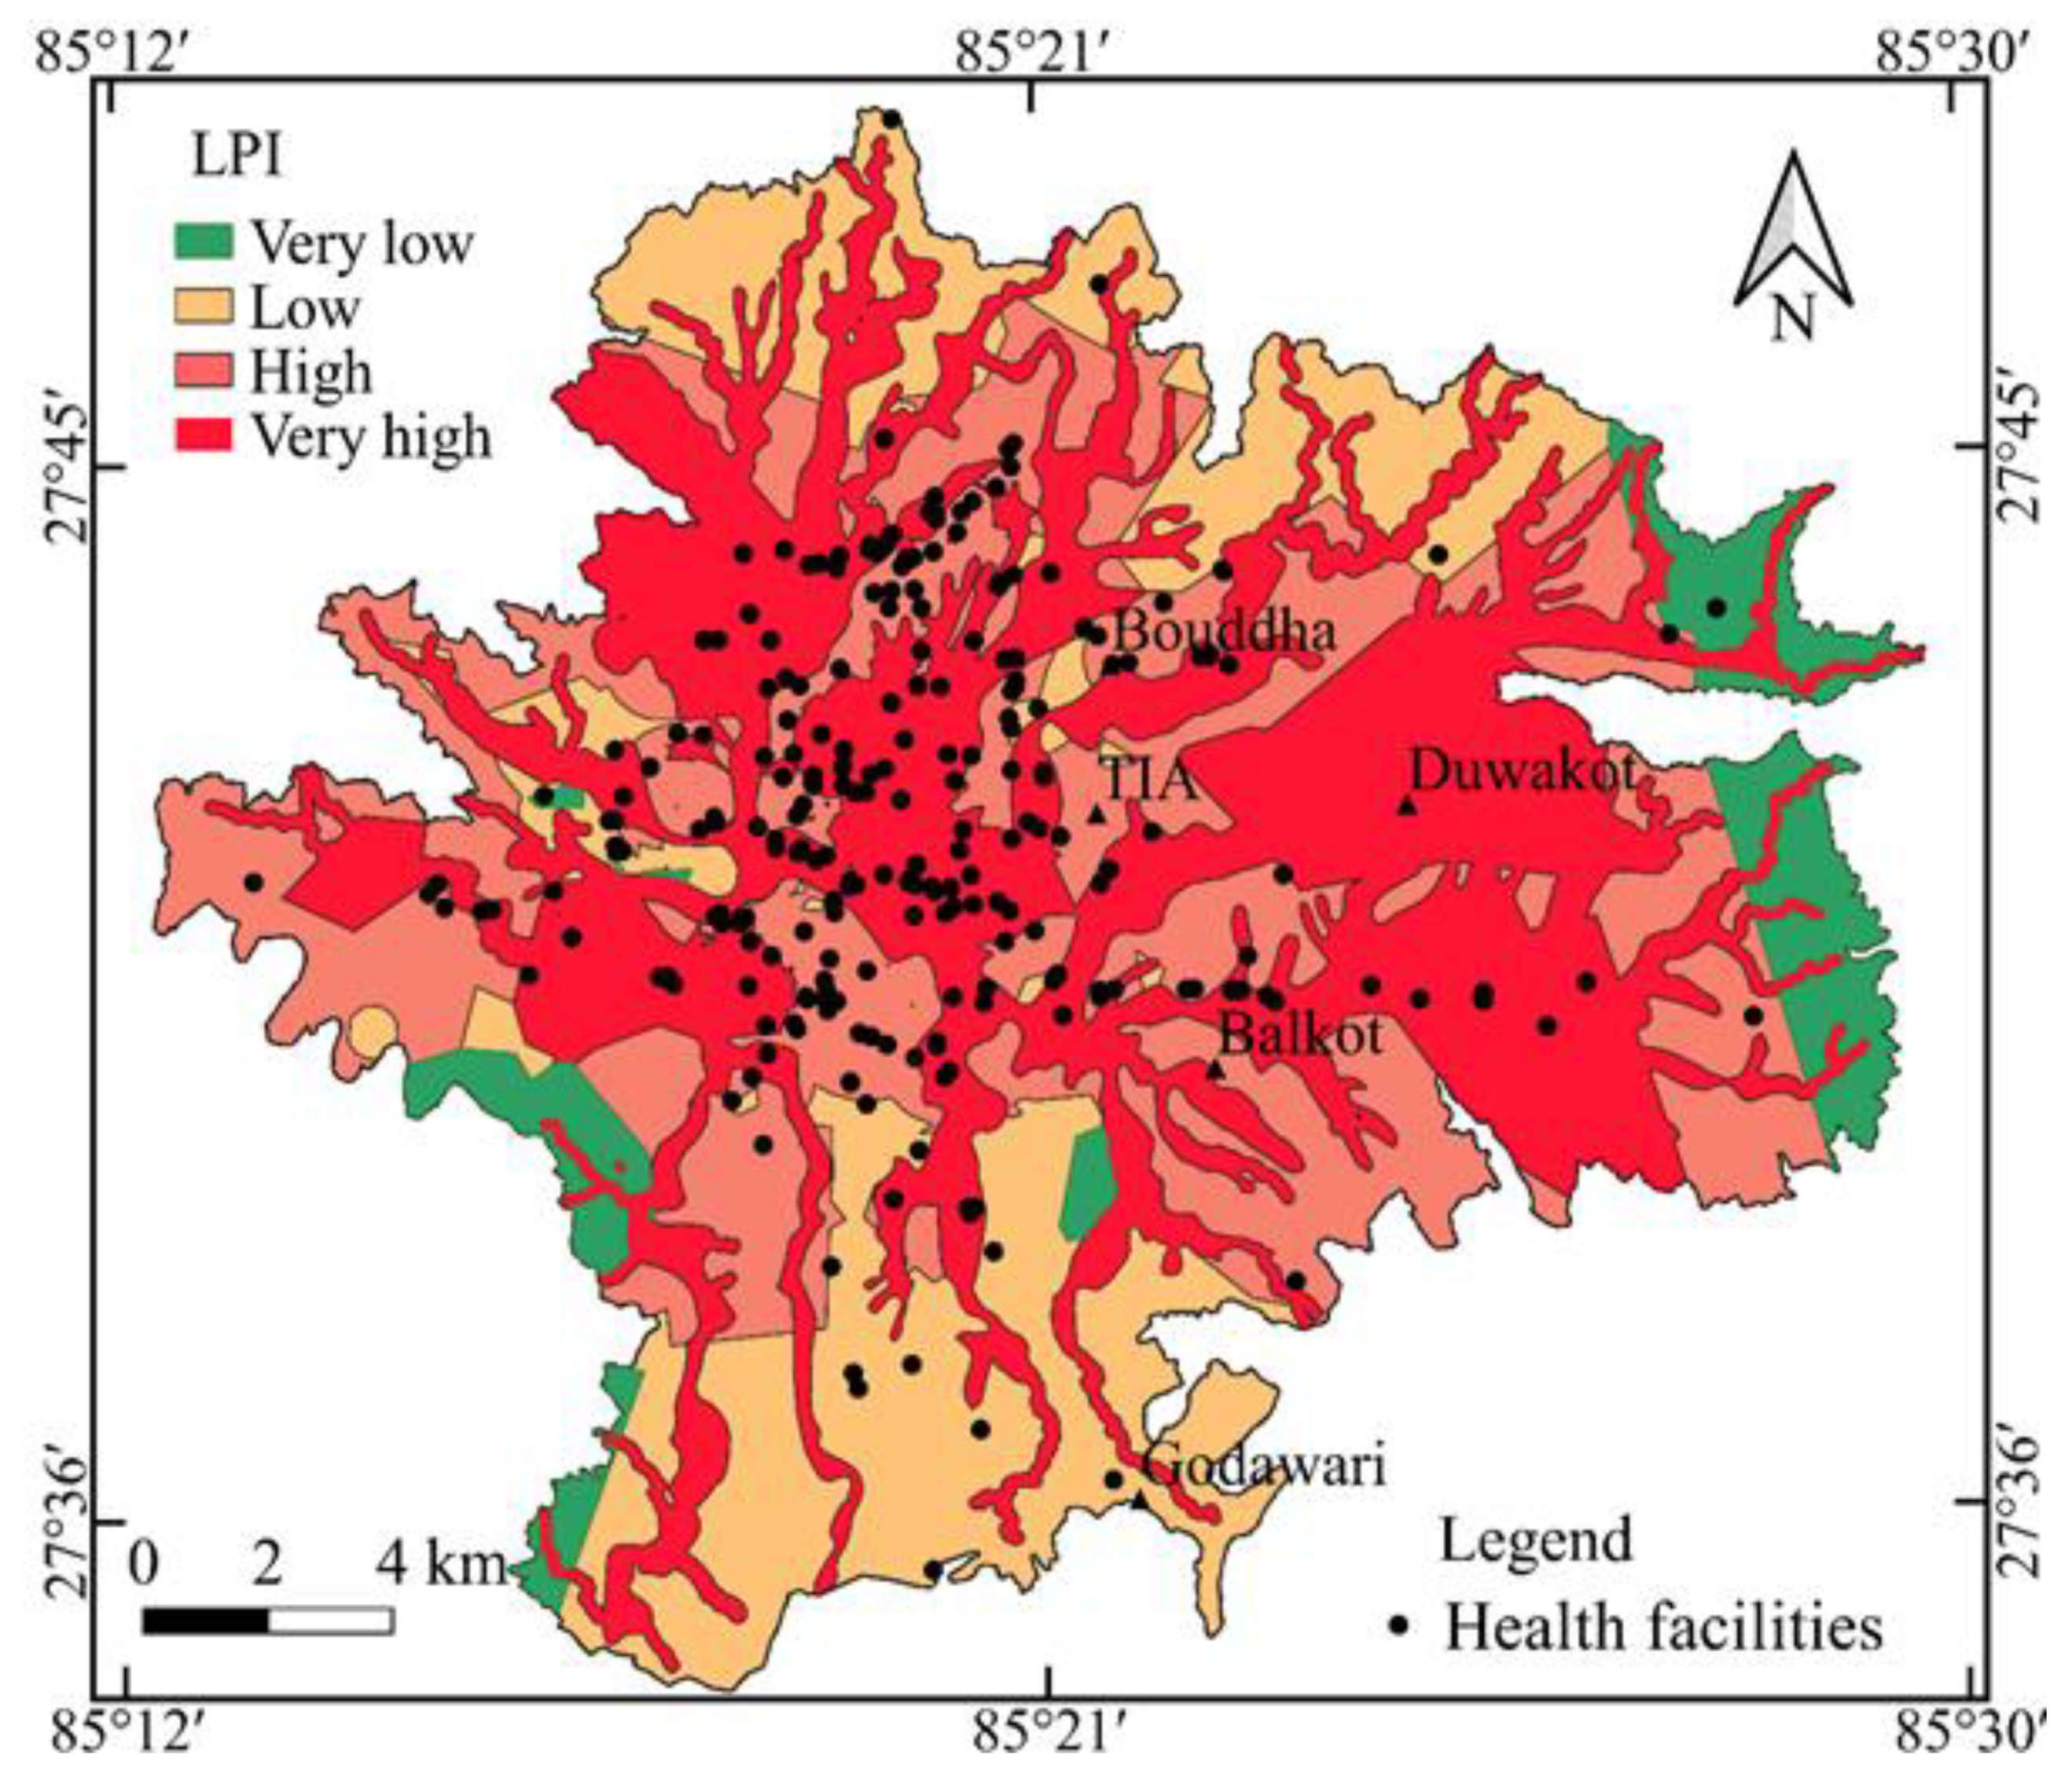
Major health facilities in the capital city such as hospitals, clinics, and health posts were mapped, and the possibility of liquefaction effects on these facilities was evaluated (Figure 13). Table 5 shows the number of health facilities falling in different categories of liquefaction susceptibility. Figure 13 indicates that a large number of health facilities are in the central part of the valley, where most of the buildup area lies. As discussed earlier, the liquefaction susceptibility in the central region of the valley is higher. The total percentage of health facilities in a very high liquefaction zone was observed to be 60%, while this was 32% in a high liquefaction zone. This indicates that more than 92% of health facilities have been in high to a very high zones of liquefaction susceptibility in the valley. Additionally, the health facilities in very low zones make up a mere 1%, while 7% are in low liquefaction zones. The higher percentage of health facilities in high to very high liquefaction zone highlights the importance of detailed soil investigations in these areas, which effectively should be followed by remedial and countermeasures against liquefaction.
6.4. School and College
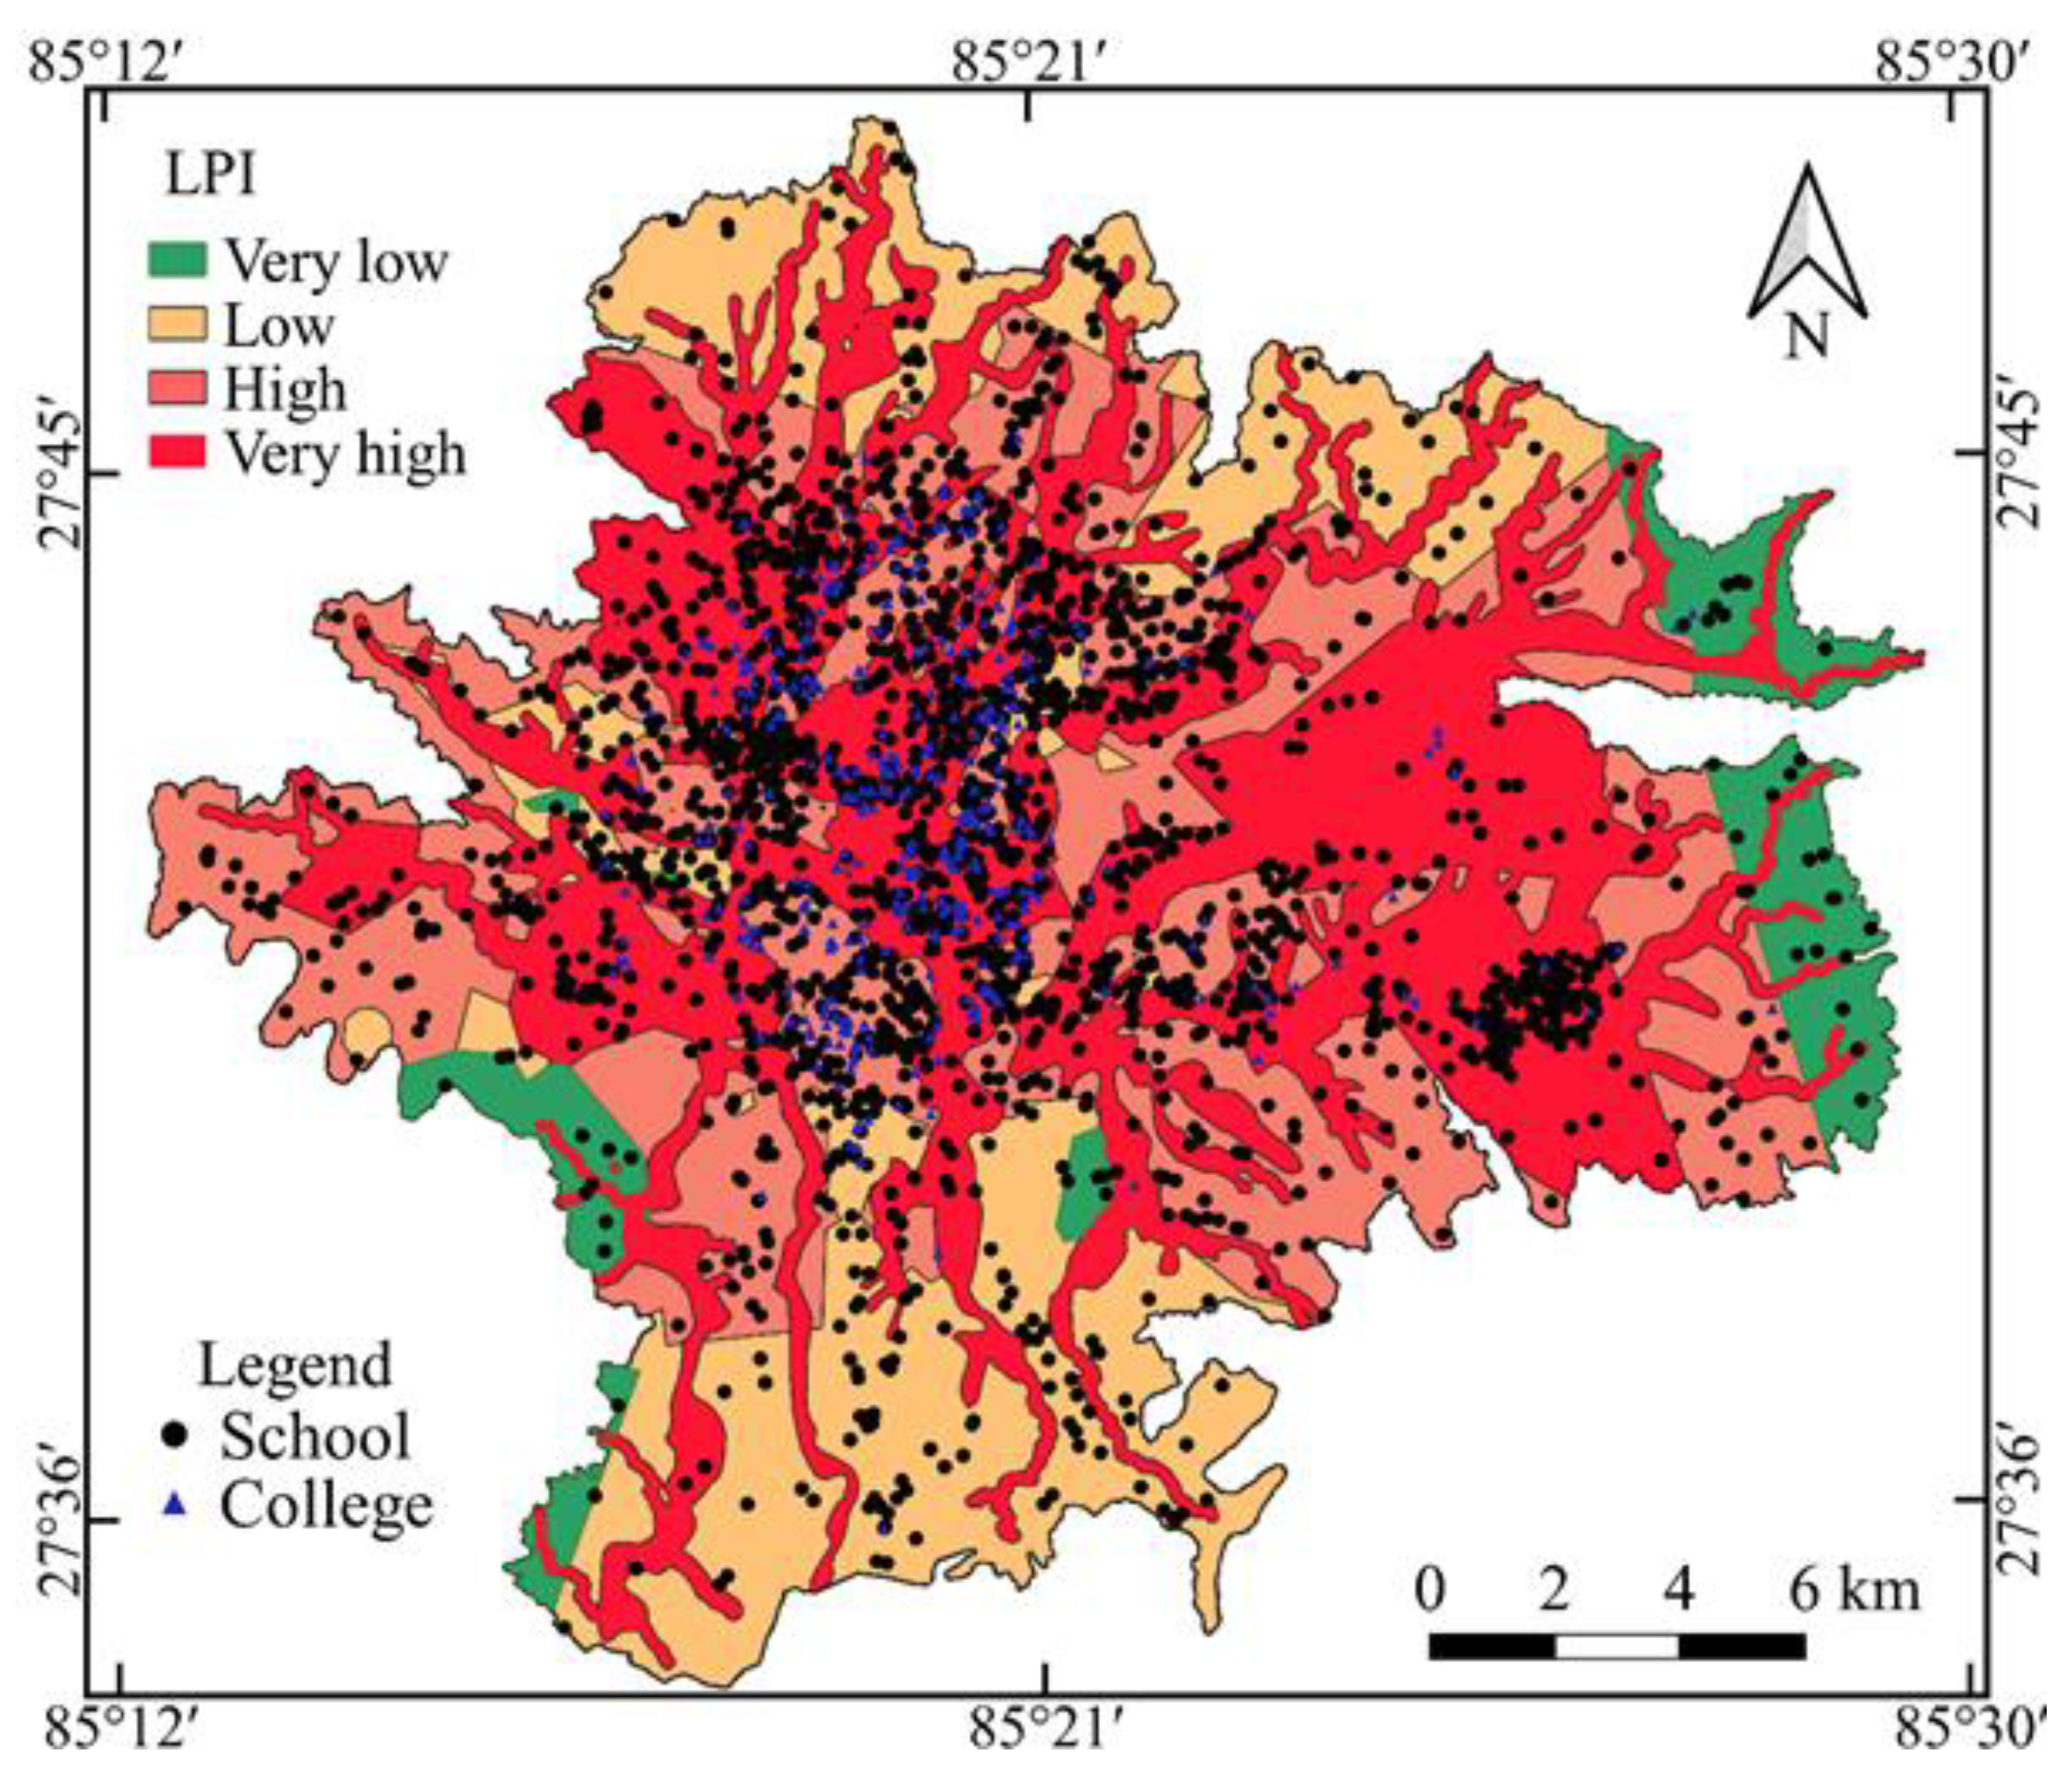
A total of 1973 schools and 404 colleges in the valley have been analyzed (Figure 14). The schools and colleges falling under a different category of liquefaction are presented in Table 6.
The plot of schools and colleges in the liquefaction susceptibility map indicates that schools and colleges in very high liquefaction susceptibility zoned were 54% and 64%, respectively. This might be attributed to a large number of schools and colleges in the central part of the valley, which is highly prone to liquefaction. The very low and low liquefaction zones are located along the edges of the valley where a smaller number of schools and colleges can be seen. Thus, only 2% of schools and 0.5% of colleges were effectively in very low liquefaction zones, while a higher percentage of schools and colleges were in high to very high liquefaction zones.
7. Conclusions and Recommendations
A liquefaction potential map of the subsurface geological materials of Kathmandu Valley was prepared for an earthquake scenario having a magnitude of 8.0 Mw with 0.30 g PGA. The category of very high and high susceptibility for liquefaction was observed at the central part of the valley, while low to very low potential of liquefaction was observed at the edge of the valley. The effects of liquefaction on critical facilities of the valley have been evaluated using the liquefaction potential map. The critical facilities chosen to evaluate seismic soil liquefaction effects included the road network, airport, health facilities, schools and colleges. For an earthquake of 8.0 Mw, PGA 0.30 g and groundwater conditions for the monsoon period, it was seen that 60% of the hospitals and about 64% of colleges in the valley are in very high-risk zones of liquefaction. Similarly, 54% of the schools and 42% of the road network in the valley are in a very high liquefaction zone, while 78% of the airport area is in the high-risk zone of liquefaction occurrence. This goes on to show that the percentage of critical facilities falling in the very high-risk zone of liquefaction is certainly on the higher side. Importantly, the central part of the valley, which has a high chance of liquefaction occurrence, also has a higher percentage of critical facilities, which highlights the possibility of greater liquefaction effects in that region.
The existing critical infrastructures such as hospitals, schools, colleges, airport, and road facilities located on weak subsoils that may liquefy under moderate shaking should be retrofitted to meet the requirement of maintaining their functions after earthquakes. In addition to, the facilities used in this study, other critical services such as emergency response services, telecommunication services, financial institutions, and major industrial/commercial facilities located in very high-risk zones of liquefaction should also be relocated or retrofitted. The development of all these facilities should be carried out considering appropriate land use guided by the liquefaction risks to mitigate potential loss and proper functioning after earthquakes. This study can help in urban planning, preliminary studies, feasibility studies, and land-use policies. This research also assists the government authority and the geotechnical engineers beforehand to plan the comprehensive seismic microzonation based on the provided liquefaction map. The results from this study can be used only for preliminary studies and desk study. A more detailed site-specific study is recommended before developing any critical infrastructures in Kathmandu Valley.
Author Contributions
Conceptualization, P.A. and K.S.; methodology, P.A. and K.S.; software, P.A.; validation, P.A., K.S. and I.P.A.; formal analysis, P.A.; resources, P.A. and K.S.; data curation, P.A.; writing—original draft preparation, P.A.; writing—review and editing, P.A., K.S. and I.P.A.; supervision, K.S. and I.P.A. All authors have read and agreed to the published version of the manuscript.
Funding
This research received no external funding.
Institutional Review Board Statement
Not applicable.
Informed Consent Statement
Not applicable.
Data Availability Statement
Borehole log data and test results were collected from different geotechnical laboratories working in the Kathmandu valley. These data are available on request. Data used to present critical facilities were extracted to QGIS from OSM (Open Street Map); additional data as required were collected from the Department of Survey, Nepal. Some data were digitized by the authors using topographical sheets and google earth imagery. These digitized data are also available on request.
Conflicts of Interest
The authors declare no conflict of interest.
References
- Bilham, R.; Bodin, P.; Jackson, M. Entertaining a great earthquake in western Nepal: Historic inactivity and geodetic tests for the present state of strain. J. Nep. Geol. Soc. 1995, 11, 73–78. [Google Scholar]
- Nepal National Building Code (NBC 105), Seismic Design of Buildings in Nepal; Ministry of Physical Planning and Works: Kathmandu, Nepal, 1994.
- Rana, B.S.J.B. Nepal Ko Maha Bhukampa (Great Earthquake of Nepal), 2nd ed.; Jorganesh Press: Kathmandu, Nepal, 1935. [Google Scholar]
- Hashash, Y.; Tiwari, B.; Moss, R.E.; Asimaki, D.; Clahan, K.B.; Kieffer, D.S.; Dreger, D.S.; Macdonald, A.; Madugo, C.M.; Mason, H.B. Geotechnical Field Reconnaissance: Gorkha (Nepal) Earthquake of 25 April 2015 and Related Shaking Sequence. Geotechnical Extreme Events Reconnaissance (GEER) Association Report No. GEER-040. 2015. Available online: http://www.geerassociation.org/index.php/component/geer_reports/?view=geerreports&layout=build&id=26 (accessed on 3 March 2018).
- Okamura, M.; Bhandary, N.P.; Mori, S.; Marasini, N.; Hazarika, H. Report on a reconnaissance survey of damage in Kathmandu caused by the 2015 Gorkha Nepal earthquake. Soils Found. 2015, 55, 1015–1029. [Google Scholar] [CrossRef] [Green Version]
- Subedi, M.; Sharma, K.; Acharya, I.P.; Adhikari, K. Liquefaction of Soil in Kathmandu Valley from the 2015 Gorkha, Nepal, Earthquake. Nepal Eng. Assoc. Tech. J. Spec. Issue Gorkha Earthq. 2015, 2015, 108–115. [Google Scholar]
- Gautam, D.; De Magistris, F.S.; Fabbrocino, G. Soil liquefaction in Kathmandu valley due to 25 April 2015 Gorkha, Nepal earthquake. Soil Dyn. Earthq. Eng. 2017, 97, 37–47. [Google Scholar] [CrossRef]
- Sharma, K.; Subedi, M.; Parajuli, R.R.; Pokharel, B. Effects of surface geology and topography on the damage severity during the 2015 Nepal Gorkha earthquake. Lowl. Technol. Int. 2017, 18, 269–282. [Google Scholar]
- Sharma, K.; Deng, L. Reconnaissance Report on Geotechnical Engineering Aspect of the 2015 Gorkha, Nepal, Earthquake. J. Earthq. Eng. 2019, 23, 512–537. [Google Scholar] [CrossRef]
- Chiaro, G.; Kiyota, T.; Pokhrel, R.M.; Goda, K.; Katagiri, T.; Sharma, K. Reconnaissance report on geotechnical and structural damage caused by the 2015 Gorkha Earthquake, Nepal. Soils Found. 2015, 55, 1030–1043. [Google Scholar] [CrossRef] [Green Version]
- Egoda, K.; Ekiyota, T.; Epokhrel, R.M.; Chiaro, G.; Ekatagiri, T.; Esharma, K.; Ewilkinson, S. The 2015 Gorkha Nepal Earthquake: Insights from Earthquake Damage Survey. Front. Built Environ. 2015, 1. [Google Scholar] [CrossRef]
- Sharma, K.; Deng, L.; Noguez, C.C. Field investigation on the performance of building structures during the April 25, 2015, Gorkha earthquake in Nepal. Eng. Struct. 2016, 121, 61–74. [Google Scholar] [CrossRef]
- Japan International Cooperation Agency (JICA). The Study of Earthquake Disaster Mitigation in the Kathmandu Valley, Kingdom of Nepal; Final Report, I–IV; JICA: Tokyo, Japan, 2002.
- Shrestha, S.; Semkuyu, D.J.; Pandey, V.P. Assessment of groundwater vulnerability and risk to pollution in Kathmandu Valley, Nepal. Sci. Total. Environ. 2016, 556, 23–35. [Google Scholar] [CrossRef]
- Lamichhane, S.; Shakya, N.M. Shallow aquifer groundwater dynamics due to land use/cover change in highly urbanized basin: The case of Kathmandu Valley. J. Hydrol. Reg. Stud. 2020, 30, 100707. [Google Scholar] [CrossRef]
- Prajapati, R.; Upadhyay, S.; Talchabhadel, R.; Thapa, B.R.; Ertis, B.; Silwal, P.; Davids, J.C. Investigating the nexus of groundwater levels, rainfall and land-use in the Kathmandu Valley, Nepal. Groundw. Sustain. Dev. 2021, 14, 100584. [Google Scholar] [CrossRef]
- Orense, R.P.; Hickman, N.A.; Hill, B.T.; Pender, M.J. Spatial evaluation of liquefaction potential in Christchurch following the 2010/2011 Canterbury earthquakes. Int. J. Geotech. Eng. 2014, 8, 420–425. [Google Scholar] [CrossRef]
- Jradi, L.; Dupla, J.-C.; El Dine, B.S.; Canou, J. Effect of fine particles on cyclic liquefaction resistance of sands. Int. J. Geotech. Eng. 2020, 14, 860–875. [Google Scholar] [CrossRef]
- Japan National Committee on Earthquake Engineering (JNC). Niigata Earthquake of 1964. In Proceedings of the Third World Conference on Earthquake Engineering 1965, Auckland and Wellington, New Zealand, 22 January–1 February 1965; Volume 3, pp. 78–109. [Google Scholar]
- Shengcong, F.; Tatsuoka, F. Soil Liquefaction during Haicheng and Tangshan Earthquake in China; a Review. Soils Found. 1984, 24, 11–29. [Google Scholar] [CrossRef] [Green Version]
- Adalier, K.; Aydingun, O. Liquefaction during the June 27, 1998 Adana-Ceyhan (Turkey) Earthquake. Geotech. Geol. Eng. 2000, 18, 155–174. [Google Scholar] [CrossRef]
- Rajendran, C.P.; Sanwal, J.; John, B.; Anandasabari, K.; Rajendran, K.; Kumar, P.; Jaiswal, M.; Chopra, S. Footprints of an elusive mid-14th century earthquake in the central Himalaya: Consilience of evidence from Nepal and India. Geol. J. 2019, 54, 2829–2846. [Google Scholar] [CrossRef]
- Ayothiraman, R.; Kanth, S.T.G.R.; Sreelatha, S. Evaluation of liquefaction potential of Guwahati: Gateway city to Northeastern India. Nat. Hazards 2012, 63, 449–460. [Google Scholar] [CrossRef]
- Bhattacharya, S.; Hyodo, M.; Goda, K.; Tazoh, T.; Taylor, C. Liquefaction of soil in the Tokyo Bay area from the 2011 Tohoku (Japan) earthquake. Soil Dyn. Earthq. Eng. 2011, 31, 1618–1628. [Google Scholar] [CrossRef]
- Ishihara, K.; Araki, K.; Bradley, B. Characteristics of Liquefaction-Induced Damage in the 2011 Great East Japan Earthquake. In Proceedings of the International Conference on Geotechnics for Sustainable Development (Geotec), Hanoi, Vietnam, 6–7 October 2011. [Google Scholar]
- Yasuda, S.; Towhata, I.; Ishii, I.; Sato, S.; Uchimura, T. Liquefaction-induced damage to structures during the 2011 great east japan earthquake. J. JSCE 2013, 1, 181–193. [Google Scholar] [CrossRef] [Green Version]
- Cubrinovski, M.; Bray, J.D.; Taylor, M.; Giorgini, S.; Bradley, B.; Wotherspoon, L.; Zupan, J. Soil Liquefaction Effects in the Central Business District during the February 2011 Christchurch Earthquake. Seism. Res. Lett. 2011, 82, 893–904. [Google Scholar] [CrossRef]
- Sassa, S.; Takagawa, T. Liquefied gravity flow-induced tsunami: First evidence and comparison from the 2018 Indonesia Sulawesi earthquake and tsunami disasters. Landslides 2018, 16, 195–200. [Google Scholar] [CrossRef] [Green Version]
- Toprak, S.; Holzer, T.L. Liquefaction Potential Index: Field Assessment. J. Geotech. Geoenviron. Eng. 2003, 129, 315–322. [Google Scholar] [CrossRef]
- Sonmez, H. Modification of the liquefaction potential index and liquefaction susceptibility mapping for a liquefaction-prone area (Inegol, Turkey). Environ. Earth Sci. 2003, 44, 862–871. [Google Scholar] [CrossRef]
- Tang, A.; Kwasinski, A.; Eidinger, J.; Foster, C.; Anderson, P. Telecommunication Systems’ Performance: Christchurch Earthquakes. Earthq. Spectra 2014, 30, 231–252. [Google Scholar] [CrossRef]
- Mian, J.; Kontoe, S.; Free, M. Assessing and managing the risk of earthquake-induced liquefaction to civil infrastructure. In Handbook of Seismic Risk Analysis and Management of Civil Infrastructure Systems; Woodhead Publishing: Sawston, UK, 2013; pp. 113–138. [Google Scholar] [CrossRef]
- Maurer, B.; Green, R.; Cubrinovski, M.; Bradley, B. Fines-content effects on liquefaction hazard evaluation for infrastructure in Christchurch, New Zealand. Soil Dyn. Earthq. Eng. 2015, 76, 58–68. [Google Scholar] [CrossRef]
- Meslem, A.; Iversen, H.; Iranpour, K.; Lang, D. A computational platform to assess liquefaction-induced loss at critical infrastructures scale. Bull. Earthq. Eng. 2021, 1–32. [Google Scholar] [CrossRef]
- Phule, R.R.; Choudhury, D. Assessing and Mapping Seismic Liquefaction Hazard, Vulnerability, and Risk of the Transportation Infrastructure of Mumbai City, India. In Geotechnical Earthquake Engineering and Soil Dynamics V: Seismic Hazard Analysis, Earthquake Ground Motions, and Regional-Scale Assessment; Geotechnical Special Publication No. GSP 291; ASCE: Austin, TX, USA, 2018; pp. 658–666. [Google Scholar] [CrossRef]
- D’Apuzzo, M.; Evangelisti, A.; Modoni, G.; Spacagna, R.-L.; Paolella, L.; Santilli, D.; Nicolosi, V. Simplified Approach for Liquefaction Risk Assessment of Transportation Systems: Preliminary Outcomes. In Proceedings of the International Conference on Computational Science and Its Applications, Cagliari, Italy, 1–4 July 2020; pp. 130–145. [Google Scholar] [CrossRef]
- Paolella, L.; Spacagna, R.L.; Chiaro, G.; Modoni, G. A simplified vulnerability model for the extensive liquefaction risk assessment of buildings. Bull. Earthq. Eng. 2020, 1–29. [Google Scholar] [CrossRef]
- Mosavat, N.; Oh, D.E.; Chai, D.G. Liquefaction Risk Potential of Road Foundation in the Gold Coast Region, Australia. Electron. J. Geotech. Eng. 2013, 14, 1493–1504. [Google Scholar]
- Coelho, P.; Costa, A. Identification and characterization of liquefaction risks for highspeed railways in Portugal. In Geotechnical Safety and Risk, Proceedings of the 2nd International Symposium on Geotechnical Safety and Risk, Gifu, Japan, 11–12 June 2009; Honjo, Y., Hara, T., Suzuki, M., Zhang, F., Eds.; CRC Press-Taylor and Francis Group: Gifu, Japan, 2009. [Google Scholar]
- Van Ballegooy, S.; Malan, P.; Lacrosse, V.; Jacka, M.E.; Cubrinovski, M.; Bray, J.D.; O’Rourke, T.D.; Crawford, S.A.; Cowan, H. Assessment of Liquefaction-Induced Land Damage for Residential Christchurch. Earthq. Spectra 2014, 30, 31–55. [Google Scholar] [CrossRef]
- Sakai, H. Stratigraphic division and sedimentary facies of the Kathmandu Basin sediments. J. Nep. Geol. Soc. 2001, 25, 19–32. [Google Scholar]
- Subedi, M.; Sharma, K.; Upadhayay, B.; Poudel, R.K.; Khadka, P. Soil liquefaction potential in Kathmandu Valley. Int. J. Lsld. Environ. 2013, 1, 91–92. [Google Scholar]
- Sajan, K.C.; Bhochhibhoya, S.; Adhikari, P.; Adhikari, P.; Gautam, D. Probabilistic seismic liquefaction hazard assessment of Kathmandu valley, Nepal. Geomat. Nat. Hazards Risk 2020, 11, 259–271. [Google Scholar] [CrossRef] [Green Version]
- Sapkota, S.N.; Bollinger, L.; Klinger, Y.; Tapponnier, P.; Gaudemer, Y.; Tiwari, D.R. Primary surface ruptures of the great Himalayan earthquakes in 1934 and 1255. Nat. Geosci. 2013, 6, 71–76. [Google Scholar] [CrossRef]
- Chitrakar, G.R.; Pandey, M.R. Historical earthquakes of Nepal. Bull. Geol. Soc. Nepal 1986, 4, 7–8. [Google Scholar]
- Bilham, R.; Gaur, V.K.; Molnar, P. Himalayan seismic hazard. Science 2001, 293, 1442–1444. [Google Scholar] [CrossRef] [Green Version]
- Ram, T.D.; Wang, G. Probabilistic seismic hazard analysis in Nepal. Earthq. Eng. Eng. Vib. 2013, 12, 577–586. [Google Scholar] [CrossRef]
- Sharma, K.; Deng, L.; Khadka, D. Reconnaissance of liquefaction case studies in 2015 Gorkha (Nepal) earthquake and assessment of liquefaction susceptibility. Int. J. Geotech. Eng. 2019, 13, 326–338. [Google Scholar] [CrossRef]
- Nepal Road Standard (NRS); Ministry of Physical Infrastructure and Transport, Department of Roads: Kathmandu, Nepal, 2013.
- Idriss, I.M.; Boulanger, R.W. Soil Liquefaction during Earthquakes; Earthquake Engineering Research Institute: Oakland, CA, USA, 2008. [Google Scholar]
- Seed, H.B.; Tokimatsu, K.; Harder, L.F.; Chung, R.M. Influence of SPT Procedures in Soil Liquefaction Resistance Evaluations. J. Geotech. Eng. 1985, 111, 1425–1445. [Google Scholar] [CrossRef]
- Robertson, P.K.; Fear, C.E. Cyclic liquefaction and its evaluation based on the SPT and CPT. In Proceedings of the NCEER Workshop on Evaluation of Liquefaction Resistance of Soils, Salt Lake City, UT, USA, 31 December 1997; pp. 41–87. [Google Scholar]
- Cetin, K.O.; Seed, R.B.; Der Kiureghian, A.; Tokimatsu, K.; Harder, L.F.; Kayen, R.E.; Moss, R.E.S. Standard Penetration Test-Based Probabilistic and Deterministic Assessment of Seismic Soil Liquefaction Potential. J. Geotech. Geoenviron. Eng. 2004, 130, 1314–1340. [Google Scholar] [CrossRef] [Green Version]
- Moss, R.E.; Seed, R.B.; Kayen, R.E.; Stewart, J.P.; Der Kiureghian, A.; Cetin, K.O. CPT-Based Probabilistic and Deterministic Assessment of In Situ Seismic Soil Liquefaction Potential. J. Geotech. Geoenviron. Eng. 2006, 132, 1032–1051. [Google Scholar] [CrossRef] [Green Version]
- Kayen, R.E.; Moss, R.E.S.; Thompson, E.; Seed, R.B.; Cetin, K.O.; Der Kiureghian, A.; Tanaka, Y.; Tokimatsu, K. Shear-Wave Velocity–Based Probabilistic and Deterministic Assessment of Seismic Soil Liquefaction Potential. J. Geotech. Geoenviron. Eng. 2013, 139, 407–419. [Google Scholar] [CrossRef] [Green Version]
- Cetin, K.O.; Seed, R.B.; Kayen, R.E.; Moss, R.E.; Bilge, H.T.; Ilgac, M.; Chowdhury, K. SPT-based probabilistic and deterministic assessment of seismic soil liquefaction triggering hazard. Soil Dyn. Earthq. Eng. 2018, 115, 698–709. [Google Scholar] [CrossRef]
- Cetin, K.O.; Seed, R.B.; Kayen, R.E.; Moss, R.E.; Bilge, H.T.; Ilgac, M.; Chowdhury, K. Examination of differences between three SPT-based seismic soil liquefaction triggering relationships. Soil Dyn. Earthq. Eng. 2018, 113, 75–86. [Google Scholar] [CrossRef]
- Cetin, K.O.; Bilge, H.T.; Wu, J.; Kammerer, A.M.; Seed, R.B. Probabilistic Model for the Assessment of Cyclically Induced Reconsolidation (Volumetric) Settlements. J. Geotech. Geoenviron. Eng. 2009, 135, 387–398. [Google Scholar] [CrossRef]
- Iwasaki, T.; Tokida, K.I.; Tatsuoka, F.; Watanabe, S.; Yasuda, S.; Sato, H. Microzonation for soil liquefaction potential using simplified methods. In Proceedings of the 3rd International Conference on Microzonation, Seattle, WA, USA, 28 June–1 July 1982; Volume 3, pp. 1310–1330. [Google Scholar]
Figure 1.
Liquefaction and ground fissures in the (a) Tundhikhel and (b) Nayabazar areas during the 1934 Nepal–Bihar earthquake (Adapted from ref. [3]).
Figure 1.
Liquefaction and ground fissures in the (a) Tundhikhel and (b) Nayabazar areas during the 1934 Nepal–Bihar earthquake (Adapted from ref. [3]).

Figure 2.
Ground liquefaction, settlement, and ground fissures: (a) road settlement at Lokanthali, Bhaktpur; (b) lateral spreading of road embankment, Lalitpur; (c) liquefaction in Bungamati, Lalitpur; (d) liquefaction-induced fissures in Mulpani, and (e) tilted building due to adjacent ground settlement during the 2015 Gorkha, Nepal, earthquake.

Figure 4.
Boreholes considered in the study.

Figure 5.
Road network and airport in Kathmandu Valley.

Figure 6.
Health facilities in Kathmandu Valley.

Figure 7.
Schools and colleges in Kathmandu Valley.

Figure 8.
Typical soil profile, SPT-N value, and FS with depth at (a) Manamaiju, (b) Imadol, (c) Ramkot, and (d) Bungamati.
Figure 8.
Typical soil profile, SPT-N value, and FS with depth at (a) Manamaiju, (b) Imadol, (c) Ramkot, and (d) Bungamati.

Figure 9.
LPI for each borehole considered in this study.

Figure 10.
The histogram of liquefaction potential index values.

Figure 11.
Liquefaction susceptibility map of Kathmandu Valley.

Figure 12.
Liquefaction susceptibility map with road network and airport of Kathmandu Valley.

Figure 13.
Liquefaction susceptibility map with health facilities of Kathmandu Valley.

Figure 14.
Liquefaction susceptibility map with schools and colleges of Kathmandu Valley.


Table 1.
Sample calculation of FS and LPI for a typical borehole.
| Depth (m) | Corrected SPT-N Value | Soil Saturation | FC (%) | σvc (kPa) | σ’vc (kPa) | rd | CSR | MSF for Sand | Kσ * | CRR for M = 7.5 and σvc’ = 1 atm | CRR | FS | LPI |
|---|---|---|---|---|---|---|---|---|---|---|---|---|---|
| 1.5 | 11.90 | Unsaturated | 7 | 27.00 | 27.00 | 1.00 | 0.19 | 0.88 | 1.10 | 0.13 | n.a. | 0.00 | |
| 3 | 20.90 | Unsaturated | 7 | 54.00 | 54.00 | 0.99 | 0.19 | 0.88 | 1.09 | 0.22 | n.a. | 0.00 | |
| 4.5 | 27.14 | Unsaturated | 7 | 81.00 | 81.00 | 0.98 | 0.19 | 0.88 | 1.04 | 0.36 | n.a. | 0.00 | |
| 6 | 13.43 | Saturated | 7 | 110.25 | 95.54 | 0.97 | 0.22 | 0.88 | 1.01 | 0.14 | 0.13 | 0.58 | 4.36 |
| 7.5 | 18.27 | Saturated | 9 | 139.50 | 110.07 | 0.95 | 0.24 | 0.88 | 0.99 | 0.19 | 0.17 | 0.71 | 2.69 |
| 9 | 26.50 | Saturated | 5 | 168.75 | 124.61 | 0.94 | 0.25 | 0.88 | 0.96 | 0.33 | 0.28 | 1.12 | 0.00 |
| 10.5 | 27.67 | Saturated | 5 | 198.00 | 139.14 | 0.93 | 0.26 | 0.88 | 0.94 | 0.37 | 0.31 | 1.19 | 0.00 |
| 12 | 30.05 | Saturated | 5 | 227.25 | 153.68 | 0.91 | 0.26 | 0.88 | 0.91 | 0.49 | 0.39 | 1.49 | 0.00 |
| 13.5 | 24.41 | Saturated | 5 | 256.50 | 168.21 | 0.89 | 0.27 | 0.88 | 0.92 | 0.28 | 0.22 | 0.84 | 0.79 |
| 15 | 27.98 | Saturated | 5 | 285.75 | 182.75 | 0.88 | 0.27 | 0.88 | 0.89 | 0.38 | 0.30 | 1.12 | 0.00 |
| 16.5 | 27.06 | Saturated | 5 | 315.00 | 197.28 | 0.86 | 0.27 | 0.88 | 0.88 | 0.35 | 0.27 | 1.00 | 0.00 |
| 18 | 26.20 | Saturated | 5 | 344.25 | 211.82 | 0.84 | 0.27 | 0.88 | 0.87 | 0.32 | 0.25 | 0.92 | 0.12 |
| 20 | 25.16 | Saturated | 5 | 383.25 | 231.20 | 0.82 | 0.26 | 0.88 | 0.86 | 0.29 | 0.22 | 0.84 | 0.00 |
| 7.96 | |||||||||||||
* overburden correction factor.
Table 2.
Liquefaction potential classification (Adapted from ref. [59]).
Table 2.
Liquefaction potential classification (Adapted from ref. [59]).
| LPI | Susceptibility |
|---|---|
| 0 | Very low |
| 0 < LPI ≤ 5 | Low |
| 5 < LPI ≤ 15 | High |
| LPI > 15 | Very high |
Table 3.
Liquefaction susceptibility of the road network in Kathmandu Valley.
| LPI | Highways | Feeder Roads | District Roads | Other Roads | Total | |||||
|---|---|---|---|---|---|---|---|---|---|---|
| km | % | km | % | km | % | km | % | km | % | |
| Very low | 0.1 | 0.2 ≈ 0 | 0.6 | 1 | 12.7 | 7 | 79.8 | 5 | 93.3 | 5 |
| Low | 3.6 | 7 | 16.5 | 28 | 28.7 | 15 | 365.3 | 22 | 414.0 | 21 |
| High | 18.0 | 32 | 21.2 | 37 | 66.7 | 35 | 538.3 | 32 | 644.3 | 32 |
| Very high | 33.9 | 61 | 19.8 | 34 | 81.2 | 43 | 687.6 | 41 | 822.5 | 42 |
| Total | 55.6 | 100 | 58.1 | 100 | 189.3 | 100 | 1671.0 | 100 | 1974.1 | 100 |
Table 4.
Liquefaction susceptibility of Tribhuvan International Airport in Kathmandu Valley.
| Liquefaction Susceptibility | Airport | |
|---|---|---|
| Area (Sq. m) | Percentage (%) | |
| Very low | 0 | 0 |
| Low | 0.16 | 6 |
| High | 2.16 | 78 |
| Very high | 0.44 | 16 |
| Total | 2.76 | 100 |
Table 5.
Health facilities in the valley falling on a different zone of liquefaction susceptibility.
Table 5.
Health facilities in the valley falling on a different zone of liquefaction susceptibility.
| Liquefaction Susceptibility | Health Facility | |
|---|---|---|
| Number | Percentage (%) | |
| Very low | 2 | 1 |
| Low | 18 | 7 |
| High | 84 | 32 |
| Very high | 159 | 60 |
| Total | 263 | 100 |
Table 6.
Schools and colleges of Kathmandu Valley falling in a different zone of liquefaction susceptibility.
Table 6.
Schools and colleges of Kathmandu Valley falling in a different zone of liquefaction susceptibility.
| Liquefaction Susceptibility | School | College | ||
|---|---|---|---|---|
| Number | Percentage (%) | Number | Percentage (%) | |
| Very low | 43 | 2 | 2 | 0.5 ≈ 0 |
| Low | 232 | 12 | 15 | 4 |
| High | 629 | 32 | 130 | 32 |
| Very high | 1069 | 54 | 257 | 64 |
| Total | 1973 | 100 | 404 | 100 |
Publisher’s Note: MDPI stays neutral with regard to jurisdictional claims in published maps and institutional affiliations. |
© 2021 by the authors. Licensee MDPI, Basel, Switzerland. This article is an open access article distributed under the terms and conditions of the Creative Commons Attribution (CC BY) license (https://creativecommons.org/licenses/by/4.0/).
Share and Cite
MDPI and ACS Style
Acharya, P.; Sharma, K.; Acharya, I.P. Seismic Liquefaction Risk Assessment of Critical Facilities in Kathmandu Valley, Nepal. GeoHazards 2021, 2, 153-171. https://0-doi-org.brum.beds.ac.uk/10.3390/geohazards2030009
AMA Style
Acharya P, Sharma K, Acharya IP. Seismic Liquefaction Risk Assessment of Critical Facilities in Kathmandu Valley, Nepal. GeoHazards. 2021; 2(3):153-171. https://0-doi-org.brum.beds.ac.uk/10.3390/geohazards2030009
Chicago/Turabian StyleAcharya, Prabin, Keshab Sharma, and Indra Prasad Acharya. 2021. "Seismic Liquefaction Risk Assessment of Critical Facilities in Kathmandu Valley, Nepal" GeoHazards 2, no. 3: 153-171. https://0-doi-org.brum.beds.ac.uk/10.3390/geohazards2030009