Article

Threshold Effects of Relative Sea-Level Change in Intertidal Ecosystems: Empirical Evidence from Earthquake-Induced Uplift on a Rocky Coast

1
Marine Ecology Research Group, University of Canterbury, Private Bag 4800, Christchurch 8140, New Zealand
2
School of Earth and Environment, University of Canterbury, Private Bag 4800, Christchurch 8140, New Zealand
3
Cawthron Institute, 98 Halifax Street, Nelson 7010, New Zealand
*
Author to whom correspondence should be addressed.
Submission received: 9 August 2021 / Revised: 24 September 2021 / Accepted: 24 September 2021 / Published: 29 September 2021

Abstract

:
Widespread mortality of intertidal biota was observed following the 7.8 Mw Kaikōura earthquake in November 2016. To understand drivers of change and recovery in nearshore ecosystems, we quantified the variation in relative sea-level changes caused by tectonic uplift and evaluated their relationships with ecological impacts with a view to establishing the minimum threshold and overall extent of the major effects on rocky shores. Vertical displacement of contiguous 50 m shoreline sections was assessed using comparable LiDAR data to address initial and potential ongoing change across a 100 km study area. Co-seismic uplift accounted for the majority of relative sea-level change at most locations. Only small changes were detected beyond the initial earthquake event, but they included the weathering of reef platforms and accumulation of mobile gravels that continue to shape the coast. Intertidal vegetation losses were evident in equivalent intertidal zones at all uplifted sites despite considerable variation in the vertical displacement they experienced. Nine of ten uplifted sites suffered severe (>80%) loss in habitat-forming algae and included the lowest uplift values (0.6 m). These results show a functional threshold of c.1/4 of the tidal range above which major impacts were sustained. Evidently, compensatory recovery has not occurred—but more notably, previously subtidal algae that were uplifted into the low intertidal zone where they ought to persist (but did not) suggests additional post-disturbance adversities that have contributed to the overall effect. Continuing research will investigate differences in recovery trajectories across the affected area to identify factors and processes that will lead to the regeneration of ecosystems and resources.

1. Introduction

Relative sea-level trends are pervasive drivers of change in nearshore coastal systems due to the multitude of social and ecological relationships that are structured by the position of land in relation to the sea [1]. Enduring sea-level changes present a specific set of challenges that differ from those associated with periodic extreme events. For example, they are more likely to force long-term adjustments to the spatial configuration of coastal landscapes upon which both periodic extreme events and regular hydrological fluctuations interact [2]. Land-mass displacement mechanisms play a critical role in determining relative sea-level trends and include crustal movements associated with tectonic plates and isostatic responses to stress redistribution associated with glacial de-loading [3,4]. Land surface elevation changes may also result from shallow sources of uplift and subsidence such as the movement of hydrocarbons and groundwater, decay of organic material and compaction of sediments [5,6,7].
Rapid changes in relative sea-levels can result in widespread disturbance to the antecedent pattern of development in both natural and anthropogenic environments. While various degrees of resistance or resilience to these changes are a feature of social–ecological systems, there are also tipping points beyond which major losses are sustained [8,9,10]. These thresholds are therefore of fundamental interest for the study of disaster risk reduction and disaster recovery processes to improve strategic planning and preparedness for further change. The potential for rapid displacement events is a serious consideration in seismically active regions that include vast tracts of coastline in territories close to subduction zones in the Pacific Ocean [11]. In addition to the direct impacts of hydrological changes, the cumulative effects of land mass movements have important consequences for the development of climate-change adaptation strategies [12,13]. Depending on the direction of motion, they may potentially mitigate or exacerbate eustatic sea-level rise effects and drive additional interactions with erosion and sedimentation processes [14,15,16].
There are few contemporary studies of the impact of co-seismic displacement events on coastal communities, but they have undoubtedly been a regular occurrence over geological time periods. The available studies have documented massive changes in the structure and function of coastal ecosystems with associated impacts on the persistence and condition of natural resources, including shellfish and finfish fisheries, coastal forests, blue-carbon ecosystems, and coastal land. Recent examples include a 2007 earthquake in the Solomon Islands that caused subsidence leading to major changes in the spatial extent of mangroves and coastal wetlands [17]. In New Zealand, the 2010–2011 Canterbury earthquakes caused both subsidence and uplift in coastal waterways as a consequence of tilt effects associated with fault-line movements [18]. Ground-surface deformation caused widespread damage to residential properties in low-lying areas, and exacerbated flood risk in areas of subsidence leading to a managed retreat initiative [19,20,21]. Hydrological changes also caused the loss of coastal wetlands and shorebird habitat in areas of relative sea-level rise as characteristic ecosystems moved landward [2,12,22]. In uplifted areas, impacts included shifts in the salt water intrusion characteristics of lowland waterways leading to the downstream migration of coastal zonation patterns and key habitats [23,24].
In the 2010 8.8 Mw Chilean earthquake, coastal uplift was associated with severe losses of low intertidal sand beach habitat and gains in upper- and mid-intertidal habitat [25,26]. These impacts were influenced by the magnitude and direction of vertical displacement, interactions with substrate types, and the mobility of characteristic biota [25]. Similar circumstances are found in the present study, which investigates impacts of the 2016 7.8 Mw Kaikōura earthquake on the east coast of New Zealand. The associated fault ruptures were among the most complex ever recorded [27,28,29] and manifested as a highly variable pattern of ground-level displacement but mostly in the direction of uplift [30]. These physical impacts led to widespread reassembly of ecological communities on rocky shorelines [31,32,33]. Associated social and economic effects included new landscape configurations altering access to the coast, and the closure of commercial fisheries and recreational harvesting of seaweeds and shellfish [34,35].

Objectives

In the aftermath of the earthquake we began a research programme to determine the severity of impacts and investigate prospects for recovery. In this study, our major objectives were (a) to quantify relative sea-level changes caused by the earthquake as close as possible to our post-earthquake study sites in the new intertidal environment, and (b) to estimate the severity of impacts on major habitat-forming macroalgal, particularly large brown kelp and fucoid algae (phaeophyceae) that provide habitat, are highly productive, support a large biomass, and define ecosystem structure on the rocky shores of this coast [36]. Challenges for this assessment included the availability of elevation data within the landforms and ecosystem types of interest, particularly in the new intertidal areas that were previously submerged and therefore outside of the spatial extent of aerial and satellite-based altimetry surveys. There was also a need to include the evaluation of tilt effects that could lead to ground-level displacement gradients across the shore profile, and the potential for continued displacement subsequent to the main seismic event.
Despite being an investigative study of a natural event, we identified several intriguing hypotheses, including the expectation that the short dispersal distances of reproductive large brown algae [37,38] would limit recruitment into areas of newly available habitat, reducing the potential for recovery of impacted population and/or slowing recovery rates. Interactions with other stressors (e.g., erosion, compromised light environment) in the post-quake environment were also expected to limit the potential for recovery through rapid post-quake recruitment and potentially reduce the survival of individuals that were uplifted to new and more physically stressful vertical positions within the tidal range. We expected that testing these hypotheses would manifest as net losses in habitat-forming algae for equivalent pre- and post-quake tidal zones, which are the focus of this study.
Note that these expectations contrast with an alternative hypothesis in which characteristic habitats remain intact due to the survival of key species and/or rapid recovery from recruitment, with the overall intertidal zone simply shifting along the coastal profile in response to new sea levels. In considering the implications, the latter is associated with few negative impacts or quick recovery through seeding from nearby reproductive individuals that survived initial impacts. In contrast, the former are indicative of widespread ecosystem collapse with associated social and economic impacts, such as prolonged fishery closures and other ecosystem service losses.

2. Materials and Methods

2.1. Study Area

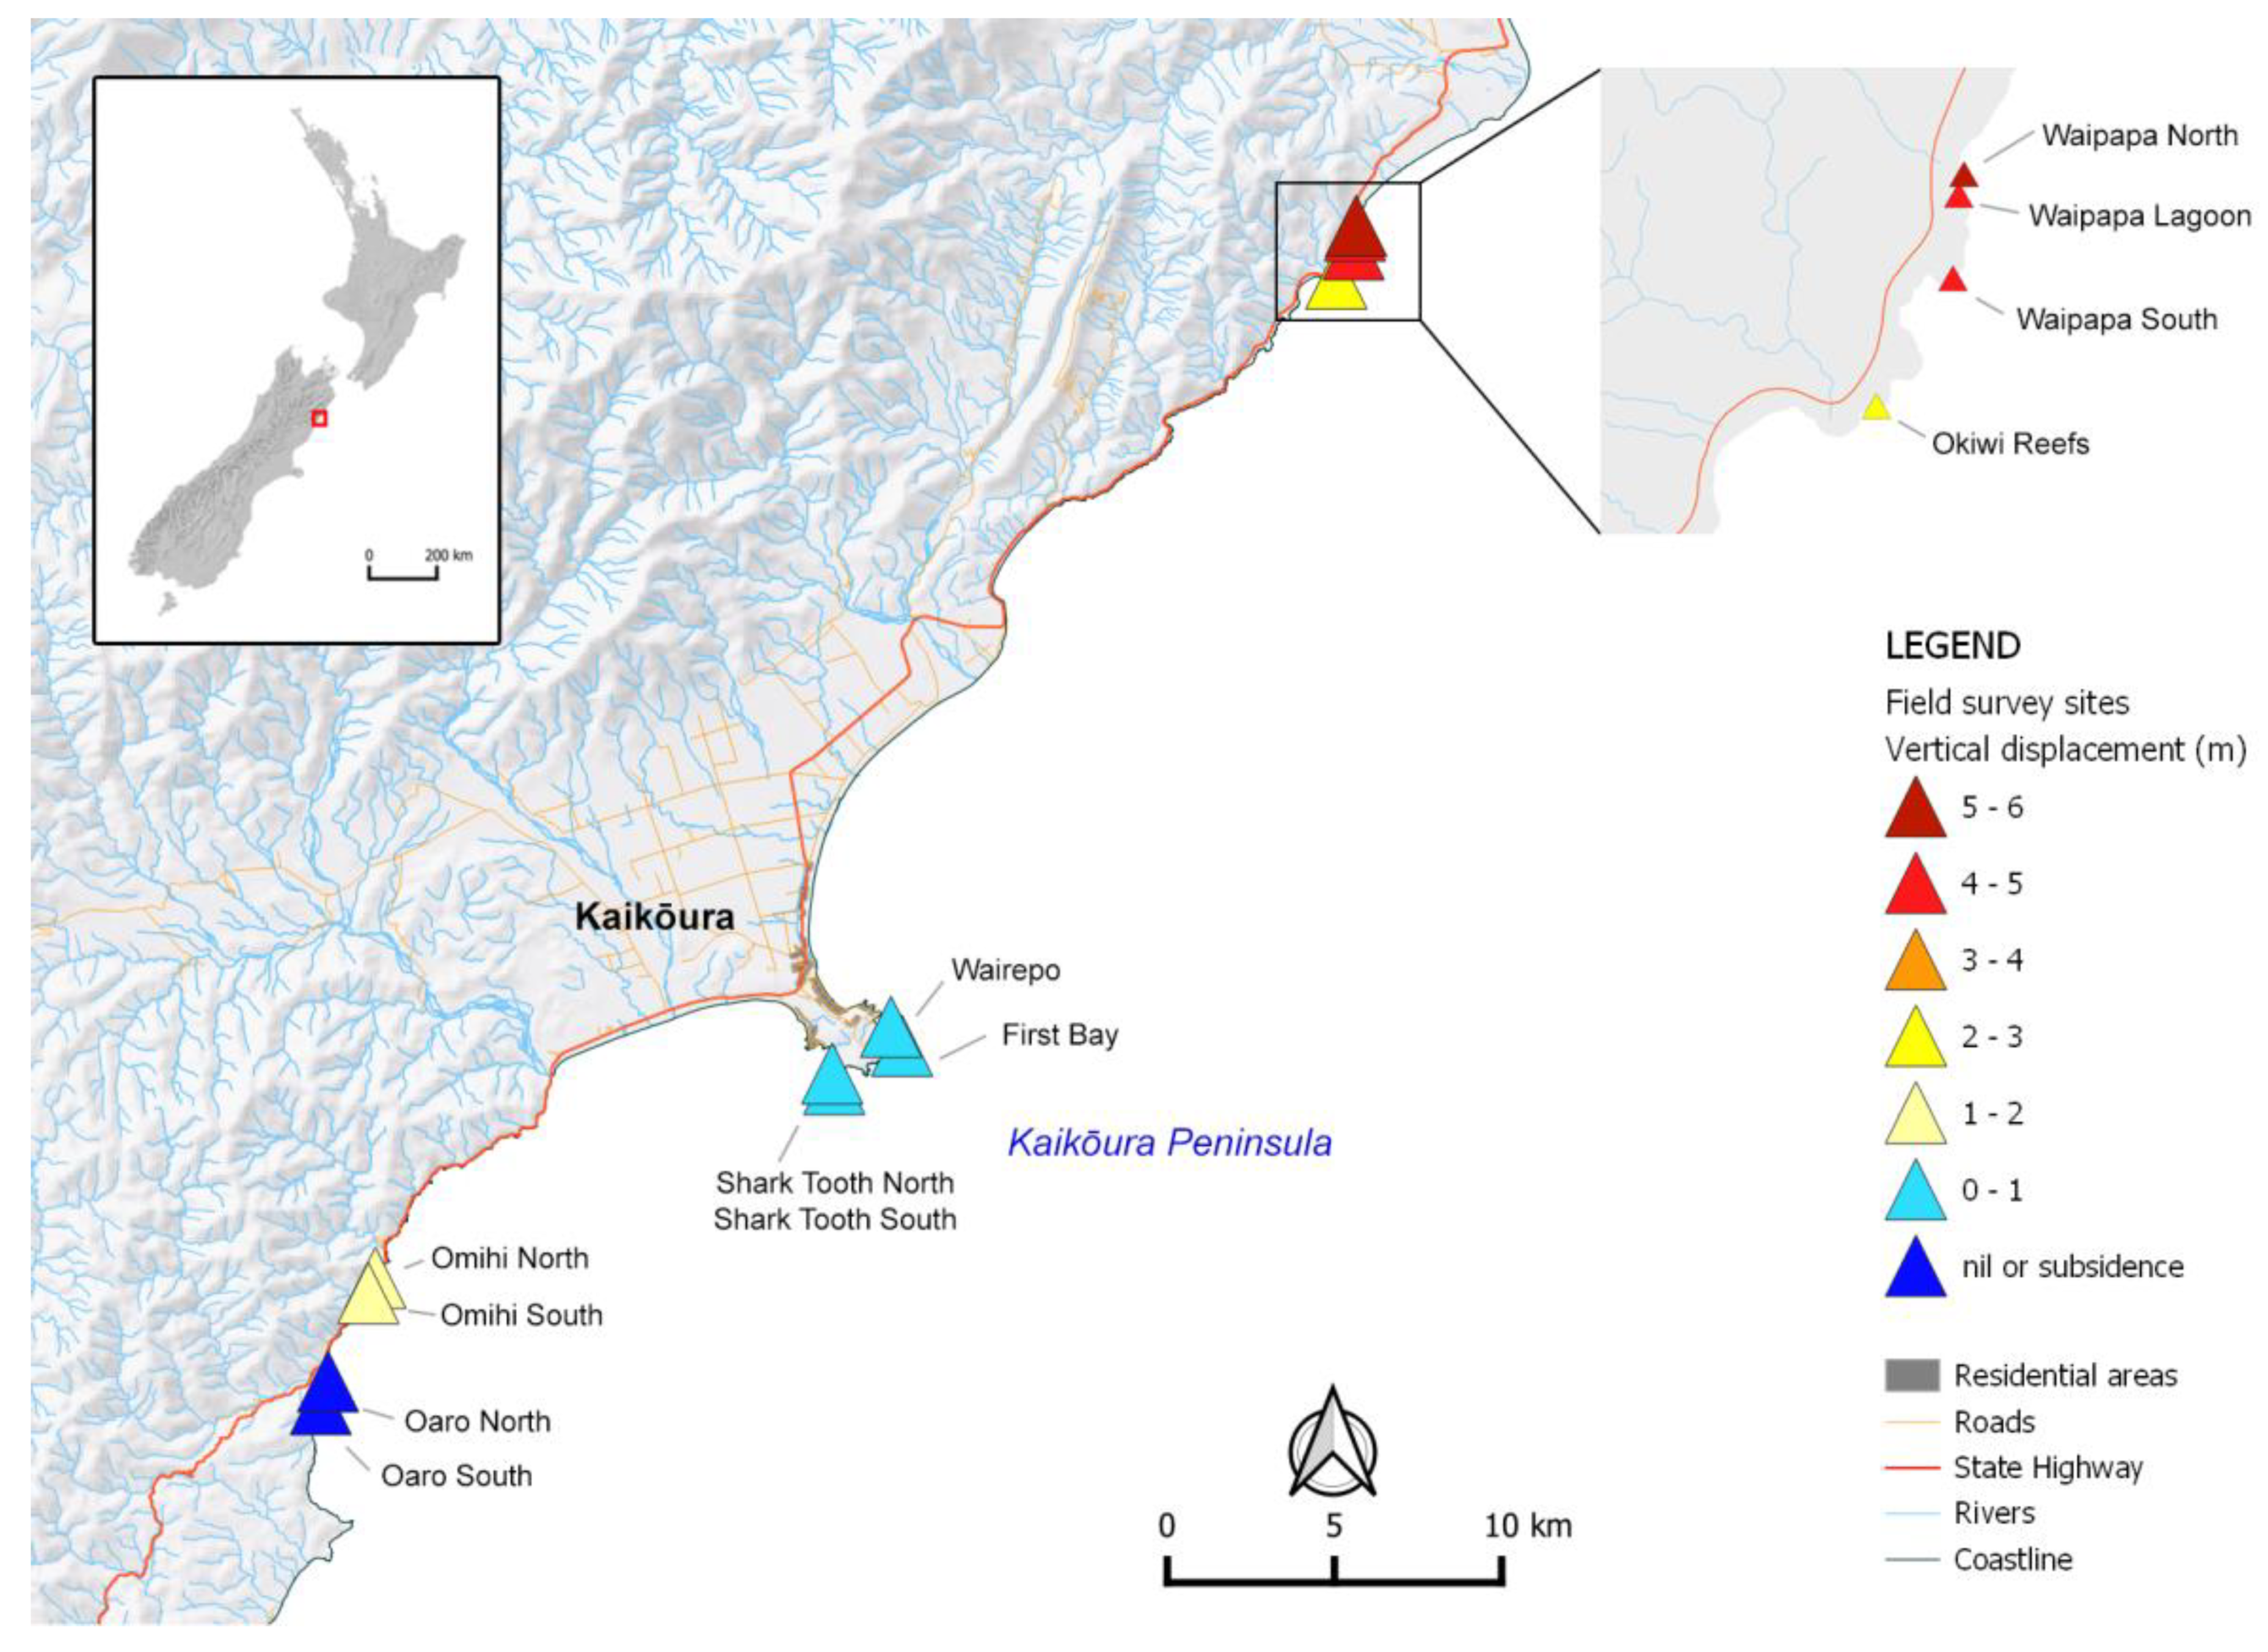
The study area is a contiguous 100 km section of coastline stretching from Oaro to Waipapa Bay on the east coast of the South Island of New Zealand. Kaikōura is a small town (population c.2500) located at the base of the Kaikōura Peninsula, a prominent feature on this wave-exposed coast (Figure 1). The coastal environment of this area is renowned for its rocky shore habitats that support a rich diversity of intertidal and shallow subtidal marine species, including habitat-dominating seaweeds, understory species, rock lobsters, New Zealand abalone (pāua), and other invertebrates [33,39]. The area features a wide variety of substrate types and topographies, including near-horizontal platforms and extensive rock and boulder fields, interspersed with dynamic mixed sand-gravel and sandy beaches. Much of the coast is sparsely populated and the single highway along it was severely damaged and closed for over a year. As a result, access to study sites had many logistical constraints, especially in the early phases of the study.

2.2. Data

Our overall approach took advantage of the availability of light detection and ranging (LiDAR) datasets that included three post-quake LiDAR acquisitions and a comparable pre-quake dataset (Table 1). The two immediate post-quake datasets (covering different spatial extents) were combined and all data re-projected to a common reference system and aligned to facilitate vertical displacement analyses based on differencing of 1 × 1 m digital elevation models (DEM). To evaluate temporal effects, we compared differences derived from the pre-quake (July 2012) to immediate post-quake (December 2016) period, and the immediate post-quake to 18-months post-quake (June 2018) LiDAR datasets. Confounding factors from ground-level changes between the July 2012 LiDAR acquisition and the earthquake event have been reviewed in previous studies [30], and the most significant seismic event in that period was associated with the Cook Strait earthquake sequence of up to Mw 6.6 that produced only small vertical displacements (<5 mm) in the Kaikōura region [40]. The potential for further post-seismic movement has been also assessed in previous work using interferometric synthetic aperture radar (InSAR) and GPS data that showed considerable further displacement effects at many sites in the upper South Island and much farther afield in the lower North Island [41,42]. Other sources of variance affecting differencing analyses include erosion and accretion effects that are difficult to account for in the before–after earthquake comparison. However, we made use of high resolution (0.1 m) RGB imagery captured during the aerial LiDAR acquisition to identify deposition from rockfall, unstable surfaces such as riverbeds, and anthropogenic modifications such as earthworks associated with earthquake recovery activities on the road and rail corridor. These areas were manually delineated where visible in the aerial imagery and the DEMs masked to remove these features from the analysis.

2.3. Vertical Displacement

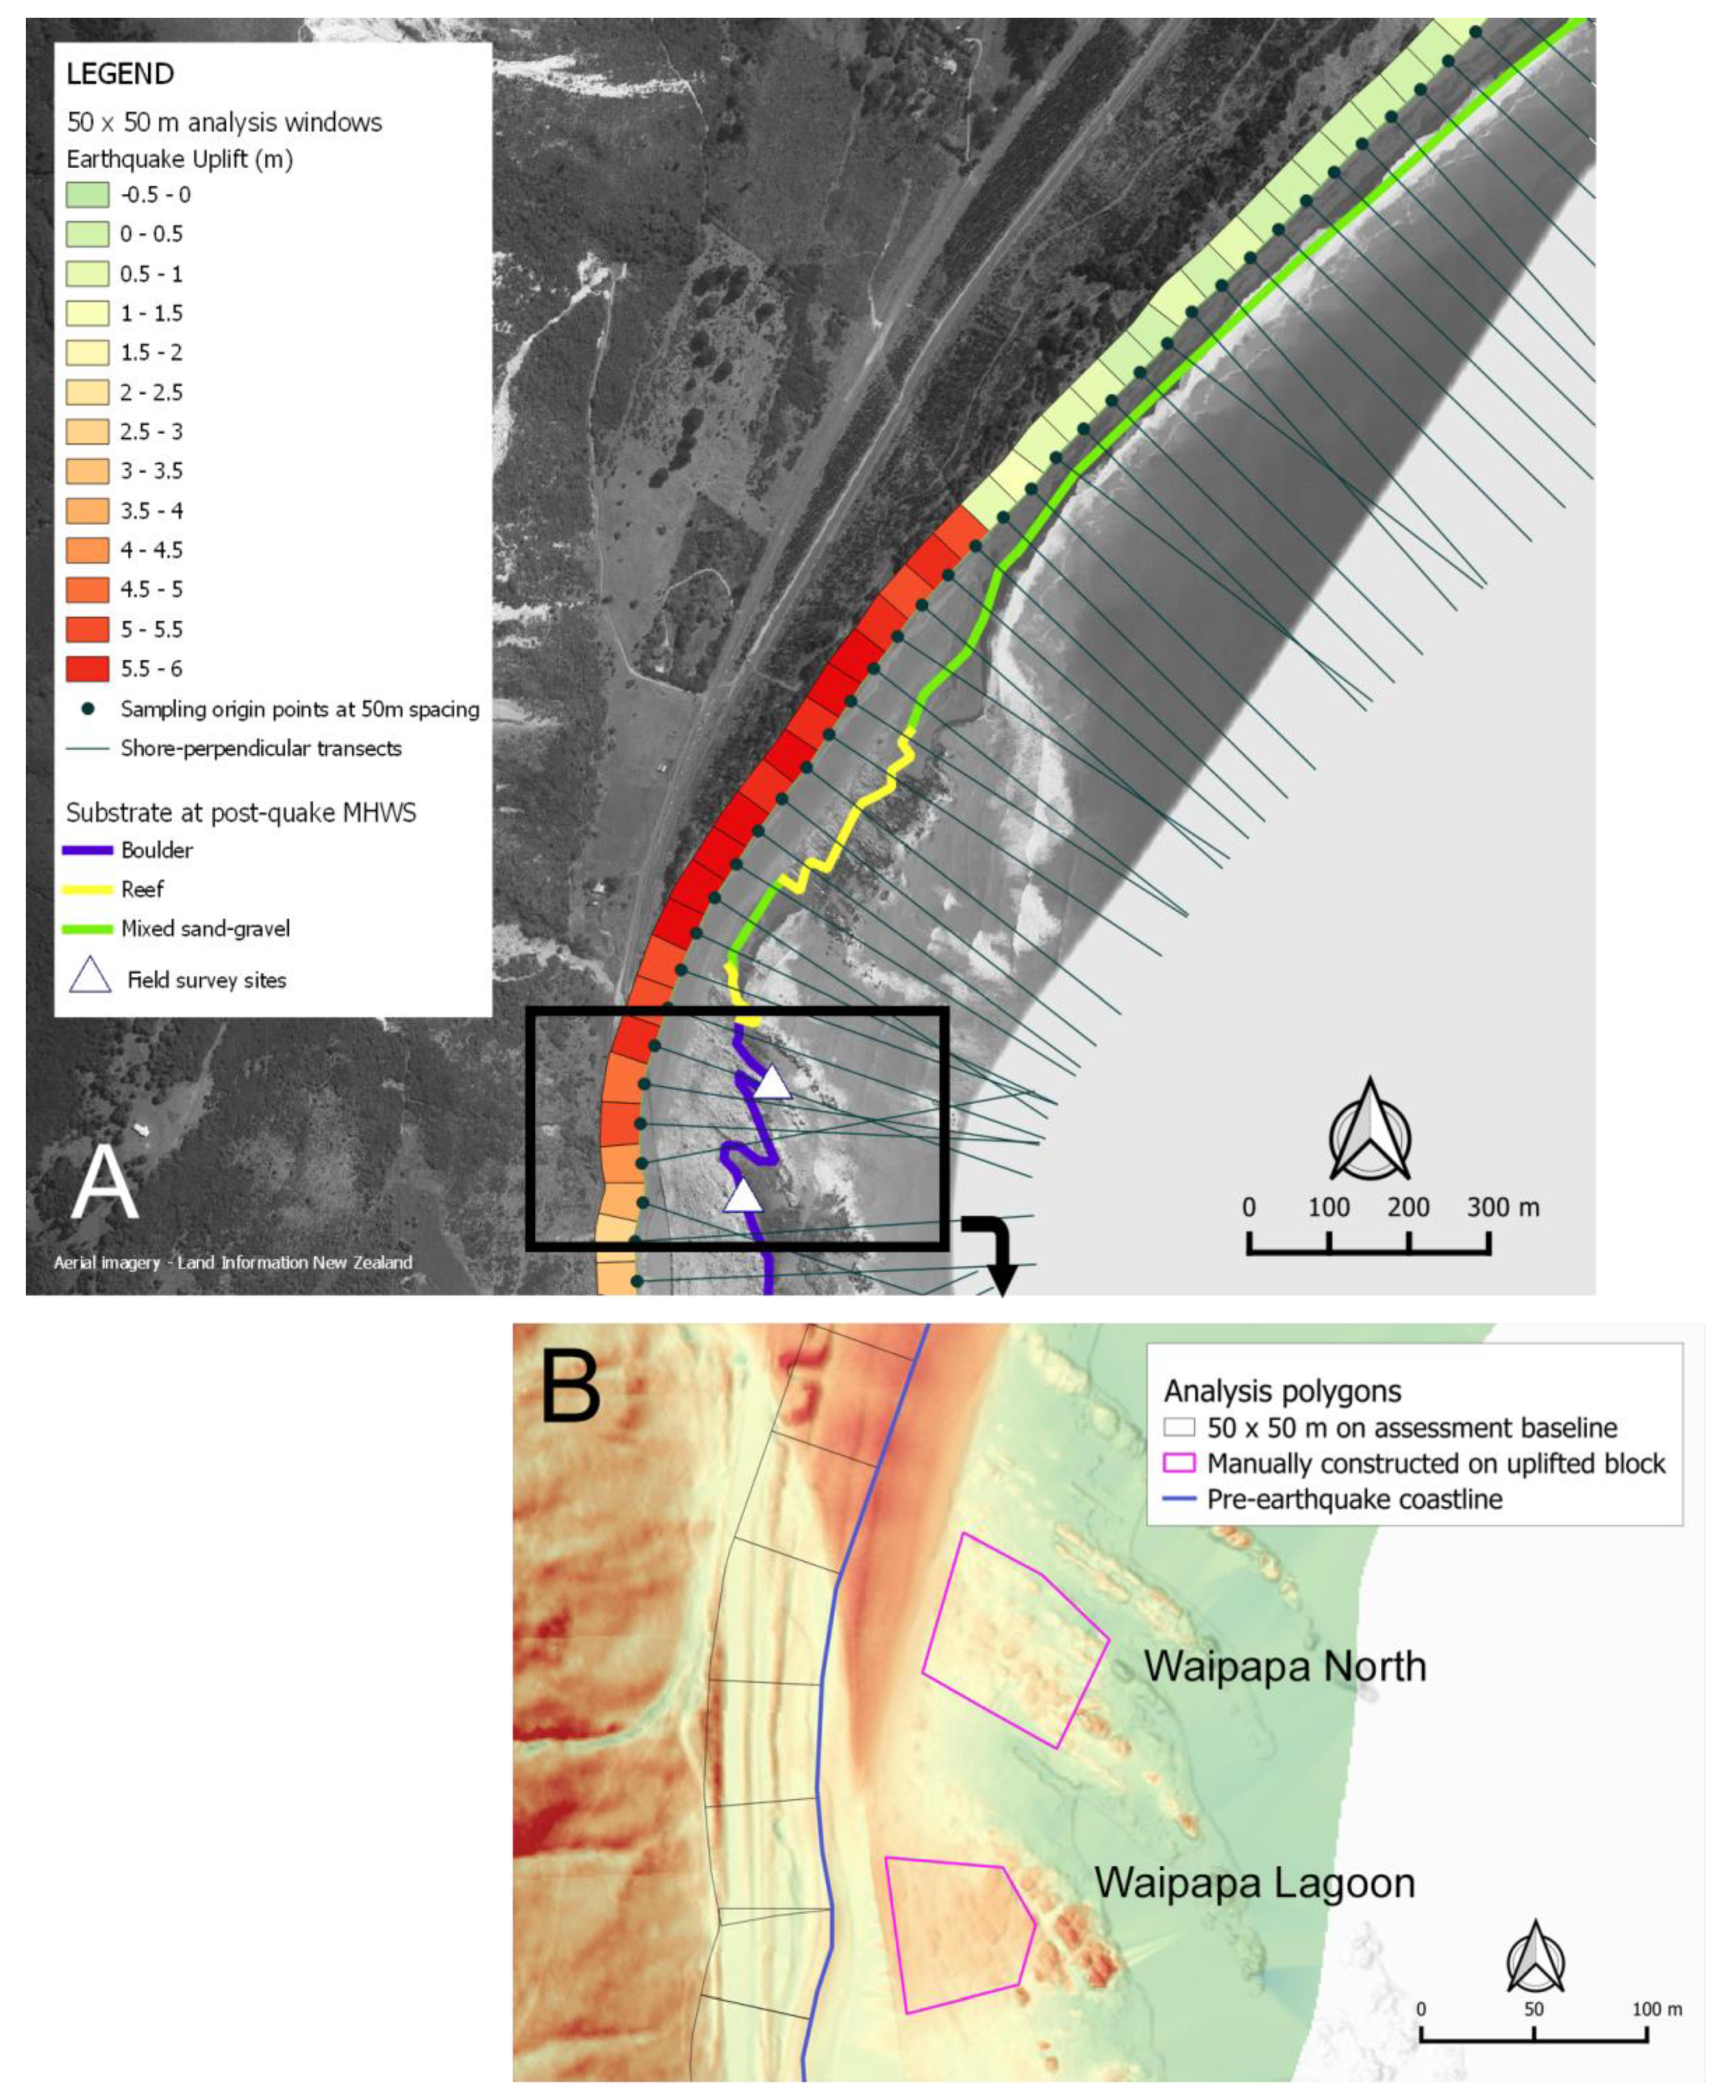
To assess spatio–temporal variability in vertical displacement at the coast, we constructed an assessment baseline using the first contiguous 0.1 m contour common to all datasets, which was located at the approximate position of the 2012 (pre-quake) mean high water springs (MHWS). A set of analysis windows was constructed landward of this baseline to facilitate the closest possible approximation of ground-level change within new intertidal areas (generally located seaward of this line), which are a key focus for recovery and impact assessments (
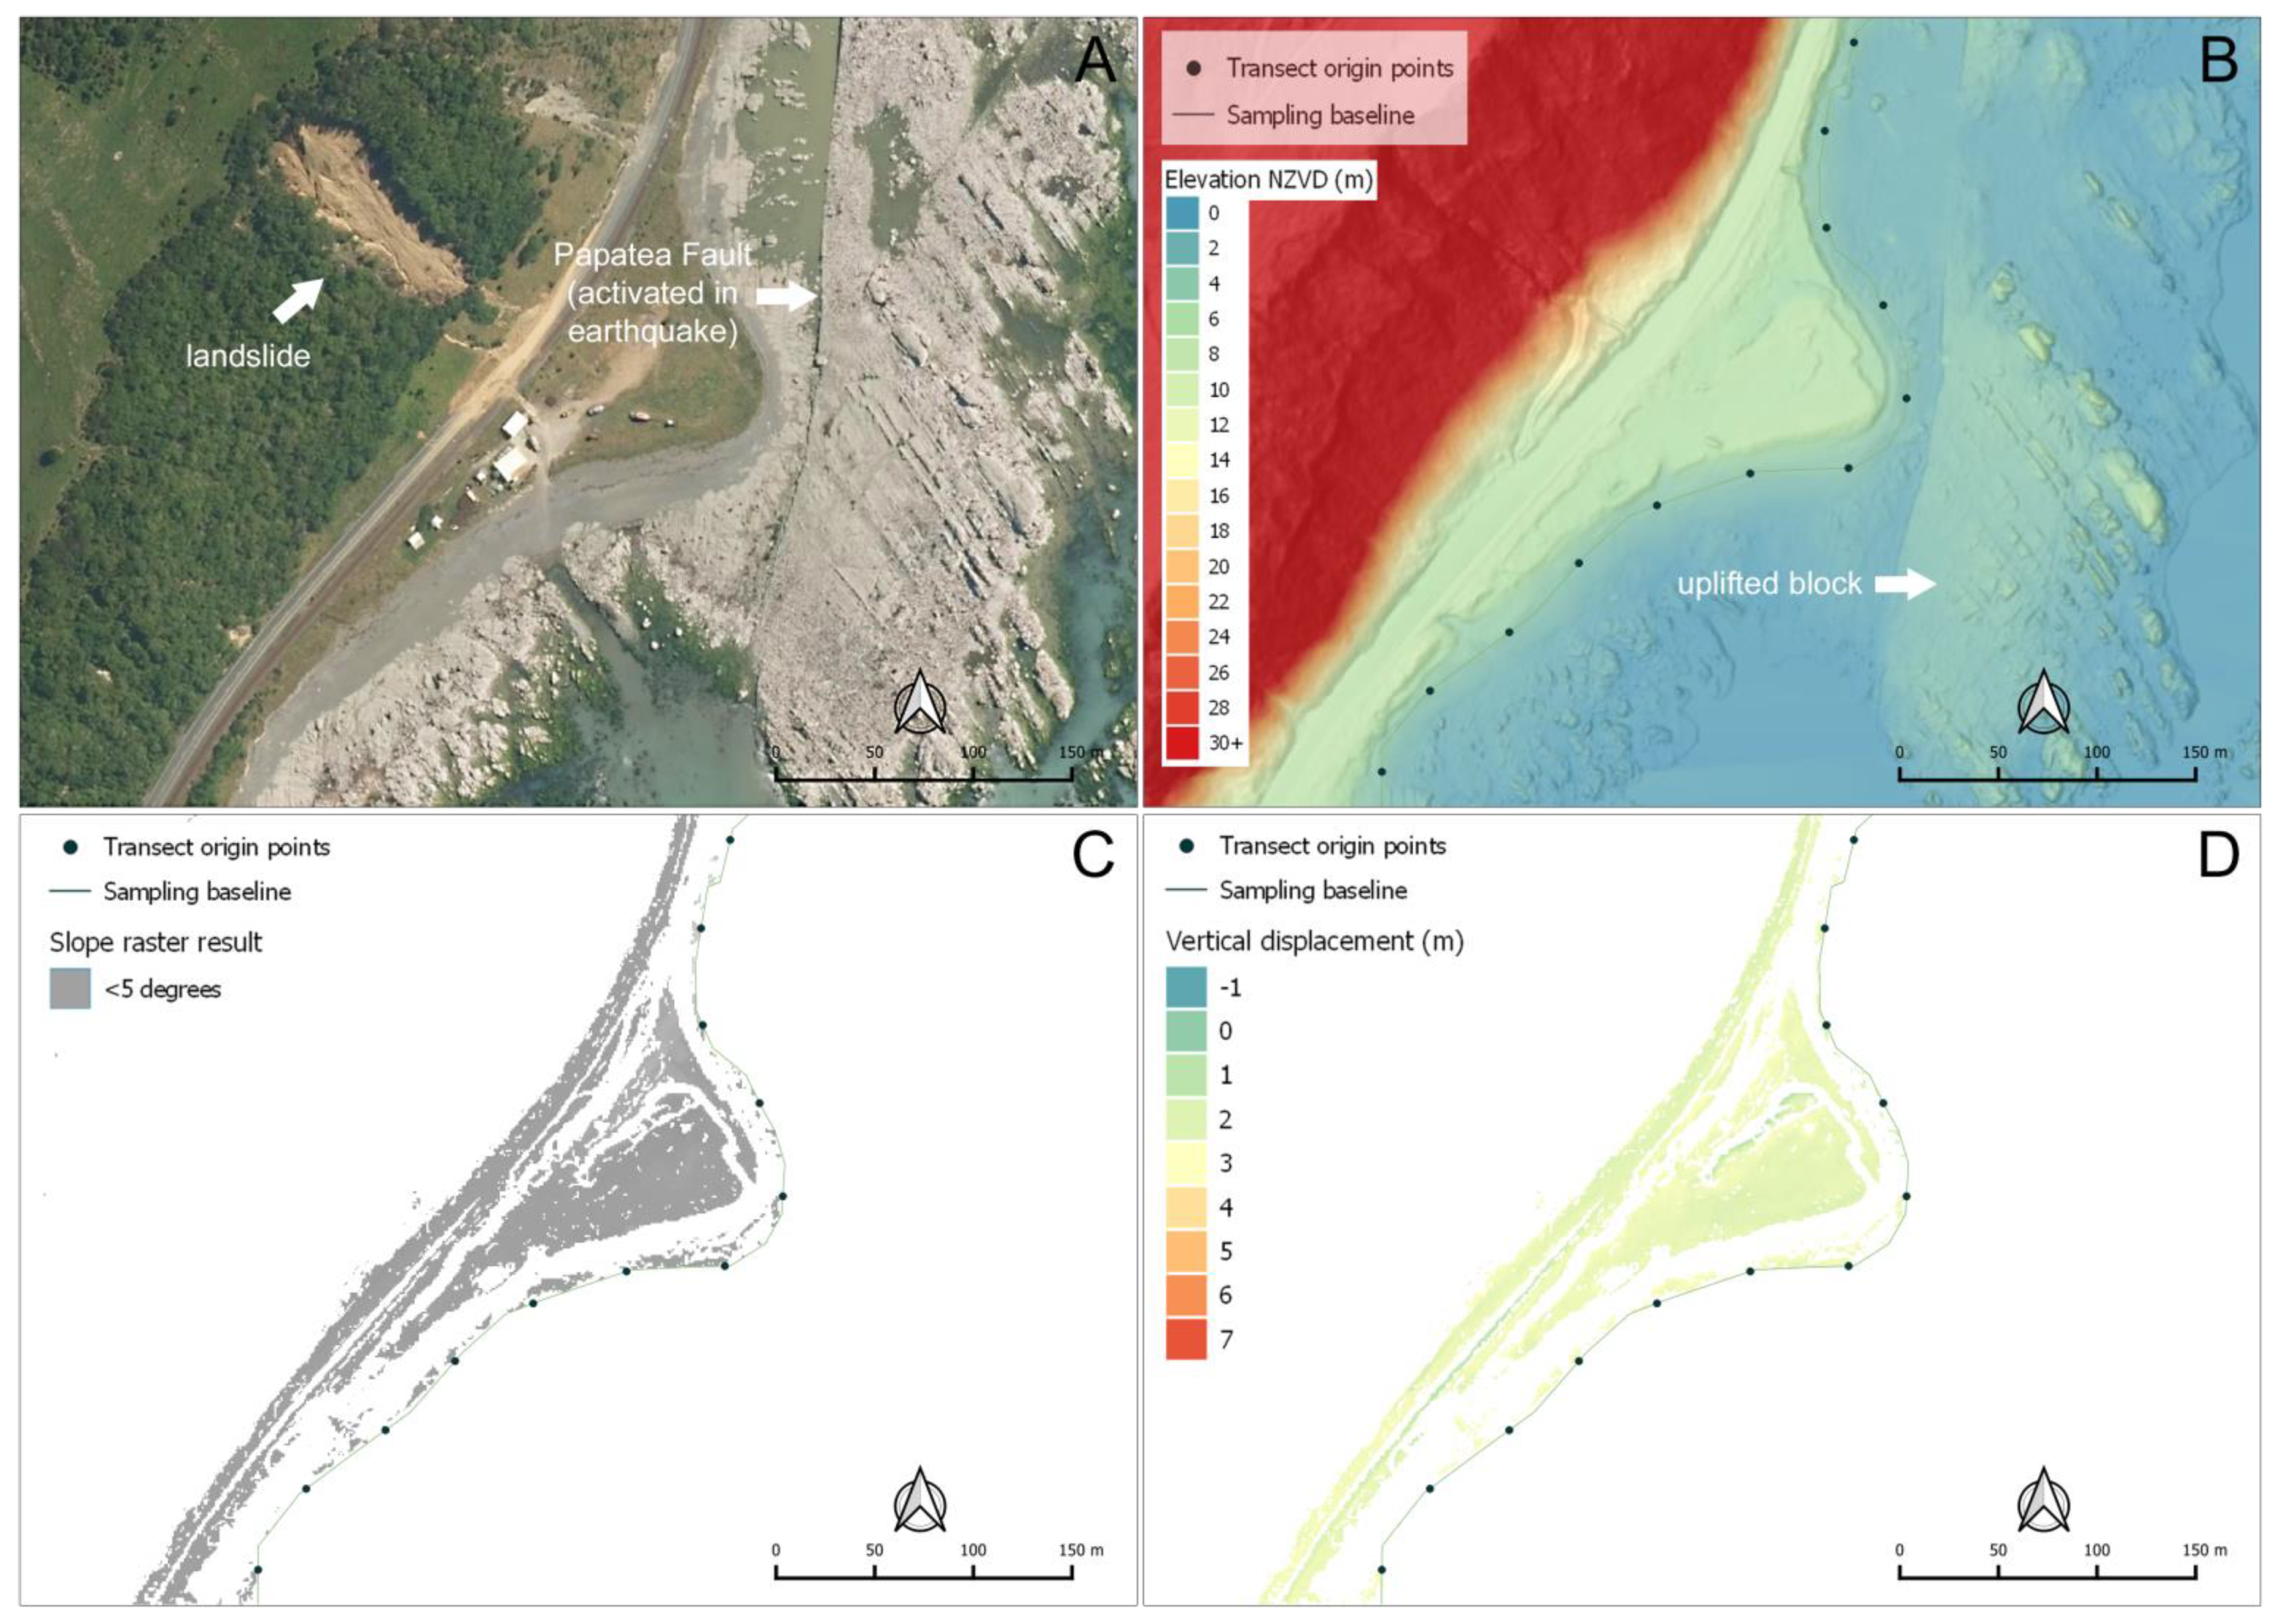
Figure 2A). Tilt effects were assessed independently (see below) to verify the transferability of these measurement to the new intertidal zone. At Waipapa, a sizeable portion of the intertidal zone was lifted higher than surrounding areas to landward as the result of block-faulting on the western strand of the Papatea Fault (Figure 3A). Fortunately, outcrops of relatively tall flat-topped rocks are a characteristic of this area and were captured in both pre- and post-earthquake LiDAR data. This enabled the calculation of uplift values for the uplifted block to be calculated using manually constructed analysis windows (Figure 2B).
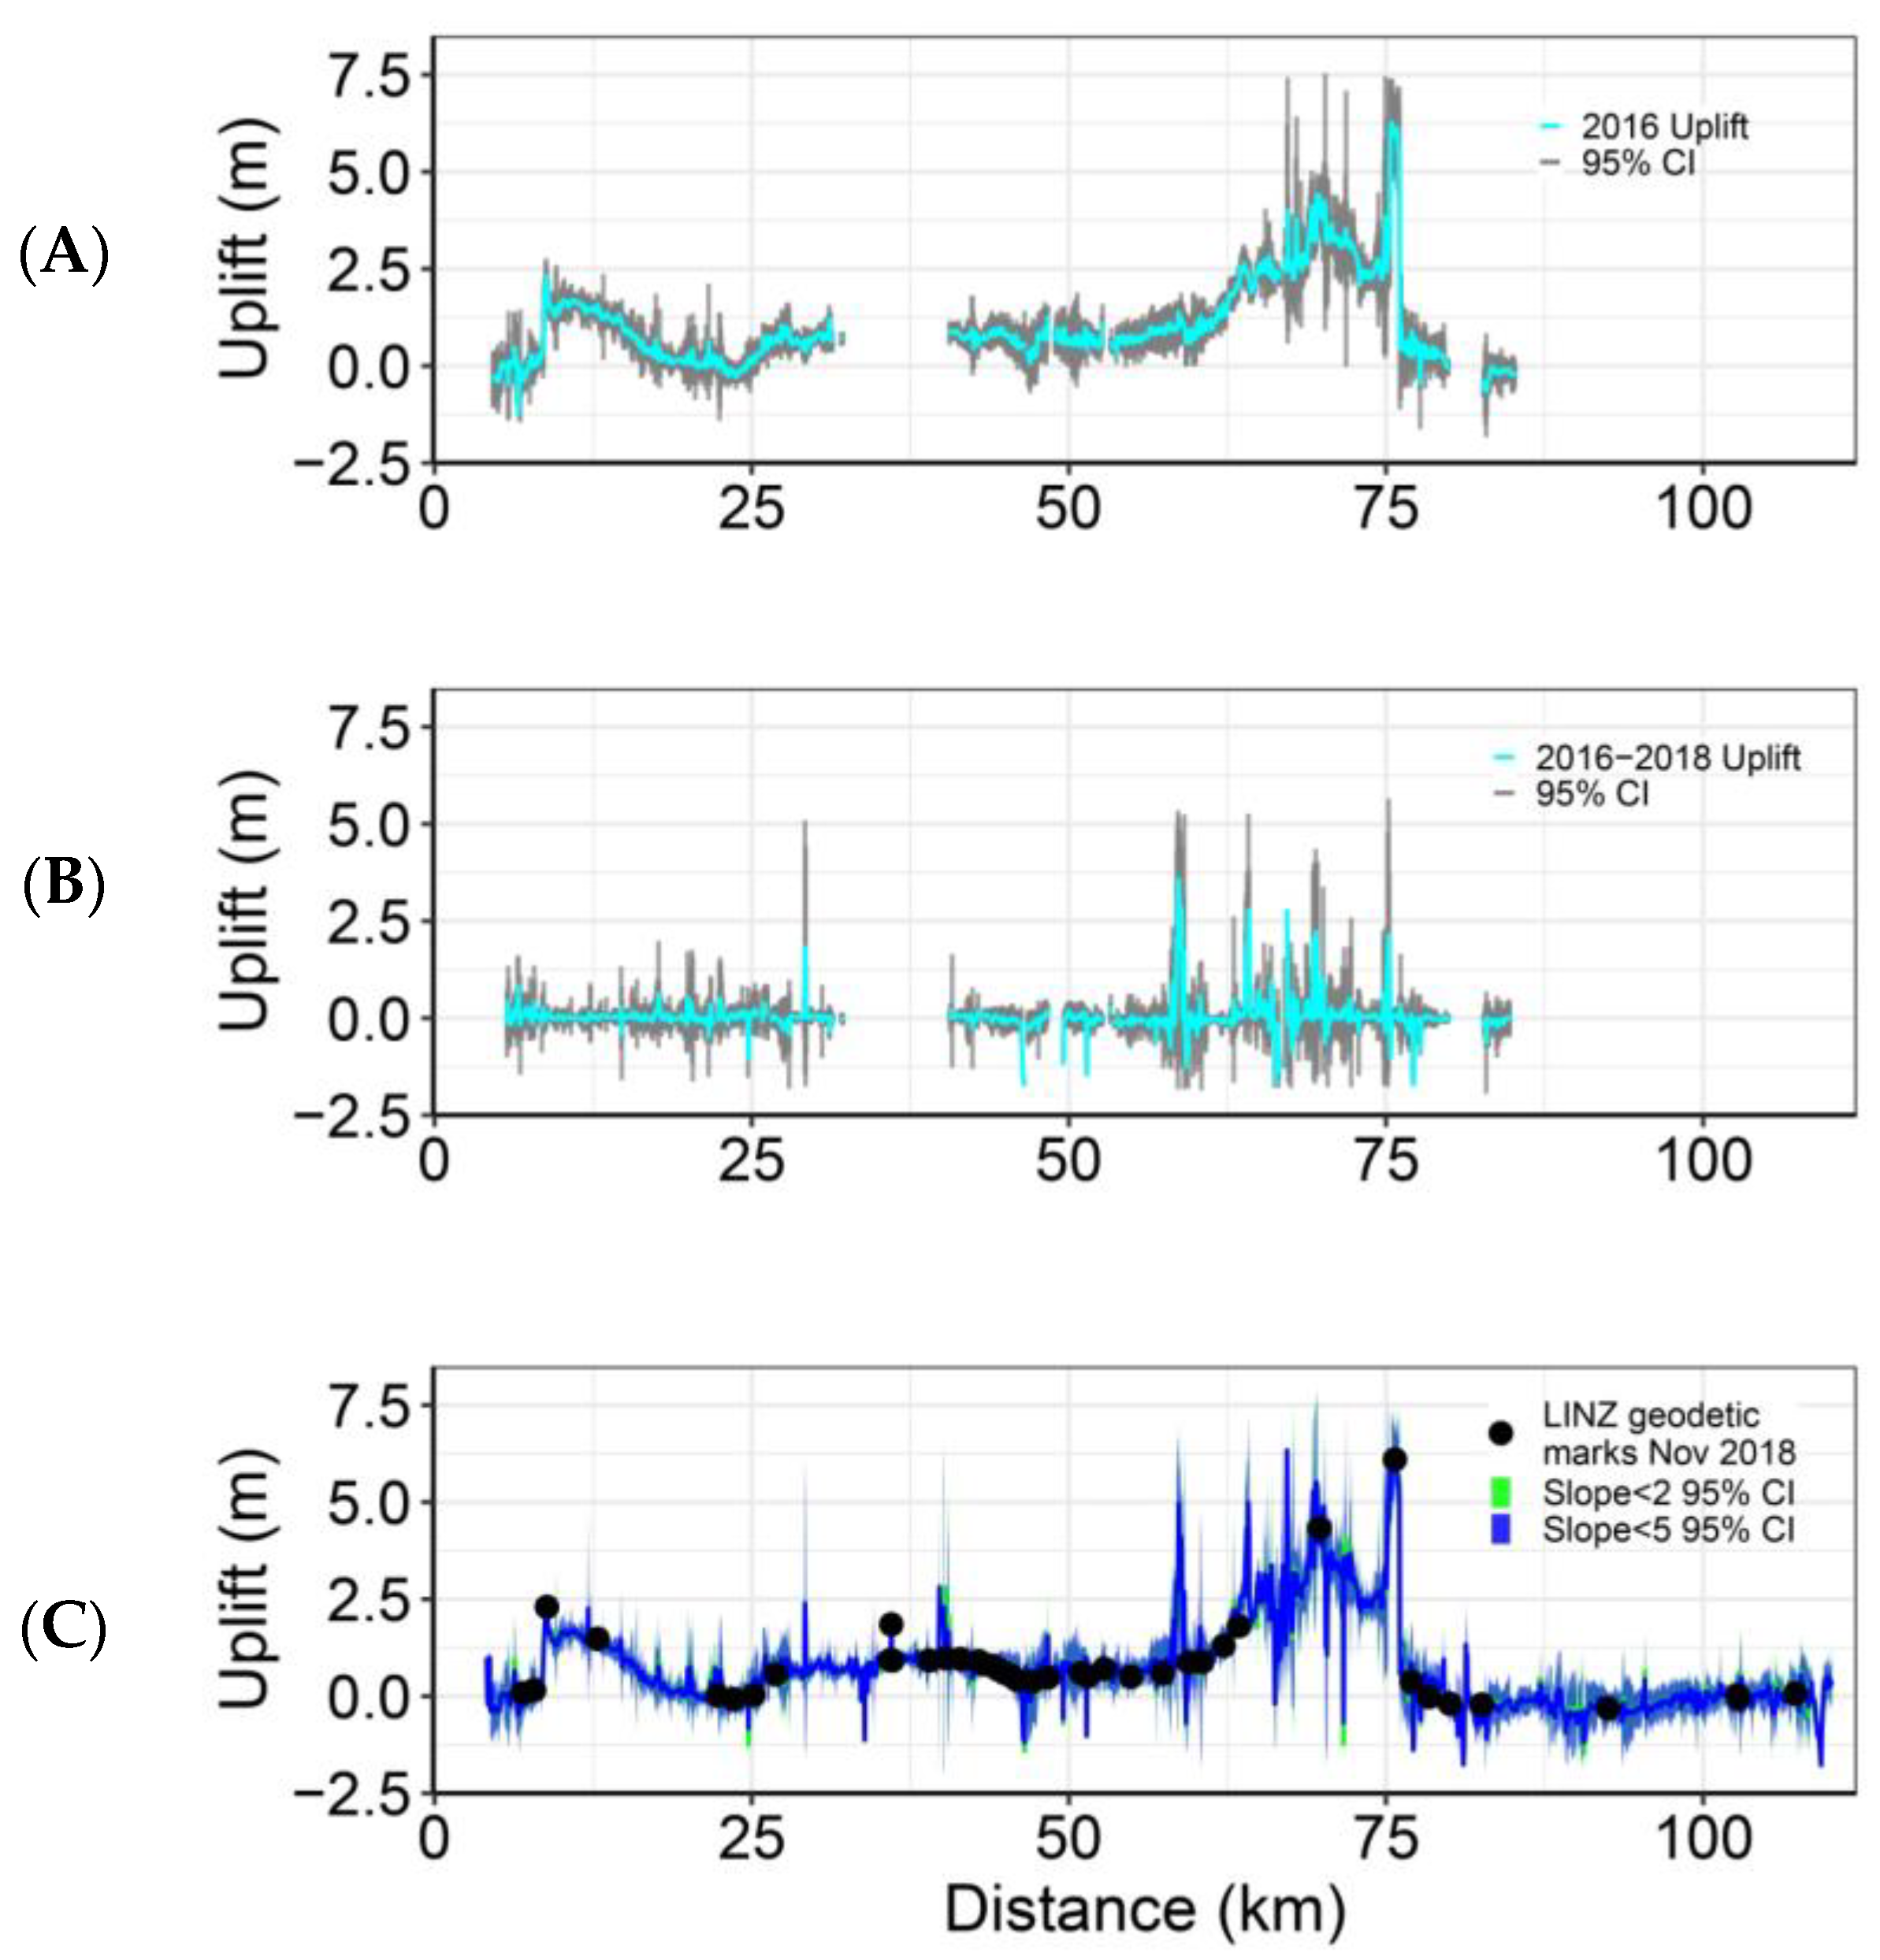
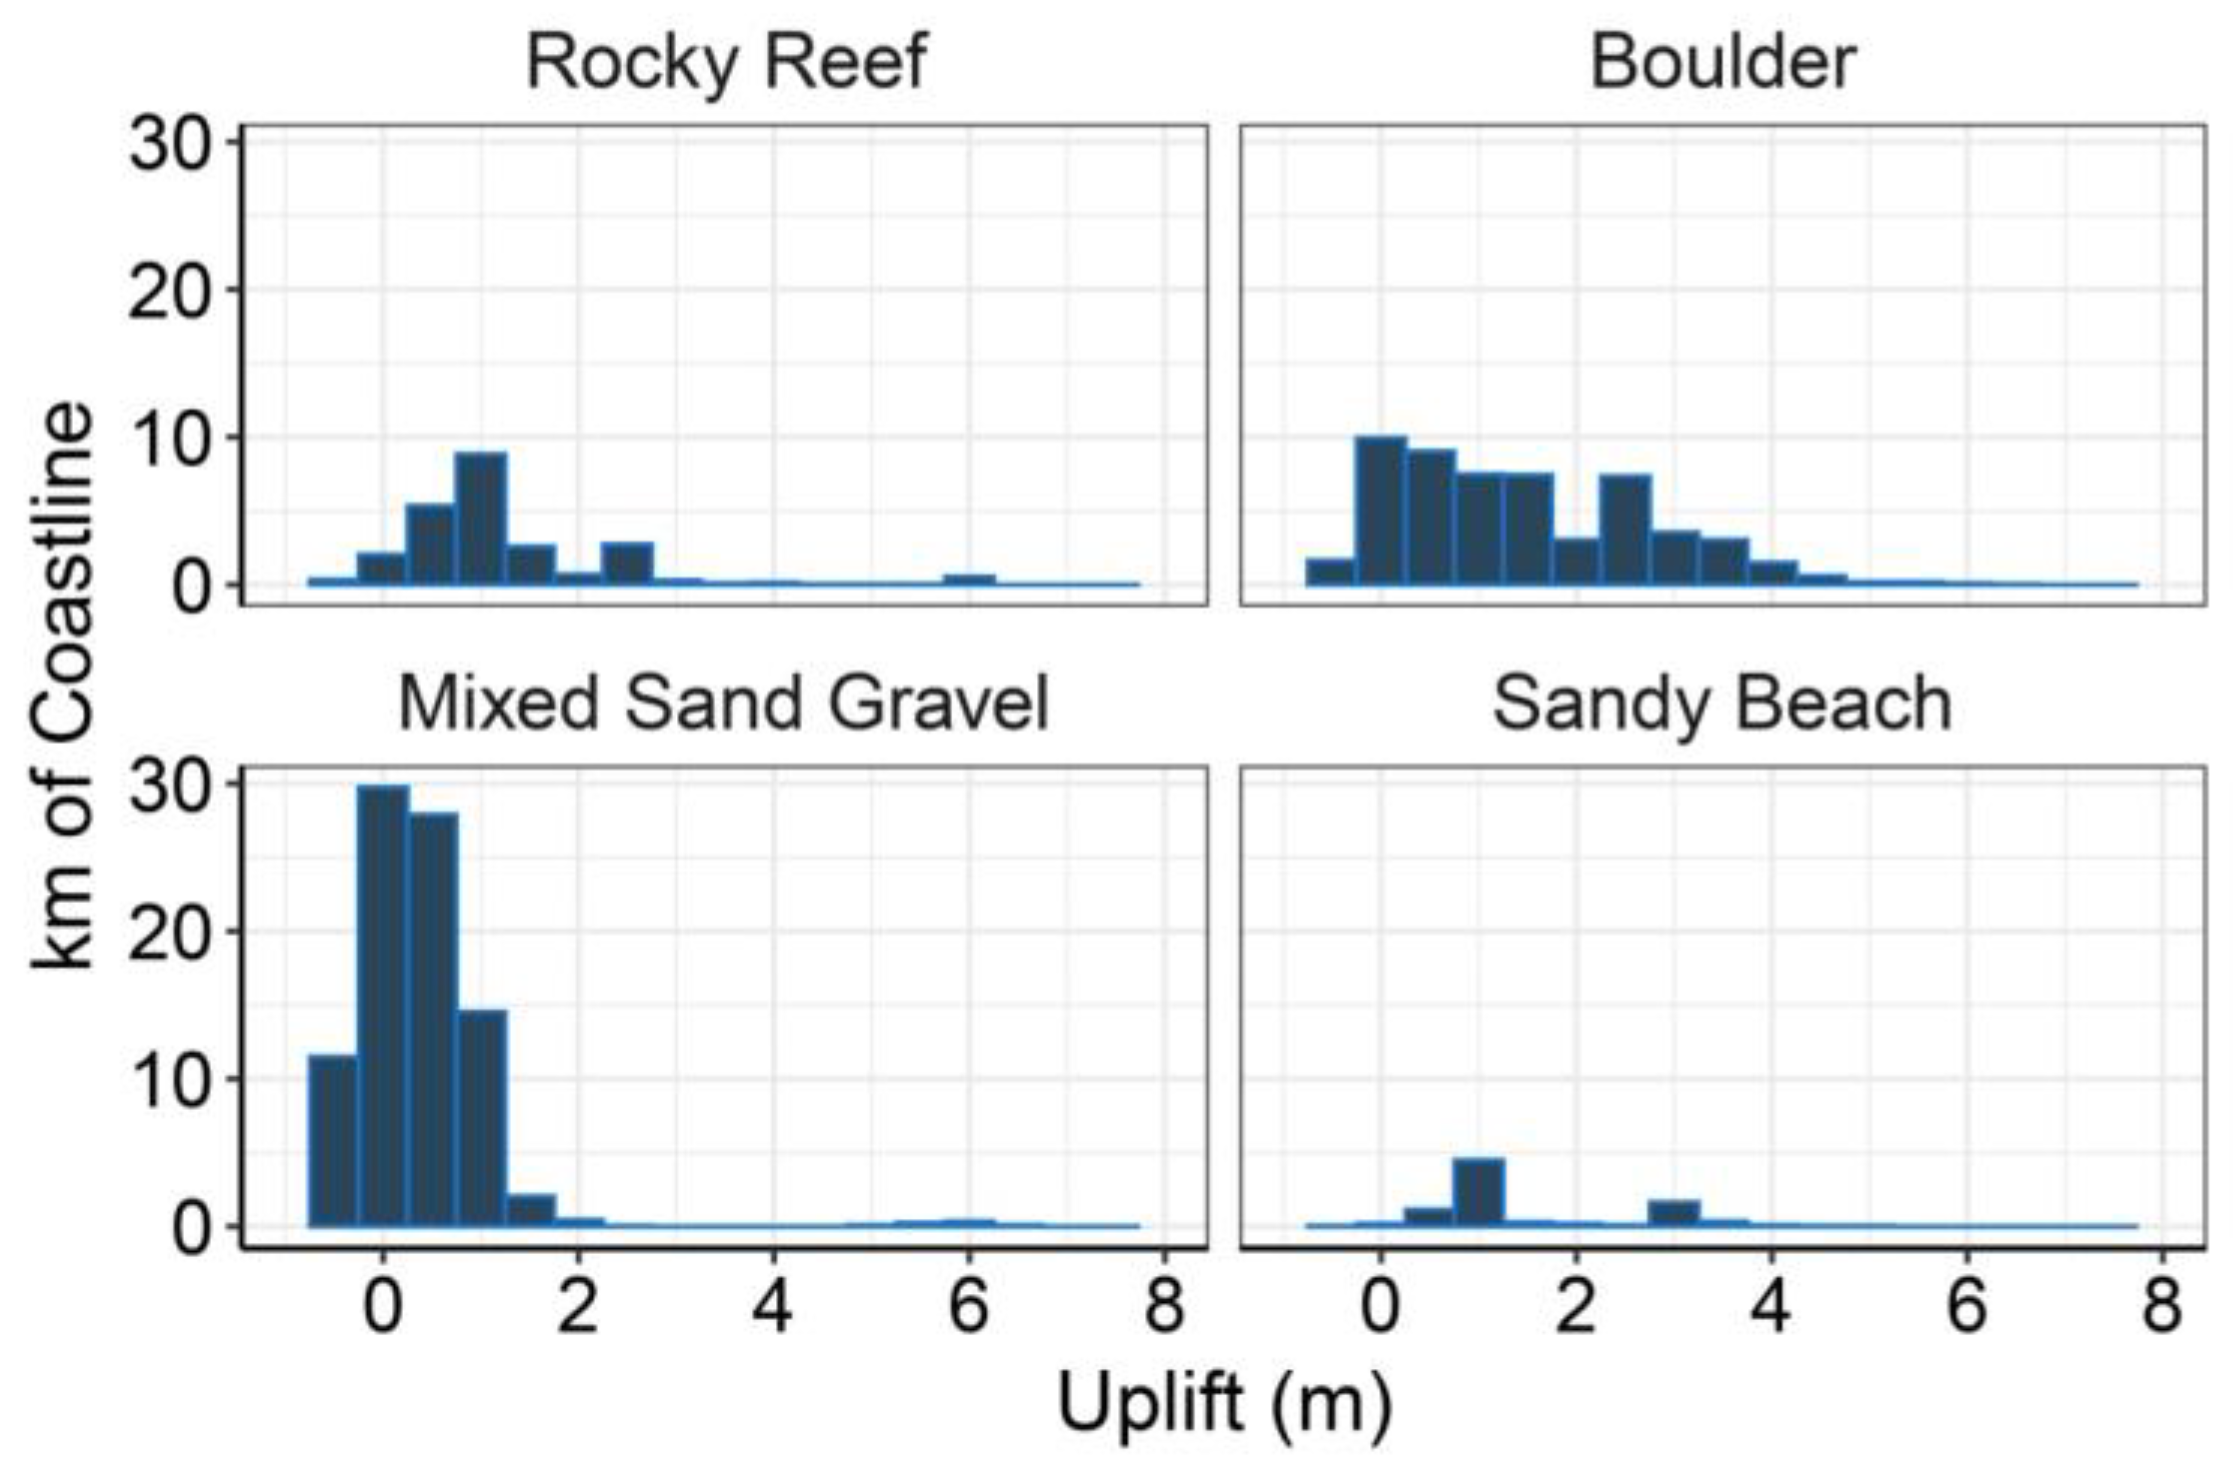
Ground-level changes were computed by differencing the DEMs after applying slope constraints (see below) and summarised using zonal analysis of returns within each of the analysis polygons. Vertical displacements recorded in national geodetic updates to the Land Information New Zealand (LINZ) survey benchmark network were also catalogued for comparison to the values obtained. To assess the interactions between vertical displacement and substrate, four substrate types (rocky reef, boulder, mixed sand–gravel and sandy beach) were mapped at the position of the new (post-quake) MHWS corresponding to the 0.5 m NZVD contour using 2018 aerial imagery and ground-truthing in the field. Each analysis window was classified according to substrate type in the adjacent coastal environment by intersecting the substrate map with its associated shore-perpendicular transect (Figure 2).

2.4. Tilt and Horizontal Displacement Effects

To test for tilt effects in the vicinity of the coast, three sets of analysis windows (each n = 2000) were constructed with different landward extents (50 m, 200 m and 500 m) oriented perpendicular to each 50 m segment of the baseline (Figure 2). Horizontal ground displacement effects that confound the measurement of vertical displacement using overlapping DEMs were controlled by restricting the analysis domain to nearly flat ground (Figure 3). Two separate slope thresholds (less than 2 and 5 degrees, respectively) were calculated by slope analysis of the DEMs and applied as masks to the differencing analysis.
Results from the above analyses were used to provide sensitivity tests of tilt and horizontal displacement effects on the vertical differencing assessment. One way ANOVAs were used to test for significant differences in vertical displacement for the independent variables of orthogonal distance from the coast (tilt effects) and slope constraints (horizontal displacement effects). Linear regressions were also used to further test for biases across the range of uplift values found within the sampling domain for each of the above comparisons.

2.5. Field Surveys

Quadrat-based field surveys were used to assess biological impacts within the intertidal area at 12 sites (Table 2). In these surveys, transects of 30–50 m were laid out horizontally along the shore at different tidal heights (see below) representing equivalent mid and low intertidal zones, respectively, and ten 1 m2 quadrats sampled from each zone and the percentage cover or abundance of key species recorded, including all visible algae and invertebrates. These sites were selected to provide both geographical coverage and representation of a range of uplift values across the extensive study area. Their locations also reflect a paired sampling strategy whereby six pairs of sites were located in areas of similar uplift. The most southern sites were located at Oaro, which had experienced negligible uplift and therefore functioned as a control (Table 2). The remaining sites included two sites at Omihi, four sites on Kaikōura Peninsula, and four sites in higher uplift zones in the north of the study area (Figure 1). All of these sites are rocky shorelines that were previously dominated by large brown algae with a similar composition of rocky reef substrate types (e.g., reef and boulder) in pre- and post-earthquake intertidal areas.
The first round of surveys was completed immediately after the earthquake and assessed the pre-earthquake intertidal zone in which the majority of species were still identifiable for at least two months after the earthquake before ‘burning off’ in the post-earthquake configurations. It is important to note that these initial surveys and selection of sites were completed in extremely arduous circumstances in a high-hazard environment with the sites being accessed by combinations of helicopter and on foot. Coastal roads were impassable due to massive landslides and ongoing rockfall hazard. The strategic priority for these surveys was obtaining quantitative data representative of pre-quake intertidal conditions from each general locality, followed by the establishment of additional study sites where possible. In three locations (Waipapa, Omihi and Sharks Tooth) only single sites could be surveyed, but these represent the only pre-quake information available (Table 2). Subsequent survey rounds were completed annually at all sites, and these sampled the new post-earthquake intertidal area. As a consequence of variable uplift, there is also variability in the degree of overlap between the intertidal zone in its pre- and post-earthquake configuration between sites. Due to variable mortality rates, species that persisted could be recorded in the post-quake survey areas albeit in a different region of the intertidal zone, and the overall composition of those zones was in a state of constant readjustment. To address these aspects, our analysis has a specific focus on the cover and abundance of key species in equivalent intertidal zones in their pre- and post-earthquake quake configurations. Post-quake data represent the mean values recorded across all quadrats for each of three surveys completed in the period 2017–2018, which are compared to their pre-quake equivalents. This provides the most intuitive and practical means for empirical evaluation of impacts that are attributable to the earthquake.
Cover changes in habitat-forming macroalgae were calculated in terms of percentage gain or loss in canopy cover from their pre-earthquake values. Data were collected for each species, but the major classes were grouped to give an assessment of major functional changes. In this assessment, our main focus was large brown algae that include the major habitat-forming foundation species of this coastal area. Large brown species consisted of fucoids, including the large southern bull kelp Durvillaea spp., the sea wrack Carpophyllum maschalocarpum, and Cystophora spp. in the low tidal zone and bladder alga Hormosira banksii that formed extensive beds in the mid-tidal zone of some sites. The high-tide zone has no large algae and was omitted from this analysis.
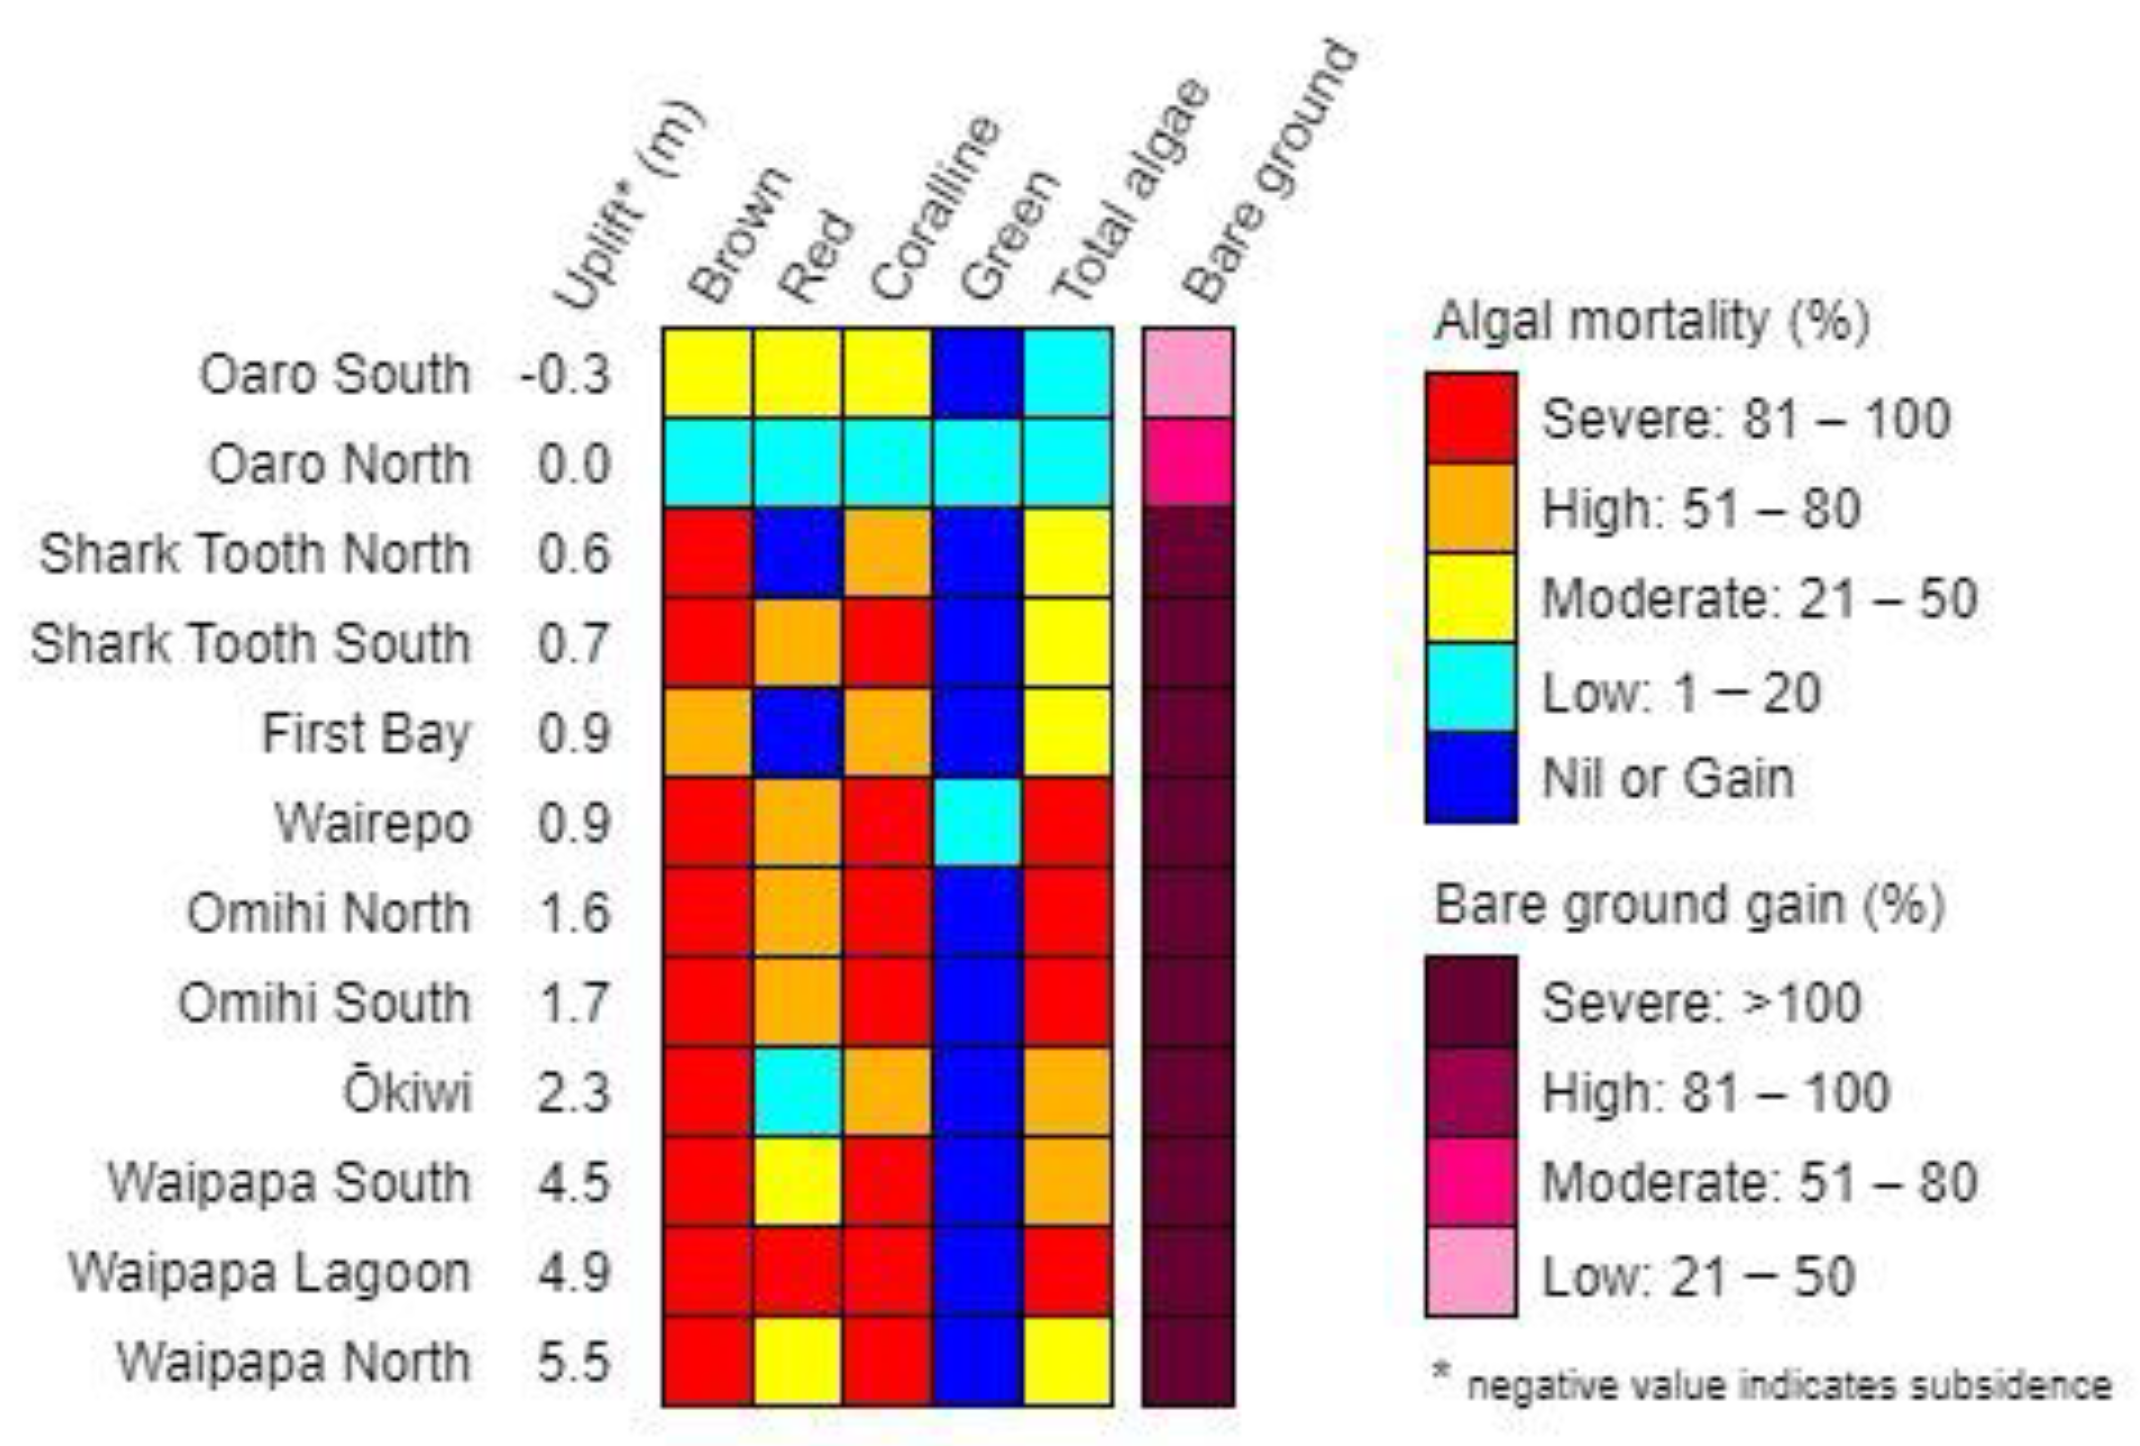
Earthquake impacts were classified as severe (>80% loss), high (51–80%), moderate (21–80%), or low (1–20%), and a fifth class (nil or gain) was used to show increases versus pre-quake values. Uplift values derived from the analysis window closest to the field survey site were used to identify relationships with biological impacts. The extent of major losses in habitat-forming algae across the whole coast was estimated by identifying the minimum relative sea-level change associated with high or severe impacts as observed at the field study sites. The length of coastline with relative sea-level changes exceeding this threshold was calculated at 50 m intervals for substrates supporting these communities (rocky reef and boulder) across the 100 km study area.

2.6. Assumptions and Limitations

Key assumptions in this approach include the representativeness of the pre-quake values obtained since they may be prone to confounding effects, such as seasonal fluctuations, that can affect estimates of ephemeral algal species, such as the green algae Ulva spp. These limitations are addressed by the use of the impact classification system that places the observed gains and losses into broad categories that summarise the predominant pattern. All of the pre-earthquake percentage cover scores were also checked against long-term records of similar quadrat-based surveys completed by our research group in the vicinity of the sites chosen for this assessment. At most sites these include multi-year studies using similar quadrat techniques and sampling arrangements [36]. It is important to note that the identification of appropriate control sites (Oaro North and South) required non-impacted locations close to the earthquake-affected area with similar substrate compositions and pre-quake taxa. As with other studies based on a Before-After-Control-Impact (BACI) approach, limitations of such control sites include their inability to provide true replicates of the treatment effect of interest (e.g., relative sea-level change). There remains some degree of variability between sites despite best efforts to control for this in the site selection process [43,44].

3. Results

3.1. Sensitivity Analyses

Tilt assessments showed that landward extension of the analysis windows had little effect on the uplift values obtained (Figure 4). Regressions of all combinations of analysis window size showed consistent results, with R2 values of 0.983, 0.982, and 0.996 for 50 m vs. 200 m, 50 m vs. 500 m, and 200 m vs. 500 m, respectively. One-way ANOVAs showed no significant difference between the uplift values obtained (F2,3987 = 0.022, p = 0.978). These results validated use of the finest-scale assessment window (50 × 50 m) for subsequent analyses. Sensitivity analyses for the control of horizontal displacement effects showed no significant difference between the two- and five-degree slope constraints for the 50 × 50 m analysis windows (one way ANOVA: F1,2652 = 0.001, p = 0.916). A regression of these results also showed a high correlation at all uplift values (R2 = 0.996, see Supplementary Material Figure S1).

3.2. Degree of Uplift

Assessment of the two post-quake time periods showed that the majority of vertical displacement was co-seismic and associated with the 16 November earthquake event (Figure 5A,B). Ground level displacements in the period between December 2016 and June 2018 were generally site-specific and lacking in distinct coast-wide trends. Field observations and aerial photography suggest that the ground-level differences between these LiDAR acquisition dates result primarily from erosion and accretion effects of erodable substrates. These include significant discharges of material from adjacent hill-country that was fuelled by numerous landslides along the coast and nearby mountain ranges. An uplift assessment using the most recent (post-quake) LiDAR data enabled the generation of a complete dataset for all sections of the 100 km study area (Figure 5C). Vertical displacement at the coastline varies from subsidence of nearly 2 m to uplift of over 7 m as measured within the 50 × 50 m analysis units. Several prominent spatial patterns are evident, with negligible uplift at Oaro situated at the south end of the study area, an area of very high uplift near Waipapa Bay and variable degrees of uplift elsewhere (Figure 5C).

3.3. Interaction between Uplift and Substrate Type

Substrate mapping showed that the length of coastline represented by substrate type was 14.7 km for rocky reef, 26.7 km for boulder fields, 54.3 km for mixed sand-gravel, and 4.4 km for sandy beaches. Evaluation of the interaction between these substrate types and vertical elevation change using the most recent data showed that the majority of boulder and rocky reef habitat was uplifted by various degrees in the 0–4 m range (Figure 6). A small section of rocky reef that was lifted c. 6 m can also be seen in this plot, which represents the high uplift area at Waipapa. Uplift also affected the mixed sand–gravel and sandy beach environments to various degrees. Modest degrees of subsidence affected small sections of coastline within all four of these substrate types, with most of these areas being located at the far north and south of the study area (as seen in Figure 5).

3.4. Ecological Impacts

Post-earthquake measurements show that algal mortality was severe (>80% loss) in at least one algal class at nine of the 12 study sites. High mortality (>50%) was absent at only two sites, both of which were located at Oaro and were the only study sites characterised by an absence of uplift, thereby functioning as controls. Vertical displacement at the field survey sites ranged from 0.3 m of subsidence at Oaro South to 5.5 m of uplift at Waipapa North based on the most recent data (Figure 7).
Large brown algae suffered the greatest mortality across all uplifted areas, regardless of degree of uplift. However, coralline algae also suffered high or severe mortality at all uplifted sites. These are low-stature base algae that form the primary cover of rocky substrates through much of the mid and low intertidal zones. Fleshy red algae showed highly variable site-specific contributions to post-quake cover, with some sites experiencing gains relative to pre-quake levels in the equivalent tidal zone and no obvious relationship to uplift overall (Figure 7). However, green algae increased at nearly all sites. Ephemeral species such as the sea lettuce Ulva bloomed extensively in the post-quake mid and low tidal zones, likely facilitated by the initial loss of competing algal species and the extensive mortality of intertidal grazers such as limpets and pāua (abalone) at uplifted sites, but also the extremely warm conditions that prevailed in the 2016–2017 summer. Bare ground increased at all sites from pre-earthquake values of 1–20%, consistent with the pattern of total algal cover change. At some sites including the controls at Oaro but notably at Waipapa lagoon, the increase in unvegetated substrate was partly due to sand and gravel deposition onto rocky shores.
Within the above overall pattern there were many site- and zone-specific nuances in terms of impacts across the coastline. For example, it was immediately apparent that large brown algae suffered high mortality at most sites, but these were not necessarily the same species. For example, the low zone of the highest uplift sites around Waipapa was mostly dominated by the large southern bull kelp, Durvillaea spp., prior to the earthquake, but this disappeared completely from these sites post-quake (Figure 8A). Red algal species comprise much of the diversity of this coastline. These expanded quickly in the low tidal zone, primarily because they can regenerate from remnant patches and also can reproduce, recruit and grow faster than most of the large brown algae that had died. Coralline algae are tough calcareous species that form an extensive primary cover of rock surfaces. As they desiccated and died, the soft sedimentary rocks they were on usually eroded rapidly and disintegrated [45], contributing to gravel deposition and sediment loads in nearshore waters along the coast (Figure 8B). Some of the worst affected areas include reefs on Kaikōura Peninsula such as Wairepo. This one of the longest studied coastal sites in New Zealand [39] and has an extensive intertidal platform. It was covered in the mid-tidal zone by the bladder alga Hormosira, which suffered severe mortality from reduced tidal inundation and increased temperatures despite the relatively small degree of uplift (Figure 8C,D).

3.5. Threshold Value for Relative Sea-Change Associated with High Mortality

These results show that uplift values of 0.6 m or higher were consistently associated with high mortality in habitat-forming brown algae and also coralline algae. Despite widespread increases in green algal cover and some increases in reds, the combined canopy cover of all algal classes was also reduced by nearly 50% or more at all uplifted sites. This equates to massive losses in biomass in equivalent tidal zones as a consequence of the earthquake and reflects both losses in pre-quake populations and the failure of compensatory recovery in the post-quake environment. It can be noted that the absence of study sites in the uplift range 0.1–0.5 m is a limitation for identifying the true ‘threshold’ value for relative sea-change associated with high mortality on rocky shores. Despite this, the empirical evidence strongly suggests that these effects occurred with uplift of 0.6 m or more, and this value is adopted to estimate the extent of high or severe mortality for the whole coast. Although we cannot fully answer the question of a potentially lower threshold, only a small proportion of the coastline experienced uplift in the 0.1–0.5 m range, and very little of this area has rocky reef or boulder substrata. Therefore, our estimate of the extent of impacts would be relatively unaffected by assuming a slightly lower threshold for relative sea-change.

3.6. Extent of Impacts across 100 km of Coast

Using a threshold value of 0.6 m, we estimate that high or severe mortality of habitat-forming species has occurred over 87% of the rocky reef and 72% of the boulder habitat in the study area. The length of coastline involved is 19.4 km for rocky reef and 12.9 km for boulder habitat. In combination, major impacts have affected over 30 km of coastline that previously supported highly productive and diverse marine communities in these intertidal habitats. Note that the coastline considered in these calculations includes the Oaro control sites and adjacent areas. Nearly all of the remaining coastline exceeded the 0.6 m threshold value for high or severe mortality in habitat-forming brown algae and coralline algae. Furthermore, there are also rocky coast areas at least 30 km to the north that are not represented in this study (due to lack of LIDAR surveys), which were similarly affected [31].

4. Discussion

This study illustrates important considerations and methodological solutions for producing reliable estimates of relative sea-level change at ecologically relevant scales across a large study area. Inherent in this are crucial decisions on the selection of data that best meet these objectives, which typically requires a compromise between the scale and extent of potentially useful data sources. In this case, the zonation pattern and topography of the intertidal zone drove the ecological components of interest for which a relatively fine scale (i.e., tens of metres) is needed to resolve physical environmental changes of consequence. In contrast, the size of the overall study area is huge in comparison because of the sheer extent of the natural disaster event. The need, therefore, is for data with high resolution and large spatial coverage, an ideal that is somewhat of a holy grail.
Along with other options for ground-level change analysis using satellite altimetry platforms [46], airborne LiDAR provides an attractive data acquisition solution because it can incorporate concurrent high resolution aerial imagery (e.g., 0.2 m resolution in this case). As exemplified here, this imagery can be very useful for identifying and delineating the position of mobile landforms such as rivermouths that are problematic for differencing analyses. While direct field observations are also important to gain an understanding of these features, the combined approach produces an efficient workflow for these manual tasks in the analysis. Other aspects of note in this study include the use of largely terrestrial data to estimate geographical changes in the nearby marine environment. The rationale for this approach relates to the advantages of LiDAR data in meeting sampling objectives (large spatial extent and high resolution), which are virtually impossible to reproduce at this scale using any other method. This exemplifies the challenges of geographical surveys of the coastal interface in which the study area is exposed to periodic inundation and where water depths are too shallow and wave-exposed for use of sonar survey platforms [47].
Our approach also exemplifies the use of sensitivity analyses as a tool for validating methodological solutions for potentially confounding factors. We applied a nearly flat-ground slope constraint to the differencing analysis, but we tested more than one slope threshold to verify its efficacy. The highly correlated results suggest that a slope constraint of 5 degrees is sufficient for these purposes in a relatively high relief study area, although this may differ in other analysis contexts due to other combinations of ground sampling dimensions and sampling window size. Reducing the slope threshold will generally reduce the number of data points available for the analysis. In our case, however, the 2-degree slope constraint did not result in the complete loss of data in any of the analysis windows, and the mean uplift values obtained were very similar (Supplementary Material Figure S1).
Sensitivity analyses were also used to test for tilt effects as a confounding factor in the direction of interest (perpendicular to the coastline). These analyses provided a very useful test of assumptions around the transferability of vertical displacement estimates to nearby locations across the shore profile, thereby addressing the main objective of supporting intertidal ecological sampling. Within the overall workflow, these tests complement, but cannot completely replace, the manual inspection of DEMs, differencing results and aerial imagery to detect geographical irregularities that influence the interpretation of results at key locations. This is exemplified by the block faulting effects on the Papatea Fault that are visible in all three of the above data sources, but could be easily missed without the benefit of field observations (Figure 8). In this case they directly affected our area of interest in the new intertidal zone configuration and required manually constrained sampling domains for the estimation of vertical displacement at those locations (Figure 2). Overall, these aspects show that the combined methodological approach of (a) using adjacent ‘terrestrial’ data to estimate large-scale change in the nearby intertidal zone, and (b) sensitivity analyses for confounding factors provides a computationally efficient approach for the estimation of vertical displacement and associated relative sea-level changes in a difficult sampling environment.

4.1. Contribution of Temporal Changes

Along with the above approaches for estimating co-seismic displacement effects on relative sea levels at intertidal locations, the potential for ongoing change must be addressed and considered. To provide an initial indication of potential changes at the whole-coast scale, we used the available LiDAR data to test for further post-seismic vertical displacement to 18 months post-earthquake, which is also an important time period in the context of disaster recovery. The decomposition of ground-level changes between the co-seismic and post-seismic periods showed that the majority of vertical displacement was associated with the 16 November earthquake event. This is consistent with other studies that have shown post-seismic afterslip effects associated with the Kaikōura earthquake [41,42], for which the main locations exhibiting vertical motion are located farther north (i.e., outside of our study area). Although there has been some degree of horizontal afterslip within our study area, these effects are largely obscured by the use of slope constraints in our analysis. Importantly, however, our results for the post-seismic period show there have been considerable gains and losses in ground elevation at numerous sites along the coastline, even though highly mobile landforms such as rivermouths and earthquake-damaged areas such as road corridors were removed from the analysis. These effects indicate the contribution of important ongoing topographical changes that involve both accretion and erosion. Both processes continue to affect the new intertidal zone in a highly variable manner.
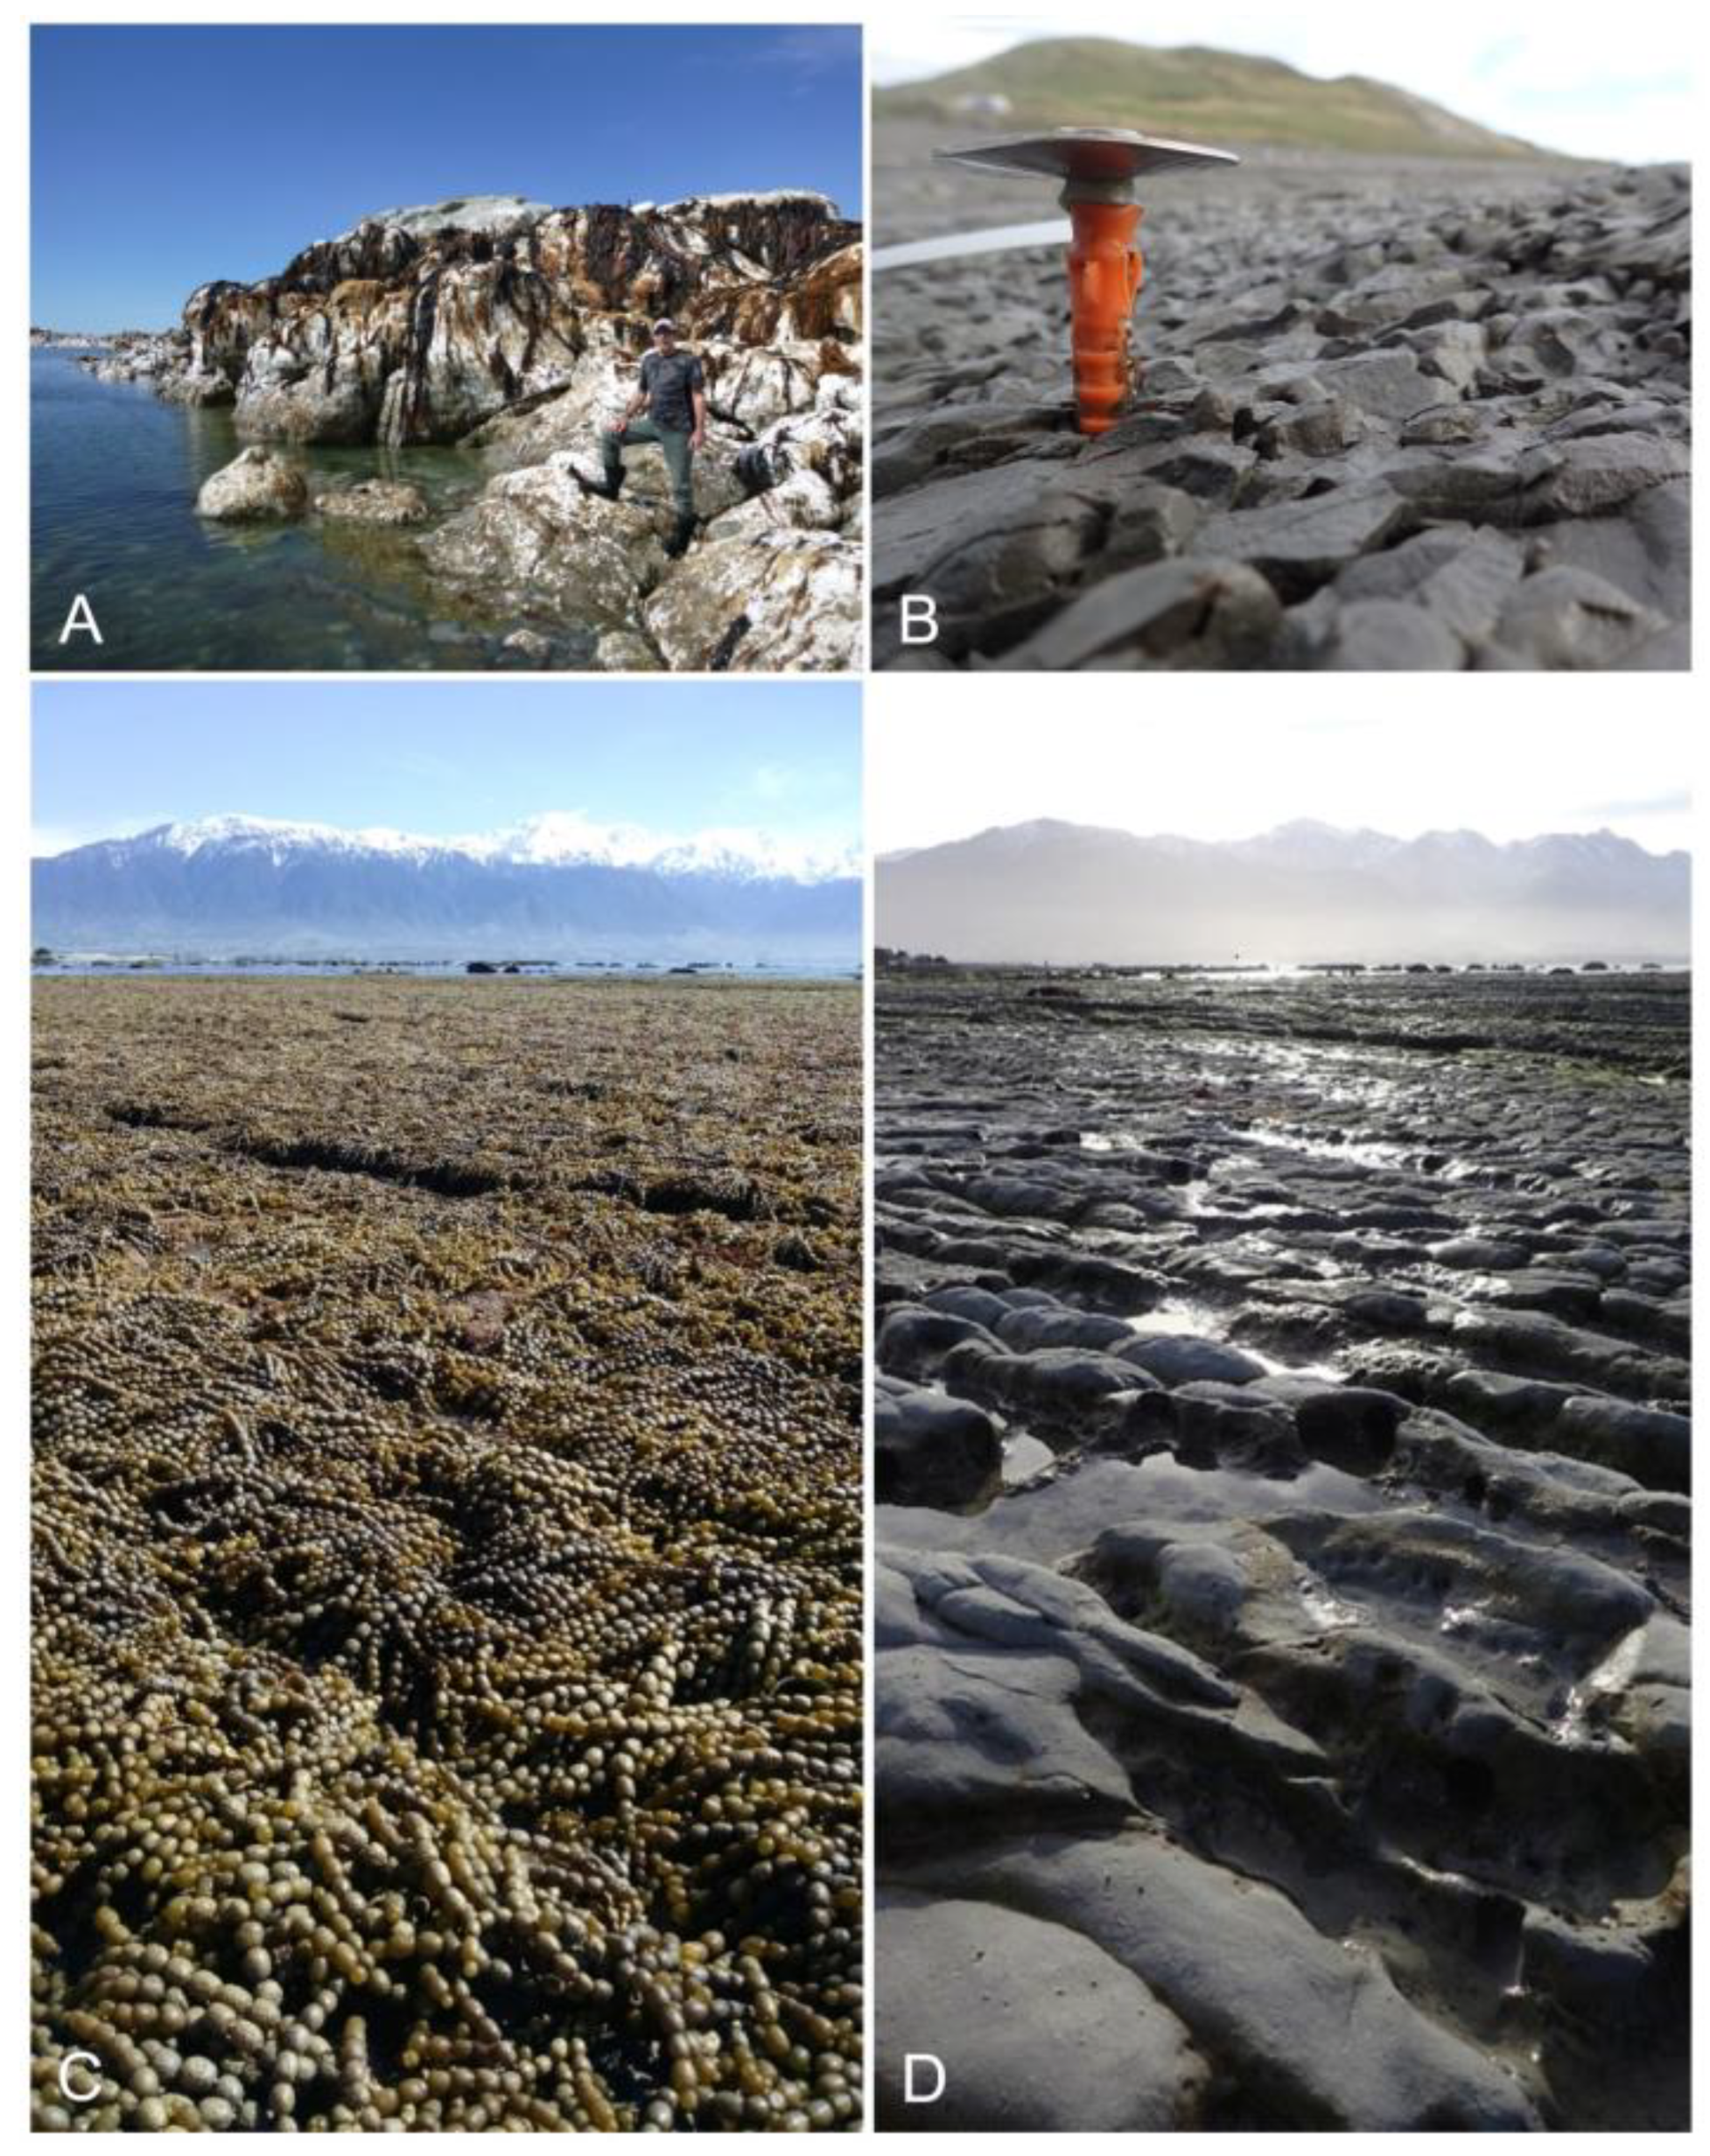
Field observations showed that these dynamics included extensive gravel depositions that covered areas of former reef and boulder fields at several locations. Additionally, many of these rocky areas are experiencing significant erosion from accelerated weathering in their uplifted positions, which is particularly prominent on mudstone platforms. At these sites, changes to the wetting and the additional drying time caused by uplift has exacerbated tension cracking, essentially shattering the upper few centimetres of the substrate surface. This shattered material is then quickly eroded away by wind and wave action, and is repeated in successful cycles. These reefs typically erode at 1–2 mm annually [45,48], but lost up to 30 mm within 6 months post-earthquake [31]. At many sites, these accelerated erosion effects have been ongoing since the initial uplift event, suggesting that they may continue until new wave-cut platforms have lowered sufficiently to provide wetting times that promote substrate stabilisation, consistent with established theory [49,50]. By extension, these same conditions may be required to support the eventual recovery of characteristic algal species at densities comparable to their former abundance because many of the rocky surfaces are too unstable for effective recruitment of large algae. Both of the above phenomena have obvious relevance for the re-establishment of biogenic algal cover and are significant additional stressors.

4.2. Impact Thresholds and Contributing Factors

Our analyses indicate that the threshold of major impacts is in the vicinity of a quarter of the tidal range (approximately 2 m) for the characteristic habitat-forming algal communities in this area. The four least-uplifted of our sampling sites outside of Oaro (which function as ‘control’ sites) provide a direct test of relative sea-level changes in the 0.6 m–0.9 m range. Changes in tidal cover at these sites were evidently beyond the adaptive threshold of the algal communities they previously supported, causing widespread mortality in the intertidal zone (Figure 8C,D). This interpretation is consistent with the general zonational pattern of these habitat-forming species. However, the empirical data also show that compensatory recovery has not occurred in the equivalent post-quake tidal zone and it is the combination of the two processes that are responsible for the net impact as assessed in this study. This finding is consistent with our central hypothesis in which a lag effect would occur in consideration of likely recruitment rates and that would manifest as net losses in the short term. However, the severity of these losses was even greater than expected. This primarily relates to conditions in the new post-quake intertidal area, in which only sparse habitat-forming algae were recorded and despite the fact that many individual algae were also uplifted into that zone from populations that were previously subtidal. This highlights the fragility of the post-quake environment and indicates the need for further research on the nature of contributing factors and potential timelines for appreciable recovery to occur.
Once populations of large algae are removed, recovery can be slow where reproductive adults become widely separated due to connectivity effects between suitable habitat for re-colonisation and the remaining recruitment sources [32]. A wide range of processes are likely hindering recovery in the post-earthquake landscape, including the now widely dispersed adult populations, the relatively short distance of propagule dispersal (usually only tens of meters), and limited ability of drifting detached reproductive algae to reach sites [37]. This emphasises the importance of the remaining remnant populations of reproductive adults. Our observations indicate that many of these individuals may have experienced, and may continue to be experiencing, heightened vulnerability due to interactions between relative sea-level changes and other processes. In particular, there is mounting evidence to suggest that previously stable subtidal substrates have become unstable and are now weathering faster as a consequence of vertical displacement into areas of higher wave energy. This hypothesis might explain the initial loss of algae affixed to such substrates that would otherwise appear to have remained with a suitable tidal zone for the species, and the same effects may be hindering the re-establishment of new recruits in these areas.

4.3. Stressors and Recovery Prospects

Related post-earthquake studies on the large southern bull kelp, Durvillaea spp., which occupies the intertidal–subtidal fringe on wave-exposed shores, show that it is particularly susceptible to desiccation with prolonged exposure, especially when wave splash is low and temperatures are high during low tide [51]. Other large brown algae such as Carpophyllum maschalocarpum and Cystophora spp. also occur in the lowest margins of the intertidal zone and typically die back to the lowest portion of the tidal zone if tides are exceptionally low, wave splash is small, and air temperatures are high. Losses were also observed in the formerly extensive mid-intertidal beds of the fucoid Hormosira. This is the most desiccation-tolerant of the fucoid species (the large brown algae of the intertidal zone) and typically recovers quickly [52], even after prolonged exposure at low tides. For example, the 0.9 m of uplift experienced by the Wairepo reef platform resulted in wetting times of 2–2.5 h of the 5 h of pre-earthquake daily high tide inundation in the semi-diurnal tidal cycle. Despite remaining within the tidal zone, desiccation stress from air temperatures often exceeding 40 °C above the reef surface and elevated water temperatures as tides covered the reefs to only shallow depths, proved too harsh for Hormosira to persist. In most places it died off over a period of 6 weeks post-earthquake. This species facilitates productivity and very high diversity by shading other species below its canopy, and its near-total loss was catastrophic for local diversity.
Interactions between the degree of uplift and topography of the shore platform are highlighted in the above processes and provide a further layer of complexity that underpins the pattern of loss. As the Hormosira example shows, relatively small changes in intertidal position can affect water temperatures and susceptibility to desiccation that may represent a tipping point leading to complete loss of the pre-existing population. Furthermore, these losses can involve extensive areas where the intertidal topography is relatively flat, as is a feature of many reef platforms on the Kaikōura coast. These topographical aspects are additional to the coastal erosion and deposition effects discussed above, which can also be catastrophic for both remnant algae of uplifted surfaces and newly established recruits. Fine silts are also abundant in the post-earthquake environment and add further stresses associated with the smothering of rocky substrates and occlusion of nearshore waters, leading to reduced light transmission and impacts on photosynthesis.

5. Conclusions

This work has been an important milestone in relating ecological damage along an extensive stretch of coastline to vertical displacement caused by one of the major seismic events in modern times. This is the first study to quantify relative sea-level changes at the position of the new intertidal environment and the first to estimate the extent of earthquake impacts on major habitat-forming algal species that are characteristic of the Kaikōura region. In doing so, we demonstrated a practical workflow for translating high-resolution data from nearby terrestrial areas to adjacent data-poor intertidal areas that includes sensitivity analyses to assess validity.
Our assessment of major impacts associated with the relative sea-level change reflects losses of habitat-forming macroalgae in the equivalent pre-quake and post-quake intertidal zones compounded by a lack of recruitment into the latter. Our whole-coast estimate of c. 90% mortality of large algae on a percentage cover basis provides some indication of the tenuous starting point upon which future recovery depends. The intensity and frequency of hydro-ecological changes and continuing interactions between stressors are key influences on recovery processes that will have legacy effects for many years to come in this coastal area, and similarly in other natural disaster contexts. Against this broad-scale backdrop it will be important to follow the fate of the remnant populations in addition to the establishment of new recruits. Both remain vulnerable to the effects of additional stressors, including those already observable and potentially for additional extreme events, particularly heat waves, in future years.

Supplementary Materials

The following are available online at https://0-www-mdpi-com.brum.beds.ac.uk/article/10.3390/geohazards2040016/s1, Figure S1: Regressions of uplift values for 2-degree and 5-degree slope constraints for the three analysis window sizes that differed in their landward dimension perpendicular to the coastline. Figure S2: Vertical displacement of the Kaikōura coast for the period July 2012–June 2018 within three analysis window sizes (50 × 50 m, 50 × 200 m, 50 × 500 m) differing in their landward dimension. These calculations used a 5-degree slope constraint to control for horizontal displacement effects. Figure S3: Density plot of the degree of uplift experienced within a classification of four substrate types found on the Kaikōura coast for the period July 2012–June 2018. Calculations used a 50 × 50 m analysis window and a 5-degree slope constraint to control for horizontal displacement effects. Table S1: Post-earthquake algal cover expressed as the percentage of pre-earthquake values for 12 sites on the Kaikōura coast. Data show the minimum values recorded over three post-quake sampling campaigns during the period to 18-months post-quake in which algal mortality was occurring at variable rates. The average percentage cover of four algal classes (brown, red, corallines, green) was recorded (species by species and then grouped) in 1 m2 quadrats sampled at random positions throughout the algal-dominated mid- and low intertidal zones. The total cover value can sum to > 100% due to layering and overlapping of algal species.

Author Contributions

Conceptualization, S.O., D.R.S.; methodology, S.O., D.R.S.; formal analysis, S.O., H.S.F., D.R.S.; investigation, S.O., T.A., S.G., R.D.; resources, D.R.S.; data curation, S.O., H.S.F.; writing—original draft preparation, S.O.; writing—review and editing, S.O., D.R.S.; visualization, S.O., H.S.F.; funding acquisition, S.O., D.R.S. All authors have read and agreed to the published version of the manuscript.

Funding

This research was funded by the Ministry of Business Innovation and Employment (MBIE) Endeavour Fund (UOCX1704), with additional support from the Ministry for Primary Industries (MPI) (KAI2016-05) and the Sustainable Seas National Science Challenge (UOA20203).

Institutional Review Board Statement

Ethical review was not required for this study.

Informed Consent Statement

Not applicable.

Data Availability Statement

Data are contained within the article or supplementary material. LiDAR datasets are available from Land Information New Zealand or the commissioning agency (Table 1).

Acknowledgments

We thank our funders, and staff at the University of Canterbury, particularly Ian Wright and Sharyn Goldstein, and others at the National Institute of Water and Atmospheric Research (NIWA) for assisting with initial post-disaster survey work and gaining access to sites. Thanks to Stephanie Mangan, Thomas Falconer, Dave Taylor and Paul South for assisting with field surveys or data preparation, and John Pirker for iwi liaison in support of this work.

Conflicts of Interest

The authors declare no conflict of interest. The sponsors had no role in the design, execution, interpretation, or writing of the study.

References

  1. Cahoon, D.R. Estimating relative sea-level rise and submergence potential at a coastal wetland. Estuaries Coasts 2015, 38, 1077–1084. [Google Scholar] [CrossRef] [Green Version]
  2. Orchard, S.; Hughey, K.F.D.; Measures, R.; Schiel, D.R. Coastal tectonics and habitat squeeze: Response of a tidal lagoon to co-seismic sea-level change. Nat. Hazards 2020, 103, 3609–3631. [Google Scholar] [CrossRef]
  3. Shugar, D.H.; Walker, I.J.; Lian, O.B.; Eamer, J.B.R.; Neudorf, C.; McLaren, D.; Fedje, D. Post-glacial sea-level change along the Pacific coast of North America. Quat. Sci. Rev. 2014, 97, 170–192. [Google Scholar] [CrossRef]
  4. Stammer, D.; Cazenave, A.; Ponte, R.M.; Tamisiea, M.E. Causes for contemporary regional sea level changes. Annu. Rev. Mar. Sci. 2013, 5, 21–46. [Google Scholar] [CrossRef] [PubMed] [Green Version]
  5. Cahoon, D.R.; Reed, D.J.; Day, J.W. Estimating shallow subsidence in microtidal salt marshes of the southeastern United States: Kaye and Barghoorn revisited. Mar. Geol. 1995, 128, 1–9. [Google Scholar] [CrossRef]
  6. Rybczyk, J.M.; Cahoon, D.R. Estimating the potential for submergence for two wetlands in the Mississippi River Delta. Estuaries 2002, 25, 985–998. [Google Scholar] [CrossRef]
  7. Woodroffe, C.D.; Rogers, K.; McKee, K.L.; Lovelock, C.E.; Mendelssohn, I.A.; Saintilan, N. Mangrove sedimentation and response to relative sea-level rise. Annu. Rev. Mar. Sci. 2016, 8, 243–266. [Google Scholar] [CrossRef] [Green Version]
  8. Berkes, F.; Colding, J.; Folke, C. Navigating Social-Ecological Systems: Building Resilience for Complexity and Change; Cambridge University Press: Cambridge, UK; New York, NY, USA, 2003. [Google Scholar]
  9. Holling, C.S. Resilience and stability of ecological systems. Annu. Rev. Ecol. Syst. 1973, 4, 1–23. [Google Scholar] [CrossRef] [Green Version]
  10. Martinez, M.L.; Taramelli, A.; Silva, R. Resistance and resilience: Facing the multidimensional challenges in coastal areas. J. Coast. Res. 2017, 77, 1–6. [Google Scholar] [CrossRef]
  11. Bilek, S.L.; Lay, T. Subduction zone megathrust earthquakes. Geosphere 2018, 14, 1468–1500. [Google Scholar] [CrossRef] [Green Version]
  12. Orchard, S.; Schiel, D.R. Enabling nature-based solutions to climate change on a peri-urban sandspit in Christchurch, New Zealand. Reg. Environ. Chang. 2021, 21, 66. [Google Scholar] [CrossRef]
  13. Saunders, M.I.; Albert, S.; Roelfsema, C.M.; Leon, J.X.; Woodroffe, C.D.; Phinn, S.R.; Mumby, P.J. Tectonic subsidence provides insight into possible coral reef futures under rapid sea-level rise. Coral Reefs 2016, 35, 155–167. [Google Scholar] [CrossRef]
  14. Church, J.A.; Clark, P.U.; Cazenave, A.; Gregory, J.M.; Jevrejeva, S.; Levermann, A.; Merrifield, M.A.; Milne, G.A.; Nerem, R.S.; Nunn, P.D.; et al. Sea level change. In Climate Change 2013: The Physical Science Basis. Contribution of Working Group to the Fifth Assessment Report of the Intergovernmental Panel on Climate Change; Stocker, T.F., Qin, D., Plattner, G.-K., Tignor, M., Allen, S.K., Boschung, J., Nauels, A., Xia, Y., Bex, V., Midgley, P.M., Eds.; Cambridge University Press: Cambridge, UK; New York, NY, USA, 2013. [Google Scholar]
  15. Nicholls, R.J.; Cazenave, A. Sea-level rise and its impact on coastal zones. Science 2010, 328, 1517–1520. [Google Scholar] [CrossRef]
  16. Simms, A.R.; Anderson, J.B.; DeWitt, R.; Lambeck, K.; Purcell, A. Quantifying rates of coastal subsidence since the last interglacial and the role of sediment loading. Glob. Planet. Chang. 2013, 111, 296–308. [Google Scholar] [CrossRef]
  17. Albert, S.; Saunders, M.I.; Roelfsema, C.M.; Leon, J.X.; Johnstone, E.; Mackenzie, J.R.; Hoegh-Guldberg, O.; Grinham, A.R.; Phinn, S.R.; Duke, N.C.; et al. Winners and losers as mangrove, coral and seagrass ecosystems respond to sea-level rise in Solomon Islands. Environ. Res. Lett. 2017, 12, 94009. [Google Scholar] [CrossRef]
  18. Quigley, M.C.; Hughes, M.W.; Bradley, B.A.; van Ballegooy, S.; Reid, C.; Morgenroth, J.; Horton, T.; Duffy, B.; Pettinga, J.R. The 2010–2011 Canterbury Earthquake Sequence: Environmental effects, seismic triggering thresholds and geologic legacy. Tectonophysics 2016, 672–673, 228–274. [Google Scholar] [CrossRef] [Green Version]
  19. Hughes, M.W.; Quigley, M.C.; van Ballegooy, S.; Deam, B.L.; Bradley, B.A.; Hart, D.E.; Measures, R. The sinking city: Earthquakes increase flood hazard in Christchurch, New Zealand. GSA Today 2015, 25, 4–10. [Google Scholar] [CrossRef]
  20. Orchard, S. Floodplain Restoration principles for the Avon-Ōtākaro Red Zone: Case Studies and Recommendations; Avon Ōtākaro Network (Publisher): Christchurch, New Zealand, 2017; p. 40. [Google Scholar]
  21. Potter, S.H.; Becker, J.S.; Johnston, D.M.; Rossiter, K.P. An overview of the impacts of the 2010–2011 Canterbury earthquakes. Int. J. Disaster Risk Reduct. 2015, 14, 6–14. [Google Scholar] [CrossRef] [Green Version]
  22. Orchard, S.; Hughey, K.F.D.; Schiel, D.R. Risk factors for the conservation of saltmarsh vegetation and blue carbon revealed by earthquake-induced sea-level rise. Sci. Total Environ. 2020, 746, 141241. [Google Scholar] [CrossRef]
  23. Orchard, S.; Hickford, M.J.H. Protected Area Effectiveness for Fish Spawning Habitat in Relation to Earthquake-Induced Landscape Change. In Sustainable Bioresource Management: Climate Change Mitigation and Natural Resource Conservation; Maiti, R., Rodríguez, H.G., Kumari, C.A., Mandal, D., Sarkar, N.C., Eds.; Apple Academic Press: Waretown, NJ, USA, 2020; p. 526. Available online: https://www.routledge.com/Sustainable-Bioresource-Management-Climate-Change-Mitigation-and-Natural/Maiti-Gonzalez-Rodriguez-Kumari-Mandal/p/book/9780429284229 (accessed on 1 September 2021).
  24. Orchard, S.; Hickford, M.J.H.; Schiel, D.R. Earthquake-induced habitat migration in a riparian spawning fish has implications for conservation management. Aquat. Conserv. Mar. Freshwat. Ecosyst. 2018, 28, 702–712. [Google Scholar] [CrossRef]
  25. Jaramillo, E.; Dugan, J.E.; Hubbard, D.M.; Melnick, D.; Manzano, M.; Duarte, C.; Campos, C.; Sanchez, R. Ecological implications of extreme events: Footprints of the 2010 earthquake along the Chilean coast. PLoS ONE 2012, 7, e35348. [Google Scholar] [CrossRef] [Green Version]
  26. Rodil, I.F.; Jaramillo, E.; Hubbard, D.M.; Dugan, J.E.; Melnick, D.; Velasquez, C. Responses of dune plant communities to continental uplift from a major earthquake: Sudden releases from coastal squeeze. PLoS ONE 2015, 10, e0124334. [Google Scholar] [CrossRef]
  27. Holden, C.; Kaneko, Y.; D’Anastasio, E.; Benites, R.; Fry, B.; Hamling, I.J. The 2016 Kaikōura Earthquake revealed by kinematic source inversion and seismic wavefield simulations: Slow rupture propagation on a geometrically complex crustal fault network. Geophys. Res. Lett. 2017, 44, 11320–11328. [Google Scholar] [CrossRef]
  28. Xu, W.; Feng, G.; Meng, L.; Zhang, A.; Ampuero, J.P.; Bürgmann, R.; Fang, L. Transpressional rupture cascade of the 2016 Mw 7.8 Kaikoura Earthquake, New Zealand. J. Geophys. Res. Solid Earth 2018, 123, 2396–2409. [Google Scholar] [CrossRef]
  29. Hamling, I.J.; Hreinsdóttir, S.; Clark, K.; Elliott, J.; Liang, C.; Fielding, E.; Litchfield, N.; Villamor, P.; Wallace, L.; Wright, T.J.; et al. Complex multifault rupture during the 2016 Mw 7.8 Kaikoura earthquake, New Zealand. Science 2017, 356, eaam719. [Google Scholar] [CrossRef] [PubMed] [Green Version]
  30. Clark, K.J.; Nissen, E.K.; Howarth, J.D.; Hamling, I.J.; Mountjoy, J.J.; Ries, W.F.; Jones, K.; Goldstien, S.; Cochran, U.A.; Villamor, P.; et al. Highly variable coastal deformation in the 2016 MW7.8 Kaikōura earthquake reflects rupture complexity along a transpressional plate boundary. Earth Planet. Sci. Lett. 2017, 474, 334–344. [Google Scholar] [CrossRef]
  31. Alestra, T.; Gerrity, S.; Dunmore, R.A.; Crossett, D.; Orchard, S.; Schiel, D.R. Rocky Reef Impacts of the 2016 Kaikōura Earthquake: Extended Monitoring of Nearshore Habitats and Communities to 3.5 Years. New Zealand Aquatic Environment and Biodiversity Report No. 253; Ministry for Primary Industries: Wellington, New Zealand, 2021; p. 46.
  32. Schiel, D.R.; Alestra, T.; Gerrity, S.; Orchard, S.; Dunmore, R.; Pirker, J.; Lilley, S.; Tait, L.; Hickford, M.; Thomsen, M. The Kaikōura earthquake in southern New Zealand: Loss of connectivity of marine communities and the necessity of a cross-ecosystem perspective. Aquat. Conserv. Mar. Freshwat. Ecosyst. 2019, 29, 1520–1534. [Google Scholar] [CrossRef]
  33. Tait, L.W.; Orchard, S.; Schiel, D.R. Missing the forest and the trees: Utility, limits and caveats for drone imaging of coastal marine ecosystems. Remote. Sens. 2021, 13, 3136. [Google Scholar] [CrossRef]
  34. Gerrity, S.; Alestra, T.; Fischman, H.S.; Schiel, D.R. Earthquake effects on abalone habitats and populations in southern New Zealand. Mar. Ecol. Prog. Ser. 2020, 656, 153–161. [Google Scholar] [CrossRef]
  35. Orchard, S.; Falconer, T.; Fischman, H.; Schiel, D.R. Beach Dynamics and Recreational Access Changes on an Earthquake-Uplifted Coast; Marlborough District Council: Blenheim, New Zealand, 2020; p. 42. Available online: https://hdl.handle.net/10092/101043 (accessed on 1 September 2021).
  36. Schiel, D.R. Biogeographic patterns and long-term changes on New Zealand coastal reefs: Non-trophic cascades from diffuse and local impacts. J. Exp. Mar. Biol. Ecol. 2011, 400, 33–51. [Google Scholar] [CrossRef]
  37. Hawes, N.A.; Taylor, D.I.; Schiel, D.R. Transport of drifting fucoid algae: Nearshore transport and potential for long distance dispersal. J. Exp. Mar. Biol. Ecol. 2017, 490, 34–41. [Google Scholar] [CrossRef]
  38. Schiel, D.R.; Foster, M.S. The population biology of large brown seaweeds: Ecological consequences of multiphase life histories in dynamic coastal environments. Annu. Rev. Ecol. Evol. Syst. 2006, 37, 343–372. [Google Scholar] [CrossRef] [Green Version]
  39. Lilley, S.A.; Schiel, D.R. Community effects following the deletion of a habitat-forming alga from rocky marine shores. Oecologia 2006, 148, 672–681. [Google Scholar] [CrossRef] [PubMed]
  40. Hamling, I.J.; D’Anastasio, E.; Wallace, L.M.; Ellis, S.; Motagh, M.; Samsonov, S.; Palmer, N.; Hreinsdóttir, S. Crustal deformation and stress transfer during a propagating earthquake sequence: The 2013 Cook Strait sequence, central New Zealand. J. Geophys. Res. Solid Earth 2014, 119, 6080–6092. [Google Scholar] [CrossRef] [Green Version]
  41. Jiang, Z.; Huang, D.; Yuan, L.; Hassan, A.; Zhang, L.; Yang, Z. Coseismic and postseismic deformation associated with the 2016 Mw 7.8 Kaikoura earthquake, New Zealand: Fault movement investigation and seismic hazard analysis. Earth Planets Space 2018, 70, 1–14. [Google Scholar] [CrossRef] [Green Version]
  42. Wallace, L.M.; Hreinsdóttir, S.; Ellis, S.; Hamling, I.; D’Anastasio, E.; Denys, P. Triggered slow slip and afterslip on the Southern Hikurangi Subduction Zone following the Kaikōura Earthquake. Geophys. Res. Lett. 2018, 45, 4710–4718. [Google Scholar] [CrossRef]
  43. Stewart-Oaten, A.; Murdoch, W.W.; Parker, K.R. Environmental Impact Assessment: “Pseudoreplication” in Time? Ecology 1986, 67, 929–940. [Google Scholar] [CrossRef]
  44. Underwood, A.J. Beyond BACI: The detection of environmental impacts on populations in the real, but variable, world. J. Exp. Mar. Biol. Ecol. 1992, 161, 145–178. [Google Scholar] [CrossRef]
  45. Stephenson, W.J.; Kirk, R.M. Rates and patterns of erosion on inter-tidal shore platforms, Kaikoura Peninsula, South Island, New Zealand. Earth Surf. Process. Landf. 1998, 23, 1071–1085. [Google Scholar] [CrossRef]
  46. Fu, L.-L.; Cazenave, A. Satellite Altimetry and Earth Sciences; Academic Press: Cambridge, MA, USA, 2001; p. 463. [Google Scholar]
  47. Mayer, L.A. Frontiers in seafloor mapping and visualization. Mar. Geophys. Res. 2006, 27, 7–17. [Google Scholar] [CrossRef]
  48. Stephenson, W.J.; Kirk, R.M.; Hemmingsen, M.A. Forty three years of micro-erosion meter monitoring of erosion rates on shore platforms at Kaikōura Peninsula, South Island, New Zealand. Geomorphology 2019, 344, 1–9. [Google Scholar] [CrossRef]
  49. Edwards, A.B. Wave action in shore platform formation. Geol. Mag. 2009, 88, 41–49. [Google Scholar] [CrossRef]
  50. Stephenson, W.J.; Kirk, R.M. Development of shore platforms on Kaikoura Peninsula, South Island, New Zealand: II: The role of subaerial weathering. Geomorphology 2000, 32, 43–56. [Google Scholar] [CrossRef] [Green Version]
  51. Thomsen, M.S.; Mondardini, L.; Thoral, F.; Gerber, D.; Montie, S.; South, P.M.; Schiel, D.R. Cascading impacts of earthquakes and extreme heatwaves have destroyed populations of an iconic marine foundation species. Divers. Distrib. 2021, 00, 1–15. [Google Scholar]
  52. Brown, M.T. Effects of desiccation on photosynthesis of intertidal algae from a southern New Zealand shore. Bot. Mar. 1987, 30, 121–128. [Google Scholar] [CrossRef]
Figure 1. Location of the study area on the east coast of the South Island of New Zealand.
Geohazards 02 00016 g001
Figure 2. (A) Sampling setup for differencing analysis of 1 × 1 m digital elevation models derived from LiDAR data showing sampling origin points at 50 m spacing on an assessment baseline located at the approximate position of the pre-earthquake mean high water springs. 50 × 50 m analysis windows landward of this line are within the spatial extent of all LiDAR datasets. Shore-perpendicular transects extending seaward were used to associate each analysis window with the dominant substrate type in the adjacent intertidal area. Two of the field survey sites (Waipapa North and Waipapa Lagoon) are located in the inset. (B) Manually constrained analysis windows used to assess uplift at the Waipapa sites where block-faulting uplifted intertidal areas higher than was recorded in the analysis windows to landward on the assessment baseline. The underlying image is a difference model with the same uplift scale as (A) for the pre-quake—immediate post-quake period.
Geohazards 02 00016 g002
Figure 3. Workflow for differencing analyses. (A) Aerial image captured concurrent with LiDAR data showing examples of surface deformation features associated with the earthquake. The acquisition date was November 2016 (immediate post-quake). (B) 1 × 1 m digital elevation model constructed from LiDAR data at the same date. (C) Example of slope mask used to constrain the analysis domain to slopes <5 degrees. (D) Example of differencing result for July 2012 and December 2016 ground heights, with the former subtracted from the latter.
Geohazards 02 00016 g003
Figure 4. Regressions of uplift values obtained from all combinations of the three analysis window sizes (50 × 50 m, 50 × 200 m, 50 × 500 m) that differ in their landward dimension perpendicular to the coastline.
Geohazards 02 00016 g004
Figure 5. Vertical displacement of the Kaikōura coast calculated for two time periods (A) 2012–2016 and (B) 2012–2018 using independent differencing analyses and a 5-degree slope constraint to control for horizontal displacement effects. The LiDAR datasets have comparable resolution but slightly different coverage. The gap in coverage at c. 35 km on the X axis is the Kaikōura Peninsula. This area was outside of the LiDAR acquisition extent in the immediate post-quake dataset (December 2016), but was included in the June 2018 acquisition, enabling the analysis of 2012 to 2018 ground-level changes for the entire study area. (C) Estimated vertical displacement of the entire coastline between July 2012 and June 2018. Vertical displacements recorded in national geodetic updates to the Land Information New Zealand (LINZ) survey benchmark network to November 2018 are also shown for comparison.
Geohazards 02 00016 g005
Figure 6. Histograms of the degree of uplift experienced within a classification of four substrate types found on the Kaikōura coast for the period July 2012–June 2018. Calculations used a 50 × 50 m analysis window and a 5-degree slope constraint to control for horizontal displacement effects.
Geohazards 02 00016 g006
Figure 7. Summary of earthquake-induced mortality by major intertidal taxa and associated bare ground changes for 12 sites that experienced various degrees of uplift on the Kaikōura coast. Colours represent the severity of changes in percentage cover from pre-earthquake values as measured in post-earthquake field surveys within the equivalent intertidal zone with the highest severity recorded over three surveys presented here.
Geohazards 02 00016 g007
Figure 8. Impacts of uplift on the Kaikōura coast. (A) Waipapa Lagoon site on high tide in the post-quake landscape. Dead and dying bull kelp (Durvillaea spp.) and other brown seaweeds can be seen. The pre-quake high tide mark is at the top of the large rocks, a displacement of nearly 5 m. (B) Reef erosion at Wairepo six months after the earthquake. The washer was flush with the rock surface when installed immediately post-quake. (C,D) A graphic illustration of the severity of impacts on habitat-forming algae at Wairepo. Despite experiencing only modest uplift, nearly all seaweeds including Hormosira (in foreground) perished soon after the earthquake.
Geohazards 02 00016 g008
Table 1. LiDAR data specifications.
Timing in
Earthquake
Sequence
LiDAR Acquisition
Date
SupplierCommissioning AgencyAccuracy
Specification (m)
VerticalHorizontal
pre-earthquakeJul 2012Aerial Surveys Ltd.Environment Canterburyunknown unknown
immediate post-quakeNov 2016AAM NZ Ltd.New Zealand Transport Agency±0.10±0.50
Immediate post-quakeDec 2016–Jan 2017New Zealand Aerial MappingLand Information New Zealand±0.10±0.50
18 months post-quakeJun 2018AAM NZ Ltd.Land Information New Zealand±0.10±0.50
2012 LiDAR data were originally provided in New Zealand Vertical Datum (NZVD) 2009 but were reprocessed by Aerial Surveys Ltd. to NZVD2016 and subjected to control checks.
Table 2. Characteristics of study sites showing their pre-earthquake algal cover. The mean percentage cover of four algal classes (brown, red, corallines, green) was recorded (species by species and then grouped) in 1 m2 quadrats sampled at random positions throughout the algal-dominated mid and low intertidal zones. The total cover value can sum to > 100% due to layering and overlapping of algal species.
SiteCoordinates (WGS84)Pre-Earthquake Mean Percentage Cover (%)
XYBrownRedCorallineGreenTotal AlgaeBare Ground
Oaro South173.5054366−42.52263674026632.113114
Oaro North173.5080324−42.51651834428556.813416
Shark Tooth North *173.6914398−42.4356525224.7530.58020
Shark Tooth South173.690683−42.4328186224.7530.58020
First Bay173.7159516−42.4251374663.6780.11487
Wairepo173.7119037−42.4200986562.2390.0973
Omihi North173.5250354−42.48859514111710.11237
Omihi South *173.5225126−42.49268154111710.11237
Ōkiwi North173.8709615−42.2174891778.9600.31471
Waipapa South *173.877159−42.20961434915730.313810
Waipapa Lagoon173.8775657−42.20451484915730.313810
Waipapa North *173.8779818−42.20323214915730.313810
* algal cover estimated from nearby sites.
Publisher’s Note: MDPI stays neutral with regard to jurisdictional claims in published maps and institutional affiliations.

