
IoT Traffic: Modeling and Measurement Experiments


1
Graduate School of Engineering and Science, Shibaura Institute of Technology, Tokyo 135-8548, Japan
2
School of Information and Communication Technology, Hanoi University of Science and Technology, Hanoi 100000, Vietnam
*
Author to whom correspondence should be addressed.
IoT 2021, 2(1), 140-162; https://0-doi-org.brum.beds.ac.uk/10.3390/iot2010008
Submission received: 21 January 2021
/
Revised: 15 February 2021
/
Accepted: 20 February 2021
/
Published: 26 February 2021
Abstract
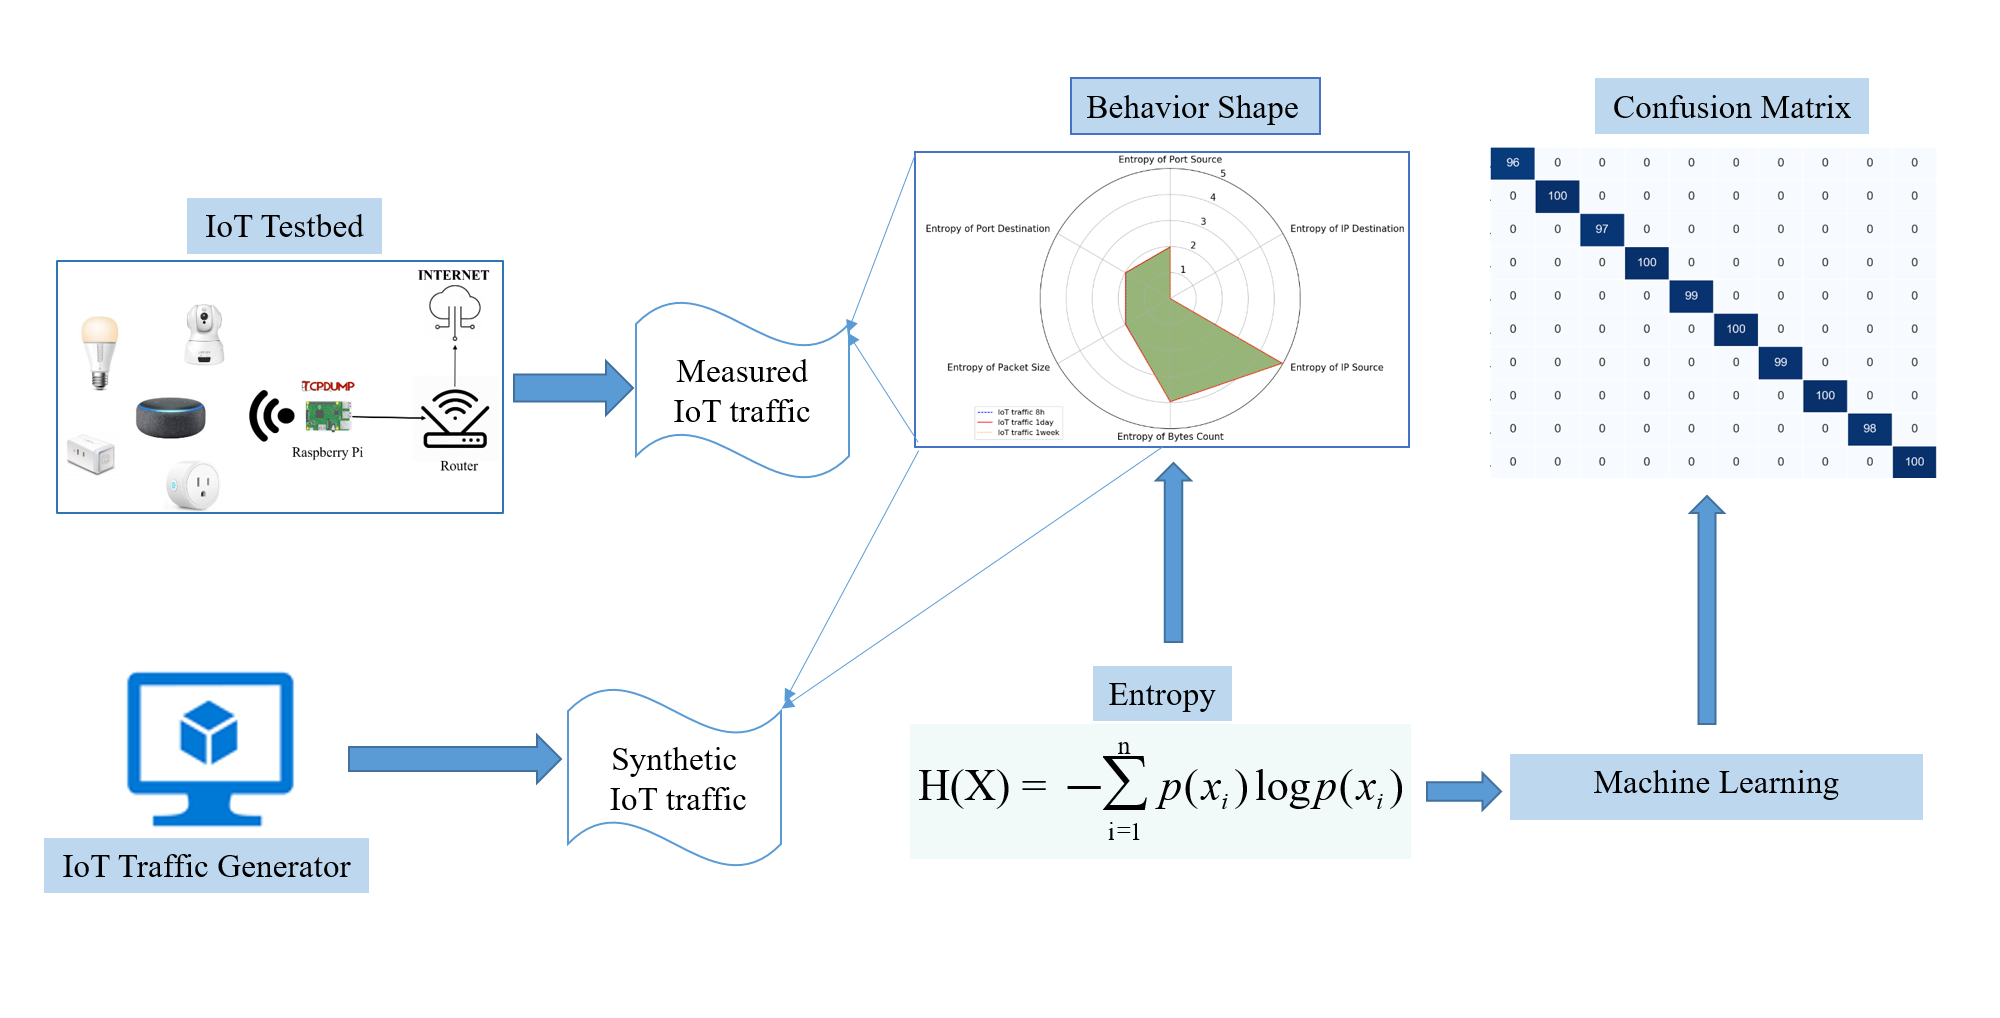
:We now use the Internet of things (IoT) in our everyday lives. The novel IoT devices collect cyber–physical data and provide information on the environment. Hence, IoT traffic will count for a major part of Internet traffic; however, its impact on the network is still widely unknown. IoT devices are prone to cyberattacks because of constrained resources or misconfigurations. It is essential to characterize IoT traffic and identify each device to monitor the IoT network and discriminate among legitimate and anomalous IoT traffic. In this study, we deployed a smart-home testbed comprising several IoT devices to study IoT traffic. We performed extensive measurement experiments using a novel IoT traffic generator tool called IoTTGen. This tool can generate traffic from multiple devices, emulating large-scale scenarios with different devices under different network conditions. We analyzed the IoT traffic properties by computing the entropy value of traffic parameters and visually observing the traffic on behavior shape graphs. We propose a new method for identifying traffic entropy-based devices, computing the entropy values of traffic features. The method relies on machine learning to classify the traffic. The proposed method succeeded in identifying devices with a performance accuracy up to 94% and is robust with unpredictable network behavior with traffic anomalies spreading in the network.

1. Introduction
The rapid development of the Internet of Things (IoT), such as smart homes, smart cities, and industries 4.0, has opened up a new cyber–physical technological era, impacting our daily lives. According to the International Data Corporation, approximately 41.6 billion IoT devices will be connected to the Internet, and 79.4 zettabytes of data will be the total generated data in 2025 [1]. The growth is not expected to slow down and will keep increasing for the next years.
There are more innovations in smart devices. For instance, smart homes can be equipped with several sensors, remotely controlling video surveillance, lighting, and heating systems [2]. The users can access information from these IoT devices or perform daily tasks (e.g., turning off the light). Therefore, many consumer IoT devices (e.g., light actuators, Wi-Fi plugs, and cameras) are connected, setting up a smart-home environment.
IoT will expectedly count for a major part of Internet traffic; however, there exist only a few studies for modeling IoT traffic and characterizing its properties [3]. Compared with current Internet traffic, IoT traffic exhibits different characteristics because of the diversity of sources, heterogeneity of hardware devices, and novel services, leading to new traffic patterns [4,5]. IoT traffic is the aggregation of packets generated by several devices from different environments, such as smart homes or smart cities. These environments include several sensors dedicated to specific tasks, such as monitoring systems or collecting cyber–physical values (e.g., temperature and humidity).
Traffic generators are essential tools for evaluating network performance and characterizing traffic [6]. Several traffic generators [7], such as Iperf, PackETH, D-ITG, and Ostinato, focus on Internet traffic. IoT traffic has different characteristics, such as heterogeneity of sources, multiple sources, new traffic patterns, and different supported services [4].
The rise of the IoT has also unveiled new vulnerabilities, as observed with the Mirai distributed denial of service (DDoS) botnet in 2016, severely impacting the Internet [8]. The virtual carjacking of a vehicle has been reported as an exploit [9]. Data from heart monitoring systems for babies were found to be unencrypted, and alerts in the case of an emergency could have been modified and strongly impacted the medical process [10]. Hence, the IoT is facing new challenges regarding the cybersecurity of devices, data privacy, and communication. The collected data can convey critical information about users, their privacy, and the environment. It is essential to characterize the traffic of IoT devices to prevent security threats and mitigate vulnerabilities.
To study IoT traffic characteristics, we set up an IoT testbed for smart-home environments. Then, we performed extensive measurement experiment campaigns to study IoT traffic. We designed a novel IoT traffic generator tool called IoTTGen. It is a packet-level traffic generator that can generate traffic from multiple devices, emulating large-scale scenarios with different devices under different network conditions. It can study the properties of IoT traffic from various environments, such as smart homes and biomedical environments [3].
From our IoT traffic dataset, we computed the entropy values of traffic parameters and visually observed the IoT traffic on the behavior shape (BS) graphs. We propose a new method for identifying traffic entropy-based devices, computing the entropy values of traffic features. The method relies on machine learning to classify the traffic. The proposed method succeeds in identifying devices under various network conditions with a performance accuracy up to 94% in all cases and is robust with unpredictable network behavior with traffic anomalies spreading in the network.
The rest of the paper is organized as follows. Section 2 surveys the related work on IoT traffic. Section 3 introduces the proposed IoT testbed for smart-home environments. Section 4 describes the proposed novel IoT traffic generator tool called IoTTGen. Section 5 presents our measurement experiments. Section 6 shows the traffic entropy analysis. Section 7 introduces the proposed new entropy-based identification method and discusses its performance accuracy. Section 8 concludes this paper and provides some insights into future work.
2. Related Work
2.1. Network Traffic Generator
Traffic generators are important and powerful tools because they evaluate network performance and characterize traffic. Many traffic generators have been developed in different forms, such as open-source software, research projects, or commercial products. Table 1 shows the popular traffic generators. Most traffic generators use different interfaces and transport protocols to generate traffic. A traffic generator is one of the best ways to inject traffic into the network for utilization by other devices. It is also useful in evaluating the performance of devices. Most previous traffic generators focus on Internet traffic; therefore, we only considered IoT traffic in this study. In [11], Eric Ke Wang et al. simulated voice transfer attacking in an industrial IoT environment. They showed that their method for synthesizing speech and the attack model reached a high level of efficiency. As we followed the same trend by modeling anomalous traffic for the IoT, our focus was on the IoT for smart-home environments where IoT devices are widely spread in the home environment. Hence, we used IoTTGen as a traffic generator, which is dedicated to IoT networks.
2.2. IoT Traffic Characterization
IoT has become a tremendous topic; however, only a few studies have investigated IoT traffic and its impact on networks. Shahid et al. [18] collected traffic from smart-home sensor devices by visualizing IoT traffic with the t-distributed stochastic neighbor embedding (t-SNE) method to classify network traffic for each device. Koroniotis et al. [19] deployed a bot–IoT testbed, the data obtained from which are publicly available. They analyzed their dataset through machine-learning methods for forensics purposes. Ferrando et al. [20] relied on streaming data analytics to detect abnormal IoT traffic by visually observing the traffic from heterogeneous sensor devices with the BS graphs. This study is different from others because we aimed to characterize IoT traffic by designing an IoT traffic generator tool for modeling traffic. We also applied our generator to a case study of an IoT traffic anomaly.
2.3. Identifying and Classifying IoT Devices
In identifying and classifying IoT devices, machine-learning algorithms are used. Shahid et al. [18] used the t-SNE method to recognize the four kinds of IoT devices. Feng et al. [21] relied on a hybrid IoT device classification framework by combining empirical models with advanced machine-learning models to classify IoT devices. Bezawada et al. [22] built a static and dynamic behavioral model based on packet headers and payload features. They fingerprinted IoT device types with high accuracy using multiple machine-learning classifiers. To classify and distinguish IoT devices from other devices, Ortiz et al. [23] relied on the long short-term memory neural network to automatically learn features from device traffic. Their study showed that it is feasible to identify devices after learning a few TCP-flow samples with high accuracy.
2.4. Entropy-Based Method
Regarding Internet traffic, several studies have relied on the entropy-based method as a good candidate for detecting anomalies [24,25,26]. Bereziński et al. [25] showed the ability to detect a broad spectrum of anomalies using supervised learning with parameterized entropy. Shukla et al. [27] computed the entropy values for a features vector and a list of legitimate traffic, which were then provided for filtering the traffic. Callegari et al. [28] proposed an intrusion detection system by measuring the entropy associated with the traffic descriptors. They identified traffic features and detected anomalies with different network scenarios.
2.5. Anomaly Detection
For modeling attacks, Arnaboldi et al. [29] proposed an IoT system model for generating a synthetic denial of service (DoS). Erlacher et al. [30] proposed an automated system for generating attack traffic for network intrusion detection systems. Huang et al. [31] implemented attack models in the Omnet++ simulator tool and evaluated the performance of their intrusion detection system for sensor networks. Salem et al. [32] proposed a framework for detecting abnormal changes in a medical wireless sensor network. Several studies, including the study by Cassas et al. [33], have relied on machine-learning methods for classification and anomaly detection.
There are also studies for detecting anomalies in IoT traffic. Ozcelik et al. [34] proposed a model for detecting and mitigating IoT-based DDoS attacks by investigating Software-Defined Networking (SDN)’s capabilities in edge IoT networks. Hence, they evaluated the use case of the Mirai malware. An intrusion detection system has also been proposed for the IoT. Fu et al. [35] presented an automata-based intrusion detection method for the IoT. Using an extension of the labeled transition systems, they detected three types of IoT attacks: jamming attacks, false attacks, and reply attacks. Similarly, Gajewski et al. [36] proposed a two-tier intrusion detection system for smart-home environments to identify network attacks using neural networks based on the monitoring records.
Based on the analysis of attackers’ behavior, Martin et al. [37] combined three practical techniques: honeypot, deep packet inspection (DPI), and a realization of moving target defense in port forwarding, to detect an anomaly. Summerville et al. [38] proposed a deep packet anomaly-detection approach that can distinguish between normal and abnormal payloads. They used the bit pattern matching technique to perform feature selection. However, this method’s applicability to resource-constrained IoT devices is limited, especially because this study considered consumer IoT devices. Moreover, this method is not easy and costly when the data are encrypted. Some IoT devices, such as the Amazon Echo and TP-link Bulb, use the Transport Layer Security (TLS) protocol to communicate, causing traffic to be encrypted. Using the DPI method without the user’s permission can also violate the user’s information privacy [39]. Furthermore, Ke Wang et al. [40] proposed a neural network architecture search method to balance the robustness and efficiency of artificial intelligence-enabled Internet of things (AIoT) systems. They reanalyzed MobileNet’s feature maps to detect anomalies. Their results show that the performance of various networks under offensive conditions is different.
2.6. Smart-Home Testbed
Many previous studies deployed IoT testbeds to research IoT networks. Hence, there are large-scale testbed facilities, such as FIT IoT-Lab [41] and WISEBED [42], that have used many sensors from different vendors. However, for reproducing a real smart-home environment, most testbeds are small-scale testbeds equipped with commercial IoT devices, as shown in Table 2. For consumers, the number of devices in a smart home is mostly limited (e.g., a few for each room). However, previous studies have taken a different approach to building a testbed. In [18,43,44], only one manufacturer per device was used; in [45], three different manufacturers for the camera were used; in [21], three different manufacturers for the plug were used. Besides, some testbeds [44,45] have additional non-IoT devices, such as Raspberry Pi sensors [21]. These studies all used smart-home testbeds and machine learning to identify the classes of IoT devices (e.g., hubs, cameras, and plugs). Hence, we also deployed a small-scale testbed, as most previous studies used.
3. IoT Testbed for Smart-Home Environment
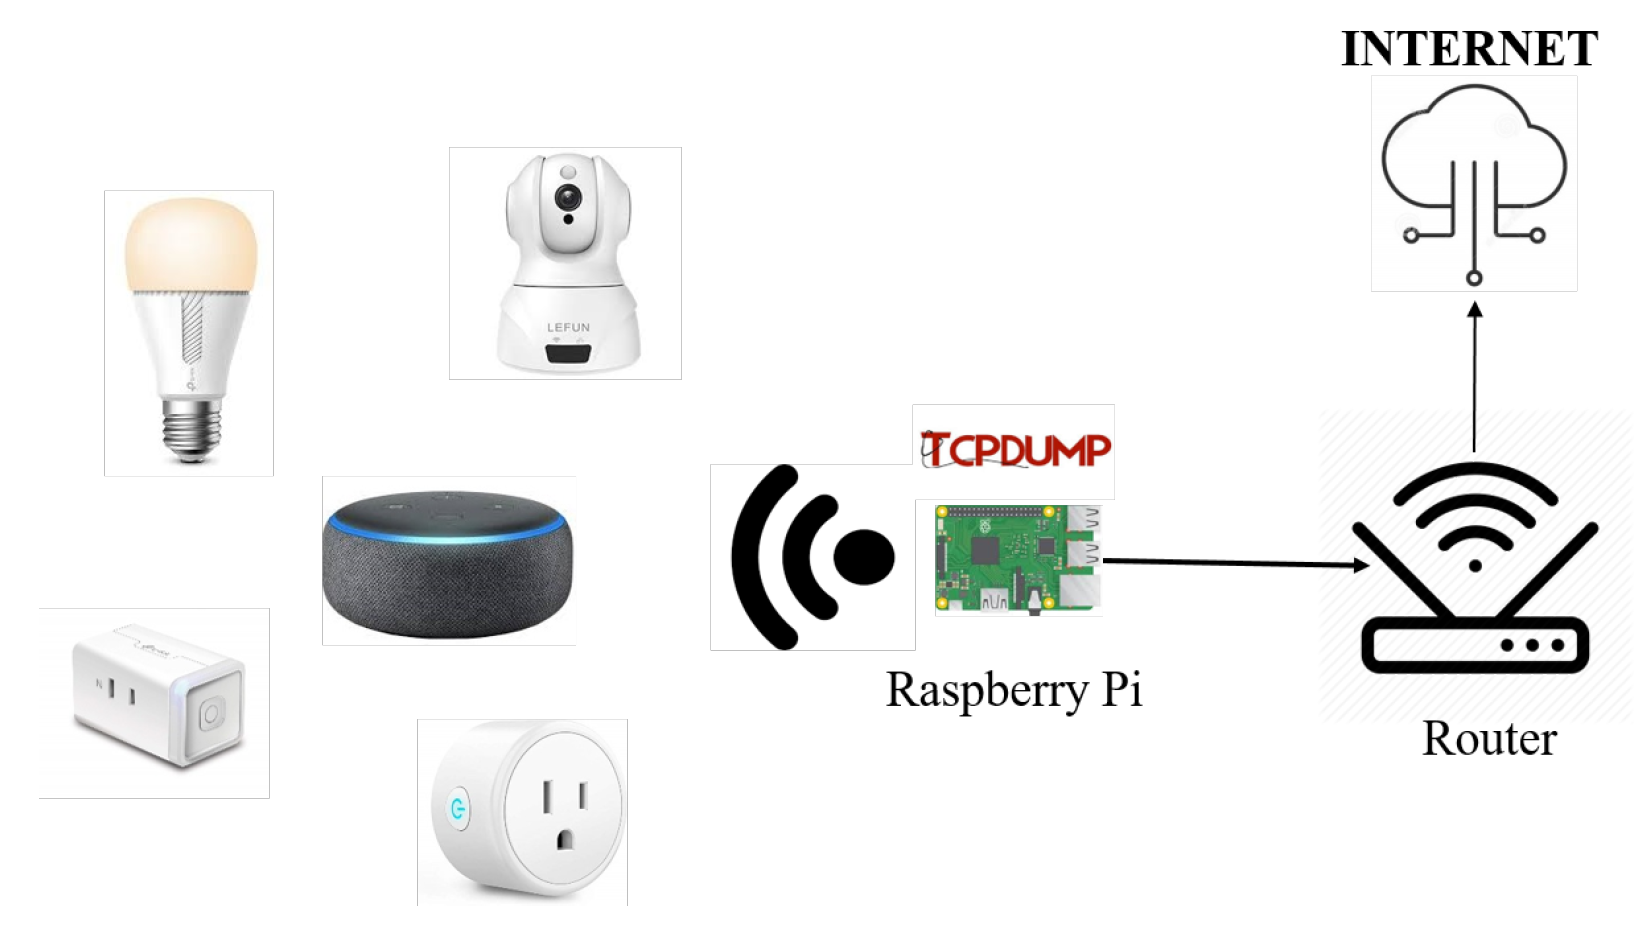
Figure 1 shows the setup of our smart-home testbed for collecting IoT traffic. Table 3 shows that our testbed comprises five popular IoT devices connected to the Internet with Wi-Fi through a home gateway for controlling the flow of information among smart appliances to the remote network.
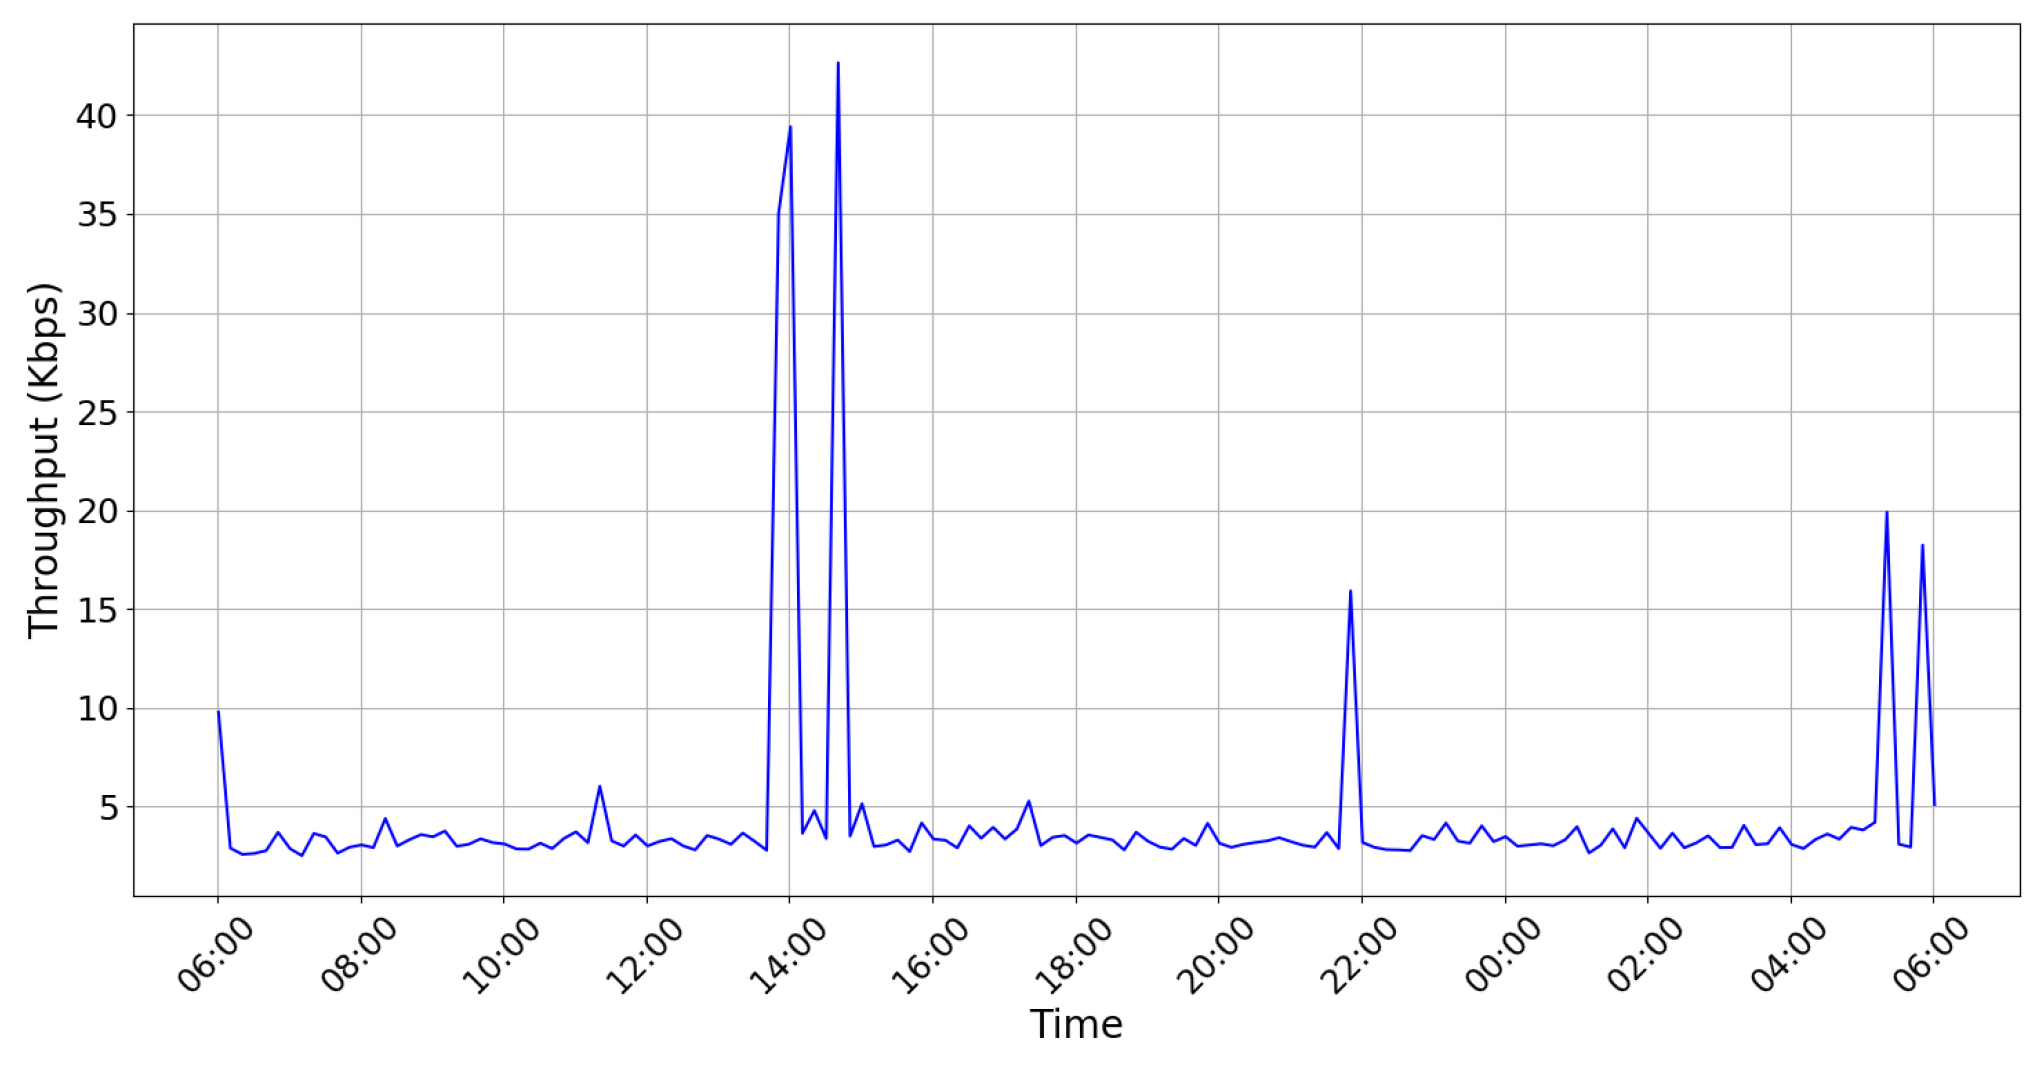
We configured a Raspberry Pi 3 Model B (Raspberry Pi Ltd., Cambridge, UK) as the wireless access point, serving as the gateway to the public Internet for collecting the traffic. We used the Raspbian Jessie OS (Raspberry Pi Ltd.). We then installed additional software, such as DNSMasq for the Domain Name Server (DNS) and Dynamic Host Configuration Protocol (DHCP) services, Hostapd for the access point and authentication server services, and Tcpdump for collecting the traffic. All the traffic from the IoT devices were recorded and stored in a single trace file in the “pcap” file format. We collected the IoT traffic for several days; however, we only present the results of one day’s traffic on our testbed (Figure 2), as the other days showed similar traffic properties.
3.1. ON/OFF Scenarios
IoT devices are dedicated entities responsible for sensing or interacting with the physical world (e.g., activating a bulb light or switching off a plug). Most use cases in IoT environments are periodic transmissions of messages containing sensor measurements, statuses, or simple commands. For instance, the ON/OFF status is periodically sent in a smart light. On the traffic collection day, we performed some activities using the IoT devices from 13:50 to 15:00, during which the traffic significantly increased (Figure 2). We also performed other activities from 22:00 to 05:30. We refer to these periods of activity as “ON” periods and those other periods without any activity as “OFF” periods. The total traffic reached approximately 3.2 Kbps without any activity (OFF), and it could reach 16–40 Kbps if some activities were using the IoT devices (ON).
Network activity varies during the daytime (intense-activity period (ON) or no-activity period (OFF)) under several cybersecurity threats (DDoS, DoS, and port scanning). Thus, we split the one-day traffic traces into 5 min traffic traces (288 5 min traces for a 24 h day trace). To classify the 5 min traces into the ON or OFF periods (or anomalous), we relied on the k-means clustering method by combination with the mean silhouette value to optimize the number of clusters [46]. Thus, each 5 min trace could be classified as active, inactive, or under cybersecurity attacks.
4. IoT Traffic Generator Tool
In the previous section, we presented our testbed for collecting smart-home IoT traffic. The deployment of a testbed allows collecting a real dataset. However, it exhibits some limitations, as it is complex to extend the scale of a testbed in order to test new devices. In direct relation to the number of devices, it is also costly. To address this, we designed a new IoT traffic generator tool that we will introduce in this section. Therefore, by using our generator, it is possible to reproduce the behavior of IoT networks in various environments and on any scale.
4.1. Overview
IoT traffic is the aggregation of packets generated by several devices from different environments, such as smart homes or smart cities. These environments involve several sensors dedicated to specific tasks, such as monitoring systems or collecting cyber–physical values (temperature, humidity, etc.). IoT traffic can be more easily predicted, as sensor devices are deployed to perform the same tasks continuously and generate the same amount of data periodically.It is the opposite of the Internet traffic, where the traffic has some human-generated aspects (flash-crowds, popularity, etc.). Some alerts can also occur, adding less predictable traffic behavior; however, they are still part of the sensor devices’ behavior. Hence, we designed a novel IoT traffic generator tool called IoTTGen. Our packet-level generator can finely tune all the traffic feature parameters, such as the packet size or time interval between packets. This tool is essential for modeling IoT traffic, studying its characteristics, modeling unpredicted traffic behavior, and understanding IoT traffic anomalies.
4.2. Architecture
Different kinds of IoT environments can be modeled using IoTTGen, in which each sensor device produces its traffic trace according to its functionality and characteristics. For instance, a video recording camera generates continuous data flows with large-sized packets, and smart plugs generate small-sized packets at a slow pace. IoTTGen is designed to configure each device’s parameters easily. All the packets generated for each device are stored in a single trace file in the following supported file formats: pcap, csv, and txt.
The IoTTGen architecture comprises (i) a device configuration module, (ii) a packet creator module, and (iii) a main controller.
The device configuration module defines the IoT device configuration, such as the packet size, port number, payload, and period between packets. The user needs to define a new device template to add a new device (a smart light bulb or camera).
The packet creator module forges the packets based on the device configuration from the previous module. To forge packets and generate real packet traffic, we used Scapy [47]. It can generate packet traces in text format only, depending on its needs. For a long-duration experiment, it drastically reduces the duration of the packet generation process.
The main controller controls the execution of IoTTGen. The controller extracts the parameters provided by the device configuration module and causes the packet creator to forge packets or provide packet traces. It also merges each device trace into a single trace; however, it is still possible to generate one trace per device.
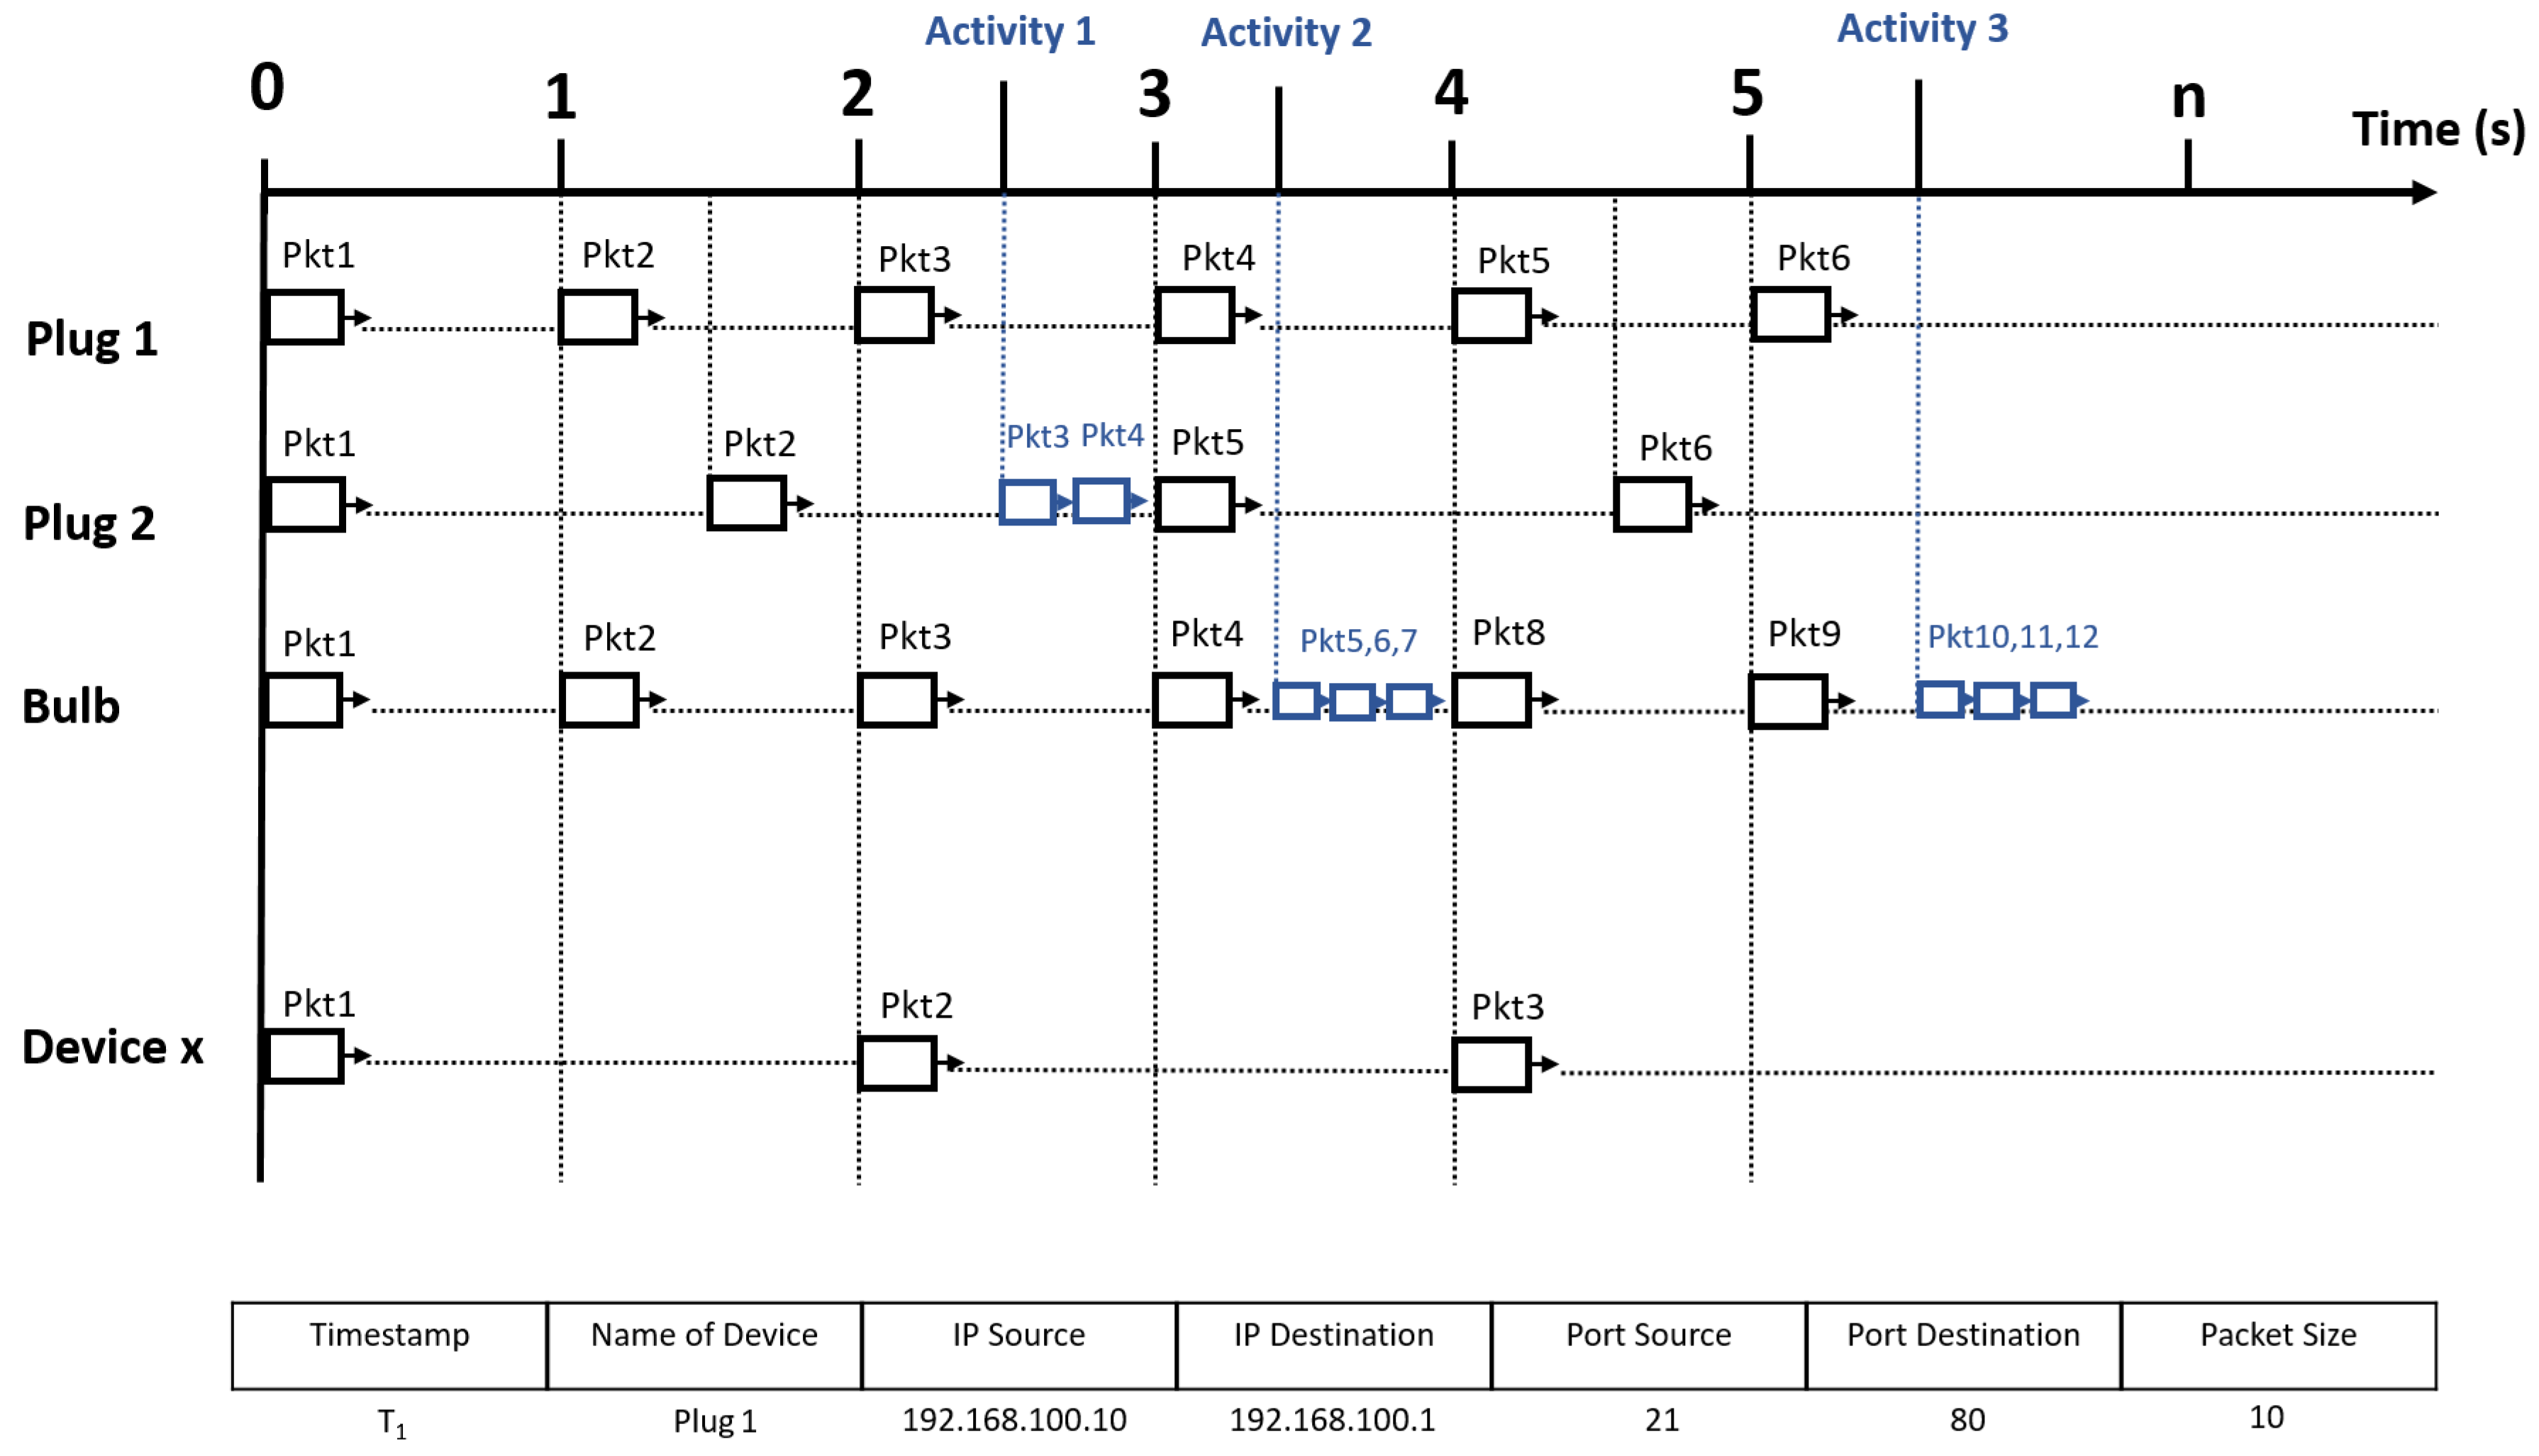
4.2.1. Device-Generated Traffic
IoT devices are dedicated entities continuously performing their tasks, such as sensing the environment, transferring data among objects or users automatically without human intervention. Thus, each device is continuously generating traffic even though no user is requesting its explicit information. Figure 3 shows the packet generation process for IoTTGen. The period for generating packets varies for each kind of device and can be configured. For example, Figure 3 shows that the devices have periods of 1, 1.5, 1, and 2 s. As for generating traffic, all the devices are synchronized with the same time origin; however, it is also possible to configure the starting time and add some delays among packets and periods to reduce devices’ synchronicity. Then, each device generates a different number of packets with different periods for the entire duration of the scenario. Besides predefined parameters, it is also possible to assign parameters within intervals so that the parameters can be randomly chosen within ranges of values. This way of working is useful for modeling the unpredictable behavior of devices and users in cases of specific scenarios (e.g., a daily routine except for one day, new behaviors and different interactions with devices, etc.). Thus, our generator is a complete scenario composition framework for the IoT.
4.2.2. Human-Generated Traffic
IoTTGen can generate traffic triggered by human activities. Each device has different event patterns (e.g., the smart plug has a turn-on event and turn-off event); hence, IoTTGen can also model the traffic generated by human activities. Besides, the user can create different scenarios using IoT devices in regular daily activities. For example, when coming home, the user can turn on the bulb and plug, launch the Spotify music service on the hub, and access the camera’s recording activities. Figure 3 shows that plug 1 is switched on at activity 1, and two packets are generated for plug 1. Then, when the bulb is switched on at activity 2, IoTTGen generates packets accordingly. Furthermore, human activities can also be created randomly. For example, when the user has a party at home, smart-home devices can operate randomly. Therefore, IoTTGen can also set the time to trigger events for these devices randomly. Thus, human-generated traffic can be generated easily using IoTTGen.
We will show how we applied IoTTGen to the IoT environment and generated a different kind of traffic in the following section.
5. IoT Traffic Measurement Experiments
We set up three experiments: collecting measured traffic using the testbed, generating synthetic traffic using IoTTGen, and generating anomalous traffic by injecting malicious traffic into synthetic traffic and measured traffic.
We used IoTTGen for implementing experiments and generating synthetic IoT traffic for smart-home environments. The measured traffic was obtained from our testbed, as discussed in Section 3.1. We also generated malicious traffic by extracting anomalous traffic from the real dataset [19]. Thus, we aimed to investigate the properties of IoT traffic and study the impact of malicious traffic.
IoTTGen can generate one day’s traffic for the five-device smart-home scenario in a few seconds with more than 60,000 packets per second. The generation of the 52-device scenarios reaches up to 80,000 packets per second, and one day’s traffic in a few seconds. This larger experiment is faster, as more devices have similar properties. The complexity of IoTTGen are presented in Table 4. Thus, IoTTGen can generate daily traffic in a few seconds and generate a longer traffic trace according to the scenarios. We conducted all the experiments on a computer running an Intel Core i7-7700 at 3.6 GHz, with 8 GB of RAM and 64-bit Windows 10 Professional (Microsoft Co., Redmond, WA, USA).
5.1. Generating Synthetic Traffic
5.1.1. Smart-Home Environment
A smart home is defined as a house equipped with (multiple) cyber–physical sensors for temperature, humidity, light control, smart hubs, and other things, allowing inhabitants to obtain information on their environment (e.g., temperature) and control and monitor it remotely (e.g., turning on equipment). In our smart-home environment, the devices were connected to the Internet with Wi-Fi through a home gateway for controlling the flow of information among smart appliances and to the remote network. Thus, remote users can access data and control home sensors with dedicated devices, such as smartphones, tablets, and computers.
5.1.2. Smart-Home Scenario
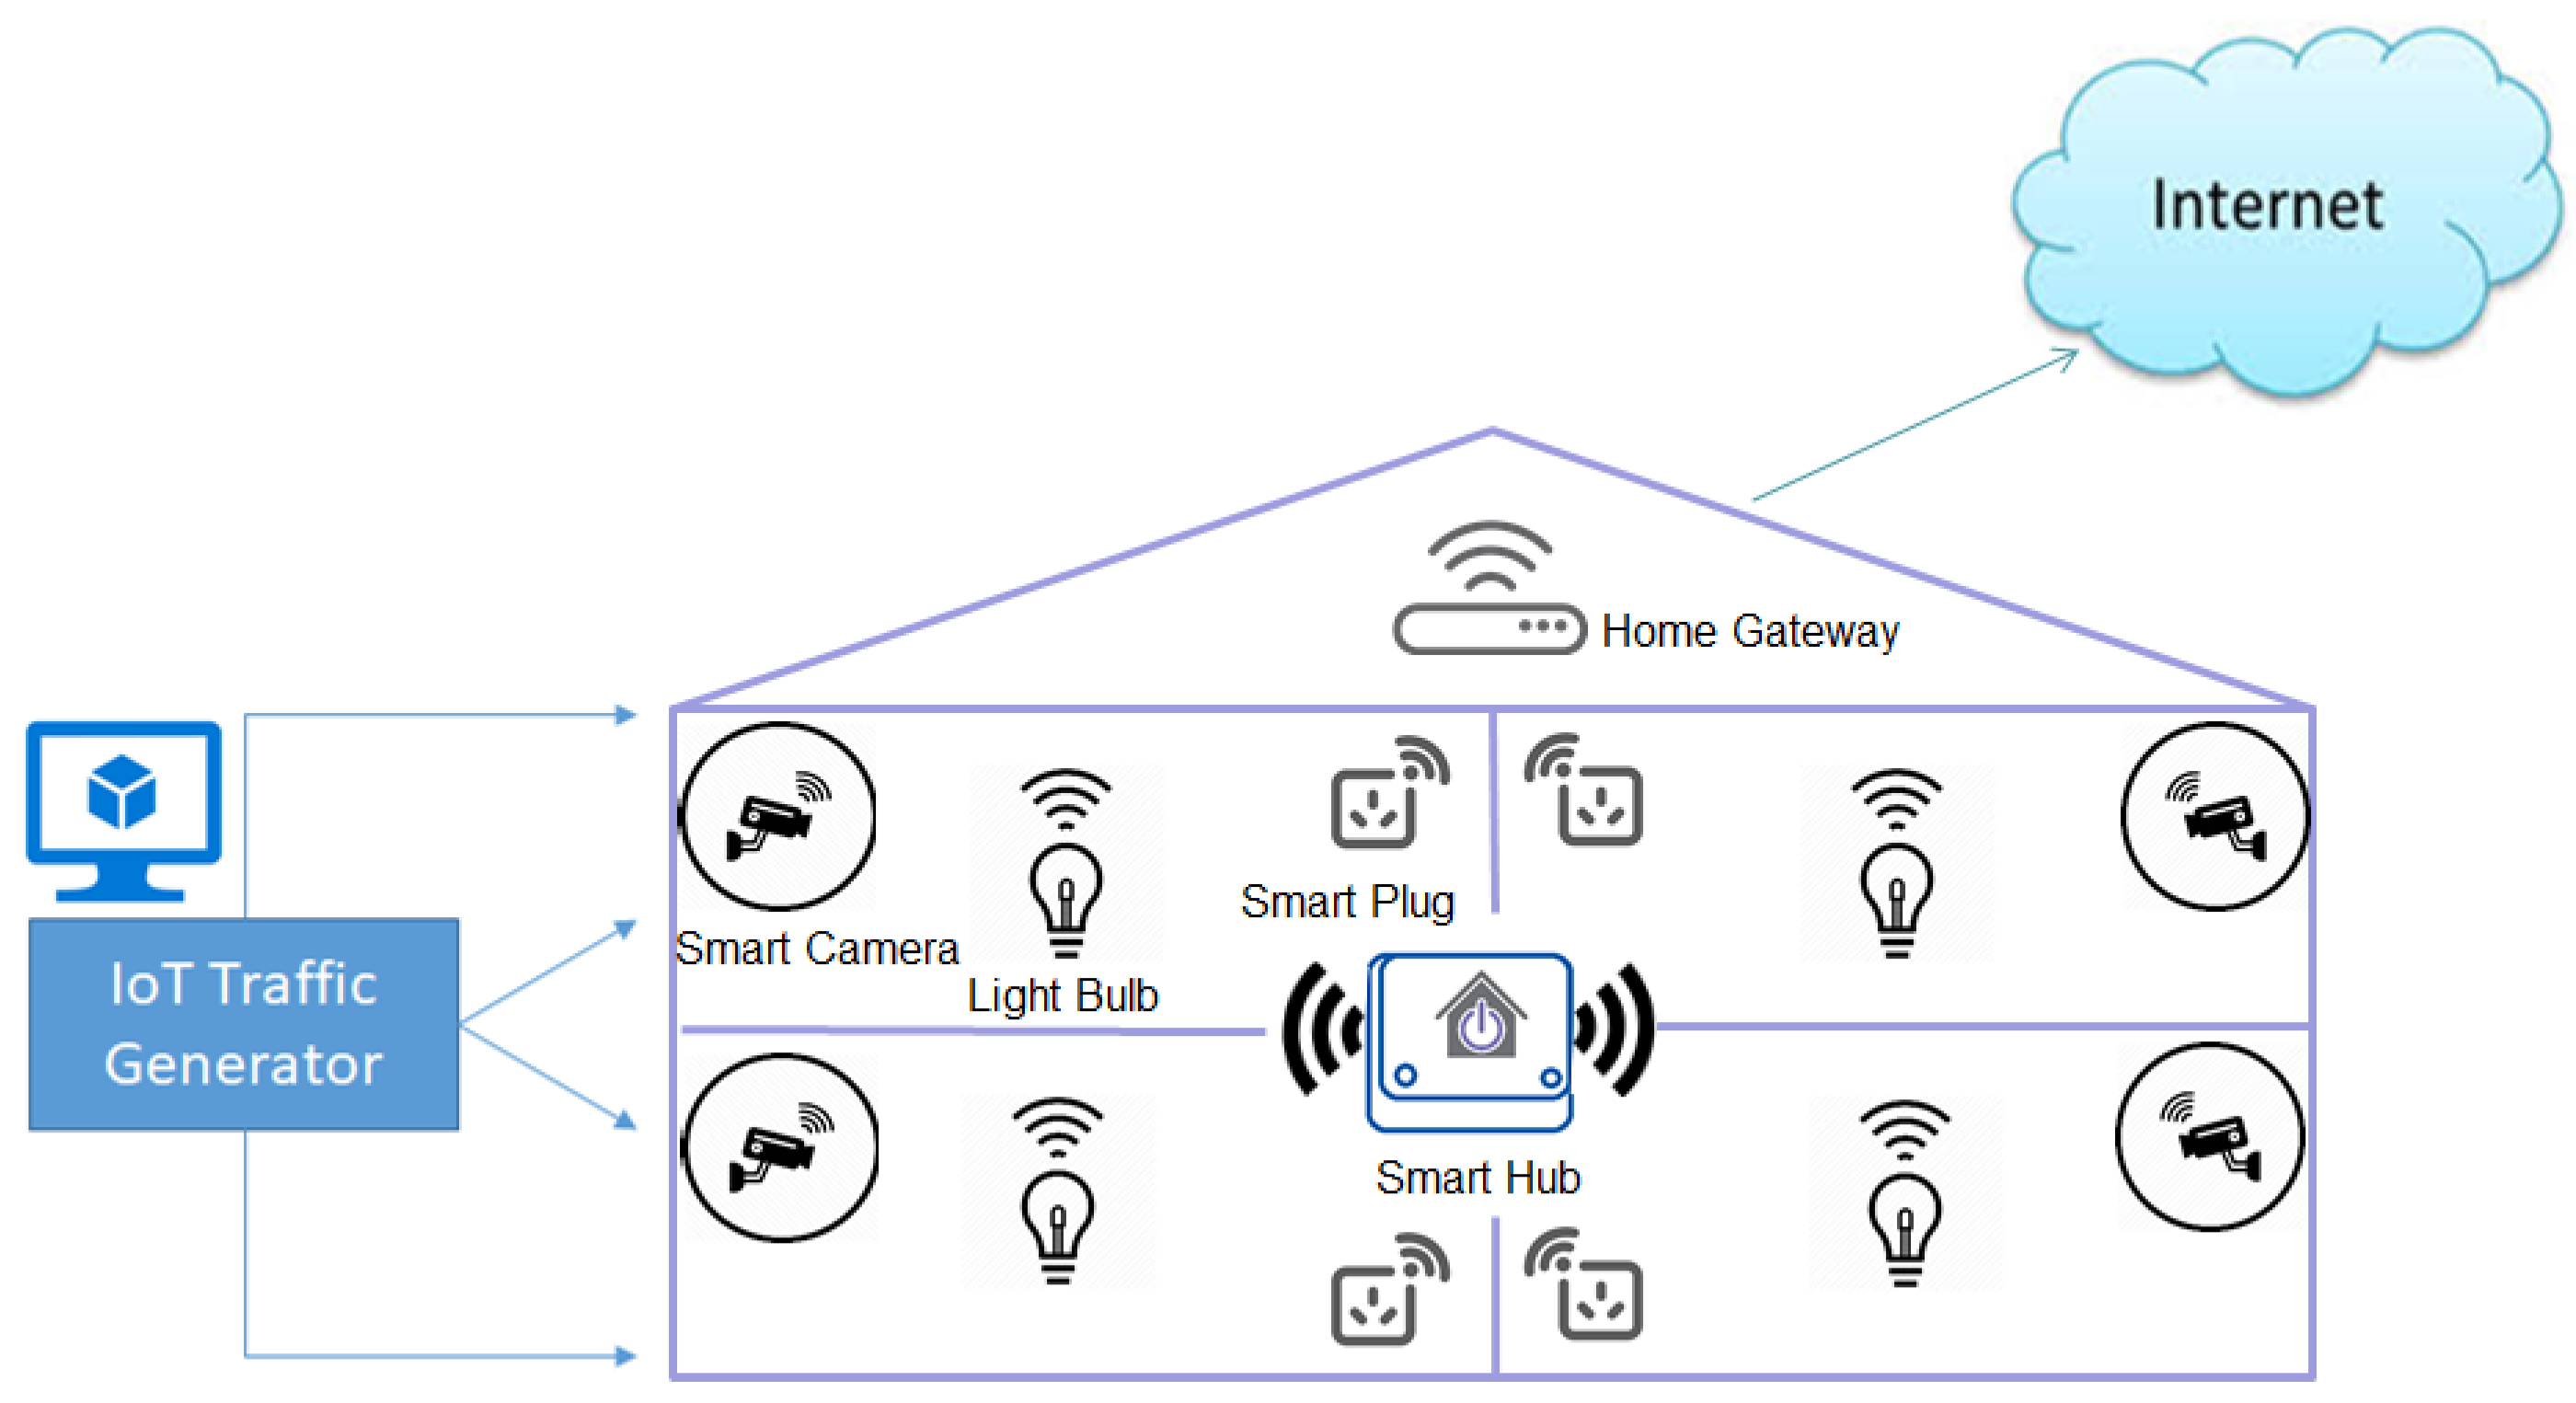
To generate IoT traffic for a smart home, we set up an experiment with a four-room house equipped with the following 13 smart devices (Figure 4): one smart hub (e.g., Amazon Echo) for controlling other devices, four smart cameras (e.g., Belkin NetCam), four smart lights (e.g., Lifx Bulb), and four smart plugs (e.g., TP-link Smart Plug).
To show that the different parameters would have an impact on the generated traffic, we considered two distinct sets of parameters for the smart-home environments: a case with custom parameters and another case with parameters extracted from the dataset [48]. Table 5 summarizes the custom parameters that we modeled based on the functionality of each device. For instance, a smart plug generates short-sized packets (100 bps) periodically, as smart plugs are low-bandwidth sensor devices. A smart hub may have larger packets (200 bps) for a management purpose but with the same period. We consider that a smart camera is a high-bandwidth device that continuously generates large-sized video packets (1000 bytes) in a short period (50 ms) for a video bitrate at 160 Kbps. Table 5 shows the parameters extracted from the previous study [48]. The same network configuration, smart hub, smart light, smart plug, and smart camera generated short-sized packets (144, 94, 120, and 100 bytes) at distinct periods (2.77, 3.2, 10, and 2 s, respectively).
Different parameter values (custom vs. extracted parameters) will have an impact on the traffic properties (Figure 5), which will be described in Section 4.
For this smart-home environment scenario, the overall smart-home traffic was generated by IoTTGen for three durations: 8 h, 24 h, and 7 days.
In adding new devices, we also implemented an experiment with a biomedical environment from a previous study [3].
5.2. Measured Traffic on Testbed
5.2.1. Traffic Trace Observation
Table 6 summarizes the one-day trace of the collected traffic. The camera, a high-bandwidth device, generated the major part of the packets and bytes, whereas the plugs counted for a small amount of the traffic. The hub also generated more packets than the camera, but overall, the hub counted for a lower amount of traffic.
5.2.2. Cloud Server Observation
There are many IoT manufacturers in the market today. Each manufacturer has its cloud server that manages its devices, and each DNS query–response pair is mapped into a particular domain owned by the manufacturers, as shown in Table 7. For instance, the TP-link plug device is directed to the TP-Link cloud server at devs.tplinkcloud.com. For Internet users, they may access many online servers (e.g., the web, Online Social Network, and e-Business) during their activities. However, IoT devices are dedicated to a single task and communicate only to pre-established servers. Inspecting the remote servers that IoT devices are connected to can indicate whether the devices have been corrupted or whether they may send information to nonlegitimate servers.
5.3. Synthetic Traffic vs. Measured Traffic
To compare the measured traffic and synthetic traffic, we used IoTTGen to generate traffic based on parameters extracted from Table 8. These parameters are similar to the parameters of measured traffic from our testbed.
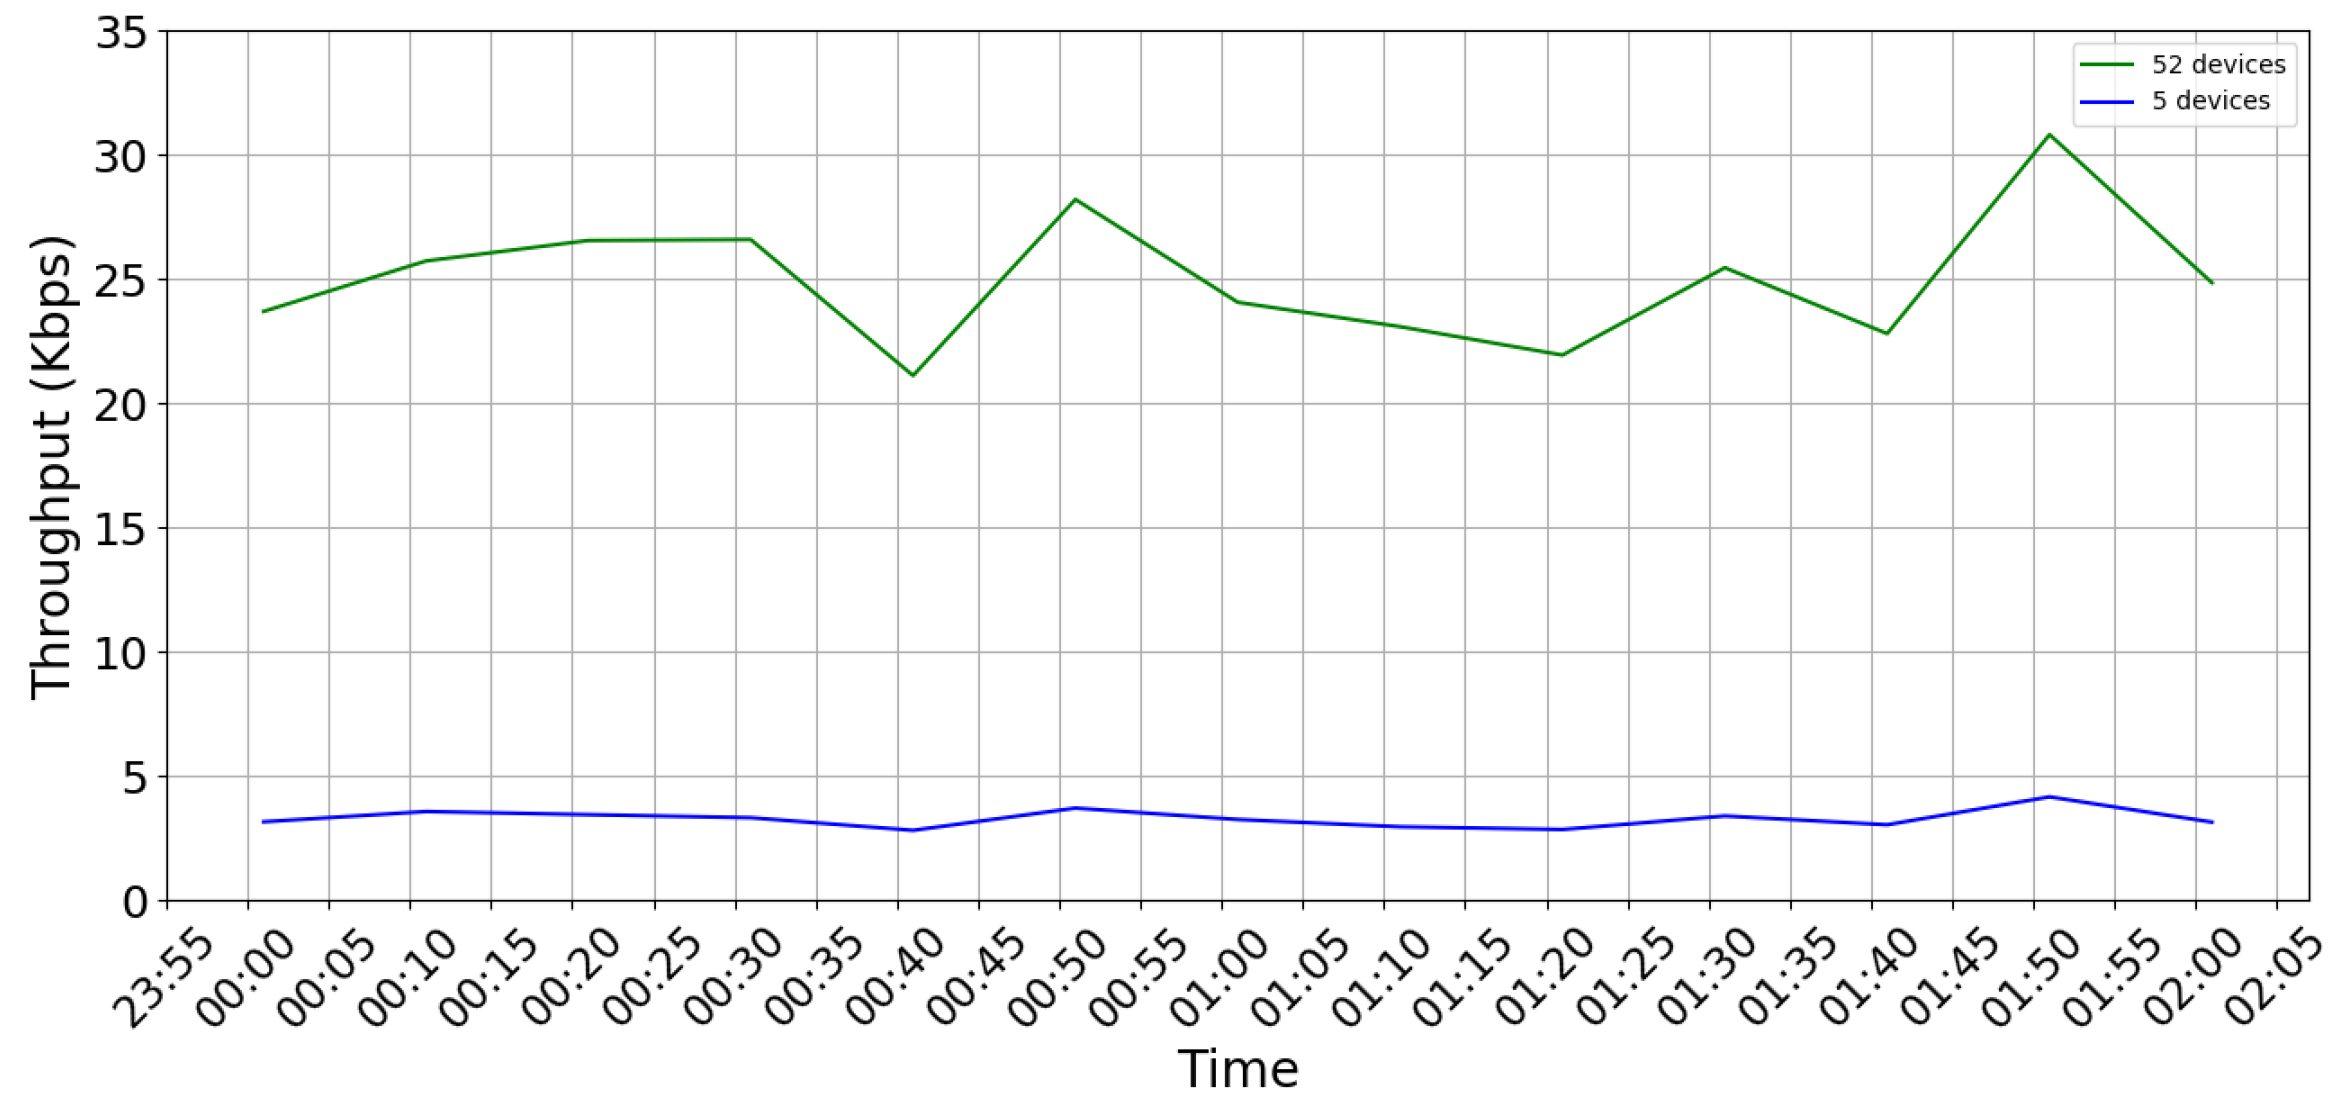
For many devices, we also considered a scenario with a house equipped with the following 52 smart devices: four hubs, eight cameras, 20 bulbs, 10 Tpl plugs, and 10 Tk plugs. The total duration of this experiment was 2 h. Figure 6 shows the differences between two scenarios of five devices and 52 devices. With 52 devices, the traffic was eight times higher than that with five devices.
5.4. Anomalous Traffic
From the regular users’ activity described previously as ON or OFF periods from the testbed and IoT traffic for smart-home environments generated from IoTTGen, another scenario of interest is when the IoT devices are under attack, and there are some security threats in the network. There are many IoT devices connected to the Internet, and there have been many cybersecurity threats or anomalies seen, such as the Mirai DDoS botnet. Thus, it is also essential to accurately detect when the devices are under attack or have anomalous traffic. In that case, the operator can react quickly in the case of new threats. We also wanted to model IoT anomalous traffic.
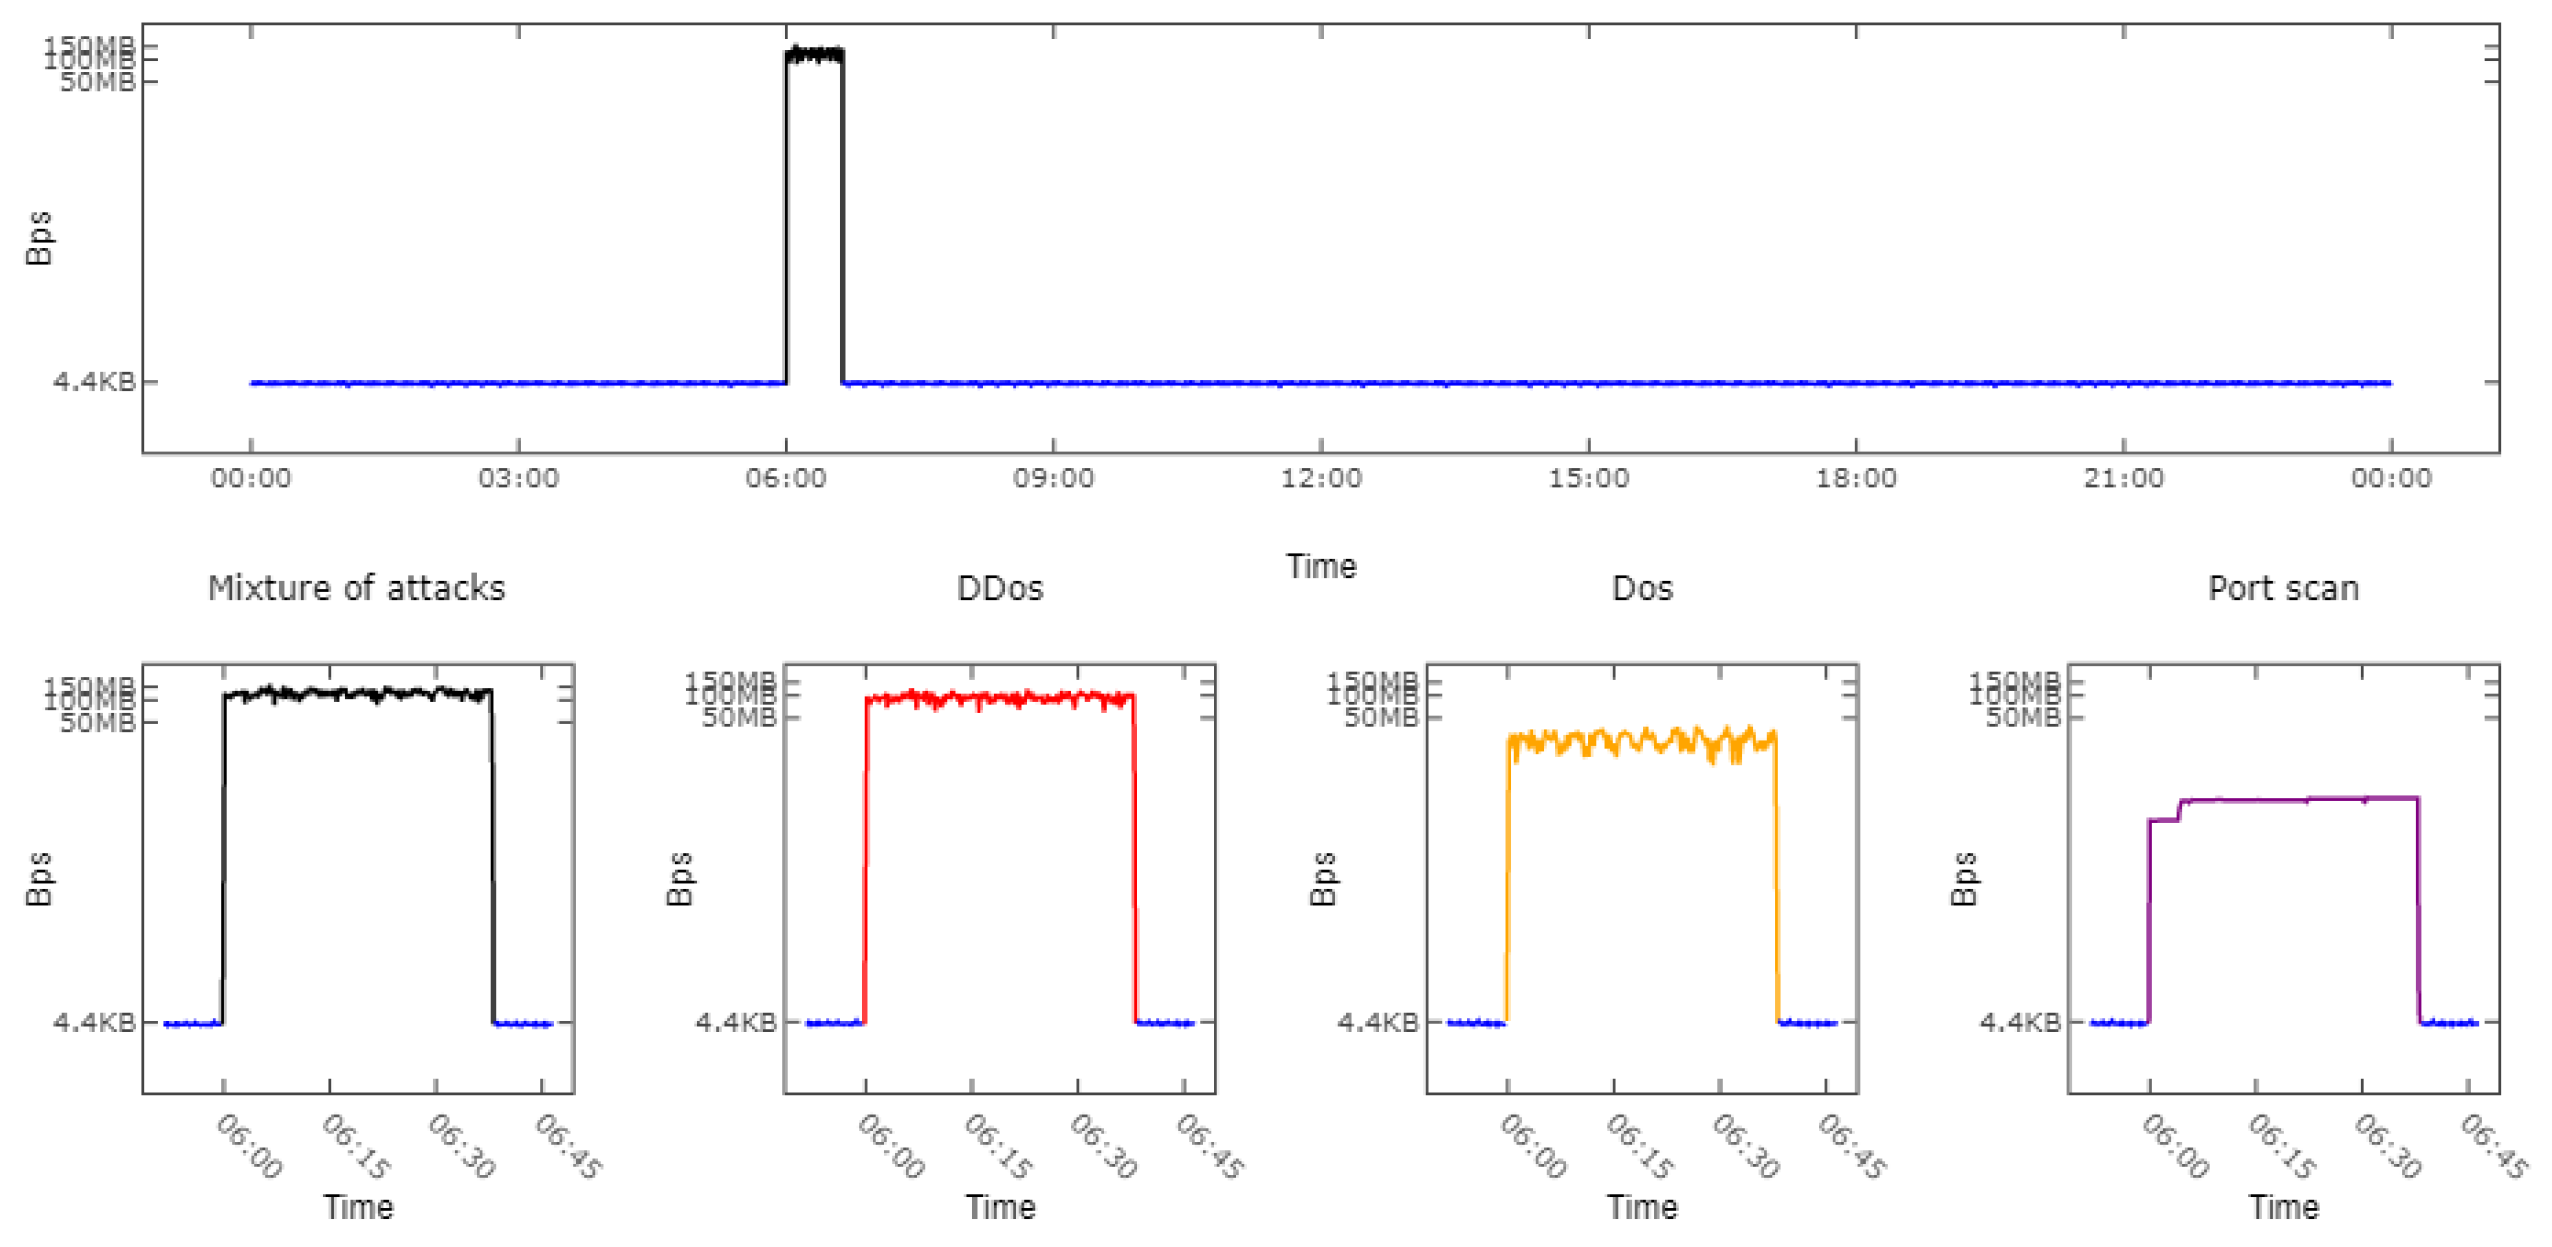
To this end, we relied on a public IoT traffic dataset [19] by extracting the traffic into three cybersecurity threats: port scanning (PS), DoS, and DDoS. Five bots generated DDoS, whereas a single bot generated DoS and port scanning. Each of the malicious traffic traces was injected into our generated IoT traffic. Then, we obtained five different traces: one original trace for IoT traffic, four malicious traffic traces for each anomaly, and a mixture of them (referred to as DDoS, DoS, PS, and mix). The total duration of the experiment was 24 h, and the cybersecurity threats occurred at 06:00 for 38 min. However, for other traffic, we had different configurations for anomalous traffic.
For the measured traffic scenario, the anomalous traffic traces are presented in Table 9, and the total duration of each trace was 1 min. The original traffic is depicted in Figure 2.
For the synthetic traffic scenario, the anomalous traffic statistics are presented in Table 10, and the total duration of the traces was 38 min. Figure 7 shows the generated traffic used for the smart-home scenario. The generated anomalous traffic is a mixture of the three different attacks and the IoT traffic.
6. Behavior Shape Traffic Analysis
To study the different traffic properties, we computed the entropy of the six traffic parameters: the IP source, IP destination, port source, port destination, packet size, and byte count. Then, we plotted the BS graphs [20] of the entropy to visualize and compare the traffic properties. The entropy can also be represented with time series [49] or three-dimensional graphs [24]. In our work, we chose the behavior shape graph, as we aimed at characterizing the traffic visually. Then, we plot the BS graphs [20] of the entropy to visualize and compare the traffic properties.
In this section, the theory of information entropy is first briefly introduced. Then, the results of our experiments are presented through the use of the entropy behavior shape. First, we present the results for regular traffic (Section 6.2) (i) generated by IoTTGen (Section 6.2.1) and (ii) measured from the testbed (Section 6.2.2), and the comparison (Section 6.2.3). Second, we present the results with anomalous traffic. In these experiments, we also showed the overall traffic of a smart home as well as the traffic of individual devices.
6.1. Entropy
As we aimed to identify IoT devices based on network traffic (legitimate or anomalous), the frequencies of traffic parameters, such as IP addresses or ports, could help to identify the devices and the network conditions. Hence, we computed the entropy values of the following traffic parameters [24]: the IP source, IP destination, port source, port destination, packet size, and bytes.
Information entropy is a quantity in information theory for measuring uncertainty (see Equation (1)) [25].
The entropy value can vary from 0 to log(n). An entropy value equal to 0 means that the observations (i.e., packets) are similar, whereas a higher entropy value shows that the observations are different. In the rest of the paper, these parameters convey sufficient information for precisely identifying the devices under different network conditions.
6.2. IoT Traffic under Regular Network Condition
In the following, we present the characterization of the IoT traffic collected on the testbed and generated by our generator.
6.2.1. Synthetic Traffic under Regular Network Condition
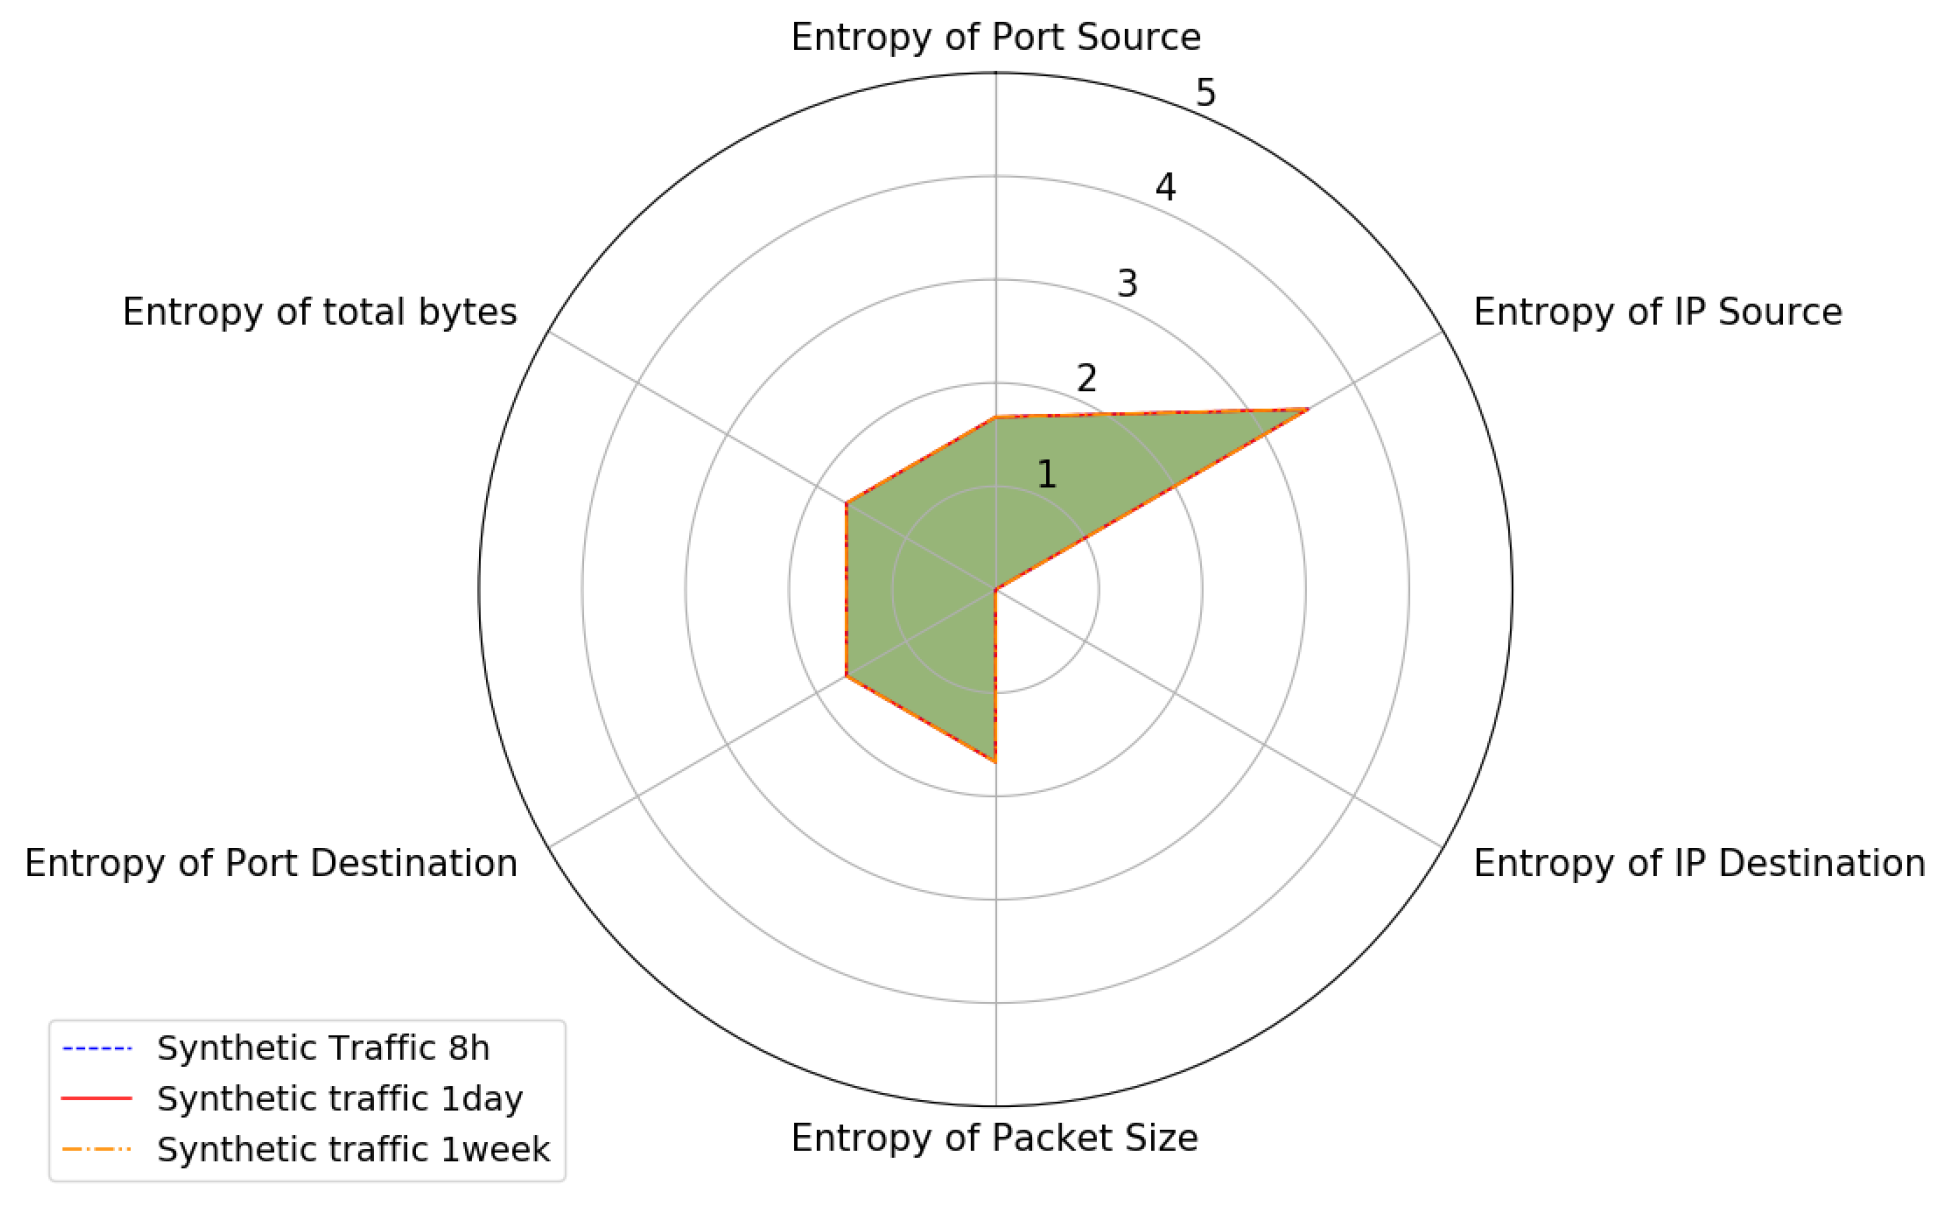
Figure 5 and Figure 8 present the BS graphs of the generated traffic for the smart home from the experiments presented in Section 5.1. Figure 5 shows that our generator used custom parameters in Table 5 and extracted parameters in Table 5. Figure 8 shows that smart-home traffic was also generated on the basis of the extracted parameters in Table 5.
In all the figures, the entropy value for the IP destination parameter is equal to 0. This is because, for all the experiments, the traffic generated from IoT devices flowed to the same destination (i.e., the gateway). Then, there was no entropy, as there was only a single destination. Figure 5 shows that the IoT traffic had been generated over 24 h as a regular daily activity with the same network configuration (smart-home environment). The parameter values directly impacted the shape of the traffic: the extracted parameters exhibited a larger shape than the custom parameters. There was the same number of IoT devices, but the parameters were different (period and packet size), resulting in different BS graphs. Figure 8 shows that the experiments were performed for 8 h, 24 h, and 7 days. For all these durations, the IoT traffic exhibited the same BS graph. As the synthetic traffic was generated, the traffic parameters stayed unchanged during all the experiments. There was no traffic evolution (e.g., there were no new connected devices or failures).
6.2.2. Measured Traffic under Regular Network Condition
As we split the traffic into 5 min time slots, each trace from the same state (i.e., ON, OFF, or anomalous) showed similar properties. We show the BS graph of a single 5 min trace for each device.
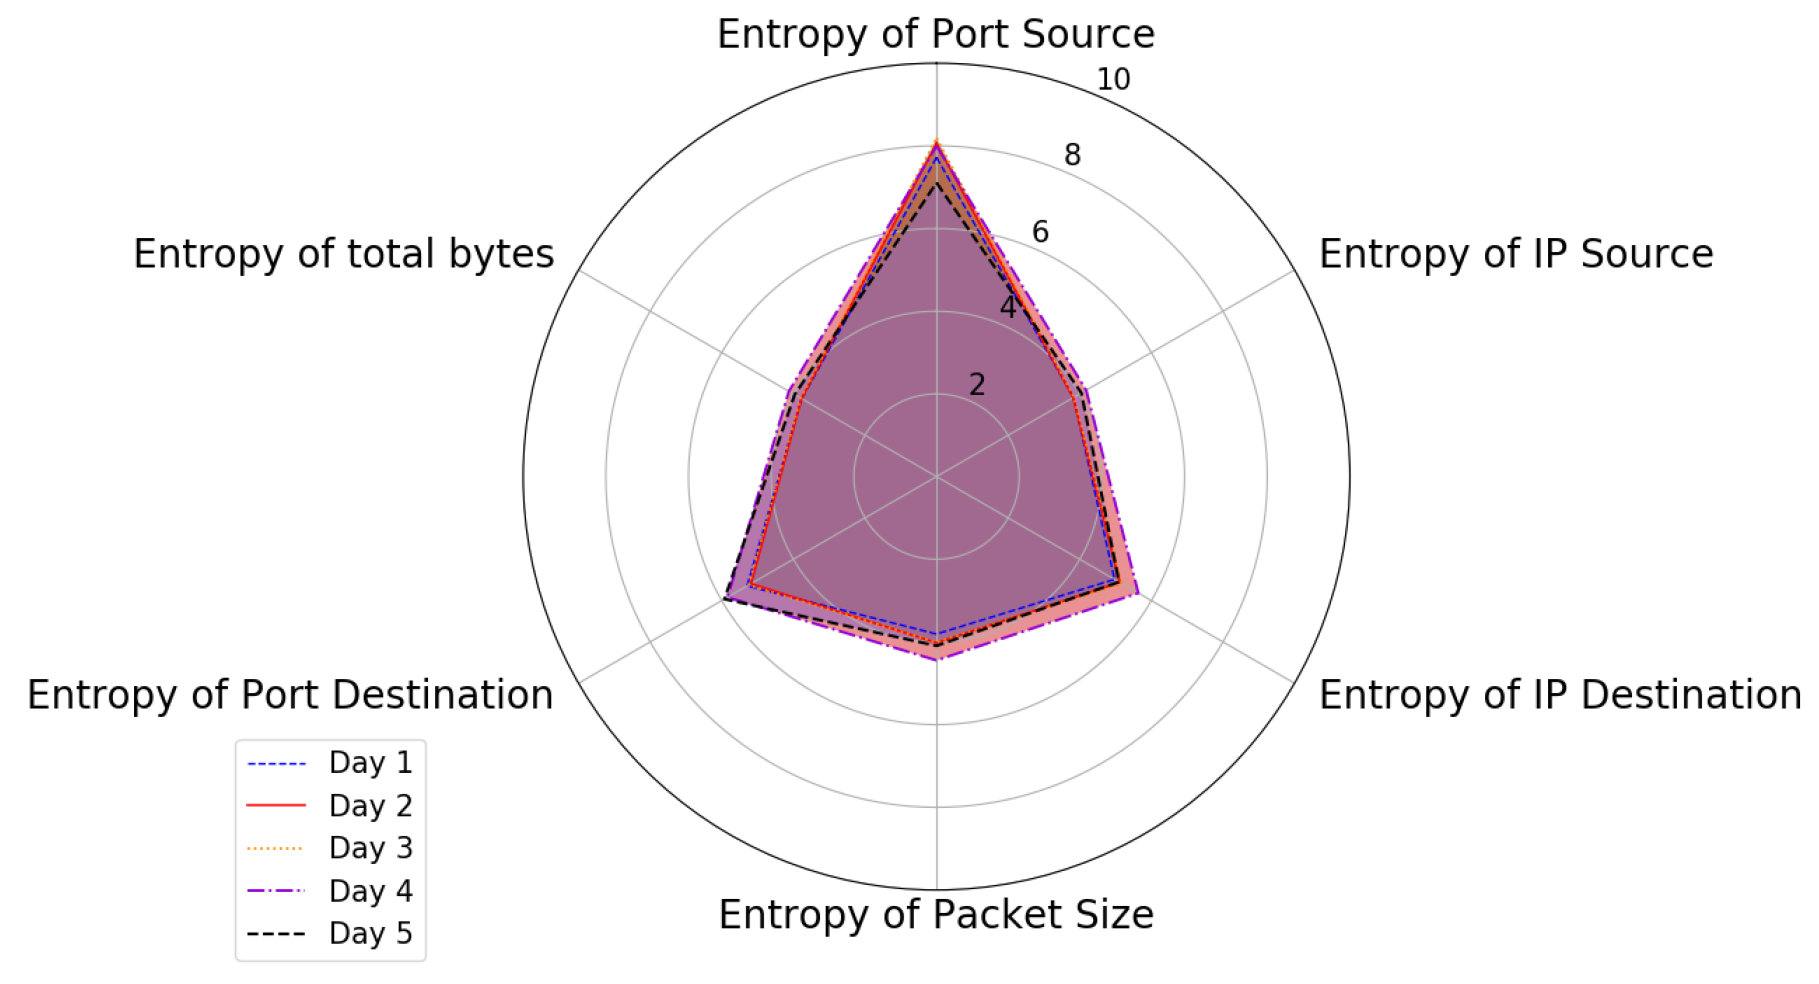
Figure 9 shows the BS graph of one day’s traffic for five consecutive days. As the traffic shapes were consistent over a day, a single day’s traffic is representative of the other days.
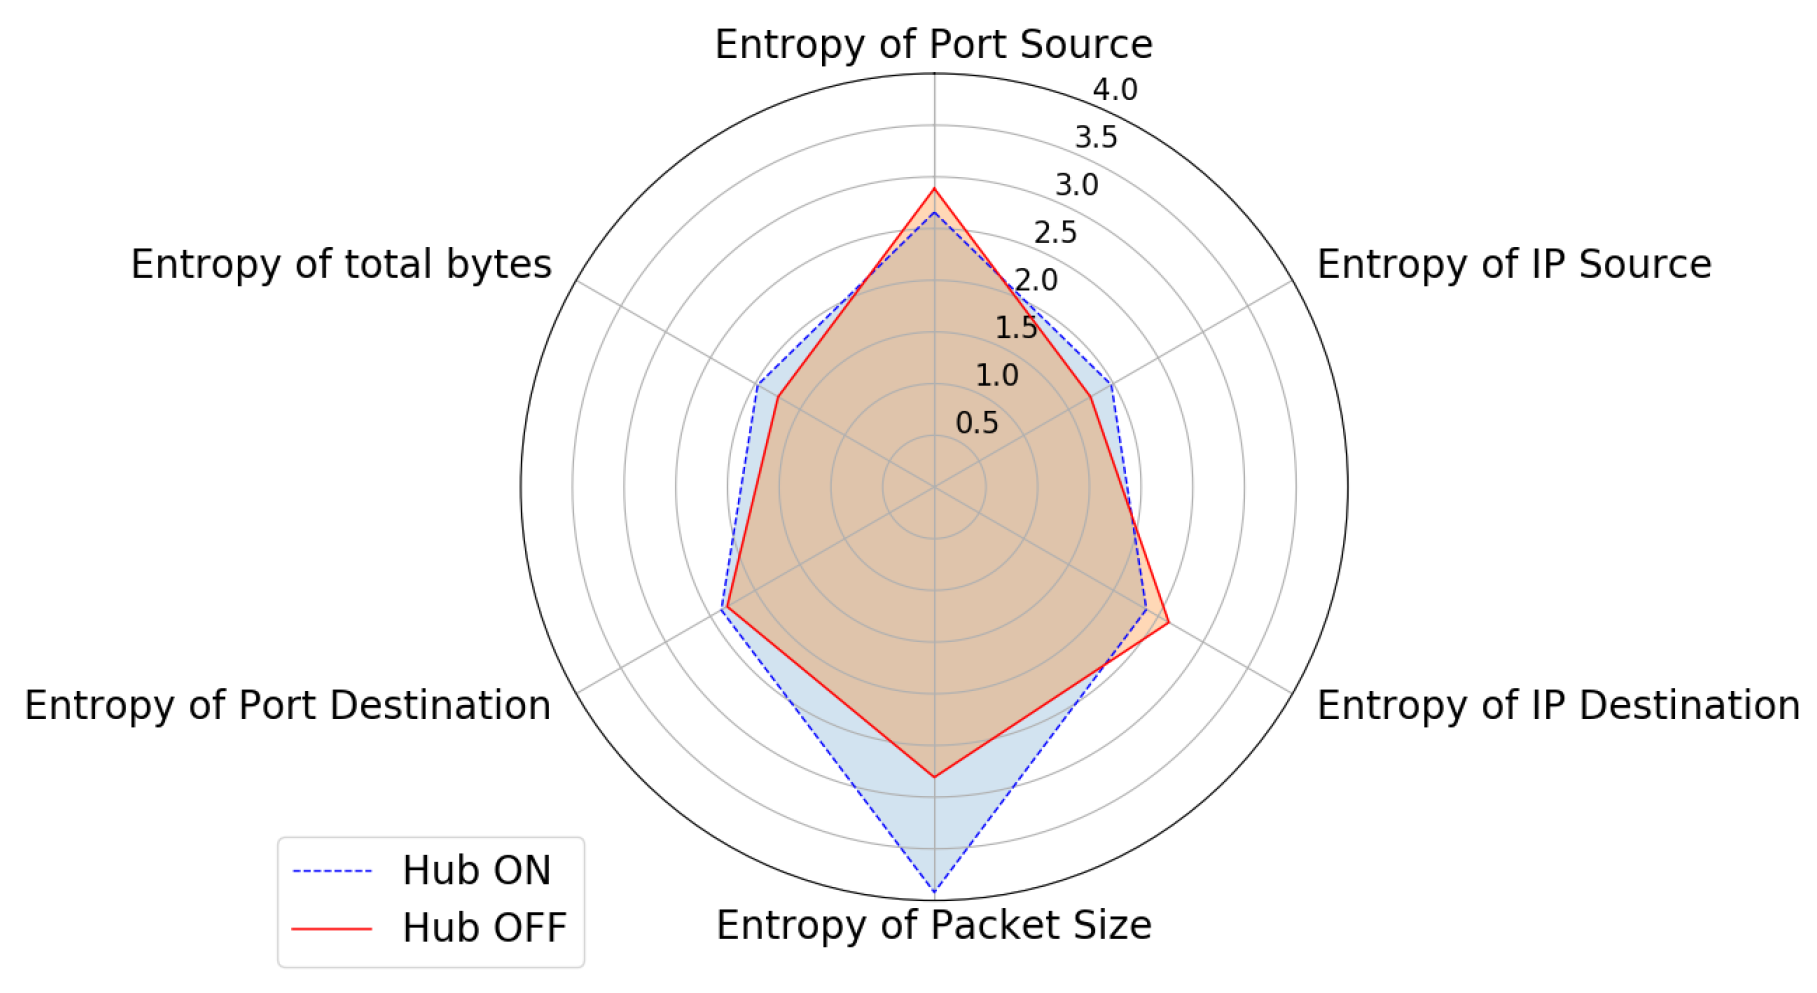
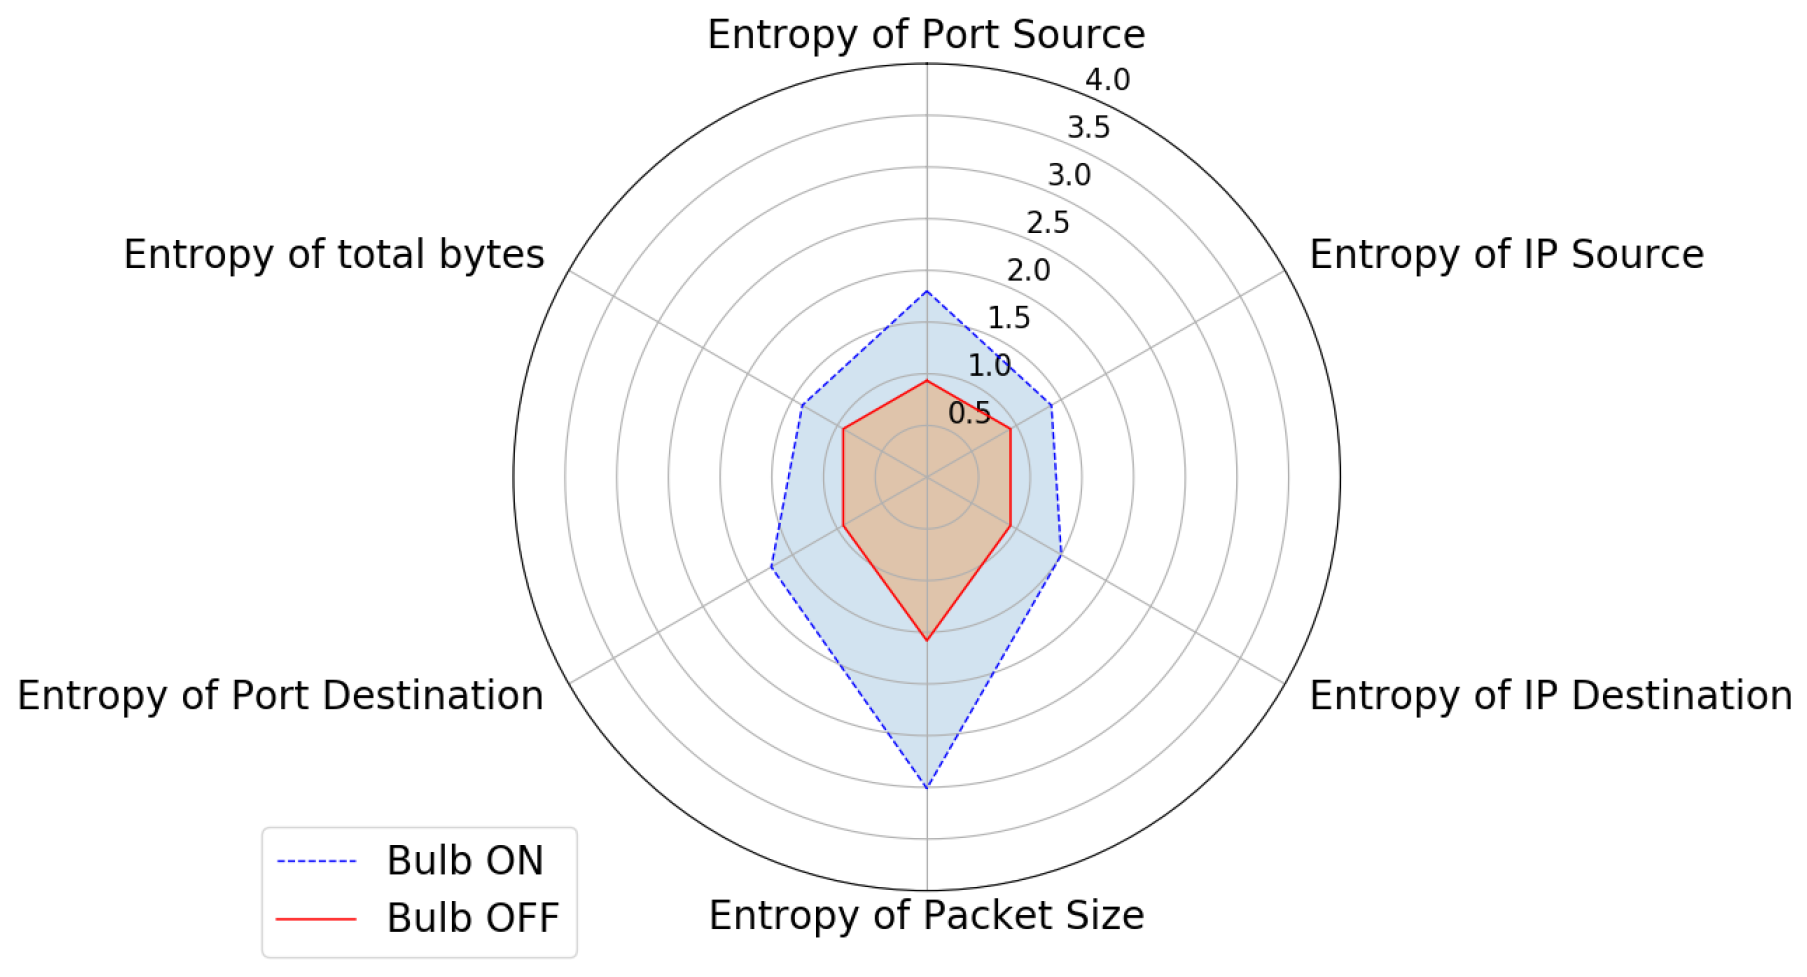
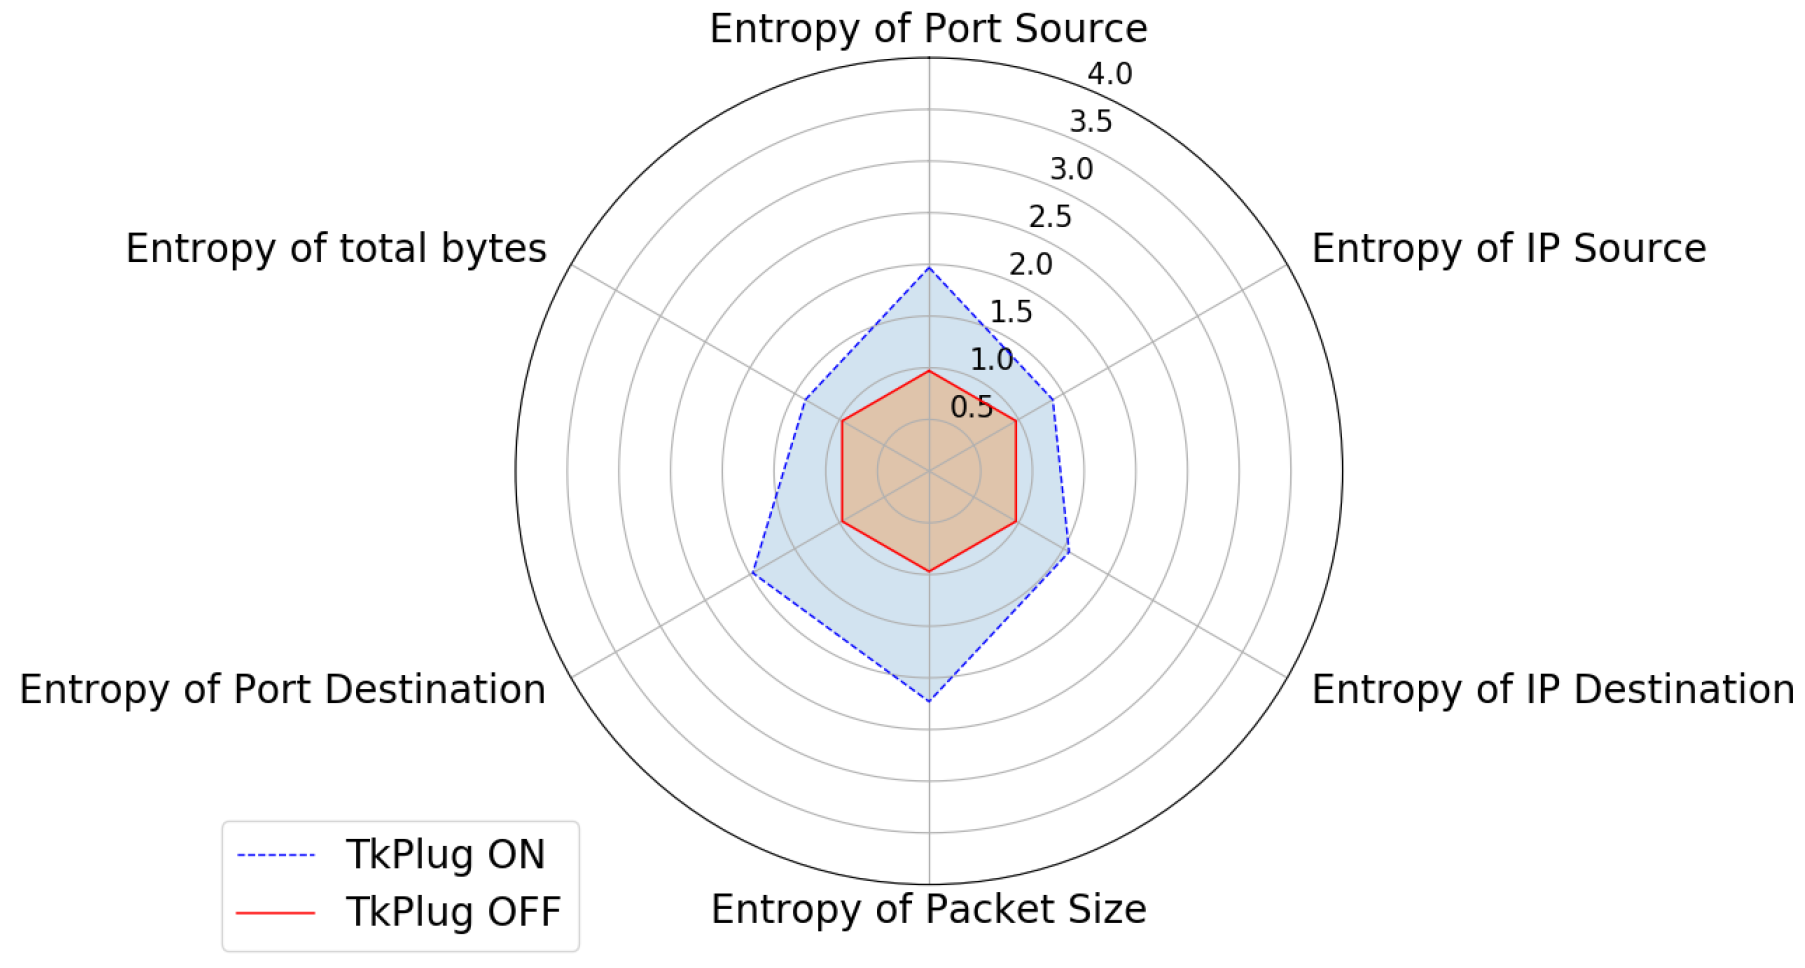
Figure 10, Figure 11, Figure 12, Figure 13 and Figure 14 present the BS graphs for different smart devices during one day. The OFF period area is smaller than that of the ON period, except for the camera. This can be explained by the fact that in the ON period, the camera uses almost only one type of packet, whereas the remaining devices use more diverse types. This leads to a decrease in the entropy value, expressed by a smaller BS area for the camera ON traffic. Moreover, the BS graph for each device is very different, and this BS graph can help to identify the IoT devices. This can be explained by the fact that each device has different characteristics and functionality; hence, they are sending or receiving different kinds of packet. For example, the camera uses many different source ports when sending packets and shows a greater entropy value for the port source (3.7) than that for the hub (2.9) or those of other devices (i.e., the Tpl plug (1.55), Tk plug (2.0), and bulb (1.9)).
Regarding the OFF period, the BS graphs for the camera and hub are larger than those of the other devices. Those devices have many functionalities and generate many more packets, even in the OFF period, than the other devices (the bulb or plugs). The entropy values for such devices reached a higher level.
6.2.3. Synthetic Traffic vs. Measured Traffic under Regular Network Condition
We validated the effectiveness of our generator by comparing synthetic traffic and measured traffic.
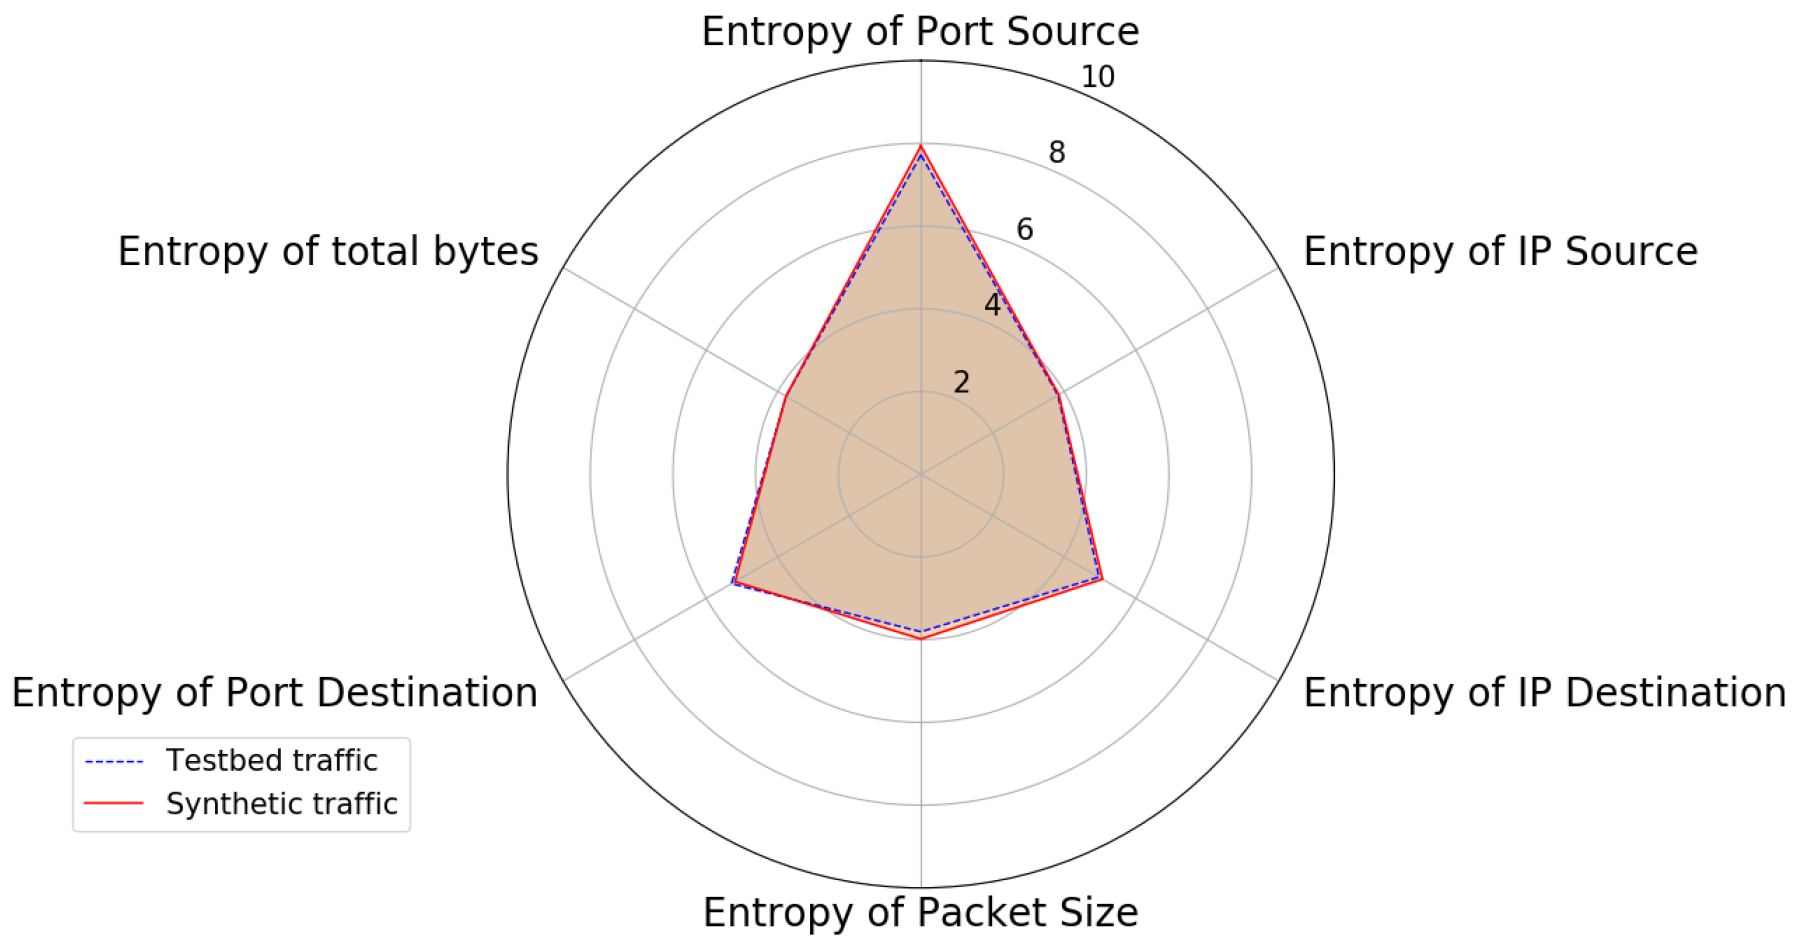
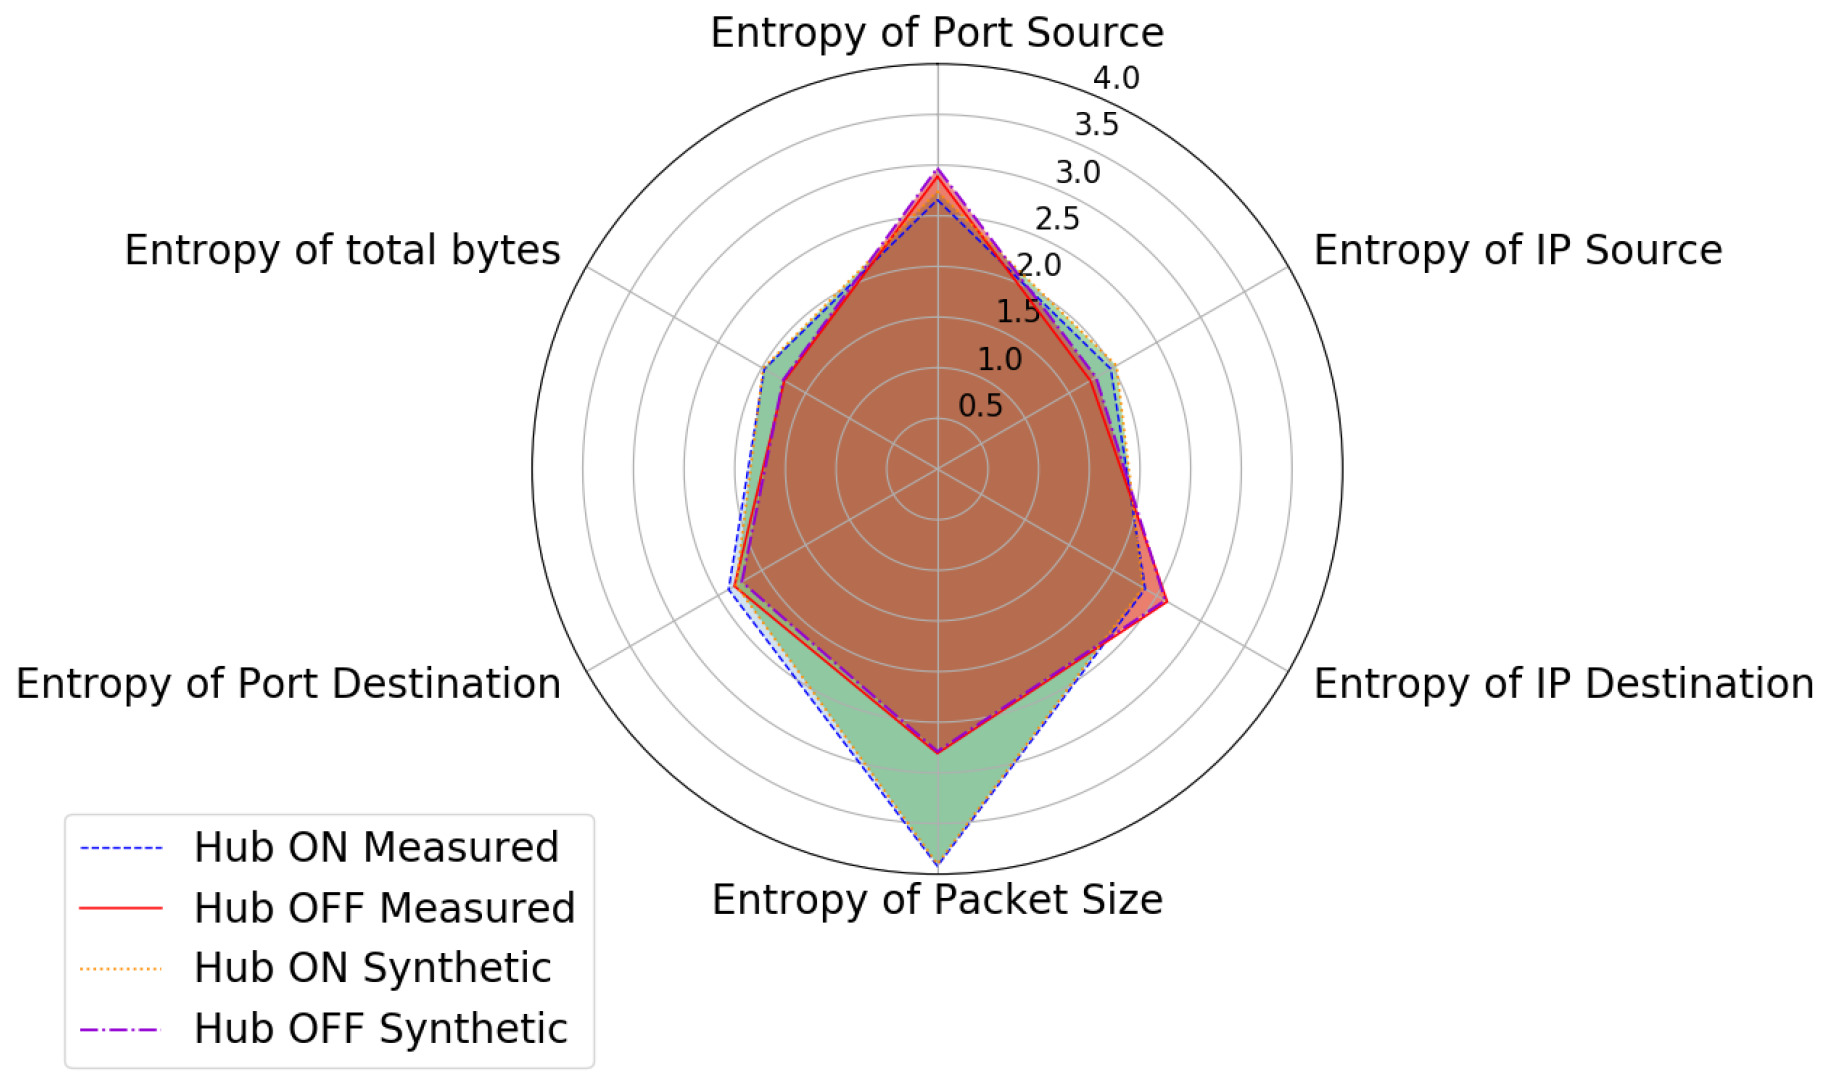
Figure 15 and Figure 16 show the BS graphs of the generated traffic from IoTTGen (based on parameters in Table 8) and testbed, as presented in Section 5.3. The BS graphs of the synthetic traffic with the measured parameters and the measured traffic overlap in both figures and exhibit the same properties. Figure 15 shows that the entropy values were nearly even in pairs of the synthetic traffic and measured traffic. Figure 16 shows that these values are similar when focusing only on the hub device with the ON/OFF activity. This shows that our generator succeeded in modeling the IoT traffic and capturing its main characteristics.
6.3. Anomalous Traffic
The number of packets increased drastically when the network was under attack. Therefore, anomalous traffic had a strong impact on the shape of the IoT traffic. Figure 17, Figure 18, Figure 19, Figure 20 and Figure 21 presents the BS graph of the anomalous traffic (see Section 5.4) for the smart-home environment.
6.3.1. Synthetic Traffic under Network Attack Condition
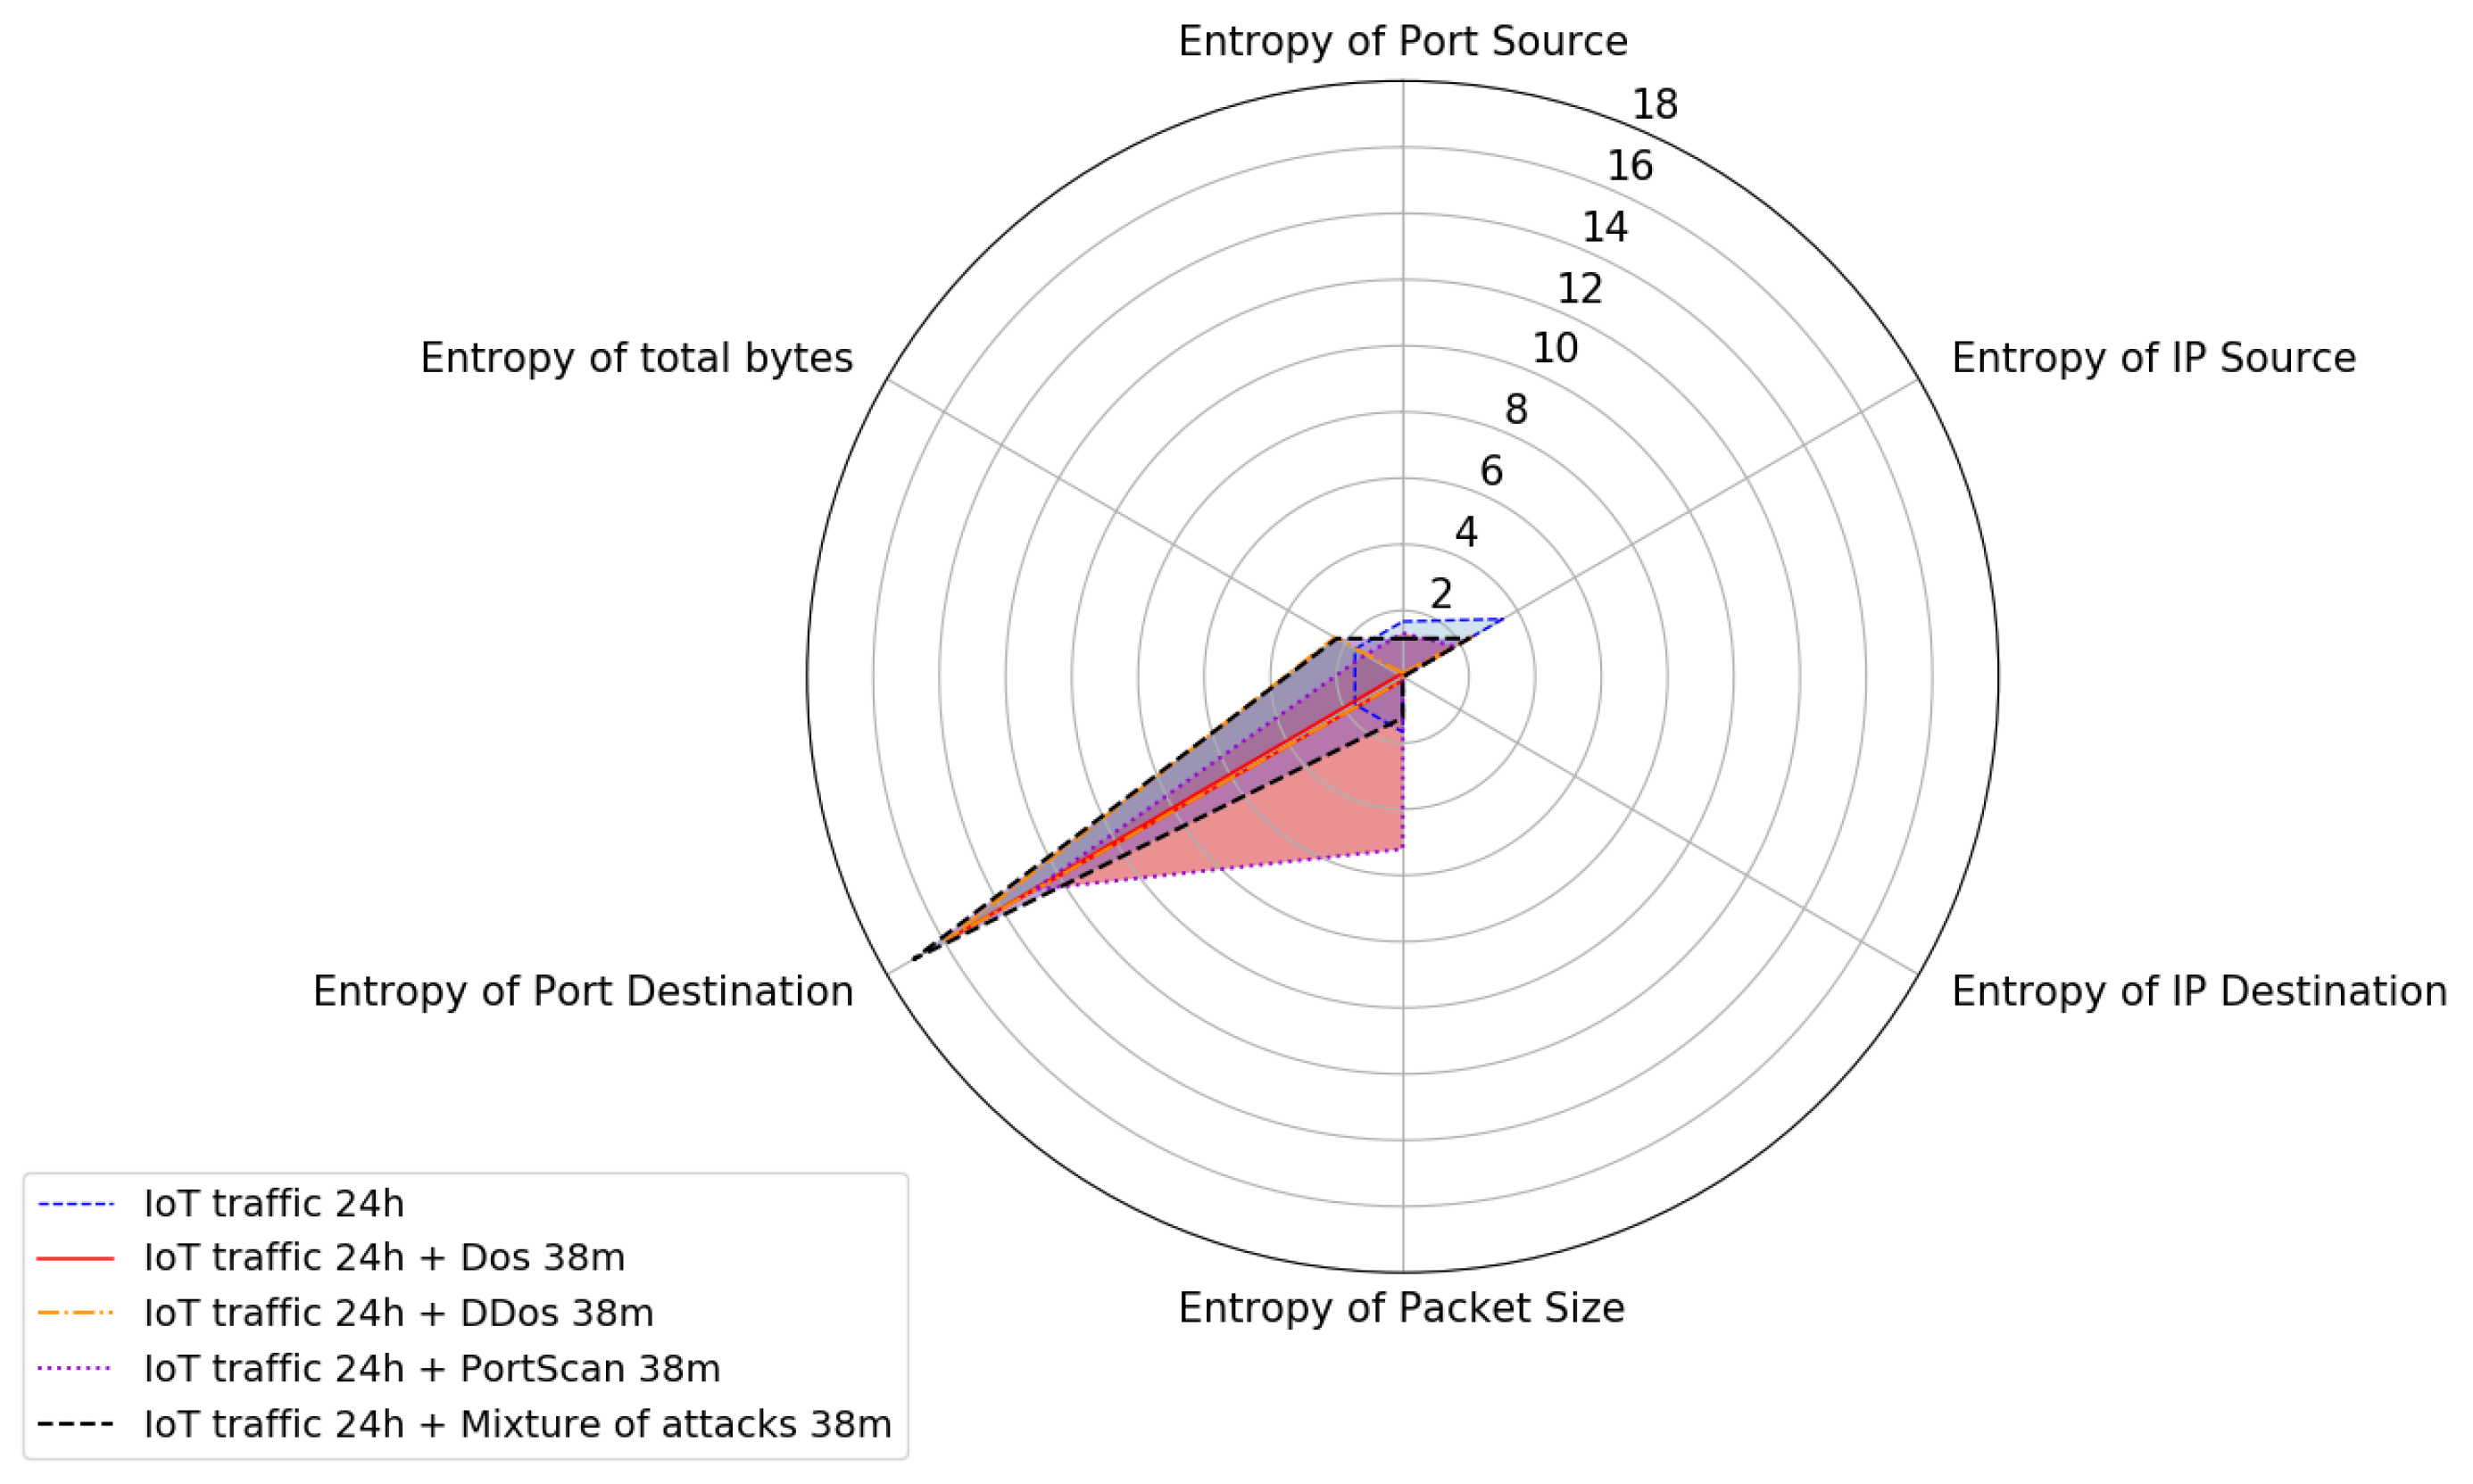
Figure 17 shows the IoT traffic, each of the malicious traffic types (DoS, DDoS, and PS), and the aggregation of all the traffic (IoT and anomalies). As we previously observed, the duration of the experiments had no impact on the entropy values; for this experiment, we focused on the daily activity patterns and present the experiment results for 24 h.
Figure 17 shows that the malicious traffic impacted the entropy values and the BS graph of the IoT traffic.
For all the malicious traffic, there was a higher entropy for the destination port. It was more pronounced for DoS and DDoS (14.5) than for port scanning (). These anomalies come from security threats targeting a large number of destination ports. Thus, it is possible to visually observe such anomalies in the network by computing the entropy value.
Regarding the entropy value of the IP source, the IoT traffic had higher entropy than the other malicious traffic. Remember that traffic was generated by 13 IoT devices for the smart-home environment and that the DDoS was generated by five bots. By contrast, the DoS and port scanning were generated by a single bot, so there were more distinct IP sources in the legitimate traffic, leading to more variations and higher entropy. However, this parameter allowed us to observe variation in the traffic and differentiate the malicious traffic from the legitimate traffic. For the source port, the observation was similar to that for the IP source. The DoS and DDoS relied on a single port to send traffic, so their entropy values reached the lowest value at 0.11. IoT scenarios involve more source ports and show higher entropy.
Regarding the packet size parameter, port scanning reached a higher value than the other traffic, and the DoS and DDoS traffic showed the lowest value. This is because the DoS and DDoS traffic sent only 60-byte packets, whereas the port scanning used various sizes of packets (100 B to 1 MB; Table 10). The IoT traffic also used various packets according to the devices and environment, as shown in Table 5. Thus, there were more variations for port scanning and higher entropy.
The DoS traffic showed lower entropy because the byte count computes the total bytes by IP source, and the entropy depends on the diversity of the packet size and the number of IP sources.
We experimented with computing the entropy level regarding traffic parameters and visually observed the traffic on BS graphs. Different traffic, such as legitimate or malicious traffic, shows different entropy values and has different impacts on a network. Using our IoT generator, we succeeded in picturing IoT traffic characteristics and showed that it is possible to detect anomalies based on entropy and the visual representation of the traffic, such as the behavior shape.
6.3.2. Measured Traffic under Network Attack Condition
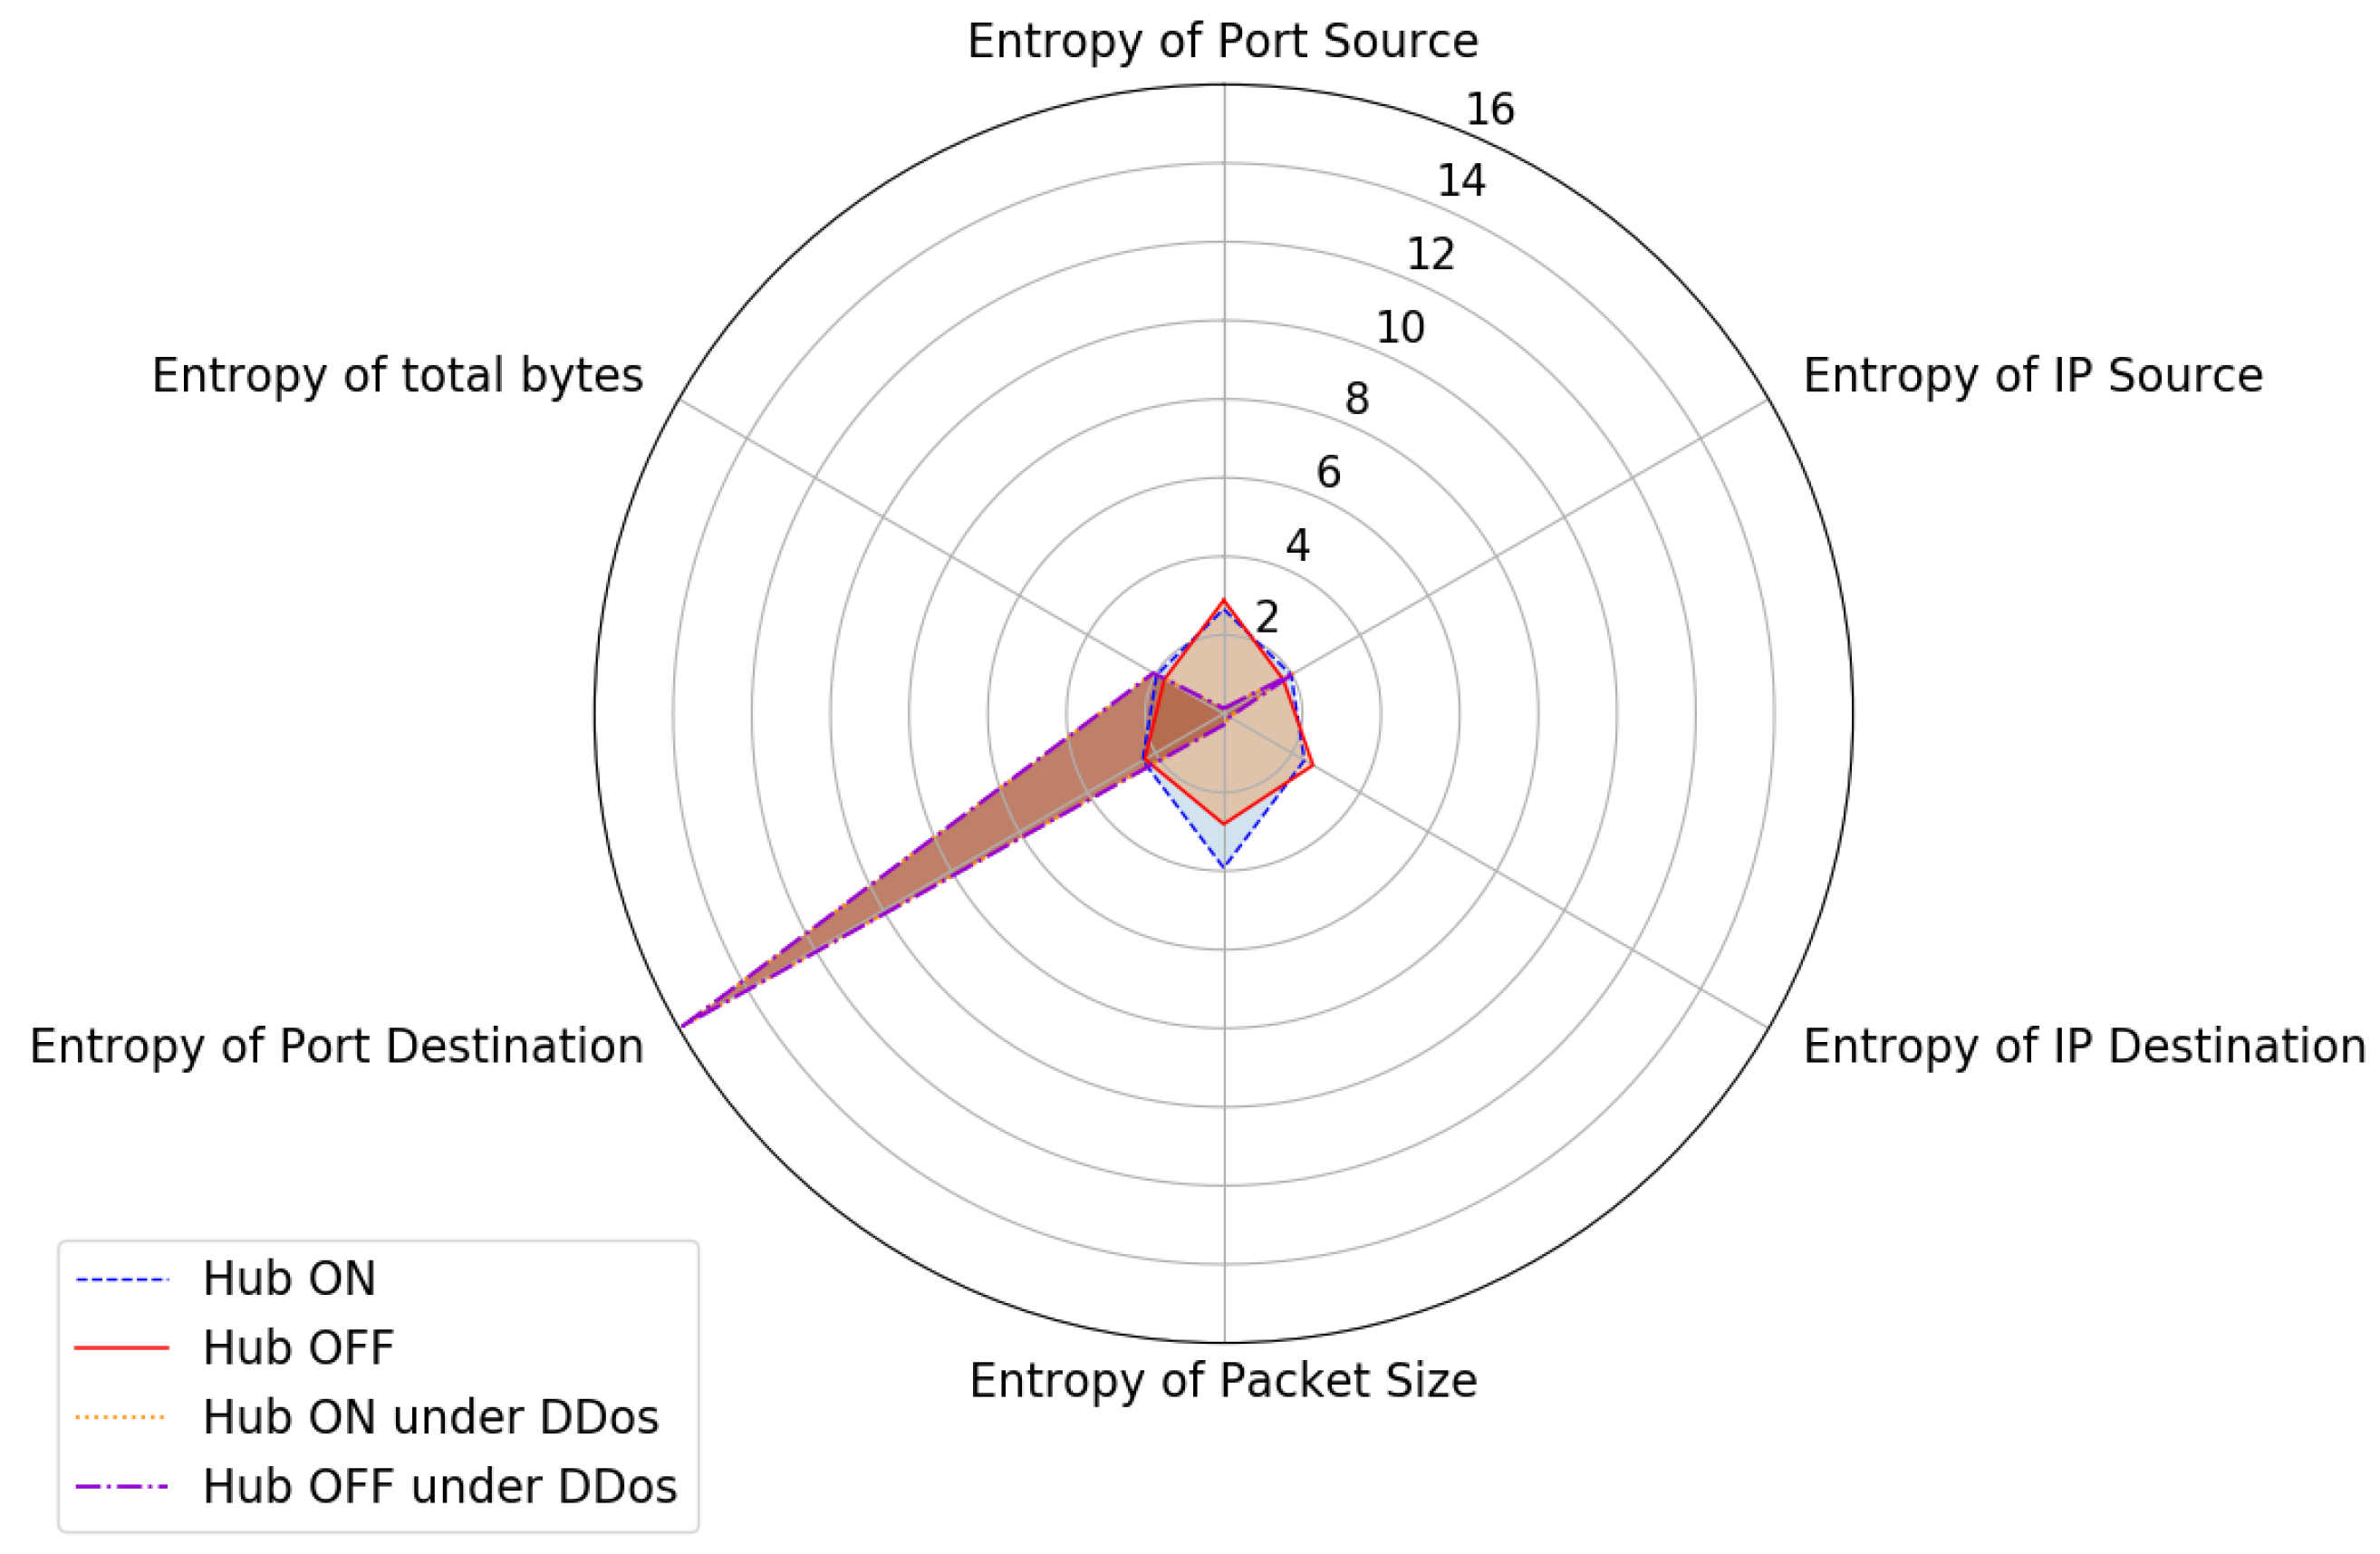
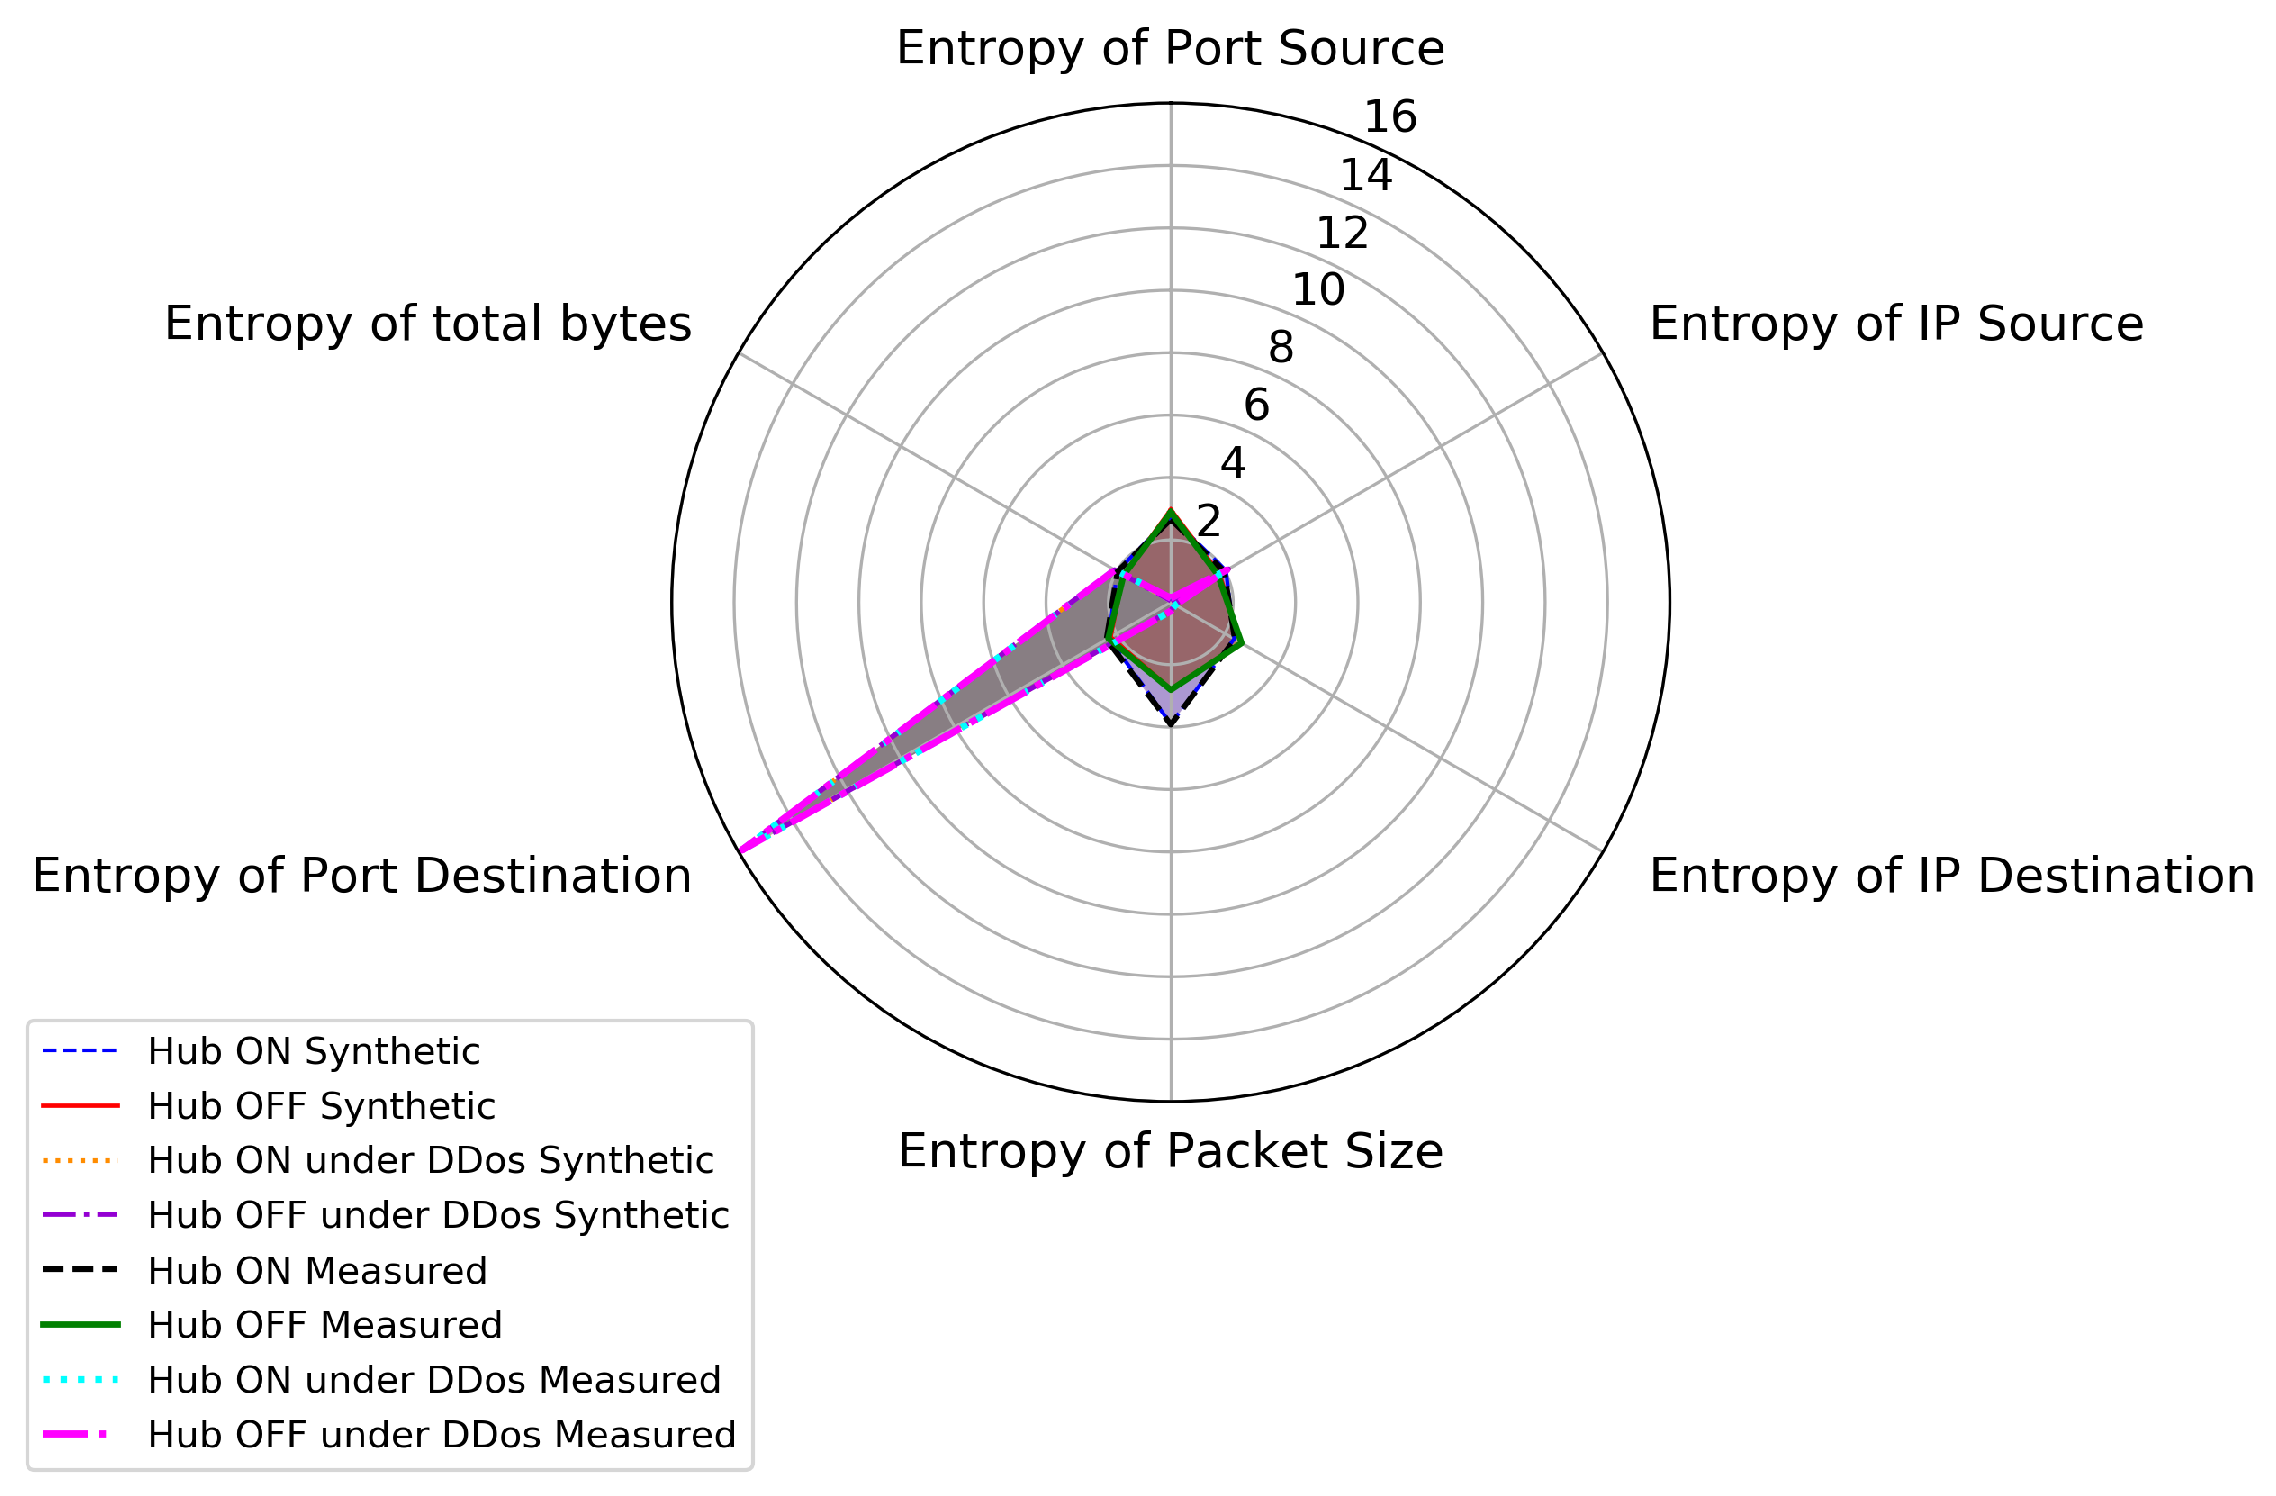
Figure 18 shows that the shape of the hub traffic with DDoS was different from that of the hub traffic. The DDoS exhibited much higher entropy values for port destinations (16) because it targeted many destination ports. For the packet size and port source, the hub traffic had higher entropy than the DDoS traffic. DDoS relies on a single port to send the same size packets, so its traffic entropy for this feature is close to zero. Overall, the BS graph can represent the nature of the traffic.
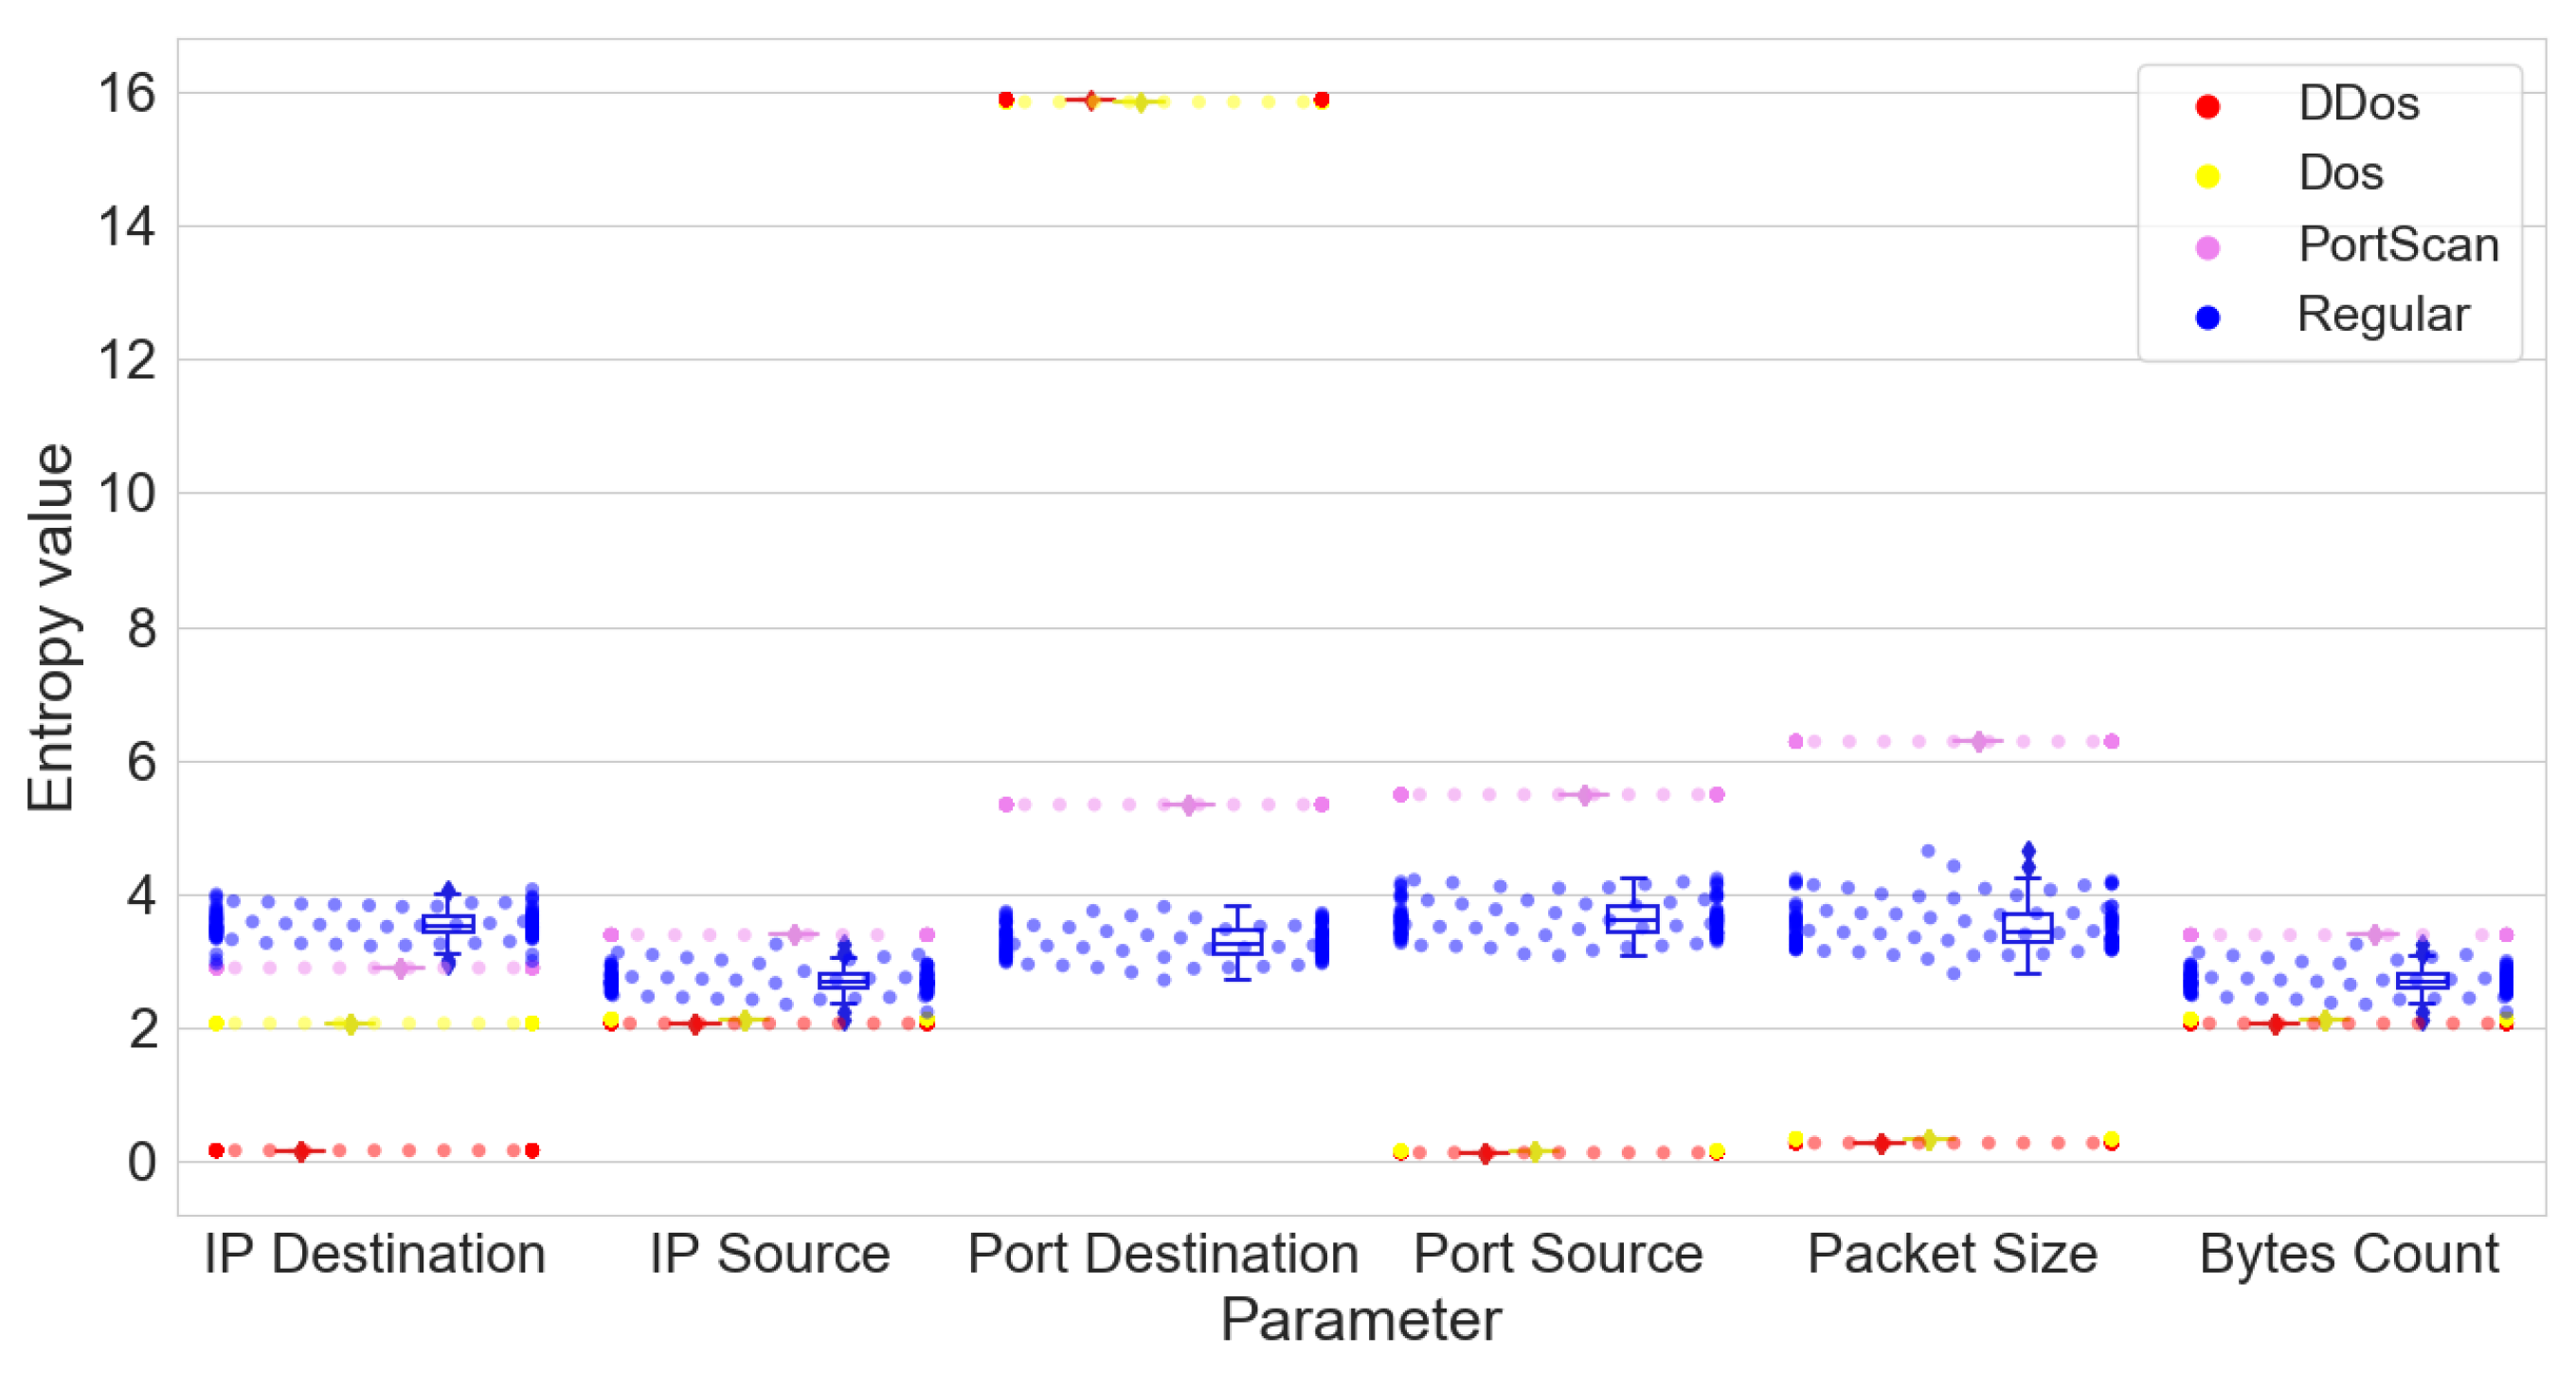
We also compared the entropy values of all the device traffic with those of each type of anomalous traffic. Figure 19 shows the difference between the ranges of the entropy values of the anomalous traffic and normal traffic. The entropy values of the normal traffic always fluctuated within a certain range, and those values of all the anomalous traffic were almost kept stable. Additionally, the minimum or maximum value of the normal traffic was always greater or less than that of the anomalous traffic. From the observation of the entropy value, it is possible to detect anomalies for IoT devices.
6.3.3. Synthetic Traffic vs. Measured Traffic under Network Attack Condition
We also used BS graphs to evaluate the effectiveness of our generator under the influence of anomalous traffic. Figure 20 and Figure 21 show that anomalous traffic directly impacted the shape of the traffic. This impact was equivalent to that of both the synthetic traffic and measured traffic. As analyzed in previous sections, the malicious traffic shapes were still different from those of the legitimate traffic. With different attack cases, the shape of the anomalous synthetic traffic nearly coincided with that of the anomalous measured traffic.
With IoTTGen, we can still model IoT traffic successfully under various network conditions.
7. Entropy-Based IoT Device Identification
Based on the experimental results, we propose a new approach to identifying and classifying IoT devices based on machine learning and traffic entropy values.
7.1. Classification Algorithms
Previously, the entropy values of traffic features showed different characteristics and could help to identify devices. We now aimed at classifying the devices by relying on machine learning algorithms. Our collected one-day trace was split into several 5 min traces. We evaluated the effectiveness of our classification using a 10-fold cross-validation method [50] and then applied it to an independent validation dataset. The dataset was randomly divided into two datasets: the training dataset (80% of the total instances, i.e., 5-min traces) and validation dataset (20% of the total instances).
Using the Weka software [51], we relied on six classification algorithms: (i) decision tree (DT), (ii) random forest (RF), (iii) k-nearest neighbors (KNN), (iv) Gaussian Naive Bayes (NB), (v) neural network (NN), and (vi) support vector machine (SVM). We considered the following metrics for evaluating the algorithms’ performance: the true positive rate (TPR), false positive rate (FPR), precision, recall, and F-measure. Table 11 shows the classification results for these algorithms for the validation dataset for all the devices and network conditions.
In our experiments, the SVM and NN algorithms performed poorly based on the TPR metric: 0.2996 and 0.3137, respectively. NB and DT showed better performance; however, NB only reached an average level of performance (0.5712), and DT reached a higher level and could classify approximately 72% of the IoT devices properly. The RF and KNN algorithms outperformed the other algorithms and showed a high level of performance. KNN succeeded in classifying >92% of the devices, and RF exhibited even higher performance, up to 94.74%. As RF and KNN succeeded in classifying IoT devices based on the entropy value, RF showed the best performance. In the following, we relied on the RF algorithm for computing the classification matrix.
7.2. Confusion Matrix for IoT Identification
Through all our data, we could define 50 classes based on the states of each device and the type of network traffic (normal or anomalous). More precisely, the five devices could be classified into ON or OFF states and under five different network conditions: regular traffic, DDoS, DoS, PS, and the three attacks jointly.
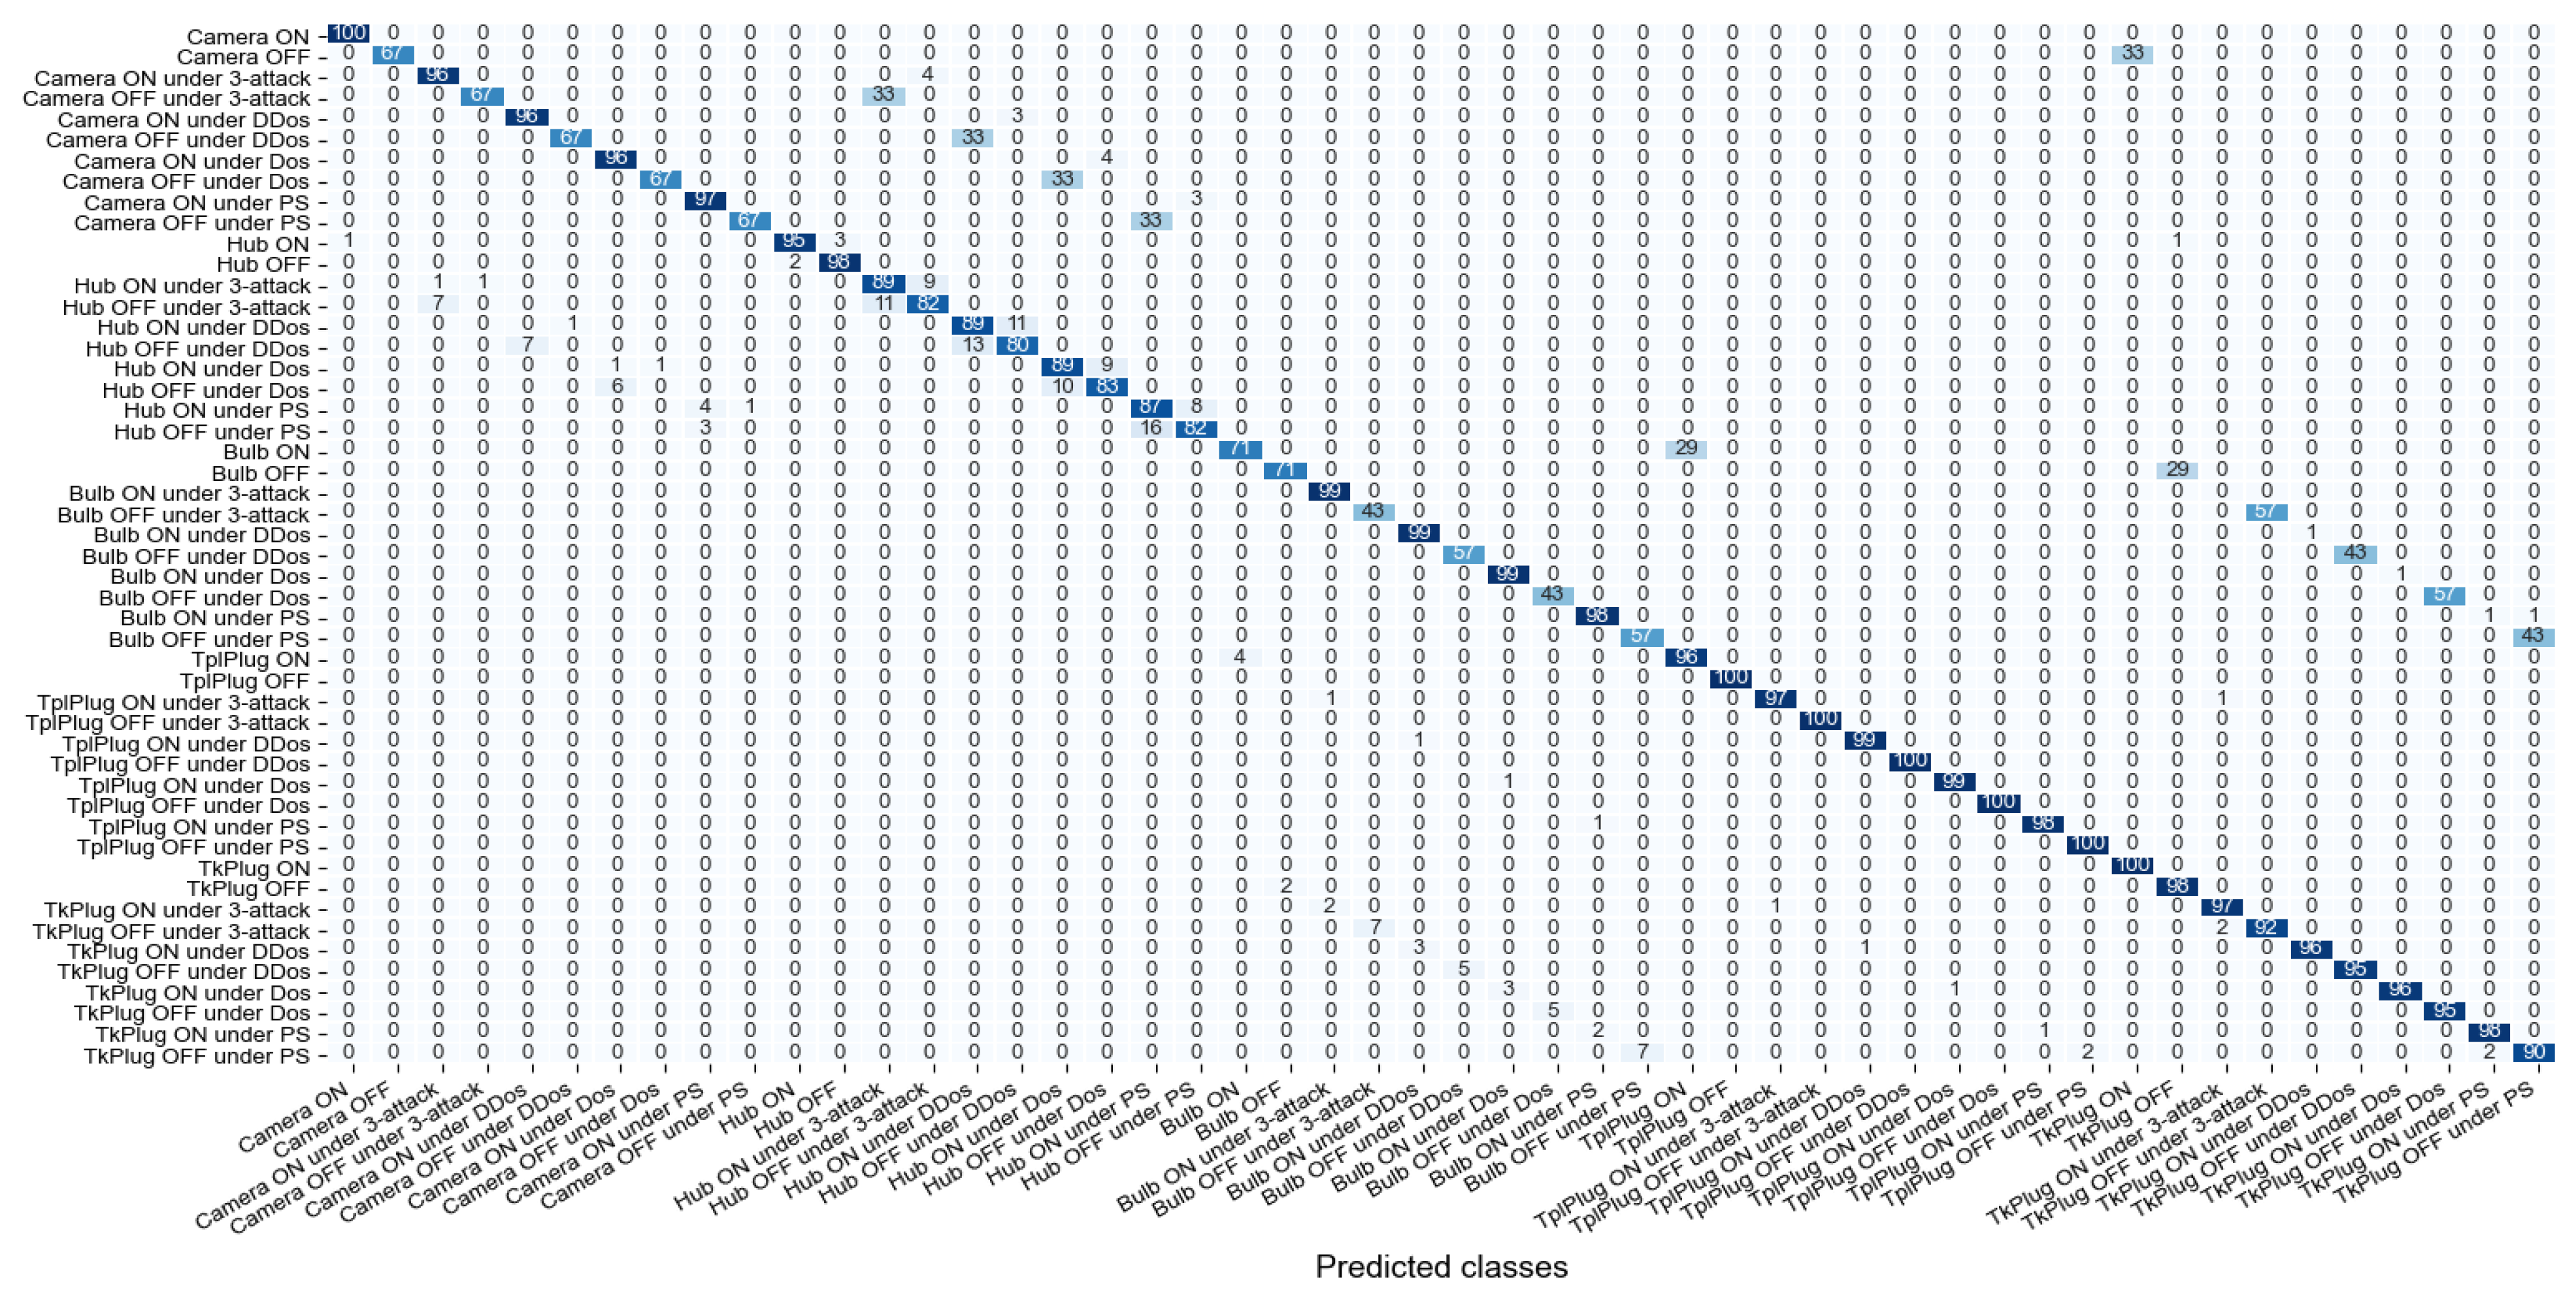
After processing the data with RF, we obtained a probability vector for each class, shown on the confusion matrix (CM) in Figure 22. The accuracy of the classification depends on the ratio of accurate predictions. The CM provides further information on the accuracy of different classifiers and which classes are correctly or incorrectly predicted. It also provides the misclassification type.
Our classification method showed a very high accuracy for detecting the devices under different network conditions for all the devices. For the plugs, 96% of the traffic for these devices were accurately classified. The precision for the hub under the regular network condition was also very high (95%) and still over 80% under anomalous network conditions. The prediction for camera OFF also reached a high level (96%), but the prediction accuracy decreased under network anomalies. Similarly, for the bulb, the prediction was very high for the ON period (98–99%) but dropped drastically with the OFF period (43–57%). The predictions were very accurate with regular traffic and dropped while cyberattacks compromised the network. The intense-activity period (ON) also showed higher accuracy than the no-user-activity period (OFF).
Finally, IoT device classification based on entropy succeeds in identifying IoT devices and under various network conditions.
8. Conclusions
We performed measurement experiments and modeling to study the properties of IoT traffic. We set up a smart-home testbed to collect consumers’ IoT traffic. From these experiments, we derived a new IoT traffic generator tool to model and emulate IoT traffic. Our tool can be used as a scenario composition framework for modeling IoT environments, such as smart homes.
We also extracted IoT anomalies from a public dataset, performed comparisons of synthetic traffic, and generated traffic by computing the entropy of the traffic parameters and observing the BS graphs’ results. The traffic shape differed significantly for different scenarios and each type of smart IoT device, and it was also possible to observe the impact of anomalous traffic. Our traffic generator succeeded in representing the traffic characteristics, and our methodology shows that we can also compare traffic and highlight anomalies.
Furthermore, we introduced a new entropy-based method for identifying IoT devices based on the computation of the entropy values of traffic features. We used machine-learning algorithms, such as RF, to classify the devices based on the IoT traffic’s entropy value in different scenarios. Our results show that our method reached a high level of performance, accurately classifying the devices (94% accuracy), especially in the case of intense activity. We also applied our method under different scenarios and cybersecurity threats, in which it still classified devices accurately.
For future work, we are now using our generator to model other IoT environments and characterize different IoT devices. For instance, we are adapting our generator tool for new scenarios, such as a biomedical or smart factory. Our generator is also being tuned to generate IoT network anomalies and combine them with the measured traffic. It is an essential tool for studying consumer IoT devices in a wide range of scenarios. For visualizing IoT traffic, we are now using the BS graphs to observe and analyze in general. In the future, the similarity of these shapes will be clarified to detect IoT anomalies; for example, we can use the Euclidean distance to evaluate the differences between shapes. Regarding our entropy-based identification method, we are now adapting it to classify IoT devices on the fly. This method could be used in a gateway to immediately detect legitimate or malicious devices in the network environment. Furthermore, other deep-learning algorithms or feature selection methods will be applied to our dataset to improve and evaluate the performance of our method.
Author Contributions
Conceptualization, H.N.-A., T.S. and T.M.; methodology, H.N.-A. and T.S.; software, H.N.-A. and T.S.; validation, H.N.-A., T.S., T.Y. and T.M.; formal analysis, H.N.-A. and T.S.; investigation, H.N.-A., T.S. and T.M.; resources, H.N.-A., T.S. and T.M.; data curation, H.N.-A. and T.S.; writing—original draft preparation, H.N.-A. and T.S.; writing—review and editing, H.N.-A., T.S., T.Y. and T.M.; visualization, H.N.-A. and T.S.; supervision, T.S. and T.M.; project administration, T.S. and T.M.; funding acquisition, T.S., T.Y., and T.M. All authors have read and agreed to the published version of the manuscript.
Funding
This work was supported by JSPS KAKENHI Grant Number JP18K11287.
Conflicts of Interest
The authors declare no conflict of interest.
References
- International Data Corporation: Worldwide Global DataSphere IoT Device and Data Forecast, 2019–2023. Available online: https://www.iotplaybook.com/tags/worldwide-global-datasphere-iot-device-and-data-forecast-2019-2023 (accessed on 21 June 2019).
- Alaa, M.; Zaidan, A.A.; Zaidan, B.B.; Talal, M.; Kiah, M.L.M. A review of smart home applications based on Internet of Things. J. Netw. Comput. Appl. 2017, 97, 48–65. [Google Scholar] [CrossRef]
- Nguyen-An, H.; Silverston, T.; Yamazaki, T.; Miyoshi, T. Generating IoT traffic: A Case Study on Anomaly Detection. In Proceedings of the IEEE International Symposium on Local and Metropolitan Area Networks, Orlando, FL, USA, 13–15 July 2020; pp. 1–6. [Google Scholar]
- Bello, O.; Zeadally, S. Communication issues in the Internet of Things (IoT). In Next-Generation Wireless Technologies; Springer: London, UK, 2013; pp. 189–219. [Google Scholar]
- Nguyen-An, H.; Silverston, T.; Yamazaki, T.; Miyoshi, T. Entropy-based IoT Devices Identification. In Proceedings of the Asia-Pacific Network Operations and Management Symposium, Daegu, Korea, 23–25 September 2020; pp. 73–78. [Google Scholar]
- Molnár, S.; Megyesi, P.; Szabó, G. How to Validate Traffic Generators? Available online: https://www.researchgate.net/publication/261087165_How_to_validate_traffic_generators (accessed on 20 February 2021).
- Mishra, S.; Sonavane, S.; Gupta, A. Study of traffic generation tools. IJARCCE 2015, 4, 4–7. [Google Scholar]
- Kolias, C.; Kambourakis, G.; Stavrou, A.; Voas, J. DDoS in the IoT: Mirai and other botnets. Computer 2017, 50, 80–84. [Google Scholar] [CrossRef]
- Woo, S.; Jo, H.J.; Lee, D.H. A practical wireless attack on the connected car and security protocol for in-vehicle CAN. IEEE Trans. Intell. Transp. Syst. 2014, 16, 993–1006. [Google Scholar] [CrossRef]
- 5 Infamous IoT Hacks and Vulnerabilities. IoT World Congress 2018. Available online: https://www.iotsworldcongress.com/5-infamous-iot-hacks-and-vulnerabilities/ (accessed on 11 September 2020).
- Wang, E.K.; Liu, X.; Chen, C.-M.; Kumari, S.; Shojafar, M.; Hossain, M.S. Voice-Transfer Attacking on Industrial Voice Control Systems in 5G-Aided IIoT Domain. Available online: https://0-ieeexplore-ieee-org.brum.beds.ac.uk/document/9195003 (accessed on 11 September 2020).
- Avallone, S.; Guadagno, S.; Emma, D.; Pescapè, A.; Ventre, G. D-ITG distributed internet traffic generator. In Proceedings of the First International Conference on the Quantitative Evaluation of Systems, Enschede, The Netherlands, 27–30 September 2004; pp. 316–317. [Google Scholar]
- Jemec, M. PackETH, Open Source Ethernet Packet Generator. Available online: http://packeth.sourceforge.net/ (accessed on 20 February 2021).
- Olsson, R. Pktgen the linux packet generator. Proc. Linux Symp. 2005, 2, 11–24. [Google Scholar]
- Gates, M.; Tirumala, A.; Dugan, J.; Gibbs, K. Iperf 1.2-The TCP/UDP Bandwidth Measurement Tool. Iperf Proj. 2005. Available online: http://sourceforge.net/projects/iperf/ (accessed on 20 February 2021).
- Patil, B.R.; Moharir, M.; Mohanty, P.K.; Shobha, G.; Sajeev, S. Ostinato-A Powerful Traffic Generator. In Proceedings of the 2017 2nd International Conference on Computational Systems and Information Technology for Sustainable Solution (CSITSS), Bengaluru, India, 21–23 December 2017; pp. 1–5. [Google Scholar]
- Telecom, ZTI. IP Traffic-Test & Measure. 2013. Available online: http://www.zti-telecom.com (accessed on 20 February 2021).
- Shahid, M.R.; Blanc, G.; Zhang, Z.; Debar, H. Iot devices recognition through network traffic analysis. In Proceedings of the IEEE International Conference on Big Data, Seattle, WA, USA, 10–13 December 2018; pp. 5187–5192. [Google Scholar]
- Koroniotis, N.; Moustafa, N.; Sitnikova, E.; Turnbull, B. Towards the development of realistic botnet dataset in the internet of things for network forensic analytics: Bot-iot dataset. Future Gener. Comput. Syst. 2019, 100, 779–796. [Google Scholar] [CrossRef] [Green Version]
- Ferrando, R.; Stacey, P. Classification of device behaviour in internet of things infrastructures: Towards distinguishing the abnormal from security threats. In Proceedings of the 1st International Conference on Internet of Things and Machine Learning, New York, NY, USA, 17–18 October 2017; pp. 1–7. [Google Scholar]
- Feng, Y.; Deng, L.; Chen, D. IoT devices discovery and identification using network traffic data: Poster. In Proceedings of the 12th Conference on Security and Privacy in Wireless and Mobile Networks, New York, NY, USA, 15–17 May 2019; pp. 338–339. [Google Scholar]
- Bezawada, B.; Bachani, M.; Peterson, J.; Shirazi, H.; Ray, I.; Ray, I. Iotsense: Behavioral Fingerprinting of IoT Devices. Available online: https://arxiv.org/pdf/1804.03852.pdf (accessed on 20 February 2021).
- Ortiz, J.; Crawford, C.; Le, F. DeviceMien: Network device behavior modeling for identifying unknown IoT devices. In Proceedings of the International Conference on Internet of Things Design and Implementation, Montreal, QC, Canada, 15–18 April 2019; pp. 106–117. [Google Scholar]
- Bereziński, P.; Jasiul, B.; Szpyrka, M. An entropy-based network anomaly detection method. Entropy 2015, 17, 2367–2408. [Google Scholar] [CrossRef]
- Bereziński, P.; Szpyrka, M.; Jasiul, B.; Mazur, M. Network anomaly detection using parameterized entropy. In IFIP International Conference on Computer Information Systems and Industrial Management; Springer: Berlin/Heidelberg, Germany, 2015; pp. 465–478. [Google Scholar]
- Nychis, G.; Sekar, V.; Andersen, D.G.; Kim, H.; Zhang, H. An empirical evaluation of entropy-based traffic anomaly detection. In Proceedings of the 8th ACM SIGCOMM Conference on Internet Measurement, Vouliagmeni, Greece, 20–22 October 2008; pp. 151–156. [Google Scholar]
- Shukla, A.S.; Maurya, R. Entropy-Based Anomaly Detection. Wirel. Pers. Commun. 2018, 99, 1487–1501. [Google Scholar] [CrossRef]
- Callegari, C.; Giordano, S.; Pagano, M. Entropy-based network anomaly detection. In Proceedings of the International Conference on Computing, Networking and Communications (ICNC), Silicon Valley, CA, USA, 26–29 January 2017; pp. 334–340. [Google Scholar]
- Arnaboldi, L.; Morisset, C. Generating synthetic data for real world detection of DoS attacks in the IoT. In Federation of International Conferences on Software Technologies: Applications and Foundations; Springer: Cham, Switzerland, 2018; pp. 130–145. [Google Scholar]
- Erlacher, F.; Dressler, F. How to Test an IDS? GENESIDS: An Automated System for Generating Attack Traffic. In Proceedings of the Workshop on Traffic Measurements for Cybersecurity, Budapest, Hungary, 20 August 2018; pp. 46–51. [Google Scholar]
- Huang, K.; Zhang, Q.; Zhou, C.; Xiong, N.; Qin, Y. An efficient intrusion detection approach for visual sensor networks based on traffic pattern learning. IEEE Trans. Syst. Man Cybern. Syst. 2017, 47, 2704–2713. [Google Scholar] [CrossRef]
- Salem, O.; Liu, Y.; Mehaoua, A. Anomaly detection in medical wireless sensor networks. J. Comput. Sci. Eng. 2013, 7, 272–284. [Google Scholar] [CrossRef]
- Casas, P.; Fiadino, P.; D’Alconzo, A. Machine-Learning Based Approaches for Anomaly Detection and Classification in Cellular Networks. In Proceedings of the 8th Traffic Monitoring and Analysis (TMA2016) Workshop, Louvain La Neuve, Belgium, 7–8 April 2016. [Google Scholar]
- Özçelik, M.; Chalabianloo, N.; Gür, G. Software-defined edge defense against IoT-based DDoS. In Proceedings of the IEEE International Conference on Computer and Information Technology (CIT), Helsinki, Finland, 21–23 August 2017; pp. 308–313. [Google Scholar]
- Fu, Y.; Yan, Z.; Cao, J.; Koné, O.; Cao, X. An automata based intrusion detection method for internet of things. Mob. Inf. Syst. 2017. [Google Scholar] [CrossRef] [Green Version]
- Gajewski, M.; Batalla, J.M.; Levi, A.; Togay, C.; Mavromoustakis, C.X.; Mastorakis, G. Two-tier anomaly detection based on traffic profiling of the home automation system. Comput. Netw. 2019, 158, 46–60. [Google Scholar] [CrossRef]
- Martin, V.; Cao, Q.; Benson, T. Fending off IoT-hunting attacks at home networks. In Proceedings of the 2nd Workshop on Cloud-Assisted Networking, Incheon, Korea, 12 December 2017; pp. 67–72. [Google Scholar]
- Summerville, D.H.; Zach, K.M.; Chen, Y. Ultra-lightweight deep packet anomaly detection for Internet of Things devices. In Proceedings of the IEEE 34th International Performance Computing and Communications Conference, Nanjing, China, 14–16 December 2015; pp. 1–8. [Google Scholar]
- Danda, J.M.R.; Hota, C. Attack identification framework for IoT devices. In Proceedings of the Information Systems Design and Intelligent Applications, Visakhapatnam, India, 8–9 January 2016; pp. 505–513. [Google Scholar]
- Wang, K.; Xu, P.; Chen, C.-M.; Kumari, S.; Shojafar, M.; Alazab, M. Neural Architecture Search for Robust Networks in 6G-enabled Massive IoT Domain. IEEE Int. Things J. 2020. [Google Scholar] [CrossRef]
- Adjih, C.; Baccelli, E.; Fleury, E.; Harter, G.; Mitton, N.; Noel, T.; Watteyne, T. FIT IoT-LAB: A large scale open experimental IoT testbed. In Proceedings of the IEEE 2nd World Forum on Internet of Things, Milan, Italy, 14–16 December 2015; pp. 459–464. [Google Scholar]
- Chatzigiannakis, I.; Fischer, S.; Koninis, C.; Mylonas, G.; Pfisterer, D. WISEBED: An open large-scale wireless sensor network testbed. In International Conference on Sensor Applications, Experimentation and Logistics; Springer: Berlin/Heidelberg, Germany, 2009; pp. 68–87. [Google Scholar]
- Apthorpe, N.; Reisman, D.; Feamster, N. A smart home is no castle: Privacy vulnerabilities of encrypted iot traffic. arXiv 2017, arXiv:1705.06805. [Google Scholar]
- Anthi, E.; Williams, L.; Burnap, P. Pulse: An adaptive intrusion detection for the internet of things. In Living in the Internet of Things: Cybersecurity of the IoT; IET: London, UK, 2018; pp. 1–4. [Google Scholar]
- Ammar, N.; Noirie, L.; Tixeuil, S. Network-Protocol-Based IoT Device Identification. In Proceedings of the Fourth International Conference on Fog and Mobile Edge Computing, Rome, Italy, 10–13 June 2019; pp. 204–209. [Google Scholar]
- Ooka, R.; Miyoshi, T.; Yamazaki, T. Unit traffic classification and analysis on P2P video delivery using machine learning. IEICE Commun. Express (ComEX) 2019, 8, 640–645. [Google Scholar] [CrossRef] [Green Version]
- Scapy Project. Biondi. 2014. Available online: http://www.secdev.org/projects/scapy (accessed on 20 February 2021).
- Sivanathan, A.; Sherratt, D.; Gharakheili, H.H.; Radford, A.; Wijenayake, C.; Vishwanath, A.; Sivaraman, V. Characterizing and classifying IoT traffic in smart cities and campuses. In Proceedings of the 2017 IEEE Conference on Computer Communications Workshops (INFOCOM WKSHPS), Atlanta, GA, USA, 1–4 May 2017; pp. 559–564. [Google Scholar]
- Crichigno, J.; Kfoury, E.; Bou-Harb, E.; Ghani, N.; Prieto, Y.; Vega, C.; Pezoa, J.; Huang, C.; Torres, D. A Flow-based Entropy Characterization of a NATed Network and its Application on Intrusion Detection. In Proceedings of the IEEE International Conference on Communications (ICC), Shanghai, China, 20–24 May 2019; pp. 1–7.
- Refaeilzadeh, P.; Tang, L.; Liu, H. Cross-Validation. Encycl. Database Syst. 2009, 5, 532–538. [Google Scholar]
- Hall, M.; Frank, E.; Holmes, G.; Pfahringer, B.; Reutemann, P.; Witten, I.H. The WEKA data mining software: An update. ACM SIGKDD Explor. Newsl. 2009, 11, 10–18. [Google Scholar] [CrossRef]
Figure 1.
Smart-home testbed.

Figure 2.
Testbed for IoT traffic.

Figure 3.
IoTTGen: packet generation process.

Figure 4.
Smart-home scenario for synthetic traffic.

Figure 5.
Behavior shape: synthetic traffic with custom and extracted parameters.

Figure 6.
Comparison of 5 devices and 52 devices in terms of synthetic traffic with measured parameters.
Figure 6.
Comparison of 5 devices and 52 devices in terms of synthetic traffic with measured parameters.

Figure 7.
Synthetic traffic with extracted parameters and extracted anomaly traffic.

Figure 8.
Behavior shape: synthetic traffic with extracted parameters.

Figure 9.
Behavior shape of the measured traffic over five consecutive days.

Figure 10.
Behavior shape of the measured camera traffic.

Figure 11.
Behavior shape of the measured hub traffic.

Figure 12.
Behavior shape of the measured bulb traffic.

Figure 13.
Behavior shape of the measured Tpl plug traffic.

Figure 14.
Behavior shape of the measured Tk plug traffic.

Figure 15.
Behavior shape: synthetic traffic with measured parameters and measured traffic.

Figure 16.
Behavior shape of the hub traffic: synthetic traffic with measured parameters and measured traffic.
Figure 16.
Behavior shape of the hub traffic: synthetic traffic with measured parameters and measured traffic.

Figure 17.
Behavior shape: synthetic traffic with extracted parameters and anomalous traffic.

Figure 18.
Behavior shape of the measured hub traffic with DDoS.

Figure 19.
Entropy for normal and anomalous measured traffic.

Figure 20.
Behavior shape of the hub traffic under DDoS: synthetic traffic with measured parameters, measured traffic, and anomalous traffic.
Figure 20.
Behavior shape of the hub traffic under DDoS: synthetic traffic with measured parameters, measured traffic, and anomalous traffic.

Figure 21.
Behavior shape: synthetic traffic with measured parameters, measured traffic, and anomalous traffic.
Figure 21.
Behavior shape: synthetic traffic with measured parameters, measured traffic, and anomalous traffic.

Figure 22.
Confusion matrix for RF classification algorithm.


Table 1.
Traffic generators from previous studies.
| Traffic Generator | Transport Protocol | Interface | Open Source | IoT Traffic |
|---|---|---|---|---|
| D-ITG [12] | UDP, TCP, DCCP, SCTP, ICMP | Command line | ✓ | x |
| PackETH [13] | UDP, TCP, ICMP, IGMP | GUI, command line | x | x |
| PktGen [14] | UDP, TCP, ARP, ICMP, GRE, MPLS | Command line | ✓ | x |
| Iperf [15] | UDP, TCP, SCTP | Command line | ✓ | x |
| Ostinato [16] | TCP, UDP, ICMP, IGMP, MLD | GUI | ✓ | x |
| IP-Traffic [17] | UDP, TCP, ICMP | GUI | x | x |
| IoTTGen [3] | UDP, TCP, ICMP | Command line | ✓ | ✓ |
Table 2.
Internet of things (IoT) testbeds from previous studies.
| Testbed | Number of | Manufacturers | Type of IoT Device | |
|---|---|---|---|---|
| IoT Devices | Other Devices | |||
| Adjih et al. [41] | 2845 | 0 | WSN430, M3, A8, Turtlebot, Wifibot | Sensor, mobile robot |
| Chatzigiannakis et al. [42] | >750 | 0 | Pacemate, iSense, TelosB, MicaZ, SunSPOT, Tmote Sky, MSB-A2 | Sensor |
| Feng et al. [21] | 11 | 0 | Samsung, Insteon, YI, Belkin, Wemo, Z-Wave, Raspberry | Hub, camera, plug, sensor |
| Ammar et al. [45] | 7 | 5 | D-Link, Panasonic, TRENDnet, Philips, Chromecast | Camera, light, speaker, TV |
| Anthi et al. [44] | 7 | 3 | Amazon, Belkin, TP-link, Hive, Apple, HP | Hub, camera, plug, sensor, TV, printer |
| Apthorpe et al. [43] | 4 | 0 | Amazon, Nest, Belkin, Sense | Hub, camera, plug, monitor |
| Shahid et al. [18] | 4 | 0 | TP-link, Nest, D-Link | Light, camera, plug, sensor |
| Our testbed [5] | 5 | 0 | Amazon, TP-link, Lefun, Teckin | Hub, camera, light, plug |
Table 3.
Smart-home testbed.
| Manufacturers | Model | Number of Devices | |
|---|---|---|---|
| Smart hub | Amazon | Echo Dot | 1 |
| Smart light | TP-link | Kasa Wi-Fi Smart Bulb | 1 |
| Smart camera | Lefun | Indoor Security Camera | 1 |
| Smart plug | TP-link | Wi-Fi Smart Plug | 1 |
| Teckin | Wi-Fi Smart Plug | 1 |
Table 4.
Complexity of IoTTGen - 1 day traffic.
| Scenarios | Number of Packets | Total Size (MB) | Running Time (s) |
|---|---|---|---|
| 13-devices extracted parameters (Table 5) | 346,551 | 23.2 | 4.4 |
| 13-devices custom parameters (Table 5) | 7,689,600 | 583.3 | 104.2 |
| 5-devices measured parameters (Table 8) | 208,781 | 15.5 | 3.4 |
| 52-devices measured parameters (Table 8) | 1,439,887 | 109.4 | 17.7 |
Table 5.
IoTTGen: parameters for smart home.
| Extracted Parameters | Custom Parameters | |||
|---|---|---|---|---|
| Period (s) | Packet Size (B) | Period (s) | Packet Size (B) | |
| Smart hub | 2.77 | 144 | 1 | 200 |
| Smart light | 3.2 | 94 | 1 | 100 |
| Smart camera | 2 | 100 | 0.05 | 1000 |
| Smart plug | 10 | 120 | 1 | 100 |
Table 6.
IoT traffic traces on testbed (1 day).
| Number of Packets | Packet Size (B) | Total Size (MB) | |
|---|---|---|---|
| Hub | 82,251 | 82.5 | 10.9 |
| Camera | 110,776 | 306 | 33.5 |
| Bulb | 6707 | 80 | 0.563 |
| Tpl plug | 1849 | 85 | 0.15 |
| Tk plug | 7198 | 85 | 0.583 |
Table 7.
Cloud servers and DNS queries for IoT devices.
| Devices | Cloud Servers | DNS Queries |
|---|---|---|
| Hub | Amazon CloudFront | www.d3p8zr0ffa9t17.cloudfront.net (accessed on 20 February 2021) |
| Camera | Mipc | s0.mipcgw.com (accessed on 20 February 2021) |
| Bulb | TP-link cloud | devs.tplinkcloud.com (accessed on 20 February 2021) |
| Tpl Plug | TP-link cloud | devs.tplinkcloud.com (accessed on 20 February 2021) |
| Tk Plug | Tuya cloud | a3.tuyaus.com (accessed on 20 February 2021) |
Table 8.
IoTTGen: measured parameters for smart home.
| Period (s) | Packet Size (B) | |
|---|---|---|
| Hub | 1.05 | 82.5 |
| Camera | 0.78 | 306 |
| Bulb | 12.88 | 80 |
| Tpl plug | 46.73 | 85 |
| Tk plug | 12.01 | 85 |
Table 9.
IoT anomaly traffic traces (1 min) for the measured traffic.
| Number of Packets | Packet Size (B) | Total Size (MB) | |
|---|---|---|---|
| DDoS | 773,045 | 60 | 44 |
| DoS | 727,210 | 60 | 41 |
| Port scanning | 23,587 | 100–1000 | 22 |
Table 10.
IoT anomaly traffic traces (38 min) for the synthetic traffic.
| Number of Packets | Packet Size (B) | Total Size (MB) | |
|---|---|---|---|
| DDoS | 29,375,746 | 60 | 1640 |
| DoS | 27,634,013 | 60 | 1540 |
| Port scanning | 896,335 | 100–1000 | 841.7 |
Table 11.
Performance of the ML algorithms (validation dataset).
| RF | KNN | DT | NB | NN | SVM | |
|---|---|---|---|---|---|---|
| TPR | 0.9474 | 0.9277 | 0.7179 | 0.5712 | 0.3137 | 0.2996 |
| FPR | 0.0013 | 0.0022 | 0.0110 | 0.0159 | 0.0283 | 0.0291 |
| Precision | 0.9512 | 0.9356 | 0.7271 | 0.5767 | 0.3188 | 0.3008 |
| Recall | 0.9474 | 0.9277 | 0.7179 | 0.5712 | 0.3137 | 0.2996 |
| F-Measure | 0.9465 | 0.9267 | 0.7171 | 0.5583 | 0.3813 | 0.2835 |
Publisher’s Note: MDPI stays neutral with regard to jurisdictional claims in published maps and institutional affiliations. |
© 2021 by the authors. Licensee MDPI, Basel, Switzerland. This article is an open access article distributed under the terms and conditions of the Creative Commons Attribution (CC BY) license (http://creativecommons.org/licenses/by/4.0/).
Share and Cite
MDPI and ACS Style
Nguyen-An, H.; Silverston, T.; Yamazaki, T.; Miyoshi, T. IoT Traffic: Modeling and Measurement Experiments. IoT 2021, 2, 140-162. https://0-doi-org.brum.beds.ac.uk/10.3390/iot2010008
AMA Style
Nguyen-An H, Silverston T, Yamazaki T, Miyoshi T. IoT Traffic: Modeling and Measurement Experiments. IoT. 2021; 2(1):140-162. https://0-doi-org.brum.beds.ac.uk/10.3390/iot2010008
Chicago/Turabian StyleNguyen-An, Hung, Thomas Silverston, Taku Yamazaki, and Takumi Miyoshi. 2021. "IoT Traffic: Modeling and Measurement Experiments" IoT 2, no. 1: 140-162. https://0-doi-org.brum.beds.ac.uk/10.3390/iot2010008