
Availability Modeling and Performance Improving of a Healthcare Internet of Things (IoT) System


1
Department of Electrical and Computer Engineering, St. Cloud State University, St. Cloud, MN 56301, USA
2
School of Data and Computer Science, Sun Yat-Sen University, Guangzhou 510006, China
*
Author to whom correspondence should be addressed.
IoT 2021, 2(2), 310-325; https://0-doi-org.brum.beds.ac.uk/10.3390/iot2020016
Submission received: 6 April 2021
/
Revised: 28 April 2021
/
Accepted: 12 May 2021
/
Published: 14 May 2021
Abstract
:Internet of Things (IoT) is improving human life in a more convenient and simpler way. One of the most promising IoT applications is healthcare. In this paper, an availability model of a healthcare IoT system is proposed which is composed of two groups of structures described by separate Markov state-space models. The two separate models are analyzed and combined to implement the whole IoT system modeling. The system balance equations are solved under a given scenario and some performance metrics of interest, such as probabilities of full service, degraded service, and the system unavailability, are derived. Detailed numerical evaluation of selected metrics is provided for further understanding and verification of the analytic results. An availability performance improving (API) method is also proposed for increasing the probability of system full service and decreasing the system unavailability. The proposed system modeling and performance improving method can serve as a useful reference for general IoT system design and evaluation.
1. Introduction
Internet of Things (IoT) combines the data-gathering capacity of sensors and smart devices with the power of cloud computing and data analytics. This data communication drives understanding and interactions between people and products in specific environments. Research from the 2017 World Economic Forum, titled “Technology and Innovation for the Future of Production”, explores that five technologies will predominate in the years to come: Internet of Things, Artificial Intelligence, Advanced Robotics, Wearables and 3D printing [1]. The IoT has started and will continue to show its great impact on many fields, such as smart homes, smart cities, healthcare, autonomous cars, smart grids, smart retail, industrial automation, inventory management, and quality control.
One of the most promising IoT applications is healthcare [2]. Networked healthcare devices create an Internet of Healthcare Things, which is aimed at health monitoring and preventive care for creating better conditions for patients who require constant medical supervision and/or preventive intervention. However, applications of new technologies often bring certain risks, including failures of components, devices, and infrastructure, which may cause disastrous results for patients. Hence, to minimize such risks and assure the required system availability, the modeling, performance evaluation, and performance improving techniques for the health IoT systems are certainly worth studying.
There are some research works in the literature on the modeling and performance evaluation techniques for the IoT systems [3,4,5,6,7,8,9,10,11,12,13,14], which are summarized as follows. In [3], the authors surveyed advances in IoT-based healthcare technologies and reviewed the state-of-the-art network architectures/platforms, applications, and industrial trends in IoT-based healthcare solutions. In [4], the economical, technological, security and application aspects of applying IoT in e-health were discussed and two solutions on the affordable prototyping platform were presented for e-health based on Raspberry Pi components. In [5], a framework for security modeling and assessment of the IoT was proposed to construct graphical security models for the IoT. The benefits of the framework were presented via a study of two examples of IoT networks. In [6], reliability and security issues of an IoT-based smart business center (SBC) network were discussed and a Markov model was developed to show a means of protection against hacker attacks with a high degree of security. In [7], the impact of factors affecting the performance in IoT networks was analyzed using simulation-based models and an analytical framework was developed to model the impact of individual node behavior on overall performance using Markov chains.
In [8], a healthcare IoT infrastructure with a brief description was presented and a case study of the considered system was modeled using the queueing theory. In [9], several types of queueing models were presented to represent different quality of service (QoS) settings of IoT interactions, such as intermittent mobile connectivity, message drop probabilities, message availability/validity and resource-constrained devices. The models were simulated using a simulator called MobileJINQS, and the results demonstrated the significant effect on response times and message success rates when varying QoS settings. In [10], a theoretical approach of performance evaluation for IoT services was proposed to provide a mathematical prediction on performance metrics at the design phase before system implementation, which was validated for the effectiveness by simulation experiments based on real-world data. In [11], a simulation model was presented for an IoT network mediator to study the capacity of an IoT mediator through performance analysis of the traffic generated by devices connected via the IoT network. The simulation model is based on both discrete event and Random Waypoint simulations.
In [12], a Markov model was proposed for a healthcare IoT infrastructure that allows for taking into account safety and security issues. The model considers basic states of the IoT system, including normal state, different attacking states, and failure states with constant failure/attack and recovery/repulse rates. The steady-state probabilities and availability function were obtained through simulations, though no analytical solution was provided. In [13], a systematic review for the studies in recent five years was conducted to present the current advancements in wearable sensors and IoT-based monitoring applications to support independent living for older adults. The investigation found that most studies focused on the system aspects of wearable sensors and IoT monitoring solutions including advanced sensors, wireless data collection, communication platform and usability. Another recent review in [14] studied the state-of-the-art works in IoT-based distributed healthcare systems, where all available medical resources are interconnected to provide effective and efficient healthcare services to those in need of medical assistance. From the study, the taxonomy of these systems was proposed considering various aspects, such as monitoring methods, communication technologies, computing techniques and low-power protocols.
In this paper, we propose an availability model of a healthcare IoT system that consists of two groups of structures with component failure events incorporated. The two groups of structures are described by separate Markov state-space models and integrated to implement the whole IoT system modeling. The system steady-state probabilities are solved recursively for a general number of biosensors. An explicit solution of the system is also provided given a specific number of biosensors. Based on the analytical solution, we derive some performance metrics of interest. We present a numerical evaluation of selected metrics with detailed analysis of the obtained results. We also propose an availability performance improving (API) method for increasing the probability of system full service and decreasing the system unavailability.
The remainder of the paper is organized as follows. Section 2 describes a typical healthcare IoT system infrastructure Section 3 develops the Markov models of individual groups and the whole IoT system. Section 4 derives some system performance metrics of interest. Section 5 proposes the API method with three possible schemes. Section 6 presents a detailed numerical evaluation. Finally, the paper is concluded in Section 7.
2. A Healthcare IoT System Infrastructure
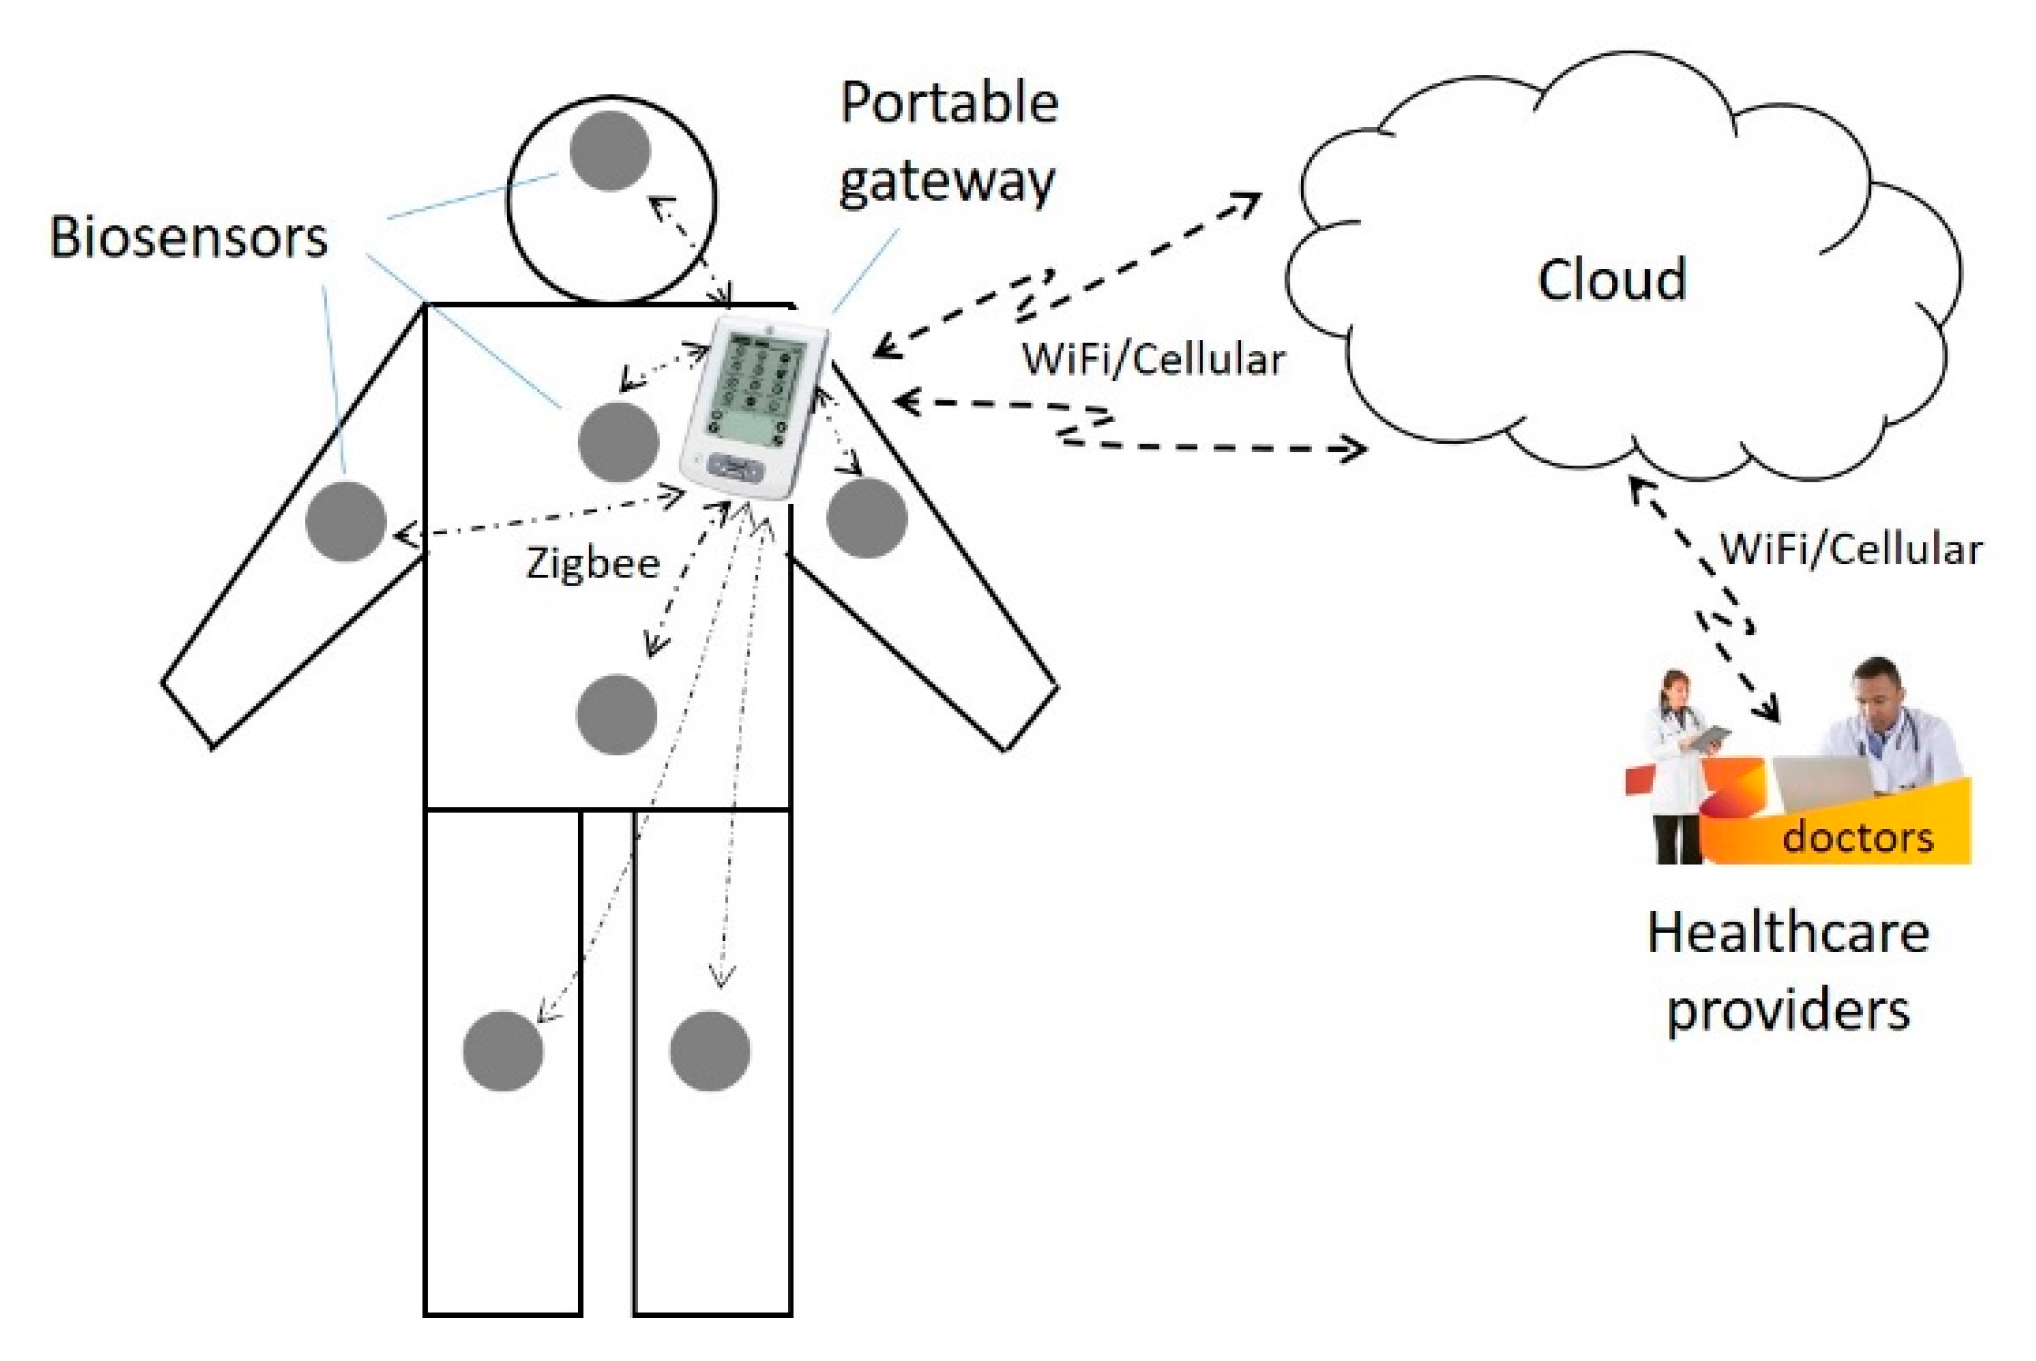
The main components of the healthcare IoT system include a wireless body area network (WBAN) [15] consisting of sensor nodes and a portable gateway device, cloud server(s), and healthcare providers, as shown in Figure 1. A brief description of each component is given as follows.
The WBAN consists of a number of biosensors installed on different parts of the human body and the portable gateway device. The biosensors are used to sense physiological data and send them to the portable gateway device in an appropriate format. There are different types of medical sensors and sensor devices, including a heart rate monitoring sensor (monitoring heart rate on a real-time basis), body temperature sensor (monitoring body temperature), blood pressure (BP) sensor (collecting BP data regularly), electroencephalogram (EEG) sensor module (detecting minute electrical activity of brain cells), oxygen saturation monitoring sensor (calculating the pulse rate and SpO2), electrocardiogram (ECG) sensor module (using sensor array to record the electrical activity generated by heart muscle and send the converted signals to a computing device for display), the global positioning system (GPS) sensor, accelerometer sensor (capturing the intensity of physical activity for human movement by attaching the sensor to a person’s wrist or ankle or to a person’s waist with a belt clip), electromyography (EMG) sensor (diagnosing a wide variety of neuromuscular diseases, motor neurons problems, nerve injuries, or degenerative conditions), cough detection sensor (a built-in microphone audio system in a sensor module), diabetes sensor (a non-invasive opto-physiological sensor to track blood glucose), and a pedometer sensor (recording the number of steps the wearer takes). Data collected by biosensors are transmitted to the portable gateway device using, e.g., Bluetooth or ZigBee [16] protocols.
The gateway device is designed to collect data from the biosensors and send the data to the cloud servers; it also monitors the sensor status, changes settings, and updates software. The gateway connects to the cloud servers through WiFi or cellular wireless technologies and to the sensor nodes through ZigBee or Bluetooth technology. The gateway can communicate with multiple sensor nodes simultaneously.
Cloud servers are virtual servers running in a cloud computing environment over the Internet. They provide a web-based information infrastructure, including computing power, storage space and network technology. Health providers can easily process, exchange, secure and manage data in either web-based or location-independent styles. Health providers use an infrastructure-as-a-service (IaaS) [17] model to process workloads and store information. They do comprehensive data analysis and send commands from the cloud to the gateway device or further, from the gateway to do software updates or other commands to the specific sensor nodes. Health providers can also generate an analytic report for the patient’s illness status and send it via email to the patient and advise him/her to make a doctor appointment if needed.
The communication between the sensor nodes and the gateway device uses ZigBee technology due to its low power-consumption rate and battery life, which is a low-power wireless specification that uses physical (PHY) and media access control (MAC) layers based on the IEEE 802.15.4 standard [18]. The ZigBee technology operates at the 2.4 GHz ISM (industrial, scientific and medical) bands. The protocol allows sensor nodes to communicate in a variety of network topologies and the battery life to last for a long time. The communication between the gateway and cloud servers uses WiFi/Cellular wireless technologies, which provides a longer distance of connection and more reliable communication links. The communication between the cloud servers and the healthcare providers uses wireless (e.g., WiFi or cellular technologies) or wired technologies (e.g., fiber-optic cable or copper cable).
For an operatable IoT system with reliable data transmission, the three segments of communication links must be workable: the links between the sensors and the gateway device; the link between the gateway and the cloud; and the link between the cloud and the healthcare providers, as shown in Figure 1.
Link failures are very prone to occur, especially in the WBAN due to the resource constraint of biosensors (e.g., limited power, limited signal transmission range) and area limitation of the network. Many factors can cause wireless connection failures in the WBAN. Sensor nodes in a WBAN are made from hardware components integrated into a small module such as the transceiver, memory and microcontroller as well as the software components, such as the application programs and MAC protocols. When a sensor node has insufficient battery power, it will fail to collect and send data. A sensor node may malfunction from a physical hardware defect due to an aging hardware component. Similarly, a sensor node may fail to offer the desired functions due to a software fault such as a software bug. Body motion can cause frequent changes in the network topology. When the sensors are affected by reflection, diffraction, and shadowing due to rapid body movement, body structure and posture, they may cause channel fading or channel impairment that adversely affects signal propagation. When the patient moves to a place with excessive noise, the wireless channel may also be subject to failure. In addition, there are many other reasons that can cause connection failure.
Similarly, the communication links from the gateway to the cloud and from the cloud to the healthcare providers can also be prone to failure due to the inherent vulnerability of wireless channels. In general, different link connection failures may need different recovery times. In the following analysis, we will assume different link failure arrival rates and link recovery times for different segments of communication channels.
3. Availability Model of the IoT System
Based on the description in Section 2, we classify the communication links in the IoT system into two groups. Group 1 contains the links between the biosensors and the gateway in the WBAN. Group 2 contains two types of communication links: the link between the gateway and the cloud; the link between the cloud and the healthcare provider. If either type of link fails, the IoT system cannot provide service. In the following, we propose the modeling of Group 1 and Group 2 as well as the whole IoT system incorporating both groups.
3.1. Modeling of Group 1
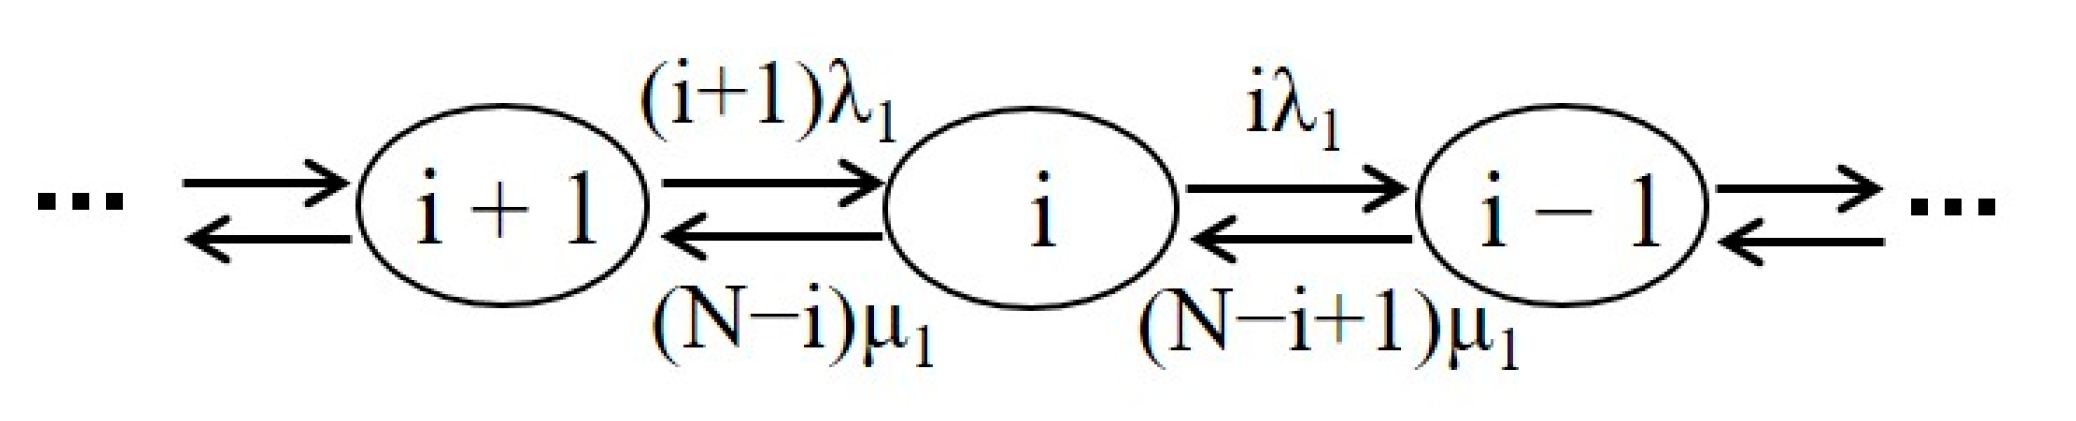
The biosensors in the WBAN, such as the pedometer sensor, temperature sensor, BP sensor, EEG sensor, and ECG sensor, sense the physiological data from the patient and send them wirelessly to the gateway, which can serve multiple sensors simultaneously with multiple wireless channels. The wireless links between the sensors and the gateway belong to the aforementioned Group 1. Since one can install multiple biosensors on the wearable equipment for the patient, the connection failure of some biosensors to the gateway may not cause the WBAN to go completely down but just lead to degraded service of the system due to less available data. Depending on the healthcare provider’s criteria and the specific patient case, a degraded service may be defined individually. For example, the system is said to be in degraded service if the number of failed links in the WBAN does not exceed a certain value, e.g., k, 0 < k < N, where N is the total number of biosensors in the WBAN for the patient. Assume that the time between the successive failure arrivals is exponentially distributed, then we can model the Group 1 structure by a finite population loss system queueing model [19].
The Markov state transition diagram of the Group 1 structure at state i is shown in Figure 2, where i represents the number of operational biosensors in the WBAN and N is the total number of sensors. λ1 denotes the individual sensor failure rate, and μ1 is the corresponding recovery rate.
3.2. Modeling of Group 2
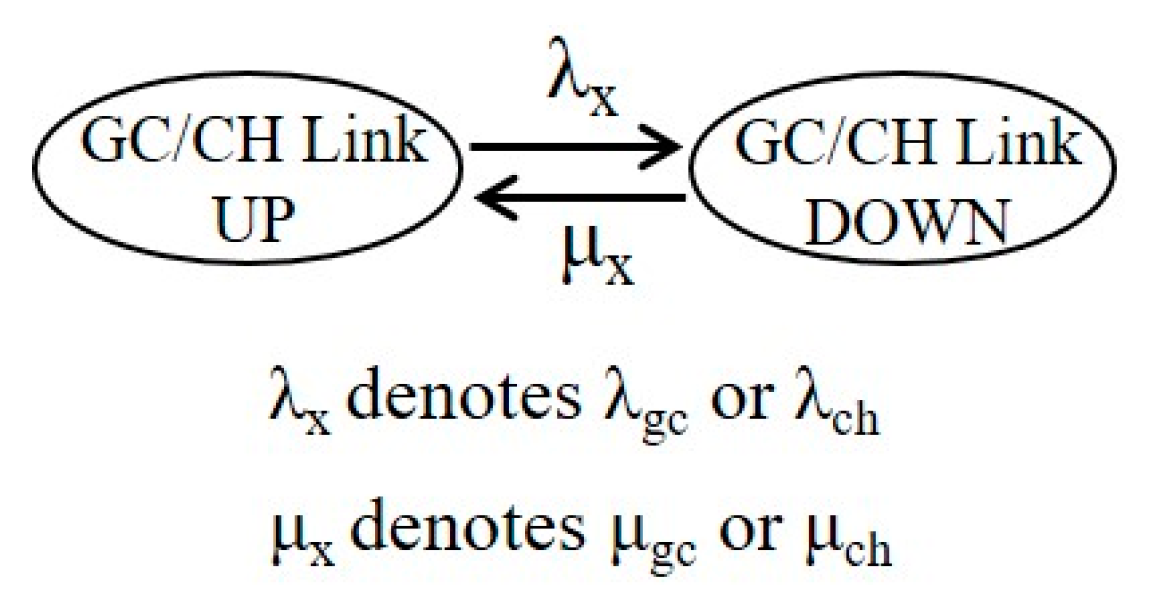
In the above Figure 1, we refer to the communication link between the gateway and the cloud as the GC link, and the link between the cloud and the healthcare provider as the CH link. Since the failure of either link would cause the failure of the Group 2 part and thus cause the IoT system to not be able to provide service (i.e., the system fails), the two links operate in series. We would model each of the links by two states with respective state transition rates. The two states are referred to as Up (link connection succeeds) and Down (link connection fails).
The Markov state transition diagram of each body sensor is shown in Figure 3, where λx and μx represent the link failure rate and the link recovery (repair) rate, respectively. λx denotes λgc for the GC link and λch for the CH link. μx denotes μgc for the GC link and μch for the CH link. The probability that the link connection is in Up or Down state can be found as:
The two links operate in series and are independent of each other. Thus, we can develop their equivalent parameters of the series structure. We denote by λ2 and μ2 the equivalent failure rate and recovery rate in the series structure, respectively, as shown in Figure 4. It is clear that the series structure system is in the Up state only when both links are in the Up state. Thus, the probability that the series structure is in the Up state, denoted by PUS, is equal to the product of individual probabilities that every link is in the Up state.
The equivalent failure rate λ2 can be found as the sum of the failure rates of the two links, i.e.,
By definition, we have . Therefore, the equivalent recovery rate μ2 can be derived as:
3.3. Modeling of the IoT System
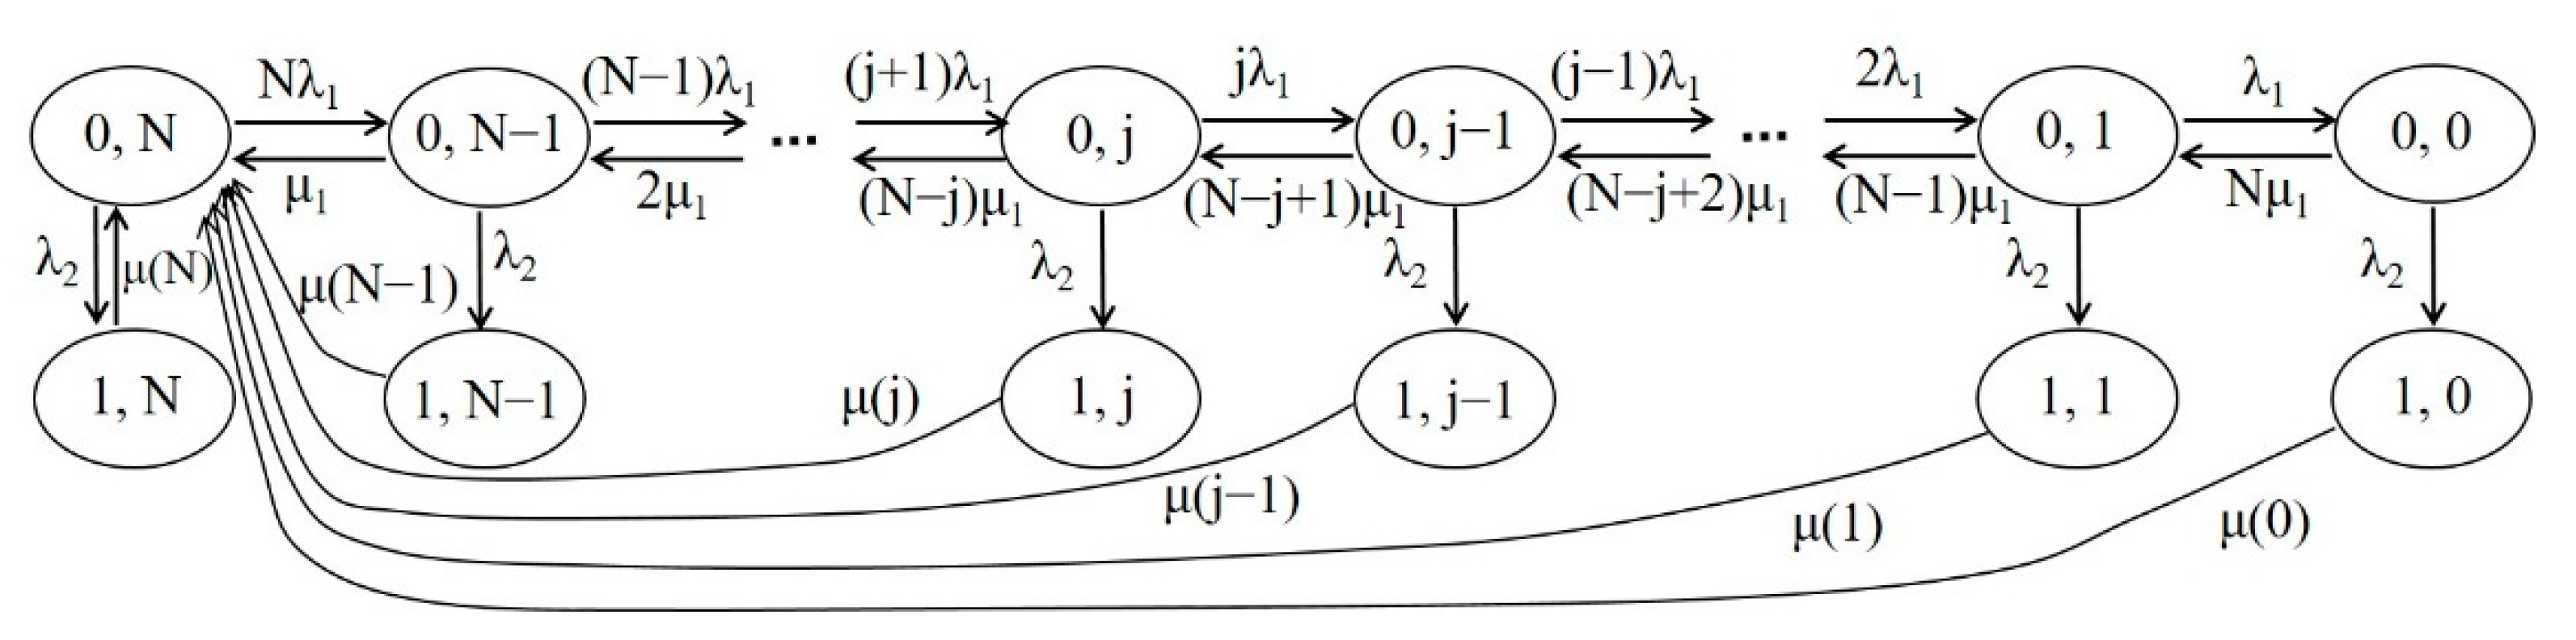
The whole IoT system consists of the components of the WBAN, the cloud, and the healthcare providers, as well as the connection links among them. The modeling of the IoT system can be obtained by combining the models of Group 1 and Group 2 with the state transition diagram as shown in Figure 5. The system state is represented by (i, j), where i is an indicator function with 0 if the Group 2 structure is Up and 1 if it is Down, and j denotes the number of operational biosensors in the Group 1 structure, 0 ≤ j ≤ N. Here, N is the total number of biosensors in the WBAN. Therefore, state (0, N) represents that the IoT system operates without any link failure, i.e., both the Group 1 structure and Group 2 structure are Up. State (0, j), 0 ≤ j ≤ N − 1, represents that Group 1 has j operational biosensors (i.e., N − j links fail) and Group 2 is Up. The sensor failure rate arriving at state (0, j) is (j + 1)λ1, and the corresponding sensor recovery rate is derived from Figure 2 as (N − j)μ1.
Similarly, state (1, j), 0 ≤ j ≤ N, represents that Group 1 has j operational biosensors and Group 2 is Down, where the Group 2 link failure rate is λ2. However, the recovery rate at this state is a little more complicated due to two types of link failures being invloved. It takes more time for both links to be recovered. The more failed sensors the are, the longer the recovery time. Since the two types of connection links are independent of each other, the equivalent recovery time, 1/μ(j), at state (1, j) will be state dependent and approximately calculated as:
A workable IoT system requires that both Group 1 and Group 2 provide service. Group 1 can provide full service with all sensors (links) workable or degraded service with partial sensors workable. If the number of workable sensors is reduced to a predefined threshold, then Group 1 is considered to provide no service (though some sensors are still workable). Group 2 can either provide service (Up state) or provide no service (Down state). Therefore, the whole IoT system is said to be in full service when Group 1 provides full service and Group 2 is Up, degraded service when Group 1 provides partial service and Group 2 is Up, and unavailable when Group 1 provides no service or Group 2 is Down. Note that, in reality, the degraded service state can be defined as the Group 1 structure has j failed sensors (depending on system requirement), 1 ≤ j ≤ N − 1, and the Group 2 structure is Up. Note also that the failure events of Group 1 and Group 2 are independent and when the system works in degraded service in the Group 1 structure or a failure event happens for Group 2, a corresponding recovery process will be triggered.
Let denote the steady-state probability that the system is in state (i, j) with state-space {(i, j)|i = 0, 1; 0 ≤ j ≤ N}. The global balance equations of the system [16] are given as follows:
where . The balance equations can be solved recursively as follows:
where:
and can be solved by applying the normalization condition:
If the total number of biosensors is not large, the explicit solution of the balance equations can be derived. In practice, the number of biosensors equipped for a patient is limited in the WBAN. Without loss of generality, we present the explicit solution of a specific scenario where N is equal to 4. Then, the steady-state probability at state (0, 0) can be derived as:
where:
The rest probabilities are derived as:
4. System Performance Metrics
Now, we derive some performance metrics of interest after obtaining the system steady-state probabilities. Let us define the following four events:
where E1 represents the event that the IoT system is fully up, where G1UP and G2UP denote that both the Group 1 and Group 2 structures are in the Up state; E2 is the event that the system is partially up (degraded service), where G1DG denotes that the Group 1 structure provides degraded service; E3 represents the event that the system cannot provide service due to the connection failure between all sensors and the gateway (which is referred to as SG link failure), where (G1DN, G2UP) denotes that the Group 1 structure is in the Down state while the Group 2 structure is in the Up state; and E4 represents the event that the system is down due to the cloud-side (CS) connection failure in the Group 2 series structure including GC and CH links (which is referred to as CS link failure), where (G1XX, G2DN) denotes that the Group 1 structure may be in any state while the Group 2 structure is in the Down state (i.e., the failure of Group 2 structure directly causes the failure of the IoT system). Thus, the probability that the IoT system provides full service is:
E1 = {(G1UP, G2UP)}
E2 = {(G1DG, G2UP)}
E3 = {(G1DN, G2UP)}
E4 = {G1XX, G2DN}
The probability that the system provides degraded service is (here, the degraded service is defined if there is j workable sensors available, 1 ≤ j ≤ N − 1):
The probability that the system cannot provide service due to SG link failure is:
The probability that the system cannot provide service due to CS link failure is:
The IoT system unavailability, denoted by U, is the total probability that the system is down.
The frequency of an event [20] is defined by the product of the transition rates departing from the event and the state probabilities, or the product of the transition rates arriving at the event and their respective state probabilities where these transitions start. Thus, the frequencies of the events E1, E2, E3, and E4 are derived as follows:
The mean duration of an event is obtained by the ratio of the event probability to the event frequency. The mean durations of events E1, E2, and E3 are:
5. Improving Availability of the IoT System
In this section, we discuss how to improve the availability of the IoT system. In general, one way is to reduce the failure rate of the SG, GC and CH links; the other way is to reduce the recovery time of these links. The link failure rate is often not controllable; however, the link recovery rate can be improved through multiple efforts. For example, if the failure of a biosensor in a WBAN could be found earlier via different software/hardware detection or alarm mechanisms, then a corresponding sensor recovery time could be reduced. For another example, if the failure of a communication link is detected, instead of the regular link recovery mechanism, an emergency recovery mechanism may be created to achieve shorter communication link recovery time. Of course, to achieve this goal, more human resources, technical resources and equipment resources would be required, which will not be discussed here. In the following, our main focus is to study the performance improving method for the IoT system, given that an emergency link recovery mechanism is provided.
In Figure 5, for a given state (0, j), 0 ≤ j ≤ N − 1, the number of failed SG links (or failed biosensors) is N − j and the recovery rate is (N − j)μ1. For the state (1, j), 0 ≤ j ≤ N, the CS link fails. Normally, either a failed sensor or a failed CS link triggers a respective regular recovery process with its corresponding rate. Now, instead of a regular recovery process, an emergency recovery process can be defined for performance improving (of course, more resources will be involved), which can lead to a larger recovery rate (or smaller recovery time). Assume that when an emergency link recovery mechanism is triggered, a multiple times (say, β times) larger link recovery rate can be achieved. Clearly, here, the factor β can be adjusted depending on the system requirement and the resources invested for the system. Based on this idea, we propose an availability performance improving (API) method for the IoT system, given that an emergency link recovery triggering mechanism is provided. The API method is described as follows:
Two conditions may trigger an emergency link recovery mechanism and achieve the availability performance improving (API). Condition 1 is when the number of failed biosensors in the system reaches an integer threshold, K, 1 ≤ K ≤ N; Condition 2 is when the CS link failure event happens. When an emergency link recovery mechanism is triggered, a β times larger link recovery rate can be achieved to the failed links.
In the following numerical evaluation, we will present three schemes to validate the proposed API method with the threshold K = 50%N.
Scheme 1: Both Condition 1 and Condition 2 are required to trigger the emergency recovery mechanism.
Scheme 2: Only Condition 2 is required to trigger the emergency recovery mechanism.
Scheme 3: Either Condition 1 or Condition 2 is required to trigger the emergency recovery mechanism.
6. Numerical Evaluation
In this section, we present numerical evaluation for the IoT system by studying selected metrics with respect to various parameters, particularly the individual sensor failure rate and recovery time as well as the failure rates of the GC link and CH link. The typical parameter settings for numerical evaluation are given in Table 1. Other values of related parameters are set separately in the figures to study the performance of the relevant metrics.
Figure 6 shows the probability of the full service of the system P(E1) with the change of biosensor failure rate λ1 and other parameters. As expected, when λ1 is increased, the probability P(E1) will decrease. An increase in sensor failure rate causes more sensors to leave the full service state. Similarly, an increase in sensor recovery time (i.e., decrease in μ1) would delay the time to reach the full service state, leading to a lower value of P(E1). It can also be observed that a larger value of the GC/CH link failure rate (e.g., 20 failures/month) will decrease P(E1) more than a smaller one, as large GC/CH link failures naturally cause the system failure.
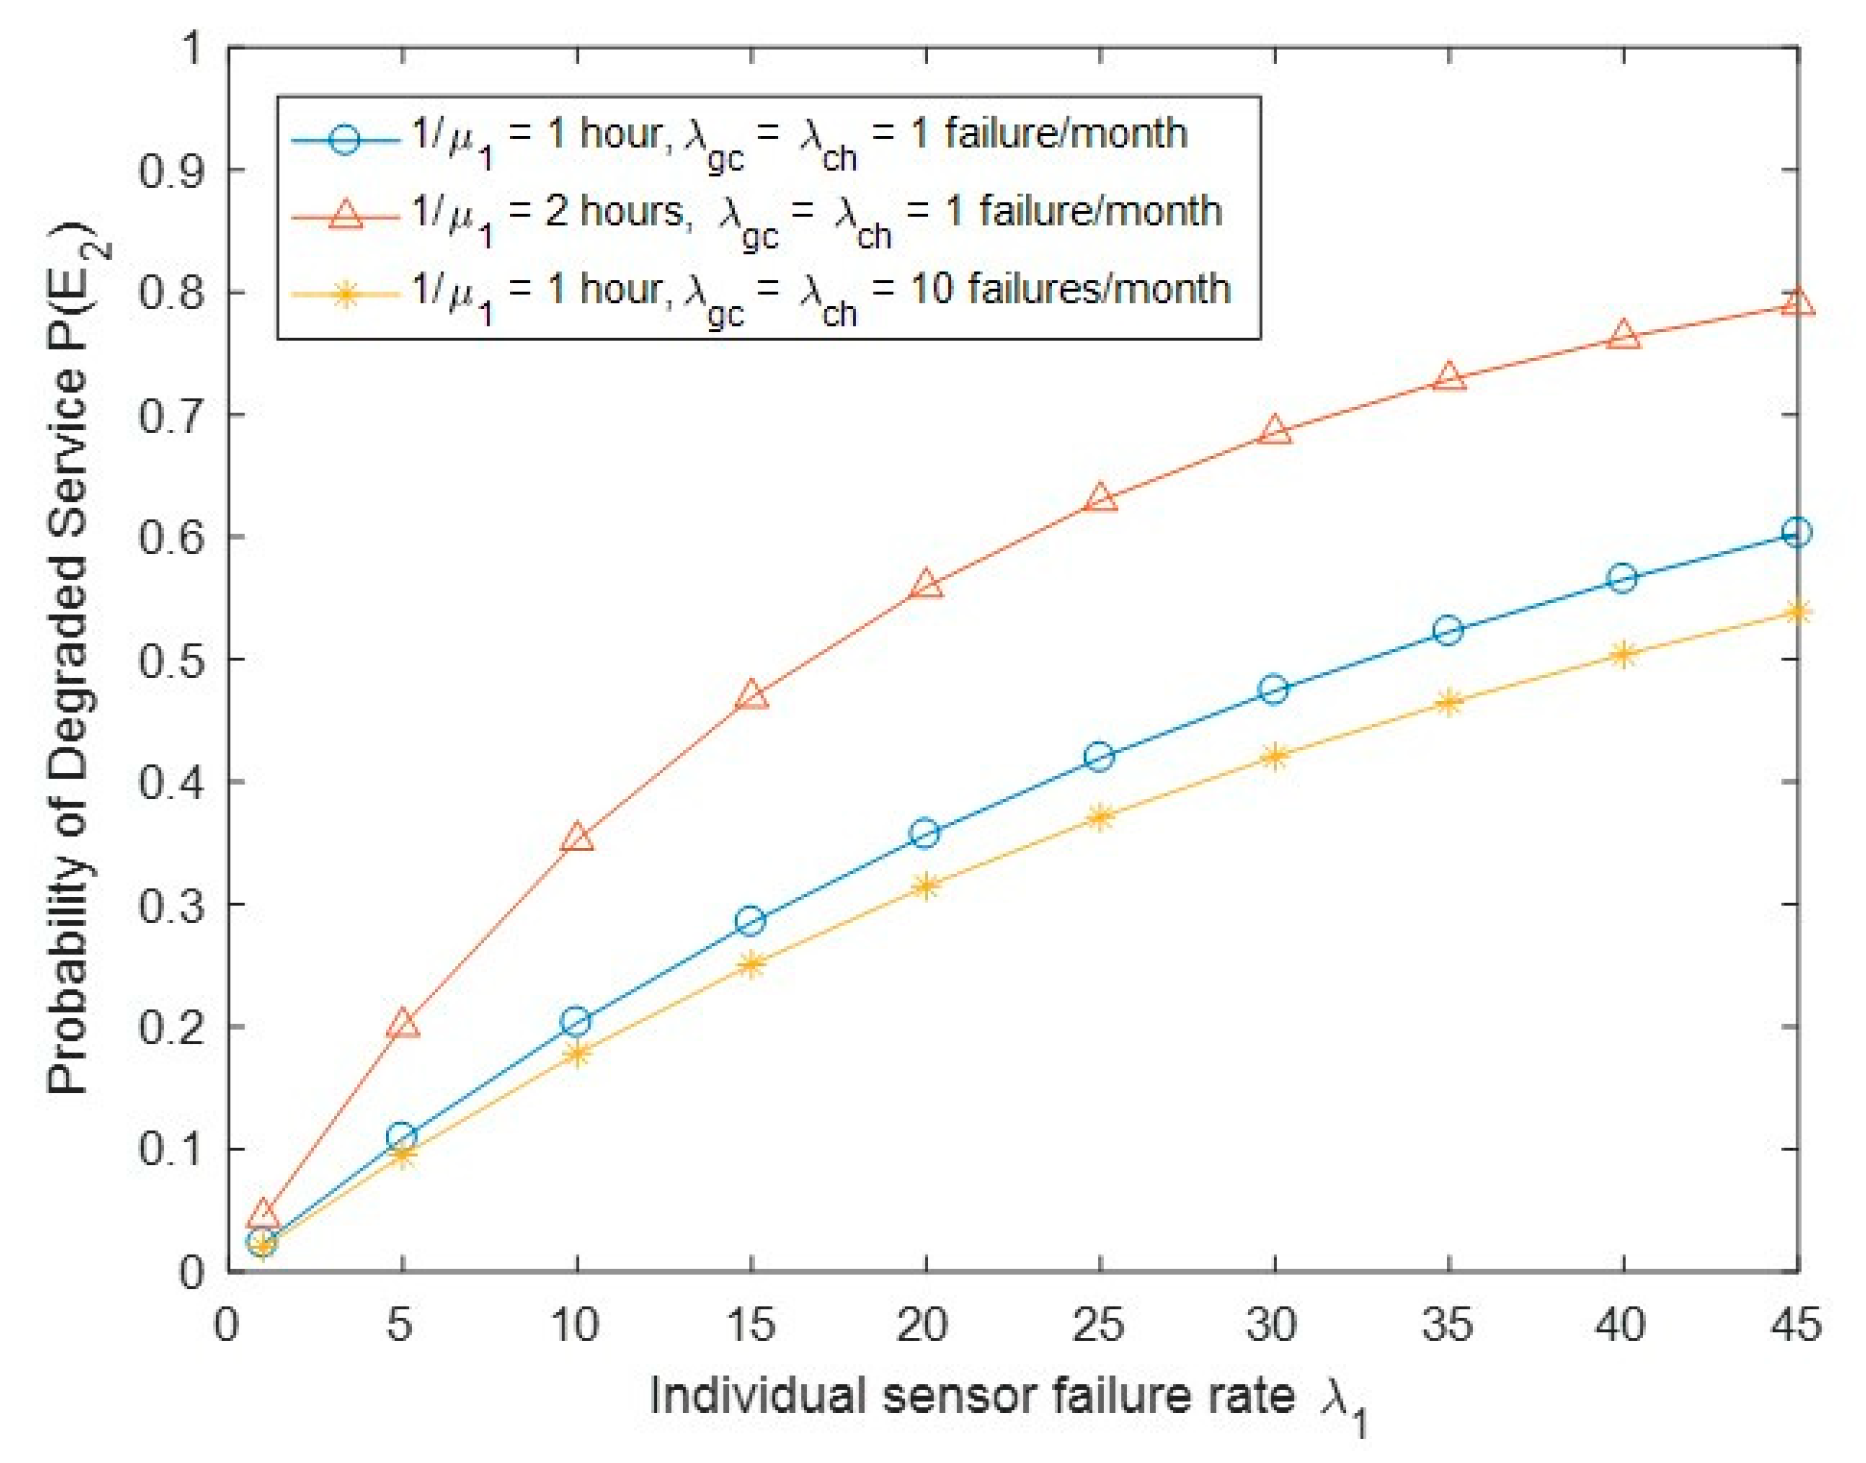
Figure 7 shows the probability of the degraded service of the system P(E2) with the change of biosensor failure rate λ1 and other parameters. We observed that when λ1 is increased, the probability P(E2) will increase. An increase in sensor failure rate causes more degraded service states to be reached. Similarly, an increase in sensor recovery time would lead to longer time of being in degraded service states. We also observed that a larger value of the GC/CH link failure rate would decrease the probability P(E2), as more degraded service states are left.
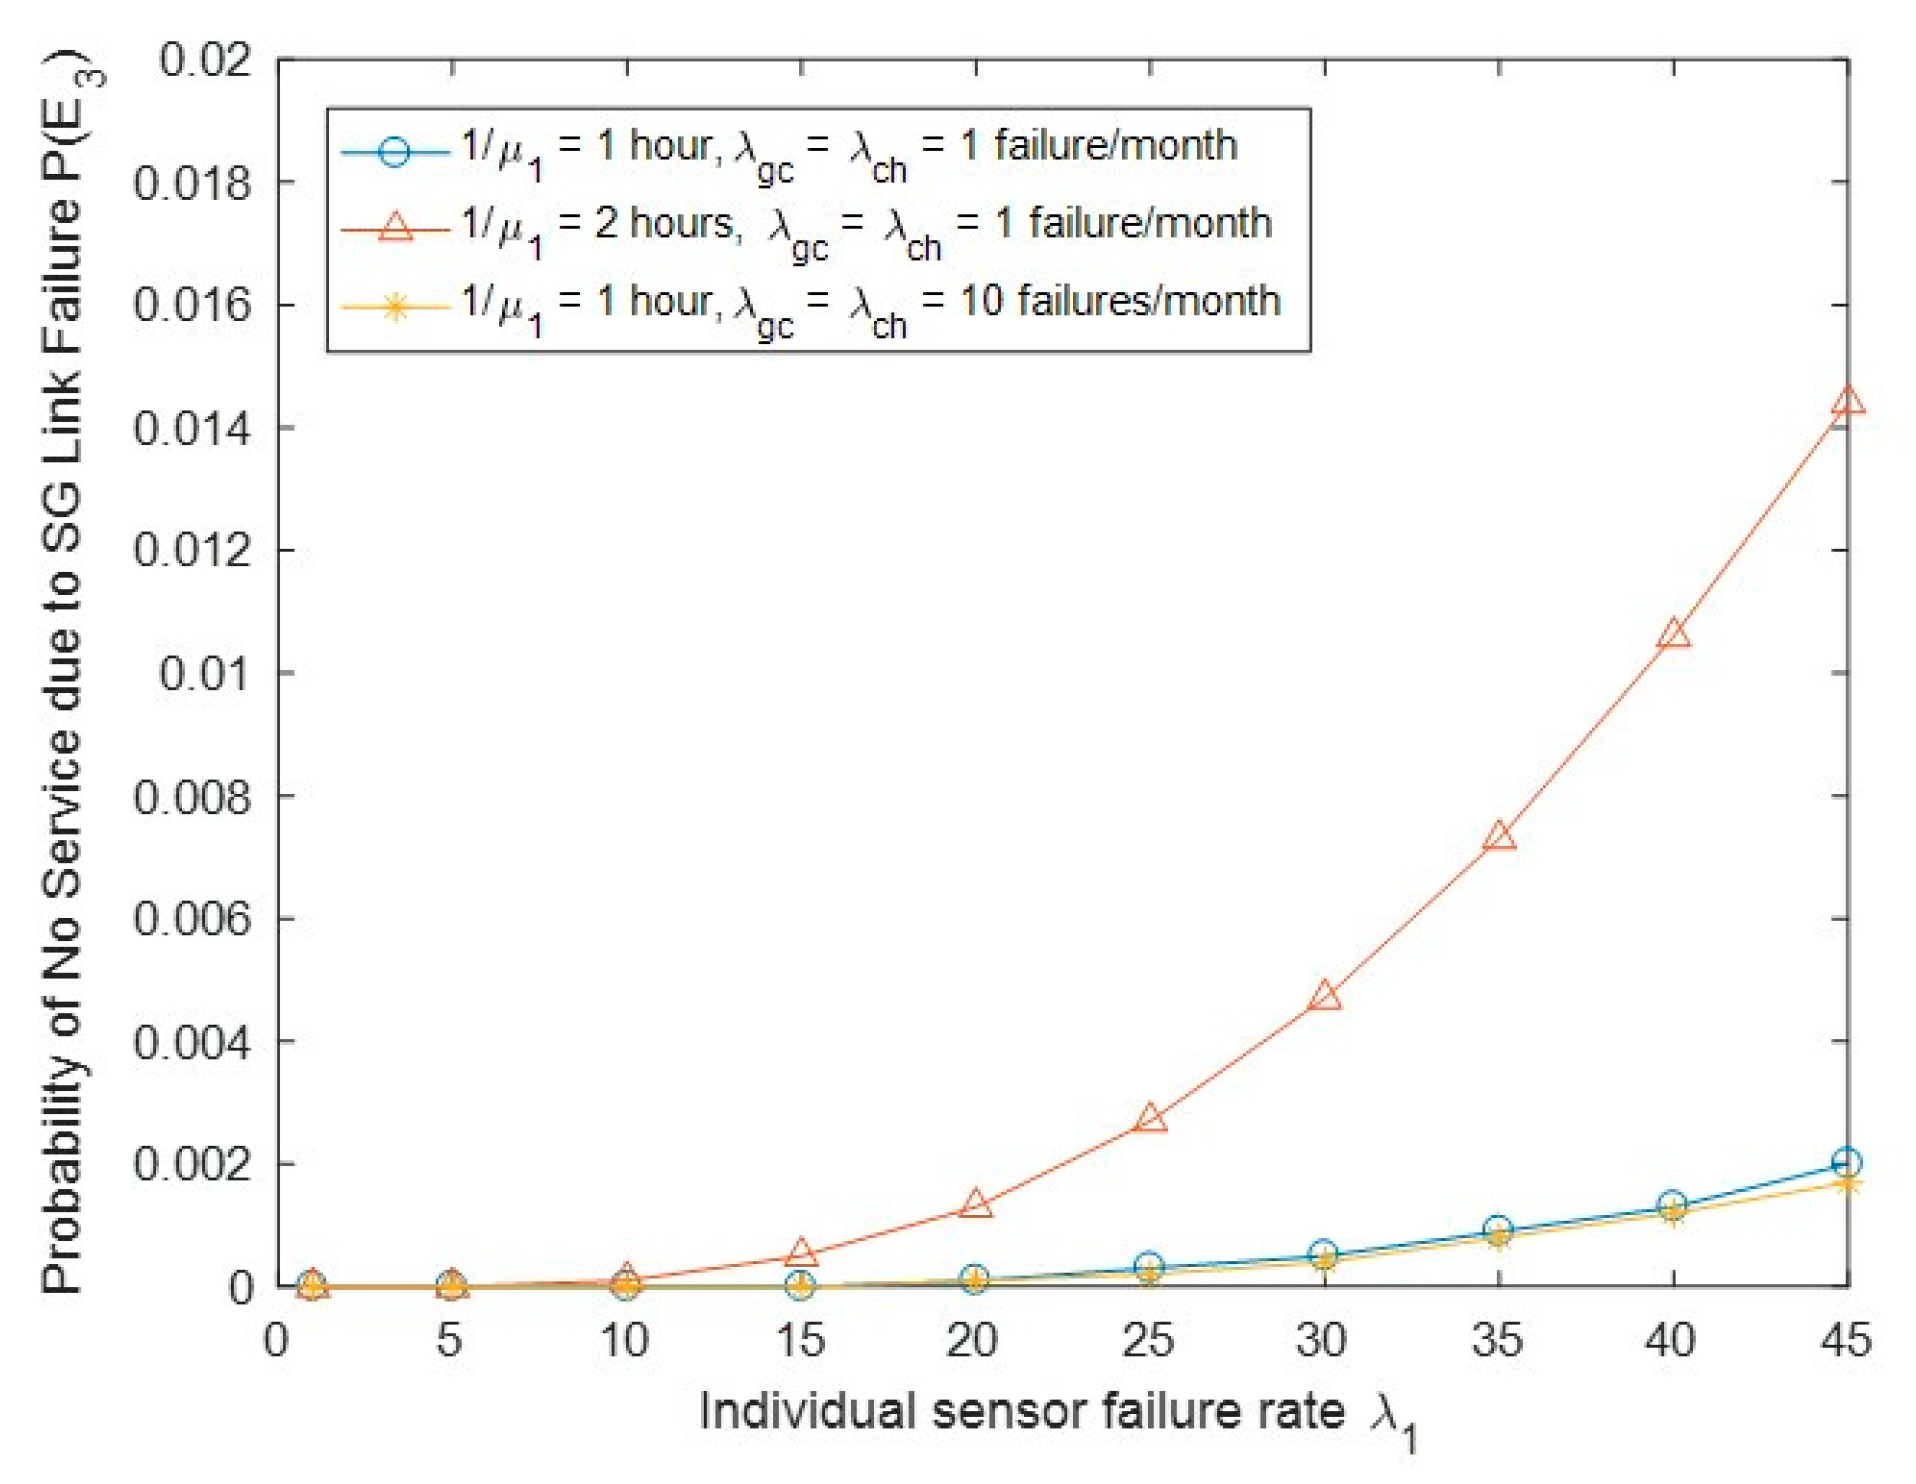
Figure 8 shows the probability of no service due to SG link failure P(E3) with the change of biosensor failure rate λ1 and other parameters. We observed that P(E3) will increase when either λ1 or 1/μ1 is increased; the reason for this can be seen in Figure 7, as the event E3 is a special case of E2 with the state (0, j) replaced by (0, 0).
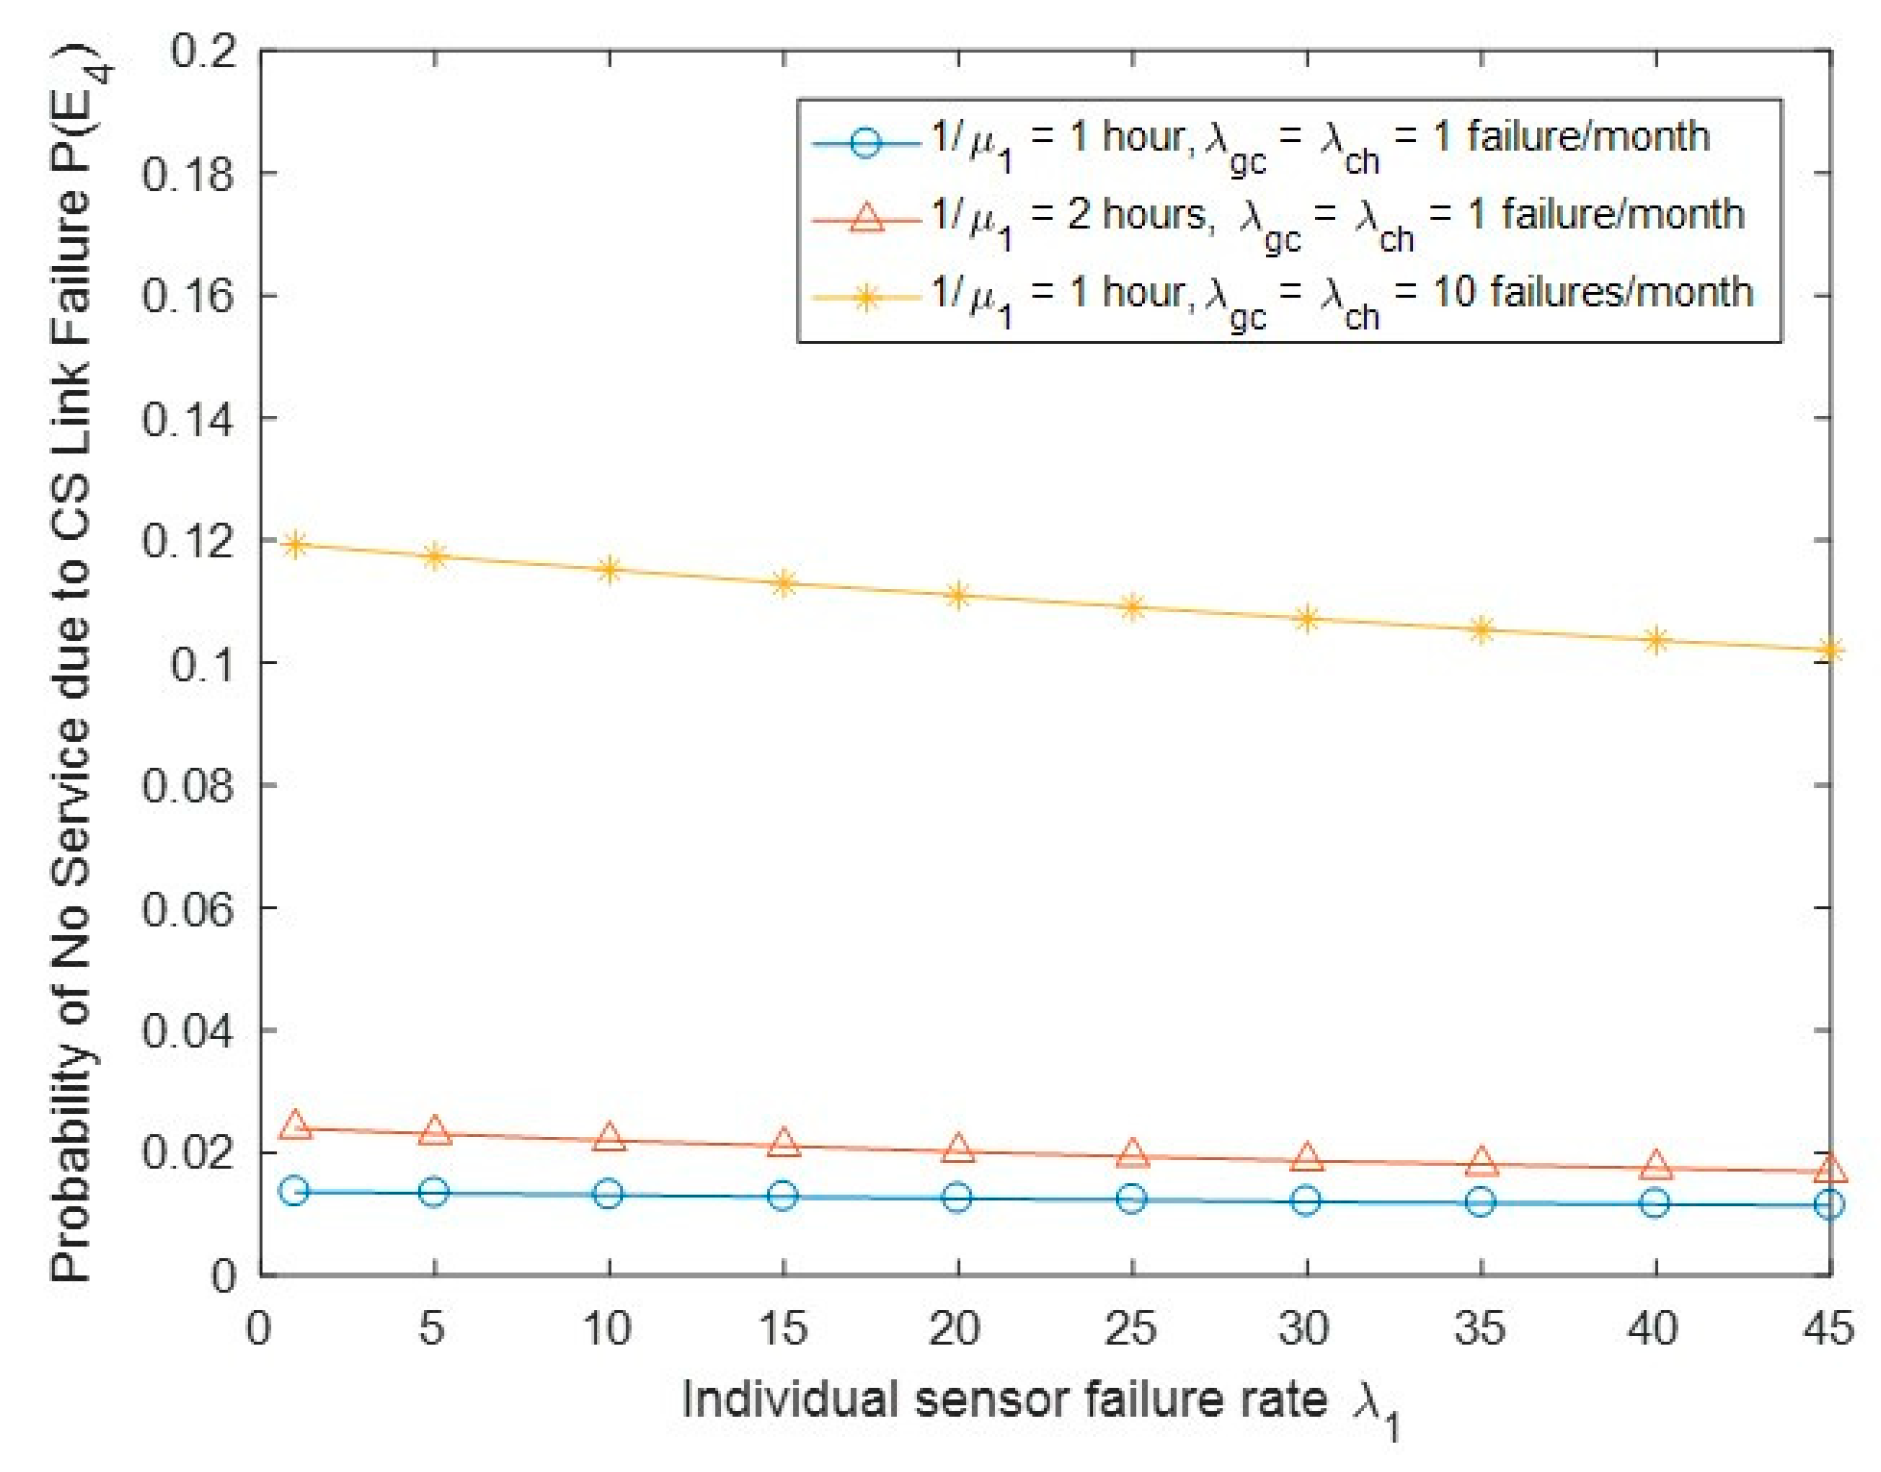
Figure 9 shows the probability of no service due to CS link failure P(E4) with the change of biosensor failure rate λ1 and other parameters. As expected, P(E4) increases when the link GC/CH link failure rate is increased. We observed that when the sensor recovery time is increased, P(E4) will increase, since the equivalent recovery time 1/μ(j) is state dependent at state (1, j), 0 ≤ j ≤ N − 1. The larger the sensor recovery time, the larger the equivalent recovery time required, leading to an increase in P(E4). We also observed that when the sensor failure rate is increased, P(E4) will tend to decrease slightly. This may be explained by the fact that an increase in sensor failure rate would cause more chance of leaving the no service states (1, j) (to maintain the system traffic balance).
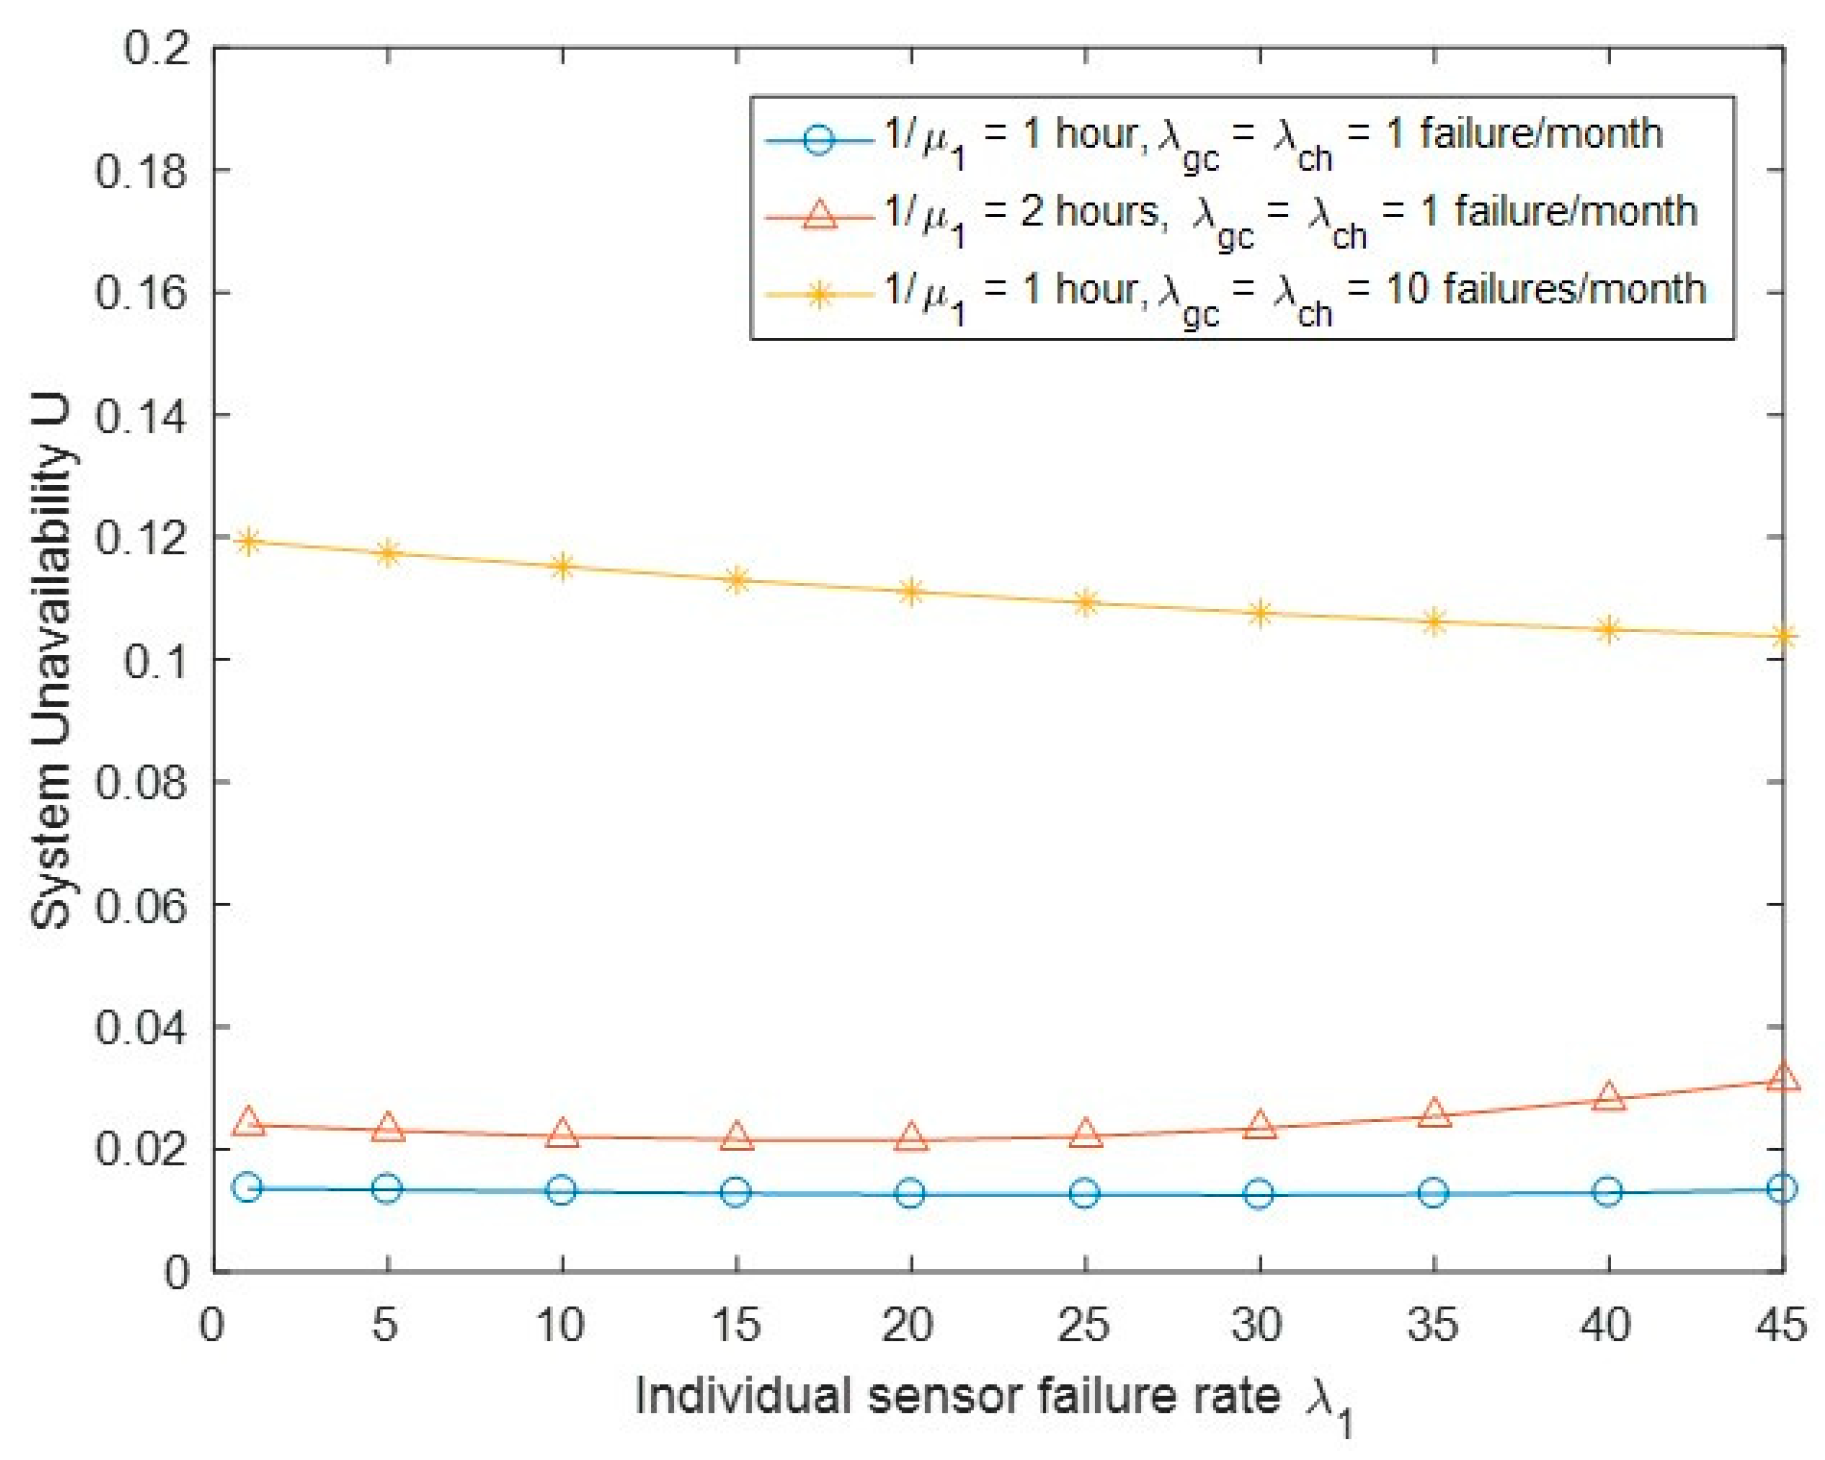
Figure 10 shows the system unavailability U with the change of biosensor failure rate λ1 and other parameters. We observed that U will increase when the sensor recovery time or the GC/CH link failure rate is increased. A longer recovery time increases the opportunity of being at the system unavailability state, while the GC/CH link failure event directly causes the system to completely go down. As expected, we also observed that U will increase when the sensor recovery time increases, since an increase in sensor recovery time causes the increase in the equivalent recovery time 1/μ(j).
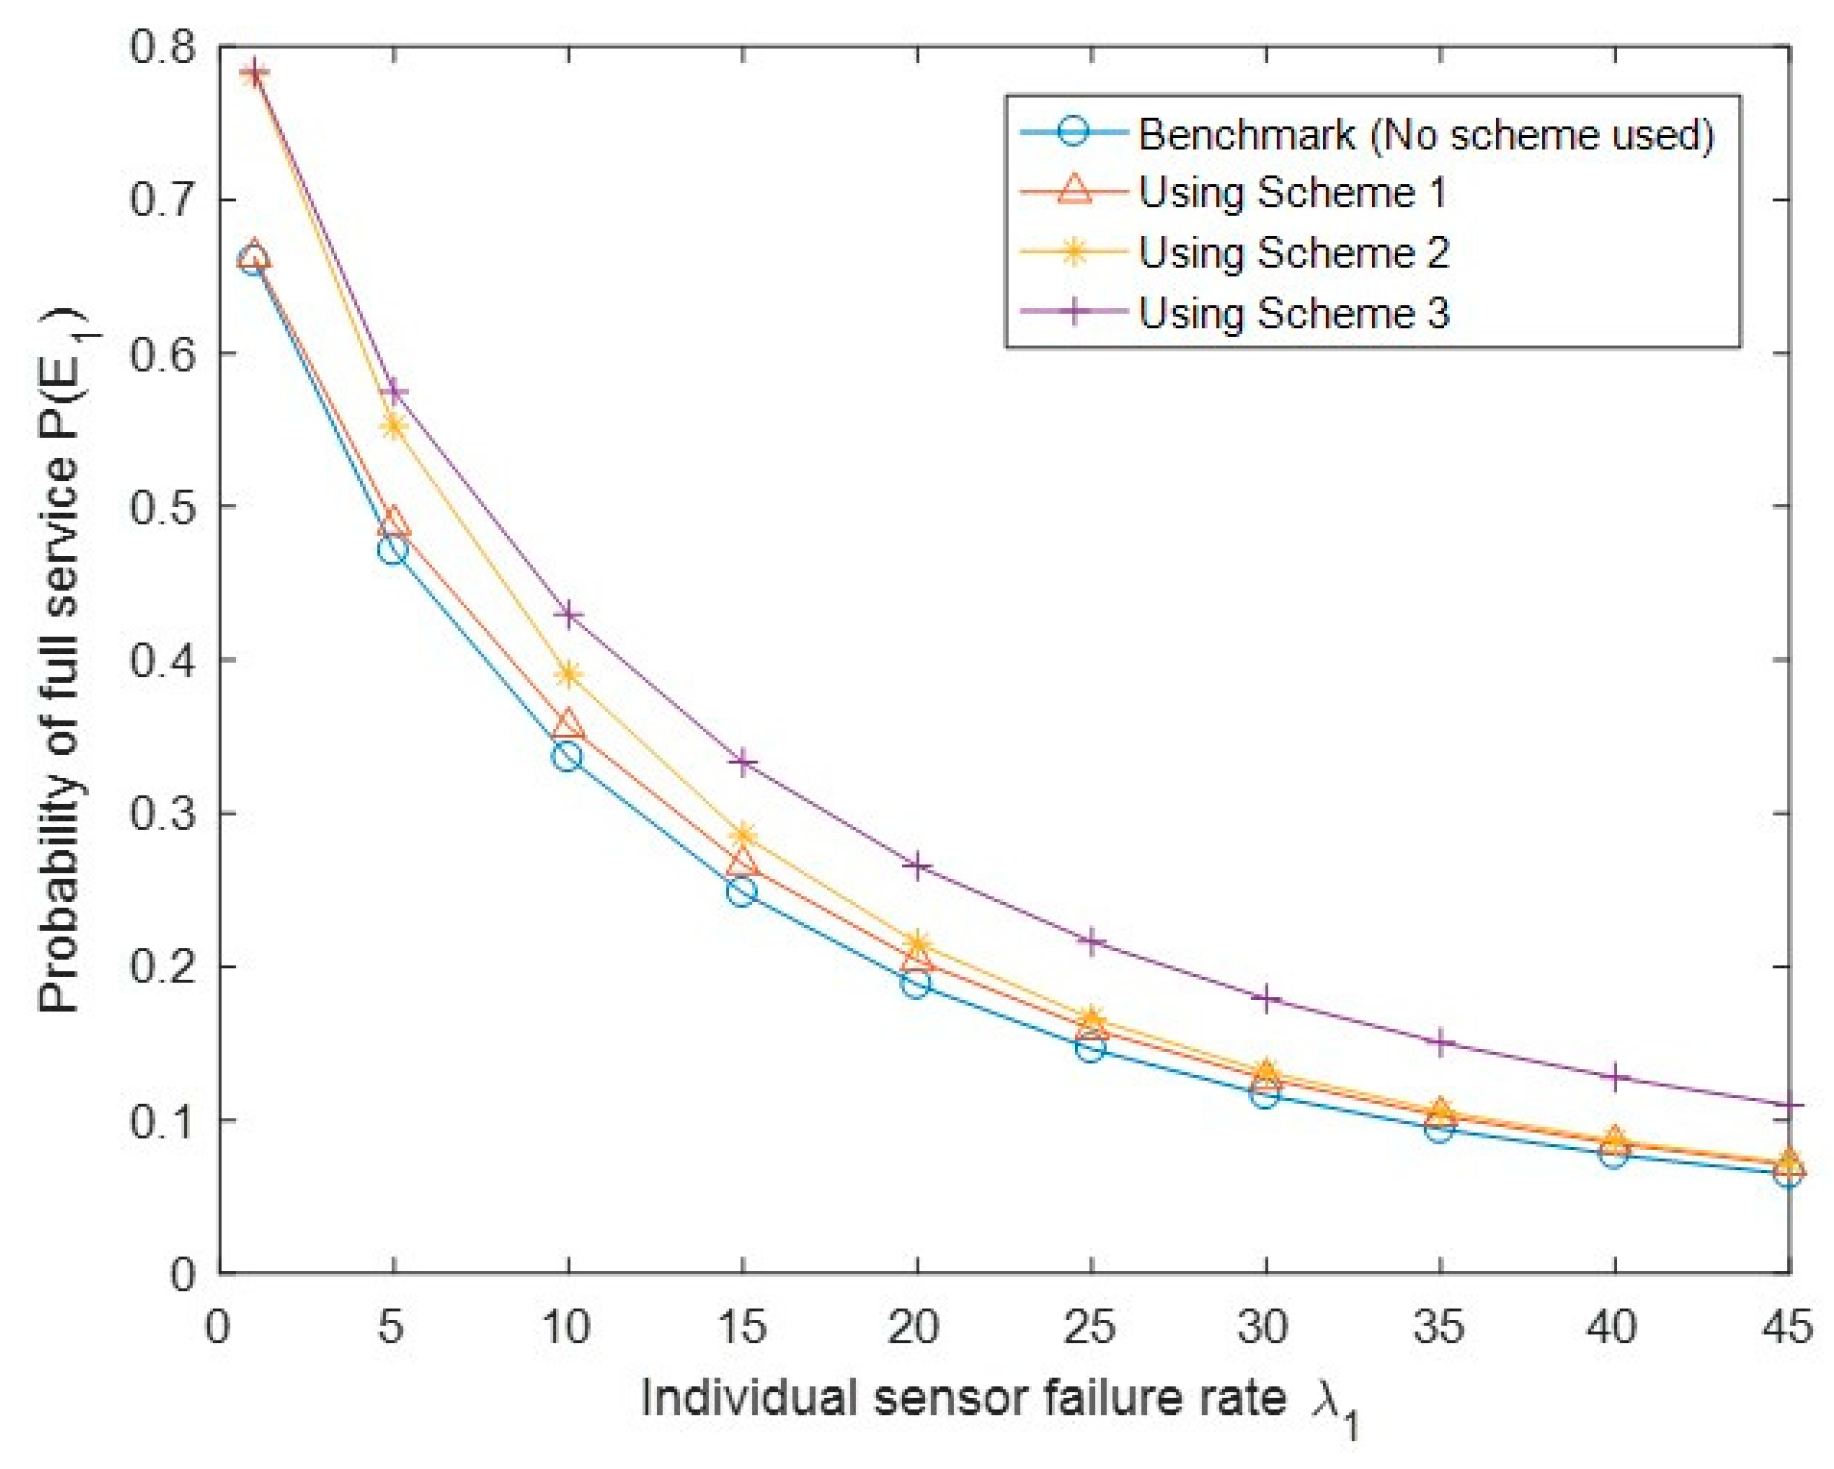
Next, we evaluate the API method using the three schemes compared with the benchmark (which does not apply any API scheme). The settings of the benchmark (no API scheme is applied) and the API schemes are as follows: 1/μ1 = 2 h, β = 2 (other values can also be used depending on the emergency recovery capability of the system), λgc = 20 failures/week, and λch = 20 failures/week. Other parameters are shown in Table 1.
Figure 11 shows the probability of the full service of the system P(E1) with different API schemes. As expected, P(E1) improves the most using Scheme 3 among the three API schemes and the least using Scheme 1. In Scheme 1, triggering the emergency link recovery mechanism needs the simultaneous occurrence of the CS side link failure and the 50%N of failed sensors, while in Scheme 3 the triggerr condition becomes either the former or the latter. Scheme 2 is between Schemes 1 and 3 based on its triggering condition. Note that, in Figure 11, Scheme 1 only slightly improves the system performance of full service, which is because the total number of sensors N is small (N = 4) in our evaluation; for a large value of N, the performance difference will be more significant.
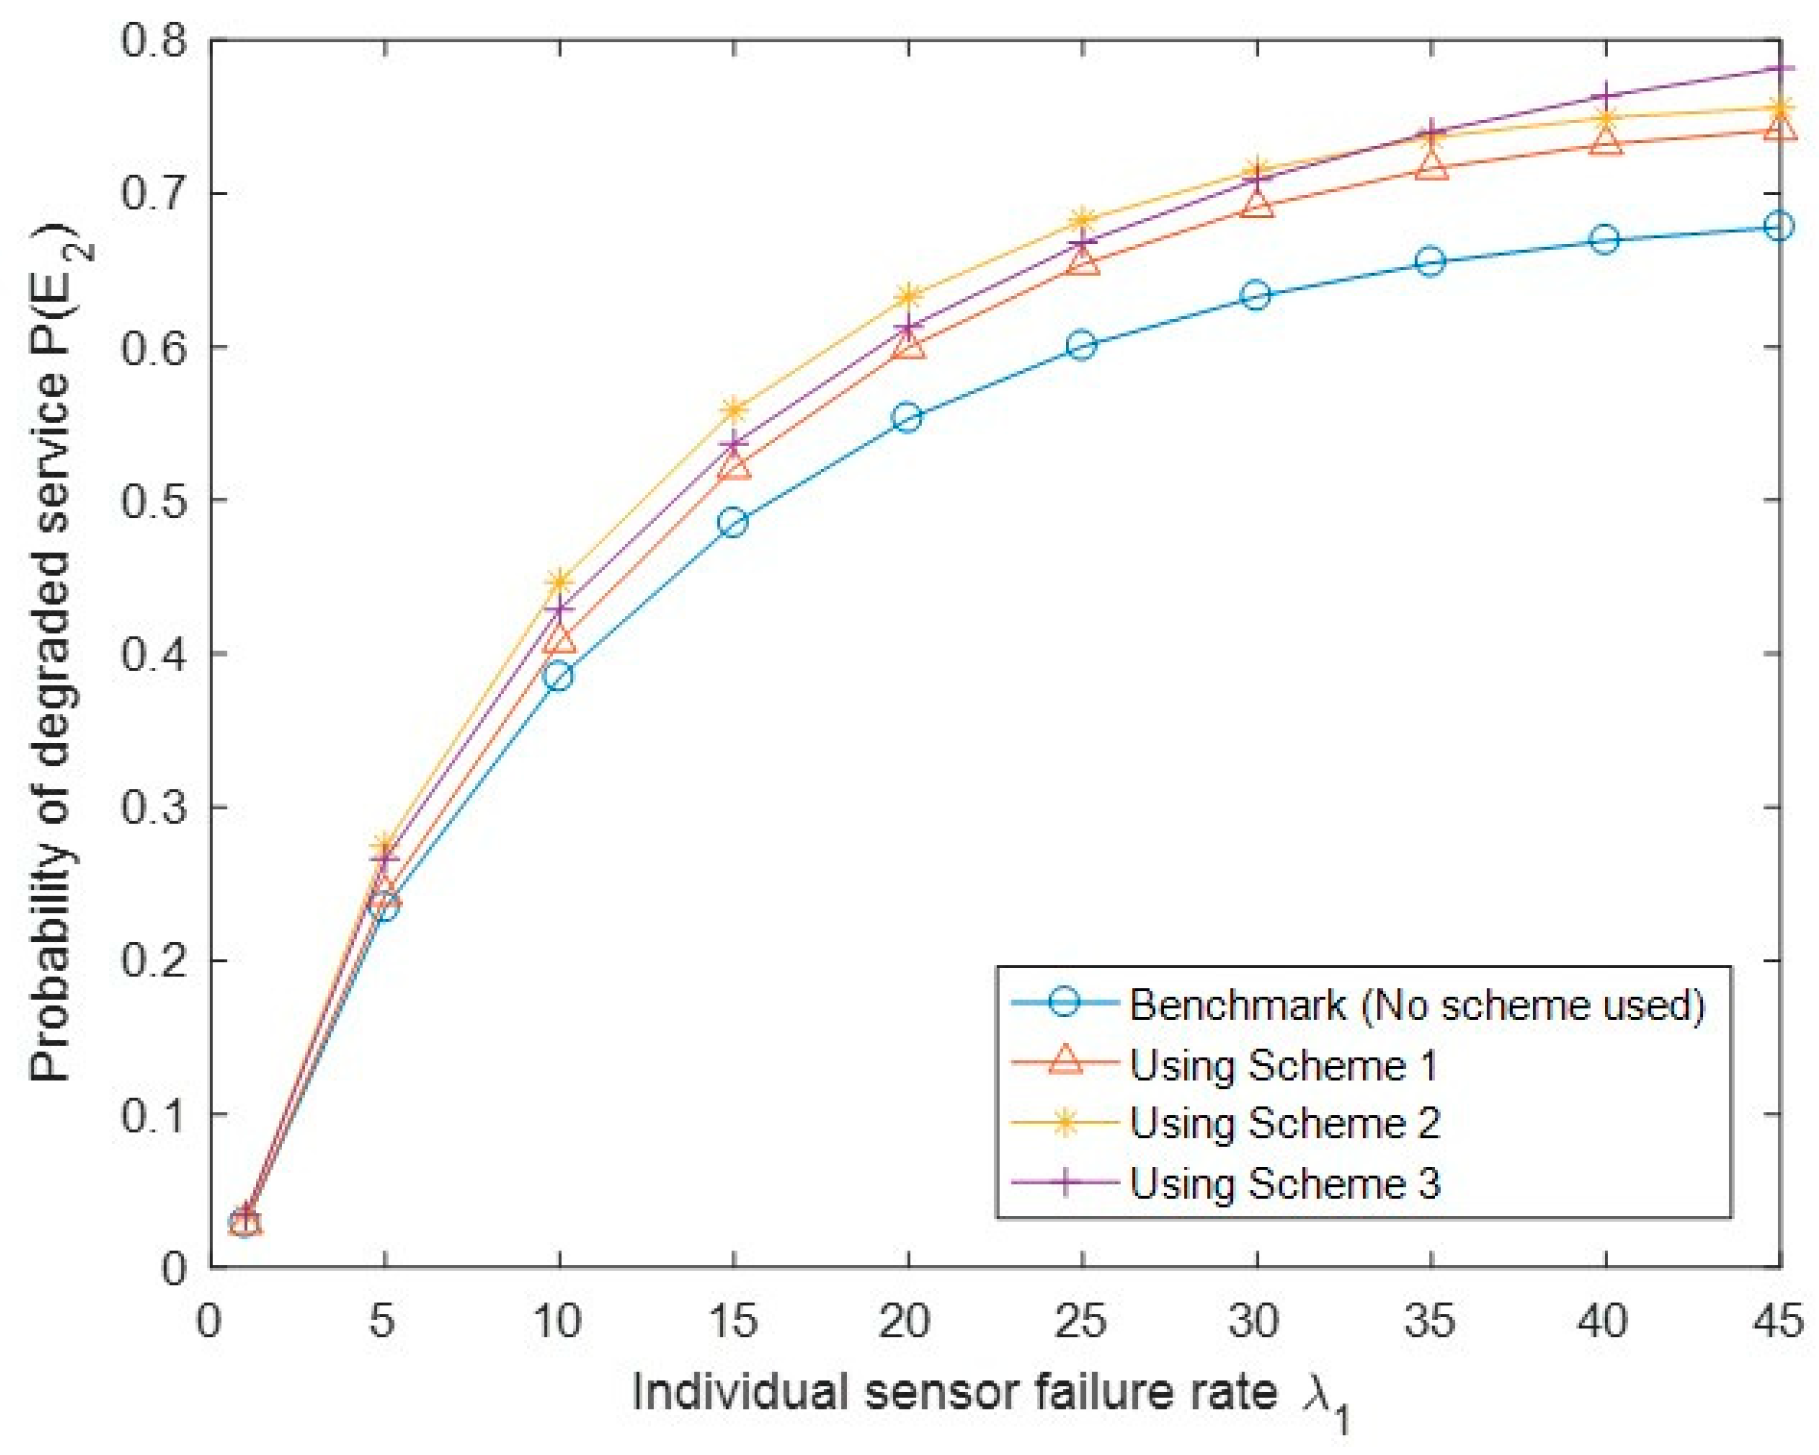
Figure 12 shows the probability of the degraded service of the system P(E2) with different API schemes. We generally observed that the three API schemes keep a higher P(E2) than the benchmark. We also observed that Scheme 3 has a lower value of P(E2) than Scheme 2; this is because Scheme 3 triggers the emergency recovery mechanism more easily than the other two, leading to more degraded service states to transition to the full service state.
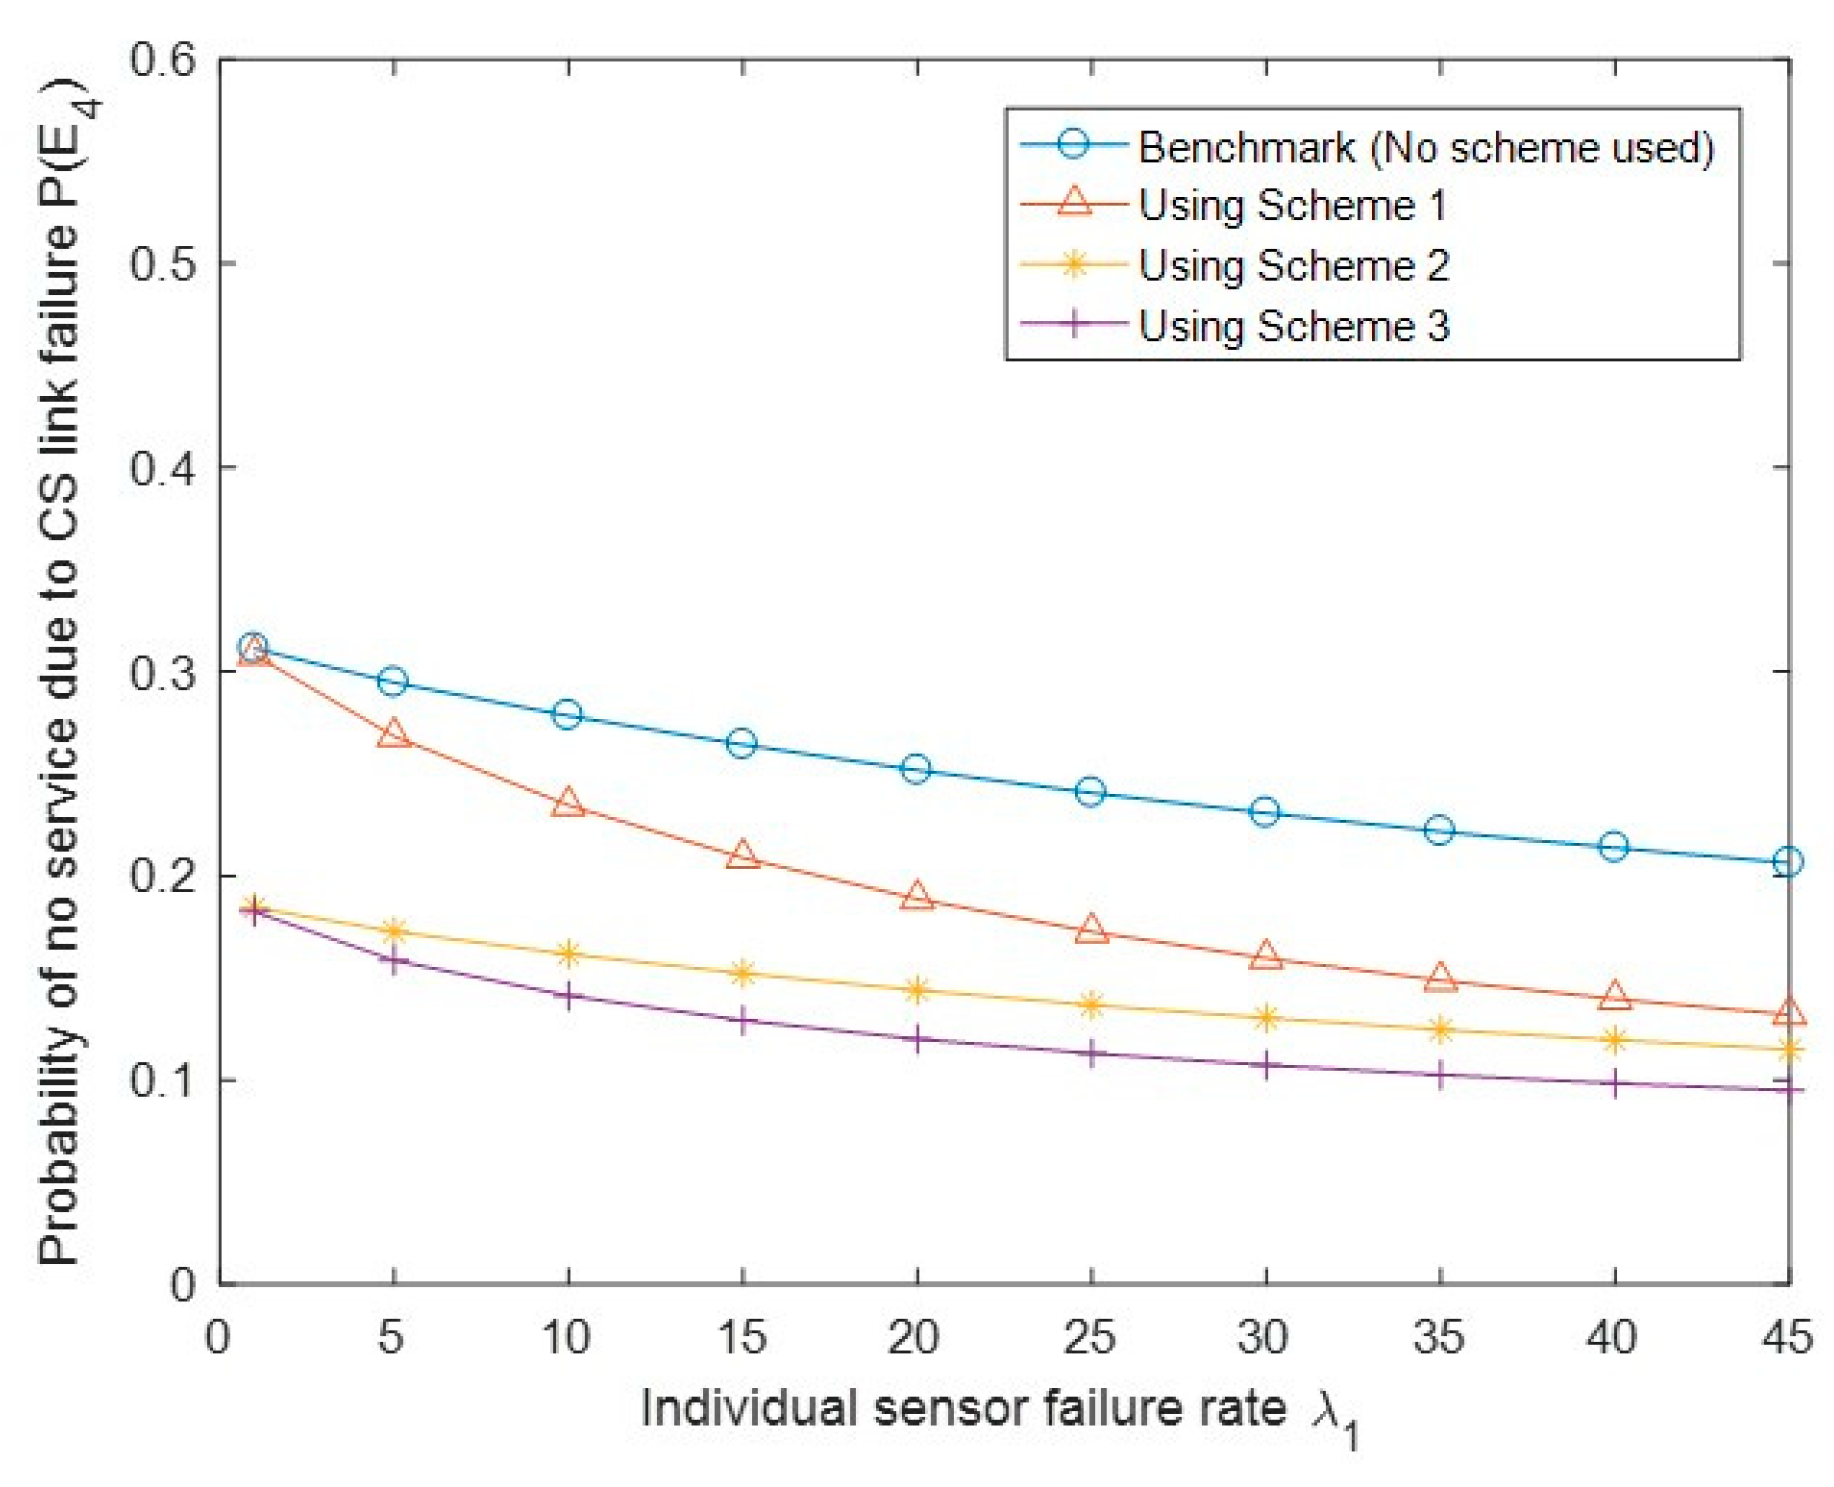
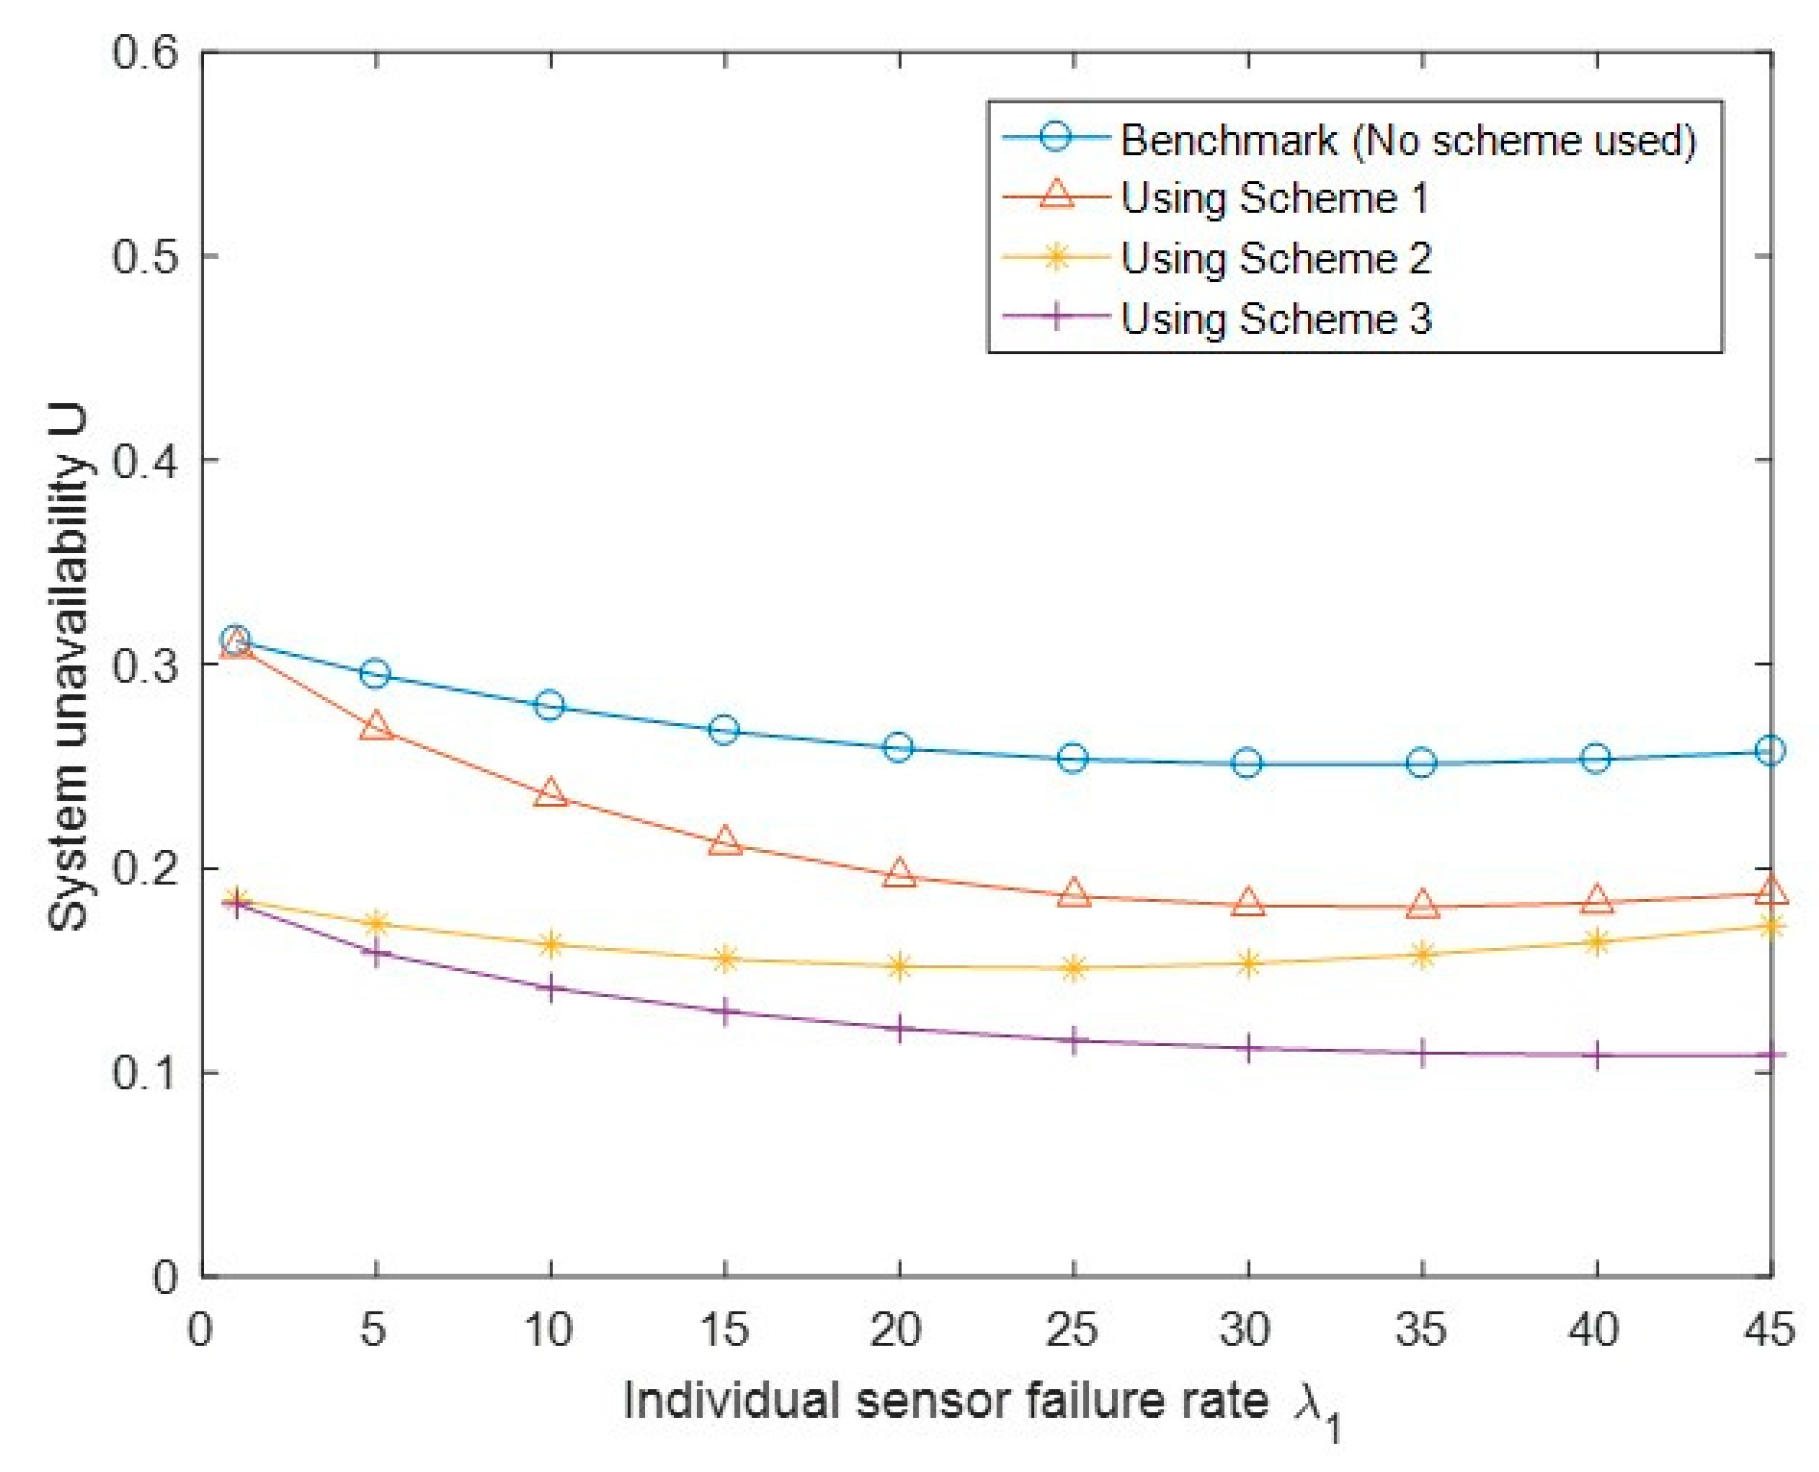
Figure 13 shows the probability of no service due to SG link failure P(E3) with different API schemes and the benchmark case. Similar to Figure 12, we observed that Scheme 3 has a lower value of P(E3) than Schemes 1 and 2, as E3 is a special case of E2. We also observed that Schemes 1 and 2 even have slightly higher P(E3) than the benchmark case; this may be because of the impact of one of the triggering conditions (i.e., the CS side link failure). Figure 14 shows the probability of no service due to CS link failure P(E4) with different API schemes. We observed that all three schemes have better performance than the benchmark case, and Scheme 3 is better than Scheme 2, which is better than Scheme 1. Finally, Figure 15 shows the system unavailability U with a similar trend to Figure 14. We observed that U becomes lower under the three API schemes than that under the benchmark case. Similar to Figure 14, Scheme 3 has achieved a lower value of system unavailability than Scheme 2, which has achieved a lower value of unavailability than Scheme 1.
7. Conclusions
We proposed an availability model of a healthcare IoT system and an API method for performance improving. The IoT system is composed of two groups of structures described by separate Markov state-space models. The two separate models are analyzed and combined to implement the whole IoT system modeling. The system balance equations were solved under a specific scenario and some performance metrics of interest, such as probabilities of full service, degraded service, and the system unavailability, were derived. Detailed numerical evaluation of selected metrics was provided for further understanding and verification of the analytic results. An availability performance improving (API) method was proposed for increasing the probability of system full service and decreasing the probability of system unavailability. The proposed system modeling and performance improving method can serve as a useful reference for general IoT system design and evaluation.
Author Contributions
S.T.: Conceptualization, Formal analysis, Methodology, Validation, Writing—original draft. Y.X.: Conceptualization, Writing—review & editing. All authors have read and agreed to the published version of the manuscript.
Funding
Shensheng Tang’s work was supported by the Early Career Grant in St. Cloud State University, MN, USA (No. 211129). Yi Xie’s work was supported by the National Nature Science Foundation of China (No. 61972431), Natural Science Foundation of Guangdong Province, China (No. 2018A030313303).
Institutional Review Board Statement
Not applicable.
Informed Consent Statement
Not applicable.
Data Availability Statement
Not applicable; we generated data for numerical evaluation based on common sense knowledge.
Conflicts of Interest
The authors declare that there is no conflict of interest associated with this publication.
References
- World Economic Forum. Technology and Innovation for the Future of Production. March 2017. Available online: http://www3.weforum.org/docs/WEF_White_Paper_Technology_Innovation_Future_of_Production_2017.pdf (accessed on 12 May 2021).
- Yin, Y.; Zeng, Y.; Chen, X.; Fan, Y. The internet of things in healthcare: An overview. J. Ind. Inf. Integr. 2016, 1, 3–13. [Google Scholar] [CrossRef]
- Islam, S.M.R.; Kwak, D.; Kabir, H.; Hossain, M.; Kwak, K.-S. The Internet of Things for Health Care: A Comprehensive Survey. IEEE Access 2015, 3, 678–708. [Google Scholar] [CrossRef]
- Maksimović, M.; Vujović, V.; Periśić, B. A custom Internet of Things healthcare system. In Proceedings of the 2015 10th Iberian Conference on Information Systems and Technologies (CISTI), Aveiro, Portugal, 17–20 June 2015; pp. 1–6. [Google Scholar]
- Ge, M.; Kim, D.S. A Framework for Modeling and Assessing Security of the Internet of Things. In Proceedings of the 2015 IEEE 21st International Conference on Parallel and Distributed Systems (ICPADS), Melbourne, Australia, 14–17 December 2015; pp. 776–781. [Google Scholar]
- Kharchenko, V.; Kolisnyk, M.; Piskachova, I.; Bardis, N. Reliability and Security Issues for IoT-based Smart Business Center: Architecture and Markov Model. In Proceedings of the 2016 Third International Conference on Mathematics and Computers in Sciences and in Industry (MCSI), Chania, Greece, 27–29 August 2016; pp. 313–318. [Google Scholar]
- Sankaran, S. Modeling the performance of IoT networks. In Proceedings of the 2016 IEEE International Conference on Advanced Networks and Telecommunications Systems (ANTS), Bangalore, India, 6–9 November 2016; pp. 1–6. [Google Scholar]
- Strielkina, A.; Uzun, D.; Kharchenko, V. Modelling of healthcare IoT using the queueing theory. In Proceedings of the 2017 9th IEEE International Conference on Intelligent Data Acquisition and Advanced Computing Systems: Technology and Applications (IDAACS), Bucharest, Romania, 21–23 September 2017; Volume 2, pp. 849–852. [Google Scholar]
- Bouloukakis, G.; Moscholios, I.; Georgantas, N.; Issarny, V. Simulation-based Queueing Models for Performance Analysis of IoT Applications. In Proceedings of the 2018 11th International Symposium on Communication Systems, Networks & Digital Signal Processing (CSNDSP), Budapest, Hungary, 18–20 July 2018; pp. 1–5. [Google Scholar] [CrossRef] [Green Version]
- Huang, J.; Li, S.; Chen, Y.; Chen, J. Performance modelling and analysis for IoT services. Int. J. Web Grid Serv. 2018, 14, 146. [Google Scholar] [CrossRef]
- Leite, J.R.E.; Ursini, E.L.; Martins, P.S. Performance analysis of IoT networks with mobility via modeling and simulation. In Proceedings of the 21st International Symposium on Performance Evaluation of Computer and Telecommunication Systems, Bordeaux, France, 9–12 July 2018; pp. 1–13. [Google Scholar]
- Strielkina, A.; Kharchenko, V.; Uzun, D. Availability models for healthcare IoT systems: Classification and research considering attacks on vulnerabilities. In Proceedings of the 2018 IEEE 9th International Conference on Dependable Systems, Services and Technologies (DESSERT), Kyiv, Ukraine, 24–27 May 2018; pp. 58–62. [Google Scholar]
- Baig, M.M.; Afifi, S.; GholamHosseini, H.; Mirza, F. A Systematic Review of Wearable Sensors and IoT-Based Monitoring Applications for Older Adults—A Focus on Ageing Population and Independent Living. J. Med. Syst. 2019, 43, 233. [Google Scholar] [CrossRef] [PubMed]
- Birje, M.N.; Hanji, S.S. Internet of things based distributed healthcare systems: A review. J. Data Inf. Manag. 2020, 2, 149–165. [Google Scholar] [CrossRef]
- Jovanov, E.; Milenkovic, A.; Otto, C.; De Groen, P.C. A wireless body area network of intelligent motion sensors for computer assisted physical rehabilitation. J. Neuroeng. Rehabil. 2005, 2, 6. [Google Scholar] [CrossRef] [PubMed] [Green Version]
- The ZigBee Alliance. “ZigBee Document 05-3474-21”, ZigBee Specification. Available online: https://zigbeealliance.org/wp-content/uploads/2019/11/docs-05-3474-21-0csg-zigbee-specification.pdf (accessed on 12 May 2021).
- Shahzadi, S.; Iqbal, M.; Qayyum, Z.U.; Dagiuklas, T. Infrastructure as a service (IaaS): A comparative performance analysis of open-source cloud platforms. In Proceedings of the 2017 IEEE 22nd International Workshop on Computer Aided Modeling and Design of Communication Links and Networks (CAMAD), Lund, Sweden, 19–21 June 2017; pp. 1–6. [Google Scholar]
- Salman, N.; Rasool, I.; Kemp, A.H. Overview of the IEEE 802.15.4 standards family for Low Rate Wireless Personal Area Networks. In Proceedings of the 2010 7th International Symposium on Wireless Communication Systems, York, UK, 19–22 September 2010; pp. 701–705. [Google Scholar]
- Harrison, P.G.; Patel, N.M. Performance Modelling of Communication Networks and Computer Architectures; Addison-Wesley: Boston, MA, USA, 1993. [Google Scholar]
- Billinton, R.; Allan, R.N. Reliability Evaluation of Engineering System, 2nd ed.; Plenum Press: New York, NY, USA, 1994. [Google Scholar]
Figure 1.
A typical healthcare IoT system infrastructure.

Figure 2.
State transition diagram of Group 1 at state i.

Figure 3.
State transition diagram of the links in Group 2.

Figure 4.
The series structure in Group 2.

Figure 5.
State transition diagram of the IoT system.

Figure 6.
Probability of full service P(E1) vs. biosensor failure rate λ1.

Figure 7.
Probability of degraded service P(E2) vs. biosensor failure rate λ1.

Figure 8.
Probability of no service due to SG link failure P(E3) vs. biosensor failure rate λ1.

Figure 9.
Probability of no service due to CS link failure P(E4) vs. biosensor failure rate λ1.

Figure 10.
System unavailability U vs. biosensor failure rate λ1.

Figure 11.
Performance comparison of the probability of full service P(E1) under the benchmark and three API schemes.
Figure 11.
Performance comparison of the probability of full service P(E1) under the benchmark and three API schemes.

Figure 12.
Performance comparison of the probability of degraded service P(E2) under the benchmark and three API schemes.
Figure 12.
Performance comparison of the probability of degraded service P(E2) under the benchmark and three API schemes.

Figure 13.
Performance comparison of the probability of no service due to SG link failure P(E3) under the benchmark and three API schemes.
Figure 13.
Performance comparison of the probability of no service due to SG link failure P(E3) under the benchmark and three API schemes.

Figure 14.
Performance comparison of the probability of no service due to CS link failure P(E4) under the benchmark and three API schemes.
Figure 14.
Performance comparison of the probability of no service due to CS link failure P(E4) under the benchmark and three API schemes.

Figure 15.
Performance comparison of the system unavailability U under the benchmark and three API schemes.
Figure 15.
Performance comparison of the system unavailability U under the benchmark and three API schemes.


Table 1.
Typical parameter configuration for numerical evaluation.
| Parameters | Value | Unit | Description |
|---|---|---|---|
| N | 4 | Number of biosensors | |
| λ1 | varies | failures/week | Sensor failure rate |
| 1/μ1 | 1 or 2 | hours | Sensor recovery time |
| λgc | 1 or 10 | failures/month | Failure rate |
| 1/μgc | 1 | hours | GC link recovery time |
| λch | 1 or 10 | failures/year | Failure rate |
| 1/μch | 1 | hours | CH link recovery time |
| β | 2 | Rate computing factor |
Publisher’s Note: MDPI stays neutral with regard to jurisdictional claims in published maps and institutional affiliations. |
© 2021 by the authors. Licensee MDPI, Basel, Switzerland. This article is an open access article distributed under the terms and conditions of the Creative Commons Attribution (CC BY) license (https://creativecommons.org/licenses/by/4.0/).
Share and Cite
MDPI and ACS Style
Tang, S.; Xie, Y. Availability Modeling and Performance Improving of a Healthcare Internet of Things (IoT) System. IoT 2021, 2, 310-325. https://0-doi-org.brum.beds.ac.uk/10.3390/iot2020016
AMA Style
Tang S, Xie Y. Availability Modeling and Performance Improving of a Healthcare Internet of Things (IoT) System. IoT. 2021; 2(2):310-325. https://0-doi-org.brum.beds.ac.uk/10.3390/iot2020016
Chicago/Turabian StyleTang, Shensheng, and Yi Xie. 2021. "Availability Modeling and Performance Improving of a Healthcare Internet of Things (IoT) System" IoT 2, no. 2: 310-325. https://0-doi-org.brum.beds.ac.uk/10.3390/iot2020016